Cambridge A Level Physics 9702 — 2023 May/June Paper 4 · Variant 3
9702/43/M/J/23 · 10 questions · 100 marks · ≈113 min
The question paper and its mark scheme, free to read here and free to download. This is Cambridge’s own paper, exactly as it was sat.
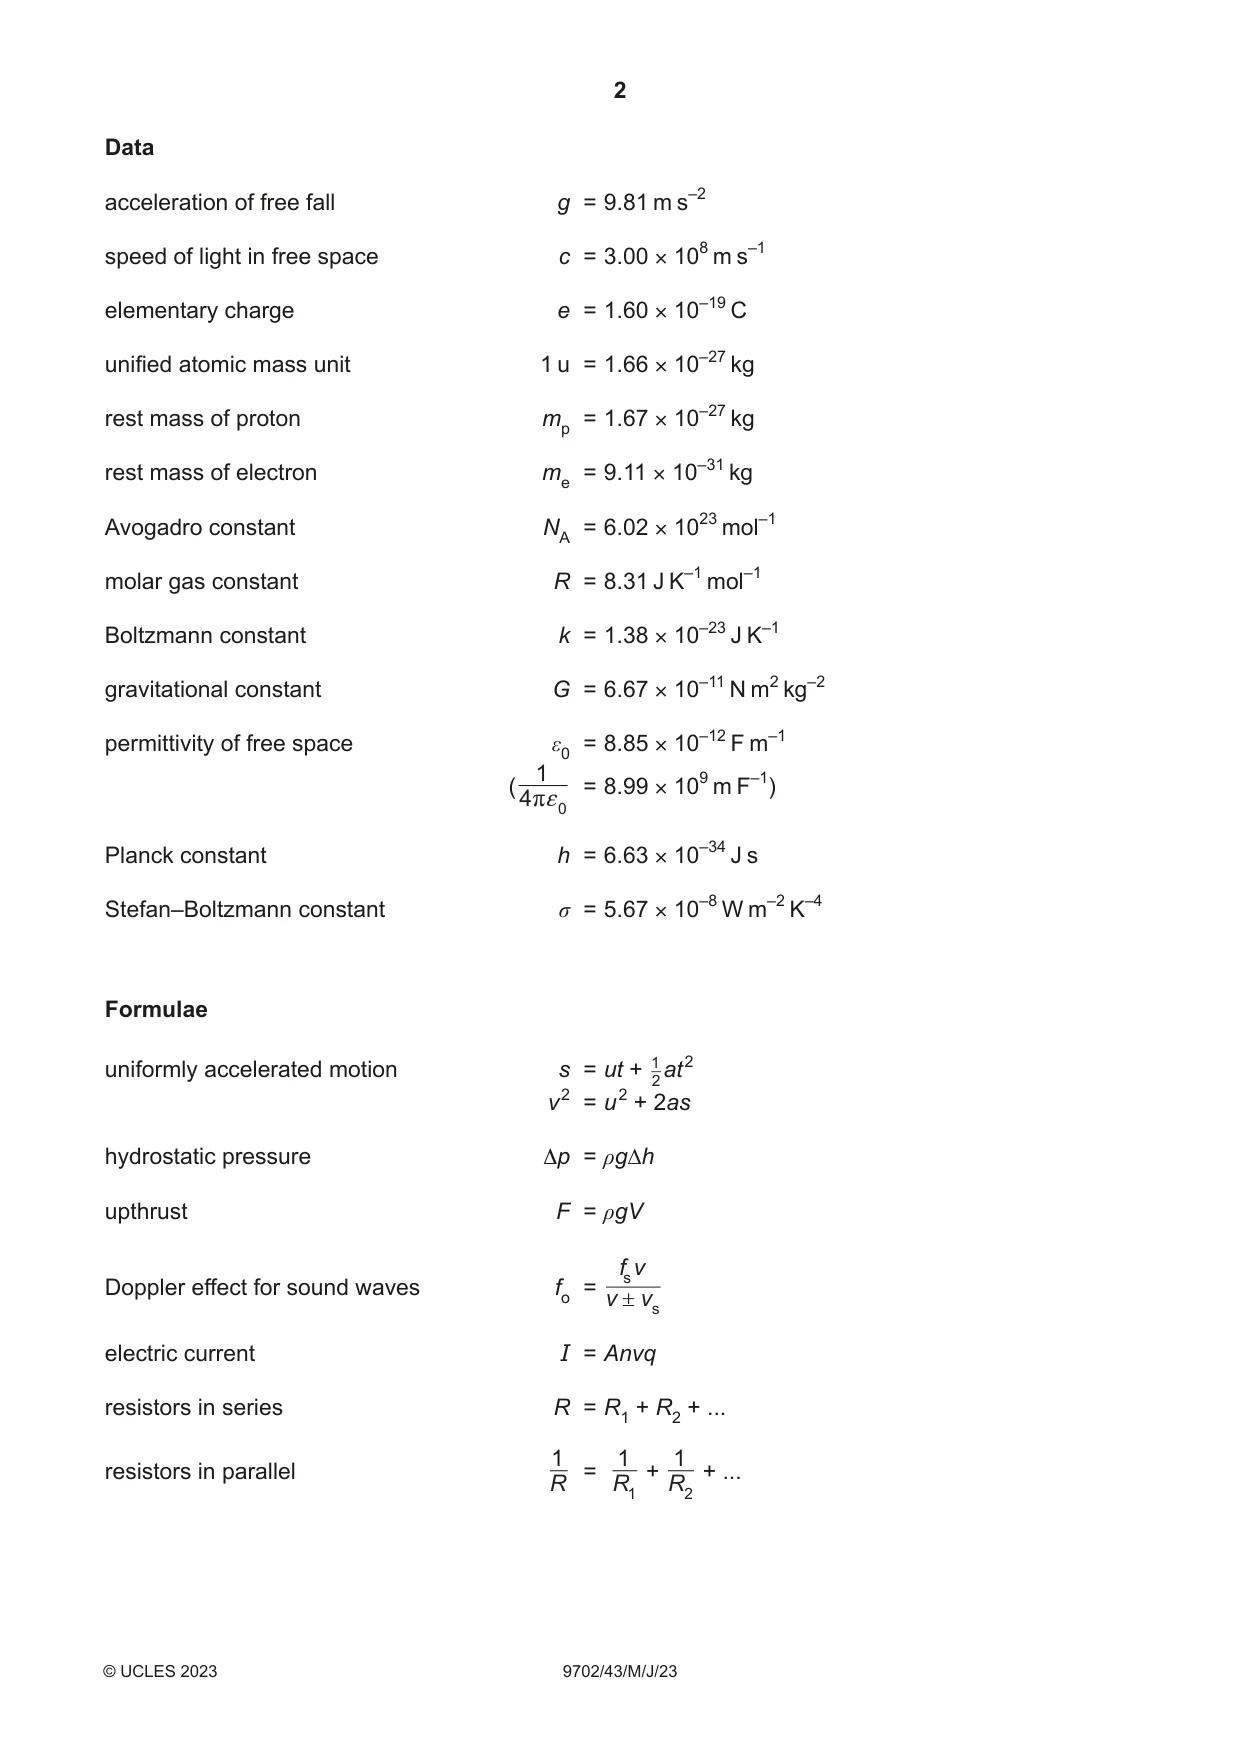
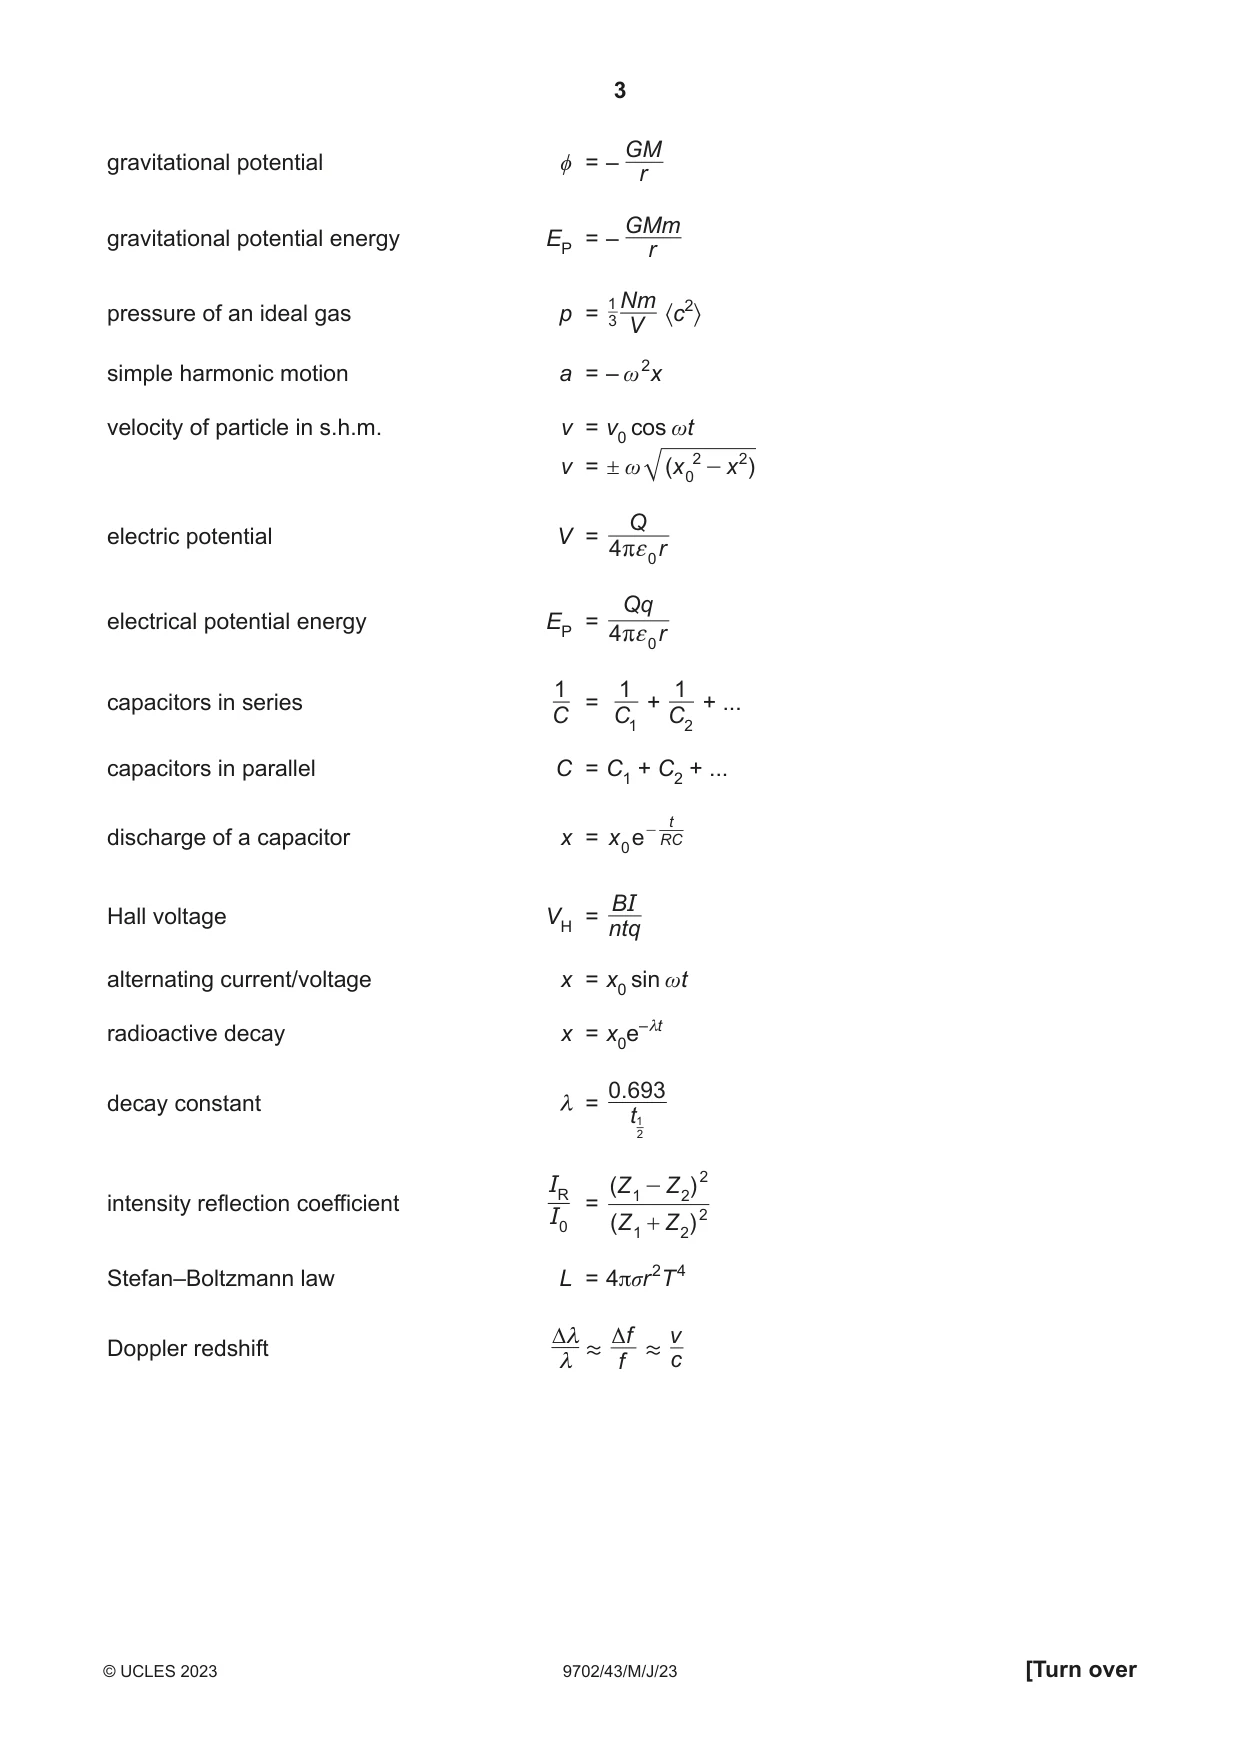
Question paper24 pages


Mark scheme16 pages
Answers below. Sit the paper first if you are practising.
Questions as text
Question 1
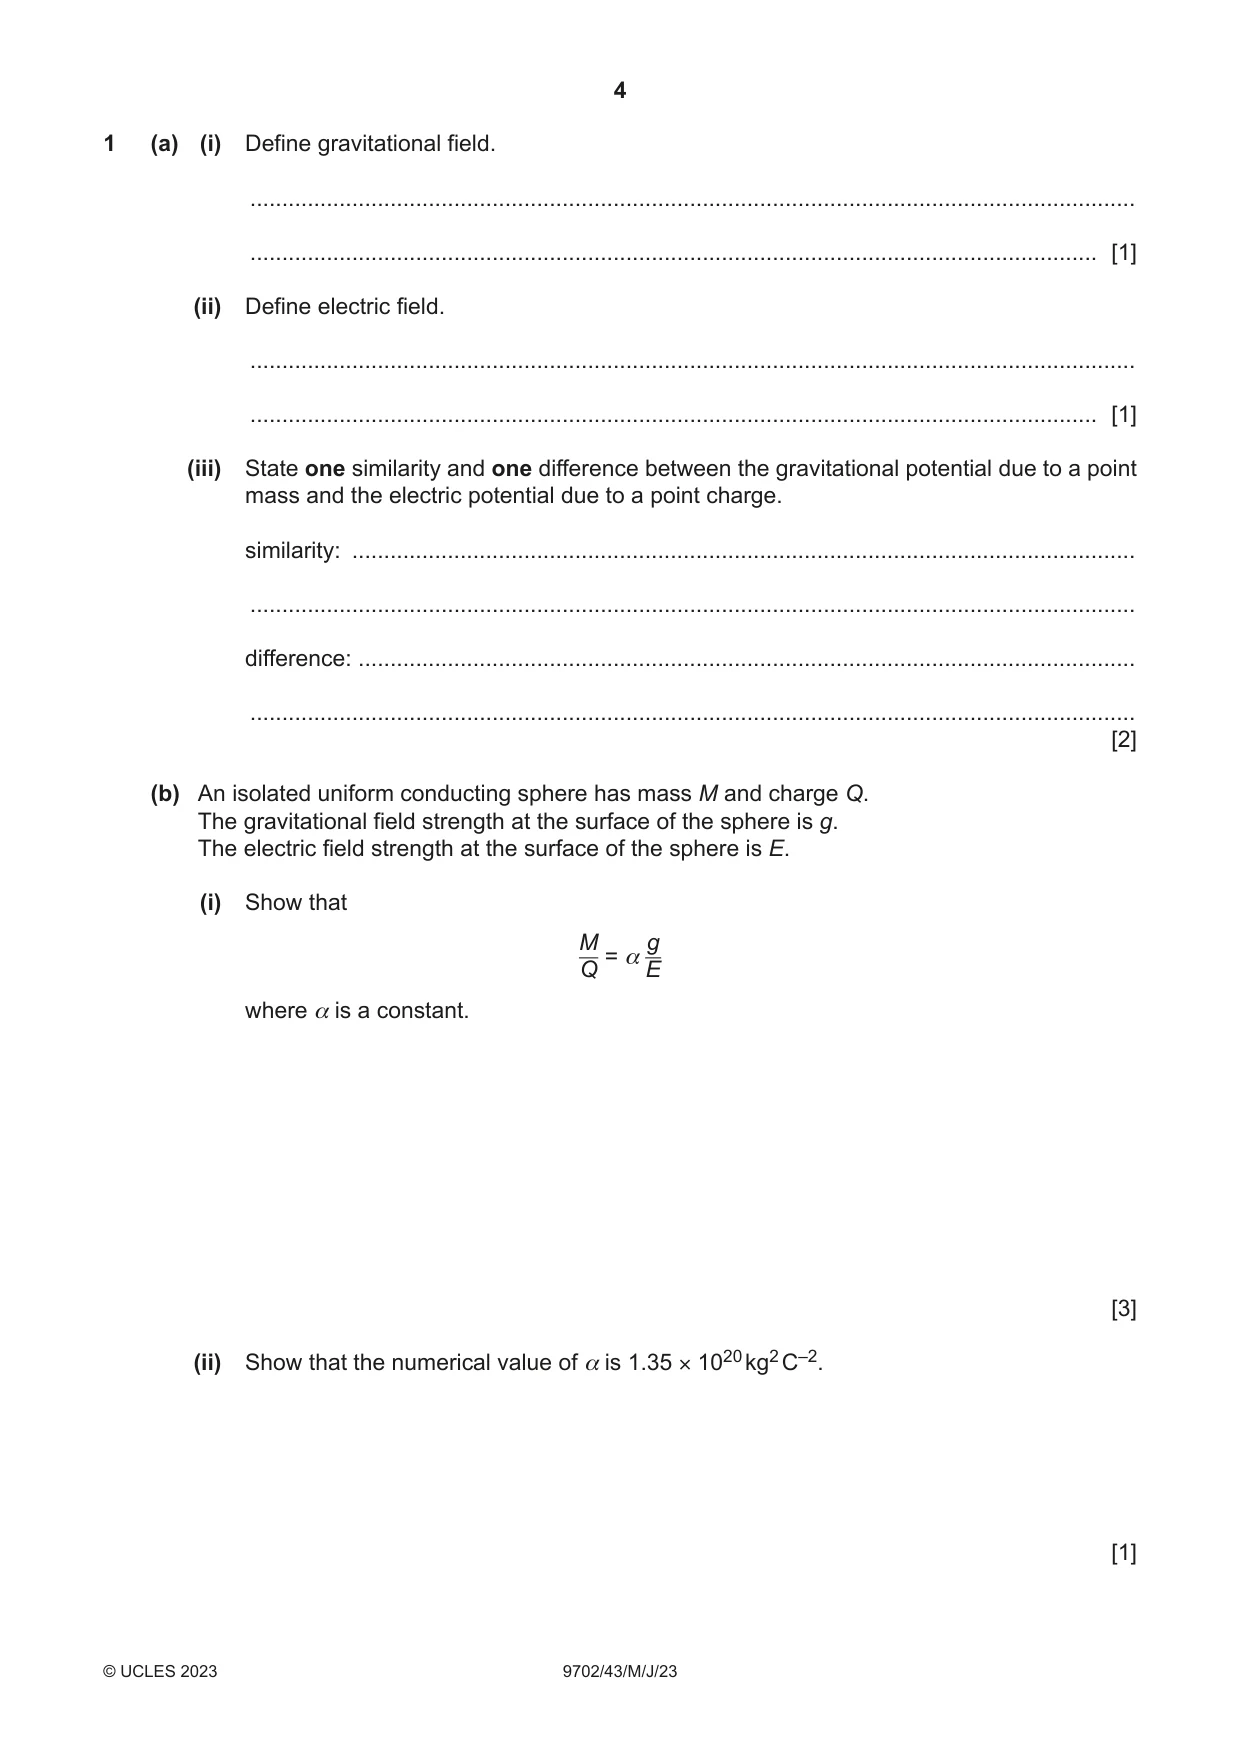
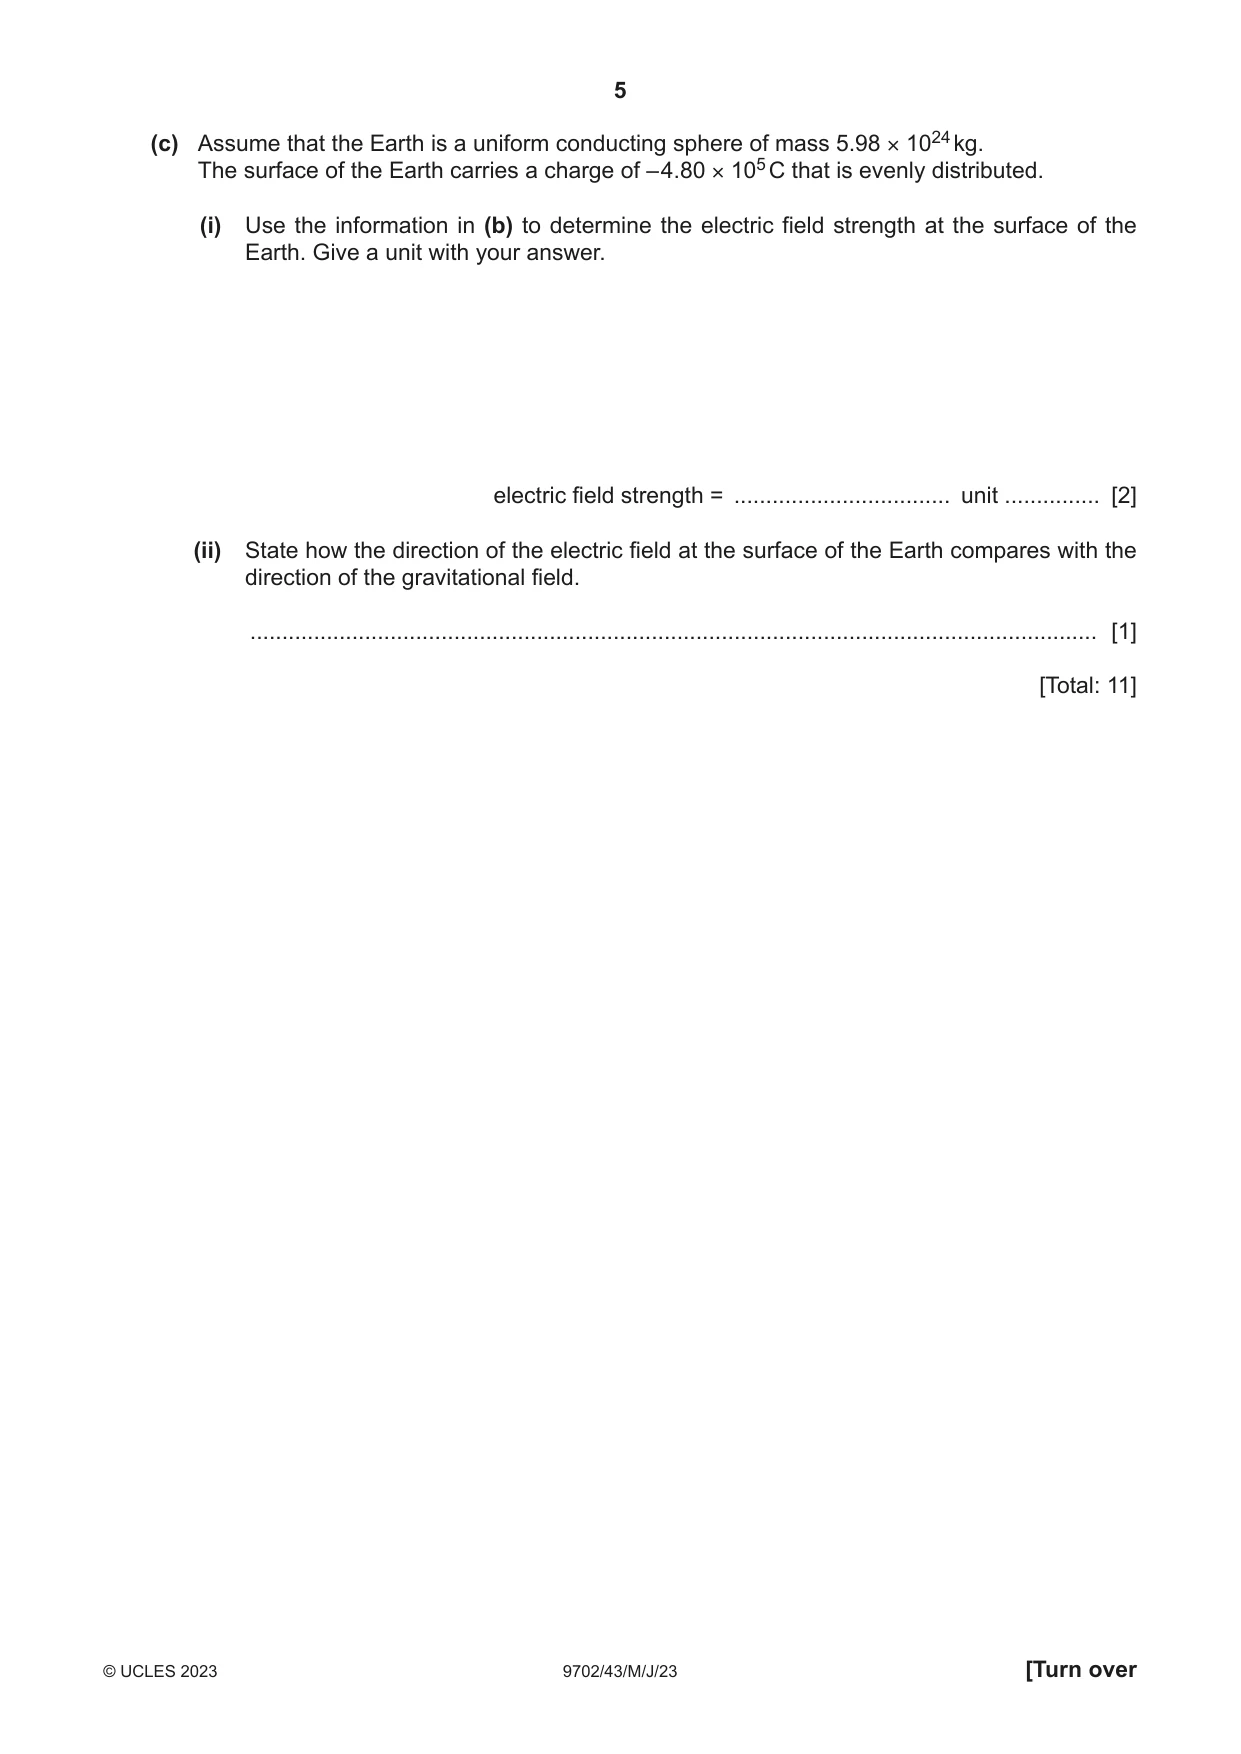
1 (a) (i) Define gravitational field. ........................................................................................................................................... ..................................................................................................................................... [1] (ii) Define electric field. ........................................................................................................................................... ..................................................................................................................................... [1] (iii) State one similarity and one difference between the gravitational potential due to a point mass and the electric potential due to a point charge. similarity: ........................................................................................................................... ........................................................................................................................................... difference: .......................................................................................................................... ........................................................................................................................................... [2] (b) An isolated uniform conducting sphere has mass M and charge Q. The gravitational field strength at the surface of the sphere is g. The electric field strength at the surface of the sphere is E. (i) Show that M g = α Q E where α is a constant. [3] (ii) Show that the numerical value of α is 1.35 × 10²⁰ kg2 C–2. [1] (c) Assume that the Earth is a uniform conducting sphere of mass 5.98 × 1024 kg. The surface of the Earth carries a charge of – 4.80 × 10⁵ C that is evenly distributed. (i) Use the information in (b) to determine the electric field strength at the surface of the Earth. Give a unit with your answer. electric field strength = .................................. unit ............... [2] (ii) State how the direction of the electric field at the surface of the Earth compares with the direction of the gravitational field. ..................................................................................................................................... [1] [Total: 11]
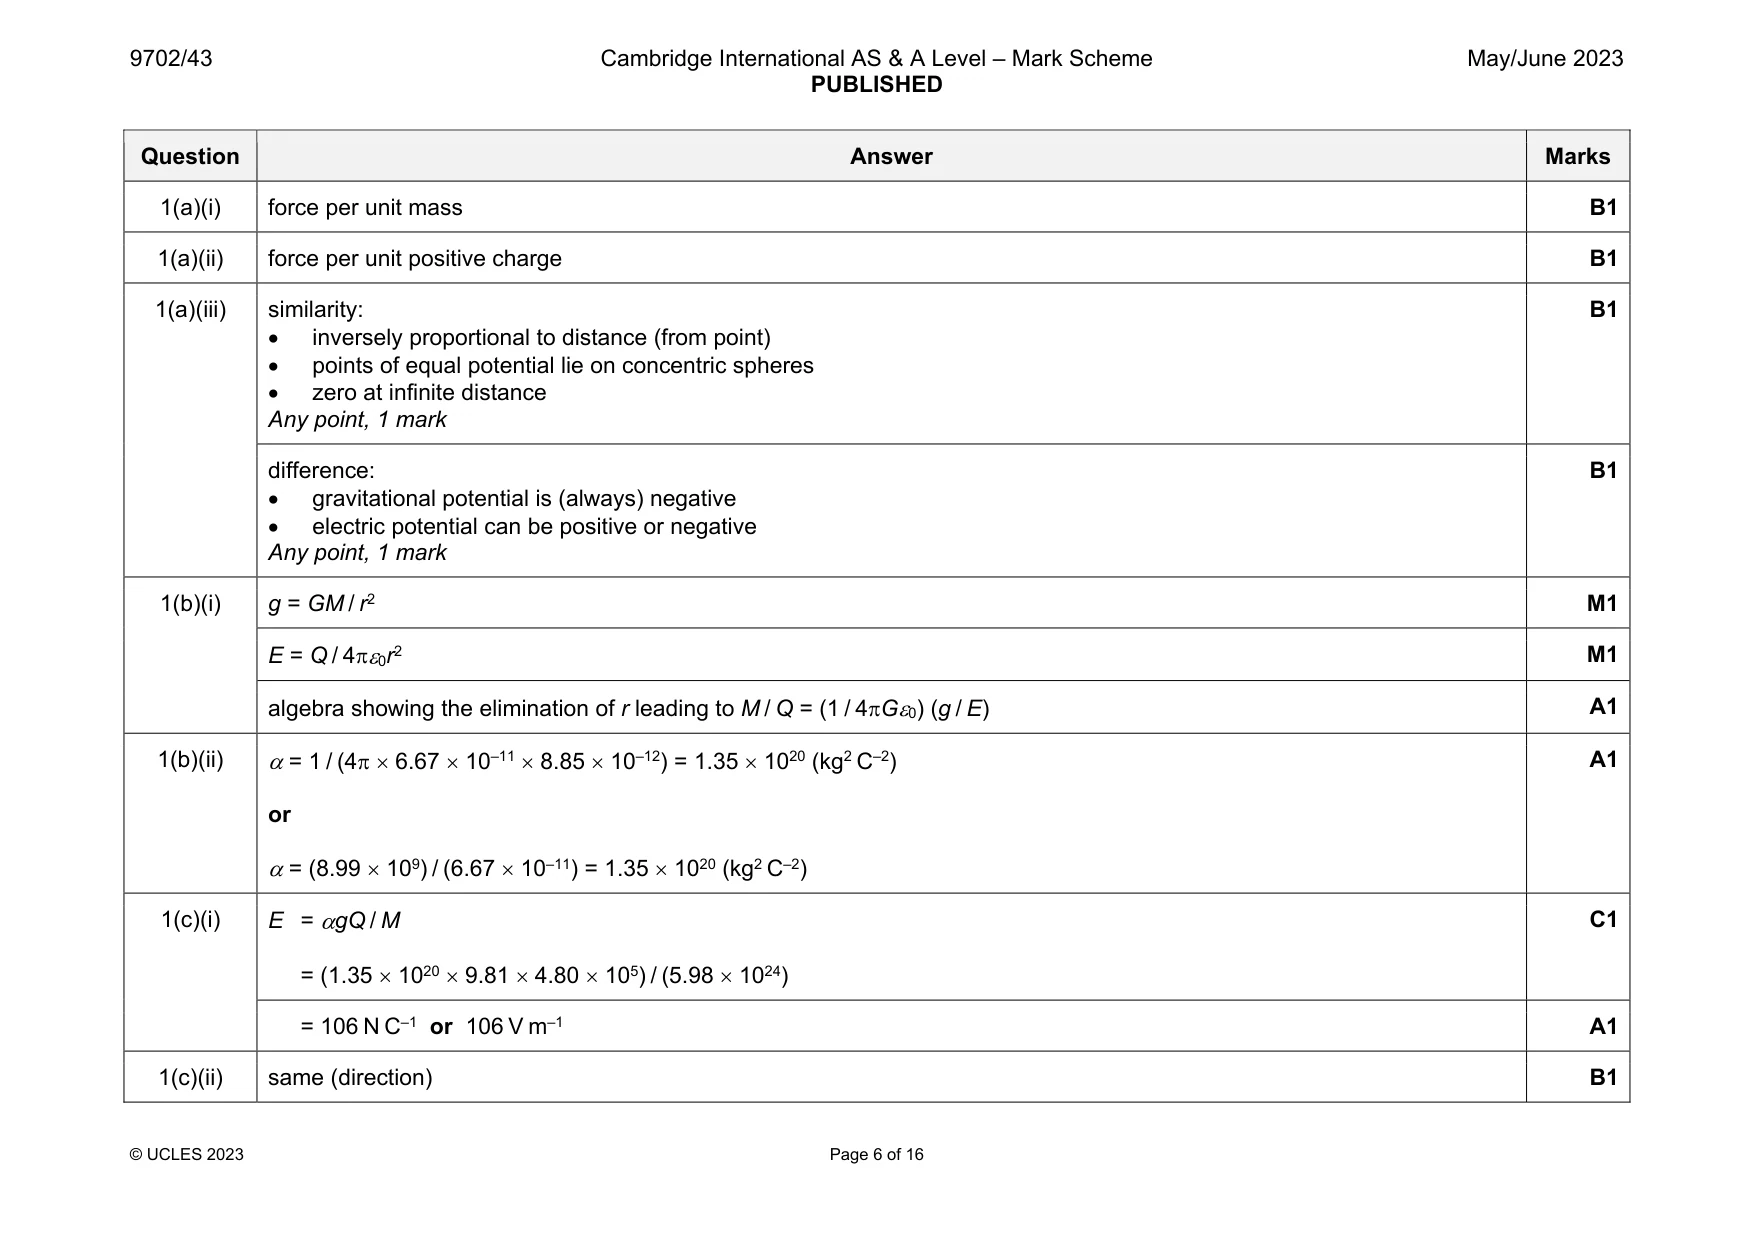
Mark scheme: 1(a)(i) force per unit mass B1 1(a)(ii) force per unit positive charge B1 1(a)(iii) similarity: inversely proportional to distance (from point) points of equal potential lie on concentric spheres zero at infinite distance Any point, 1 mark B1 difference: gravitational potential is (always) negative electric potential can be positive or negative Any point, 1 mark B1 1(b)(i) g = GM / r2 M1 E = Q / 40r2 M1 algebra showing the elimination of r leading to M / Q = (1 / 4G0) (g / E) A1 1(b)(ii) = 1 / (4 6.67 10–11 8.85 10–12) = 1.35 1020 (kg2 C–2) or = (8.99 109) / (6.67 10–11) = 1.35 1020 (kg2 C–2) A1 1(c)(i) E = gQ / M = (1.35 1020 9.81 4.80 105) / (5.98 1024) C1 = 106 N C–1 or 106 V m–1 A1 1(c)(ii) same (direction) B1
Q2 · A steel sphere of mass 0.29 kg is suspended in equilibrium from a vertical spring
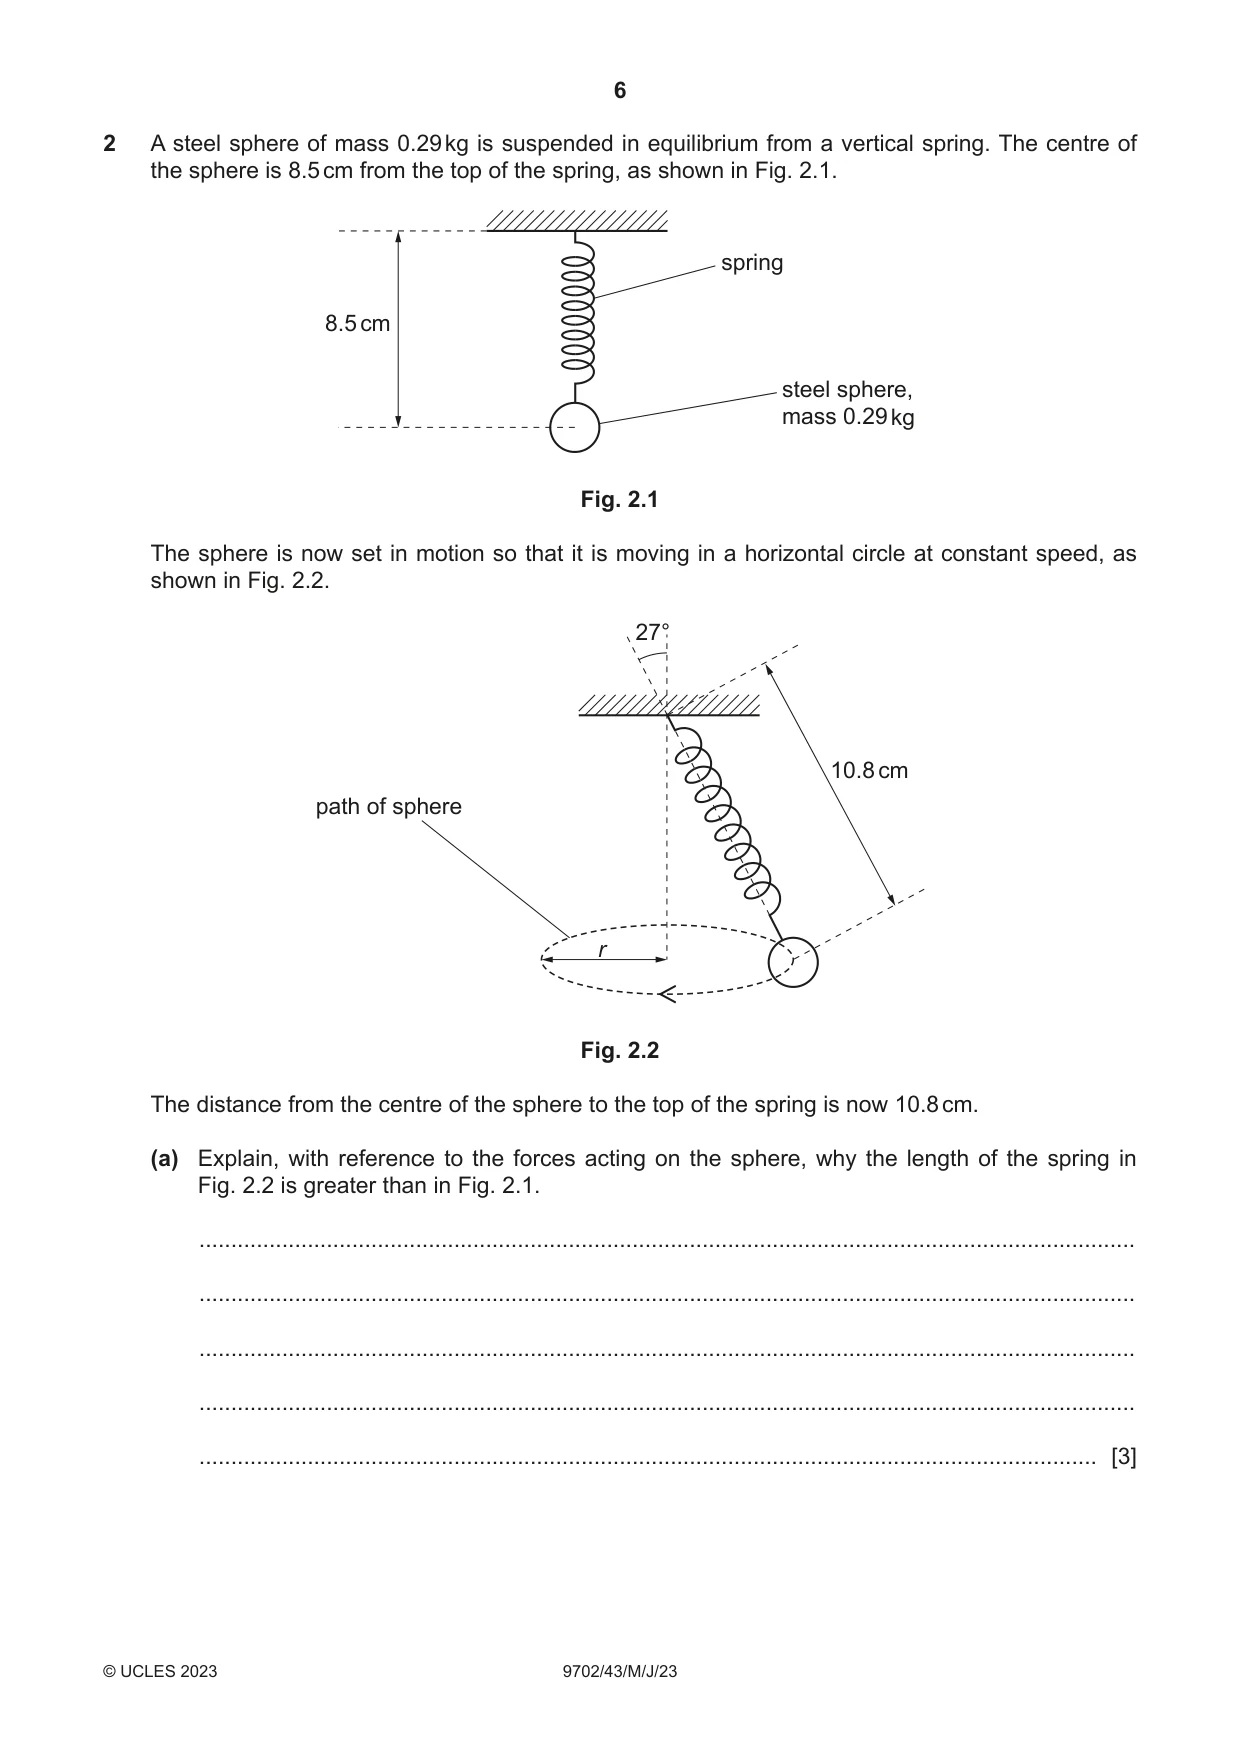
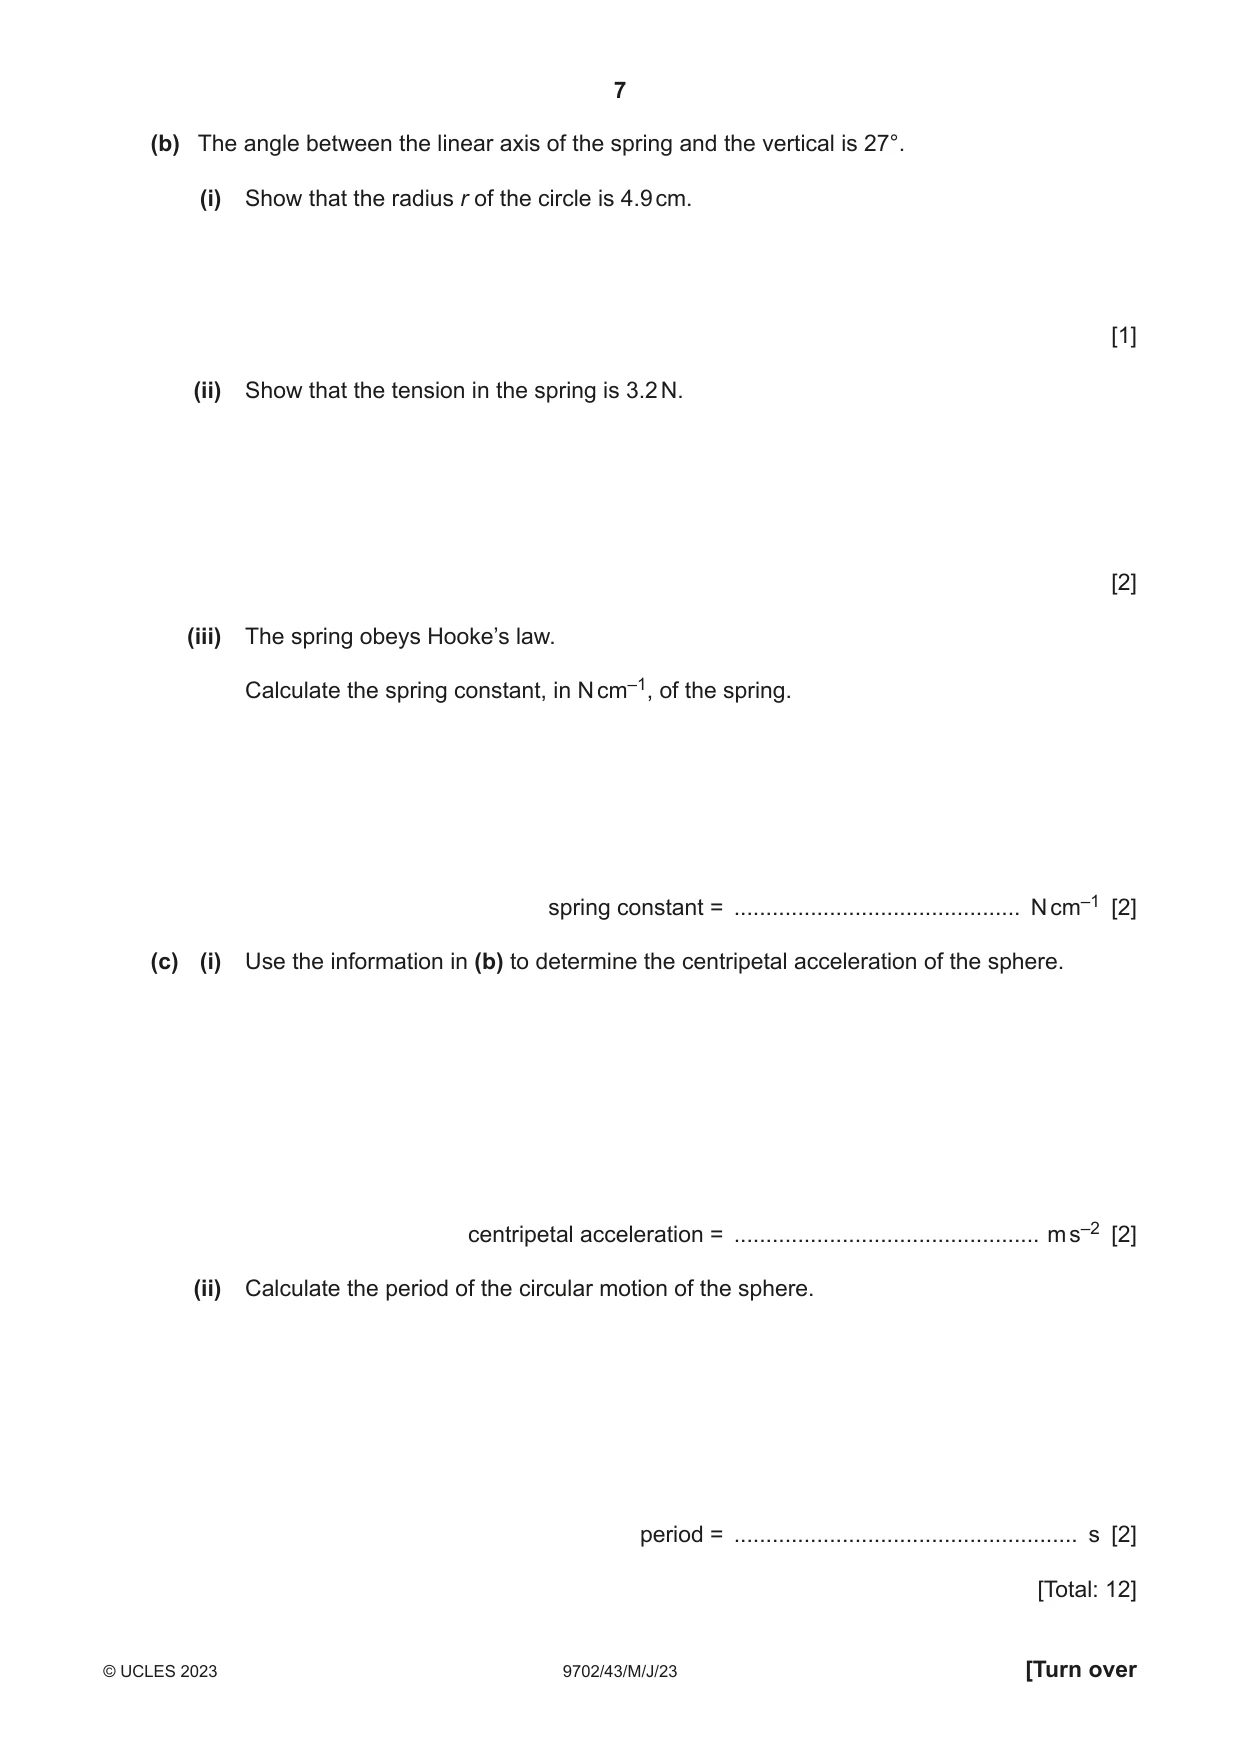
2 A steel sphere of mass 0.29 kg is suspended in equilibrium from a vertical spring. The centre of the sphere is 8.5 cm from the top of the spring, as shown in Fig. 2.1. spring 8.5 cm steel sphere, mass 0.29 kg Fig. 2.1 The sphere is now set in motion so that it is moving in a horizontal circle at constant speed, as shown in Fig. 2.2. 27° 10.8 cm path of sphere r Fig. 2.2 The distance from the centre of the sphere to the top of the spring is now 10.8 cm. (a) Explain, with reference to the forces acting on the sphere, why the length of the spring in Fig. 2.2 is greater than in Fig. 2.1. ................................................................................................................................................... ................................................................................................................................................... ................................................................................................................................................... ................................................................................................................................................... ............................................................................................................................................. [3] (b) The angle between the linear axis of the spring and the vertical is 27°. (i) Show that the radius r of the circle is 4.9 cm. [1] (ii) Show that the tension in the spring is 3.2 N. [2] (iii) The spring obeys Hooke’s law. Calculate the spring constant, in N cm–1, of the spring. spring constant = ............................................. N cm–1 [2] (c) (i) Use the information in (b) to determine the centripetal acceleration of the sphere. centripetal acceleration = ................................................ m s–2 [2] (ii) Calculate the period of the circular motion of the sphere. period = ...................................................... s [2] [Total: 12]
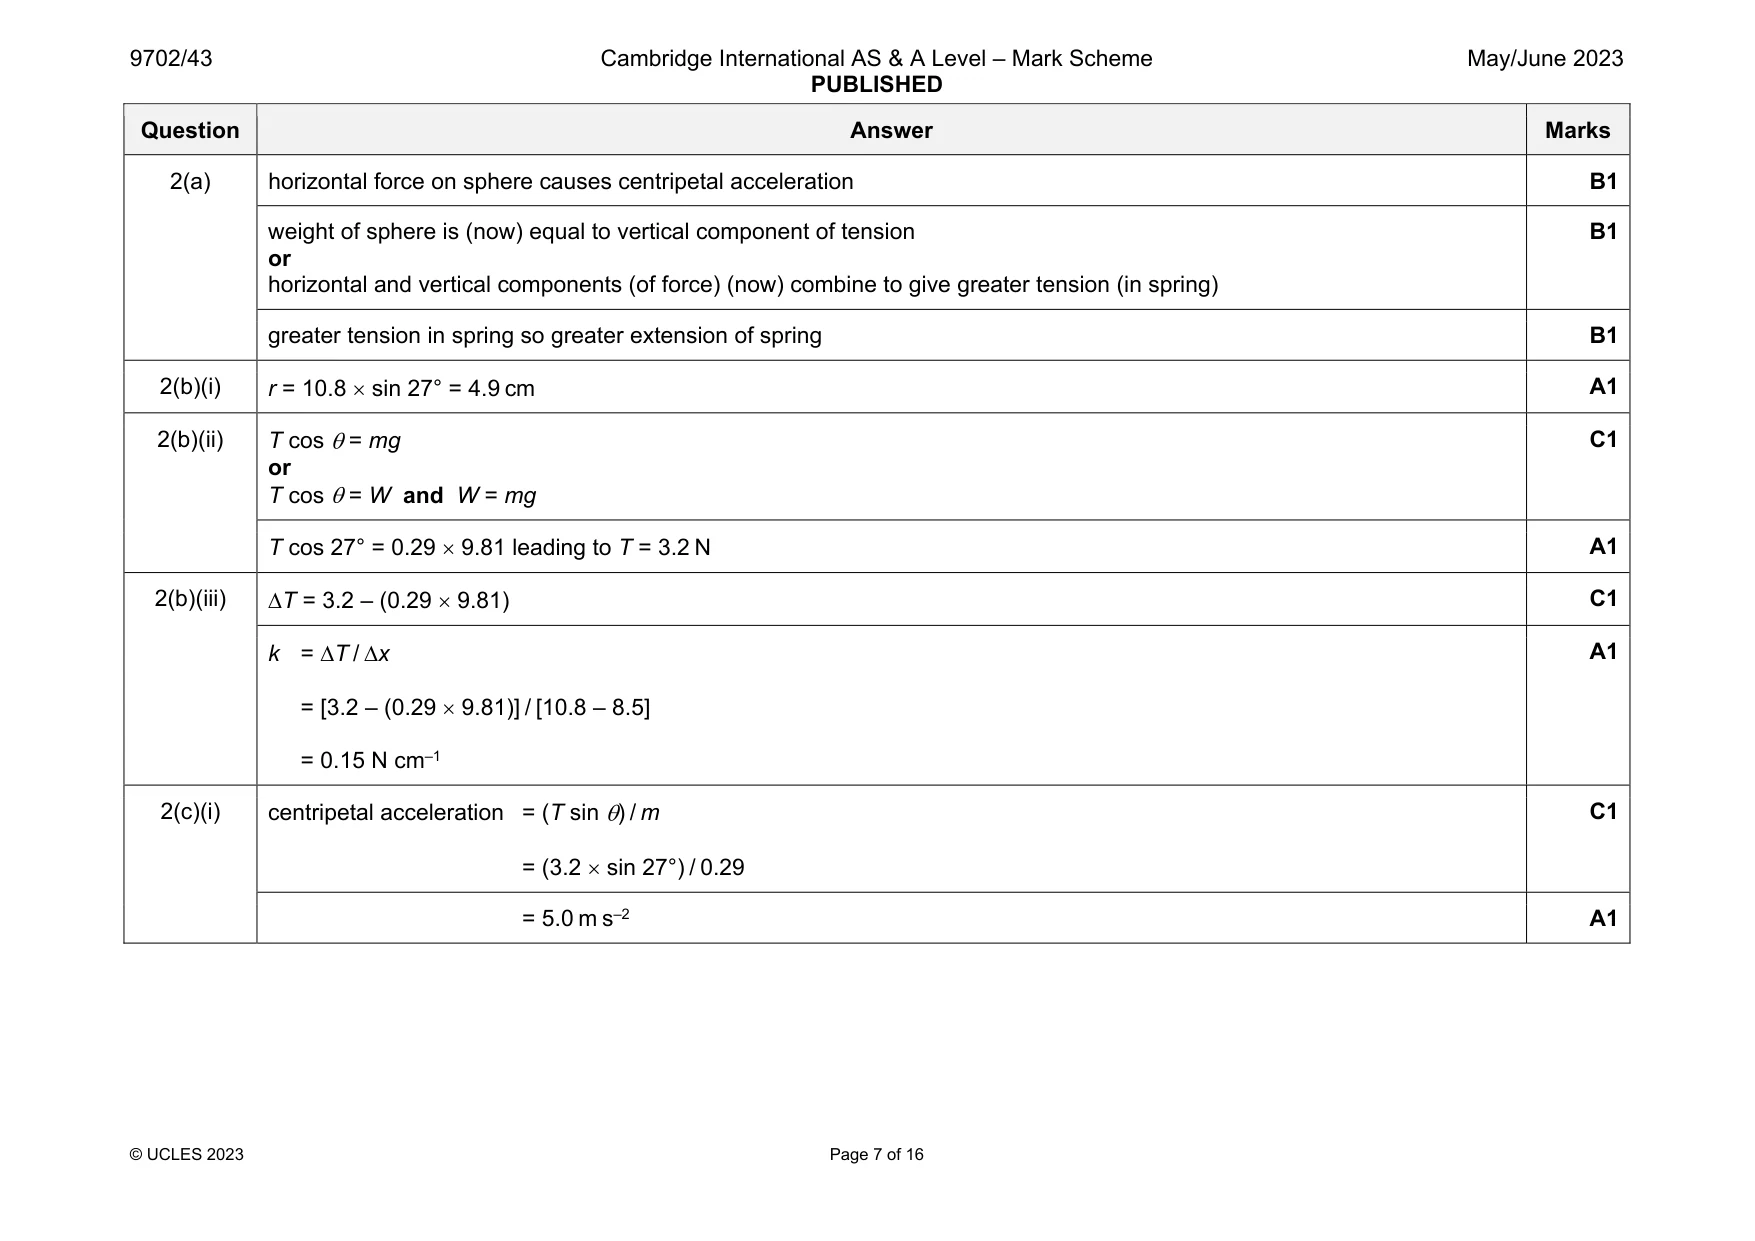
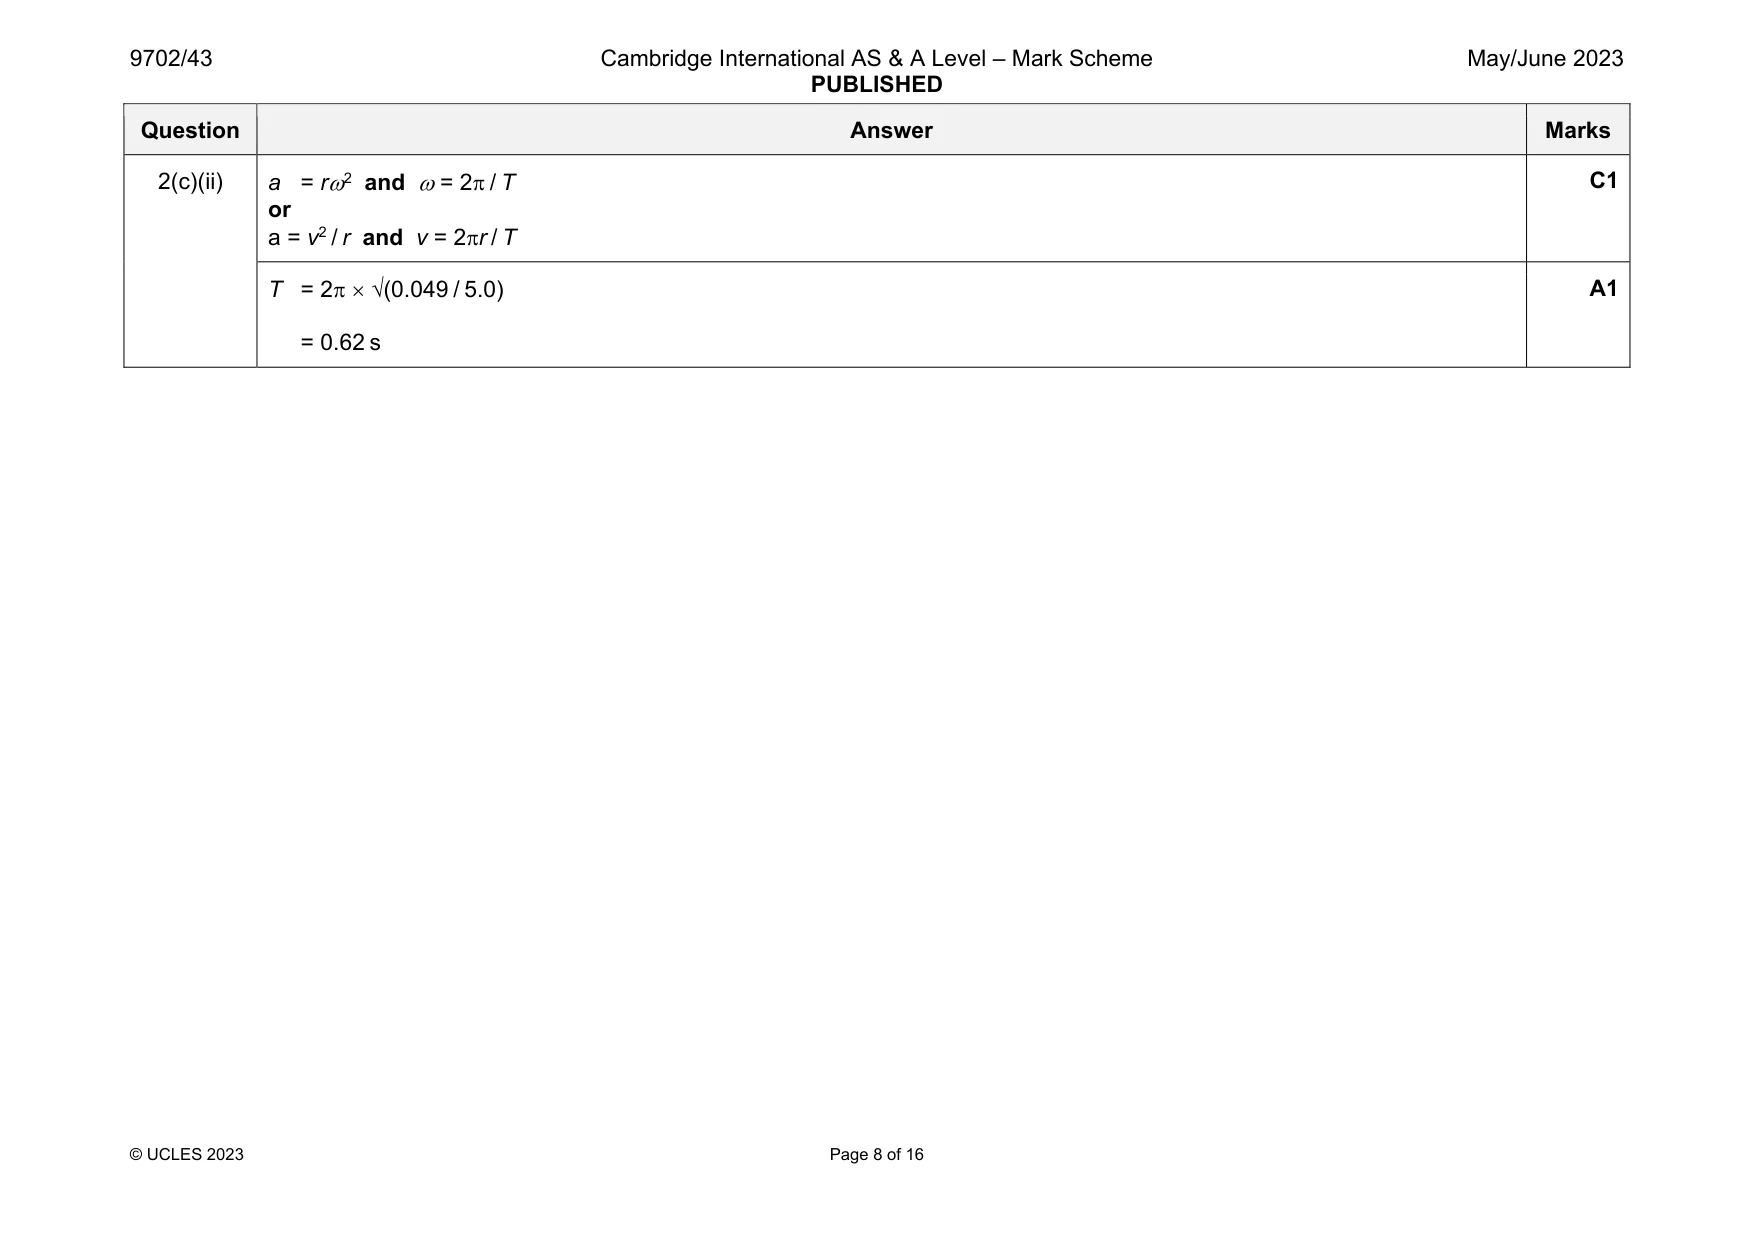
Mark scheme: 2(a) horizontal force on sphere causes centripetal acceleration B1 weight of sphere is (now) equal to vertical component of tension or horizontal and vertical components (of force) (now) combine to give greater tension (in spring) B1 greater tension in spring so greater extension of spring B1 2(b)(i) r = 10.8 sin 27° = 4.9 cm A1 2(b)(ii) T cos = mg or T cos = W and W = mg C1 T cos 27° = 0.29 9.81 leading to T = 3.2 N A1 2(b)(iii) T = 3.2 – (0.29 9.81) C1 k = T / x = [3.2 – (0.29 9.81)] / [10.8 – 8.5] = 0.15 N cm–1 A1 2(c)(i) centripetal acceleration = (T sin ) / m = (3.2 sin 27°) / 0.29 C1 = 5.0 m s–2 A1 Question Answer Marks 2(c)(ii) a = r2 and = 2 / T or a = v2 / r and v = 2r / T C1 T = 2 √(0.049 / 5.0) = 0.62 s A1
Q3 · State the reason why two objects that are at the same temperature are described as being…
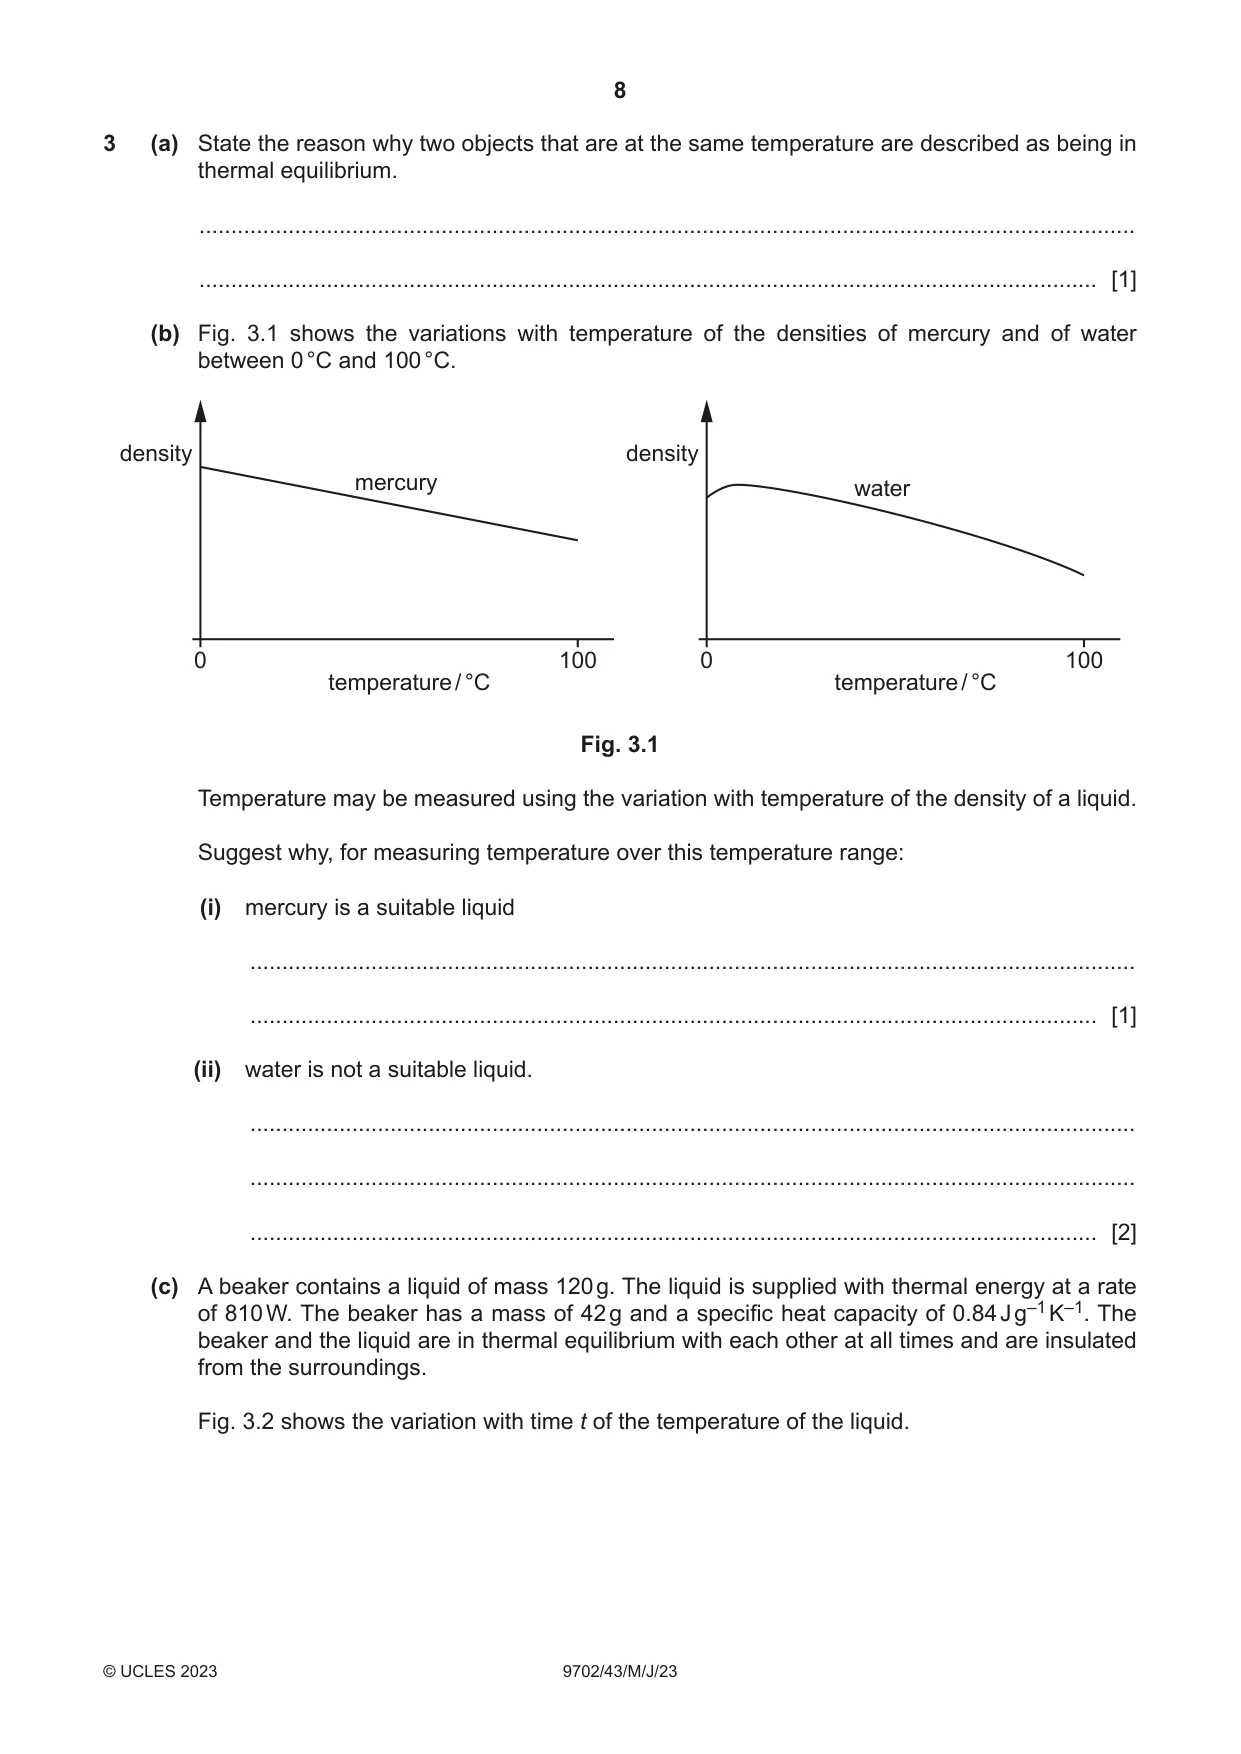
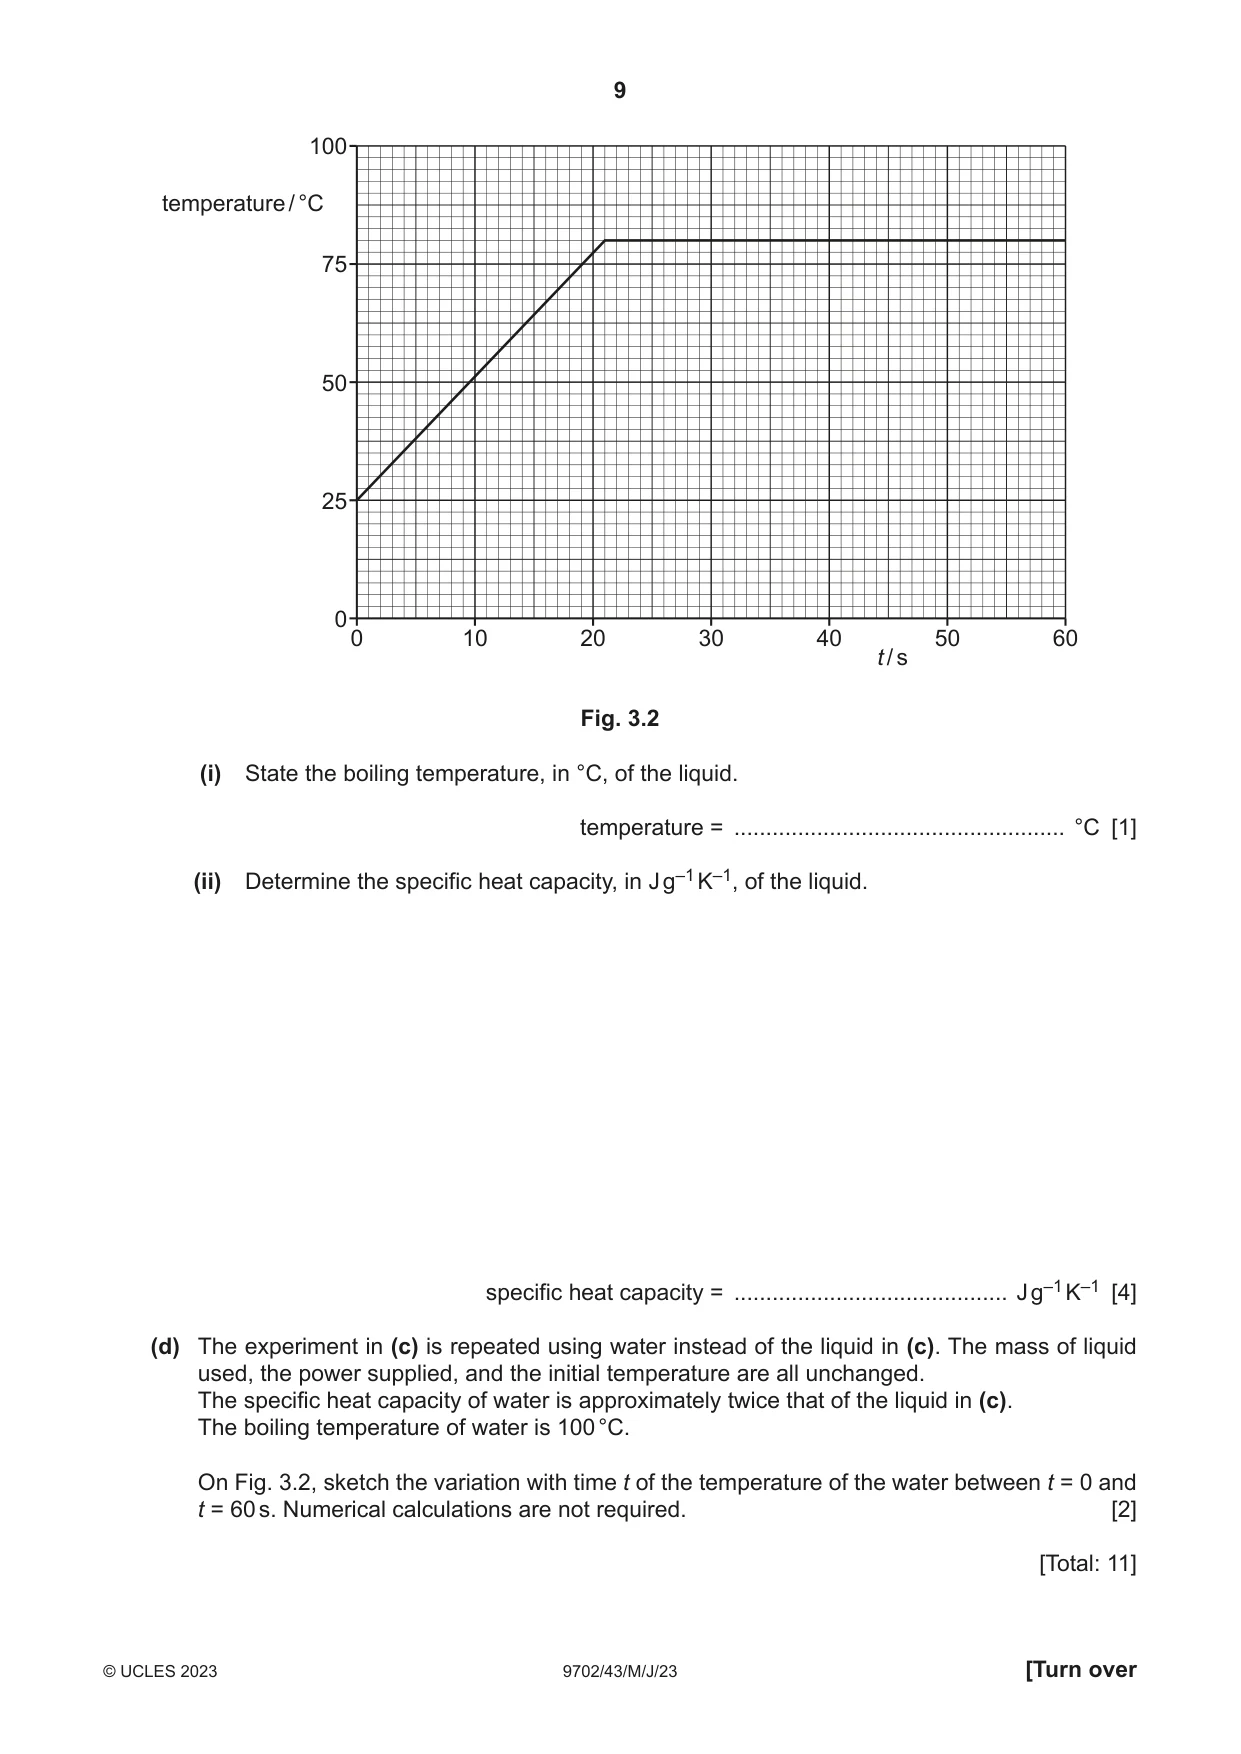
3 (a) State the reason why two objects that are at the same temperature are described as being in thermal equilibrium. ................................................................................................................................................... ............................................................................................................................................. [1] (b) Fig. 3.1 shows the variations with temperature of the densities of mercury and of water between 0 °C and 100 °C. density density mercury water 0 100 0 100 temperature / °C temperature / °C Fig. 3.1 Temperature may be measured using the variation with temperature of the density of a liquid. Suggest why, for measuring temperature over this temperature range: (i) mercury is a suitable liquid ........................................................................................................................................... ..................................................................................................................................... [1] (ii) water is not a suitable liquid. ........................................................................................................................................... ........................................................................................................................................... ..................................................................................................................................... [2] (c) A beaker contains a liquid of mass 120 g. The liquid is supplied with thermal energy at a rate of 810 W. The beaker has a mass of 42 g and a specific heat capacity of 0.84 J g–1 K–1. The beaker and the liquid are in thermal equilibrium with each other at all times and are insulated from the surroundings. Fig. 3.2 shows the variation with time t of the temperature of the liquid. 100 temperature / °C 75 50 25 0 0 10 20 30 40 50 60 t / s Fig. 3.2 (i) State the boiling temperature, in °C, of the liquid. temperature = .................................................... °C [1] (ii) Determine the specific heat capacity, in J g–1 K–1, of the liquid. specific heat capacity = ........................................... J g–1 K–1 [4] (d) The experiment in (c) is repeated using water instead of the liquid in (c). The mass of liquid used, the power supplied, and the initial temperature are all unchanged. The specific heat capacity of water is approximately twice that of the liquid in (c). The boiling temperature of water is 100 °C. On Fig. 3.2, sketch the variation with time t of the temperature of the water between t = 0 and t = 60 s. Numerical calculations are not required. [2] [Total: 11]
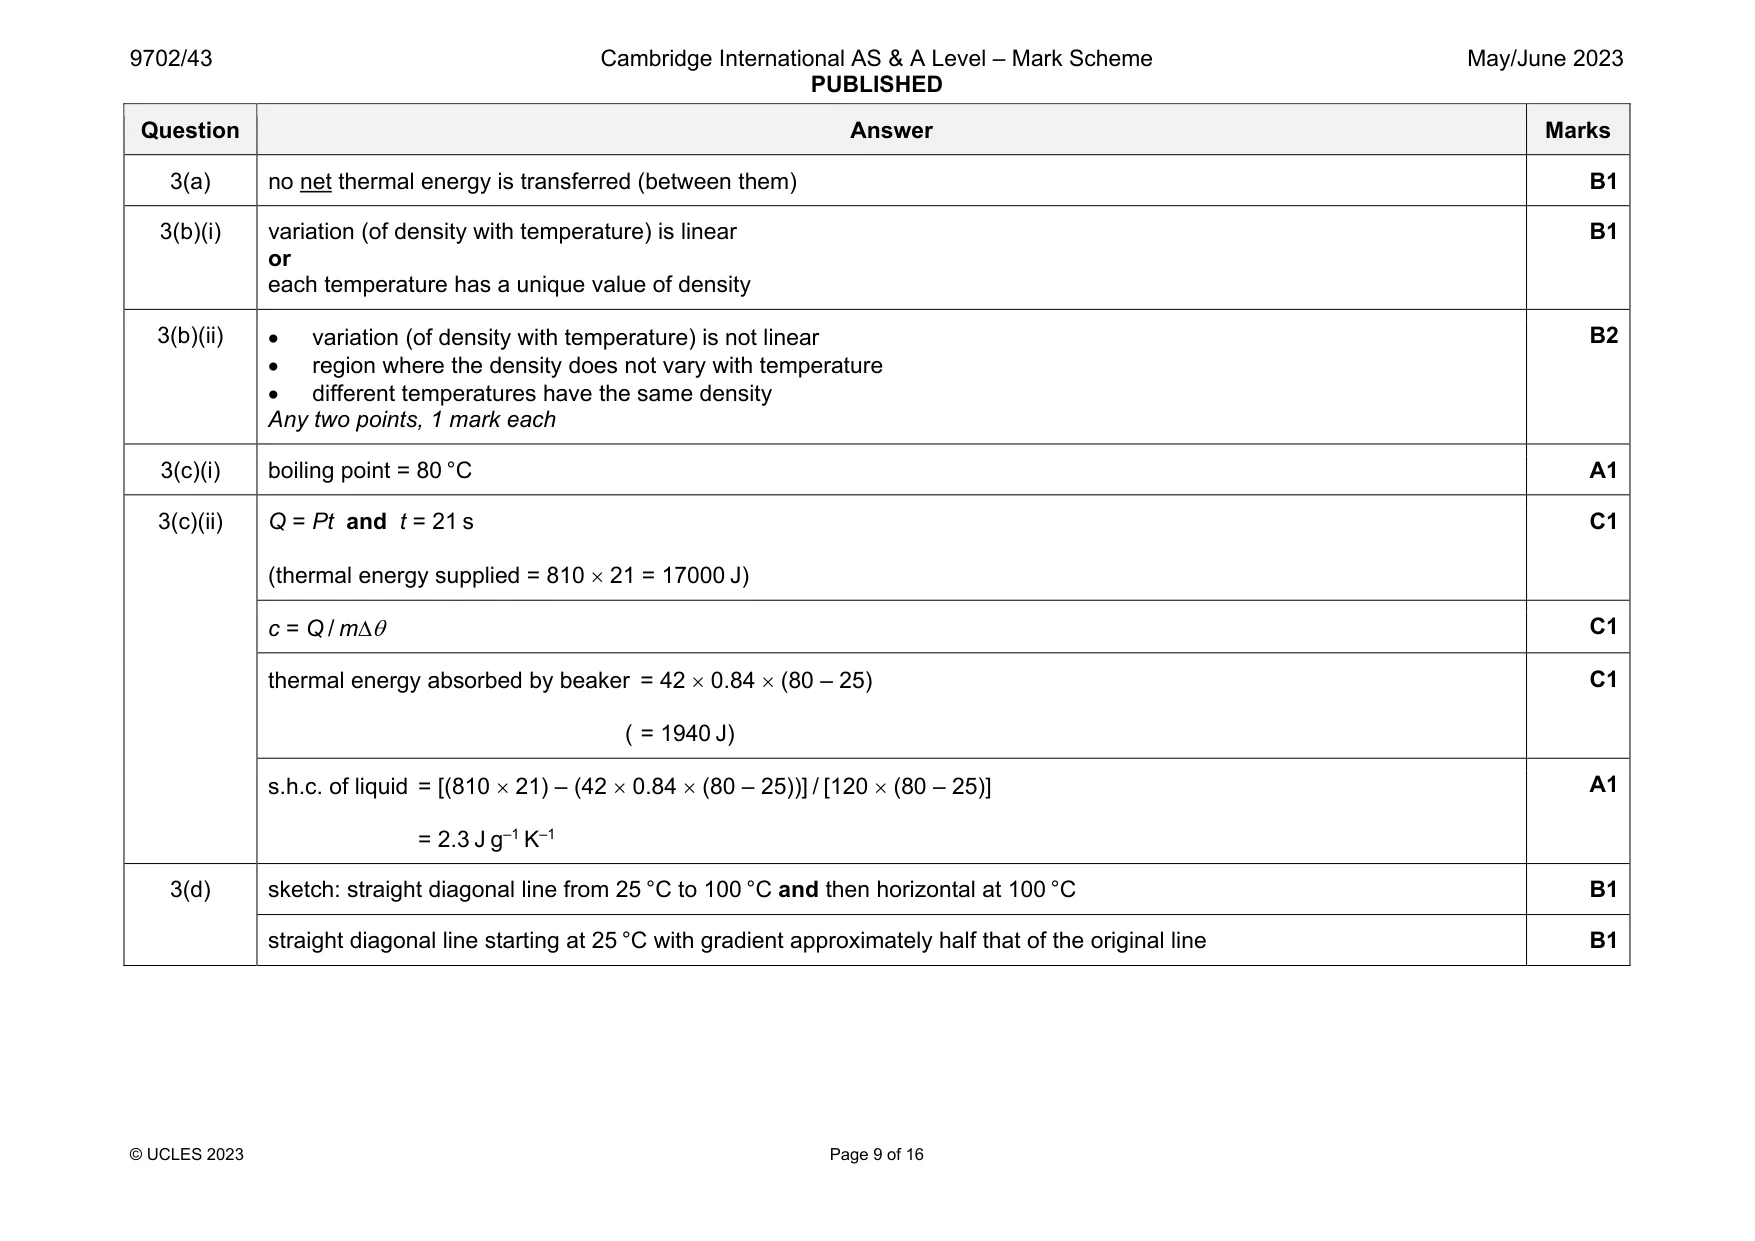
Mark scheme: 3(a) no net thermal energy is transferred (between them) B1 3(b)(i) variation (of density with temperature) is linear or each temperature has a unique value of density B1 3(b)(ii) variation (of density with temperature) is not linear region where the density does not vary with temperature different temperatures have the same density Any two points, 1 mark each B2 3(c)(i) boiling point = 80 °C A1 3(c)(ii) Q = Pt and t = 21 s (thermal energy supplied = 810 21 = 17000 J) C1 c = Q / m C1 thermal energy absorbed by beaker = 42 0.84 (80 – 25) ( = 1940 J) C1 s.h.c. of liquid = [(810 21) – (42 0.84 (80 – 25))] / [120 (80 – 25)] = 2.3 J g–1 K–1 A1 3(d) sketch: straight diagonal line from 25 °C to 100 °C and then horizontal at 100 °C B1 straight diagonal line starting at 25 °C with gradient approximately half that of the original line B1
More questions on Specific heat capacity and specific latent heat
Q4 · State two of the basic assumptions of the kinetic theory of gases
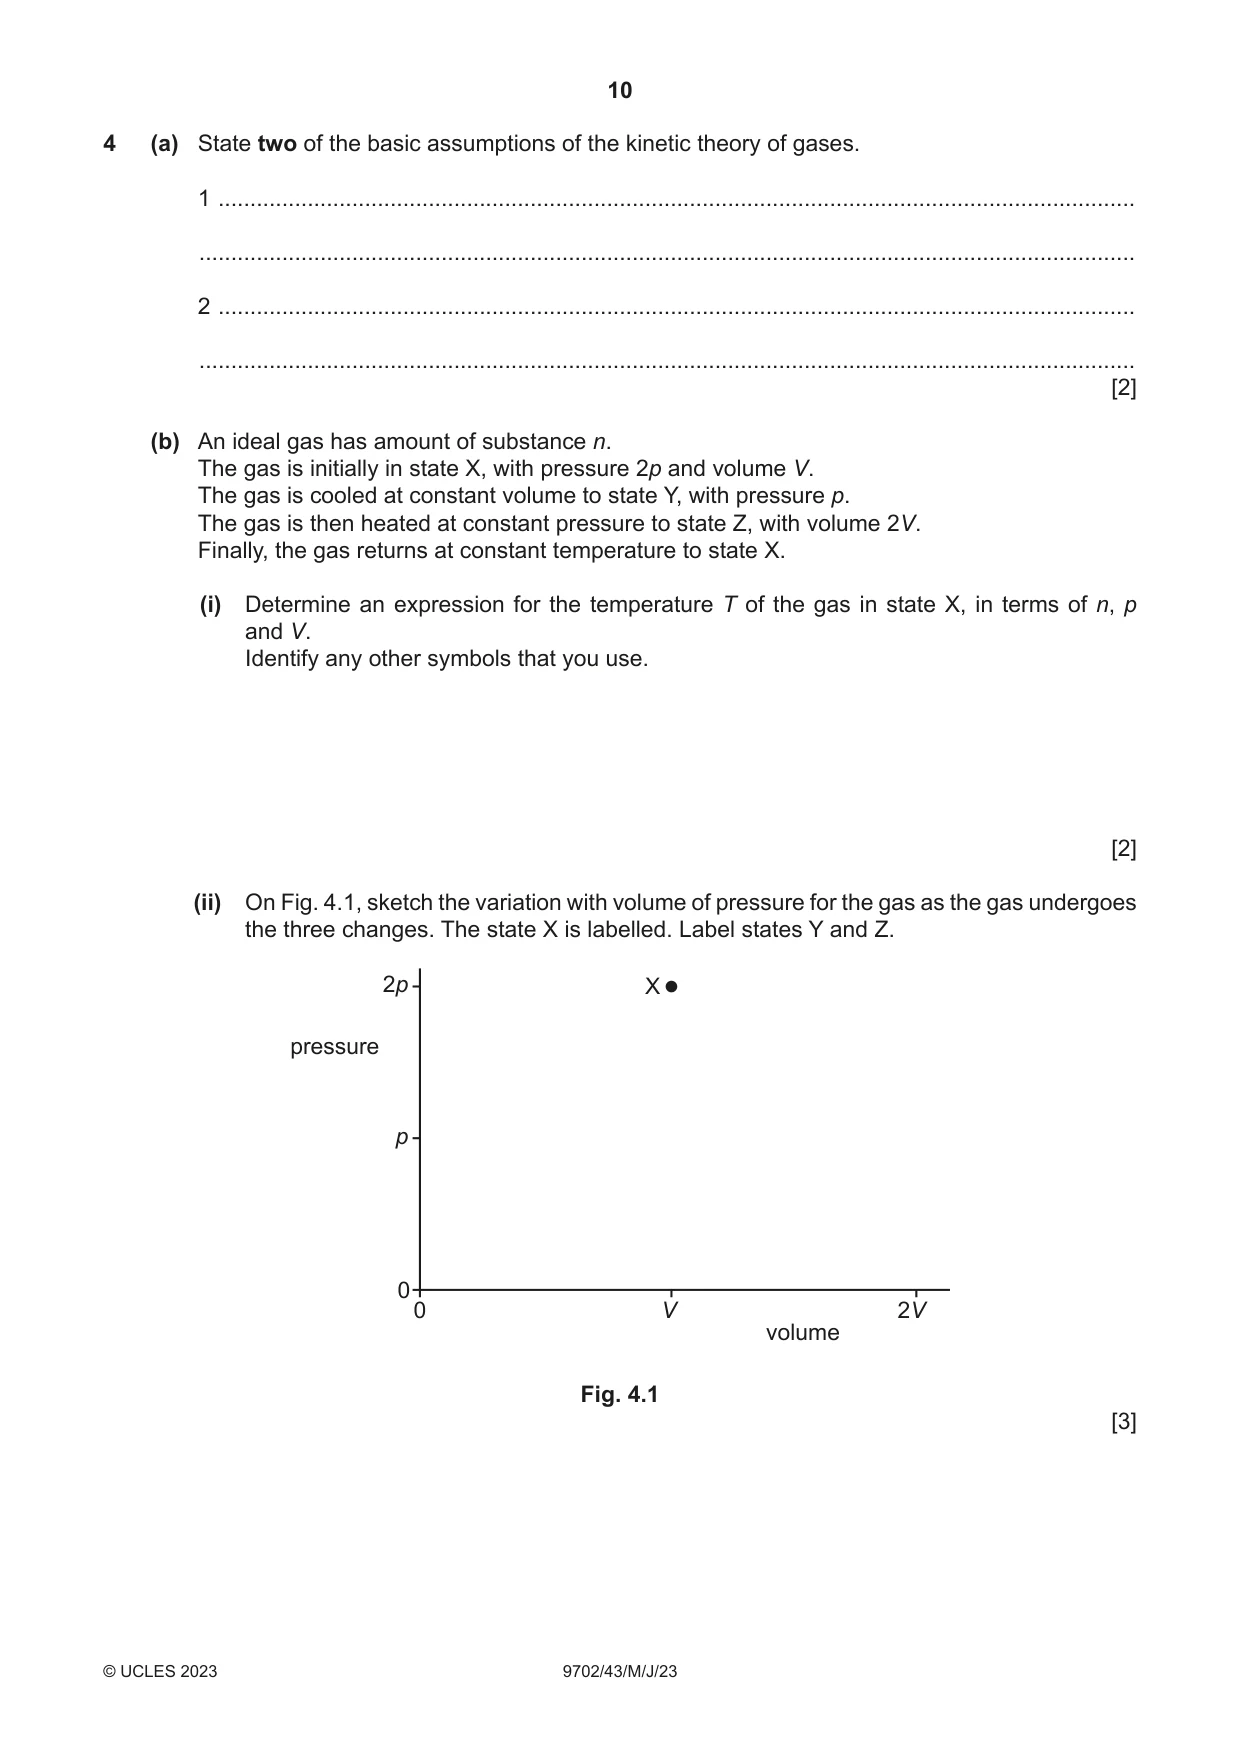
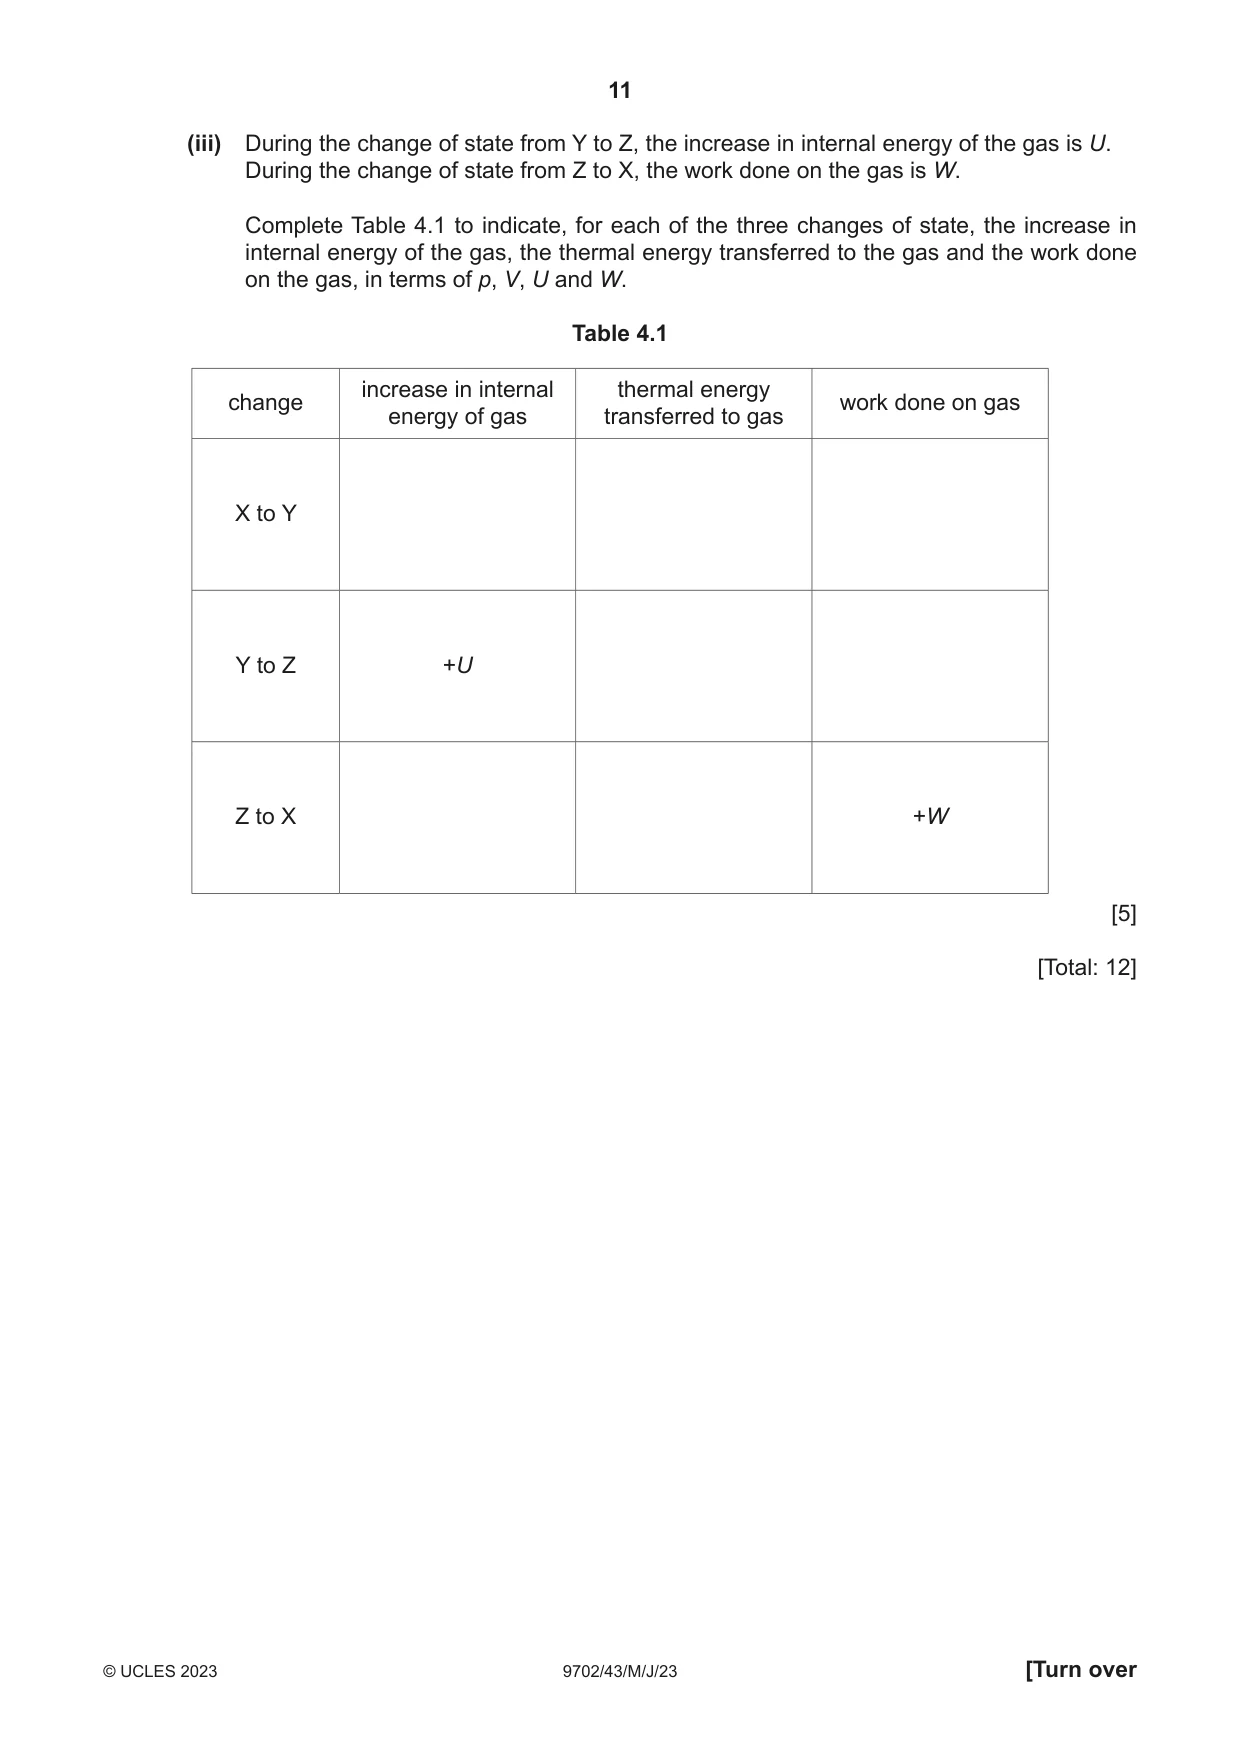
4 (a) State two of the basic assumptions of the kinetic theory of gases. 1 ................................................................................................................................................ ................................................................................................................................................... 2 ................................................................................................................................................ ................................................................................................................................................... [2] (b) An ideal gas has amount of substance n. The gas is initially in state X, with pressure 2p and volume V. The gas is cooled at constant volume to state Y, with pressure p. The gas is then heated at constant pressure to state Z, with volume 2V. Finally, the gas returns at constant temperature to state X. (i) Determine an expression for the temperature T of the gas in state X, in terms of n, p and V. Identify any other symbols that you use. [2] (ii) On Fig. 4.1, sketch the variation with volume of pressure for the gas as the gas undergoes the three changes. The state X is labelled. Label states Y and Z. 2p X pressure p 0 0 V 2V volume Fig. 4.1 [3] (iii) During the change of state from Y to Z, the increase in internal energy of the gas is U. During the change of state from Z to X, the work done on the gas is W. Complete Table 4.1 to indicate, for each of the three changes of state, the increase in internal energy of the gas, the thermal energy transferred to the gas and the work done on the gas, in terms of p, V, U and W. Table 4.1 increase in internal thermal energy change work done on gas energy of gas transferred to gas X to Y Y to Z +U Z to X +W [5] [Total: 12]
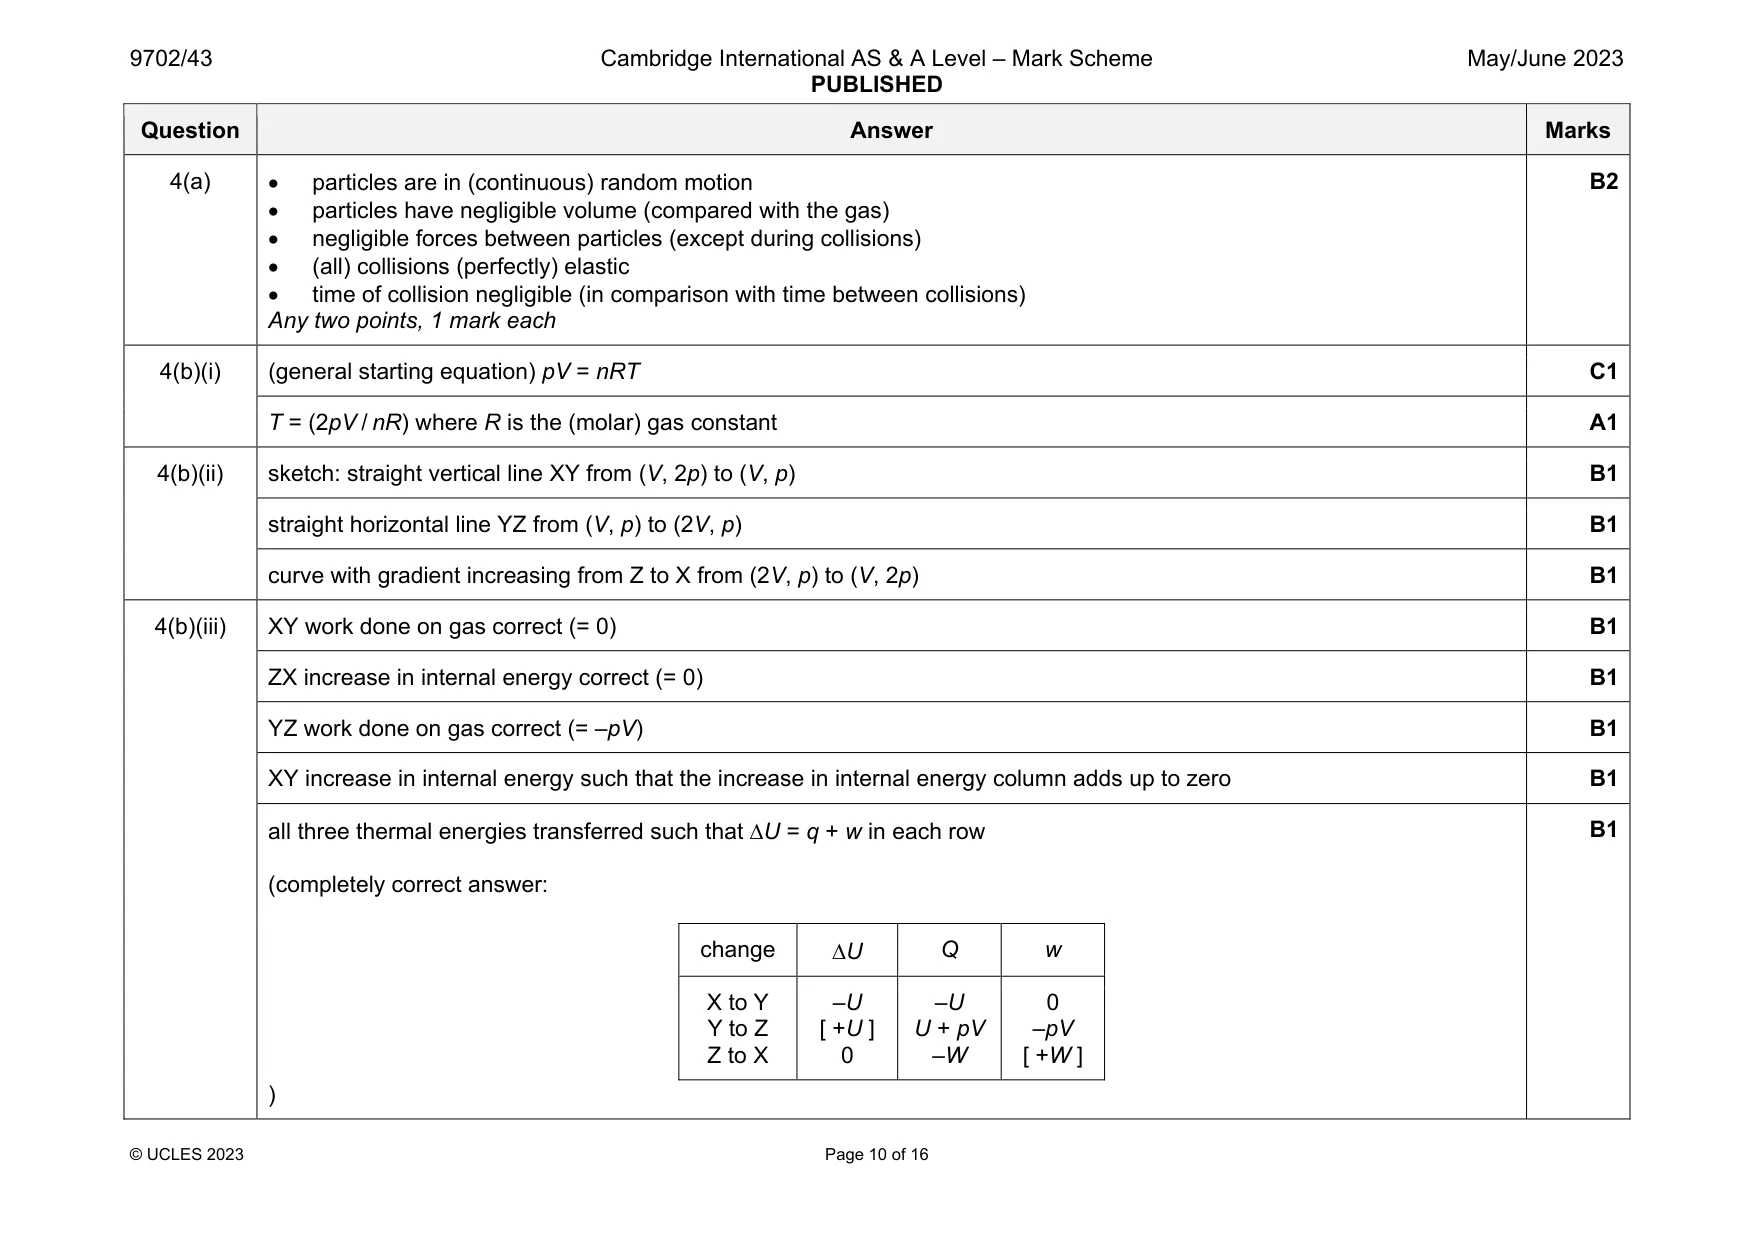
Mark scheme: 4(a) particles are in (continuous) random motion particles have negligible volume (compared with the gas) negligible forces between particles (except during collisions) (all) collisions (perfectly) elastic time of collision negligible (in comparison with time between collisions) Any two points, 1 mark each B2 4(b)(i) (general starting equation) pV = nRT C1 T = (2pV / nR) where R is the (molar) gas constant A1 4(b)(ii) sketch: straight vertical line XY from (V, 2p) to (V, p) B1 straight horizontal line YZ from (V, p) to (2V, p) B1 curve with gradient increasing from Z to X from (2V, p) to (V, 2p) B1 4(b)(iii) XY work done on gas correct (= 0) B1 ZX increase in internal energy correct (= 0) B1 YZ work done on gas correct (= –pV) B1 XY increase in internal energy such that the increase in internal energy column adds up to zero B1 all three thermal energies transferred such that U = q + w in each row (completely correct answer: change U Q w X to Y Y to Z Z to X –U [ +U ] 0 –U U + pV –W 0 –pV [ +W ] ) B1
Q5 · Part of an electric circuit is shown in Fig
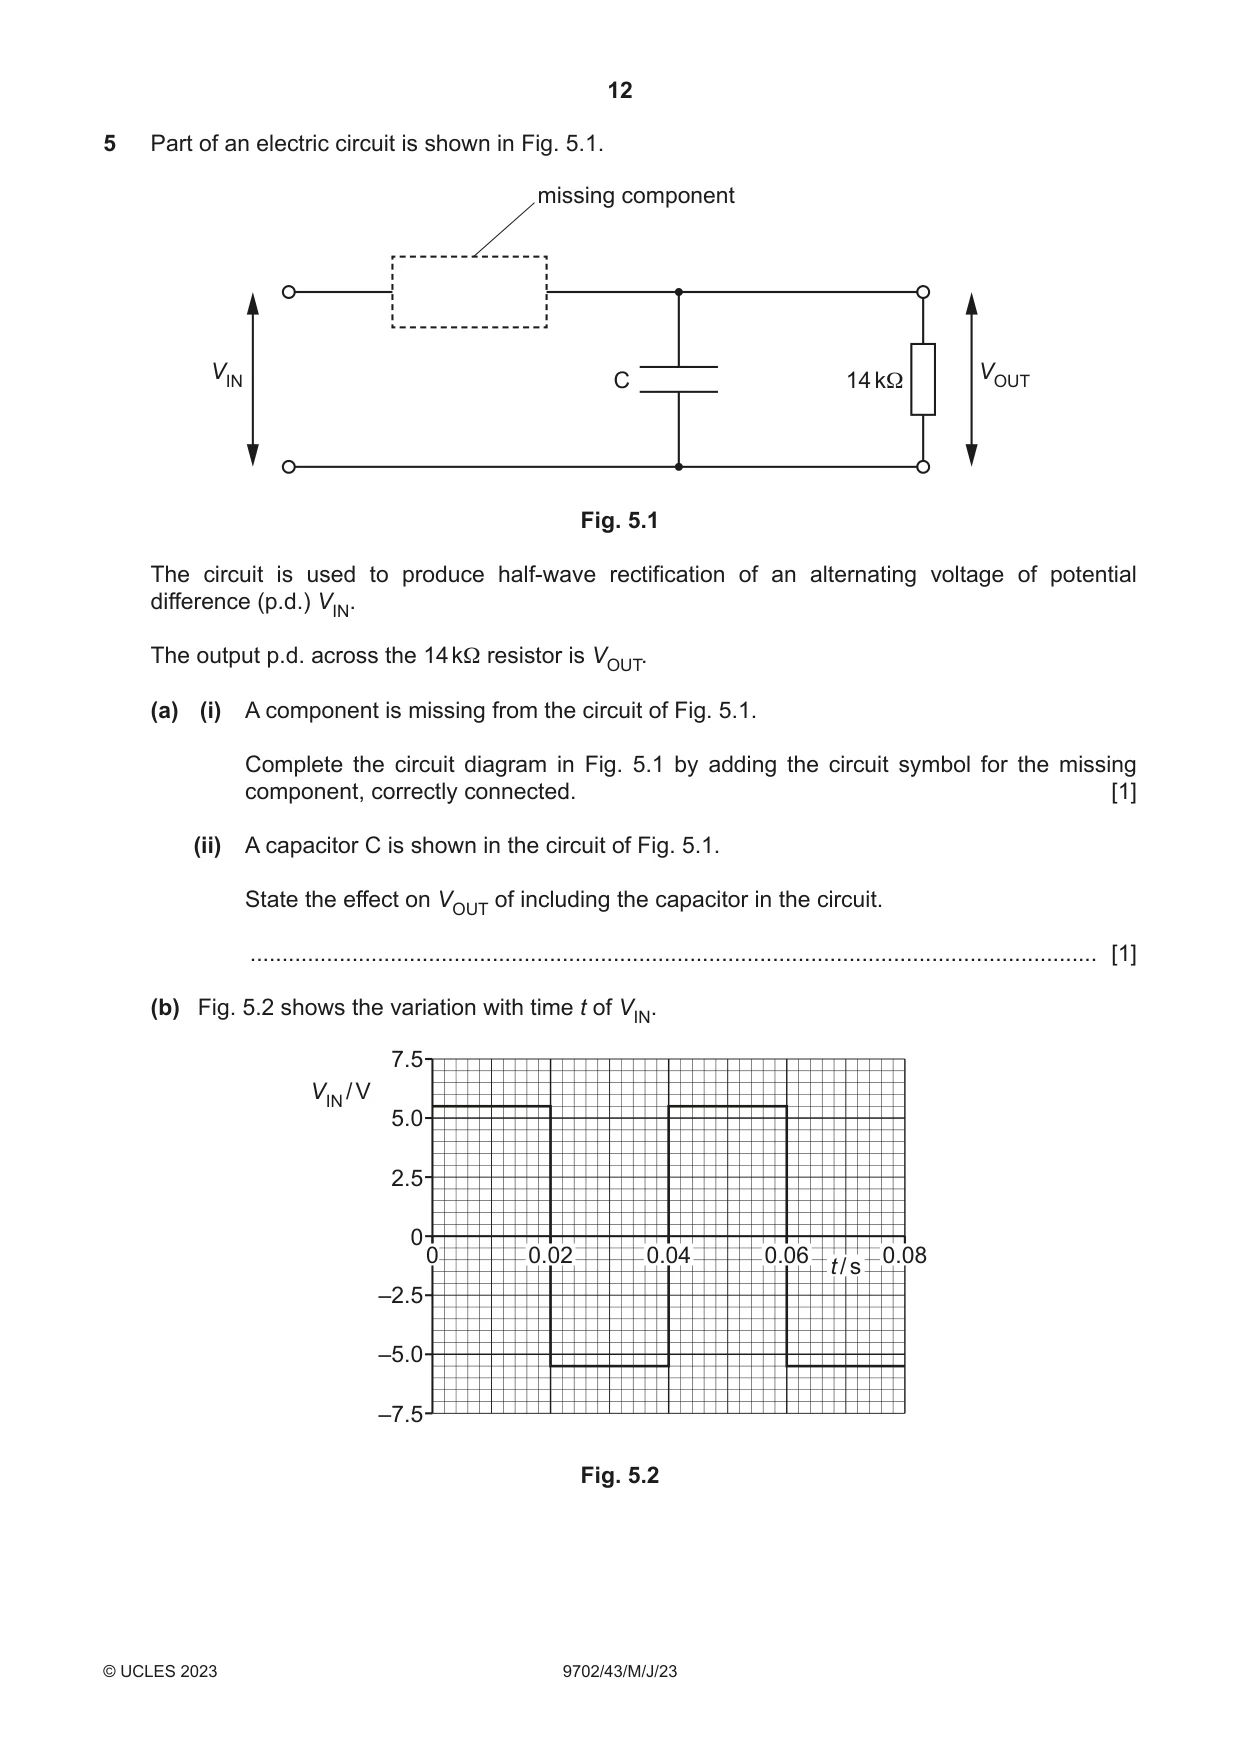
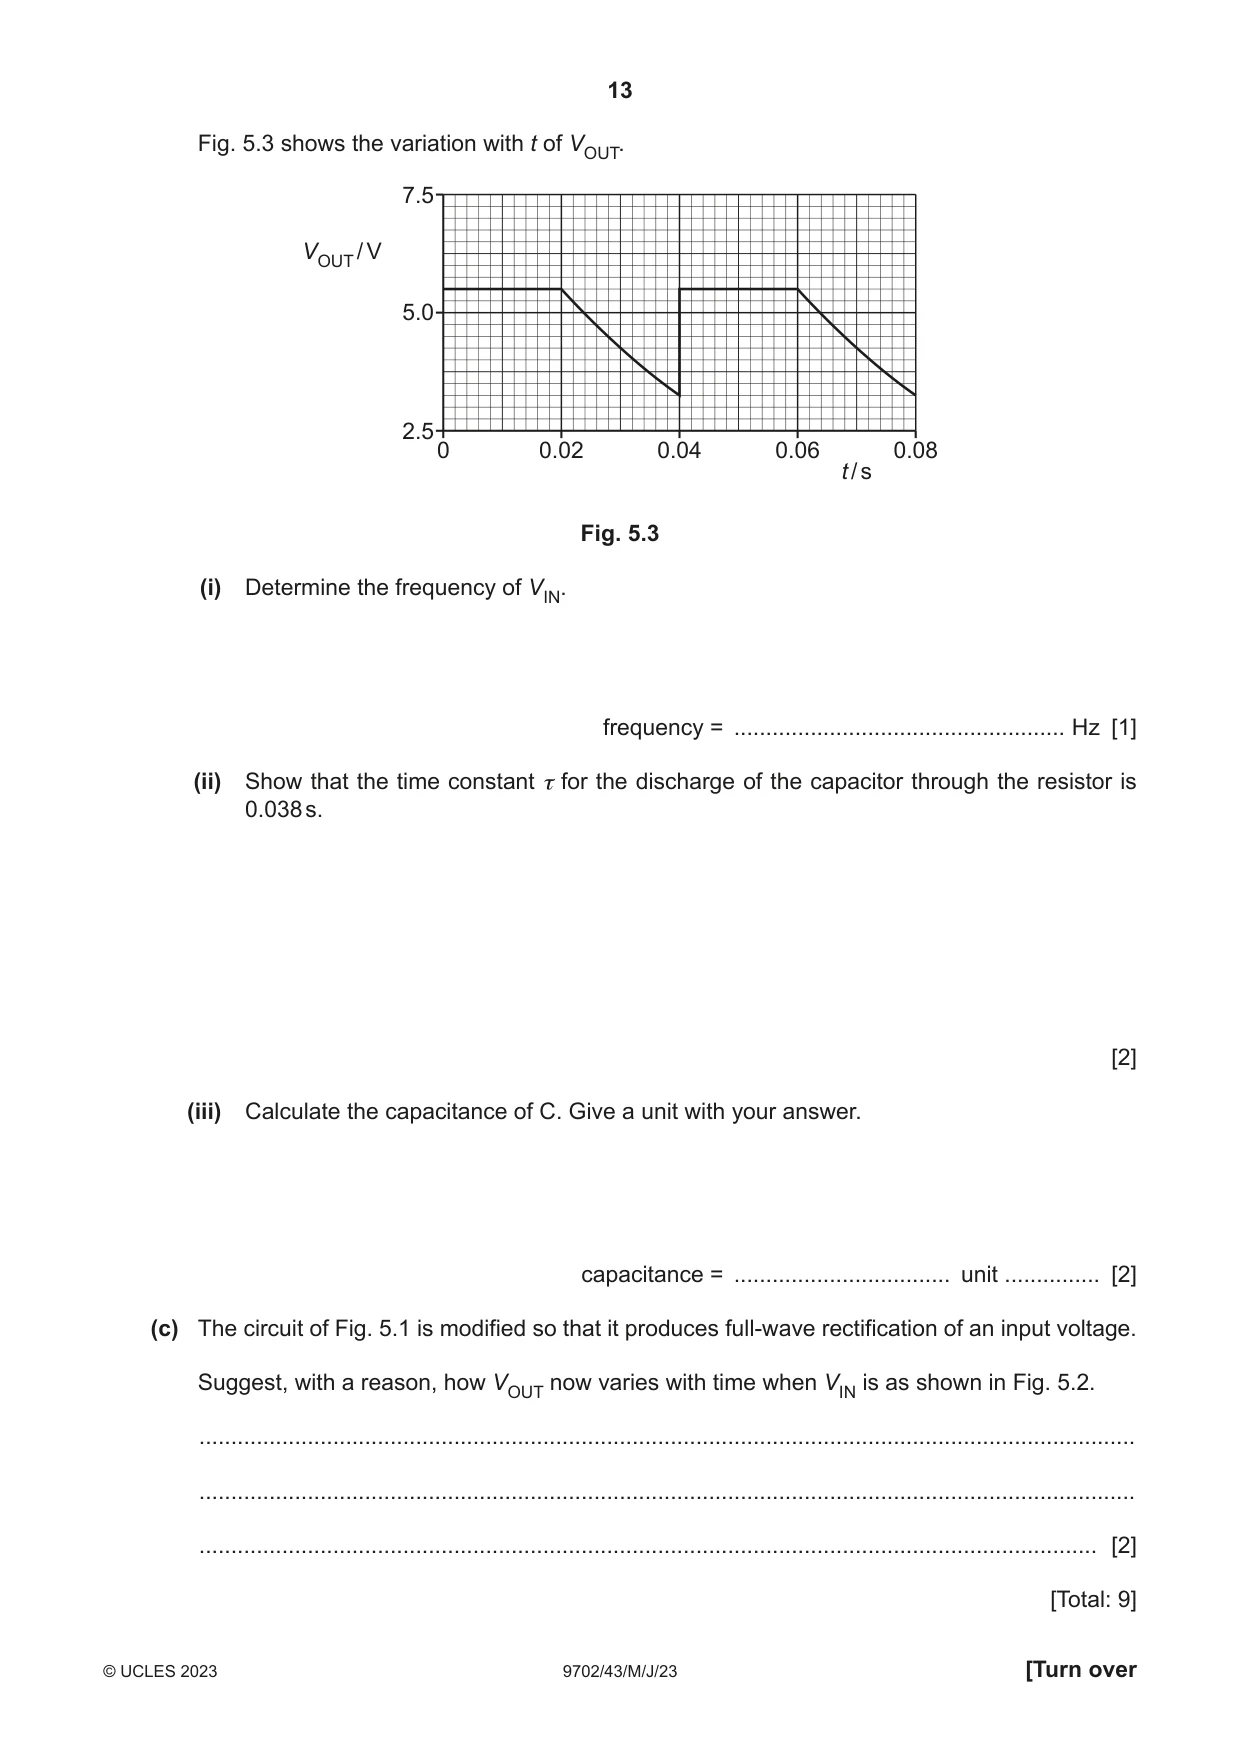
5 Part of an electric circuit is shown in Fig. 5.1. missing component VIN C 14 kΩ VOUT Fig. 5.1 The circuit is used to produce half-wave rectification of an alternating voltage of potential difference (p.d.) VIN. The output p.d. across the 14 kΩ resistor is VOUT. (a) (i) A component is missing from the circuit of Fig. 5.1. Complete the circuit diagram in Fig. 5.1 by adding the circuit symbol for the missing component, correctly connected. [1] (ii) A capacitor C is shown in the circuit of Fig. 5.1. State the effect on VOUT of including the capacitor in the circuit. ..................................................................................................................................... [1] (b) Fig. 5.2 shows the variation with time t of VIN. 7.5 VIN / V 5.0 2.5 0 0 0.02 0.04 0.06 0.08 t / s –2.5 –5.0 –7.5 Fig. 5.2 Fig. 5.3 shows the variation with t of VOUT. 7.5 VOUT / V 5.0 2.5 0 0.02 0.04 0.06 0.08 t / s Fig. 5.3 (i) Determine the frequency of VIN. frequency = .................................................... Hz [1] (ii) Show that the time constant τ for the discharge of the capacitor through the resistor is 0.038 s. [2] (iii) Calculate the capacitance of C. Give a unit with your answer. capacitance = .................................. unit ............... [2] (c) The circuit of Fig. 5.1 is modified so that it produces full-wave rectification of an input voltage. Suggest, with a reason, how VOUT now varies with time when VIN is as shown in Fig. 5.2. ................................................................................................................................................... ................................................................................................................................................... ............................................................................................................................................. [2] [Total: 9]
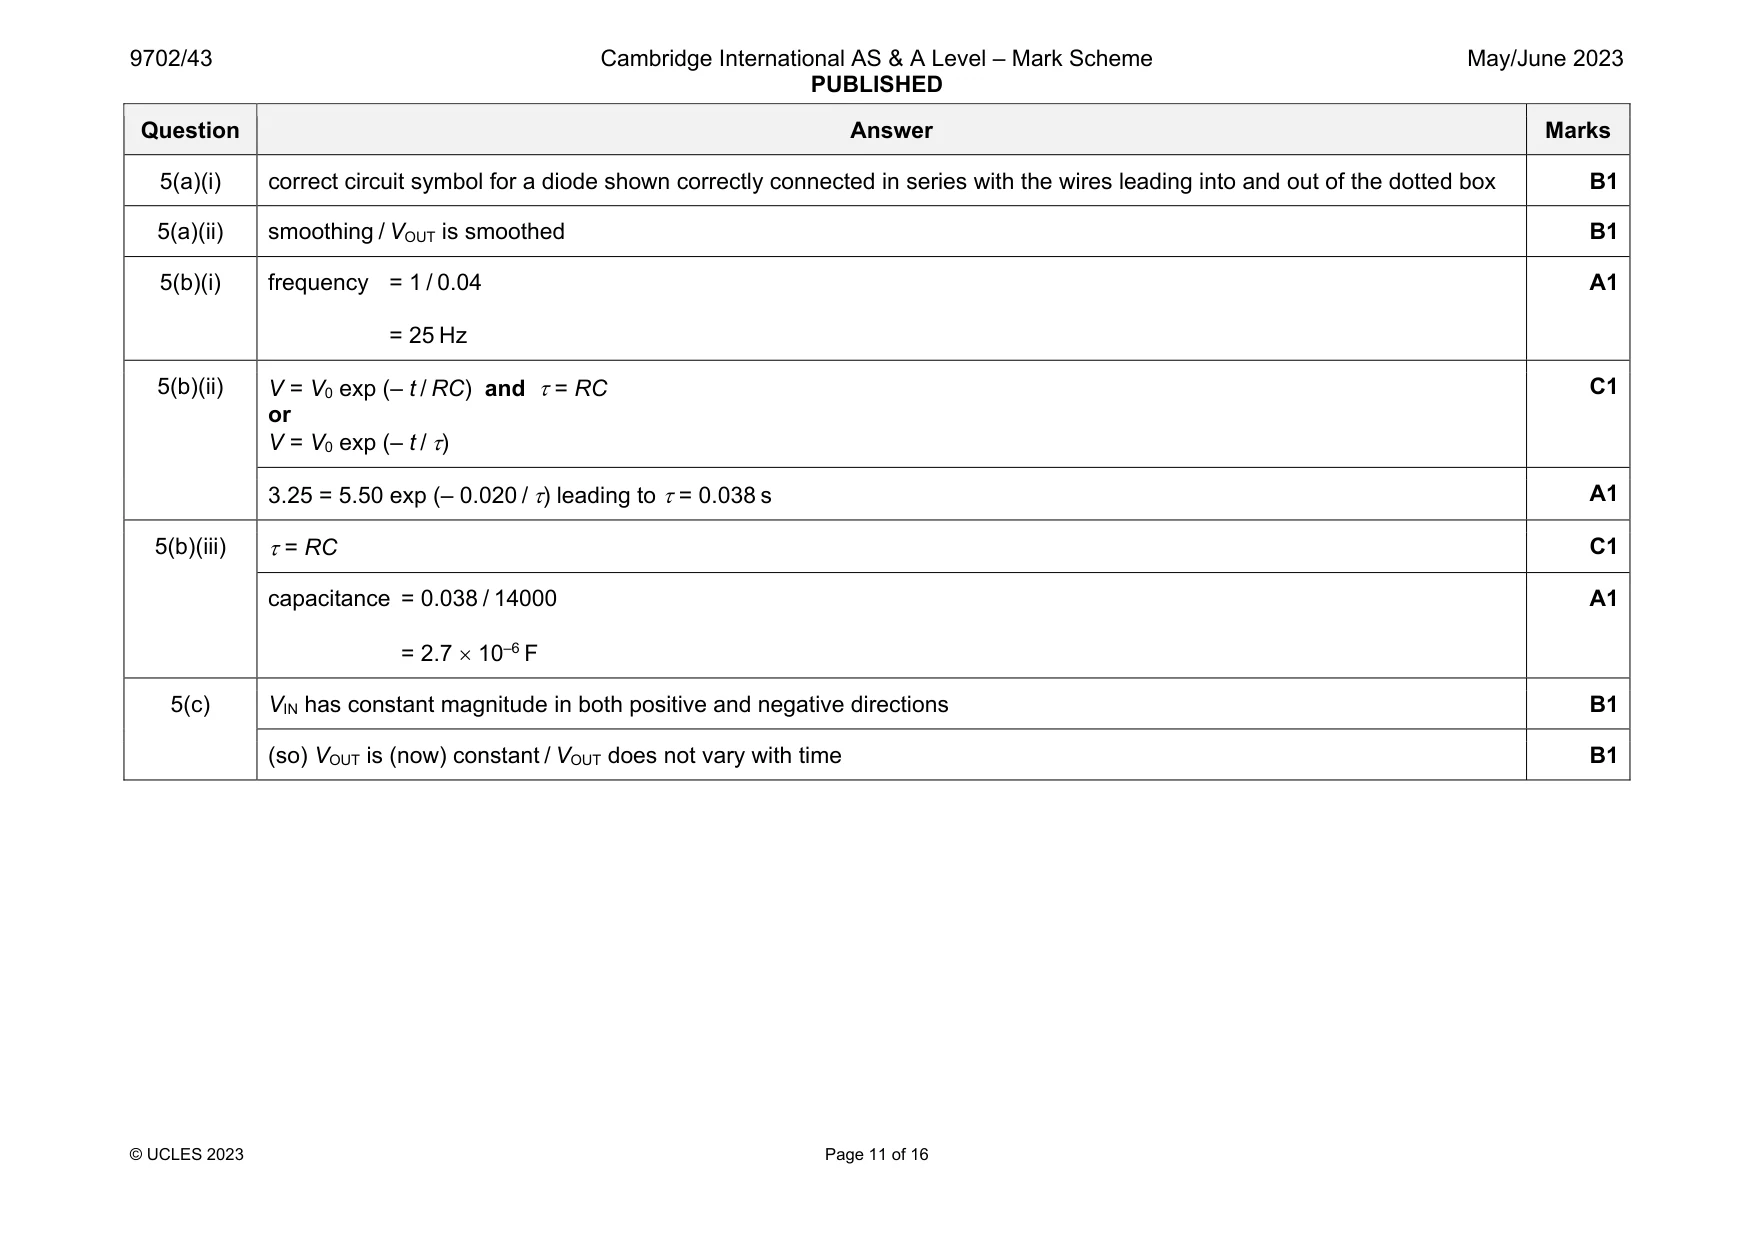
Mark scheme: 5(a)(i) correct circuit symbol for a diode shown correctly connected in series with the wires leading into and out of the dotted box B1 5(a)(ii) smoothing / VOUT is smoothed B1 5(b)(i) frequency = 1 / 0.04 = 25 Hz A1 5(b)(ii) V = V0 exp (– t / RC) and = RC or V = V0 exp (– t / ) C1 3.25 = 5.50 exp (– 0.020 / ) leading to = 0.038 s A1 5(b)(iii) = RC C1 capacitance = 0.038 / 14000 = 2.7 10–6 F A1 5(c) VIN has constant magnitude in both positive and negative directions B1 (so) VOUT is (now) constant / VOUT does not vary with time B1
Q6 · State what is meant by a magnetic field
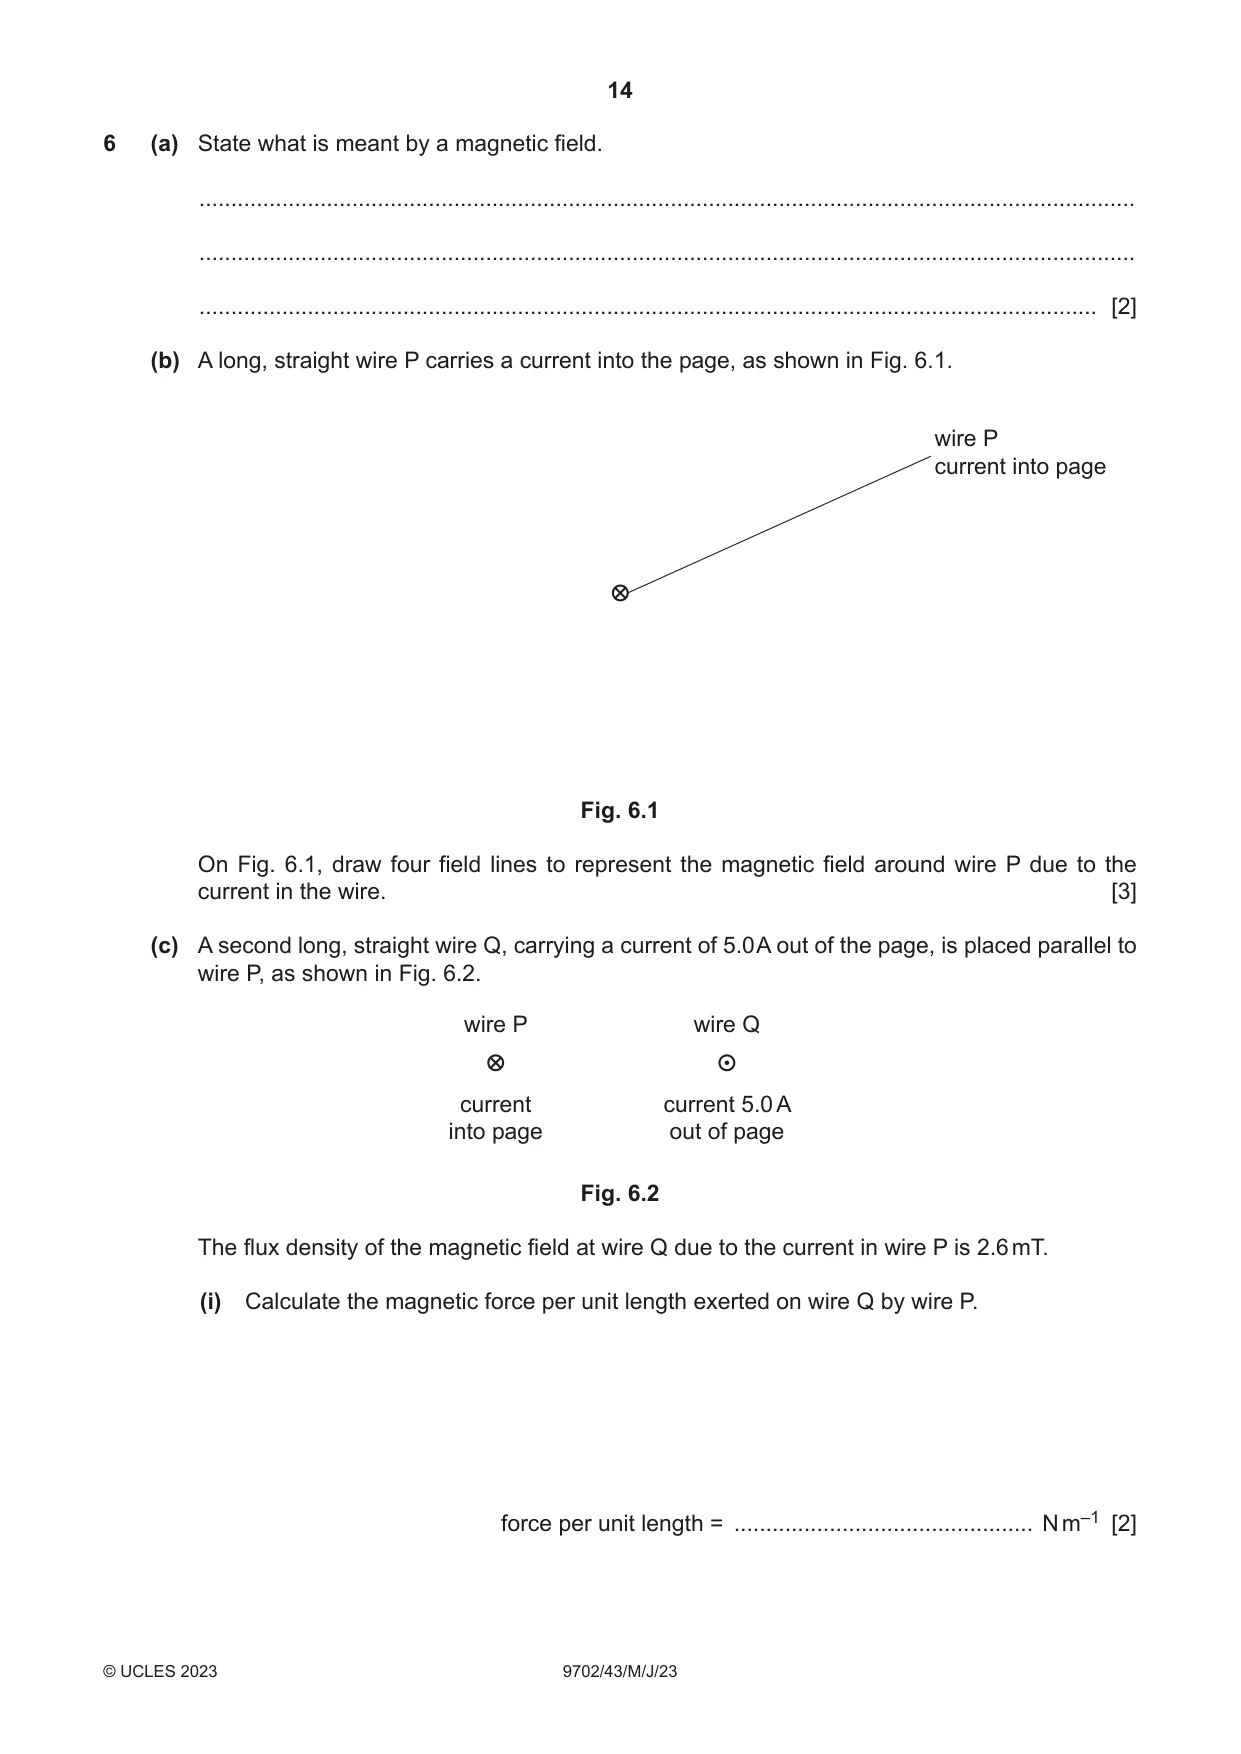
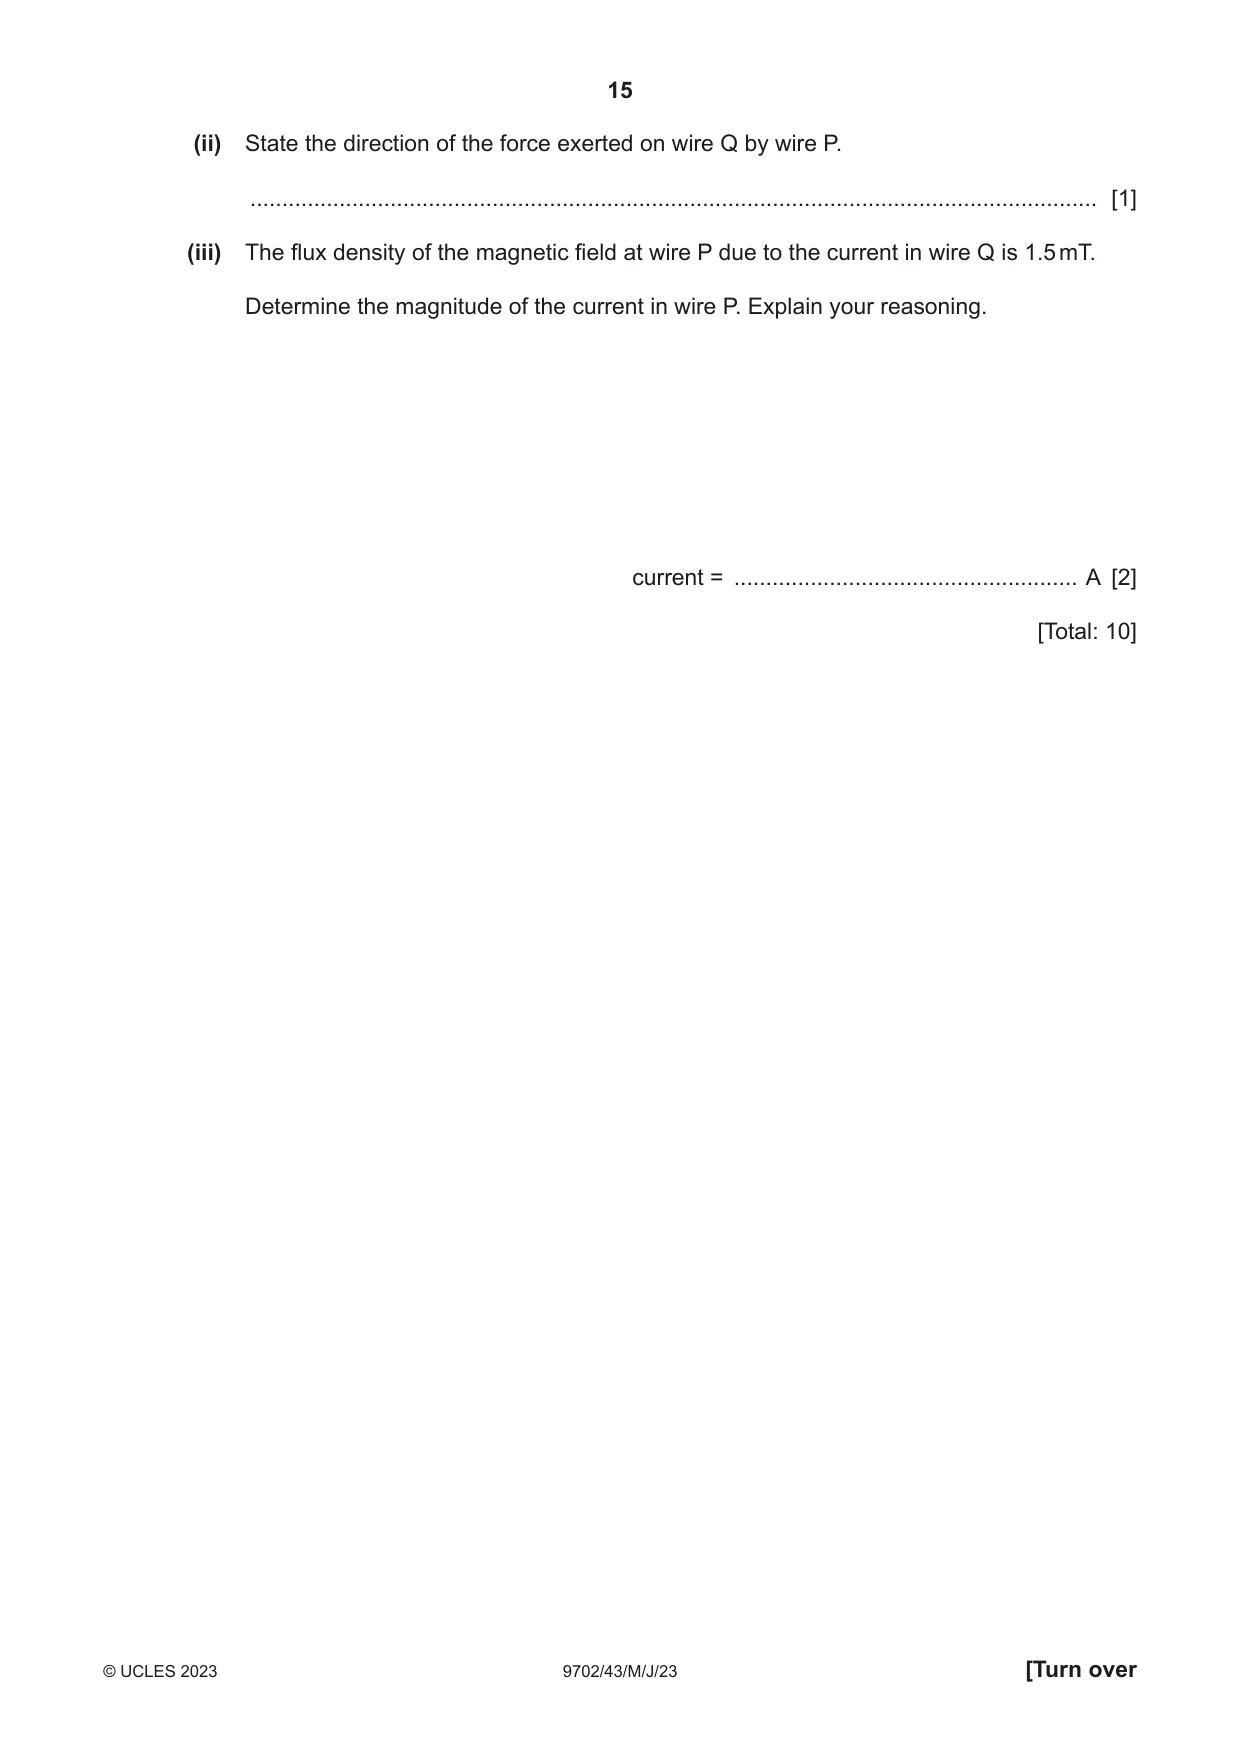
6 (a) State what is meant by a magnetic field. ................................................................................................................................................... ................................................................................................................................................... ............................................................................................................................................. [2] (b) A long, straight wire P carries a current into the page, as shown in Fig. 6.1. wire P current into page Fig. 6.1 On Fig. 6.1, draw four field lines to represent the magnetic field around wire P due to the current in the wire. [3] (c) A second long, straight wire Q, carrying a current of 5.0 A out of the page, is placed parallel to wire P, as shown in Fig. 6.2. wire P wire Q current current 5.0 A into page out of page Fig. 6.2 The flux density of the magnetic field at wire Q due to the current in wire P is 2.6 mT. (i) Calculate the magnetic force per unit length exerted on wire Q by wire P. force per unit length = ............................................... N m–1 [2] (ii) State the direction of the force exerted on wire Q by wire P. ..................................................................................................................................... [1] (iii) The flux density of the magnetic field at wire P due to the current in wire Q is 1.5 mT. Determine the magnitude of the current in wire P. Explain your reasoning. current = ...................................................... A [2] [Total: 10]
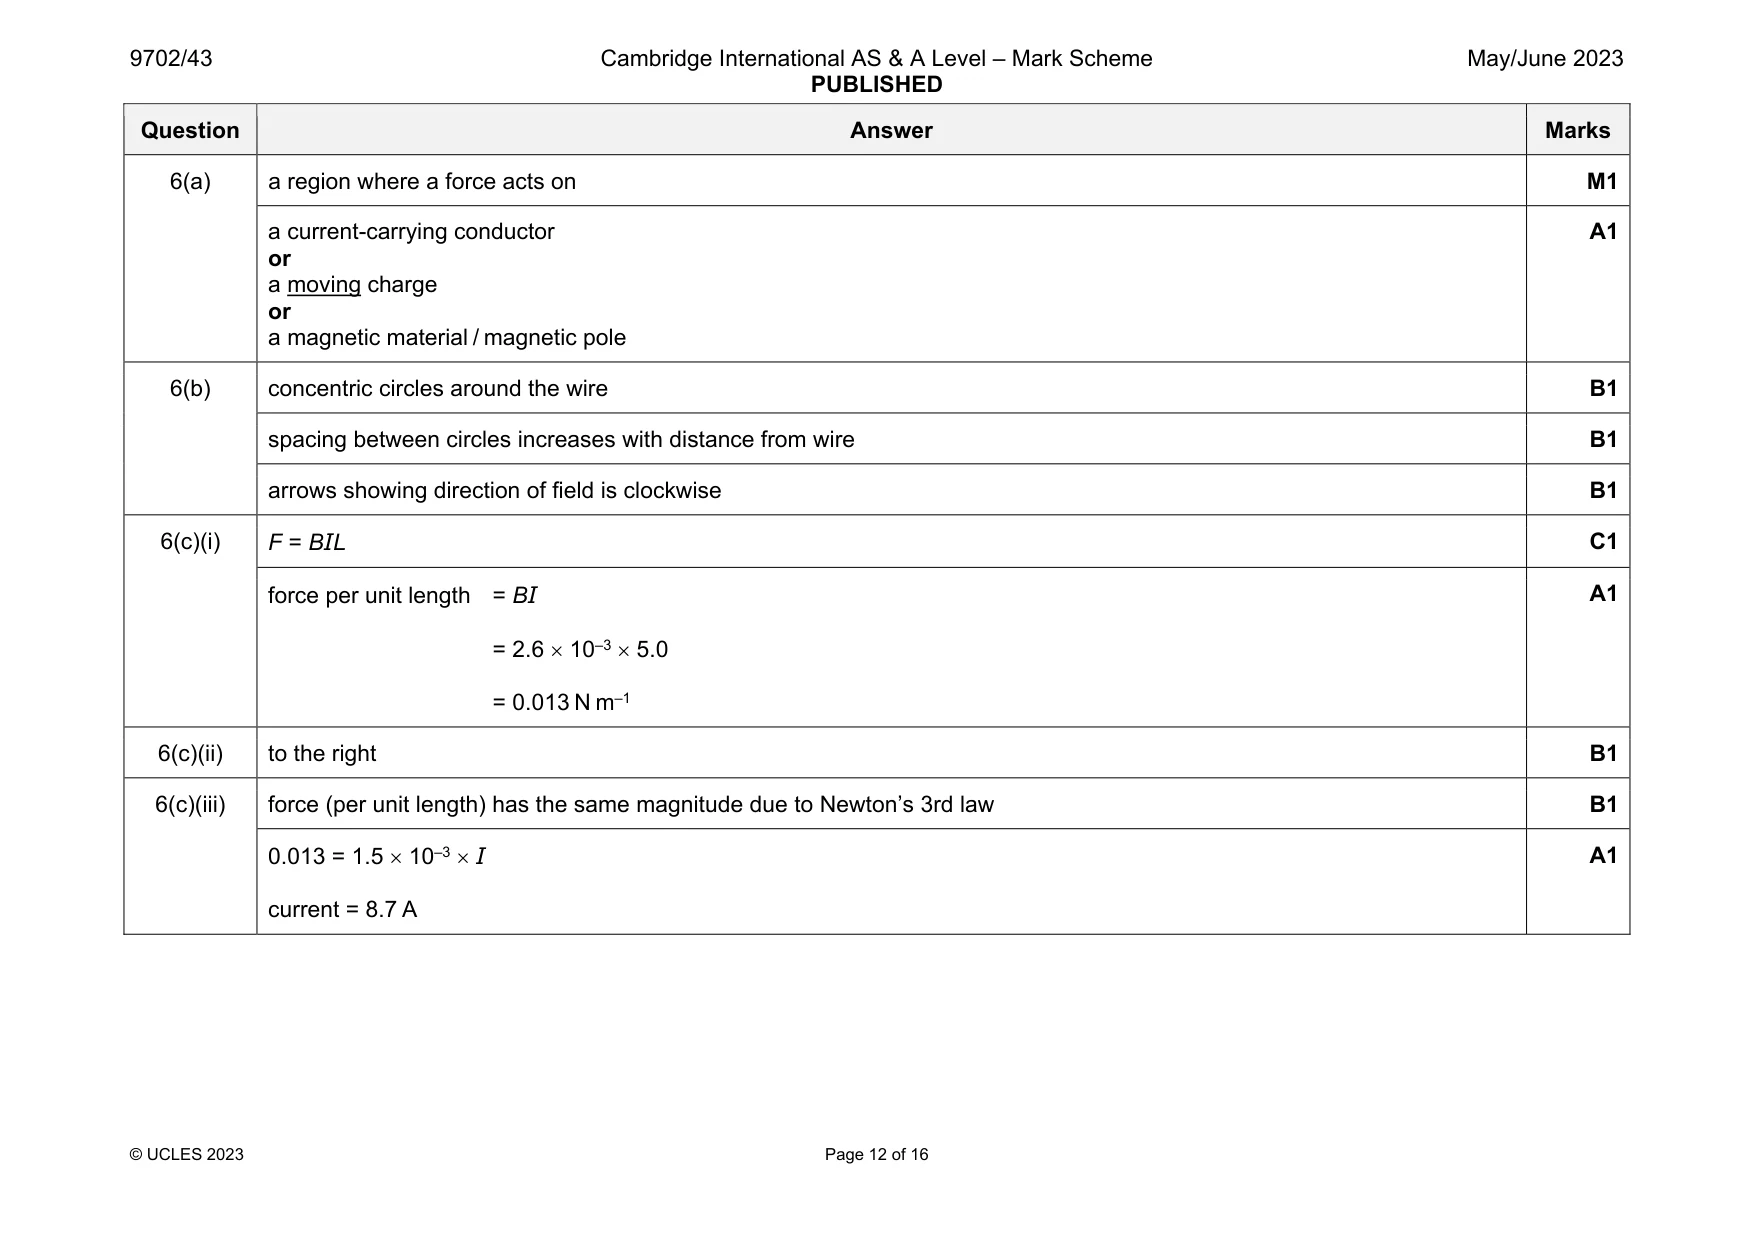
Mark scheme: 6(a) a region where a force acts on M1 a current-carrying conductor or a moving charge or a magnetic material / magnetic pole A1 6(b) concentric circles around the wire B1 spacing between circles increases with distance from wire B1 arrows showing direction of field is clockwise B1 6(c)(i) F = BIL C1 force per unit length = BI = 2.6 10–3 5.0 = 0.013 N m–1 A1 6(c)(ii) to the right B1 6(c)(iii) force (per unit length) has the same magnitude due to Newton’s 3rd law B1 0.013 = 1.5 10–3 I current = 8.7 A A1
Q7 · State what is meant by the de Broglie wavelength
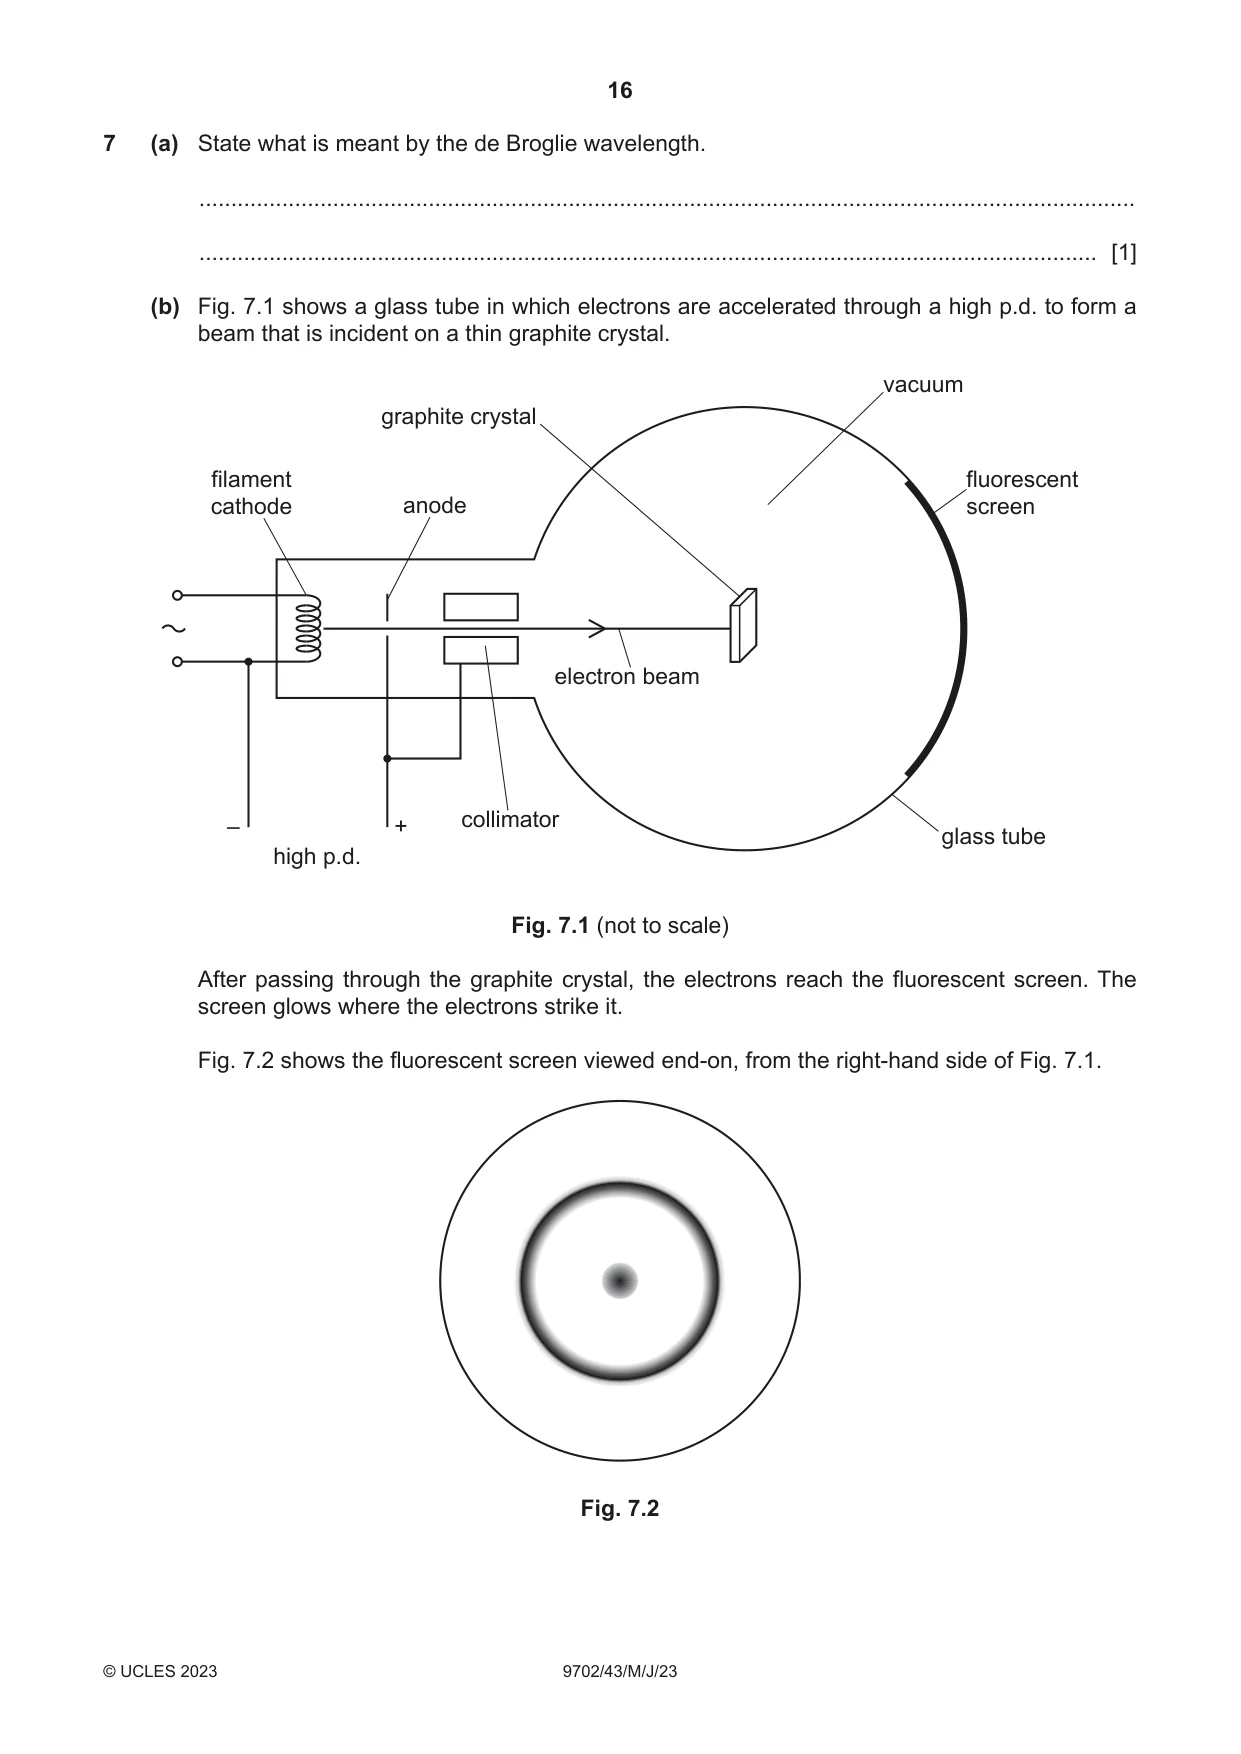
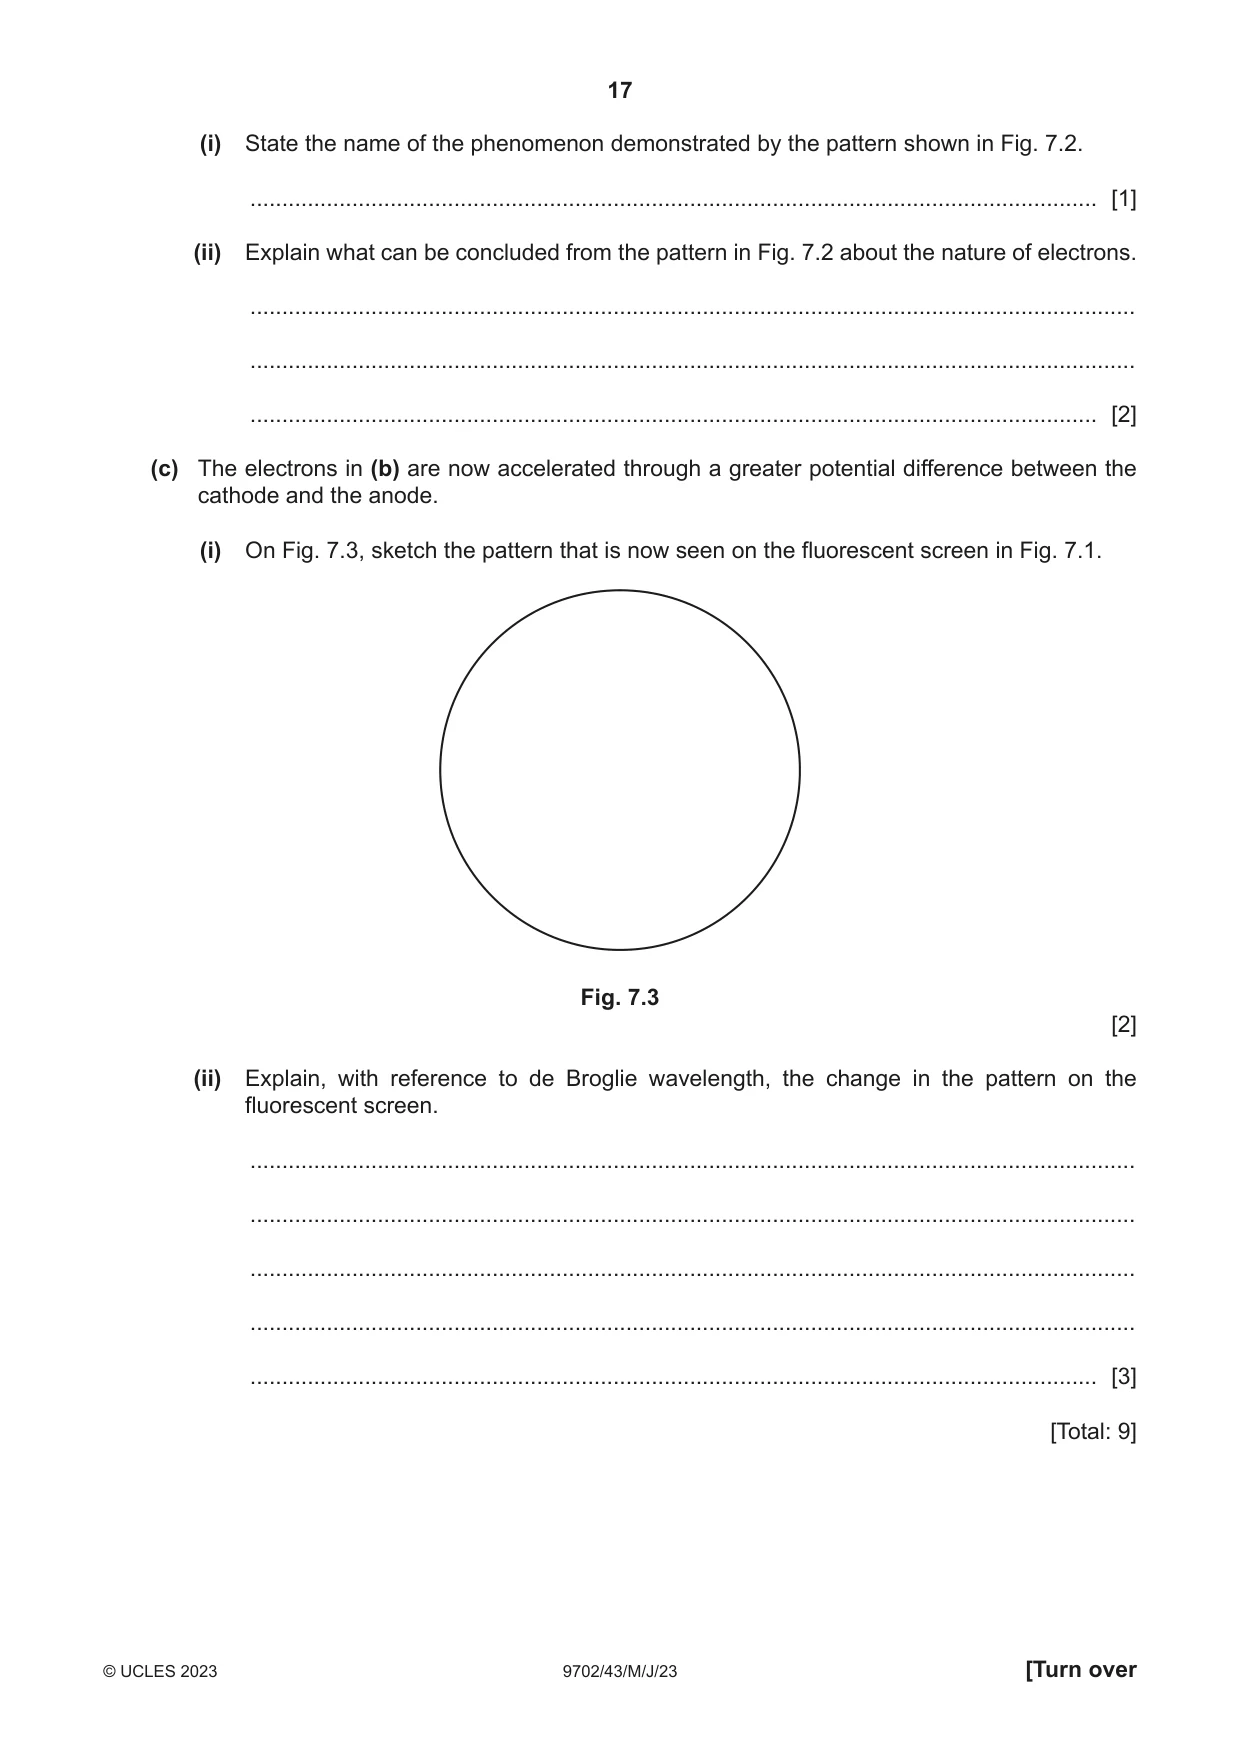
7 (a) State what is meant by the de Broglie wavelength. ................................................................................................................................................... ............................................................................................................................................. [1] (b) Fig. 7.1 shows a glass tube in which electrons are accelerated through a high p.d. to form a beam that is incident on a thin graphite crystal. vacuum graphite crystal filament fluorescent cathode anode screen electron beam collimator – + glass tube high p.d. Fig. 7.1 (not to scale) After passing through the graphite crystal, the electrons reach the fluorescent screen. The screen glows where the electrons strike it. Fig. 7.2 shows the fluorescent screen viewed end-on, from the right-hand side of Fig. 7.1. Fig. 7.2 (i) State the name of the phenomenon demonstrated by the pattern shown in Fig. 7.2. ..................................................................................................................................... [1] (ii) Explain what can be concluded from the pattern in Fig. 7.2 about the nature of electrons. ........................................................................................................................................... ........................................................................................................................................... ..................................................................................................................................... [2] (c) The electrons in (b) are now accelerated through a greater potential difference between the cathode and the anode. (i) On Fig. 7.3, sketch the pattern that is now seen on the fluorescent screen in Fig. 7.1. Fig. 7.3 [2] (ii) Explain, with reference to de Broglie wavelength, the change in the pattern on the fluorescent screen. ........................................................................................................................................... ........................................................................................................................................... ........................................................................................................................................... ........................................................................................................................................... ..................................................................................................................................... [3] [Total: 9]
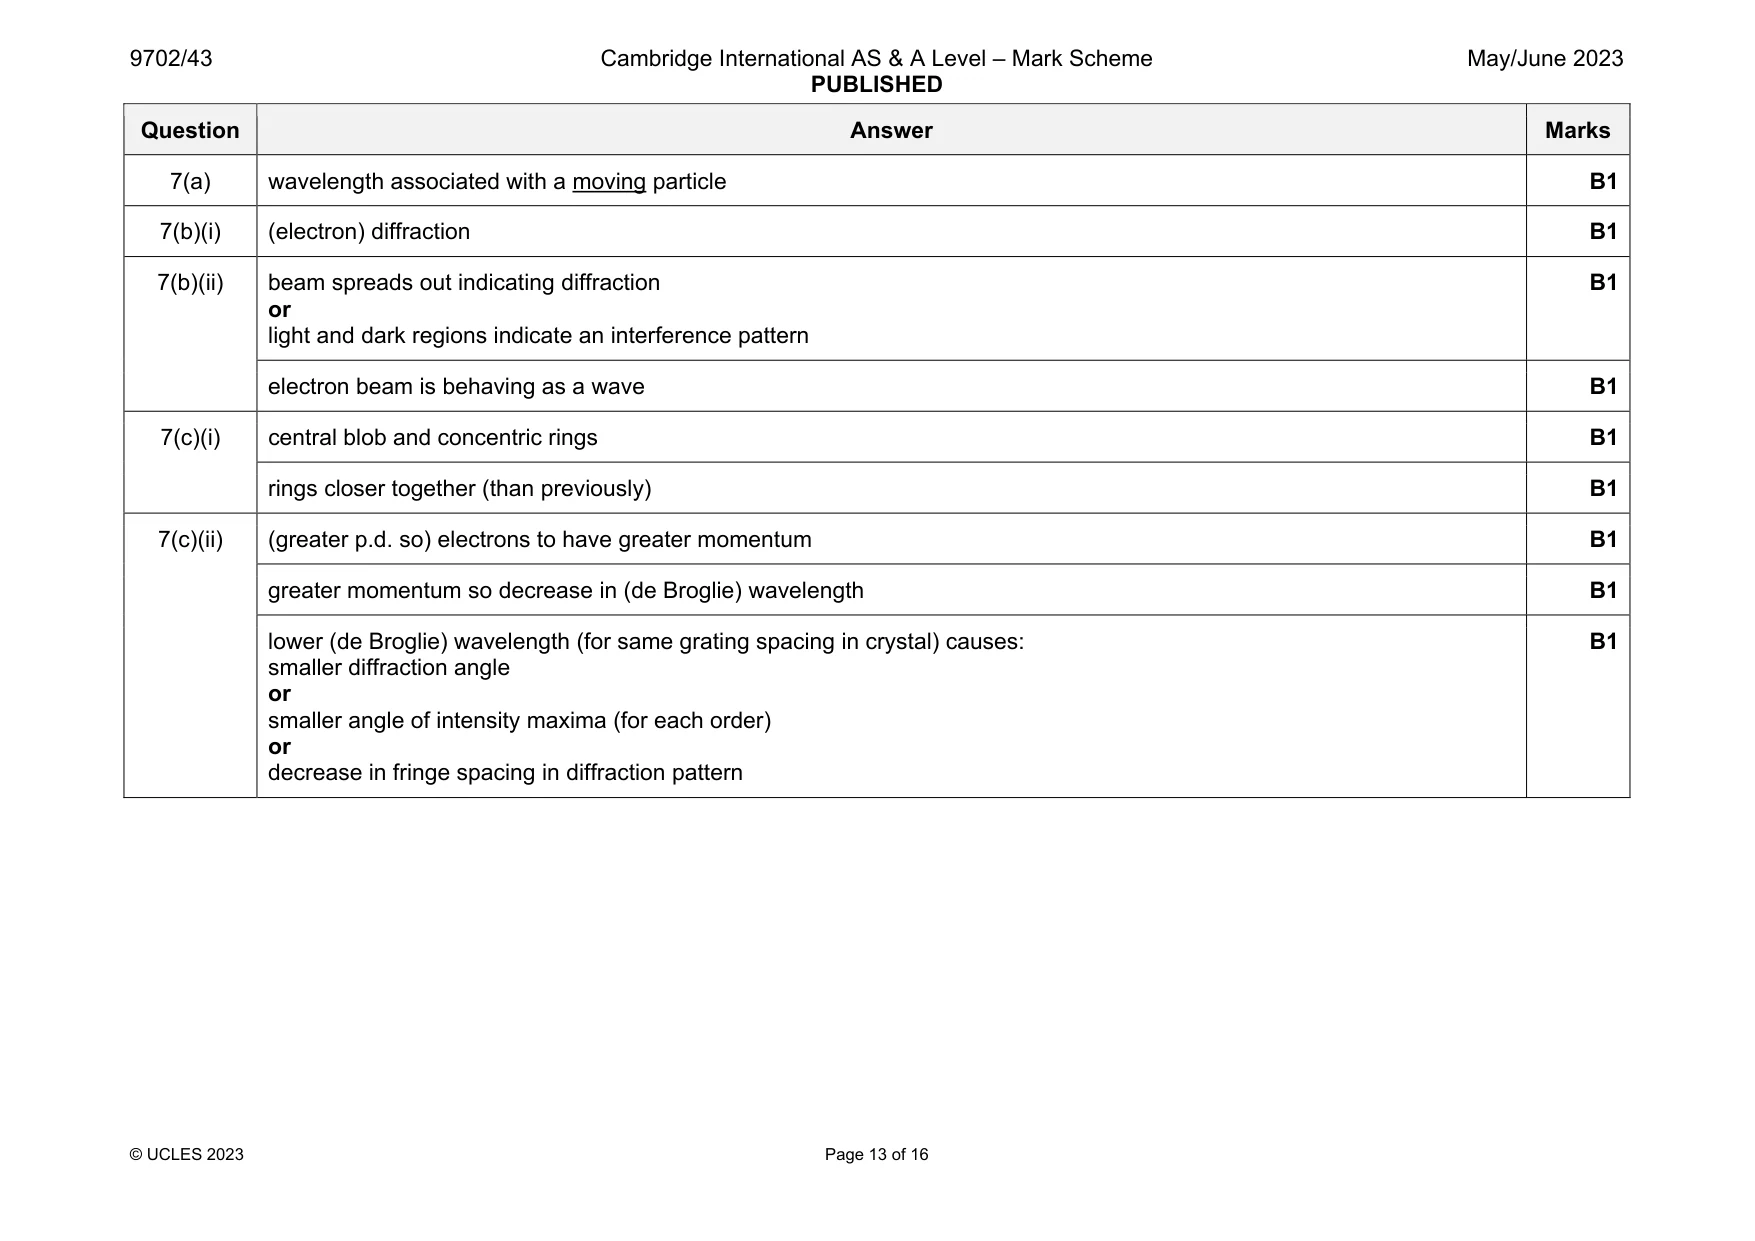
Mark scheme: 7(a) wavelength associated with a moving particle B1 7(b)(i) (electron) diffraction B1 7(b)(ii) beam spreads out indicating diffraction or light and dark regions indicate an interference pattern B1 electron beam is behaving as a wave B1 7(c)(i) central blob and concentric rings B1 rings closer together (than previously) B1 7(c)(ii) (greater p.d. so) electrons to have greater momentum B1 greater momentum so decrease in (de Broglie) wavelength B1 lower (de Broglie) wavelength (for same grating spacing in crystal) causes: smaller diffraction angle or smaller angle of intensity maxima (for each order) or decrease in fringe spacing in diffraction pattern B1
Q8 · Some data relating to the properties of air, gel and body tissue
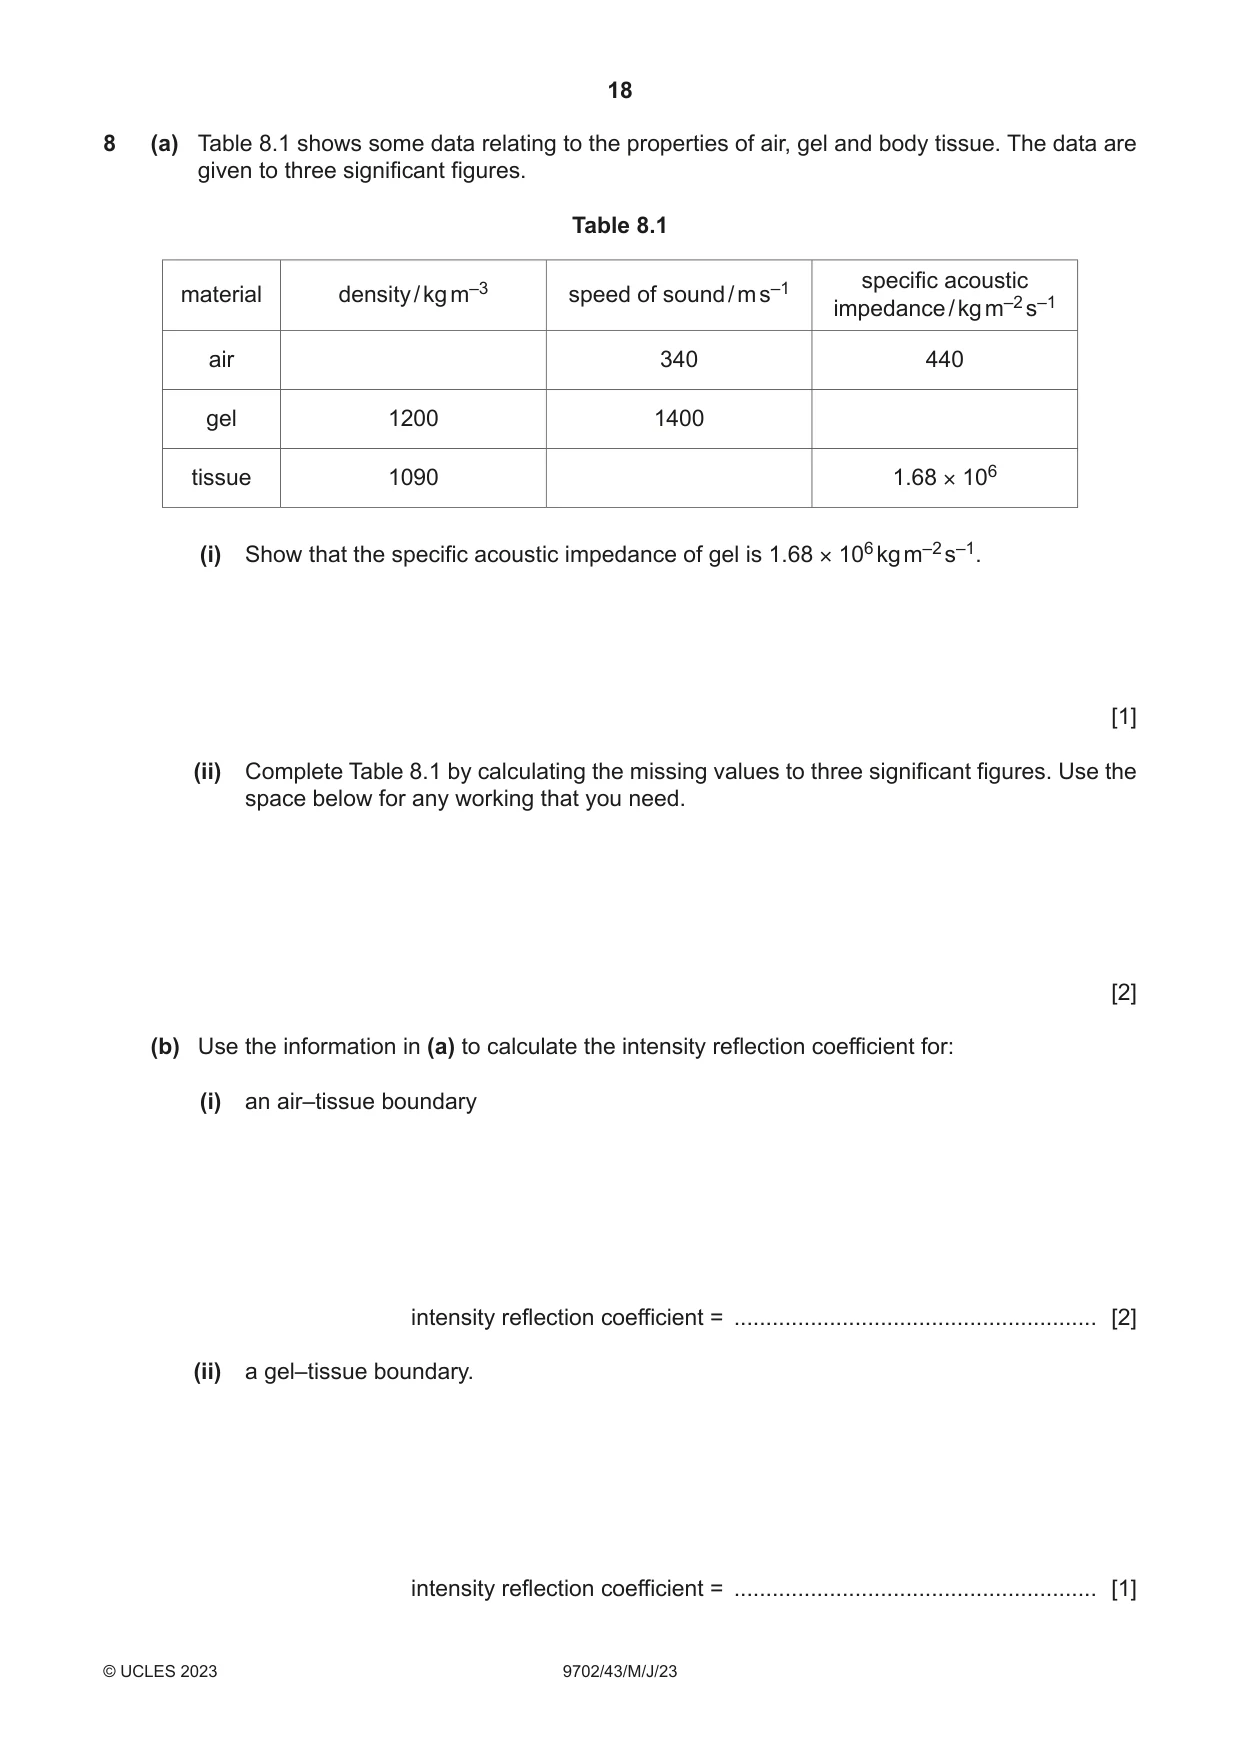
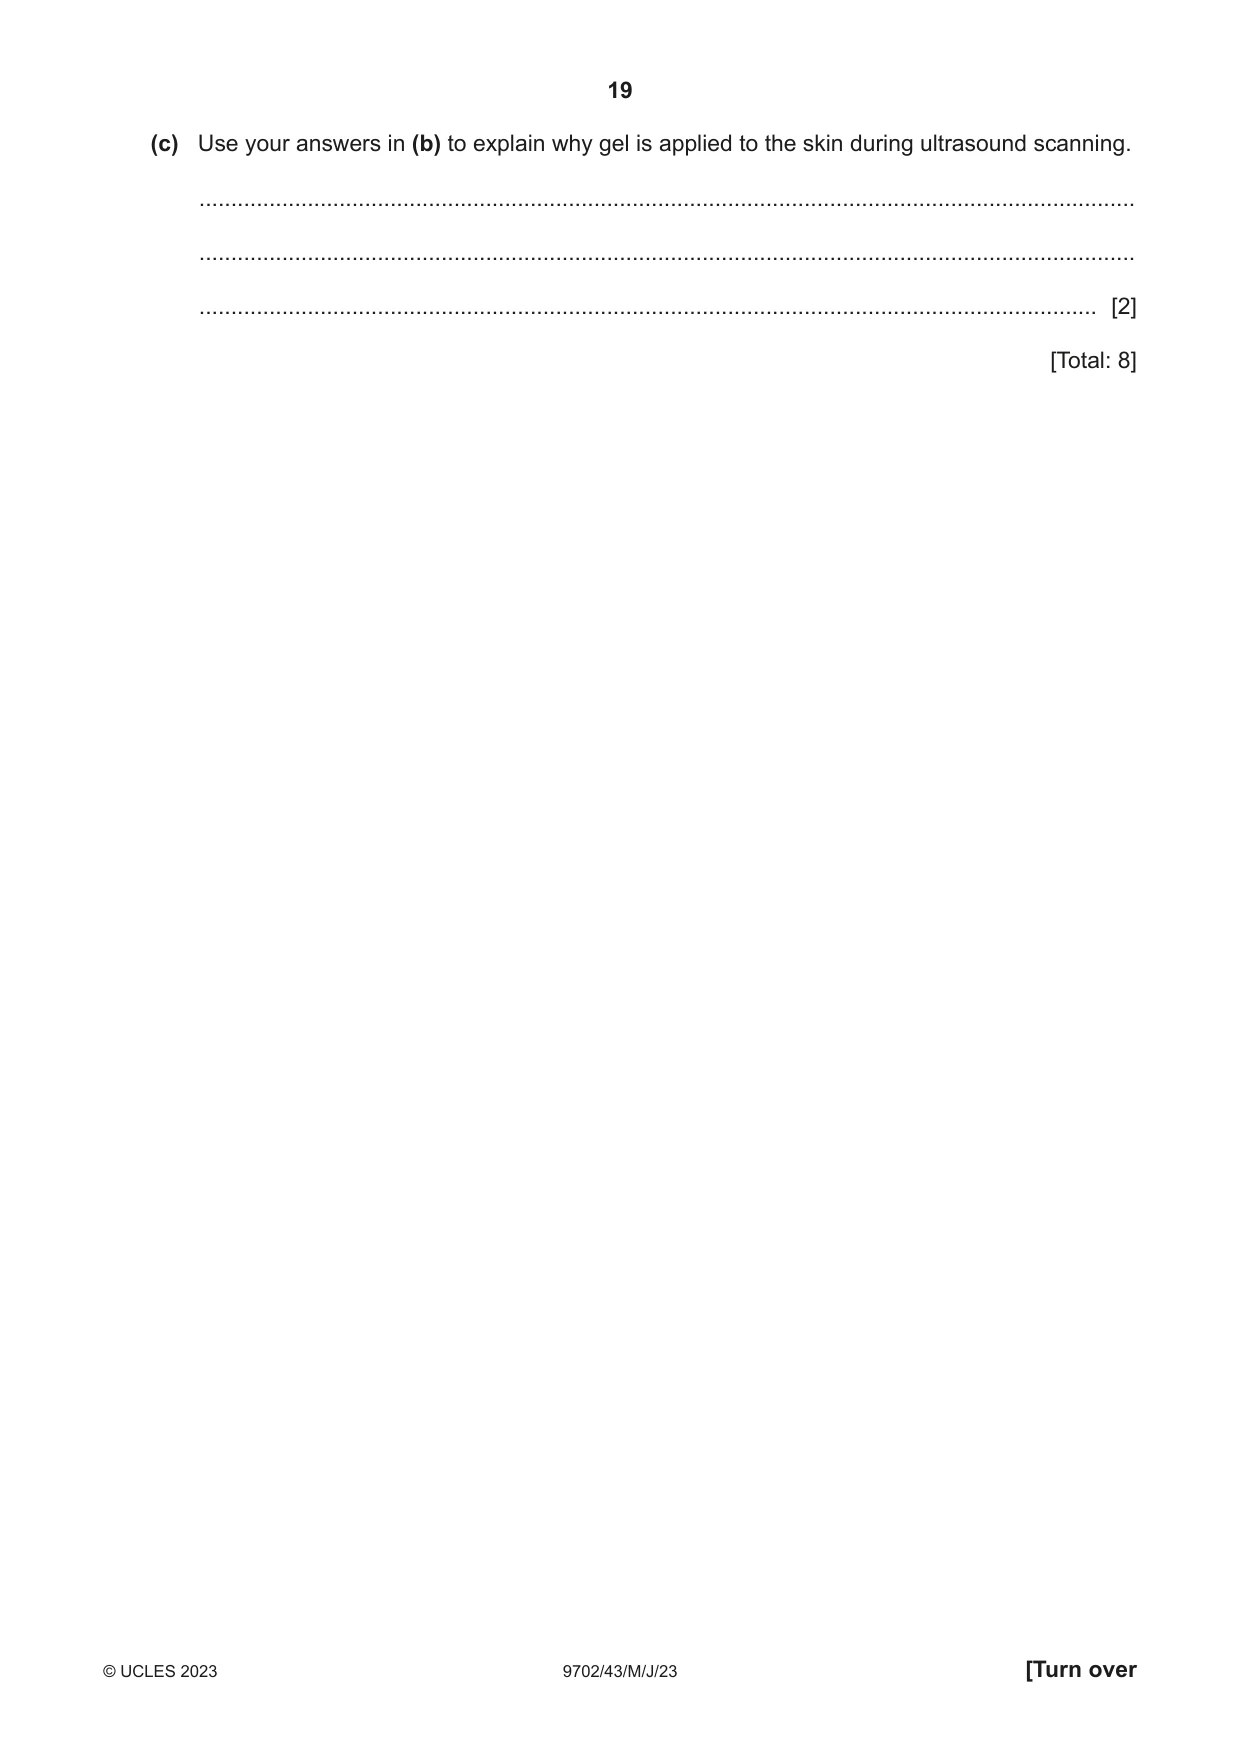
8 (a) Table 8.1 shows some data relating to the properties of air, gel and body tissue. The data are given to three significant figures. Table 8.1 specific acoustic material density / kg m–3 speed of sound / m s–1 impedance / kg m–2 s–1 air 340 440 gel 1200 1400 tissue 1090 1.68 × 10⁶ (i) Show that the specific acoustic impedance of gel is 1.68 × 10⁶ kg m–2 s–1. [1] (ii) Complete Table 8.1 by calculating the missing values to three significant figures. Use the space below for any working that you need. [2] (b) Use the information in (a) to calculate the intensity reflection coefficient for: (i) an air–tissue boundary intensity reflection coefficient = ......................................................... [2] (ii) a gel–tissue boundary. intensity reflection coefficient = ......................................................... [1] (c) Use your answers in (b) to explain why gel is applied to the skin during ultrasound scanning. ................................................................................................................................................... ................................................................................................................................................... ............................................................................................................................................. [2] [Total: 8]
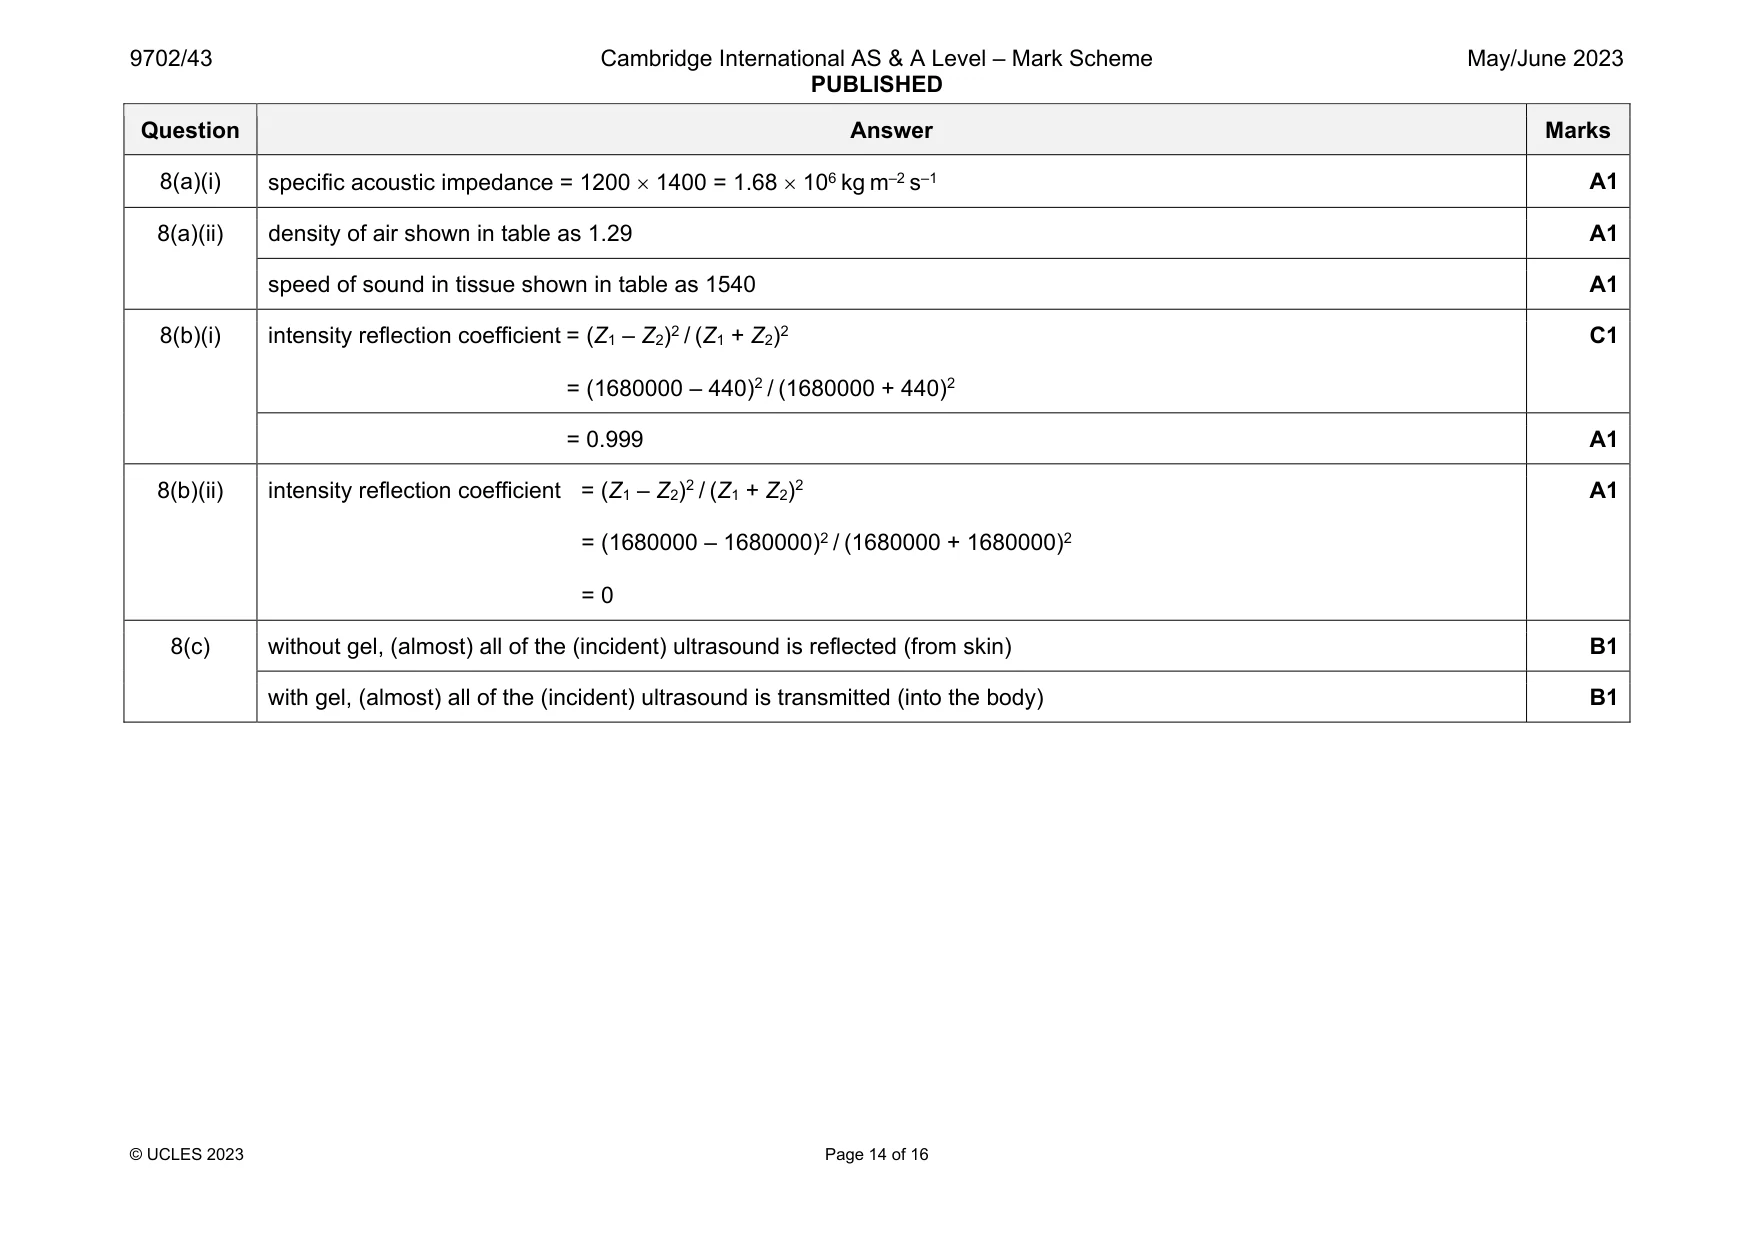
Mark scheme: 8(a)(i) A1 8(a)(ii) density of air shown in table as 1.29 A1 speed of sound in tissue shown in table as 1540 A1 8(b)(i) intensity reflection coefficient = (Z1 – Z2)2 / (Z1 + Z2)2 = (1680000 – 440)2 / (1680000 + 440)2 C1 = 0.999 A1 8(b)(ii) intensity reflection coefficient = (Z1 – Z2)2 / (Z1 + Z2)2 = (1680000 – 1680000)2 / (1680000 + 1680000)2 = 0 A1 8(c) without gel, (almost) all of the (incident) ultrasound is reflected (from skin) B1 with gel, (almost) all of the (incident) ultrasound is transmitted (into the body) B1
Q9 · Carbon-11 is radioactive and decays by β+ emission to form boron-11
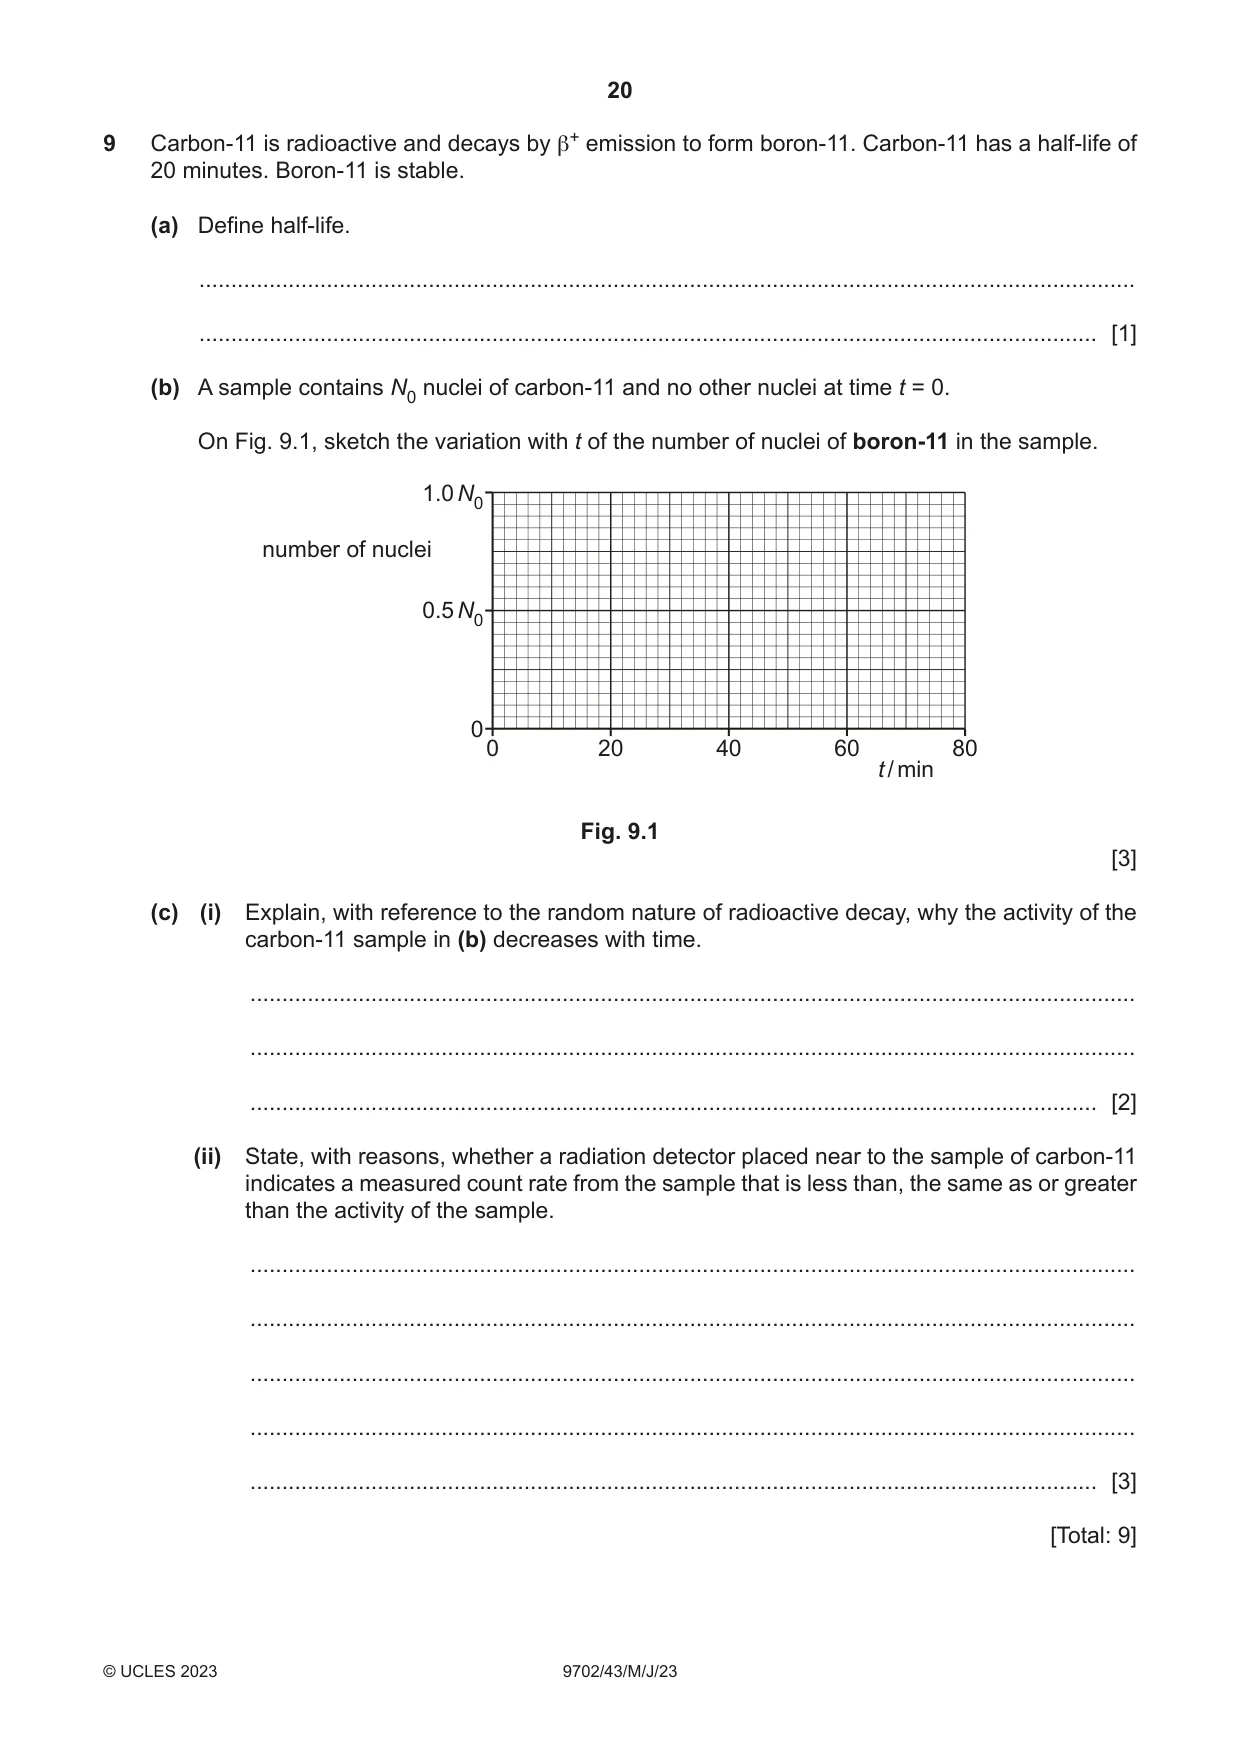
9 Carbon-11 is radioactive and decays by β+ emission to form boron-11. Carbon-11 has a half-life of 20 minutes. Boron-11 is stable. (a) Define half-life. ................................................................................................................................................... ............................................................................................................................................. [1] (b) A sample contains N0 nuclei of carbon-11 and no other nuclei at time t = 0. On Fig. 9.1, sketch the variation with t of the number of nuclei of boron-11 in the sample. 1.0 N0 number of nuclei 0.5 N0 0 0 20 40 60 80 t / min Fig. 9.1 [3] (c) (i) Explain, with reference to the random nature of radioactive decay, why the activity of the carbon-11 sample in (b) decreases with time. ........................................................................................................................................... ........................................................................................................................................... ..................................................................................................................................... [2] (ii) State, with reasons, whether a radiation detector placed near to the sample of carbon-11 indicates a measured count rate from the sample that is less than, the same as or greater than the activity of the sample. ........................................................................................................................................... ........................................................................................................................................... ........................................................................................................................................... ........................................................................................................................................... ..................................................................................................................................... [3] [Total: 9]
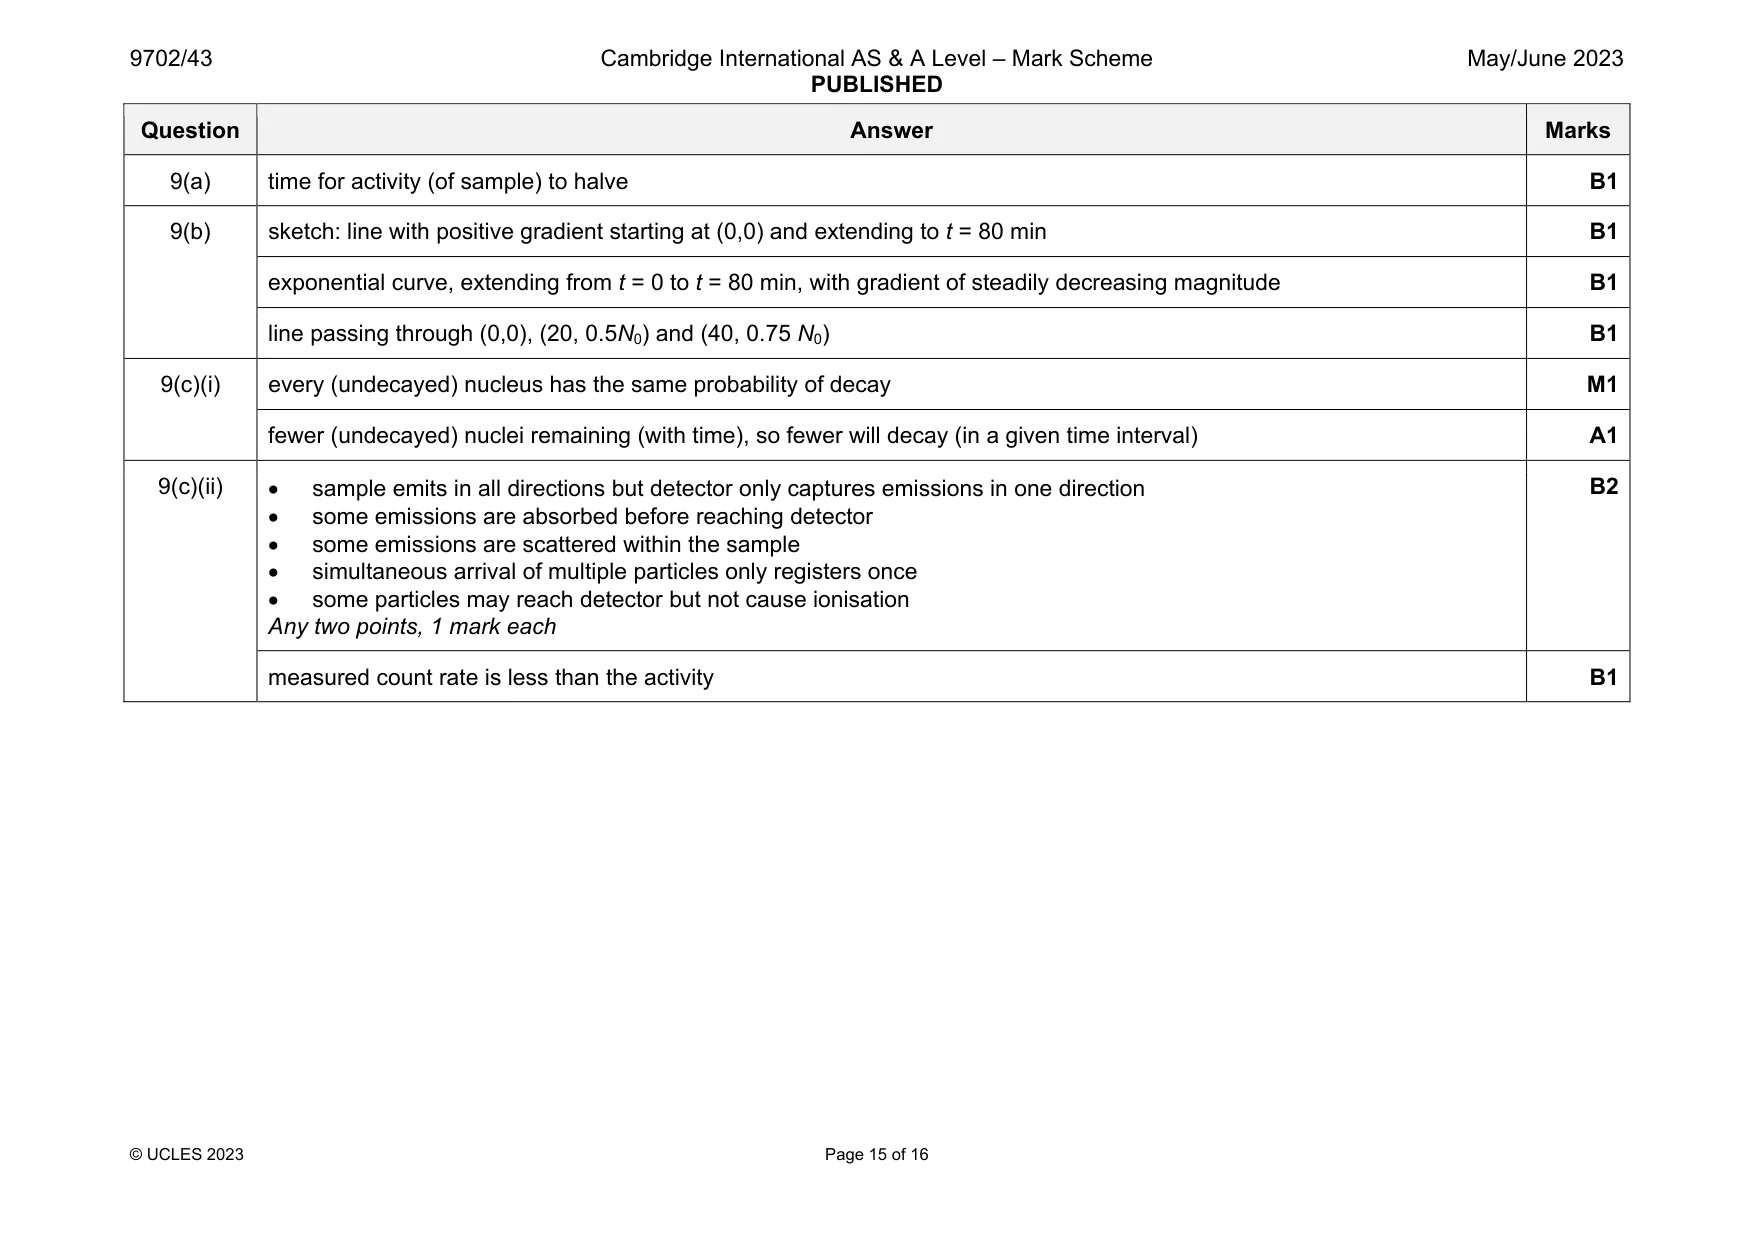
Mark scheme: 9(a) time for activity (of sample) to halve B1 9(b) sketch: line with positive gradient starting at (0,0) and extending to t = 80 min B1 exponential curve, extending from t = 0 to t = 80 min, with gradient of steadily decreasing magnitude B1 line passing through (0,0), (20, 0.5N0) and (40, 0.75 N0) B1 9(c)(i) every (undecayed) nucleus has the same probability of decay M1 fewer (undecayed) nuclei remaining (with time), so fewer will decay (in a given time interval) A1 9(c)(ii) sample emits in all directions but detector only captures emissions in one direction some emissions are absorbed before reaching detector some emissions are scattered within the sample simultaneous arrival of multiple particles only registers once some particles may reach detector but not cause ionisation Any two points, 1 mark each B2 measured count rate is less than the activity B1
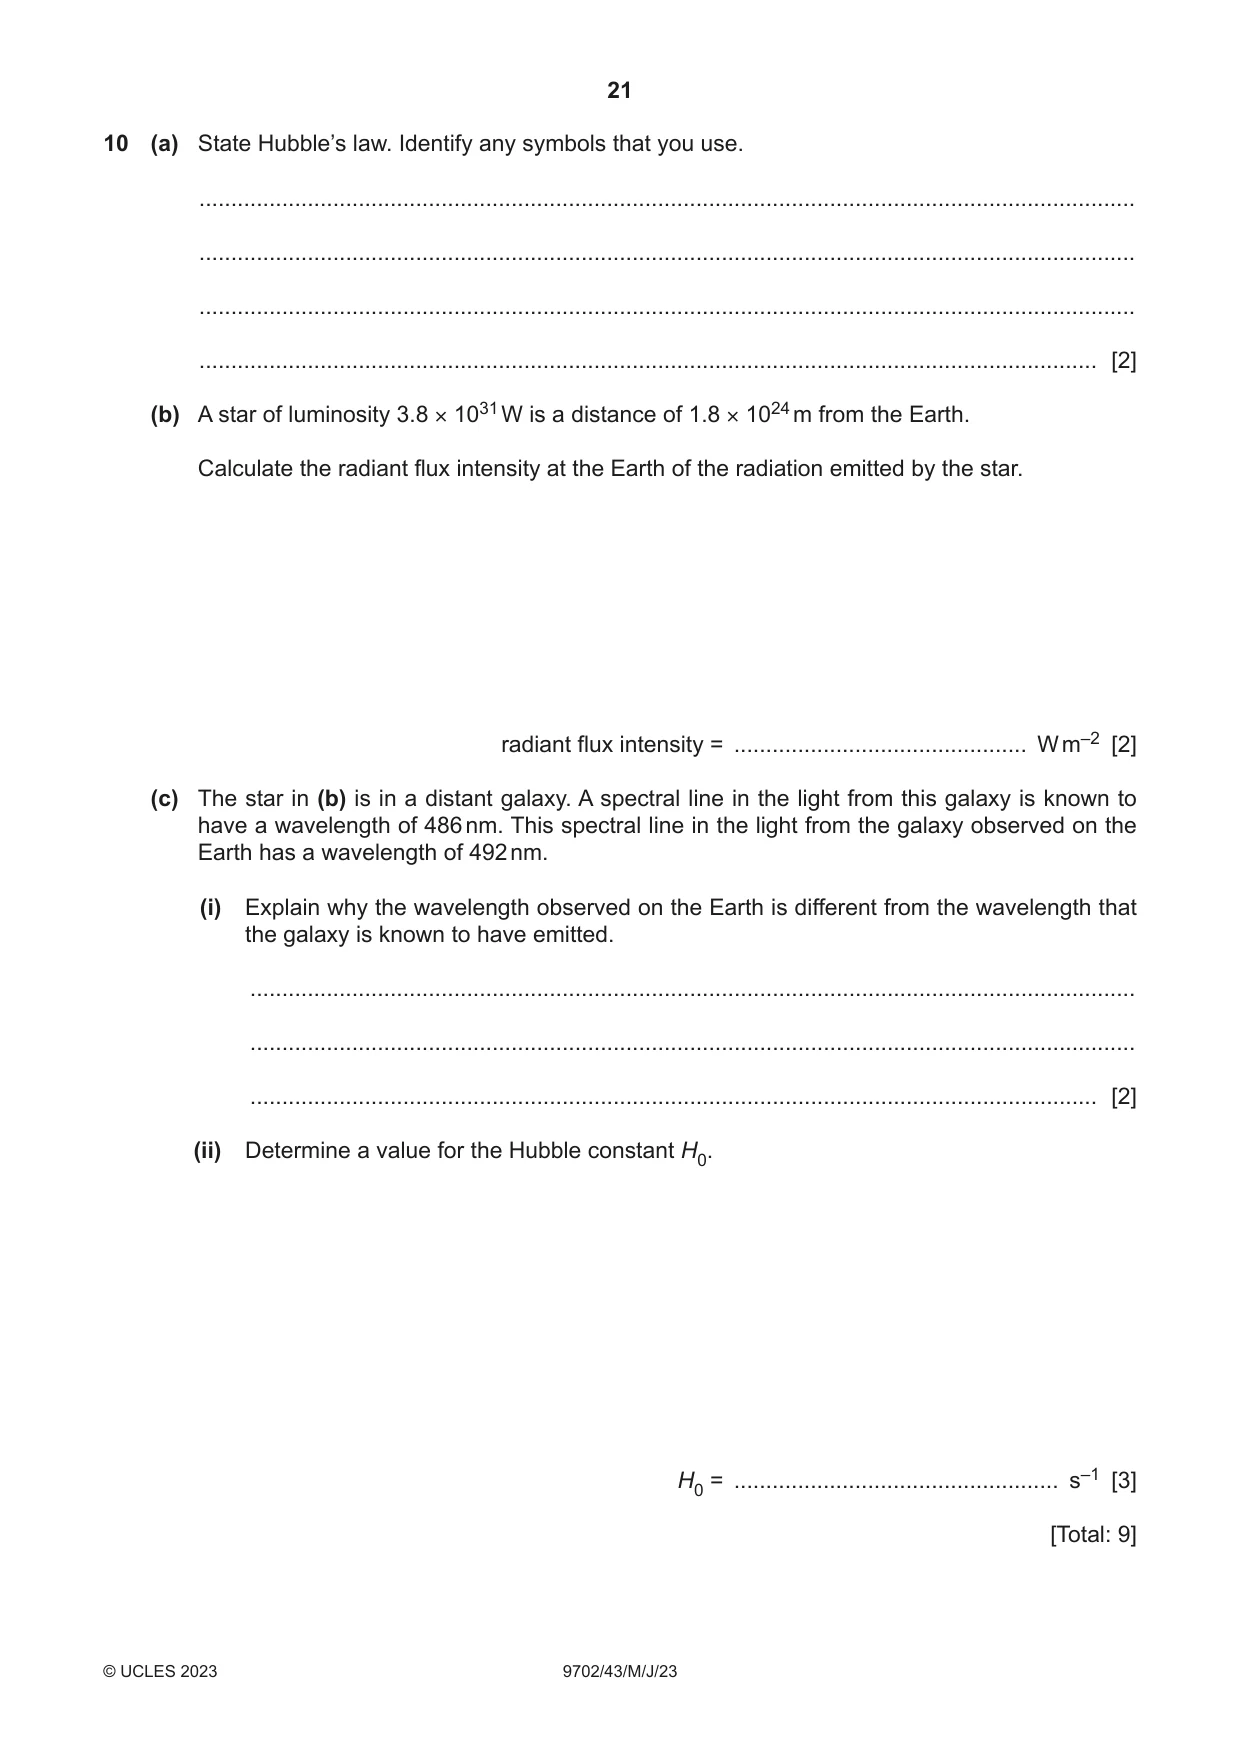
Question 10
10 (a) State Hubble’s law. Identify any symbols that you use. ................................................................................................................................................... ................................................................................................................................................... ................................................................................................................................................... ............................................................................................................................................. [2] (b) A star of luminosity 3.8 × 1031 W is a distance of 1.8 × 1024 m from the Earth. Calculate the radiant flux intensity at the Earth of the radiation emitted by the star. radiant flux intensity = .............................................. W m–2 [2] (c) The star in (b) is in a distant galaxy. A spectral line in the light from this galaxy is known to have a wavelength of 486 nm. This spectral line in the light from the galaxy observed on the Earth has a wavelength of 492 nm. (i) Explain why the wavelength observed on the Earth is different from the wavelength that the galaxy is known to have emitted. ........................................................................................................................................... ........................................................................................................................................... ..................................................................................................................................... [2] (ii) Determine a value for the Hubble constant H0. H0 = ................................................... s–1 [3] [Total: 9]
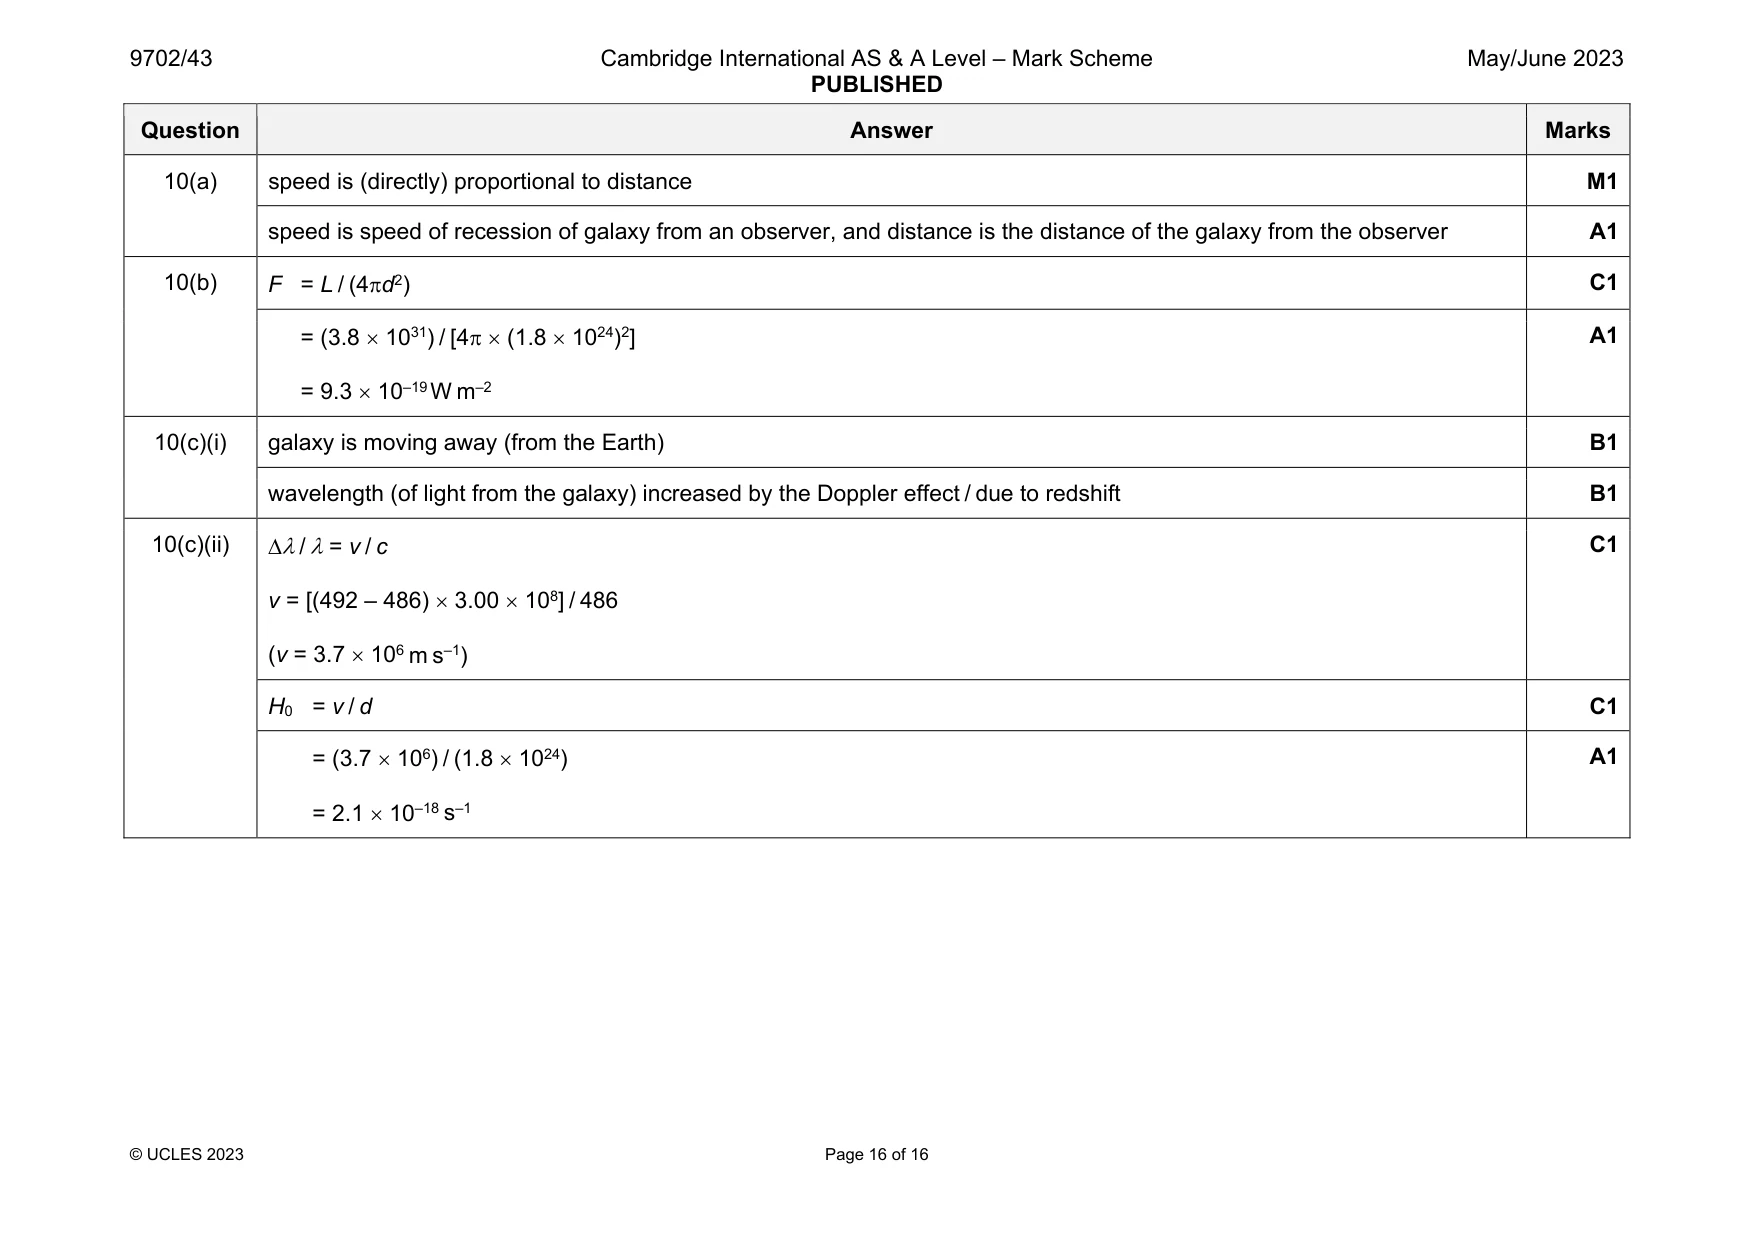
Mark scheme: 10(a) speed is (directly) proportional to distance M1 speed is speed of recession of galaxy from an observer, and distance is the distance of the galaxy from the observer A1 10(b) F = L / (4d2) C1 = (3.8 1031) / [4 (1.8 1024)2] = 9.3 10–19 W m–2 A1 10(c)(i) galaxy is moving away (from the Earth) B1 wavelength (of light from the galaxy) increased by the Doppler effect / due to redshift B1 10(c)(ii) / = v / c v = [(492 – 486) 3.00 108] / 486 (v = 3.7 106 m s–1) C1 H0 = v / d C1 = (3.7 106) / (1.8 1024) = 2.1 10–18 s–1 A1
What was in this paper
The subtopics covered by these 10 questions, and how many questions each got. Open one in a new tab to see every Cambridge question on it.
What you needed in this session
Cambridge’s own grade thresholds for 2023 May/June, Paper 4 · Variant 3. A higher threshold means an easier paper — the bar moves with how the cohort did.