Cambridge A Level Physics 9702 — 2017 Oct/Nov Paper 4 · Variant 3
9702/43/O/N/17 · 12 questions · 100 marks · ≈113 min
The question paper and its mark scheme, free to read here and free to download. This is Cambridge’s own paper, exactly as it was sat.
Question paper24 pages

Mark scheme13 pages
Answers below. Sit the paper first if you are practising.
Questions as text
Q1 · State (i) what may be deduced from the difference in the temperatures of two objects…
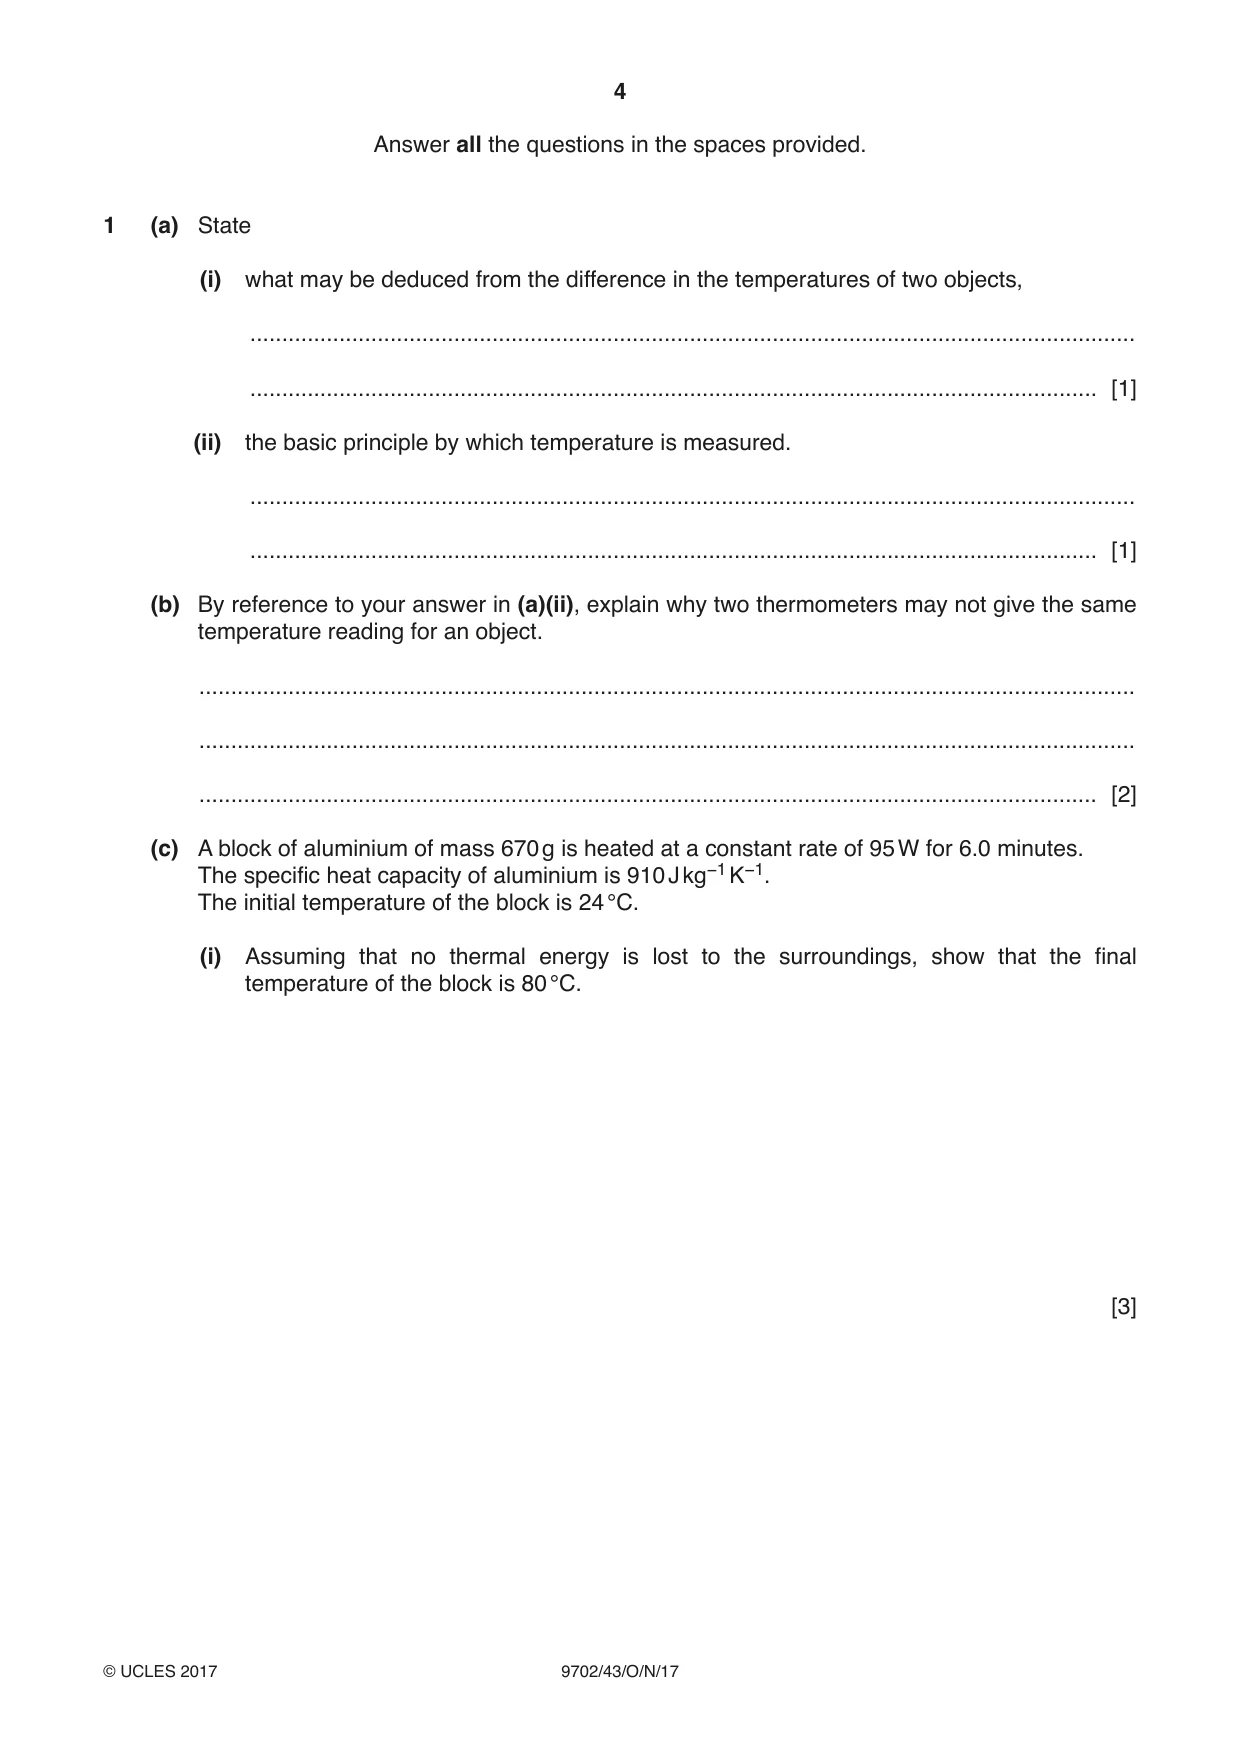
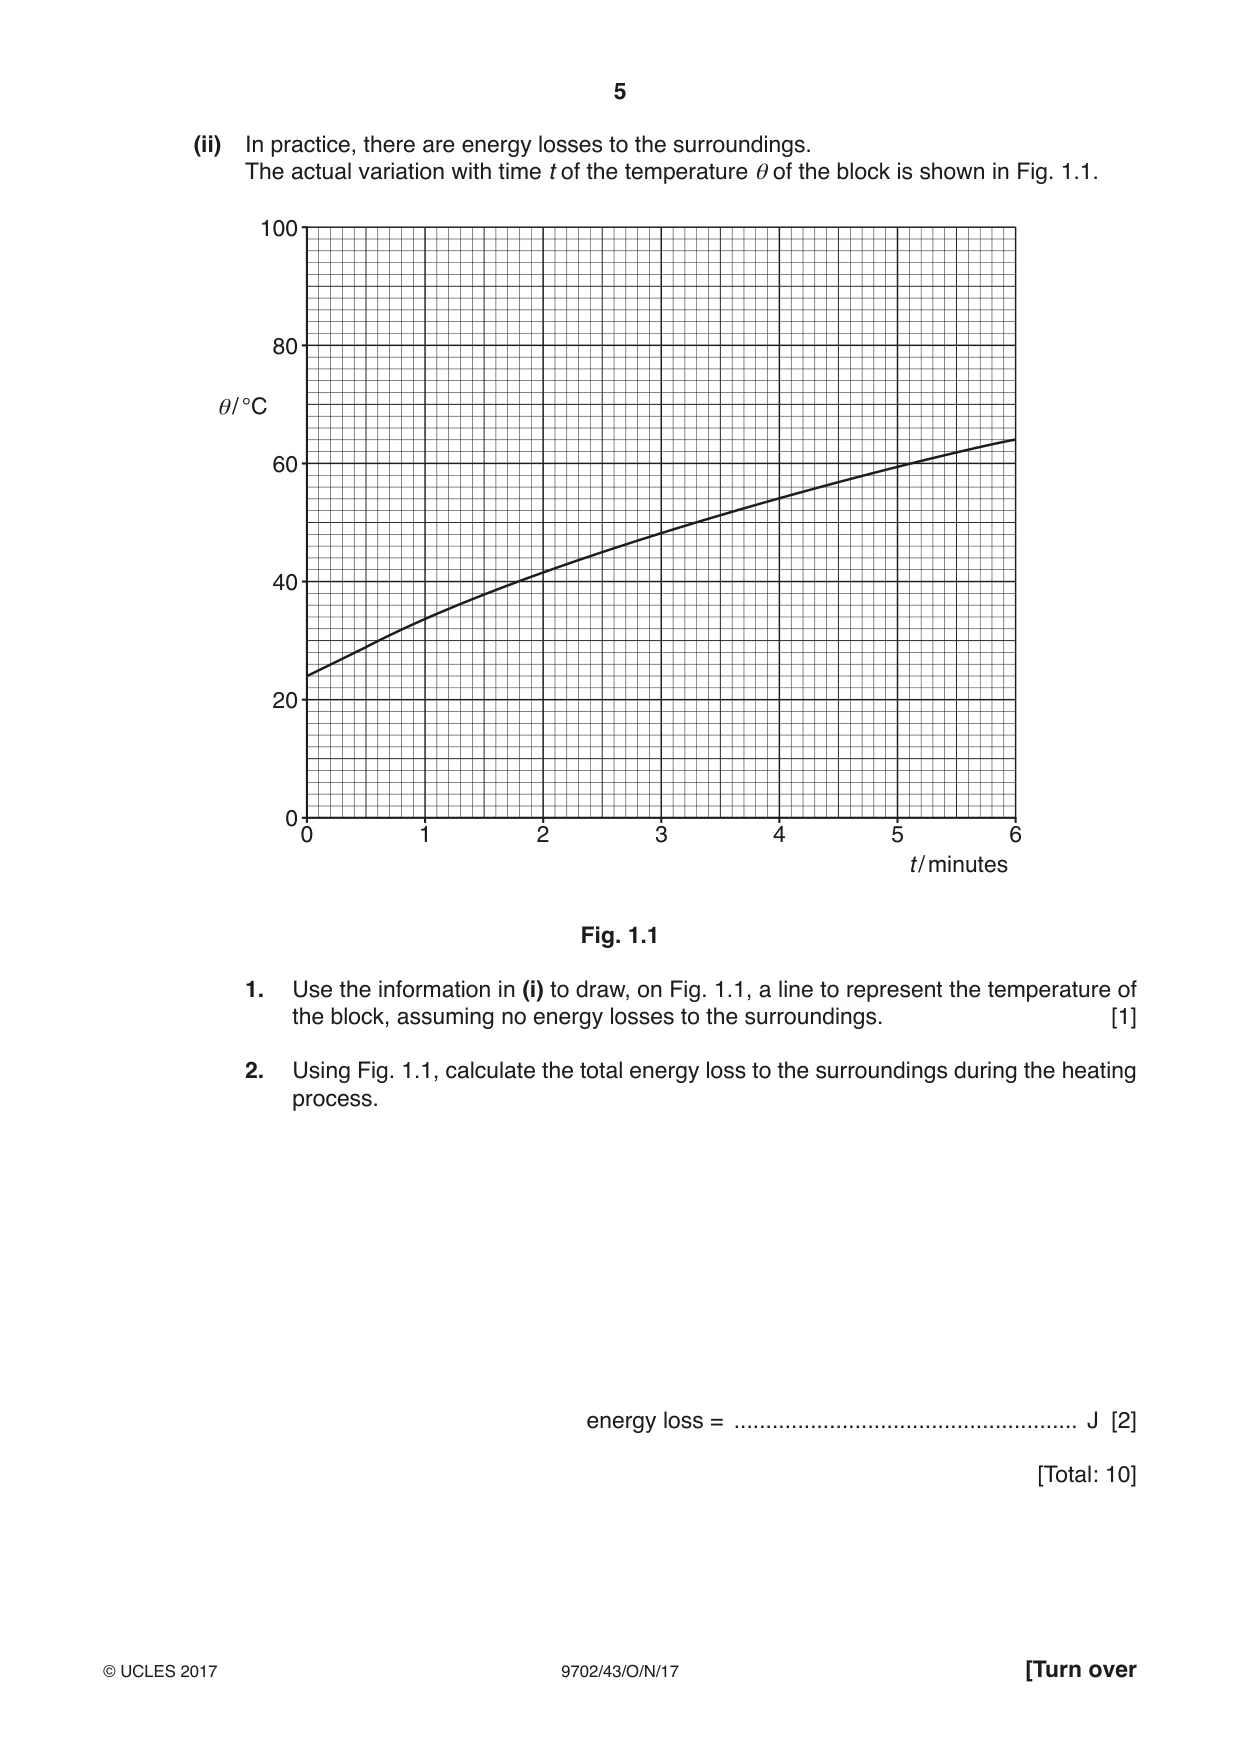
1 (a) State (i) what may be deduced from the difference in the temperatures of two objects, ........................................................................................................................................... ..................................................................................................................................... [1] (ii) the basic principle by which temperature is measured. ........................................................................................................................................... ..................................................................................................................................... [1] (b) By reference to your answer in (a)(ii), explain why two thermometers may not give the same temperature reading for an object. ................................................................................................................................................... ................................................................................................................................................... ............................................................................................................................................. [2] (c) A block of aluminium of mass 670 g is heated at a constant rate of 95 W for 6.0 minutes. The specific heat capacity of aluminium is 910 J kg−1 K−1. The initial temperature of the block is 24 °C. (i) Assuming that no thermal energy is lost to the surroundings, show that the final temperature of the block is 80 °C. [3] (ii) In practice, there are energy losses to the surroundings. The actual variation with time t of the temperature θ of the block is shown in Fig. 1.1. 100 80 θ/ °C 60 40 20 0 0 1 2 3 4 5 6 t / minutes Fig. 1.1 1. Use the information in (i) to draw, on Fig. 1.1, a line to represent the temperature of the block, assuming no energy losses to the surroundings. [1] 2. Using Fig. 1.1, calculate the total energy loss to the surroundings during the heating process. energy loss = ...................................................... J [2] [Total: 10]
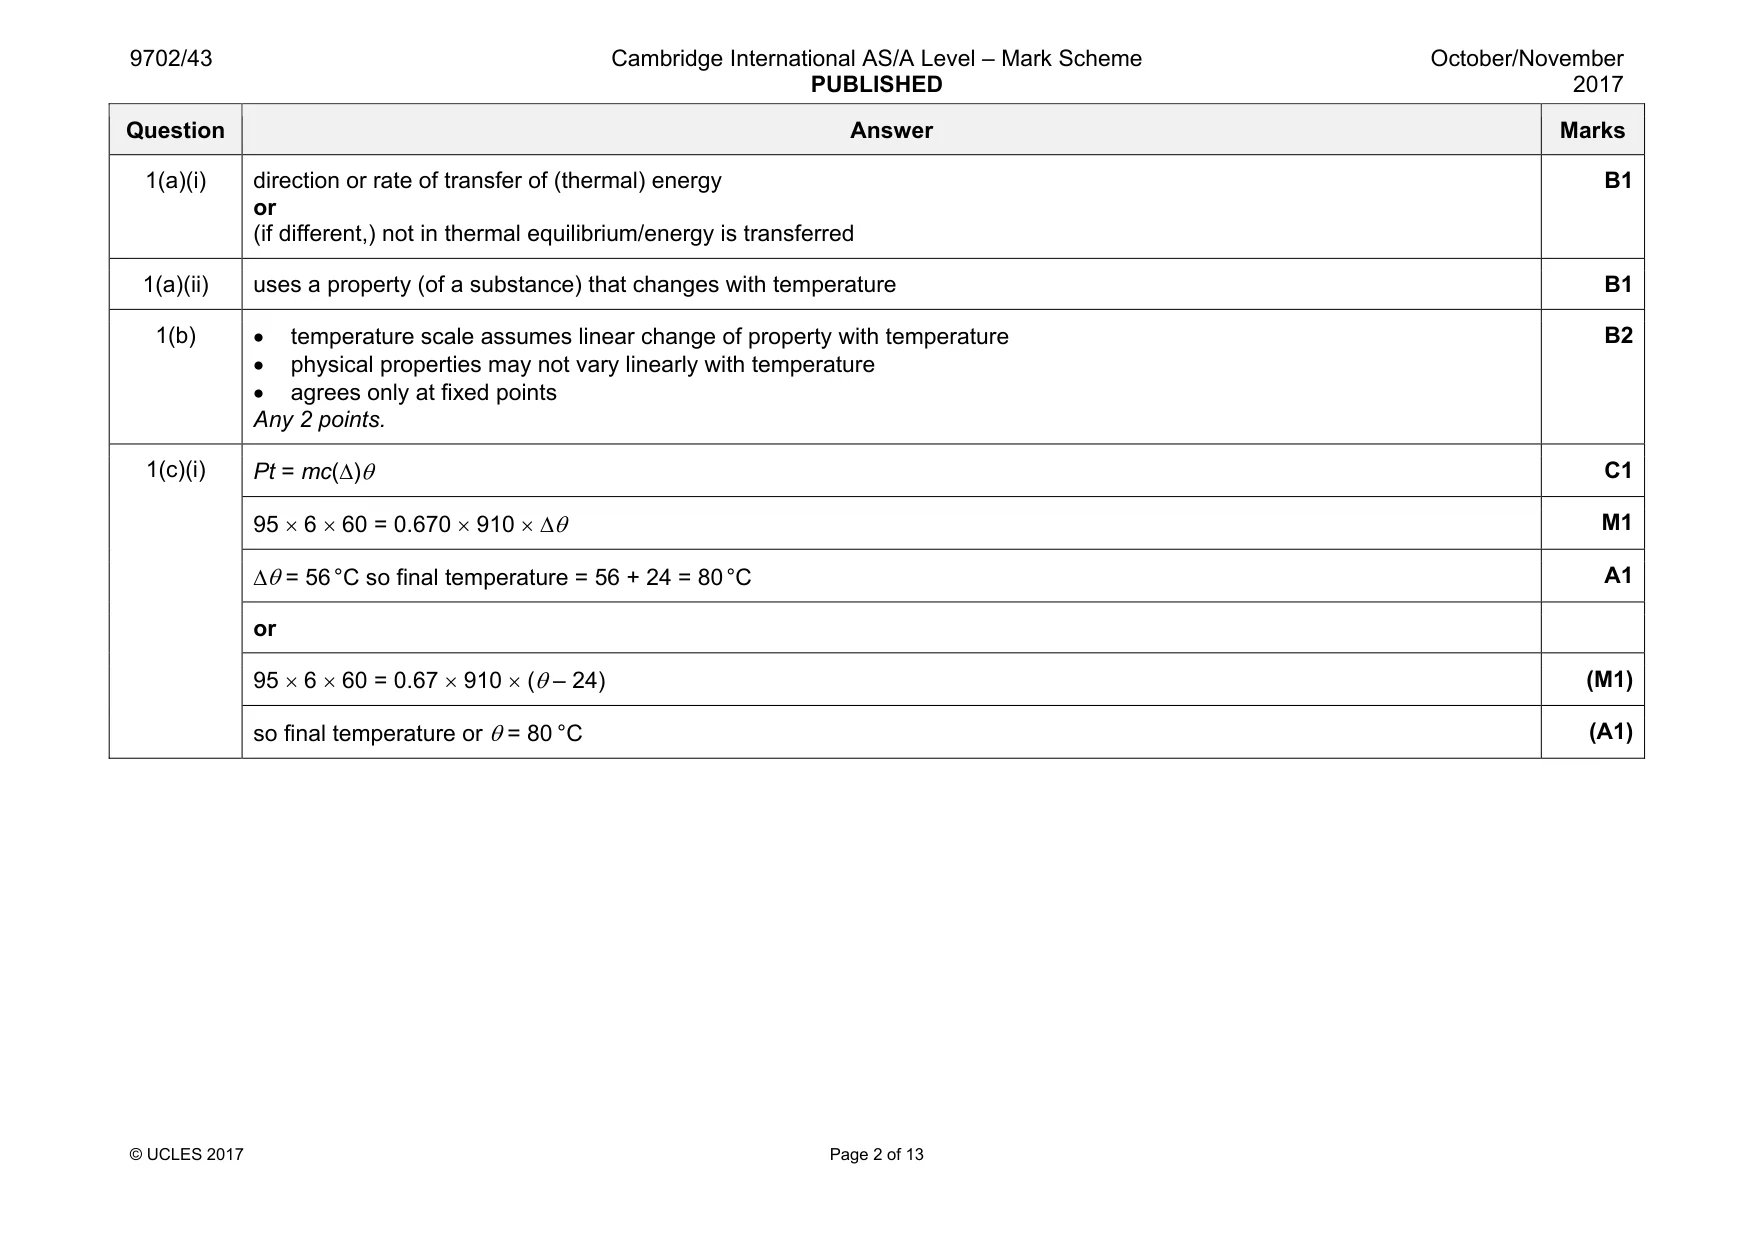
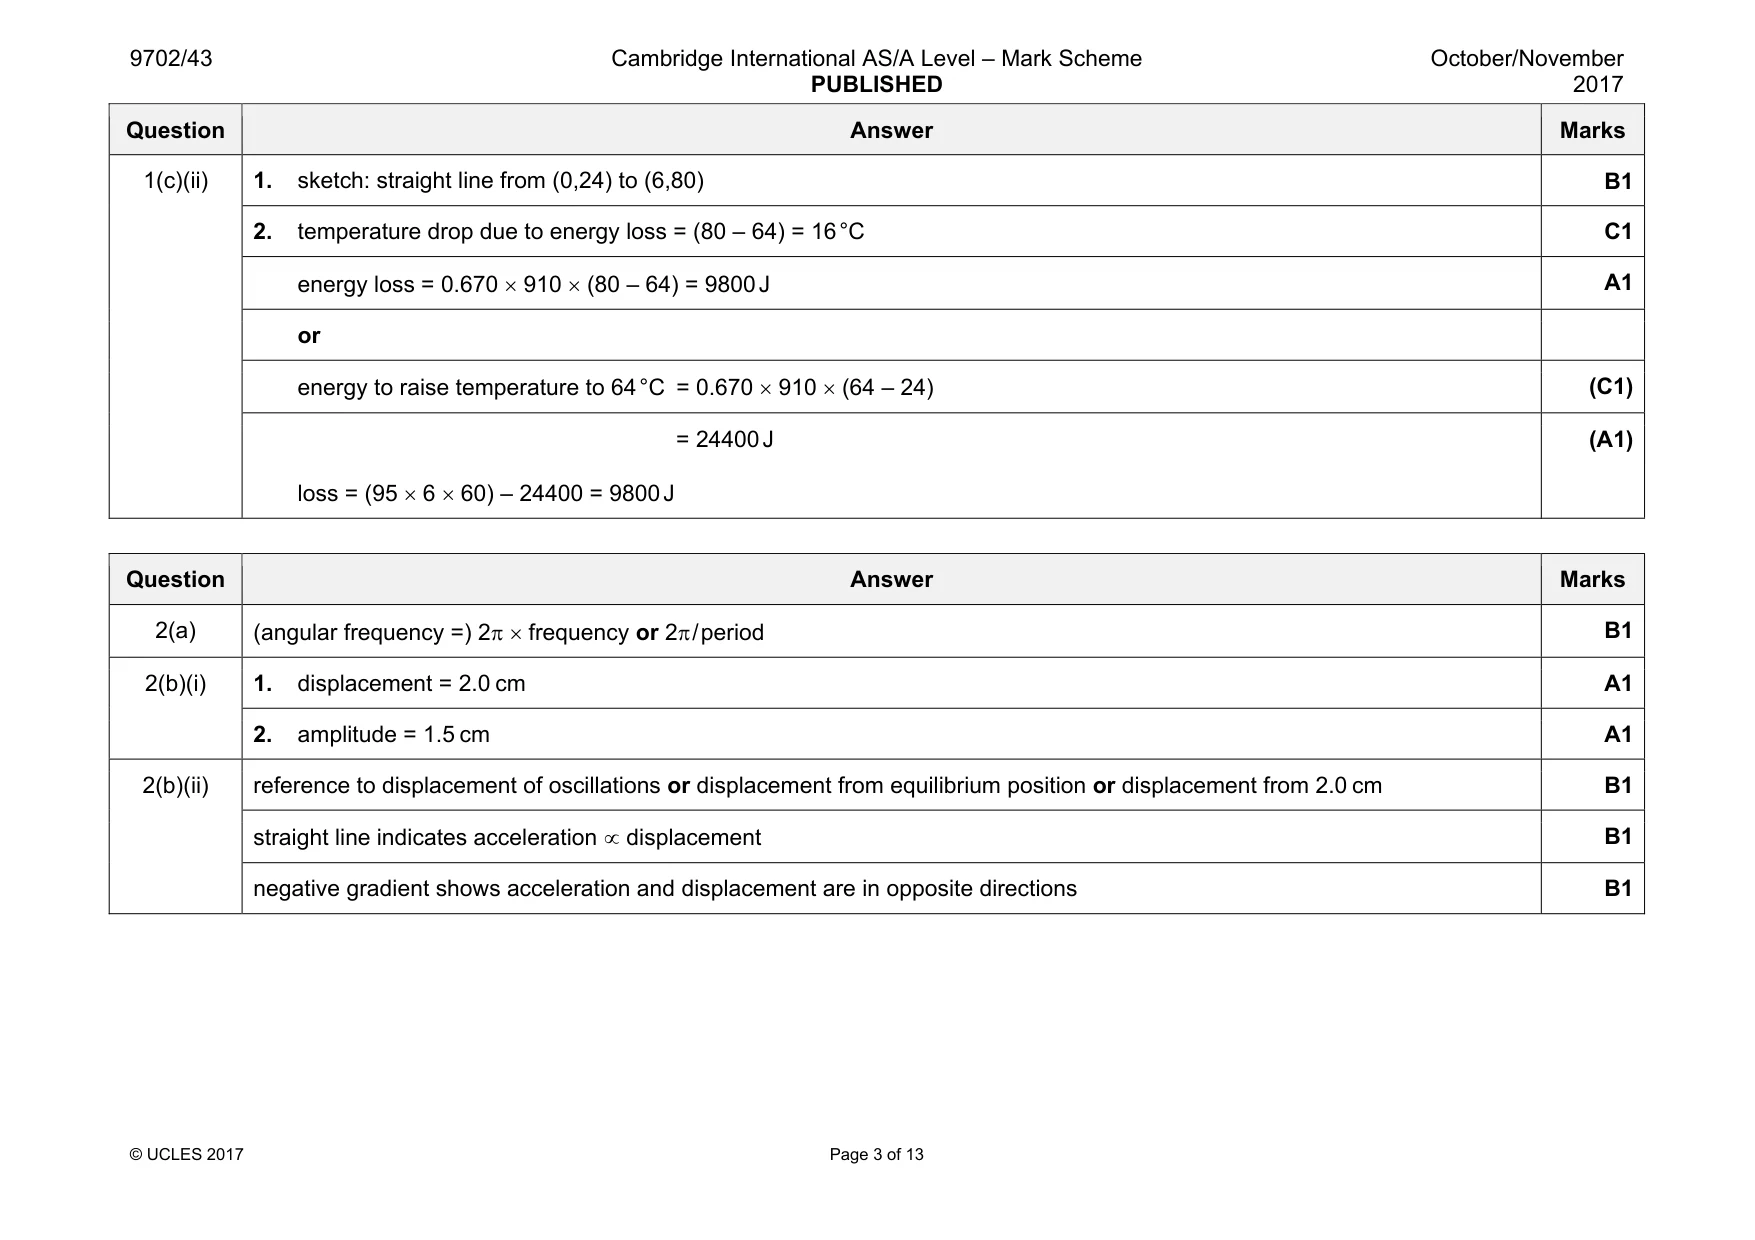
Mark scheme: 1(a)(i) direction or rate of transfer of (thermal) energy or (if different,) not in thermal equilibrium/energy is transferred B1 1(a)(ii) uses a property (of a substance) that changes with temperature B1 1(b) • temperature scale assumes linear change of property with temperature • physical properties may not vary linearly with temperature • agrees only at fixed points Any 2 points. B2 1(c)(i) Pt = mc(∆)θ C1 95 × 6 × 60 = 0.670 × 910 × ∆θ M1 ∆θ = 56 °C so final temperature = 56 + 24 = 80 °C A1 or 95 × 6 × 60 = 0.67 × 910 × (θ – 24) (M1) so final temperature or θ = 80 °C (A1) Question Answer Marks 1(c)(ii) 1. sketch: straight line from (0,24) to (6,80) B1 2. temperature drop due to energy loss = (80 – 64) = 16 °C C1 energy loss = 0.670 × 910 × (80 – 64) = 9800 J A1 or energy to raise temperature to 64 °C = 0.670 × 910 × (64 – 24) (C1) = 24400 J loss = (95 × 6 × 60) – 24400 = 9800 J (A1)
Q2 · State, by reference to simple harmonic motion, what is meant by angular frequency
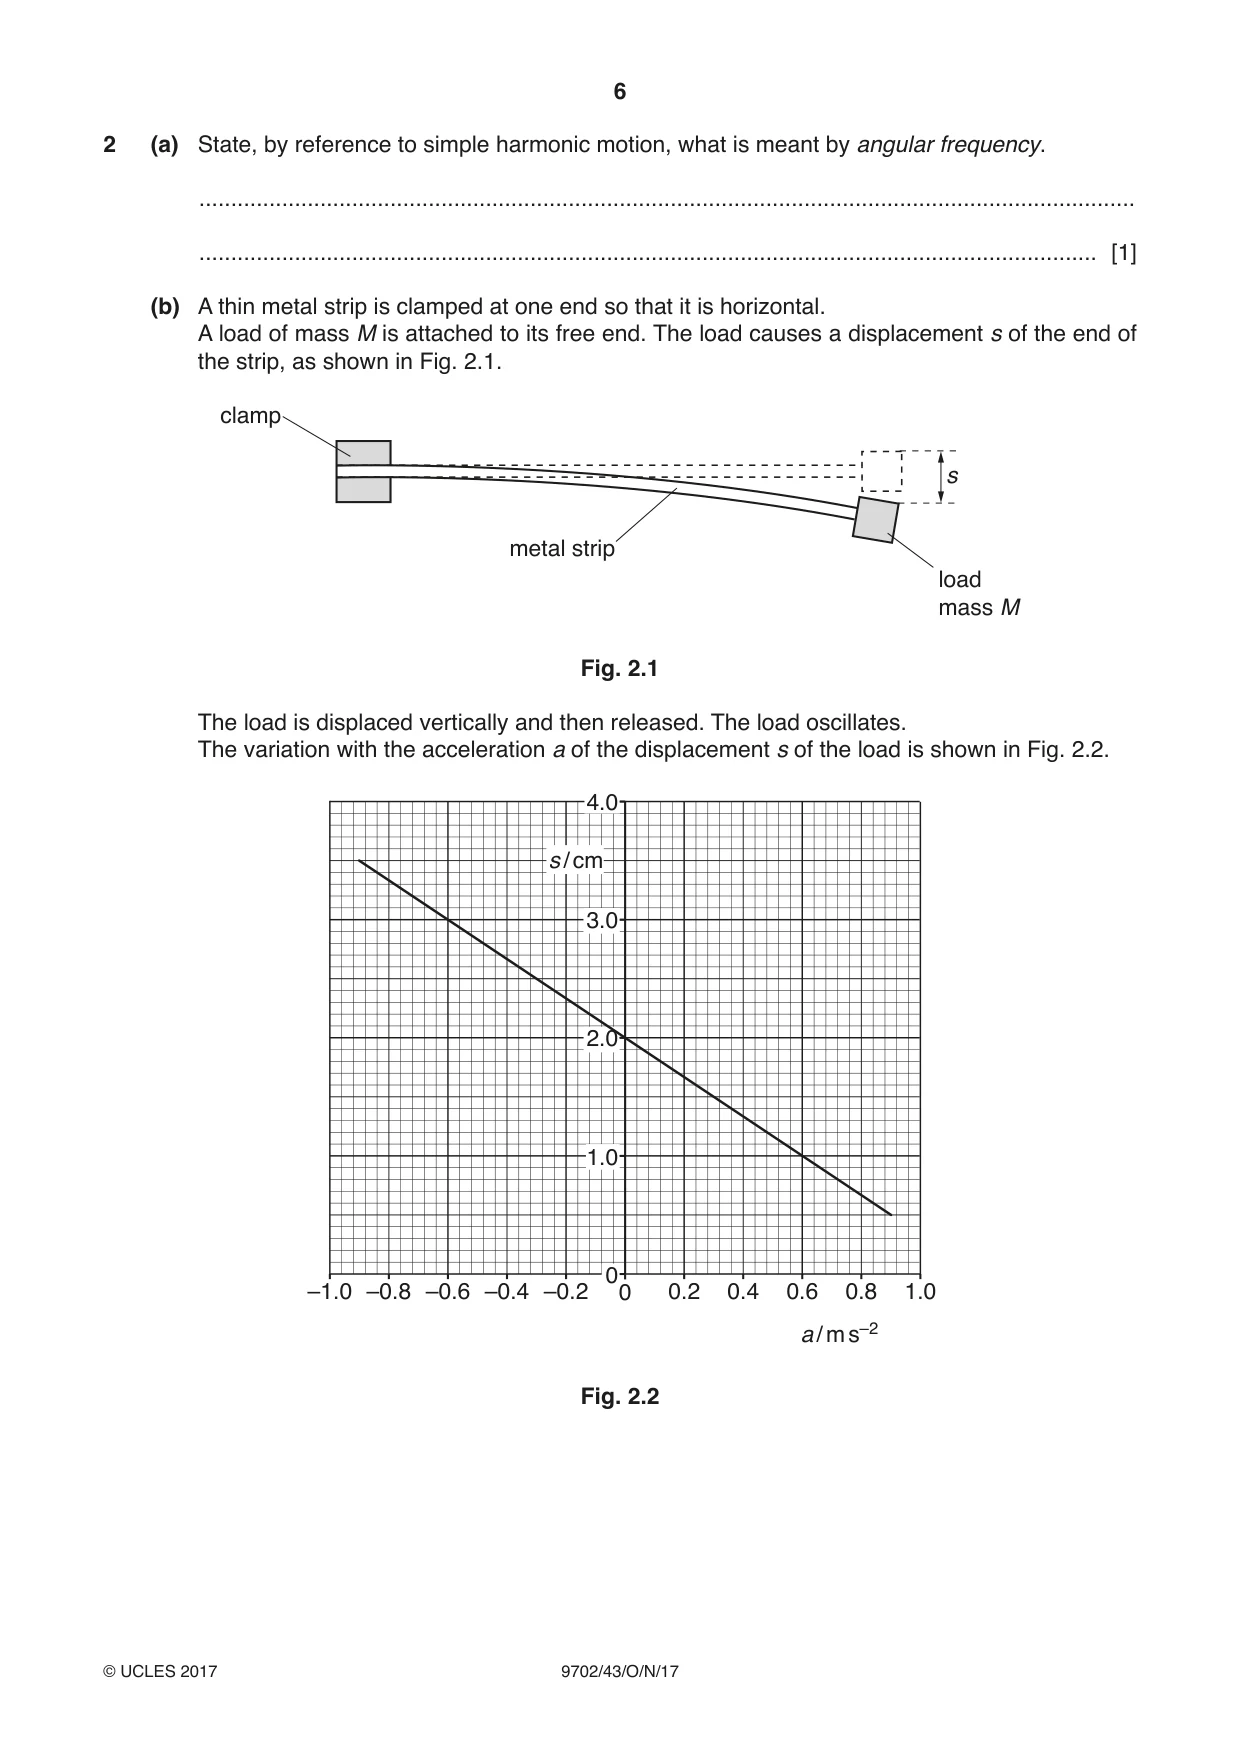
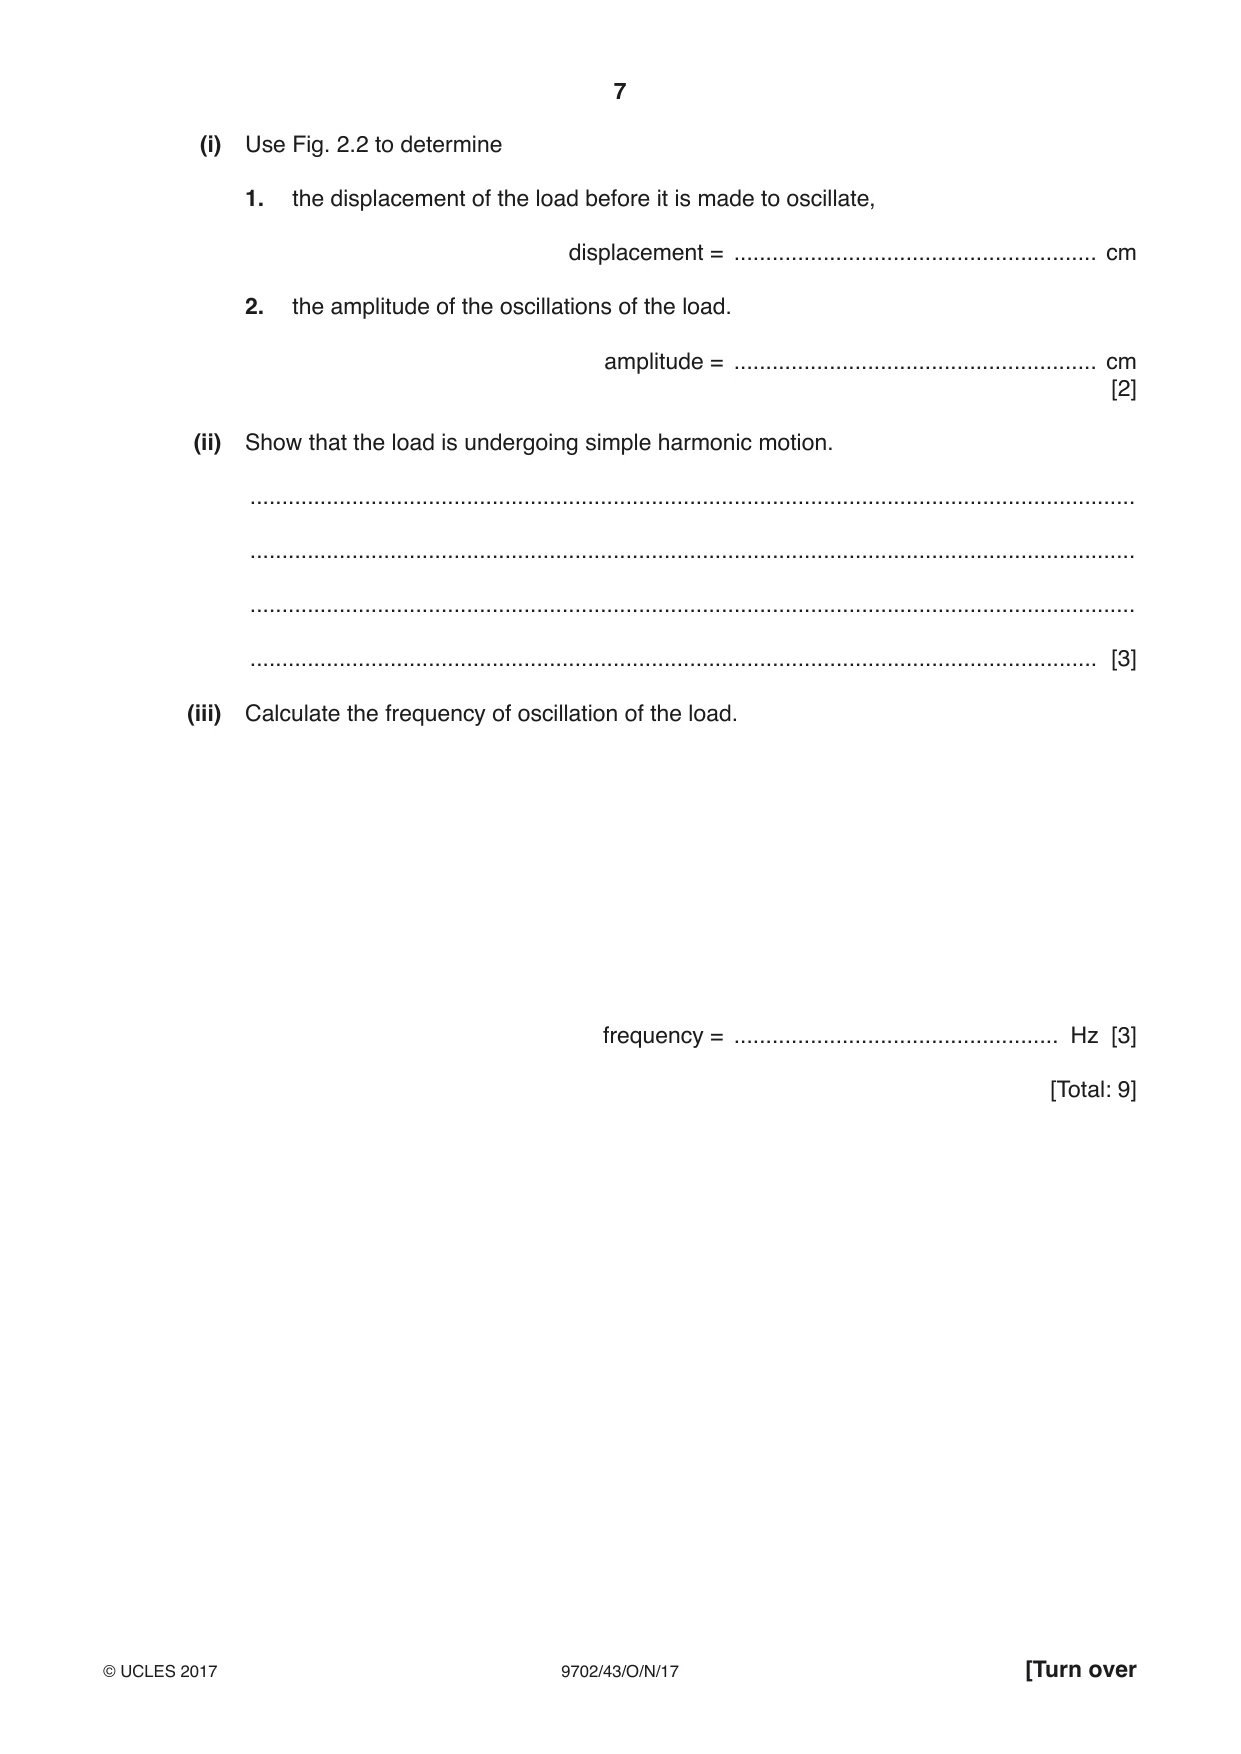
2 (a) State, by reference to simple harmonic motion, what is meant by angular frequency. ................................................................................................................................................... ............................................................................................................................................. [1] (b) A thin metal strip is clamped at one end so that it is horizontal. A load of mass M is attached to its free end. The load causes a displacement s of the end of the strip, as shown in Fig. 2.1. clamp s metal strip load mass M Fig. 2.1 The load is displaced vertically and then released. The load oscillates. The variation with the acceleration a of the displacement s of the load is shown in Fig. 2.2. 4.0 s / cm 3.0 2.0 1.0 –1.0 –0.8 –0.6 –0.4 –0.2 00 0.2 0.4 0.6 0.8 1.0 a / m s–2 Fig. 2.2 (i) Use Fig. 2.2 to determine 1. the displacement of the load before it is made to oscillate, displacement = ......................................................... cm 2. the amplitude of the oscillations of the load. amplitude = ......................................................... cm [2] (ii) Show that the load is undergoing simple harmonic motion. ........................................................................................................................................... ........................................................................................................................................... ........................................................................................................................................... ..................................................................................................................................... [3] (iii) Calculate the frequency of oscillation of the load. frequency = ................................................... Hz [3] [Total: 9]
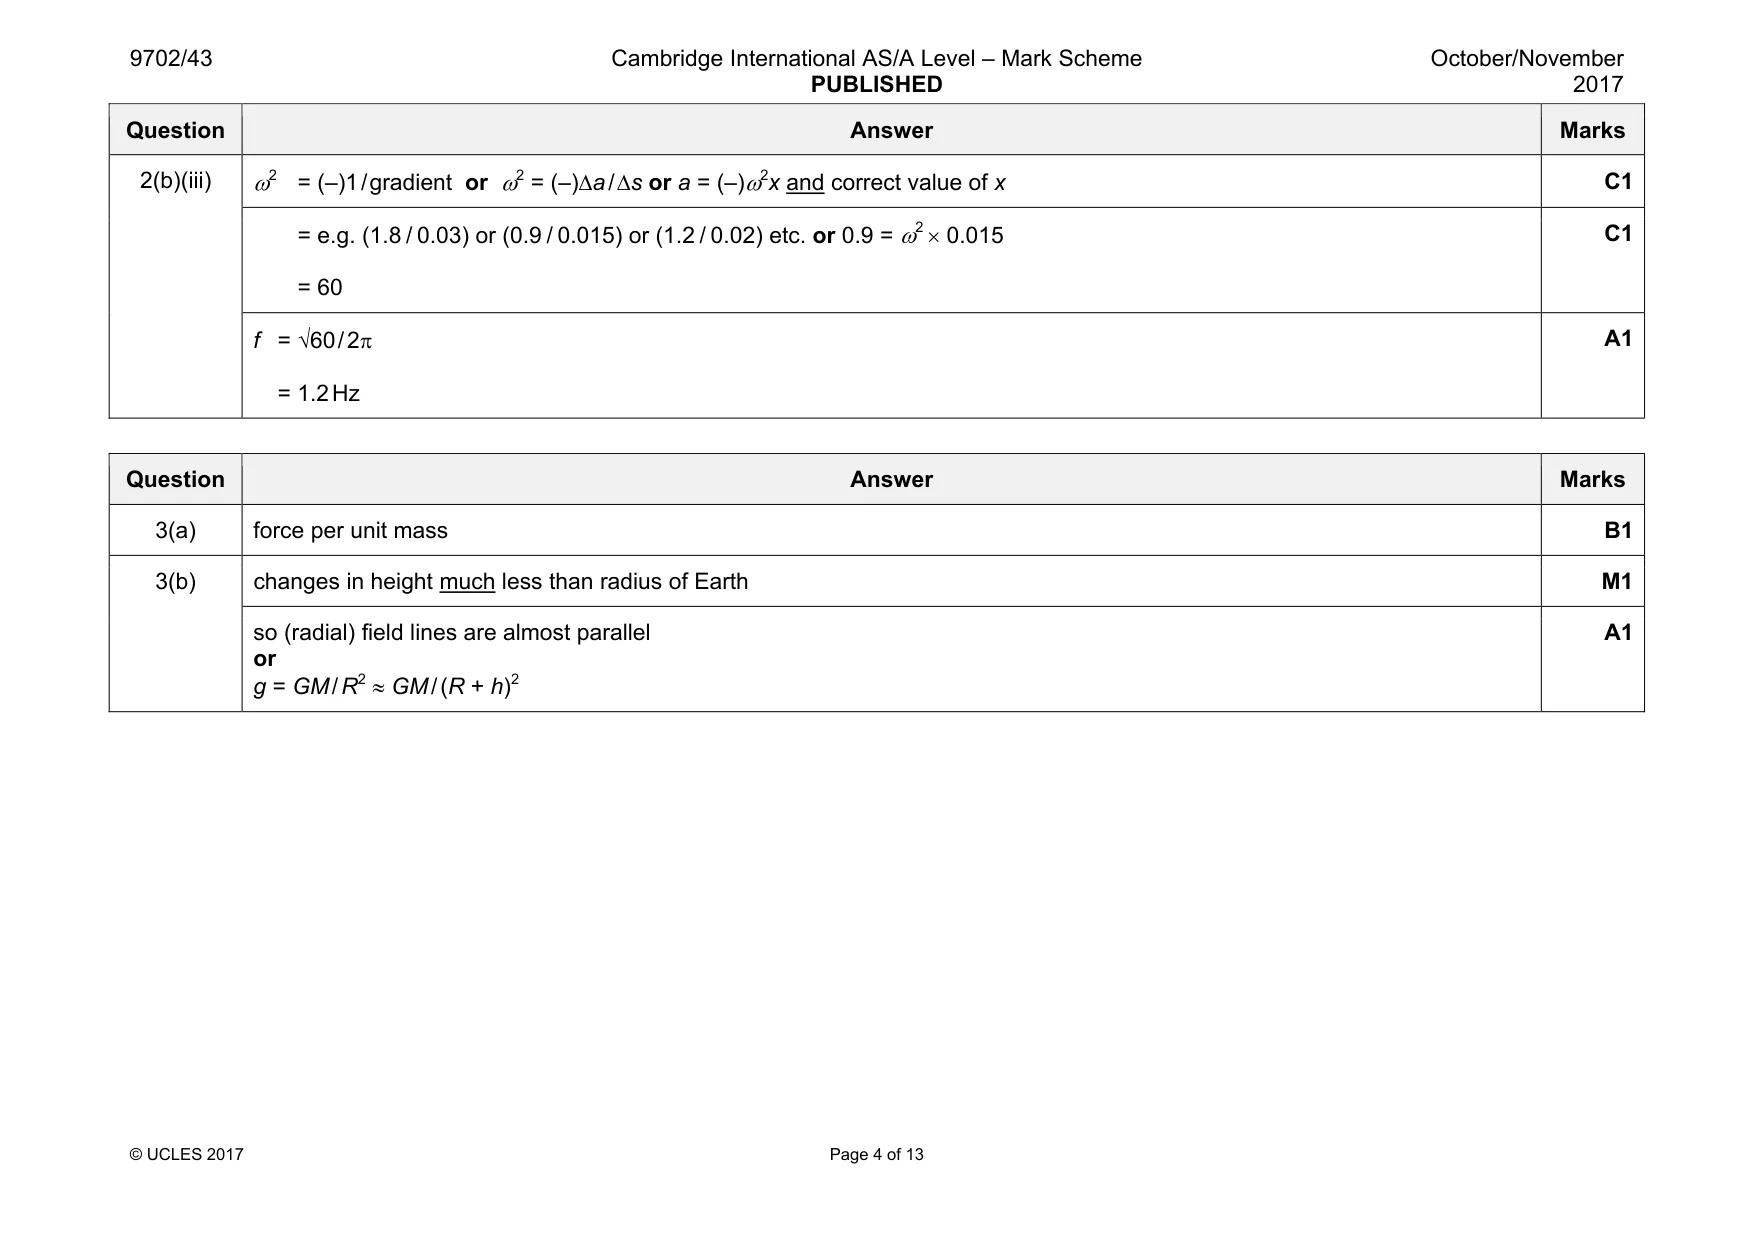
Mark scheme: 2(a) B1 2(b)(i) 1. displacement = 2.0 cm A1 2. amplitude = 1.5 cm A1 2(b)(ii) reference to displacement of oscillations or displacement from equilibrium position or displacement from 2.0 cm B1 straight line indicates acceleration ∝ displacement B1 negative gradient shows acceleration and displacement are in opposite directions B1 Question Answer Marks 2(b)(iii) ω2 = (–)1 / gradient or ω2 = (–)∆a / ∆s or a = (–)ω2x and correct value of x C1 = e.g. (1.8 / 0.03) or (0.9 / 0.015) or (1.2 / 0.02) etc. or 0.9 = ω2 × 0.015 = 60 C1 f = √60 / 2π = 1.2 Hz A1
Q3 · Define gravitational field strength
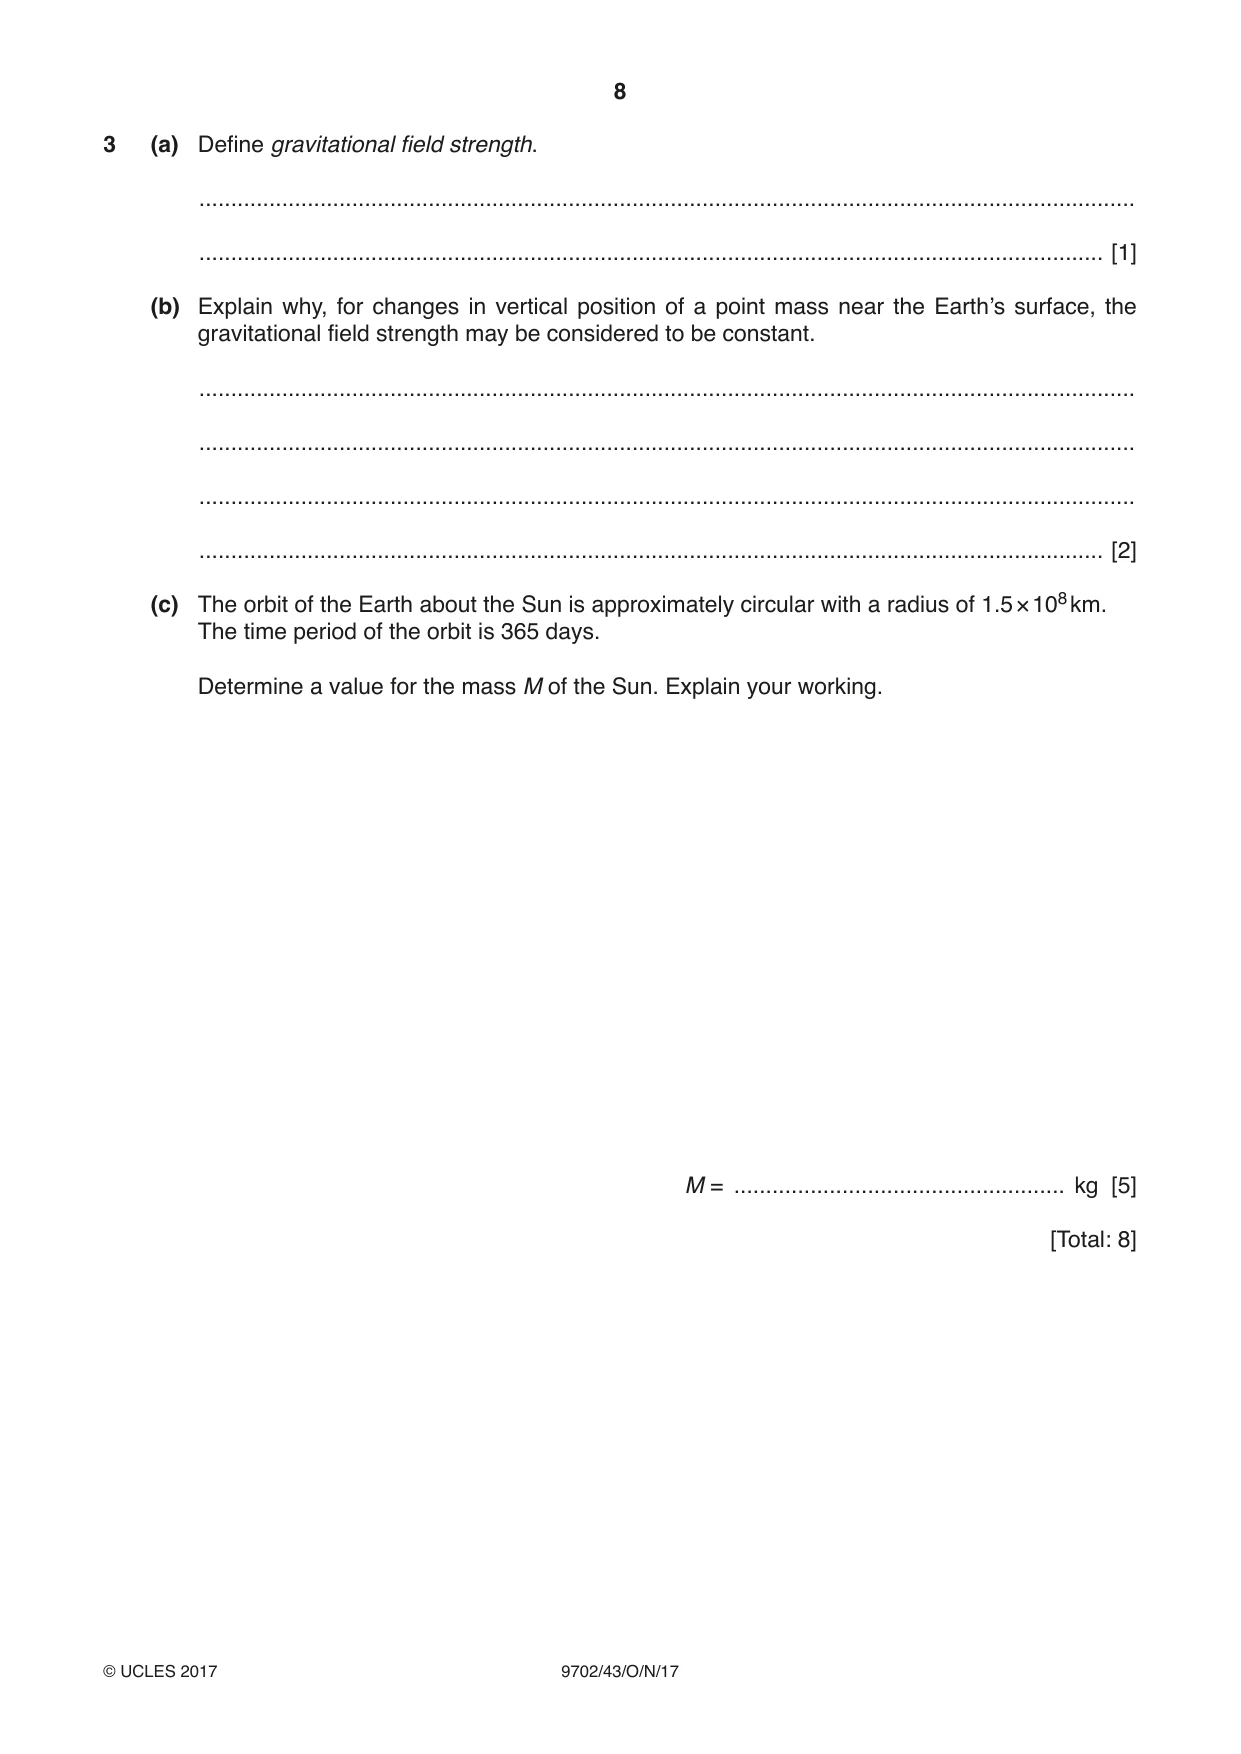
3 (a) Define gravitational field strength. ................................................................................................................................................... .............................................................................................................................................. [1] (b) Explain why, for changes in vertical position of a point mass near the Earth’s surface, the gravitational field strength may be considered to be constant. ................................................................................................................................................... ................................................................................................................................................... ................................................................................................................................................... .............................................................................................................................................. [2] (c) The orbit of the Earth about the Sun is approximately circular with a radius of 1.5 × 10⁸ km. The time period of the orbit is 365 days. Determine a value for the mass M of the Sun. Explain your working. M = .................................................... kg [5] [Total: 8]
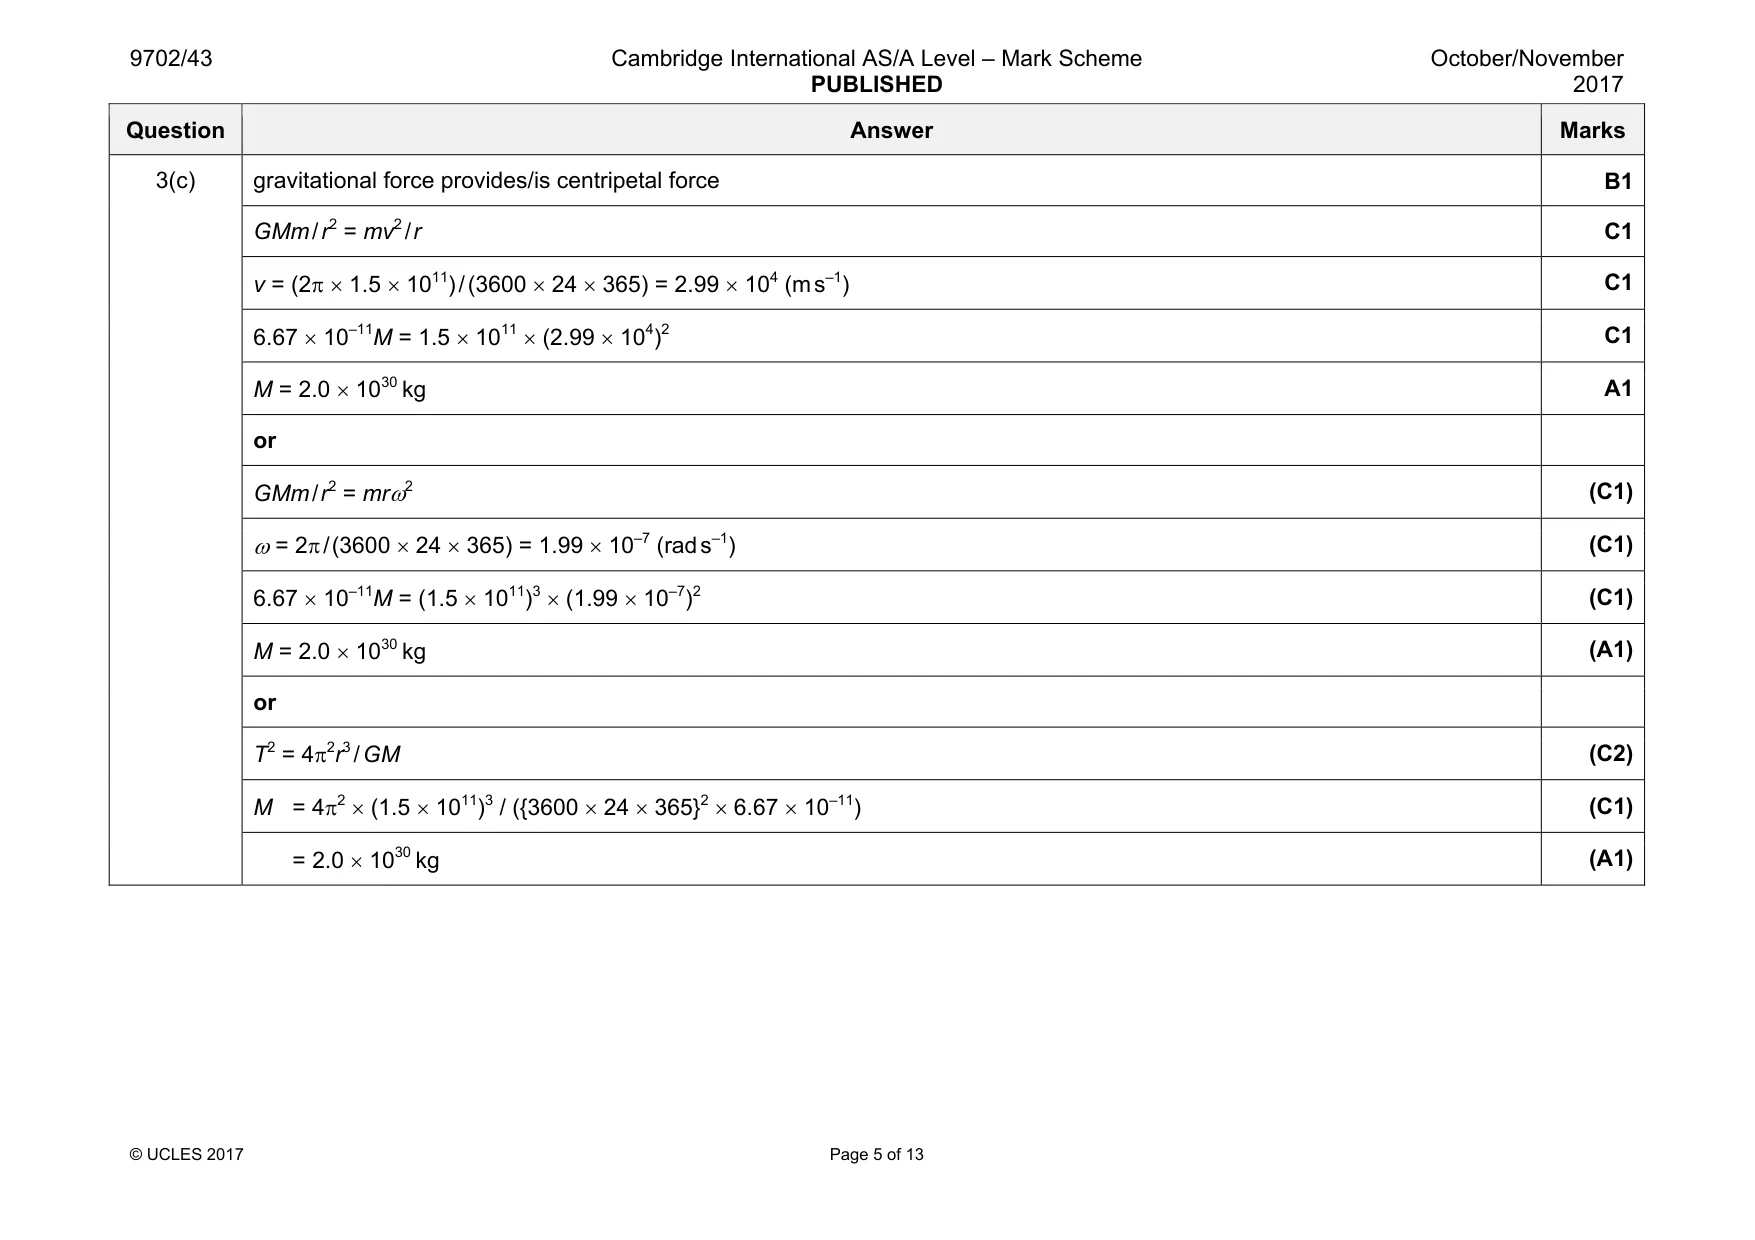
Mark scheme: 3(a) force per unit mass B1 3(b) changes in height much less than radius of Earth M1 so (radial) field lines are almost parallel or g = GM / R2 ≈ GM / (R + h)2 A1 Question Answer Marks 3(c) gravitational force provides/is centripetal force B1 GMm / r2 = mv2 / r C1 v = (2π × 1.5 × 1011) / (3600 × 24 × 365) = 2.99 × 10⁴ (m s–1) C1 6.67 × 10⁻¹¹M = 1.5 × 1011 × (2.99 × 104)2 C1 M = 2.0 × 1030 kg A1 or GMm / r2 = mrω2 (C1) ω = 2π / (3600 × 24 × 365) = 1.99 × 10⁻⁷ (rad s–1) (C1) 6.67 × 10⁻¹¹M = (1.5 × 10¹¹)3 × (1.99 × 10–7)2 (C1) M = 2.0 × 1030 kg (A1) or T2 = 4π2r3 / GM (C2) M = 4π2 × (1.5 × 1011)3 / ({3600 × 24 × 365}2 × 6.67 × 10–11) (C1) = 2.0 × 1030 kg (A1)
Q4 · A coaxial cable is frequently used to connect an aerial to a television receiver
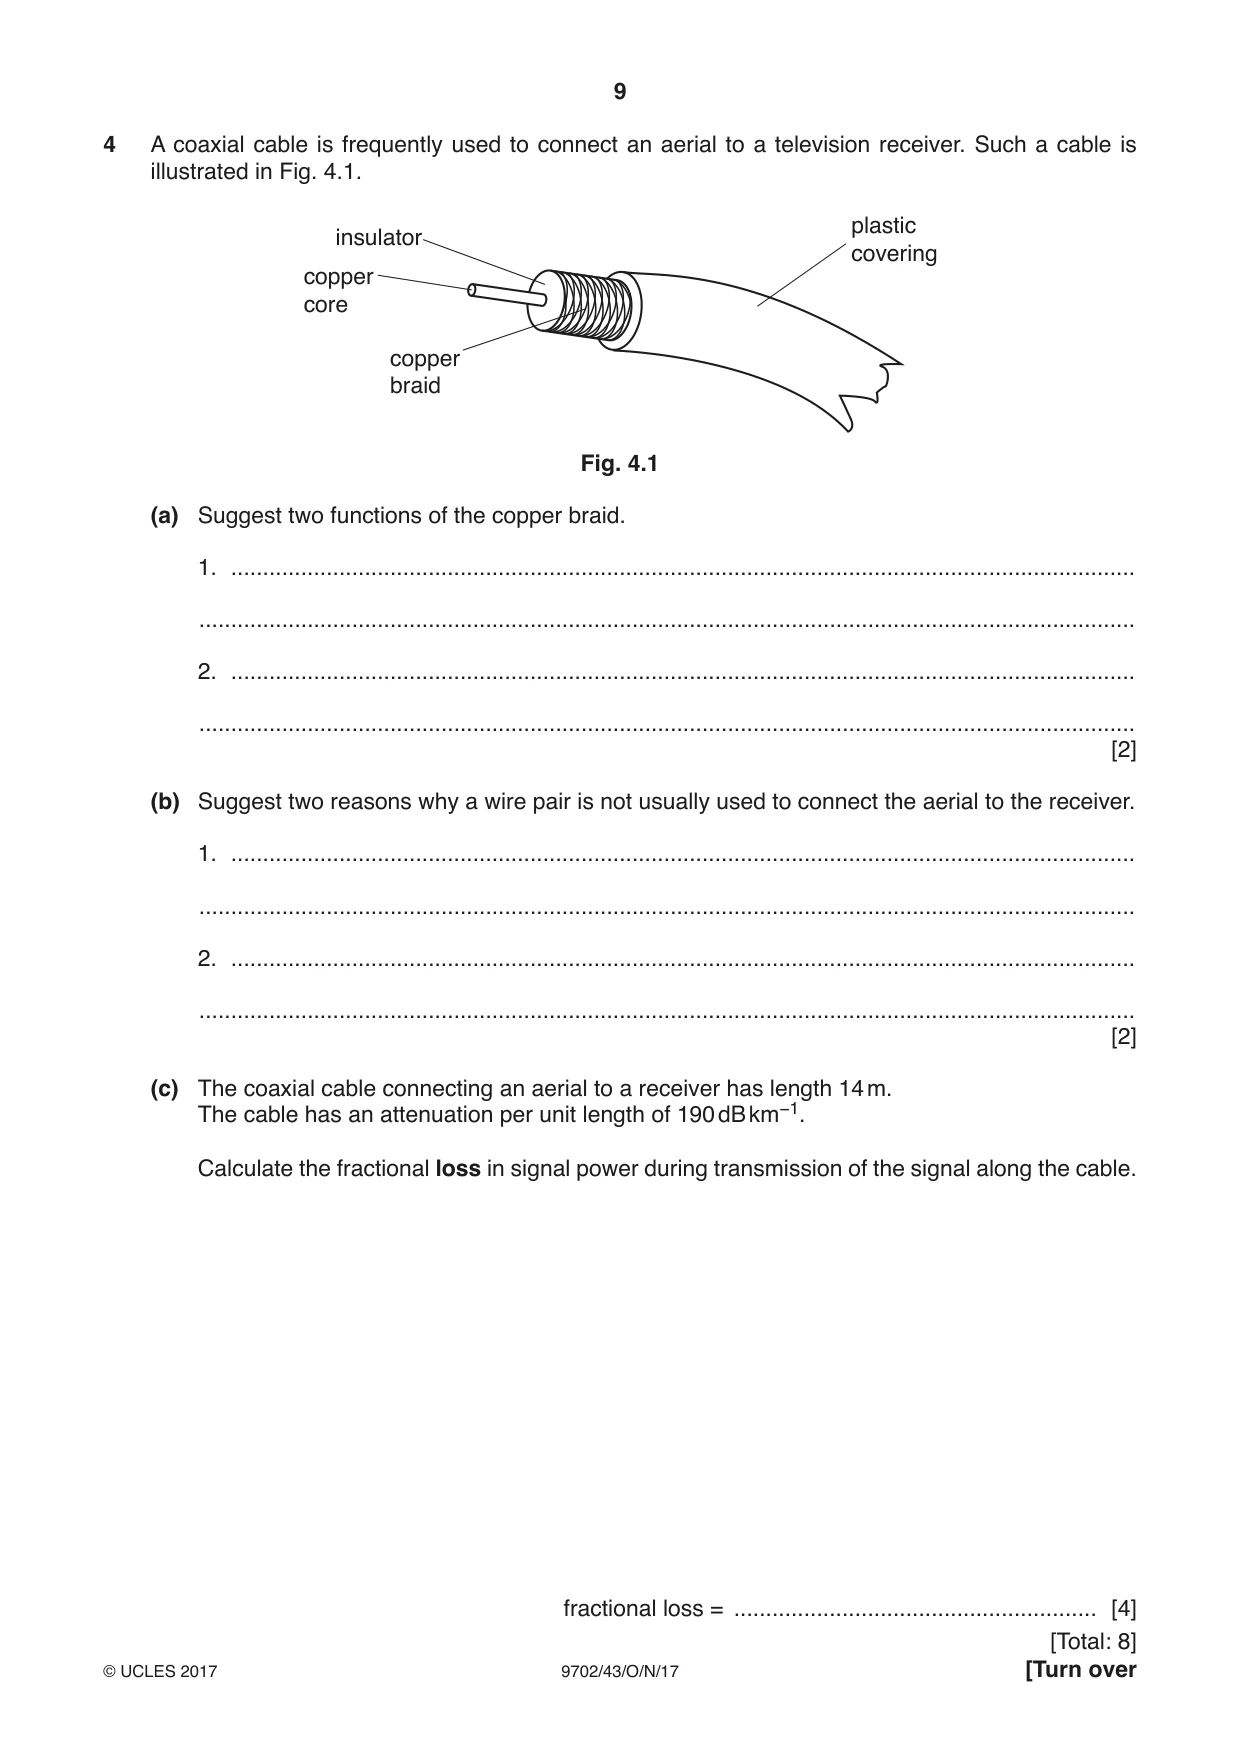
4 A coaxial cable is frequently used to connect an aerial to a television receiver. Such a cable is illustrated in Fig. 4.1. plastic insulator covering copper core copper braid Fig. 4.1 (a) Suggest two functions of the copper braid. 1. .............................................................................................................................................. ................................................................................................................................................... 2. .............................................................................................................................................. ................................................................................................................................................... [2] (b) Suggest two reasons why a wire pair is not usually used to connect the aerial to the receiver. 1. .............................................................................................................................................. ................................................................................................................................................... 2. .............................................................................................................................................. ................................................................................................................................................... [2] (c) The coaxial cable connecting an aerial to a receiver has length 14 m. The cable has an attenuation per unit length of 190 dB km−1. Calculate the fractional loss in signal power during transmission of the signal along the cable. fractional loss = ......................................................... [4]
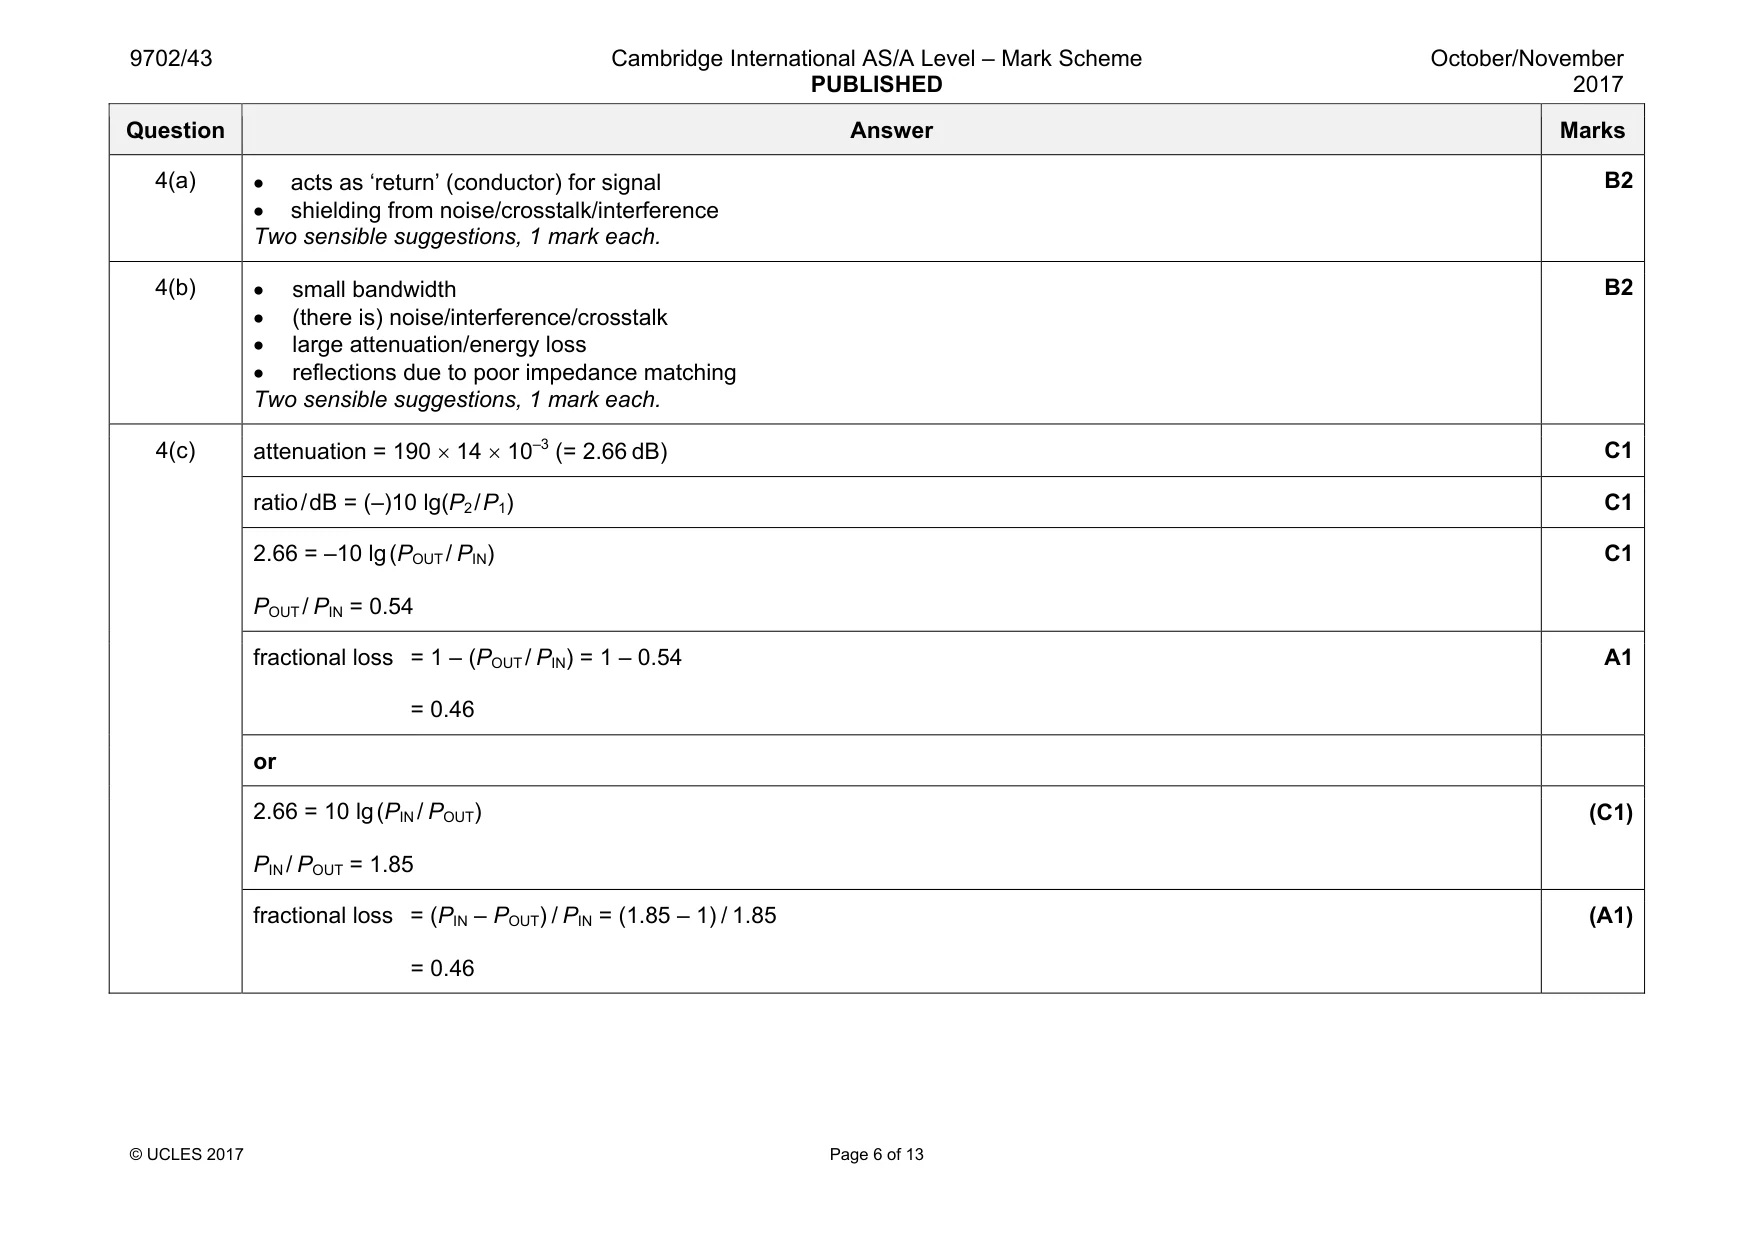
Mark scheme: 4(a) acts as ‘return’ (conductor) for signal • shielding from noise/crosstalk/interference Two sensible suggestions, 1 mark each. B2 4(b) • small bandwidth • (there is) noise/interference/crosstalk • large attenuation/energy loss • reflections due to poor impedance matching Two sensible suggestions, 1 mark each. B2 4(c) attenuation = 190 × 14 × 10–3 (= 2.66 dB) C1 ratio / dB = (–)10 lg(P2 / P1) C1 2.66 = –10 lg (POUT / PIN) POUT/ PIN = 0.54 C1 fractional loss = 1 – (POUT / PIN) = 1 – 0.54 = 0.46 A1 or 2.66 = 10 lg (PIN / POUT) PIN/ POUT = 1.85 (C1) fractional loss = (PIN – POUT) / PIN = (1.85 – 1) / 1.85 = 0.46 (A1)
Q5 · State Coulomb’s law for the force between two point charges
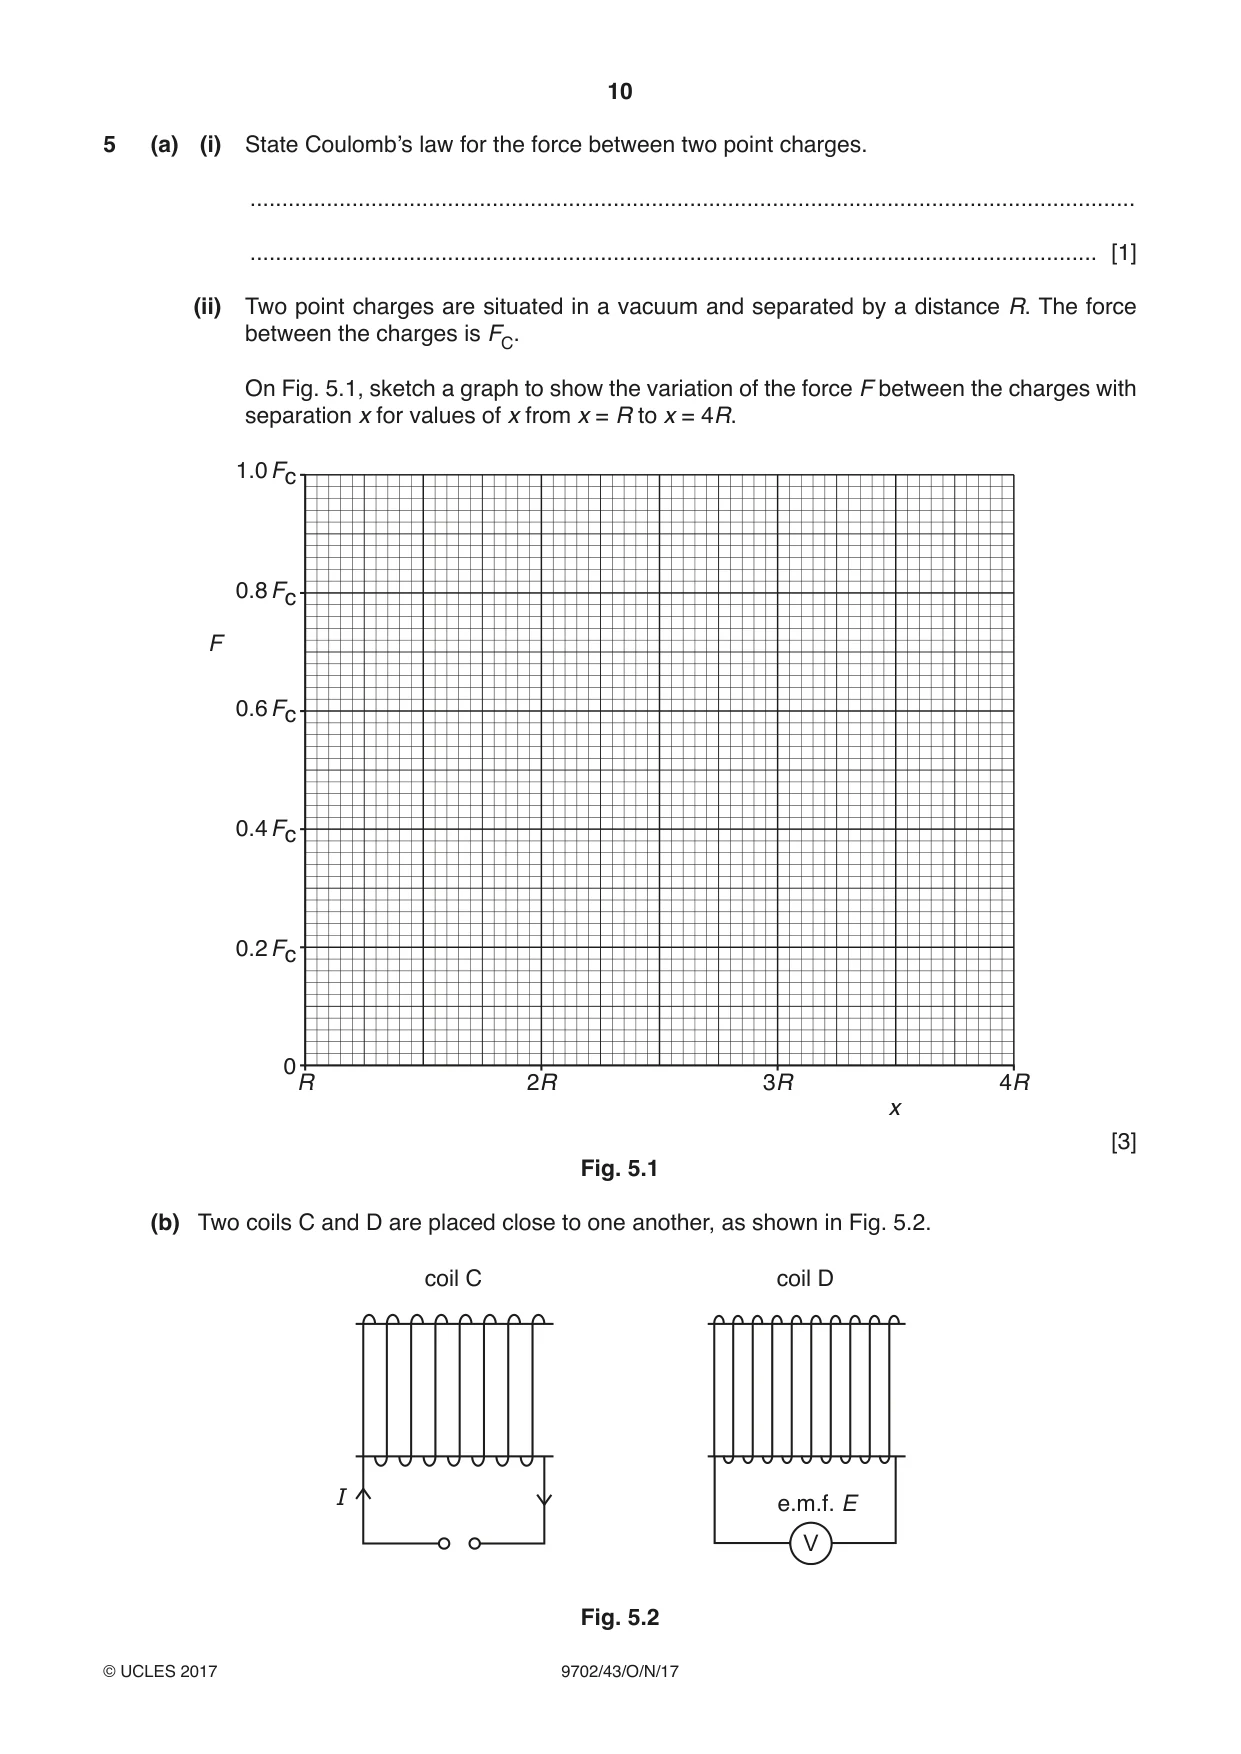
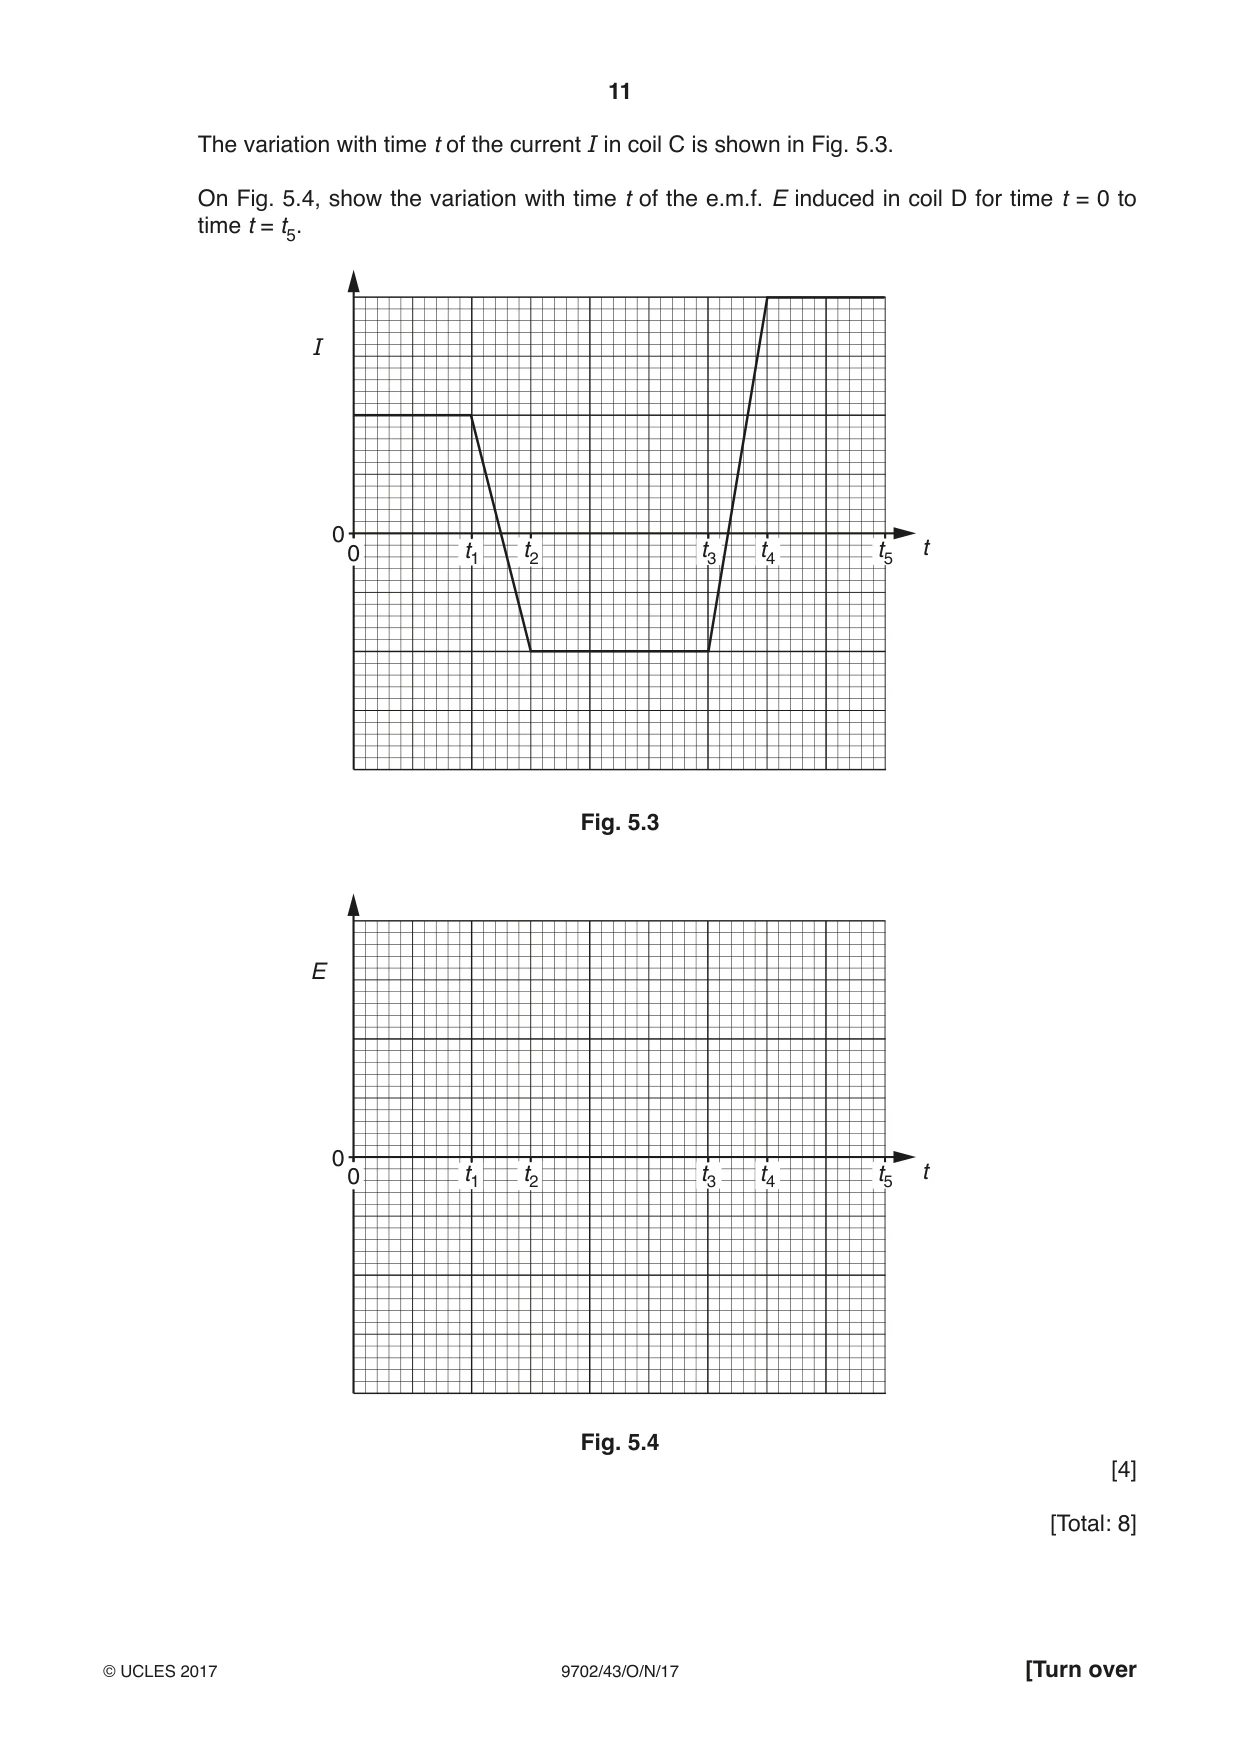
5 (a) (i) State Coulomb’s law for the force between two point charges. ........................................................................................................................................... ..................................................................................................................................... [1] (ii) Two point charges are situated in a vacuum and separated by a distance R. The force between the charges is FC. On Fig. 5.1, sketch a graph to show the variation of the force F between the charges with separation x for values of x from x = R to x = 4R. 1.0 Fc 0.8 Fc F 0.6 Fc 0.4 Fc 0.2 Fc 0 R 2R 3R 4R x [3] Fig. 5.1 (b) Two coils C and D are placed close to one another, as shown in Fig. 5.2. coil C coil D I e.m.f. E V Fig. 5.2 The variation with time t of the current I in coil C is shown in Fig. 5.3. On Fig. 5.4, show the variation with time t of the e.m.f. E induced in coil D for time t = 0 to time t = t5. I 0 0 t1 t2 t3 t4 t5 t Fig. 5.3 E 0 0 t1 t2 t3 t4 t5 t Fig. 5.4 [4] [Total: 8]
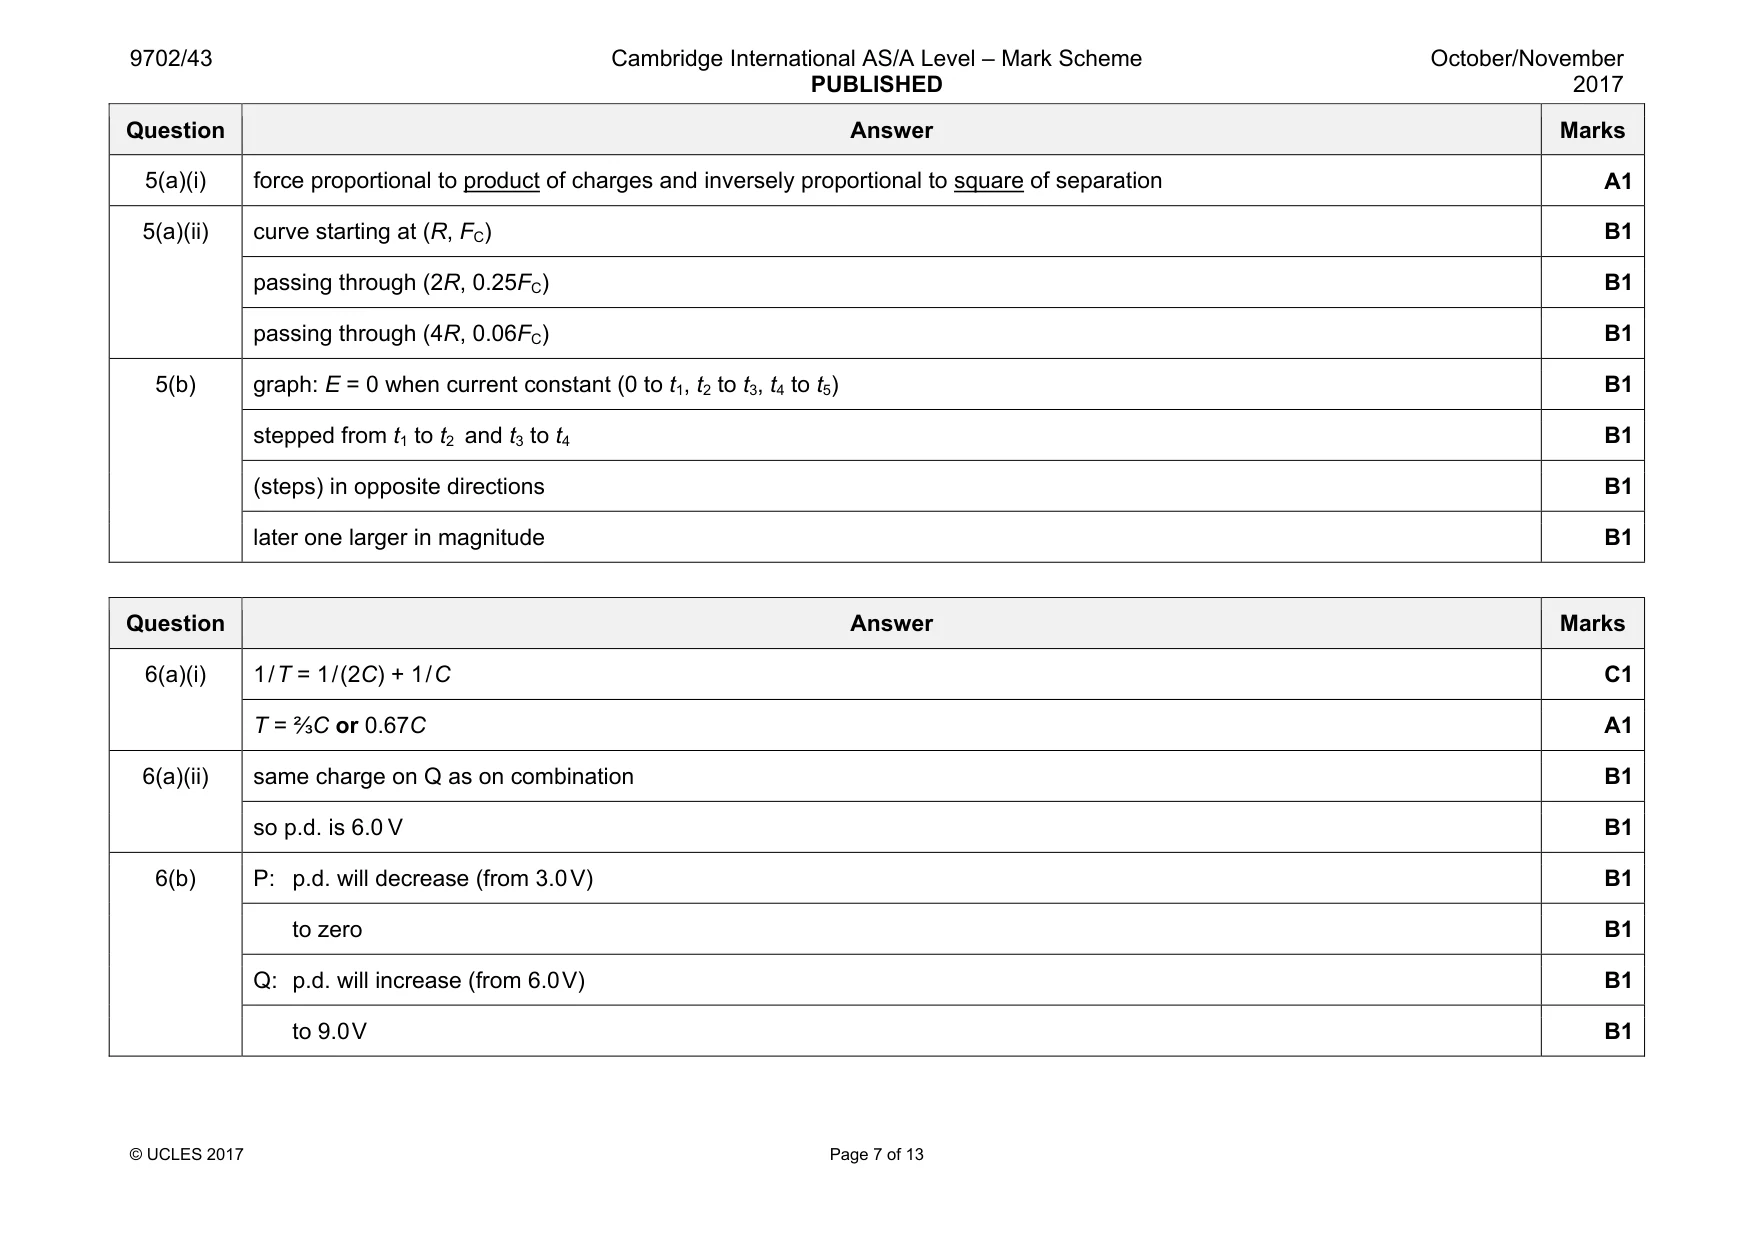
Mark scheme: 5(a)(i) force proportional to product of charges and inversely proportional to square of separation A1 5(a)(ii) curve starting at (R, FC) B1 passing through (2R, 0.25FC) B1 passing through (4R, 0.06FC) B1 5(b) graph: E = 0 when current constant (0 to t1, t2 to t3, t4 to t5) B1 stepped from t1 to t2 and t3 to t4 B1 (steps) in opposite directions B1 later one larger in magnitude B1
Q6 · Two capacitors P and Q, each of capacitance C, are connected in series with a battery of…
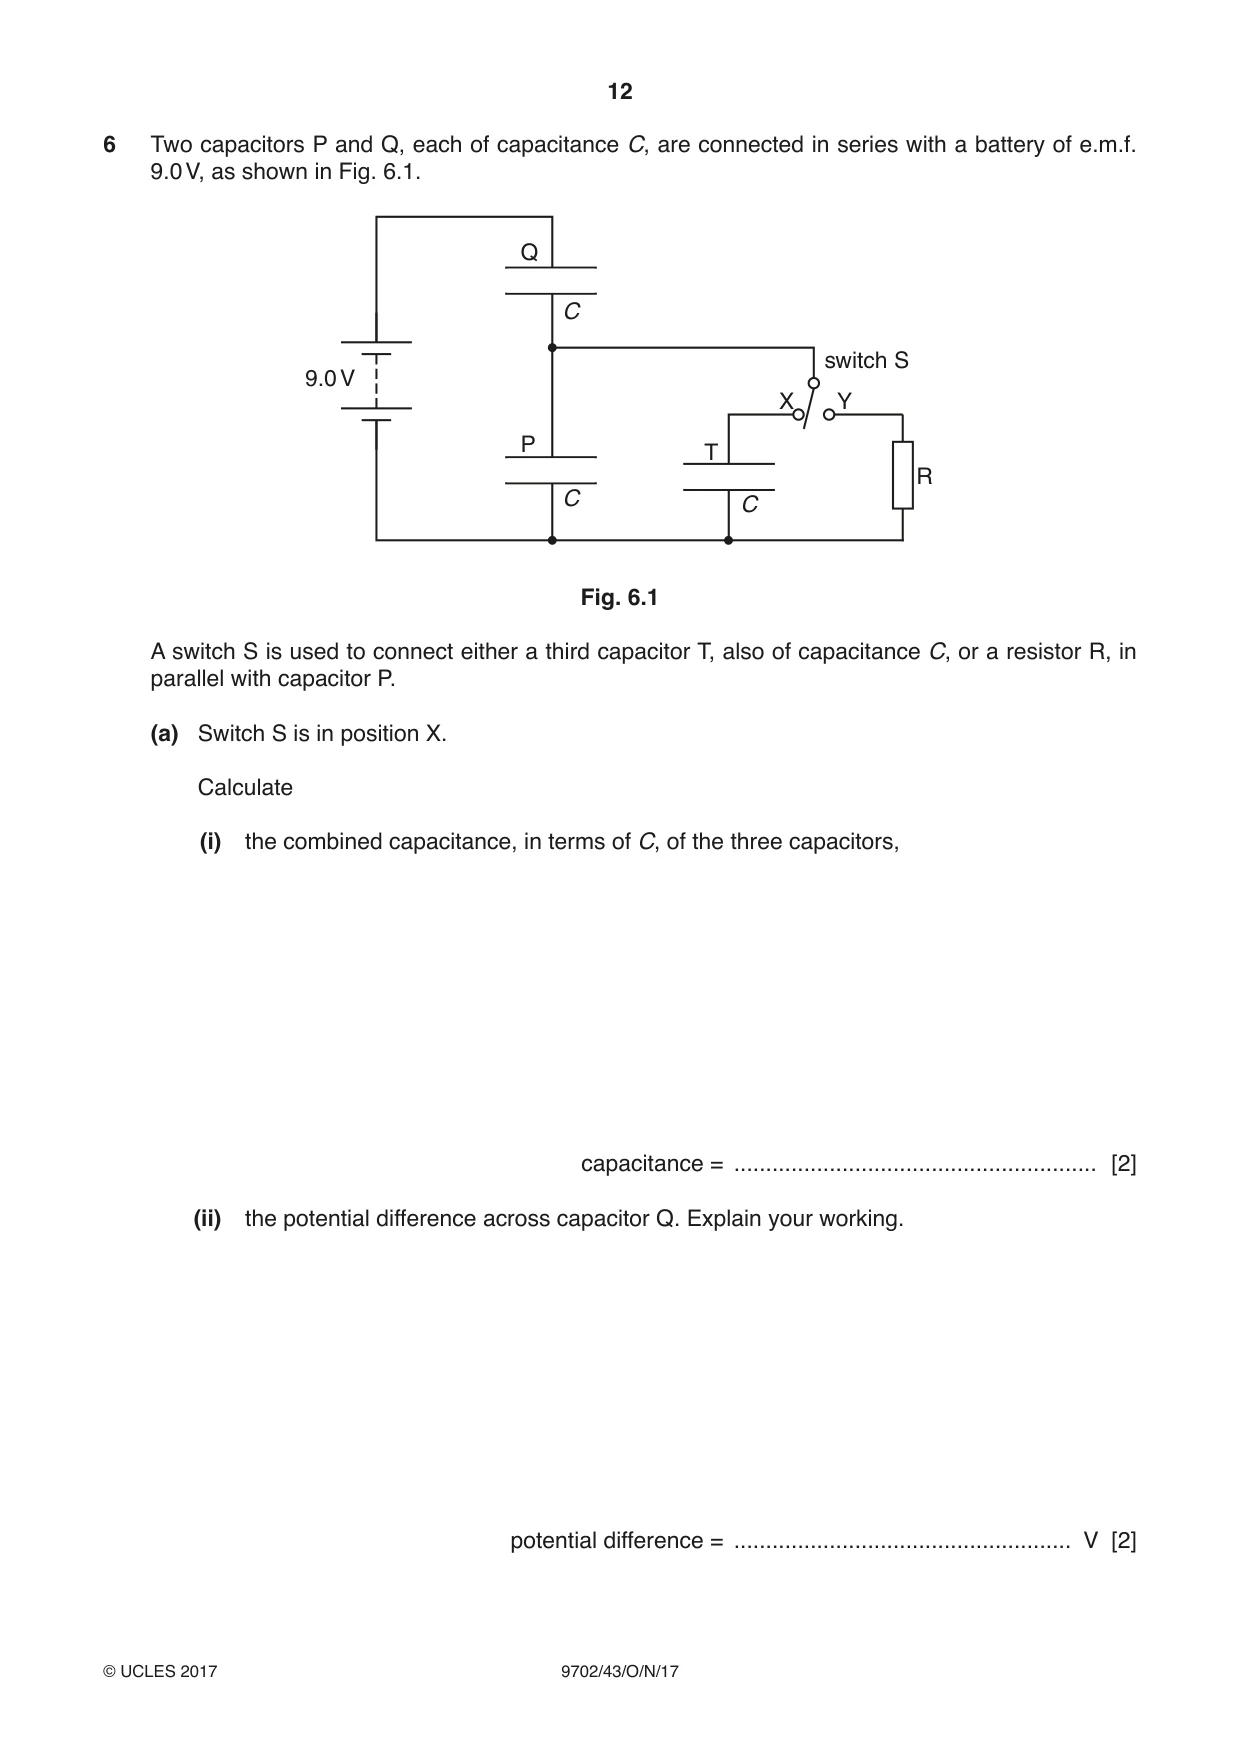
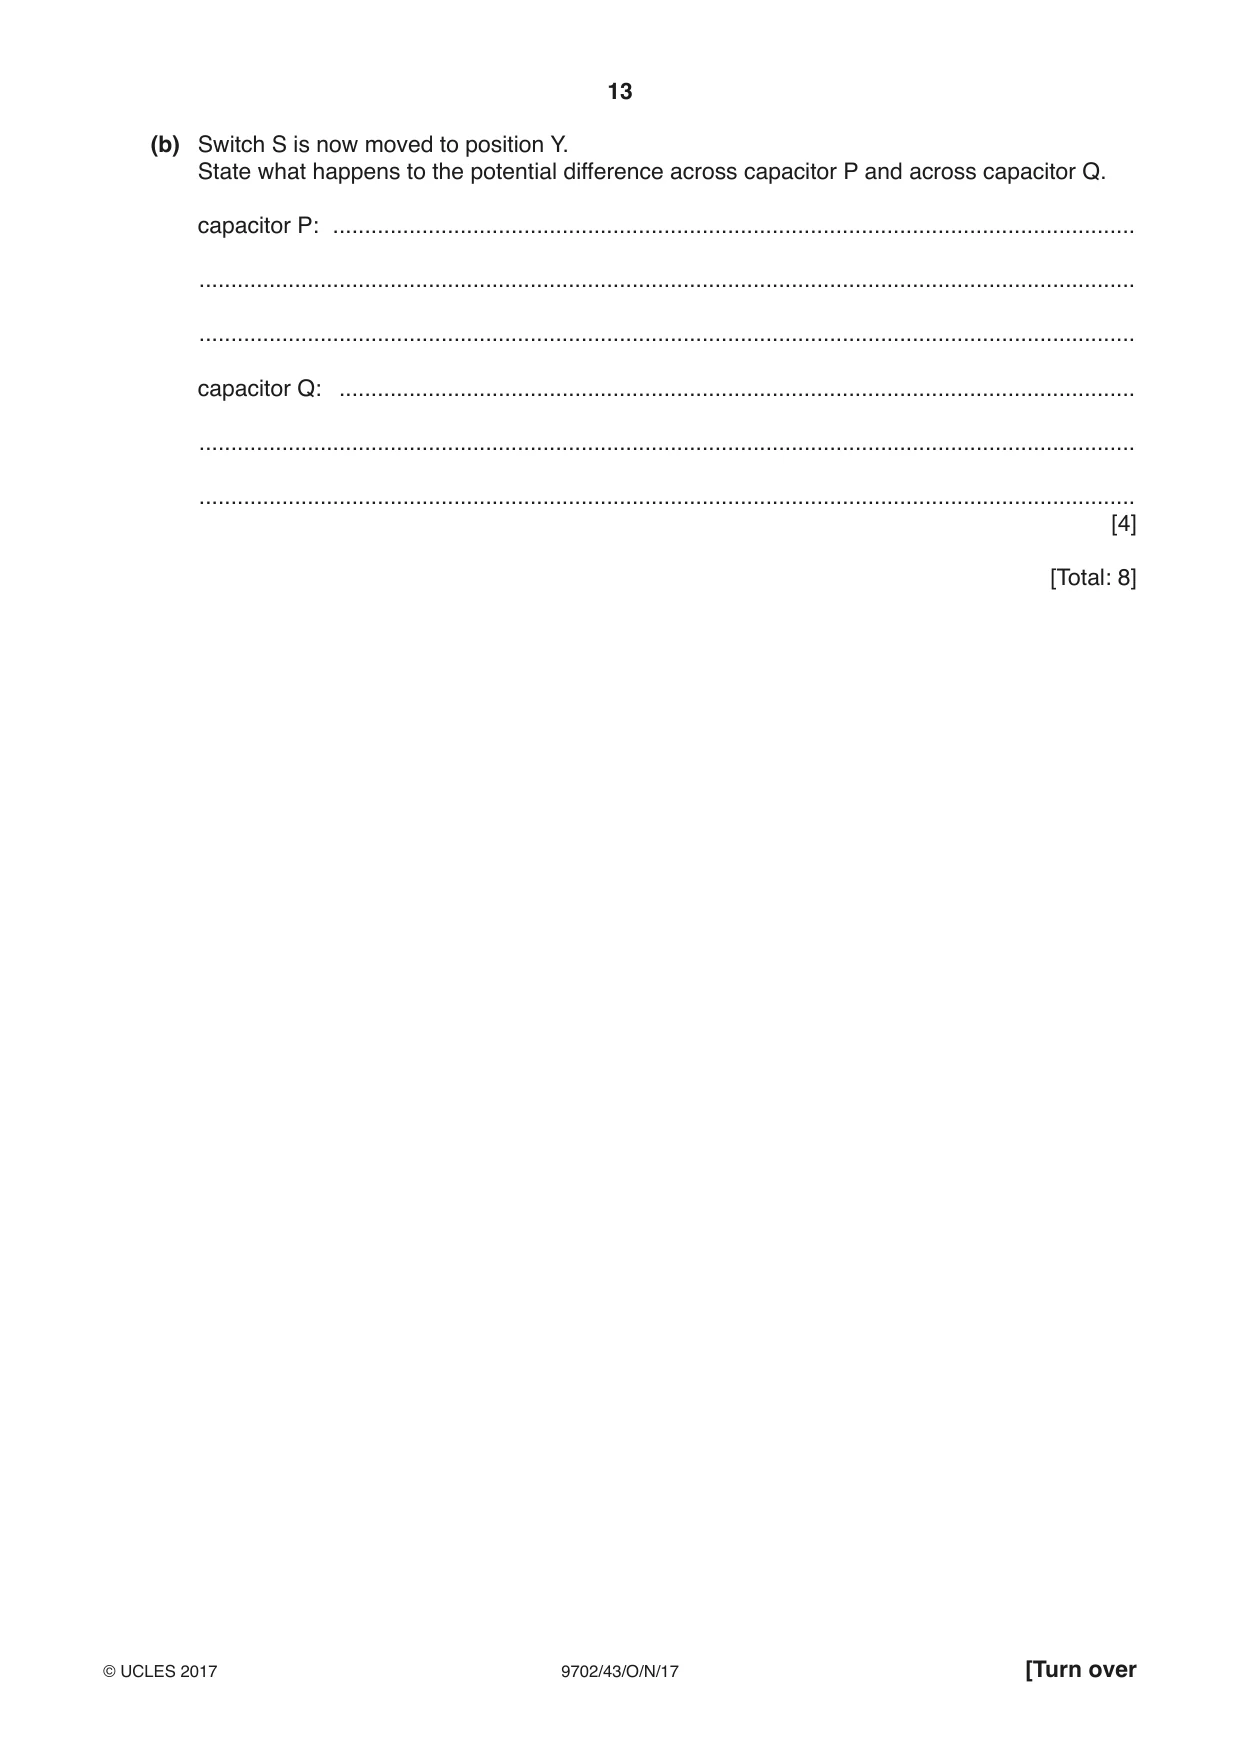
6 Two capacitors P and Q, each of capacitance C, are connected in series with a battery of e.m.f. 9.0 V, as shown in Fig. 6.1. Q C switch S 9.0 V X Y P T R C C Fig. 6.1 A switch S is used to connect either a third capacitor T, also of capacitance C, or a resistor R, in parallel with capacitor P. (a) Switch S is in position X. Calculate (i) the combined capacitance, in terms of C, of the three capacitors, capacitance = ......................................................... [2] (ii) the potential difference across capacitor Q. Explain your working. potential difference = ..................................................... V [2] (b) Switch S is now moved to position Y. State what happens to the potential difference across capacitor P and across capacitor Q. capacitor P: .............................................................................................................................. ................................................................................................................................................... ................................................................................................................................................... capacitor Q: ............................................................................................................................. ................................................................................................................................................... ................................................................................................................................................... [4] [Total: 8]
Mark scheme: 6(a)(i) 1 / T = 1 / (2C) + 1 / C C1 T = ⅔C or 0.67C A1 6(a)(ii) same charge on Q as on combination B1 so p.d. is 6.0 V B1 6(b) P: p.d. will decrease (from 3.0 V) B1 to zero B1 Q: p.d. will increase (from 6.0 V) B1 to 9.0 V B1
Q7 · The circuit of an amplifier incorporating an ideal operational amplifier (op-amp) is…
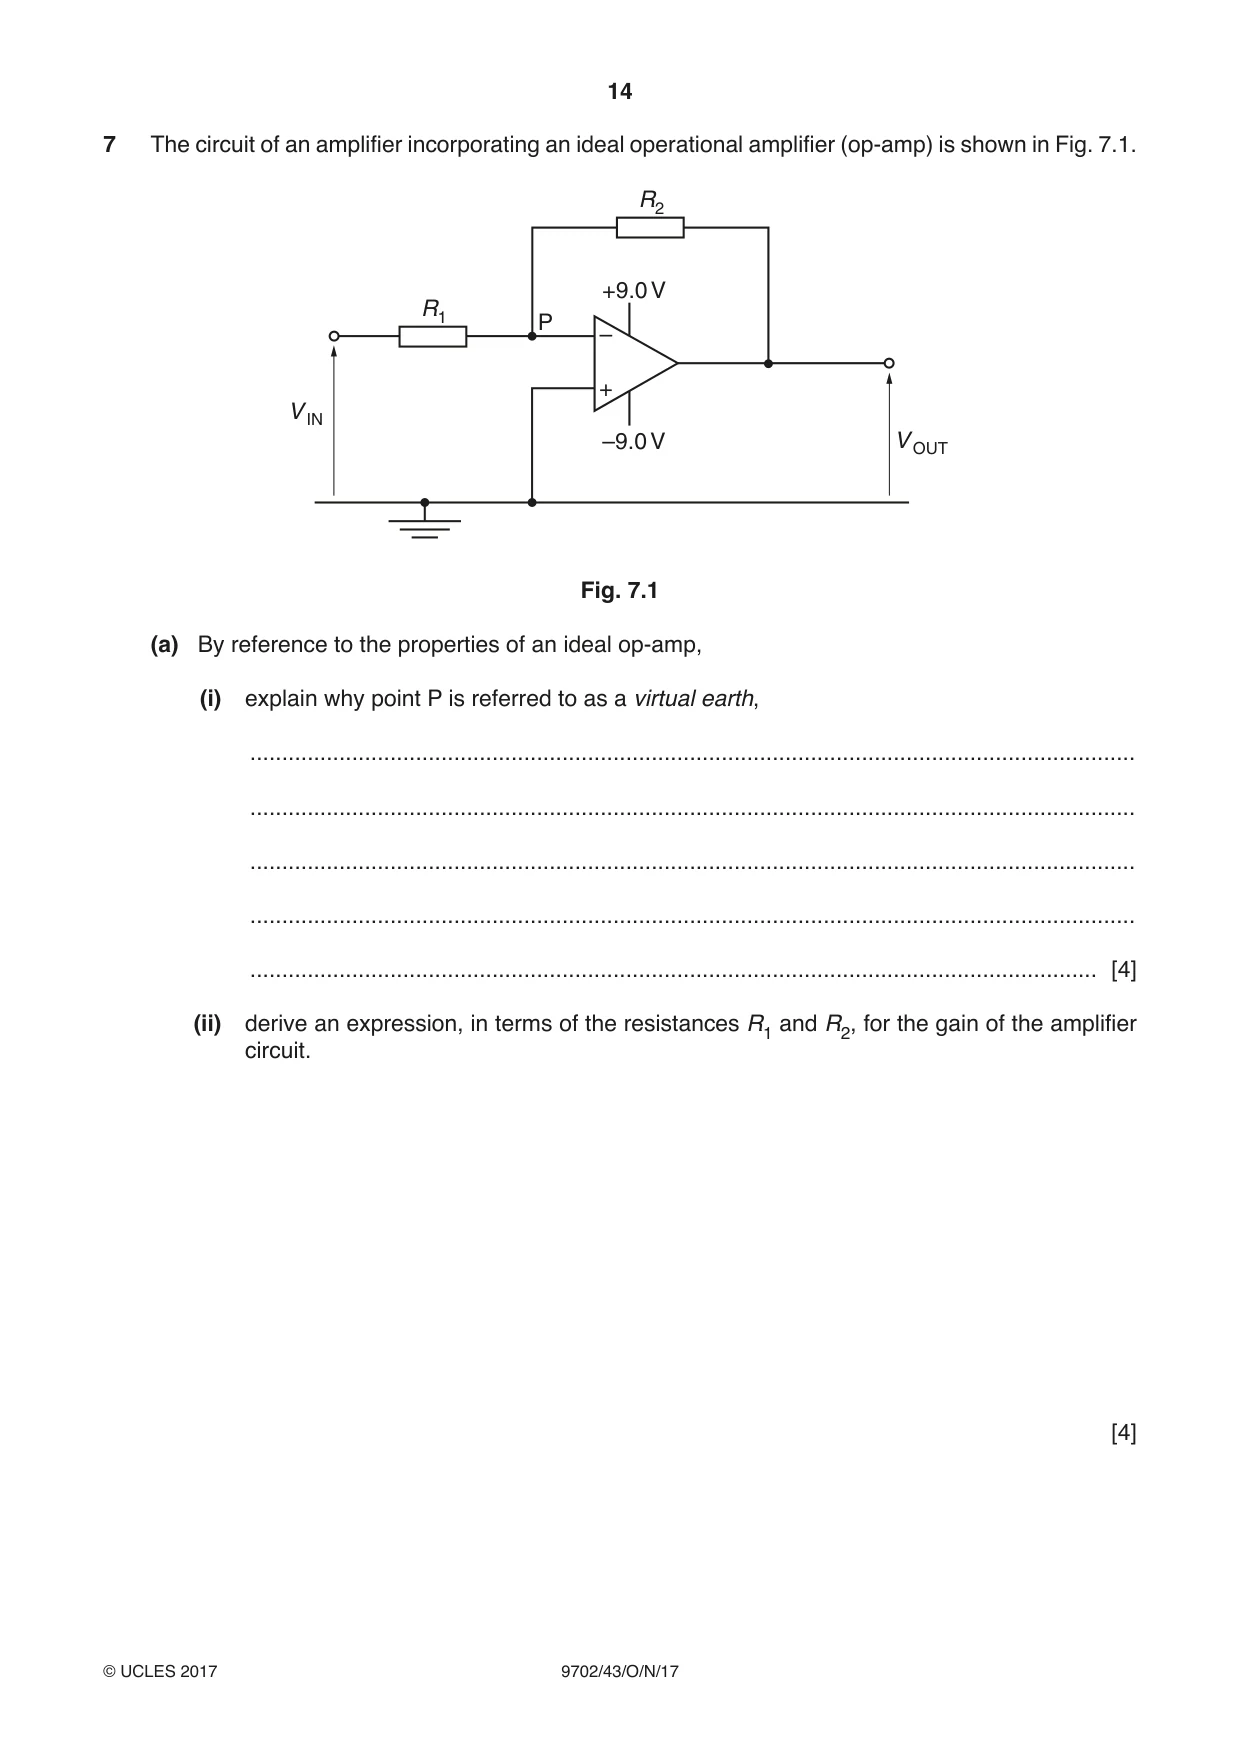
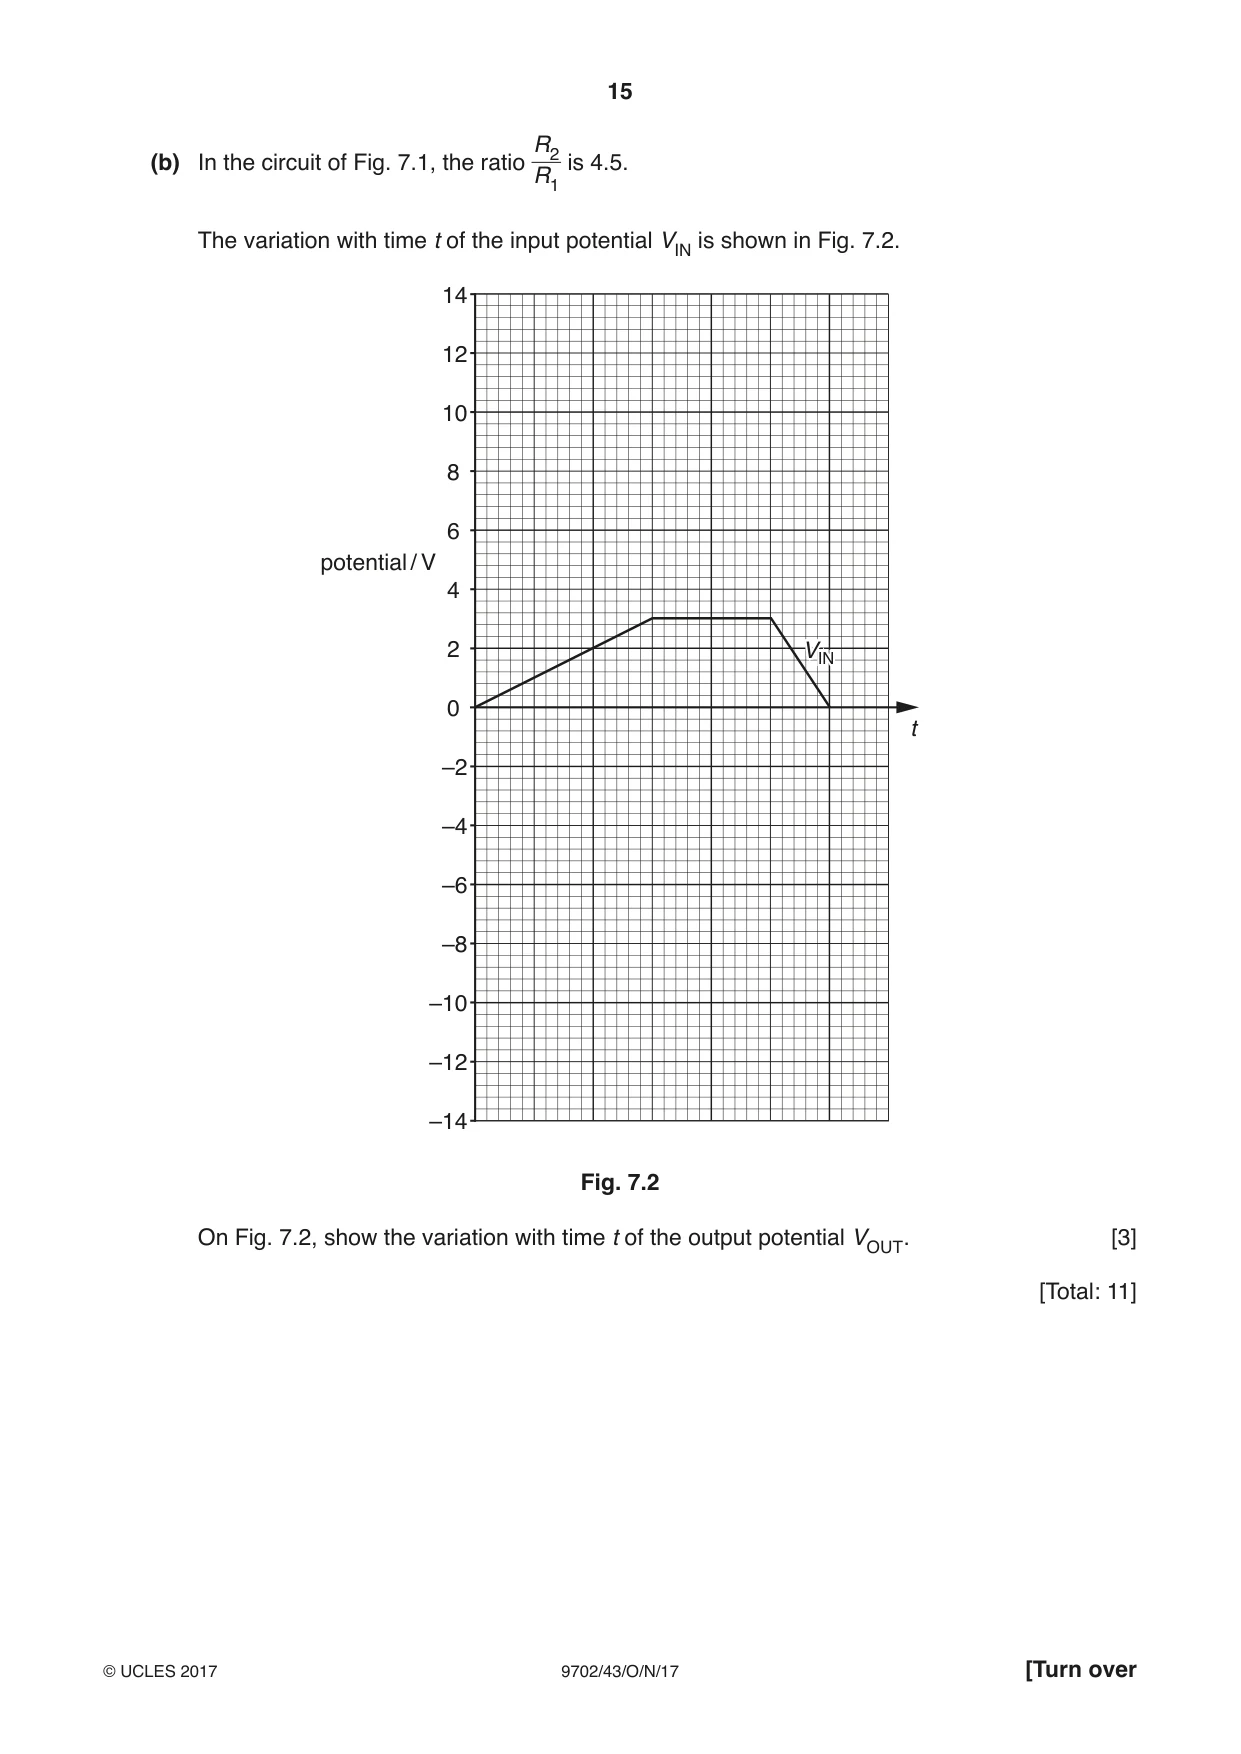
7 The circuit of an amplifier incorporating an ideal operational amplifier (op-amp) is shown in Fig. 7.1. R2 +9.0 V R1 P – + V IN –9.0 V V OUT Fig. 7.1 (a) By reference to the properties of an ideal op-amp, (i) explain why point P is referred to as a virtual earth, ........................................................................................................................................... ........................................................................................................................................... ........................................................................................................................................... ........................................................................................................................................... ..................................................................................................................................... [4] (ii) derive an expression, in terms of the resistances R1 and R2, for the gain of the amplifier circuit. [4] R2(b) In the circuit of Fig. 7.1, the ratio is 4.5. R1 The variation with time t of the input potential VIN is shown in Fig. 7.2. 14 12 10 8 6 potential / V 4 2 VINVIN 0 t –2 –4 –6 –8 –10 –12 –14 Fig. 7.2 On Fig. 7.2, show the variation with time t of the output potential VOUT. [3] [Total: 11]
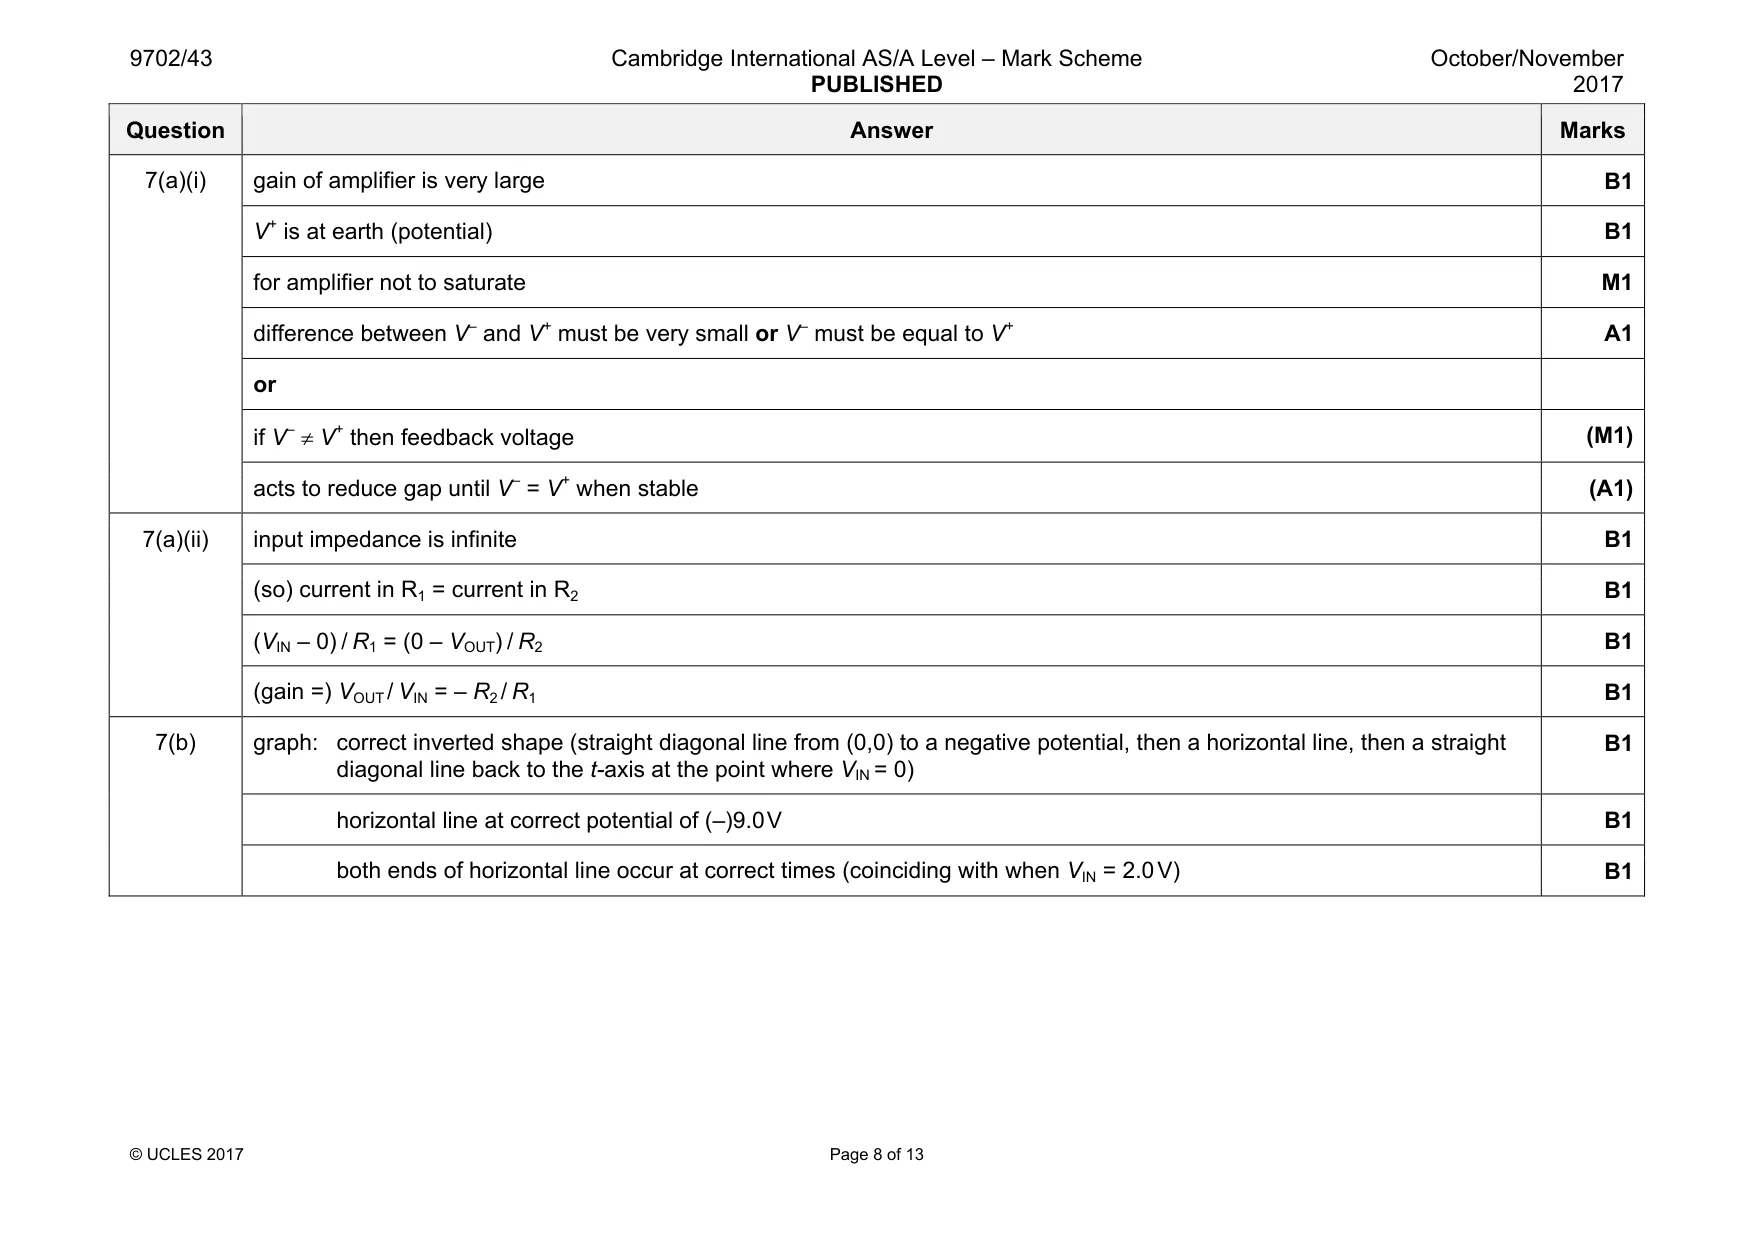
Mark scheme: 7(a)(i) gain of amplifier is very large B1 V+ is at earth (potential) B1 for amplifier not to saturate M1 difference between V– and V+ must be very small or V– must be equal to V+ A1 or if V– ≠ V+ then feedback voltage (M1) acts to reduce gap until V– = V+ when stable (A1) 7(a)(ii) input impedance is infinite B1 (so) current in R1 = current in R2 B1 (VIN – 0) / R1 = (0 – VOUT) / R2 B1 (gain =) VOUT / VIN = – R2 / R1 B1 7(b) graph: correct inverted shape (straight diagonal line from (0,0) to a negative potential, then a horizontal line, then a straight diagonal line back to the t-axis at the point where VIN = 0) B1 horizontal line at correct potential of (–)9.0 V B1 both ends of horizontal line occur at correct times (coinciding with when VIN = 2.0 V) B1
Q8 · A thin slice of conducting material is placed normal to a uniform magnetic field of flux…
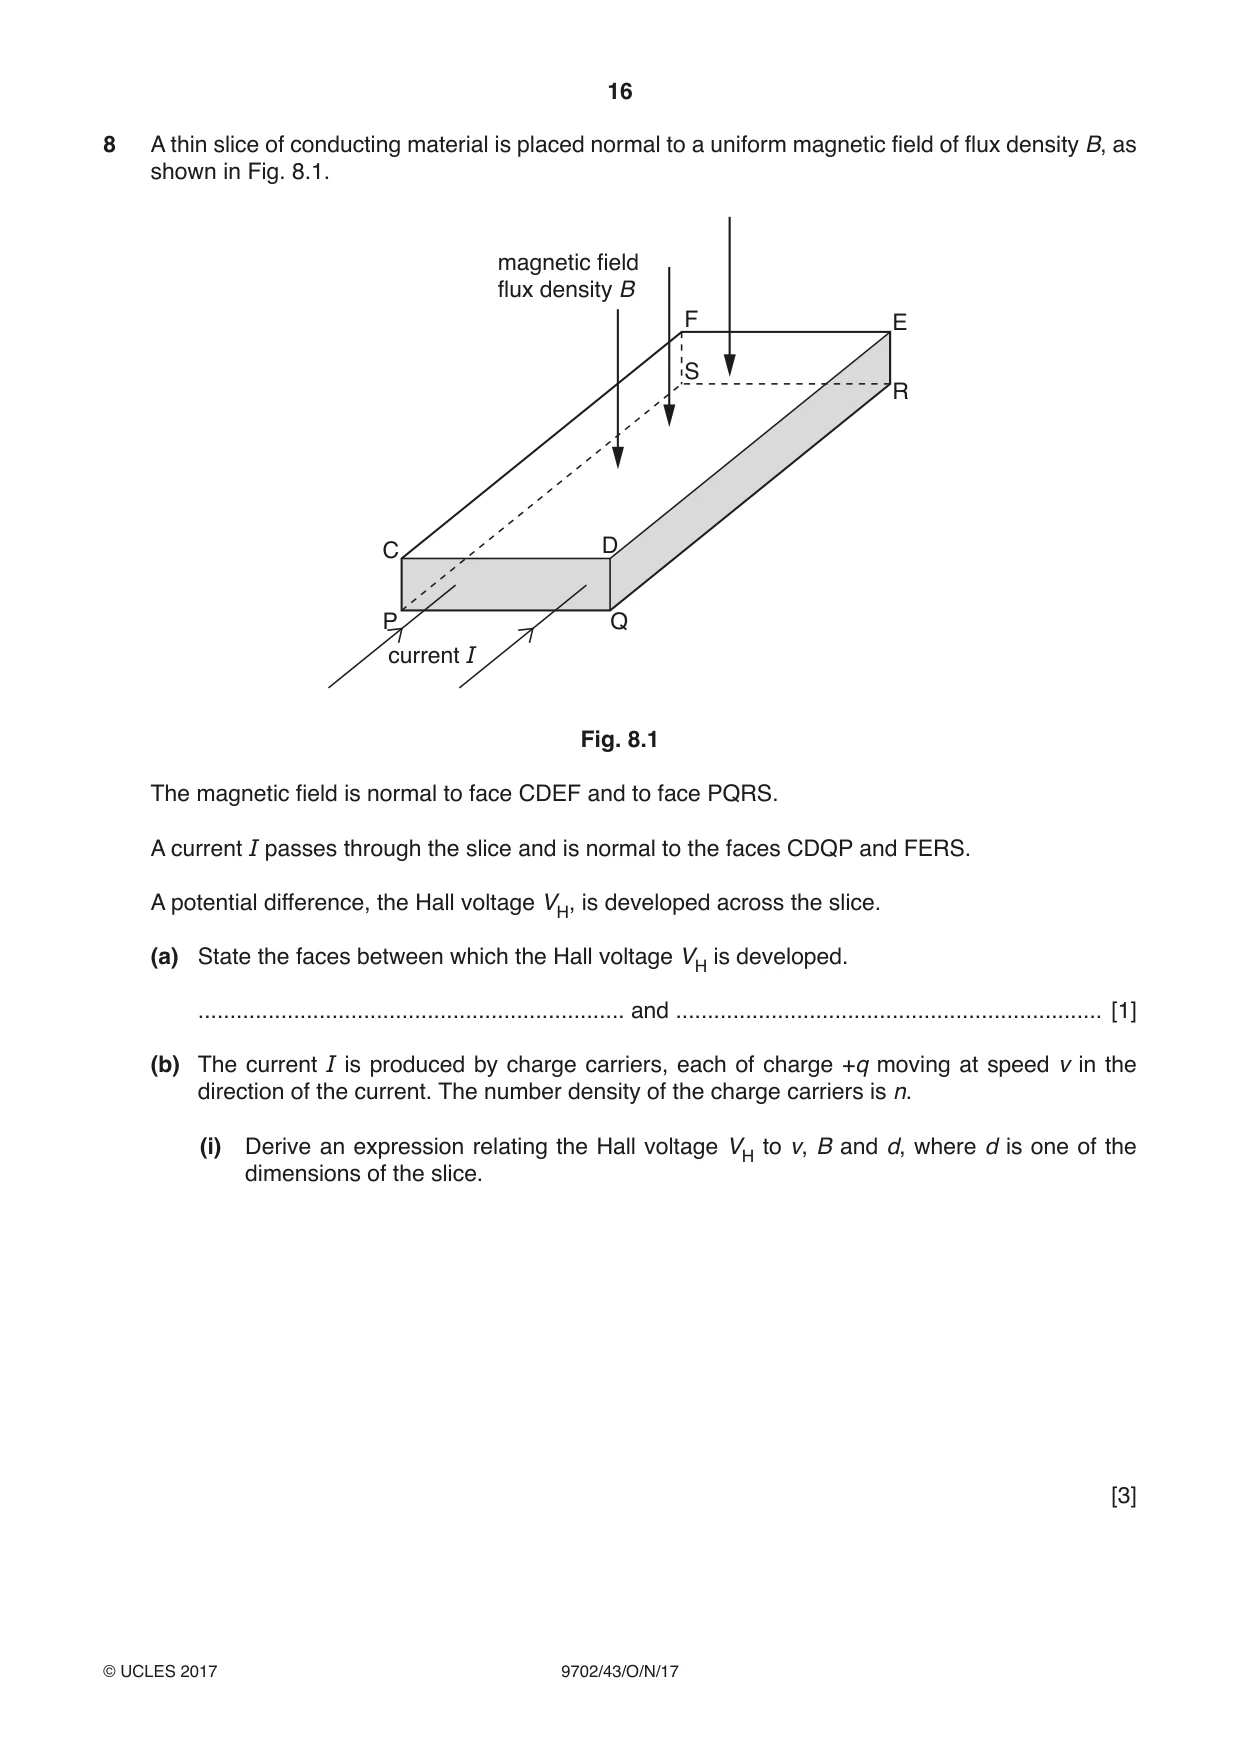
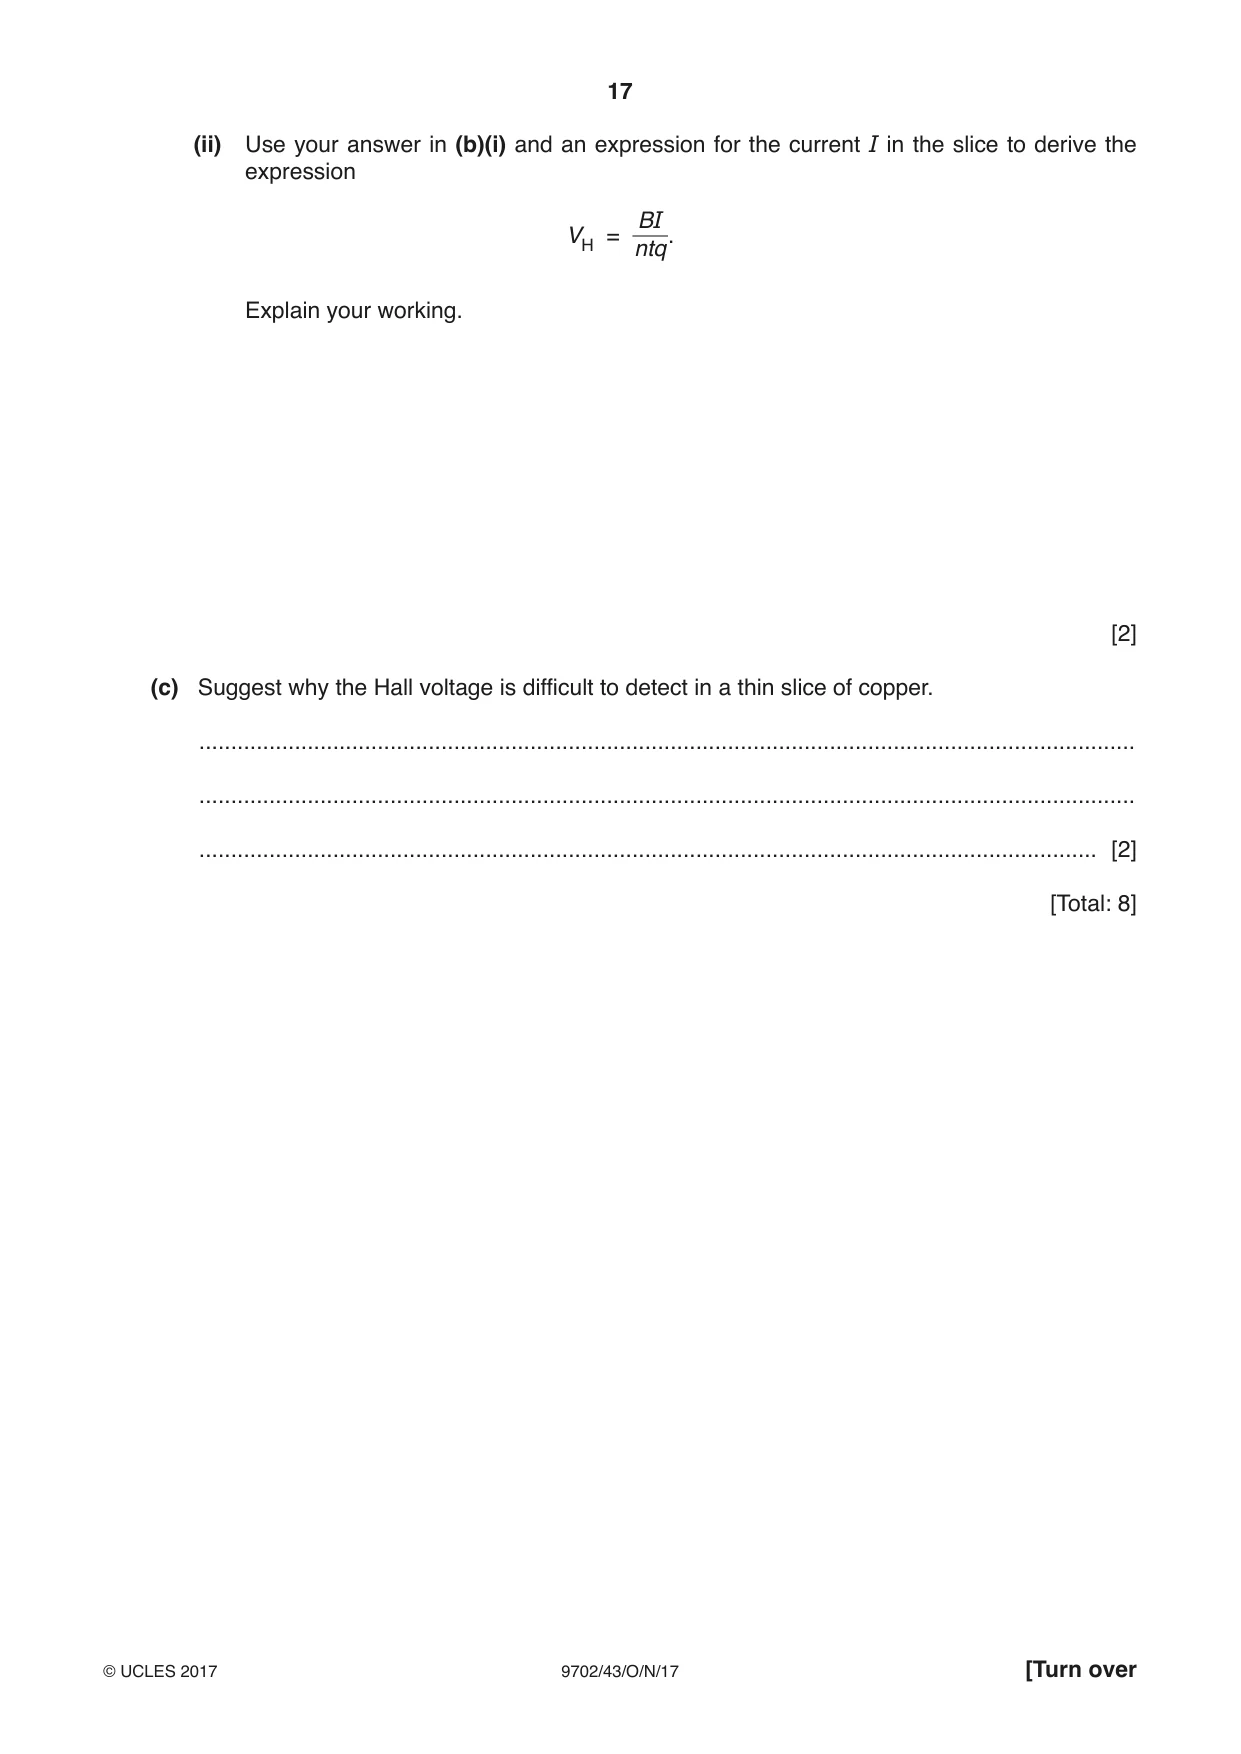
8 A thin slice of conducting material is placed normal to a uniform magnetic field of flux density B, as shown in Fig. 8.1. magnetic field flux density B F E S R C D P Q current I Fig. 8.1 The magnetic field is normal to face CDEF and to face PQRS. A current I passes through the slice and is normal to the faces CDQP and FERS. A potential difference, the Hall voltage VH, is developed across the slice. (a) State the faces between which the Hall voltage VH is developed. ................................................................... and ................................................................... [1] (b) The current I is produced by charge carriers, each of charge +q moving at speed v in the direction of the current. The number density of the charge carriers is n. (i) Derive an expression relating the Hall voltage VH to v, B and d, where d is one of the dimensions of the slice. [3] (ii) Use your answer in (b)(i) and an expression for the current I in the slice to derive the expression BI VH = ntq. Explain your working. [2] (c) Suggest why the Hall voltage is difficult to detect in a thin slice of copper. ................................................................................................................................................... ................................................................................................................................................... ............................................................................................................................................. [2] [Total: 8]
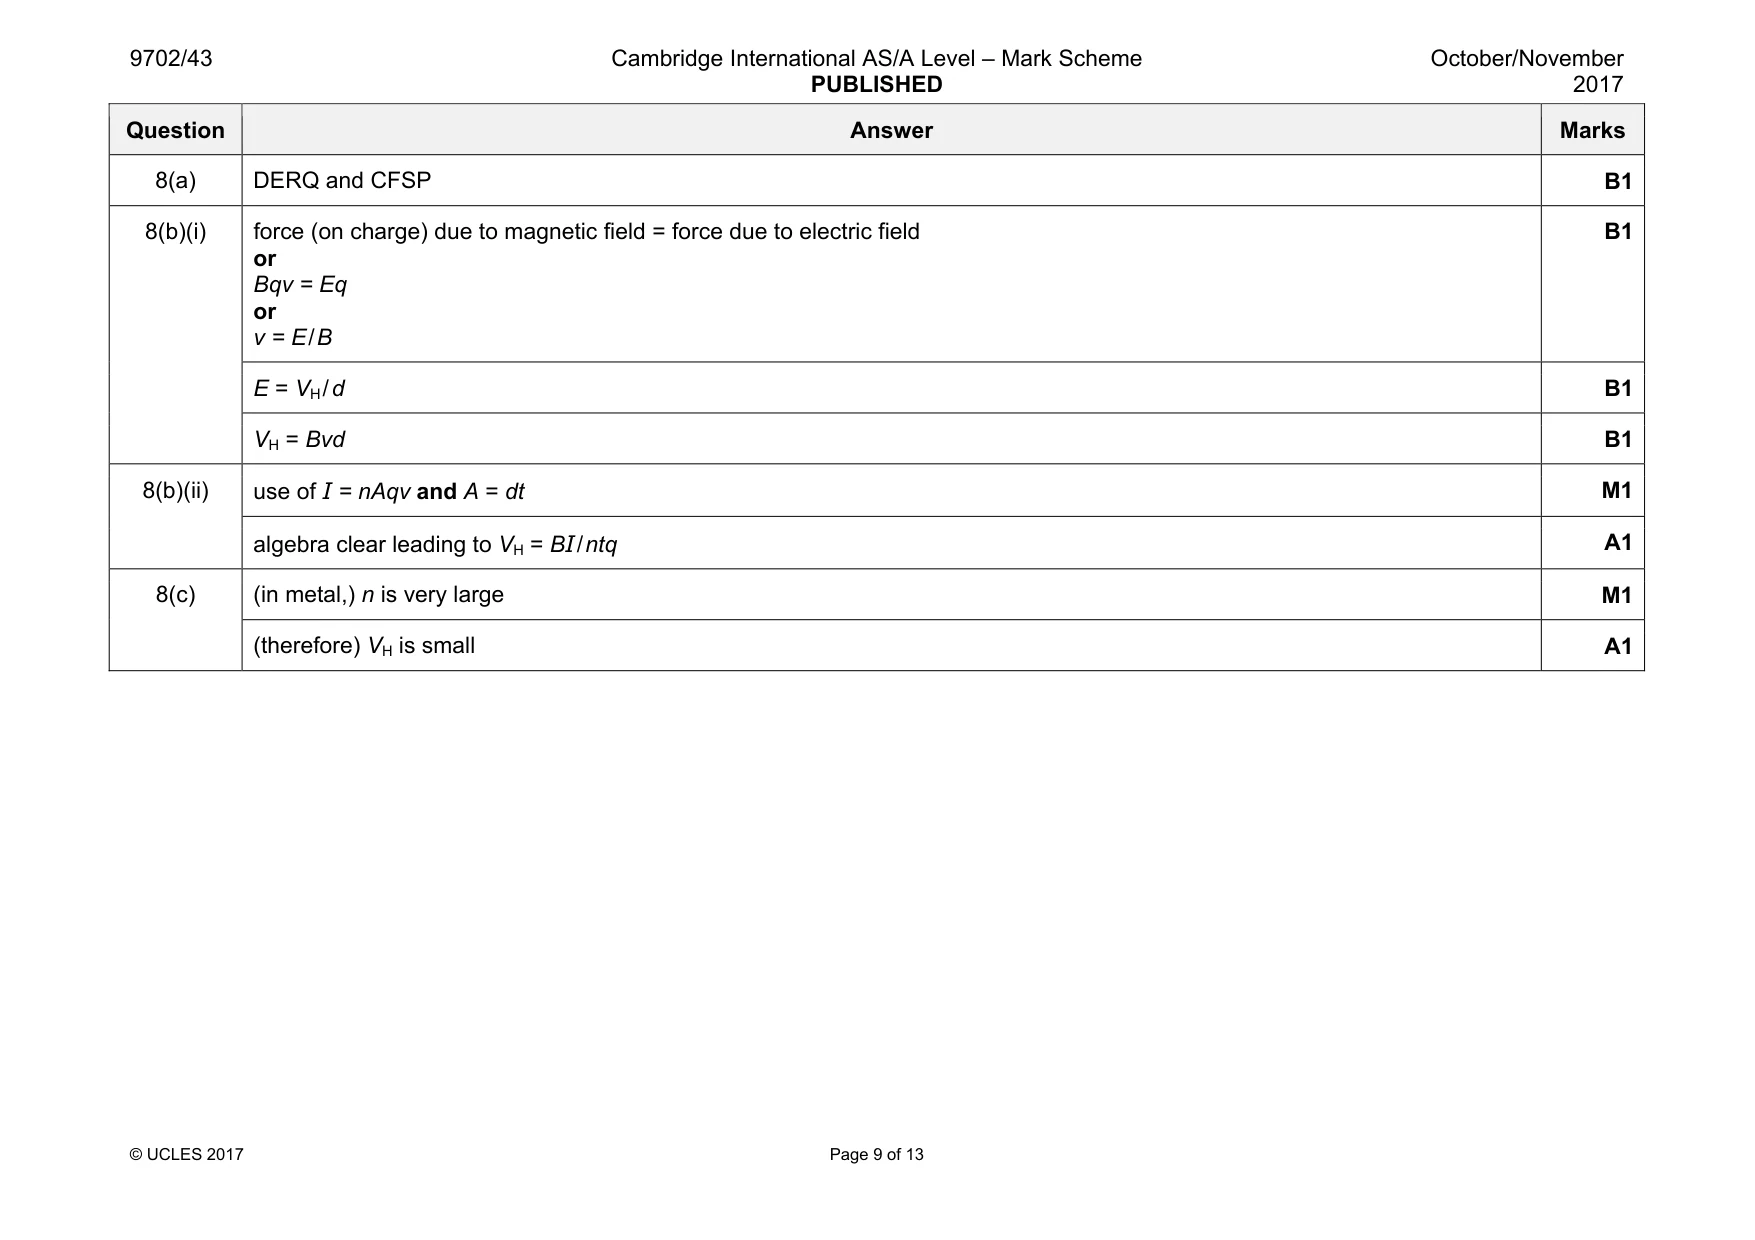
Mark scheme: 8(a) DERQ and CFSP B1 8(b)(i) force (on charge) due to magnetic field = force due to electric field or Bqv = Eq or v = E / B B1 E = VH / d B1 VH = Bvd B1 8(b)(ii) use of I = nAqv and A = dt M1 algebra clear leading to VH = BI / ntq A1 8(c) (in metal,) n is very large M1 (therefore) VH is small A1
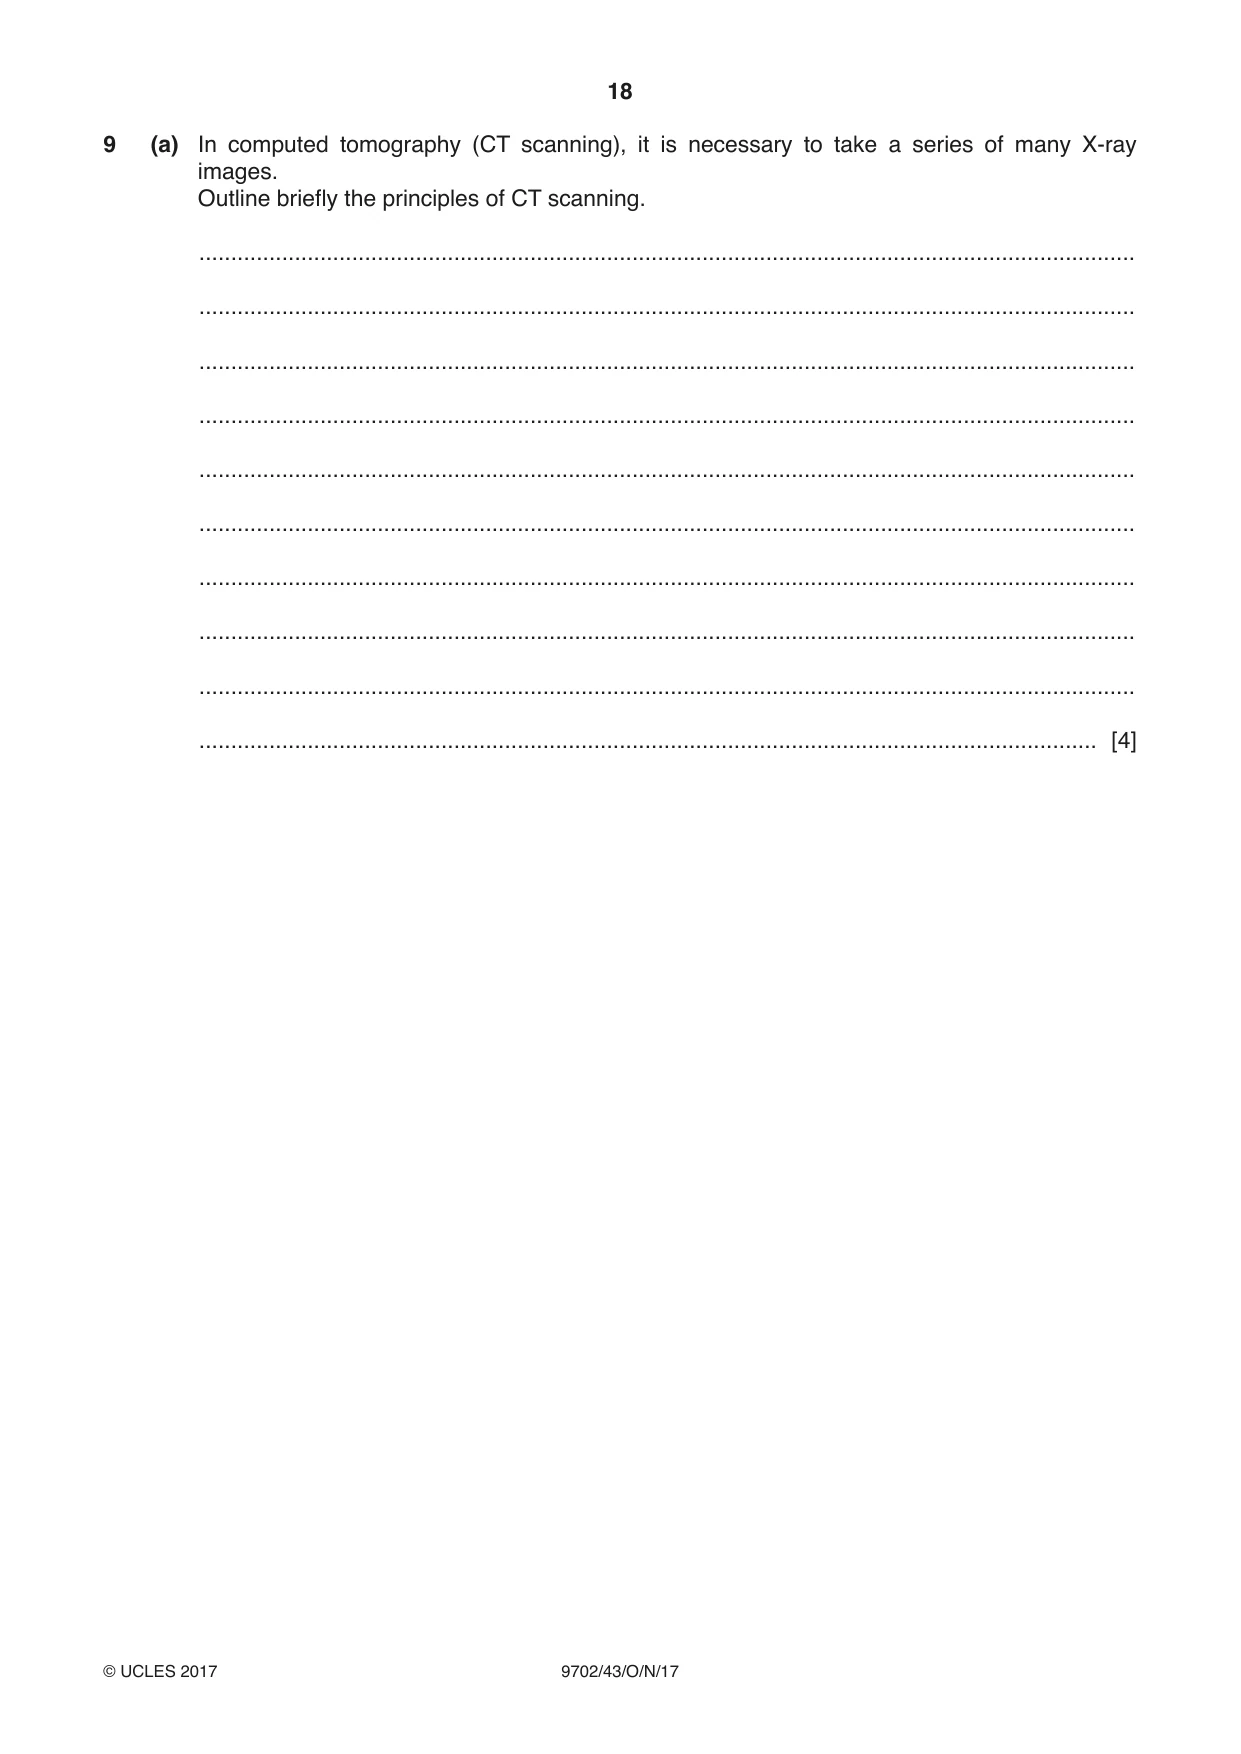
Q9 · In computed tomography (CT scanning), it is necessary to take a series of many X-ray…
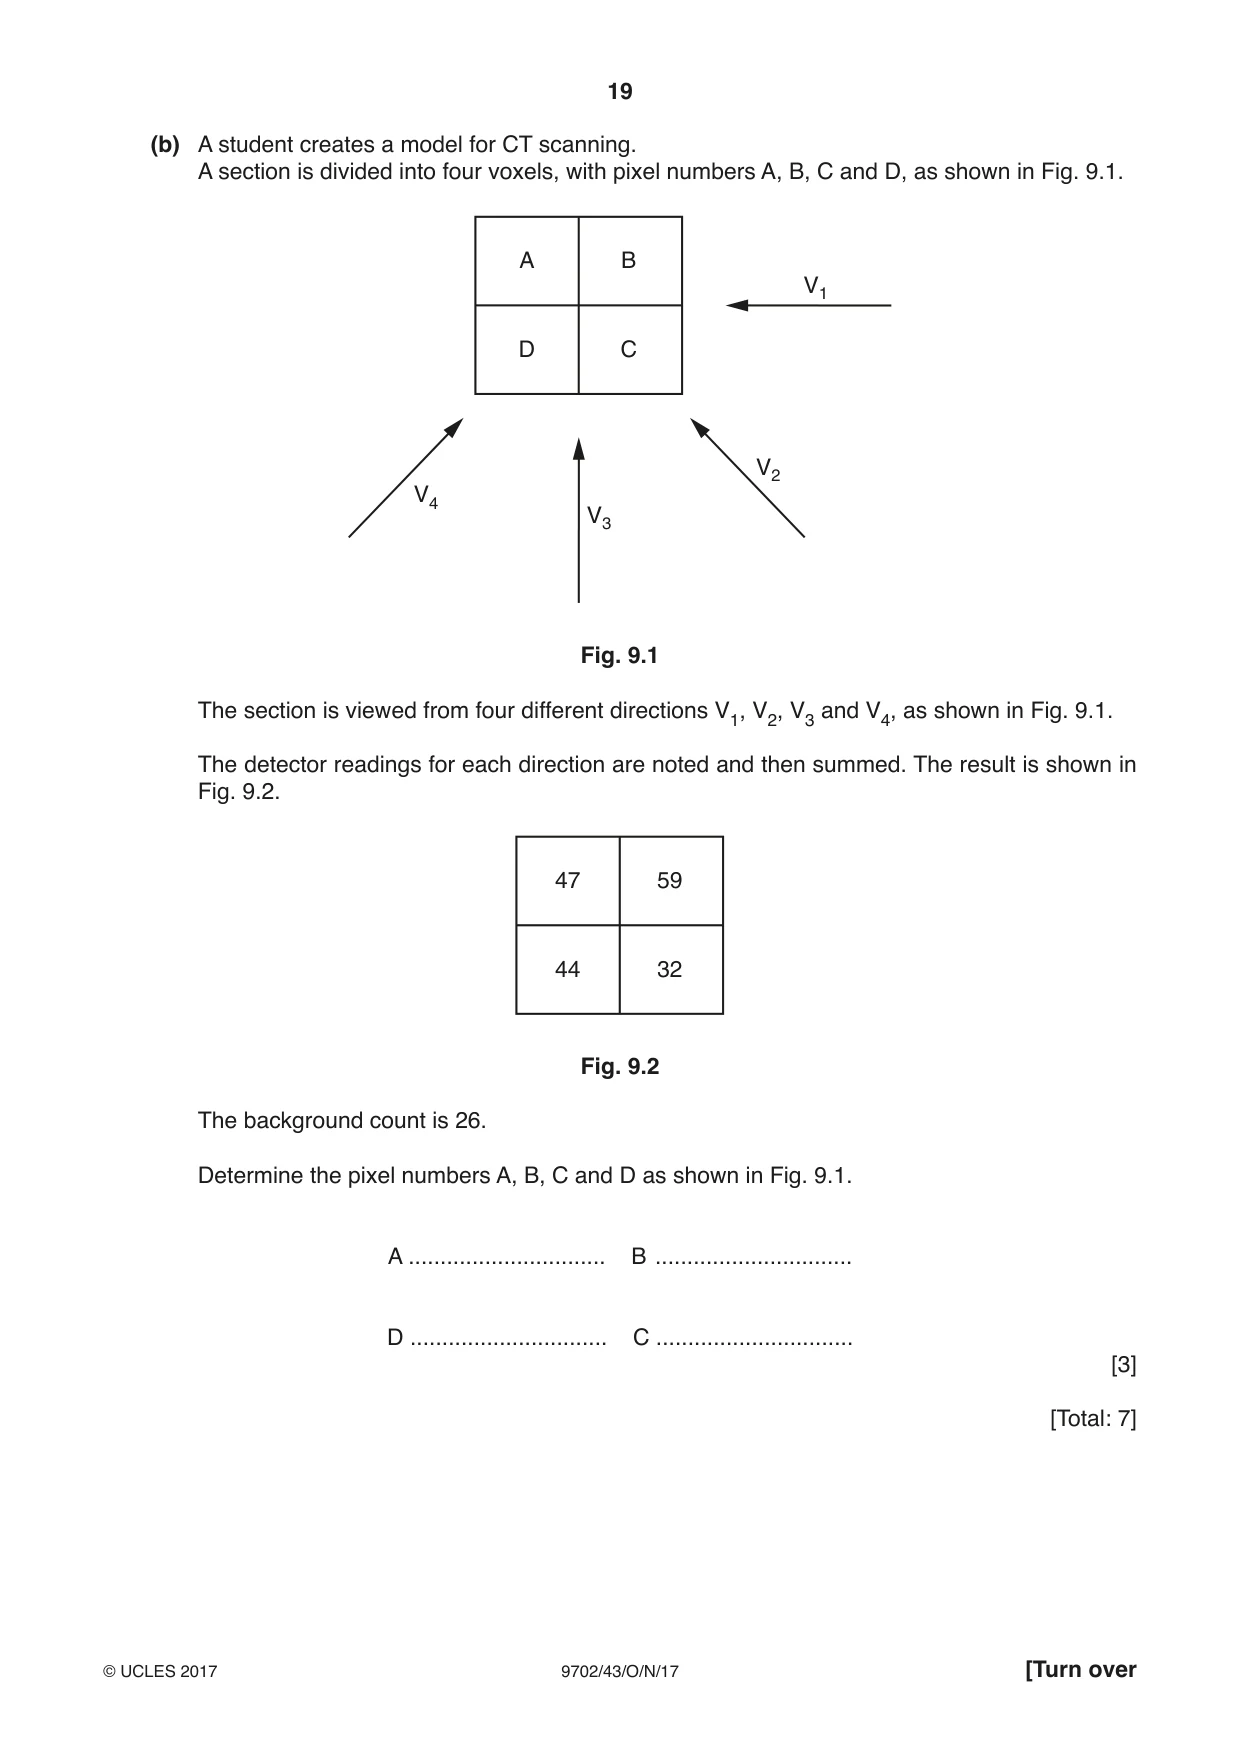
9 (a) In computed tomography (CT scanning), it is necessary to take a series of many X-ray images. Outline briefly the principles of CT scanning. ................................................................................................................................................... ................................................................................................................................................... ................................................................................................................................................... ................................................................................................................................................... ................................................................................................................................................... ................................................................................................................................................... ................................................................................................................................................... ................................................................................................................................................... ................................................................................................................................................... ............................................................................................................................................. [4] (b) A student creates a model for CT scanning. A section is divided into four voxels, with pixel numbers A, B, C and D, as shown in Fig. 9.1. A B V1 D C V2 V4 V3 Fig. 9.1 The section is viewed from four different directions V1, V2, V3 and V4, as shown in Fig. 9.1. The detector readings for each direction are noted and then summed. The result is shown in Fig. 9.2. 47 59 44 32 Fig. 9.2 The background count is 26. Determine the pixel numbers A, B, C and D as shown in Fig. 9.1. A ............................... B ............................... D ............................... C ............................... [3] [Total: 7]
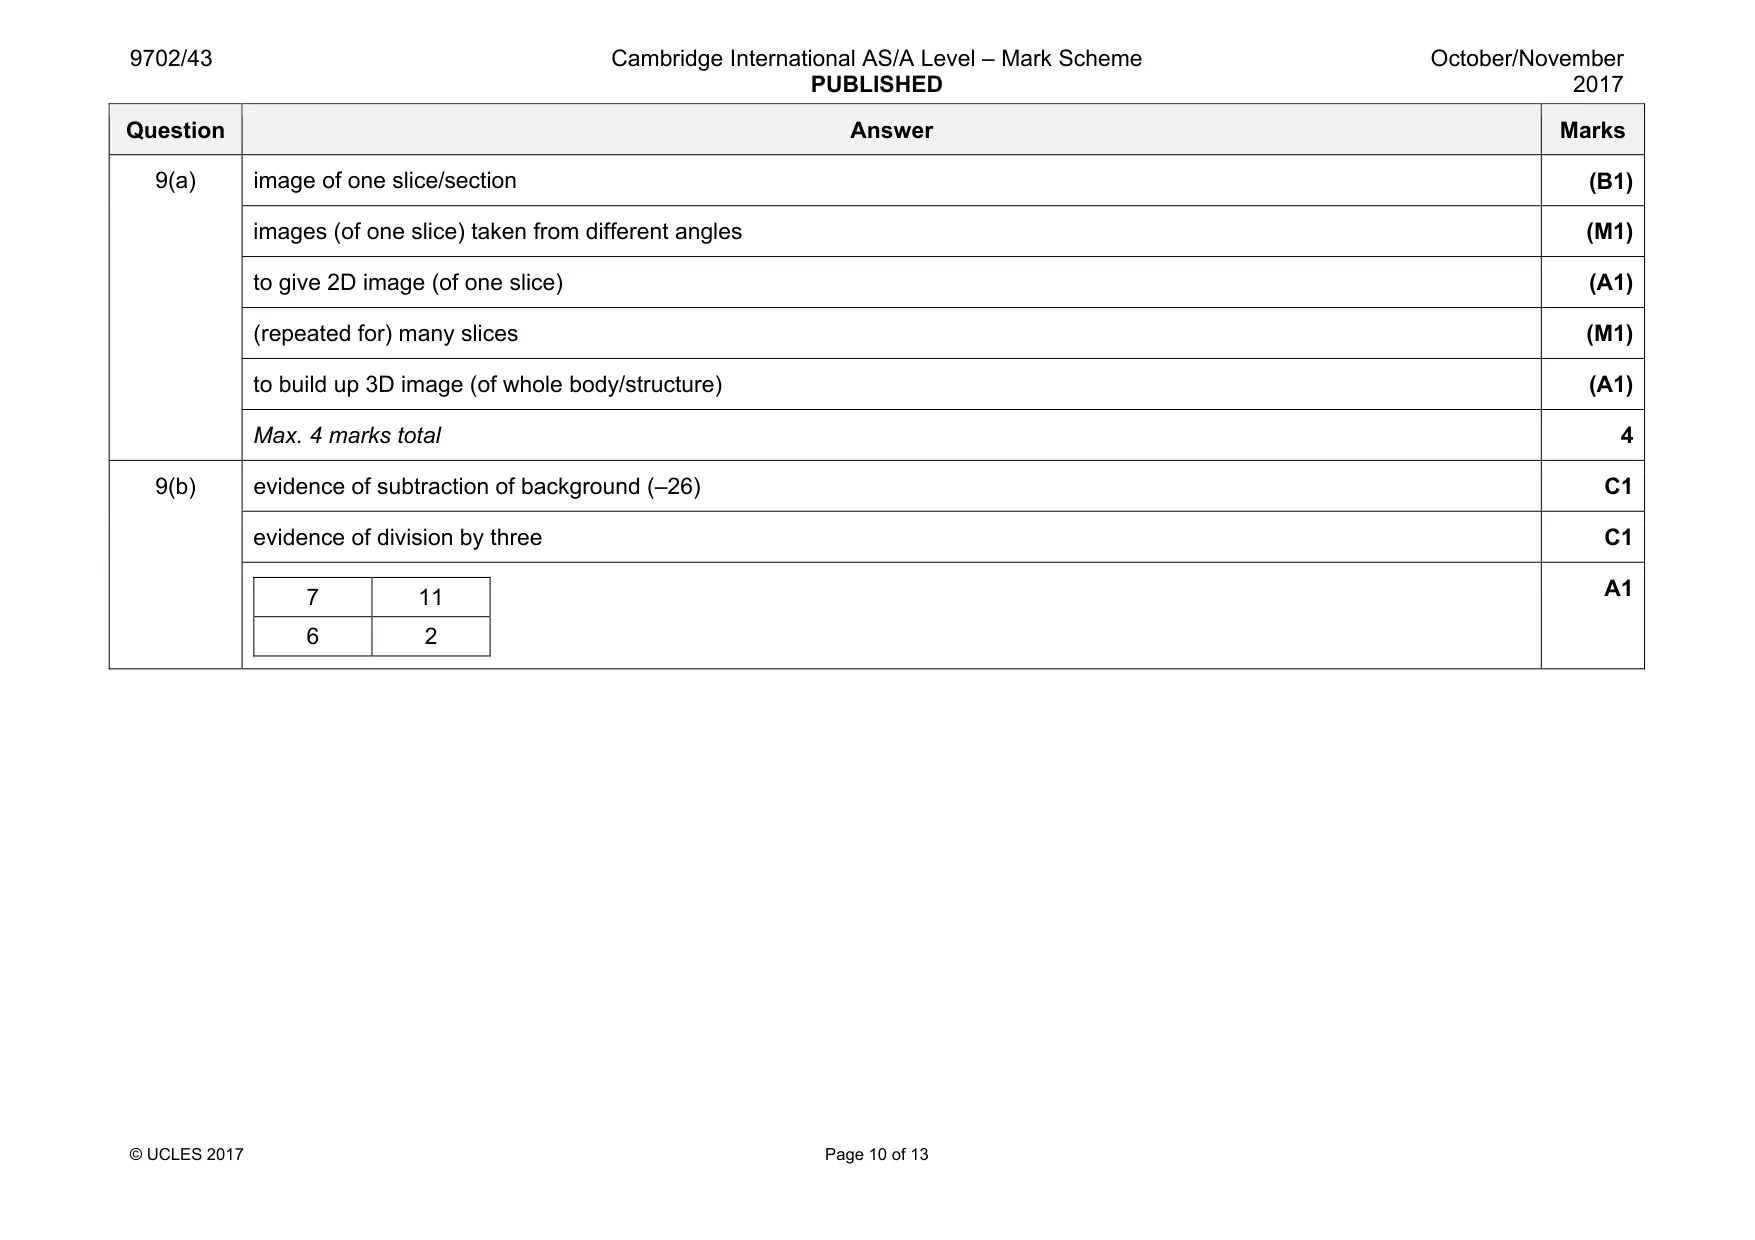
Mark scheme: 9(a) image of one slice/section (B1) images (of one slice) taken from different angles (M1) to give 2D image (of one slice) (A1) (repeated for) many slices (M1) to build up 3D image (of whole body/structure) (A1) Max. 4 marks total 4 9(b) evidence of subtraction of background (–26) C1 evidence of division by three C1 7 11 6 2 A1
Q10 · The mean value of an alternating current is zero
10 (a) The mean value of an alternating current is zero. Explain why heating occurs when there is an alternating current in a resistor. ................................................................................................................................................... ................................................................................................................................................... ................................................................................................................................................... ............................................................................................................................................. [2] (b) Transmission of electrical energy is frequently achieved using alternating high voltages. Suggest why (i) high voltages are used, ........................................................................................................................................... ........................................................................................................................................... ........................................................................................................................................... ..................................................................................................................................... [2] (ii) the voltage is alternating. ........................................................................................................................................... ........................................................................................................................................... ........................................................................................................................................... ..................................................................................................................................... [2] [Total: 6]
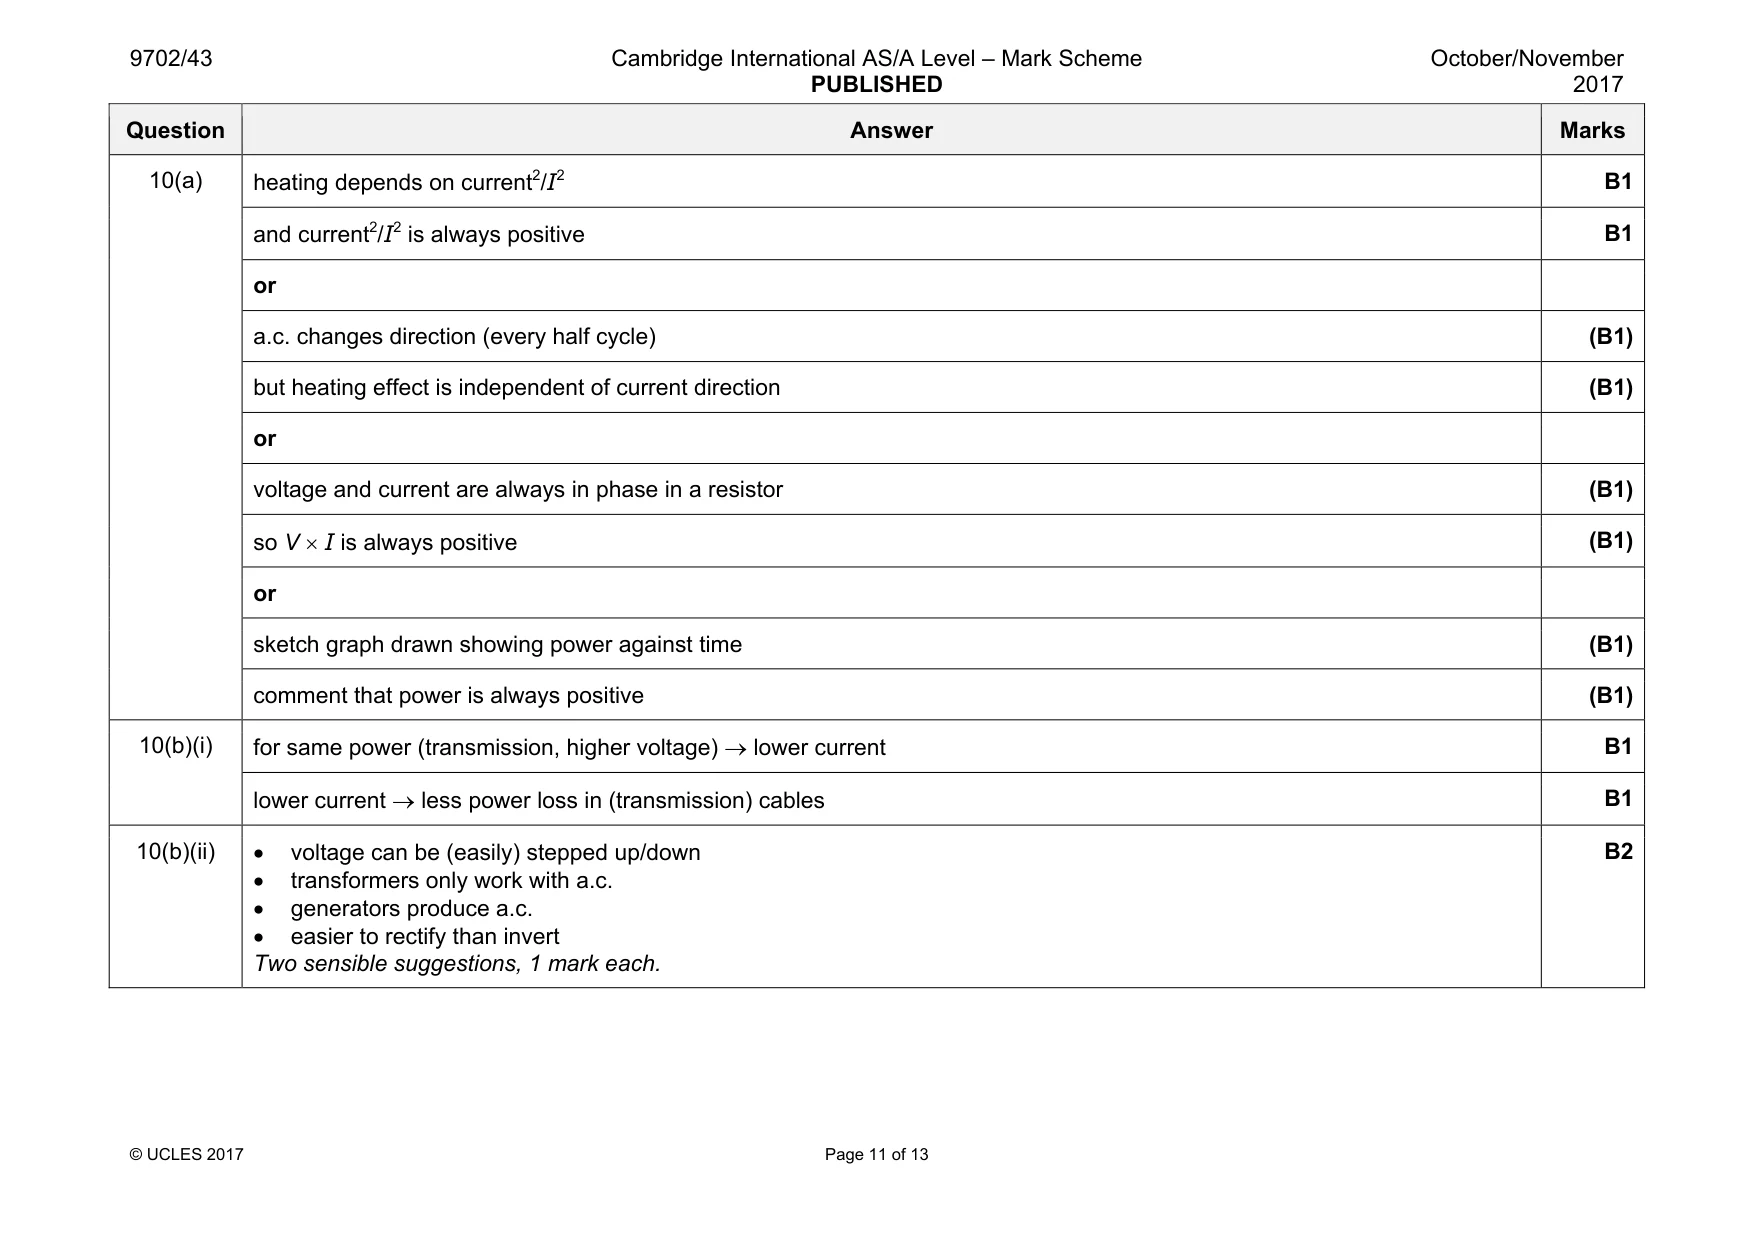
Mark scheme: 10(a) B1 and current2/I2 is always positive B1 or a.c. changes direction (every half cycle) (B1) but heating effect is independent of current direction (B1) or voltage and current are always in phase in a resistor (B1) so V × I is always positive (B1) or sketch graph drawn showing power against time (B1) comment that power is always positive (B1) 10(b)(i) for same power (transmission, higher voltage) → lower current B1 lower current → less power loss in (transmission) cables B1 10(b)(ii) • voltage can be (easily) stepped up/down • transformers only work with a.c. • generators produce a.c. • easier to rectify than invert Two sensible suggestions, 1 mark each. B2
Q11 · State what is meant by a photon
11 (a) State what is meant by a photon. ................................................................................................................................................... ............................................................................................................................................. [1] (b) Indium-123 (12349In) is radioactive. A nucleus of indium-123 emits a γ-ray photon of energy 1.1 MeV. Determine, for this γ-radiation, (i) the frequency, frequency = ................................................... Hz [2] (ii) the momentum of a photon. momentum = ................................................... N s [2] (c) The indium-123 nucleus is stationary before emission of the γ-ray photon. Use your answer in (b)(ii) to estimate the recoil speed of the nucleus after emission of the photon. speed = ................................................ m s−1 [2] [Total: 7]
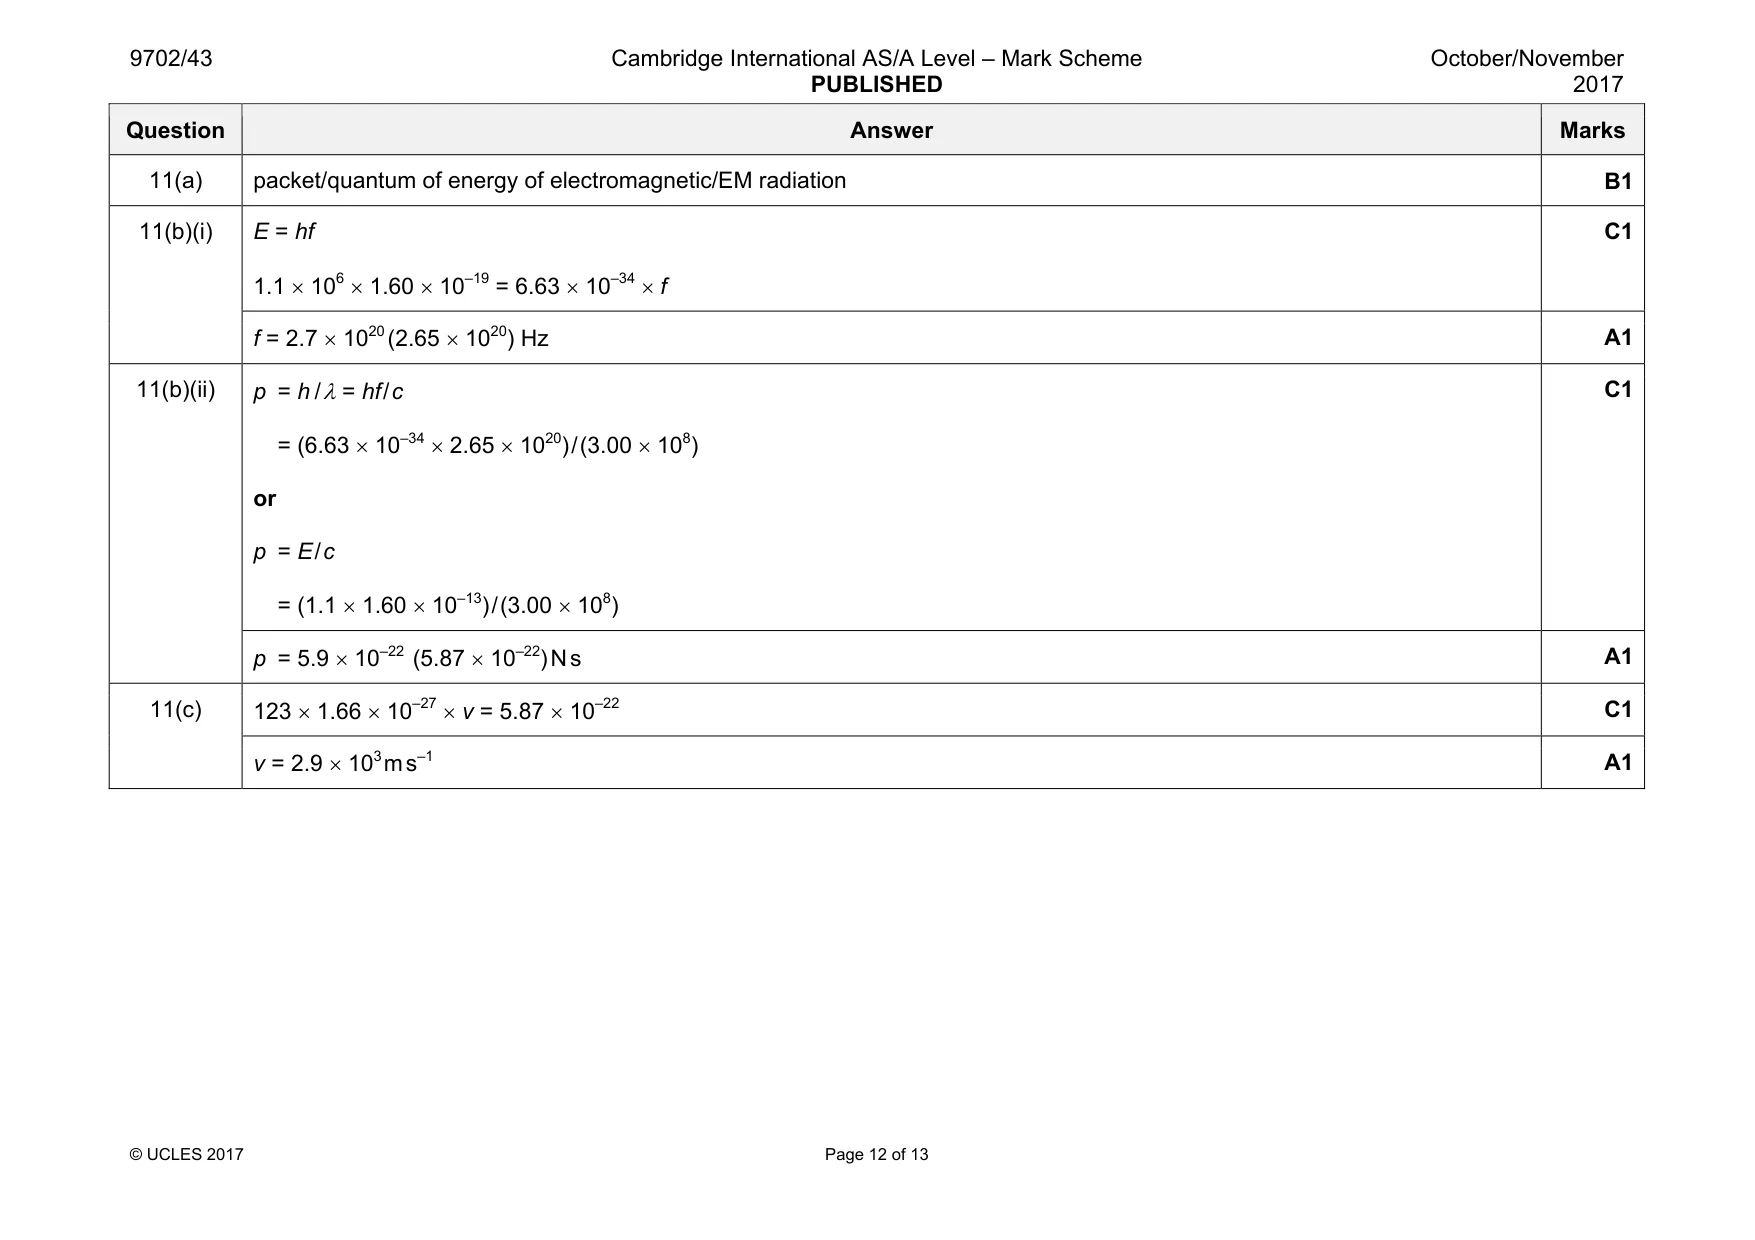
Mark scheme: 11(a) packet/quantum of energy of electromagnetic/EM radiation B1 11(b)(i) E = hf 1.1 × 106 × 1.60 × 10–19 = 6.63 × 10⁻³⁴ × f C1 f = 2.7 × 10²⁰ (2.65 × 10²⁰) Hz A1 11(b)(ii) p = h / λ = hf / c = (6.63 × 10–34 × 2.65 × 1020) / (3.00 × 10⁸) or p = E / c = (1.1 × 1.60 × 10–13) / (3.00 × 10⁸) C1 p = 5.9 × 10⁻²² (5.87 × 10⁻²²) N s A1 11(c) 123 × 1.66 × 10–27 × v = 5.87 × 10⁻²² C1 v = 2.9 × 10³ m s–1 A1
Q12 · A radiation detector is placed close to a radioactive source
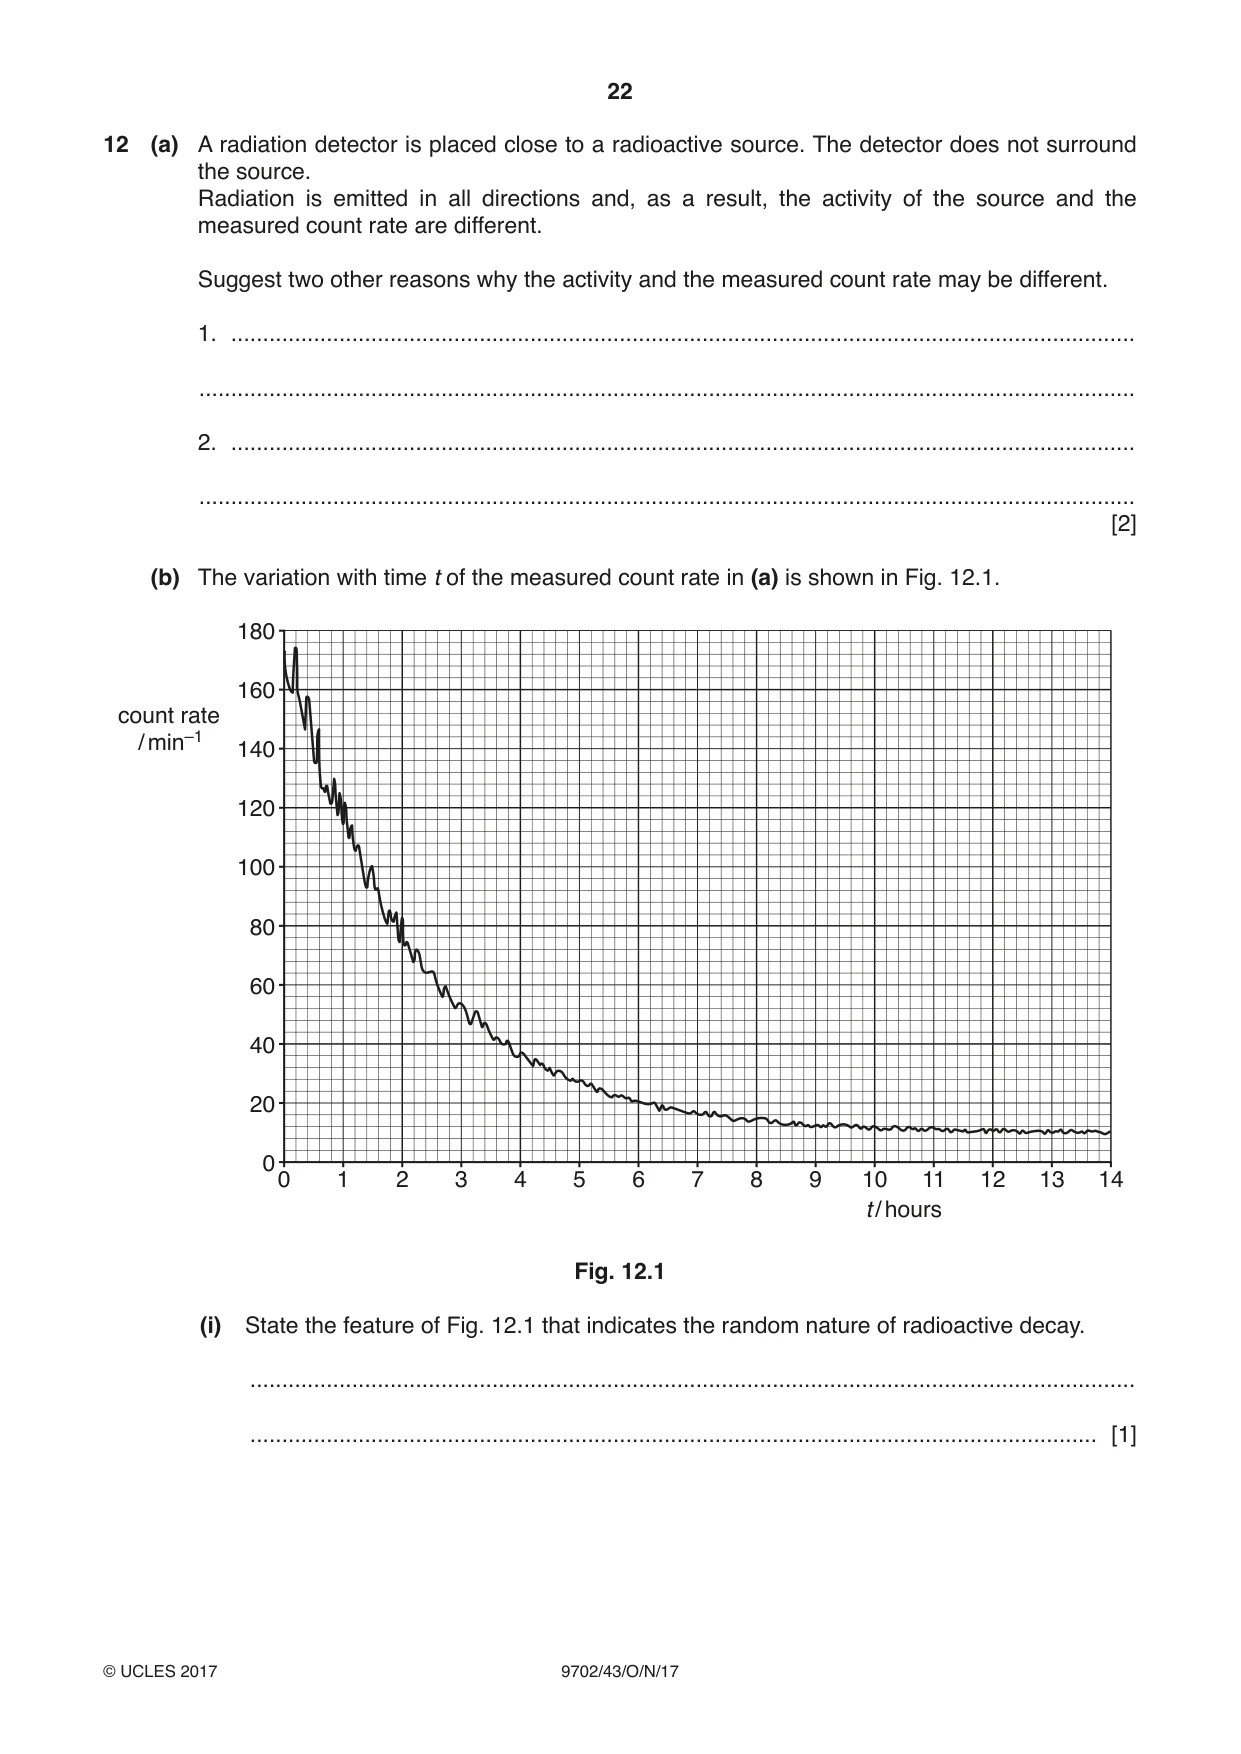
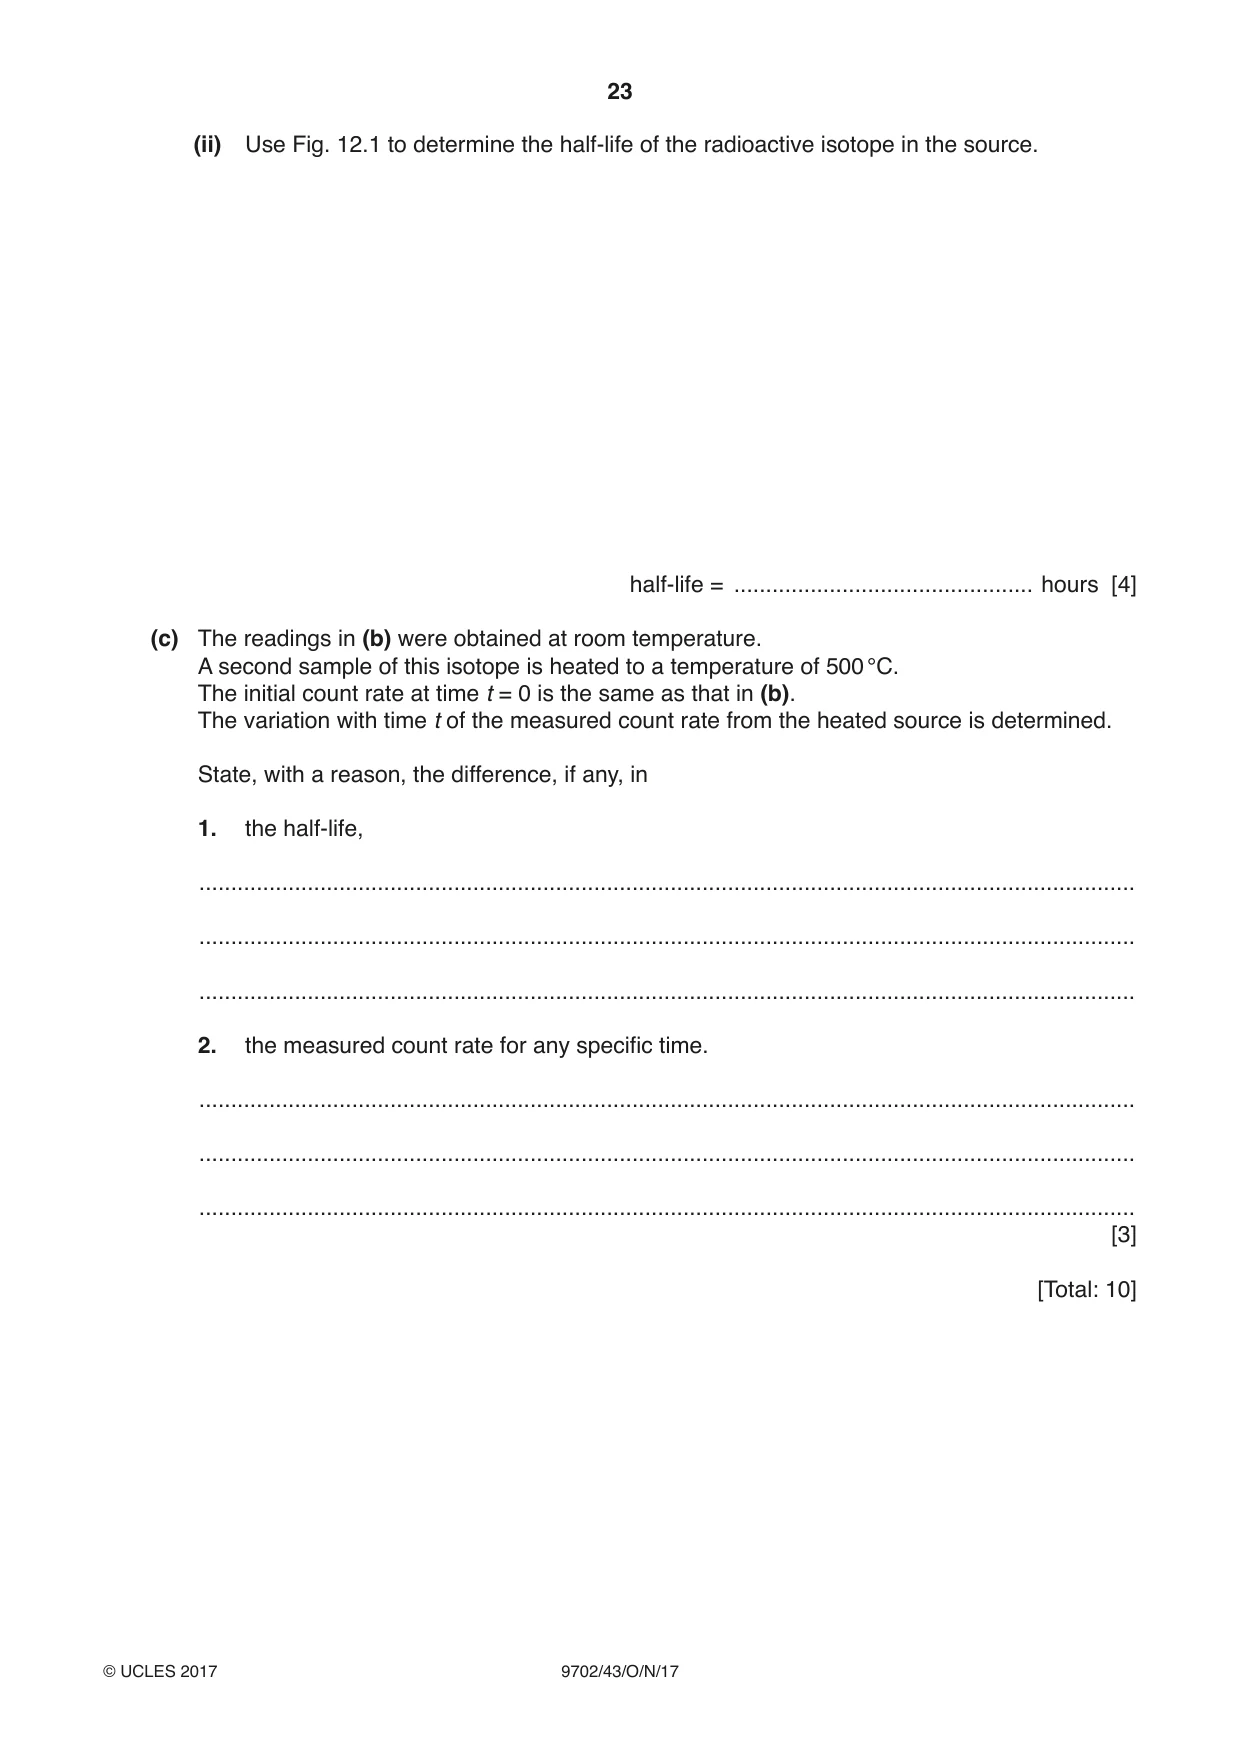
12 (a) A radiation detector is placed close to a radioactive source. The detector does not surround the source. Radiation is emitted in all directions and, as a result, the activity of the source and the measured count rate are different. Suggest two other reasons why the activity and the measured count rate may be different. 1. .............................................................................................................................................. ................................................................................................................................................... 2. .............................................................................................................................................. ................................................................................................................................................... [2] (b) The variation with time t of the measured count rate in (a) is shown in Fig. 12.1. 180 160 count rate / min–1 140 120 100 80 60 40 20 0 0 1 2 3 4 5 6 7 8 9 10 11 12 13 14 t / hours Fig. 12.1 (i) State the feature of Fig. 12.1 that indicates the random nature of radioactive decay. ........................................................................................................................................... ..................................................................................................................................... [1] (ii) Use Fig. 12.1 to determine the half-life of the radioactive isotope in the source. half-life = ............................................... hours [4] (c) The readings in (b) were obtained at room temperature. A second sample of this isotope is heated to a temperature of 500 °C. The initial count rate at time t = 0 is the same as that in (b). The variation with time t of the measured count rate from the heated source is determined. State, with a reason, the difference, if any, in 1. the half-life, ................................................................................................................................................... ................................................................................................................................................... ................................................................................................................................................... 2. the measured count rate for any specific time. ................................................................................................................................................... ................................................................................................................................................... ................................................................................................................................................... [3] [Total: 10]
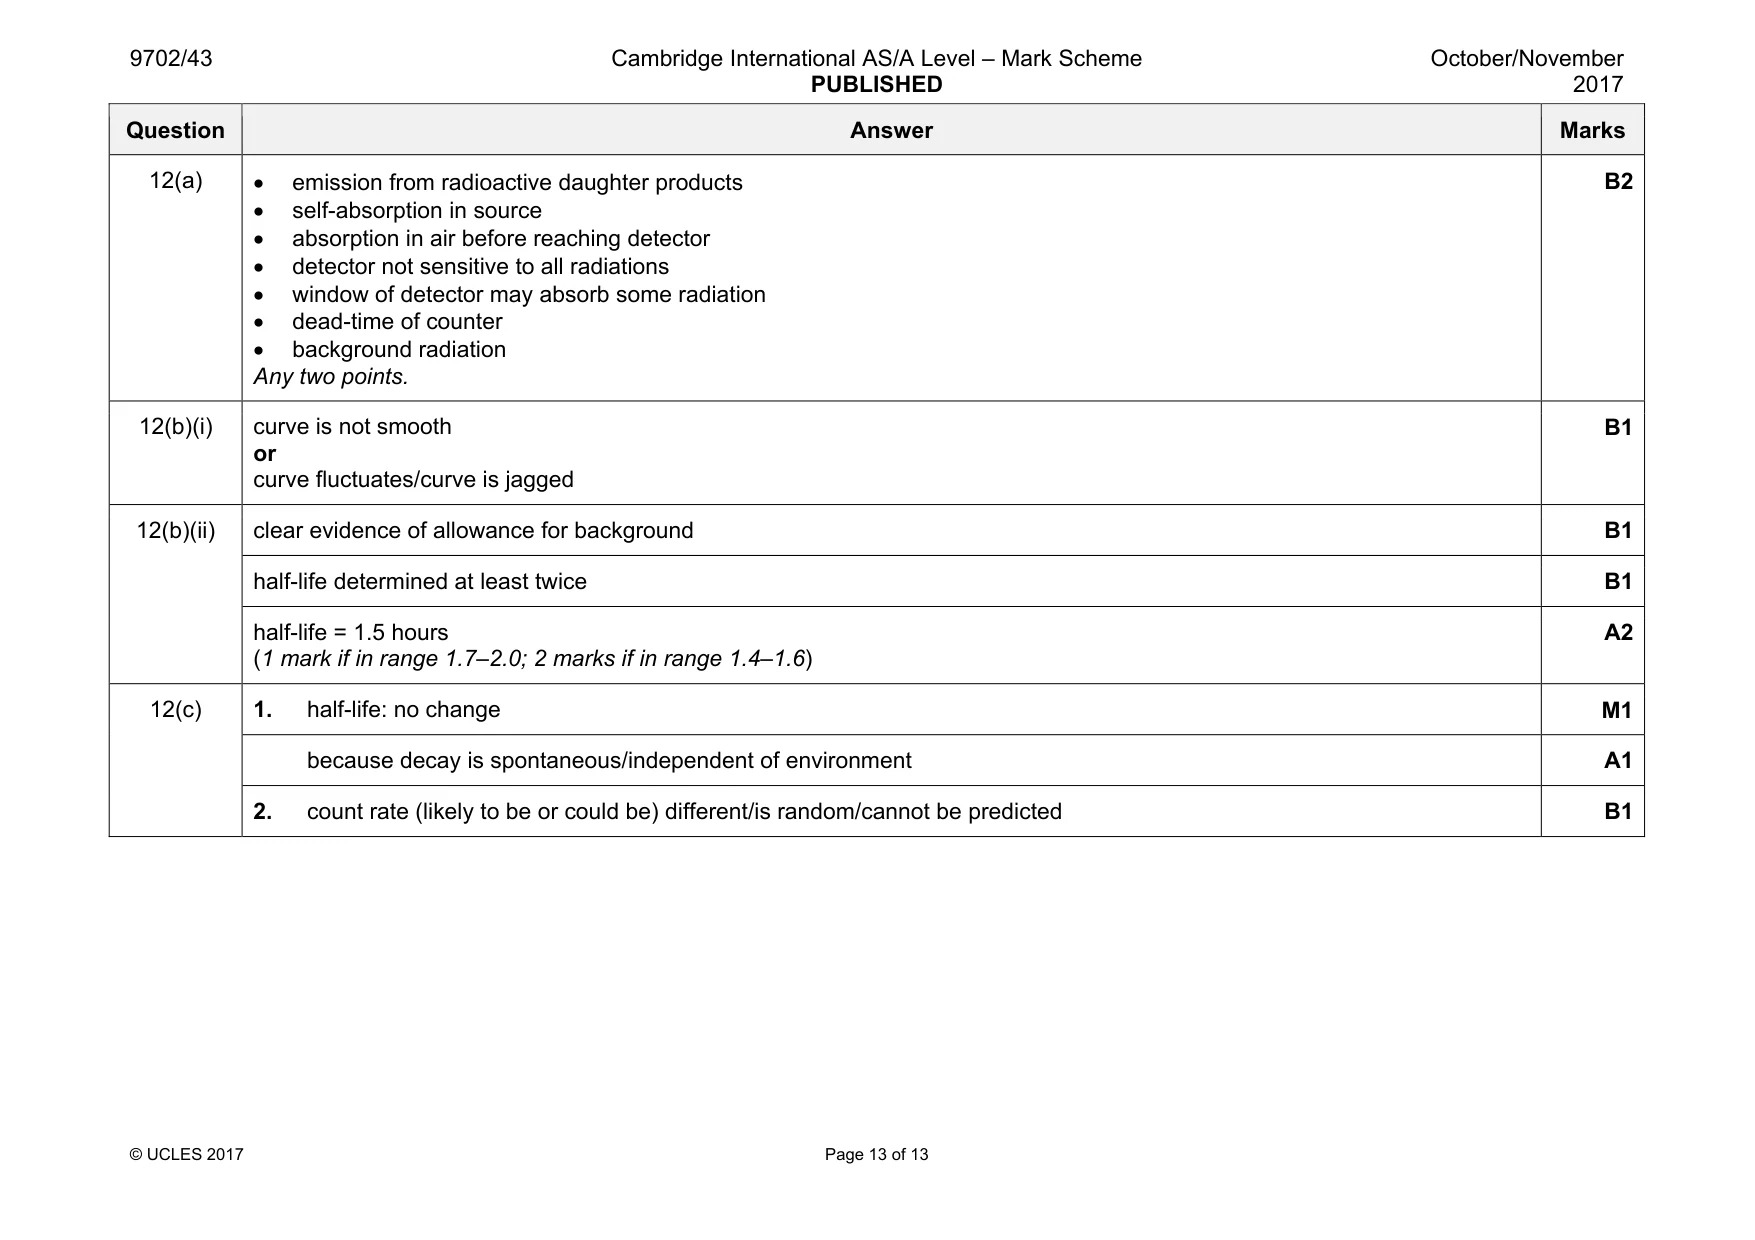
Mark scheme: 12(a) emission from radioactive daughter products • self-absorption in source • absorption in air before reaching detector • detector not sensitive to all radiations • window of detector may absorb some radiation • dead-time of counter • background radiation Any two points. B2 12(b)(i) curve is not smooth or curve fluctuates/curve is jagged B1 12(b)(ii) clear evidence of allowance for background B1 half-life determined at least twice B1 half-life = 1.5 hours (1 mark if in range 1.7–2.0; 2 marks if in range 1.4–1.6) A2 12(c) 1. half-life: no change M1 because decay is spontaneous/independent of environment A1 2. count rate (likely to be or could be) different/is random/cannot be predicted B1
What was in this paper
The subtopics covered by these 12 questions, and how many questions each got. Open one in a new tab to see every Cambridge question on it.
1Characteristics of alternating currents1Electric force between point charges1Energy and momentum of a photon1Force on a moving charge1Gravitational force between point masses1Magnetic fields due to currents1Practical circuits1Production and use of X-rays1Radioactive decay1Simple harmonic oscillations1Temperature scales1What you needed in this session
Cambridge’s own grade thresholds for 2017 Oct/Nov, Paper 4 · Variant 3. A higher threshold means an easier paper — the bar moves with how the cohort did.