Cambridge A Level Physics 9702 — 2010 Oct/Nov Paper 5 · Variant 1
9702/51/O/N/10 · 2 questions · 30 marks · ≈34 min
The question paper and its mark scheme, free to read here and free to download. This is Cambridge’s own paper, exactly as it was sat.
Question paper8 pages
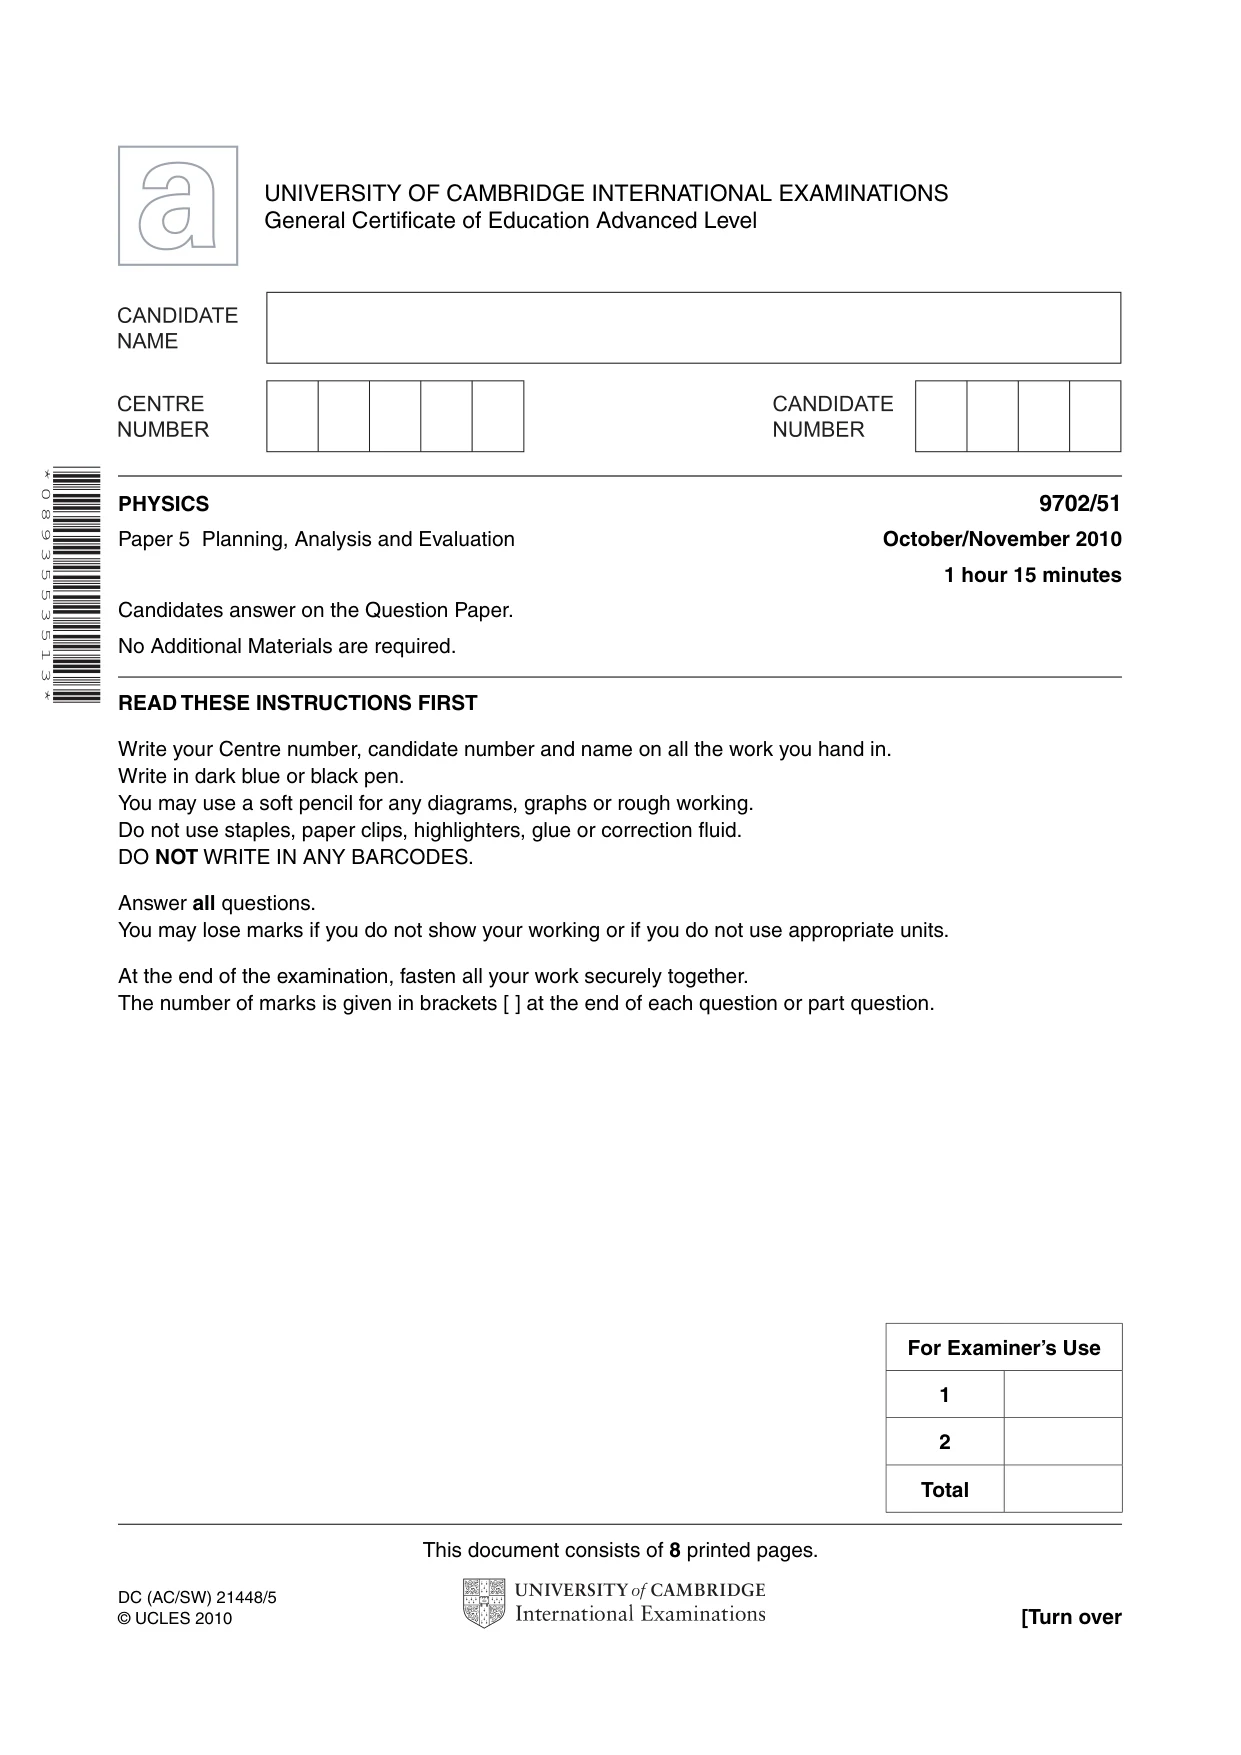


Mark scheme4 pages
Answers below. Sit the paper first if you are practising.
Questions as text
Q1 · A coil (coil X)
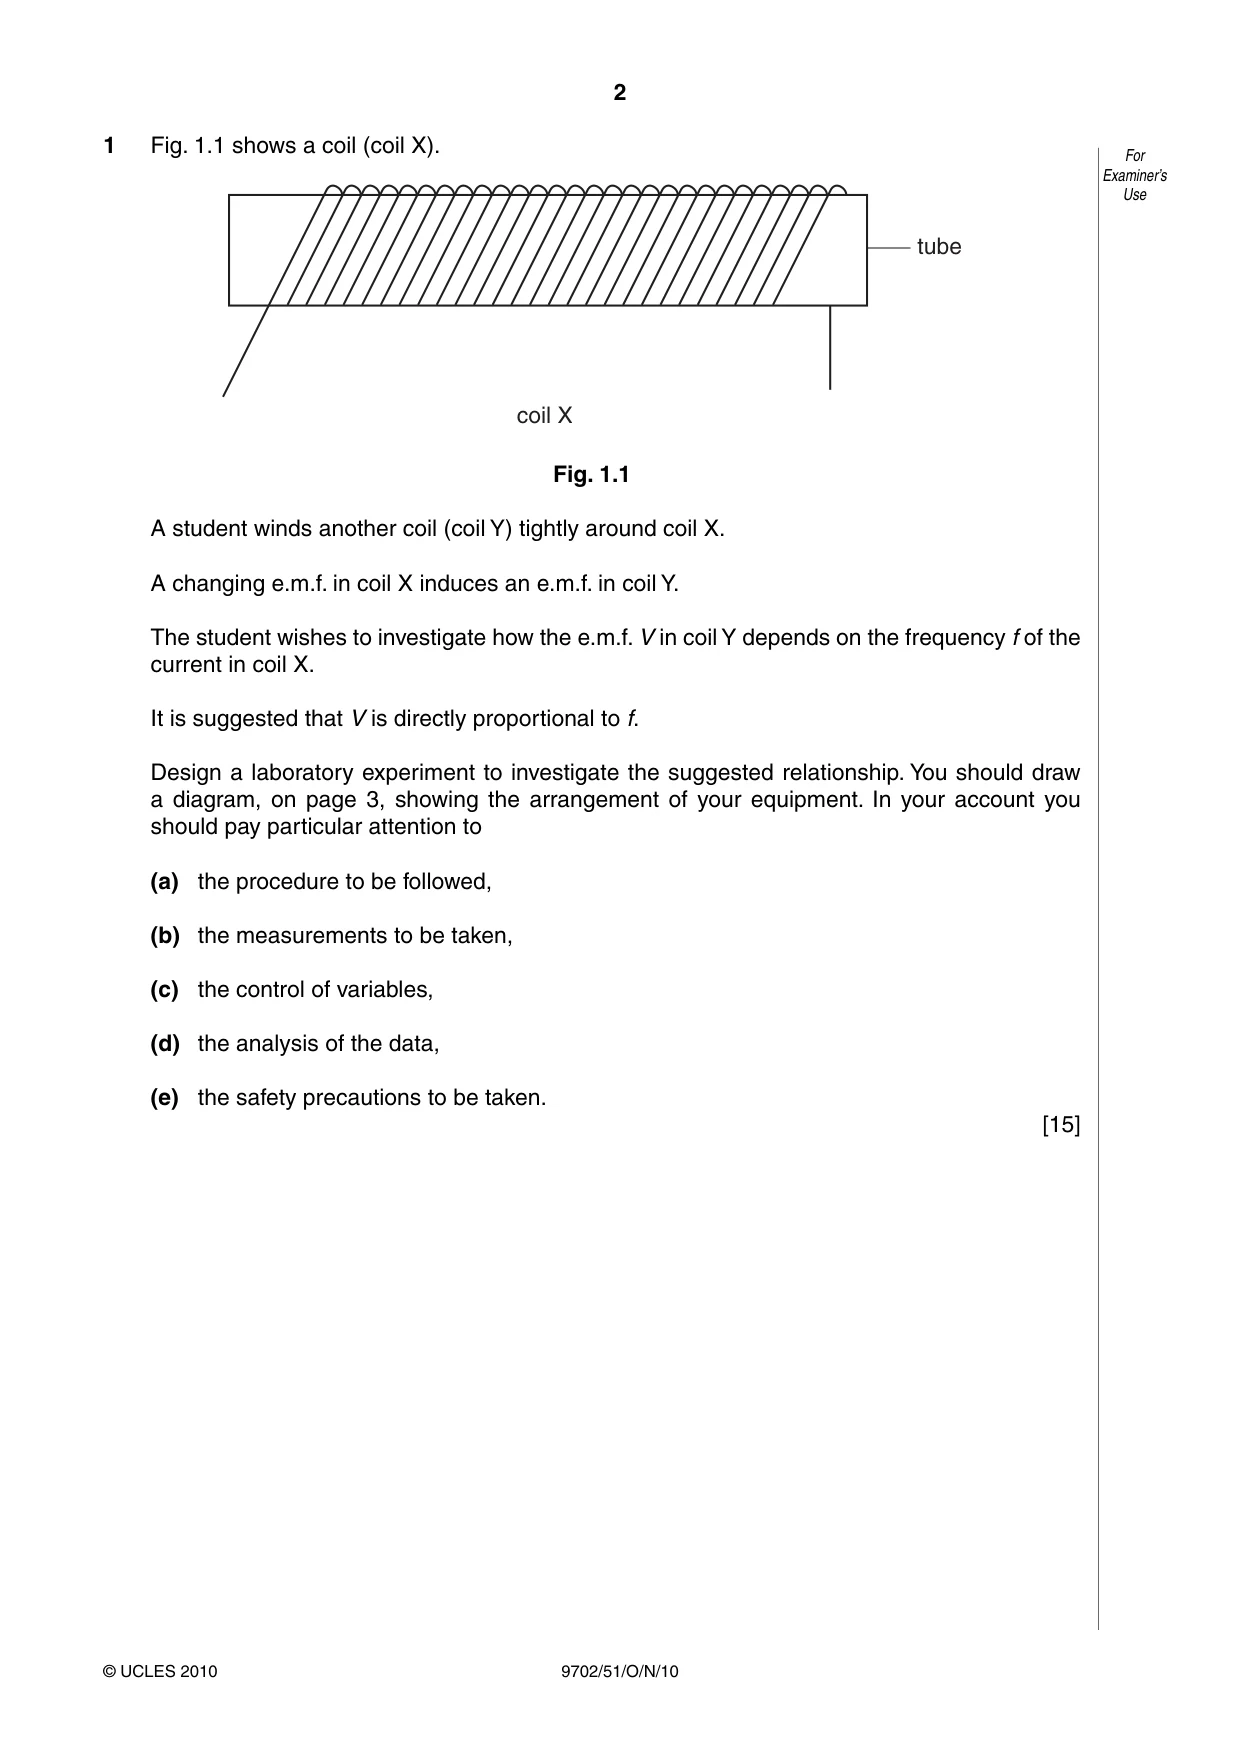
1 Fig. 1.1 shows a coil (coil X). For Examiner’s Use tube coil X Fig. 1.1 A student winds another coil (coil Y) tightly around coil X. A changing e.m.f. in coil X induces an e.m.f. in coil Y. The student wishes to investigate how the e.m.f. V in coil Y depends on the frequency f of the current in coil X. It is suggested that V is directly proportional to f. Design a laboratory experiment to investigate the suggested relationship. You should draw a diagram, on page 3, showing the arrangement of your equipment. In your account you should pay particular attention to (a) the procedure to be followed, (b) the measurements to be taken, (c) the control of variables, (d) the analysis of the data, (e) the safety precautions to be taken. [15] Diagram For Examiner’s Use ......................................................................................................................................................... ......................................................................................................................................................... ......................................................................................................................................................... ......................................................................................................................................................... ......................................................................................................................................................... ......................................................................................................................................................... ......................................................................................................................................................... ......................................................................................................................................................... ......................................................................................................................................................... ......................................................................................................................................................... ......................................................................................................................................................... ......................................................................................................................................................... ......................................................................................................................................................... ......................................................................................................................................................... ......................................................................................................................................................... For ......................................................................................................................................................... Examiner’s Use ......................................................................................................................................................... ......................................................................................................................................................... ......................................................................................................................................................... ......................................................................................................................................................... ......................................................................................................................................................... ......................................................................................................................................................... ......................................................................................................................................................... ......................................................................................................................................................... ......................................................................................................................................................... ......................................................................................................................................................... ......................................................................................................................................................... ......................................................................................................................................................... ......................................................................................................................................................... ......................................................................................................................................................... ......................................................................................................................................................... ......................................................................................................................................................... ......................................................................................................................................................... ......................................................................................................................................................... ......................................................................................................................................................... ......................................................................................................................................................... ......................................................................................................................................................... ......................................................................................................................................................... ......................................................................................................................................................... Defining the Methods of Method of Safety Additional For problem data collection analysis considerations detail Examiner’s Use
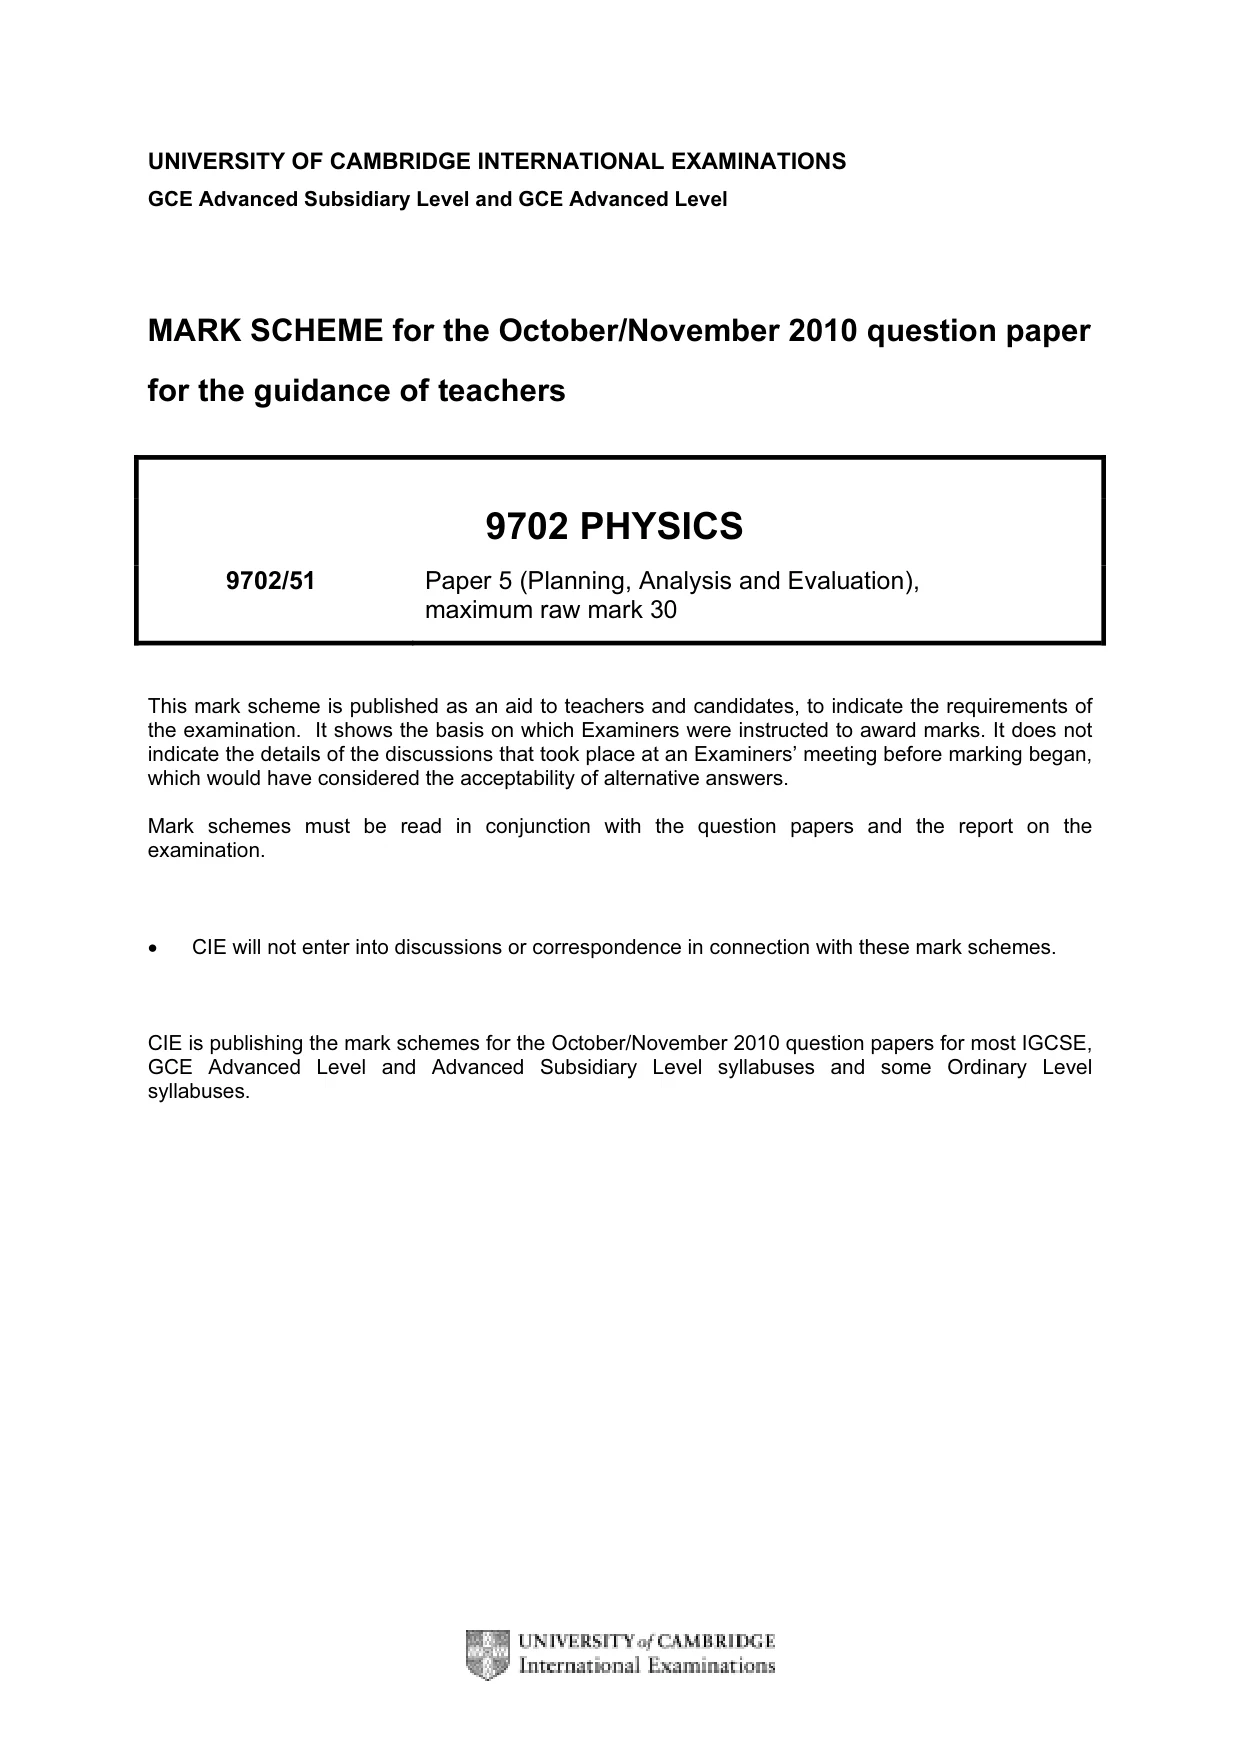
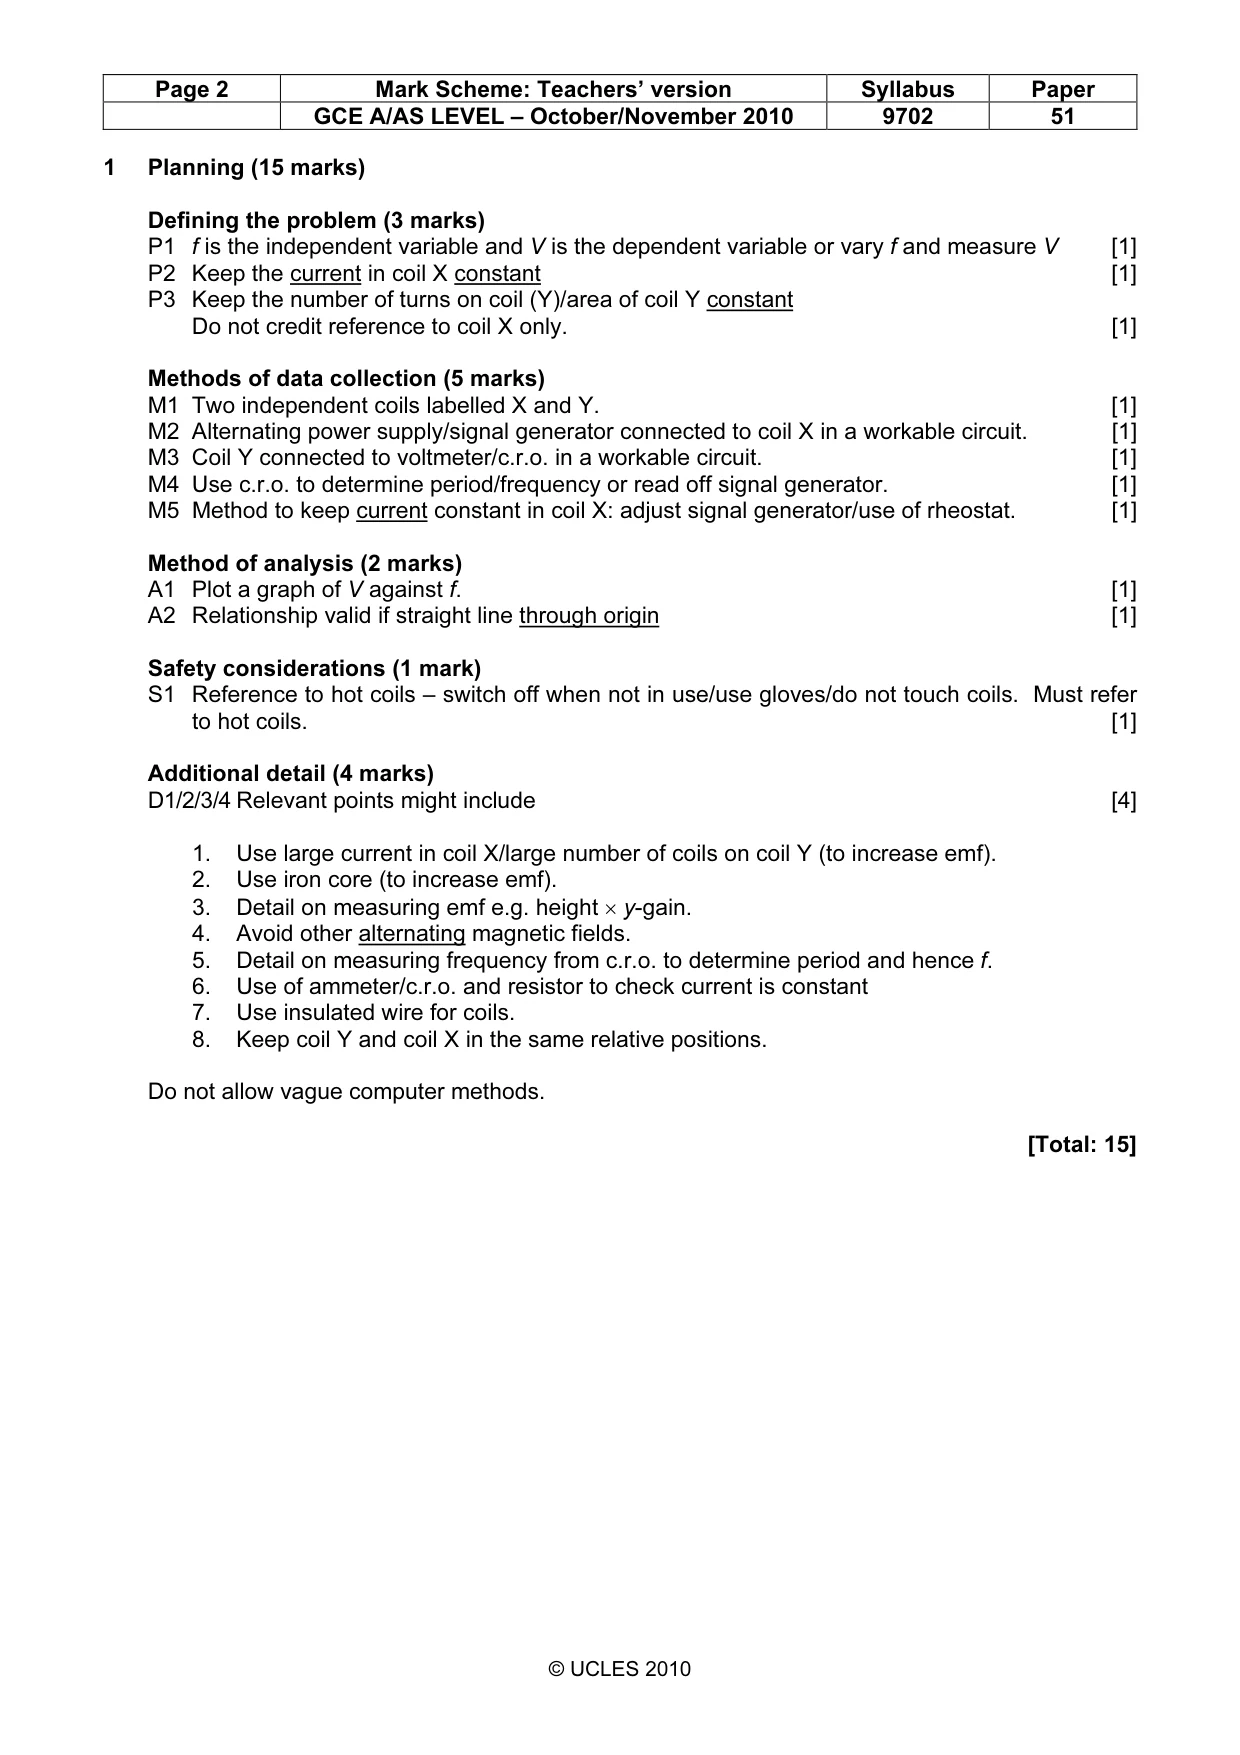
Mark scheme: 1 Planning (15 marks) Defining the problem (3 marks) P1 f is the independent variable and V is the dependent variable or vary f and measure V [1] P2 Keep the current in coil X constant [1] P3 Keep the number of turns on coil (Y)/area of coil Y constant Do not credit reference to coil X only. [1] Methods of data collection (5 marks) M1 Two independent coils labelled X and Y. [1] M2 Alternating power supply/signal generator connected to coil X in a workable circuit. [1] M3 Coil Y connected to voltmeter/c.r.o. in a workable circuit. [1] M4 Use c.r.o. to determine period/frequency or read off signal generator. [1] M5 Method to keep current constant in coil X: adjust signal generator/use of rheostat. [1] Method of analysis (2 marks) A1 Plot a graph of V against f. [1] A2 Relationship valid if straight line through origin [1] Safety considerations (1 mark) S1 Reference to hot coils – switch off when not in use/use gloves/do not touch coils. Must refer to hot coils. [1] Additional detail (4 marks) D1/2/3/4 Relevant points might include [4] 1. Use large current in coil X/large number of coils on coil Y (to increase emf). 2. Use iron core (to increase emf). 3. Detail on measuring emf e.g. height × y-gain. 4. Avoid other alternating magnetic fields. 5. Detail on measuring frequency from c.r.o. to determine period and hence f. 6. Use of ammeter/c.r.o. and resistor to check current is constant 7. Use insulated wire for coils. 8. Keep coil Y and coil X in the same relative positions. Do not allow vague computer methods. [Total: 15] GCE A/AS LEVEL – October/November 2010 9702 51
Q2 · A student is investigating how the period T of a simple pendulum depends on its For…
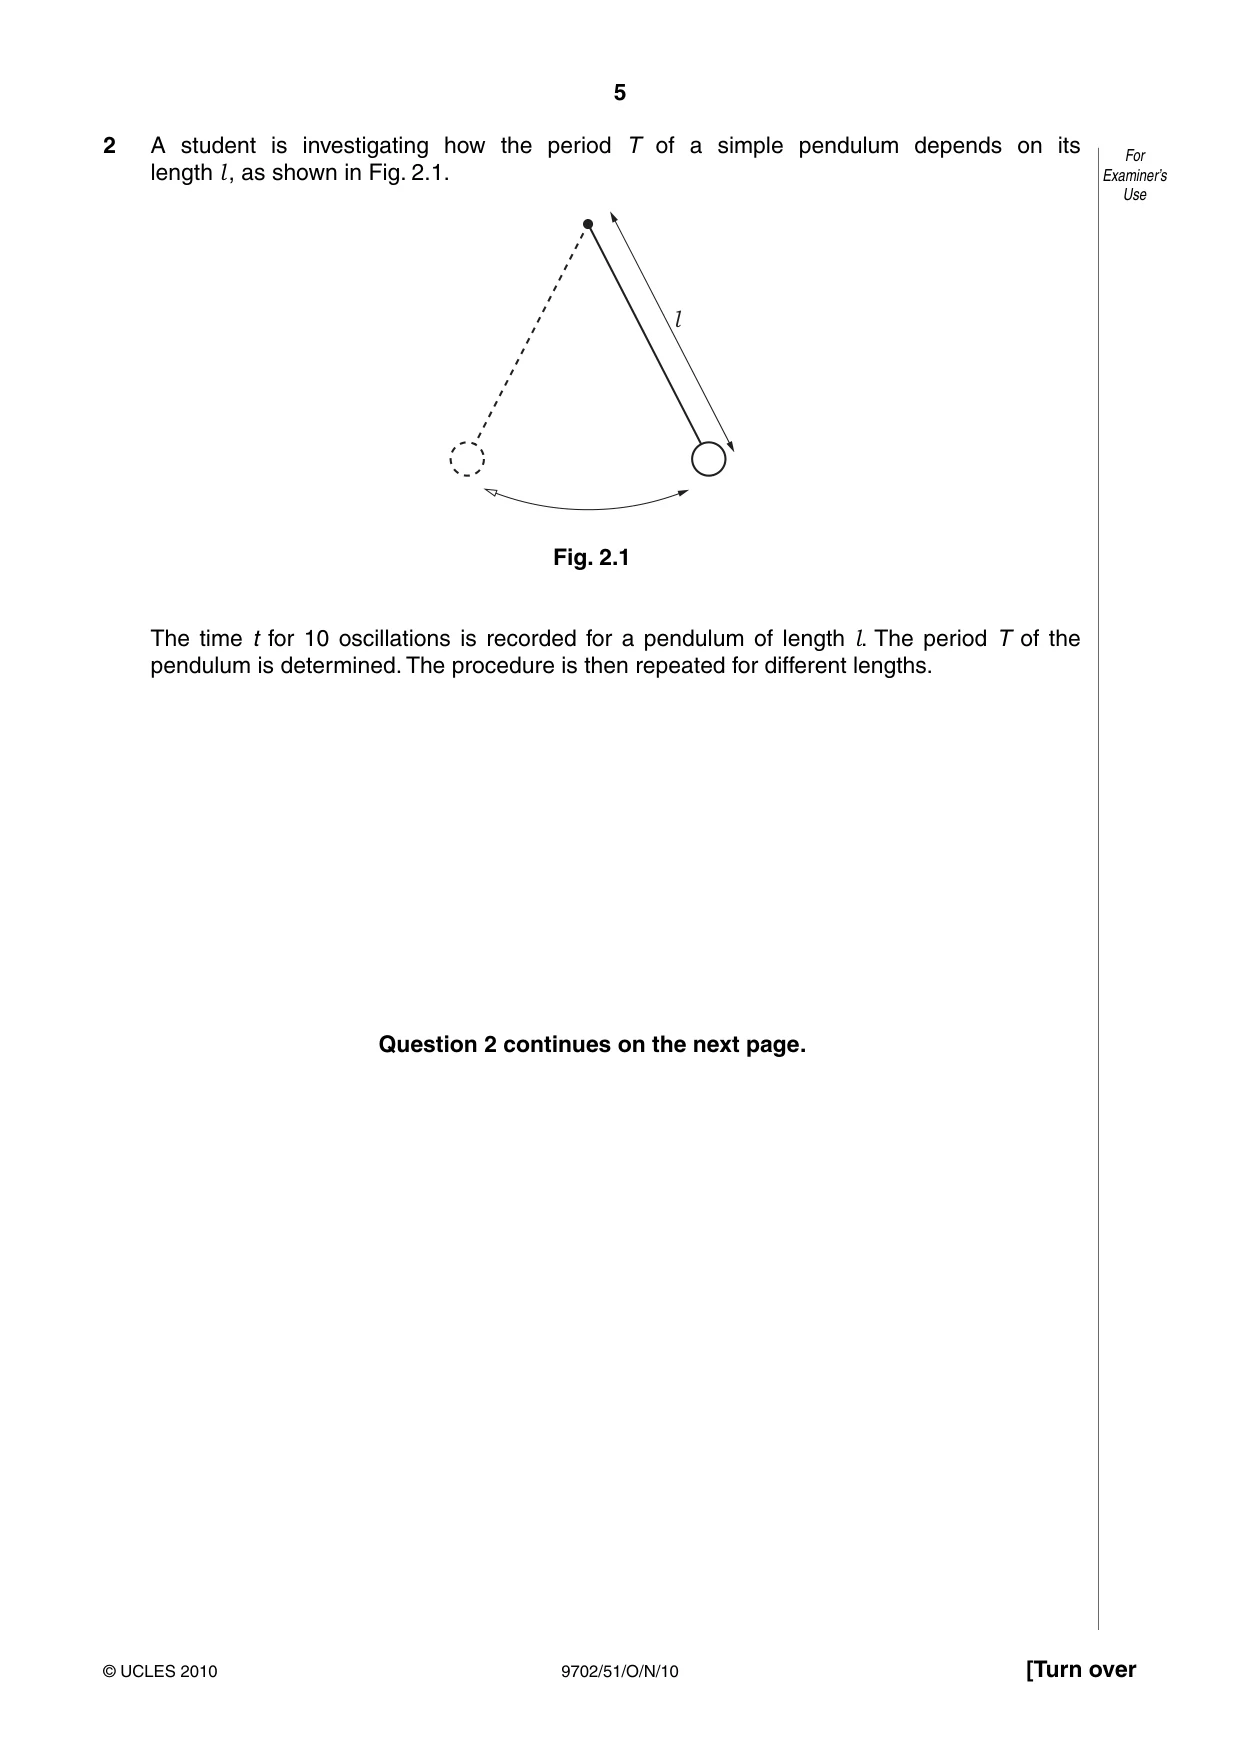
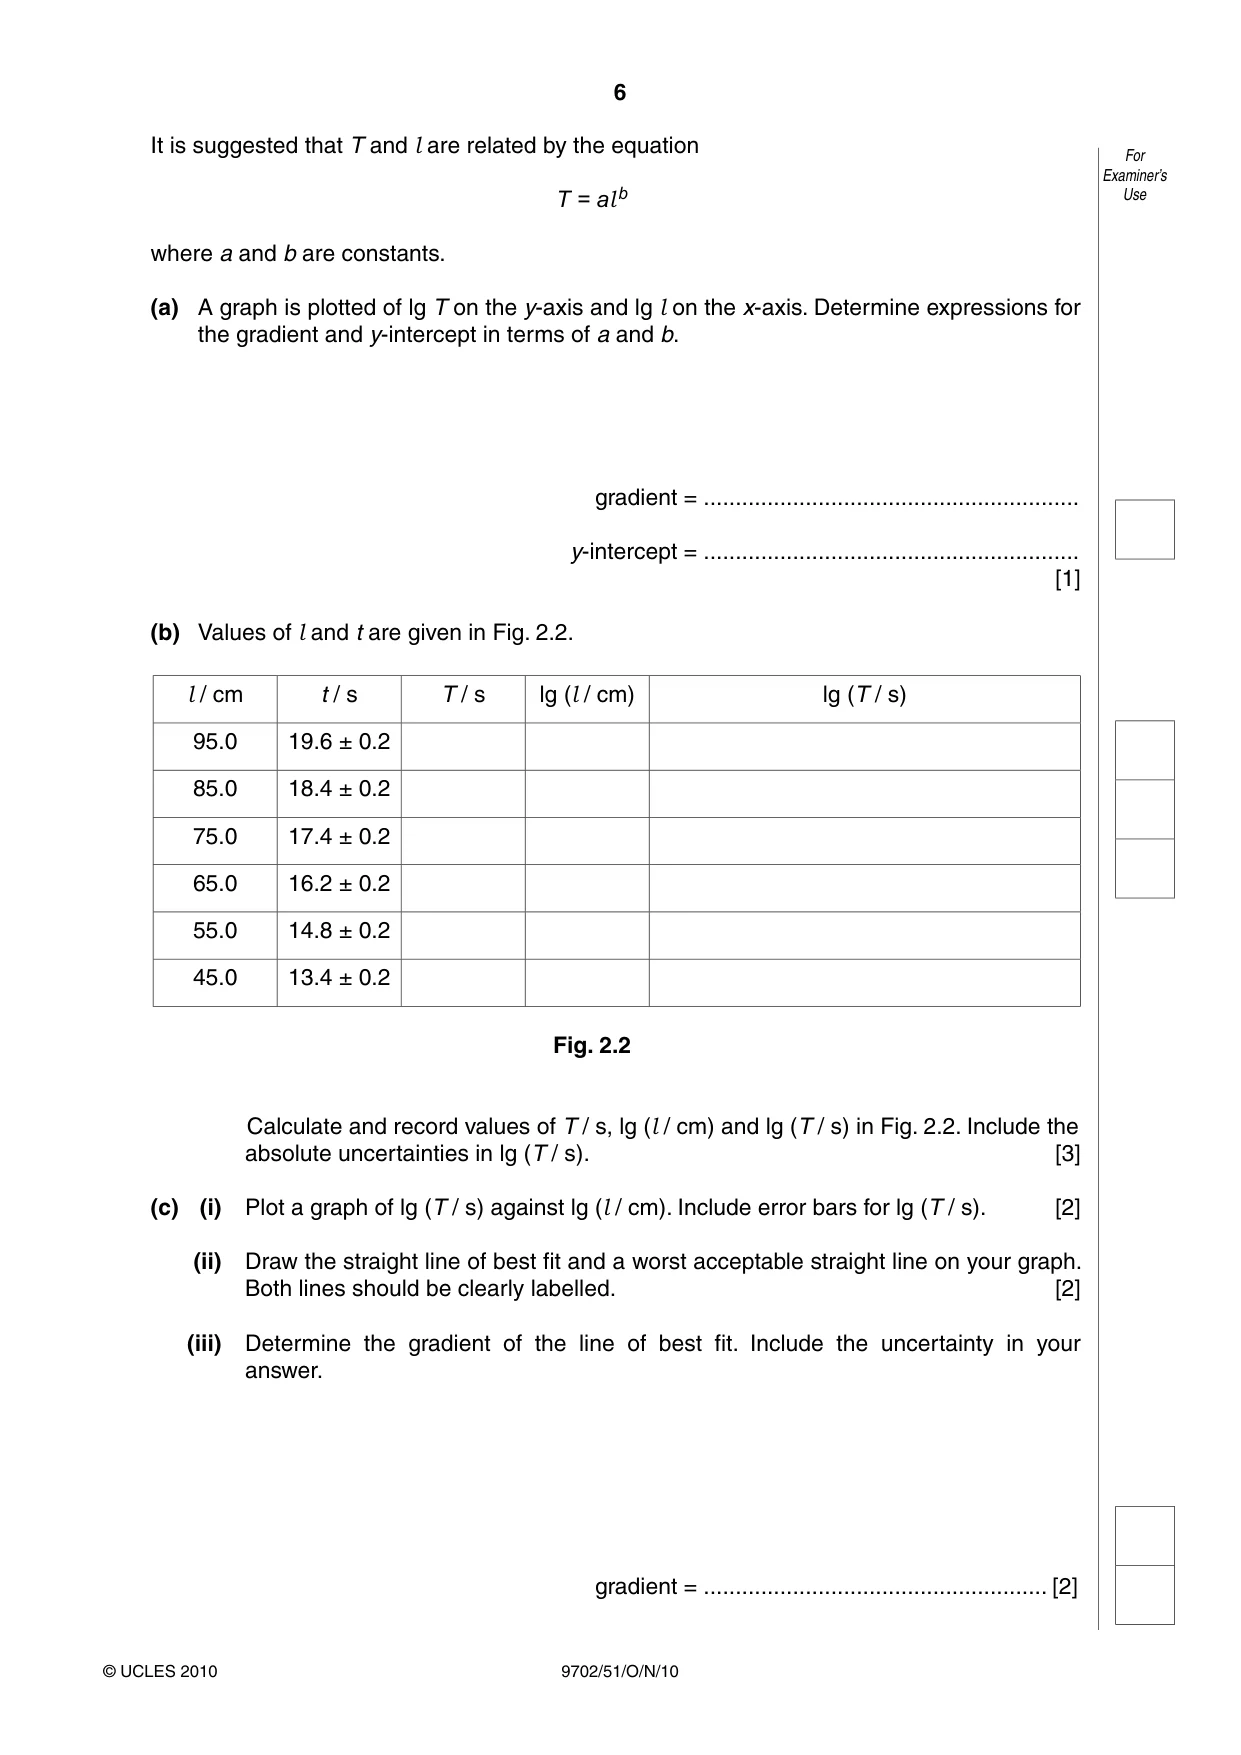
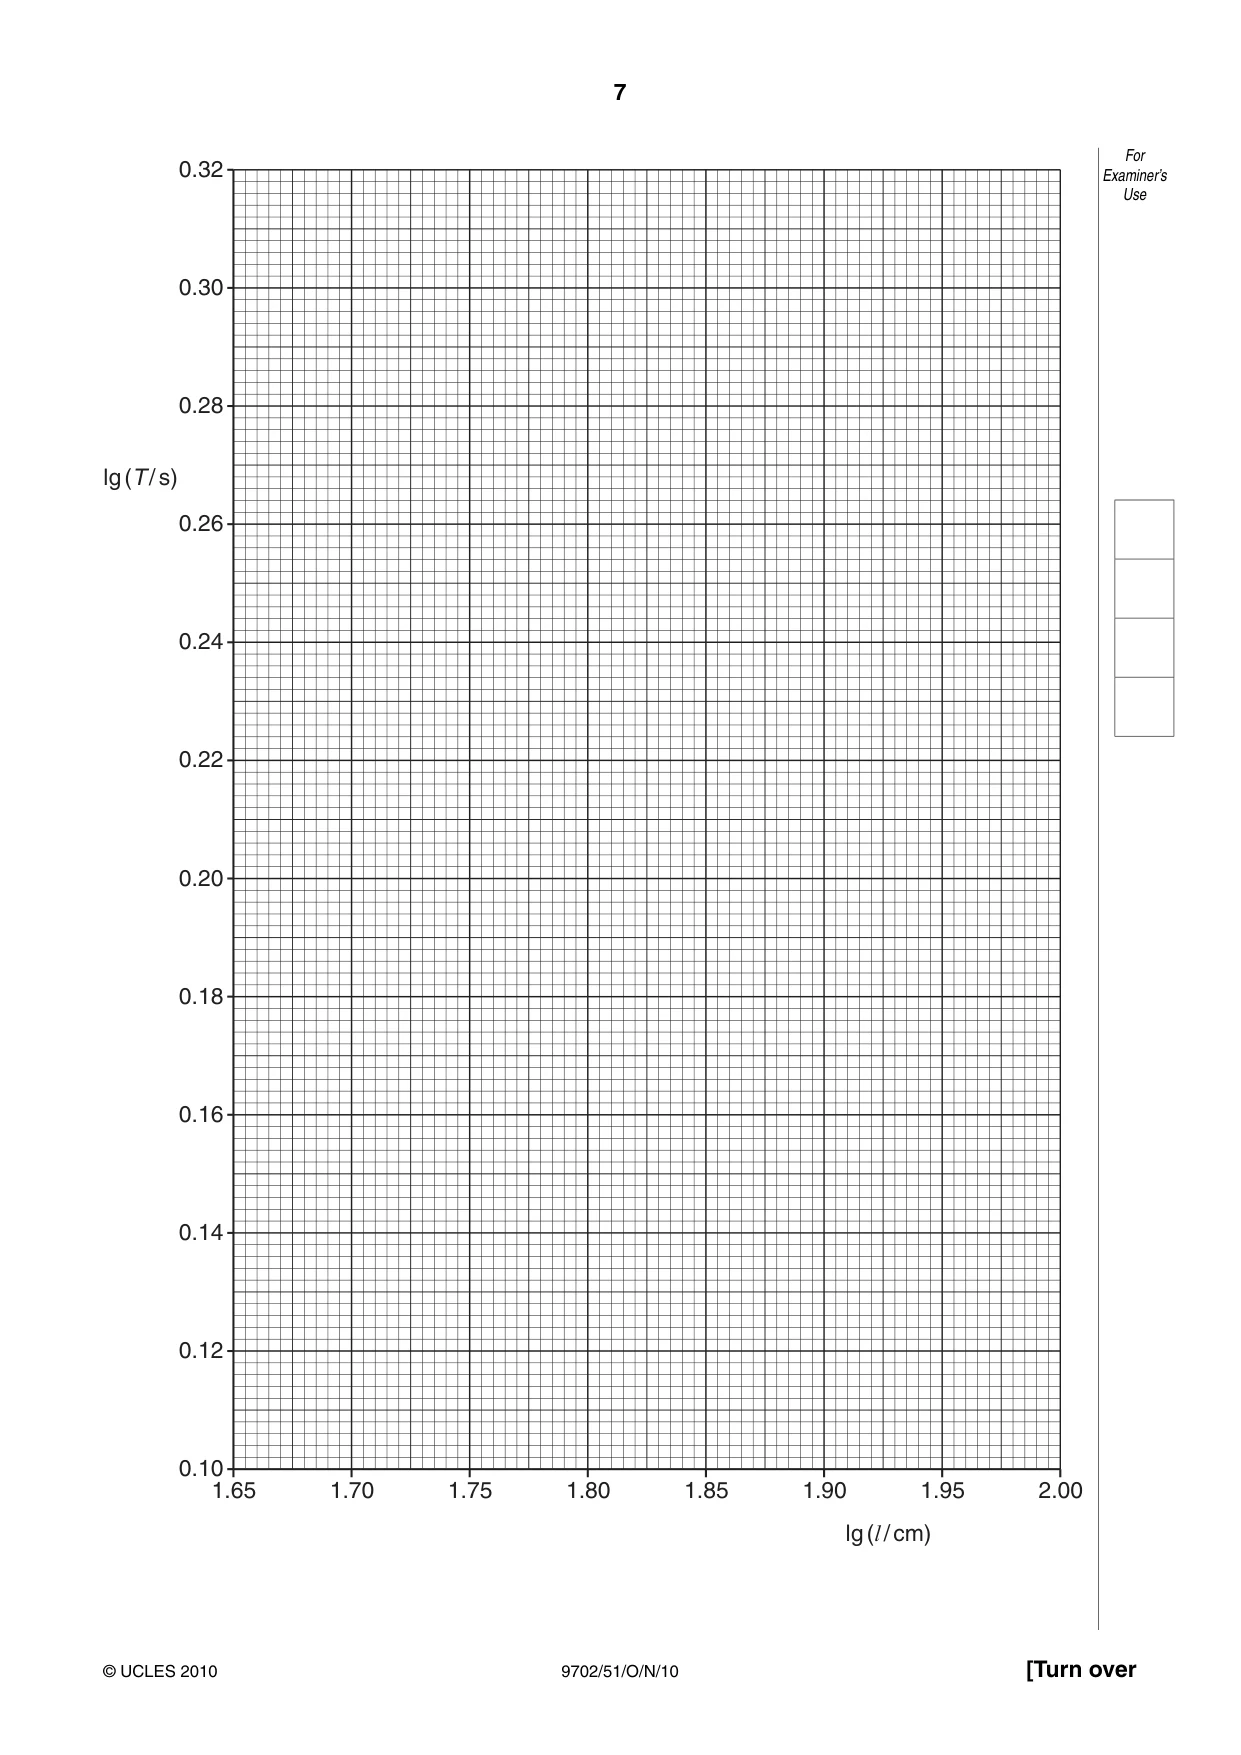
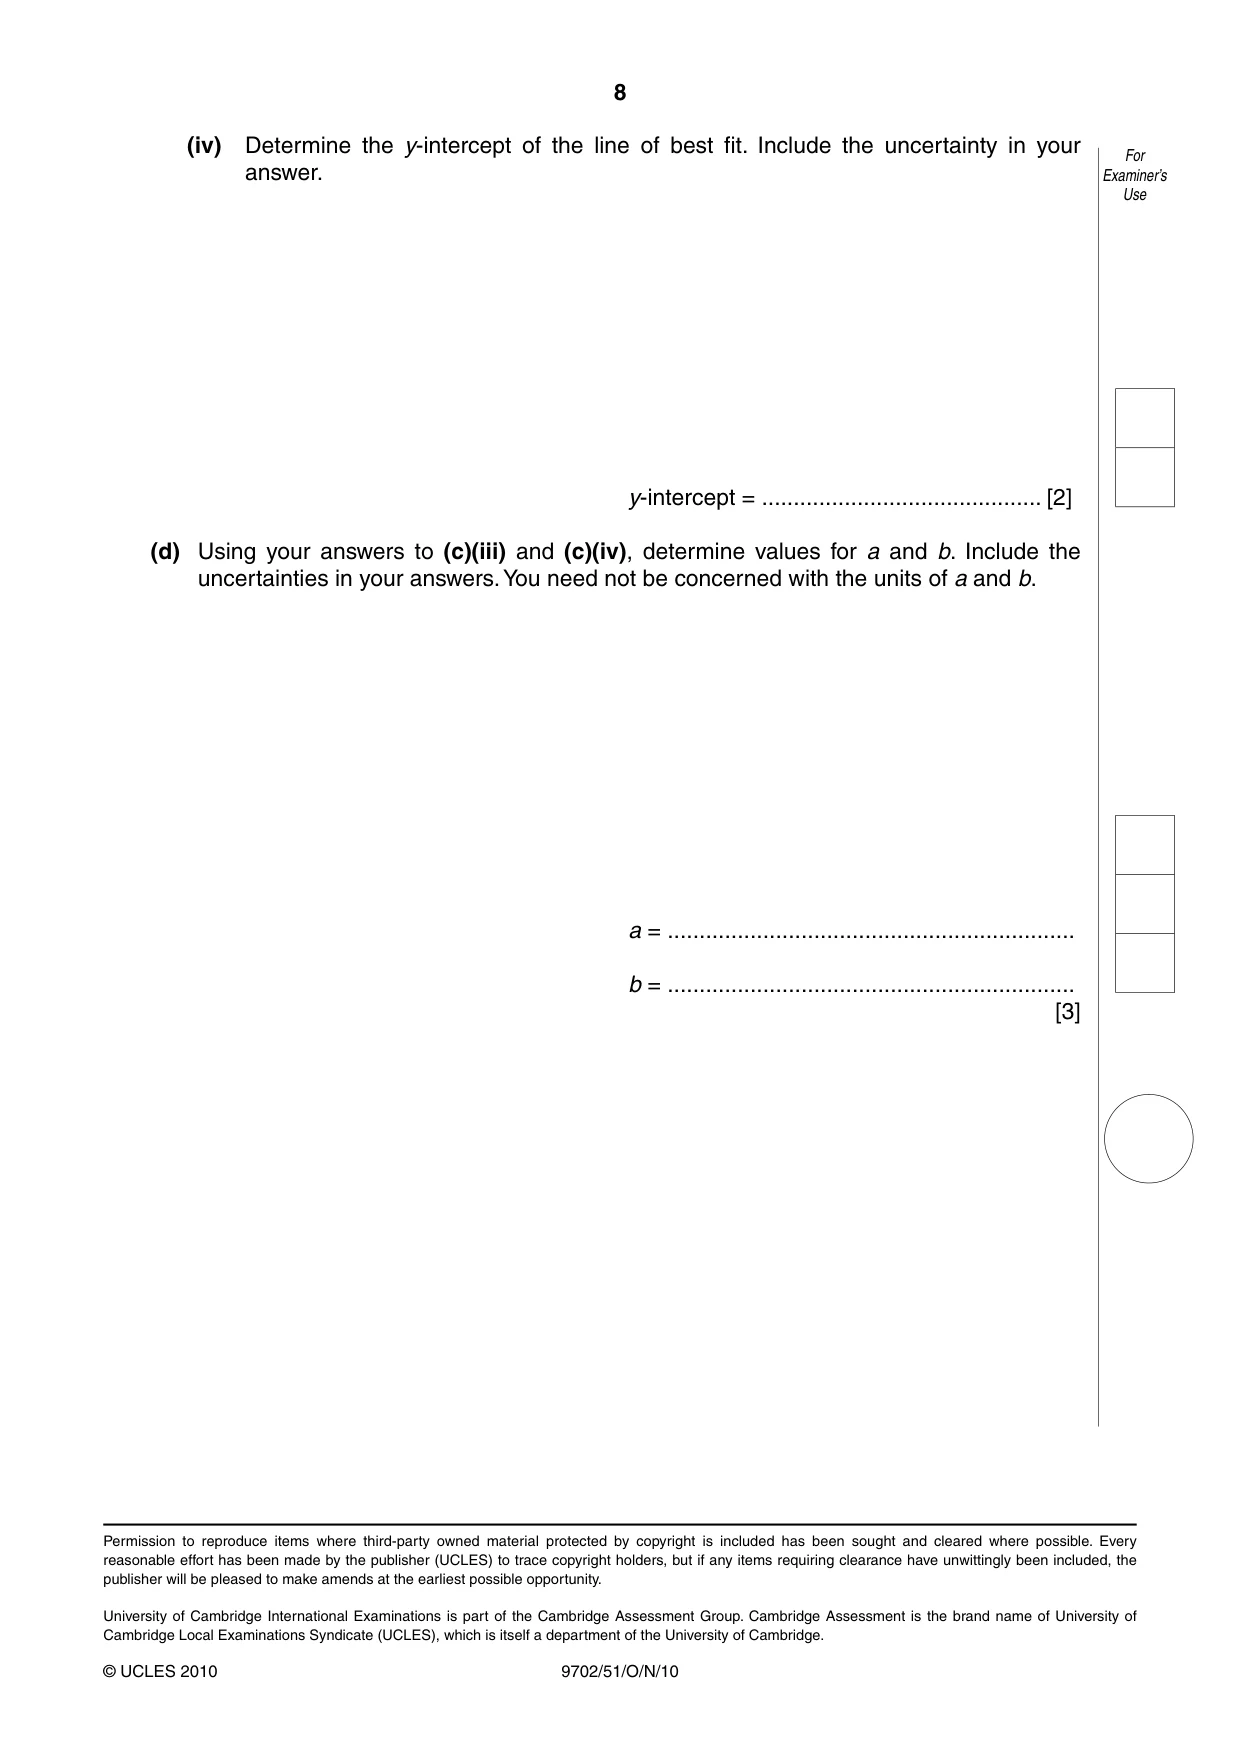
2 A student is investigating how the period T of a simple pendulum depends on its For length l , as shown in Fig. 2.1. Examiner’s Use l Fig. 2.1 The time t for 10 oscillations is recorded for a pendulum of length l. The period T of the pendulum is determined. The procedure is then repeated for different lengths. Question 2 continues on the next page. It is suggested that T and l are related by the equation For Examiner’s T = al b Use where a and b are constants. (a) A graph is plotted of lg T on the y-axis and lg l on the x-axis. Determine expressions for the gradient and y-intercept in terms of a and b. gradient = ........................................................... y-intercept = ........................................................... [1] (b) Values of l and t are given in Fig. 2.2. l / cm t / s T / s lg (l / cm) lg (T / s) 95.0 19.6 ± 0.2 85.0 18.4 ± 0.2 75.0 17.4 ± 0.2 65.0 16.2 ± 0.2 55.0 14.8 ± 0.2 45.0 13.4 ± 0.2 Fig. 2.2 Calculate and record values of T / s, lg (l / cm) and lg (T / s) in Fig. 2.2. Include the absolute uncertainties in lg (T / s). [3] (c) (i) Plot a graph of lg (T / s) against lg (l / cm). Include error bars for lg (T / s). [2] (ii) Draw the straight line of best fit and a worst acceptable straight line on your graph. Both lines should be clearly labelled. [2] (iii) Determine the gradient of the line of best fit. Include the uncertainty in your answer. gradient = ...................................................... [2] For 0.32 Examiner’s Use 0.30 0.28 lg (T / s) 0.26 0.24 0.22 0.20 0.18 0.16 0.14 0.12 0.10 1.65 1.70 1.75 1.80 1.85 1.90 1.95 2.00 lg (l / cm)
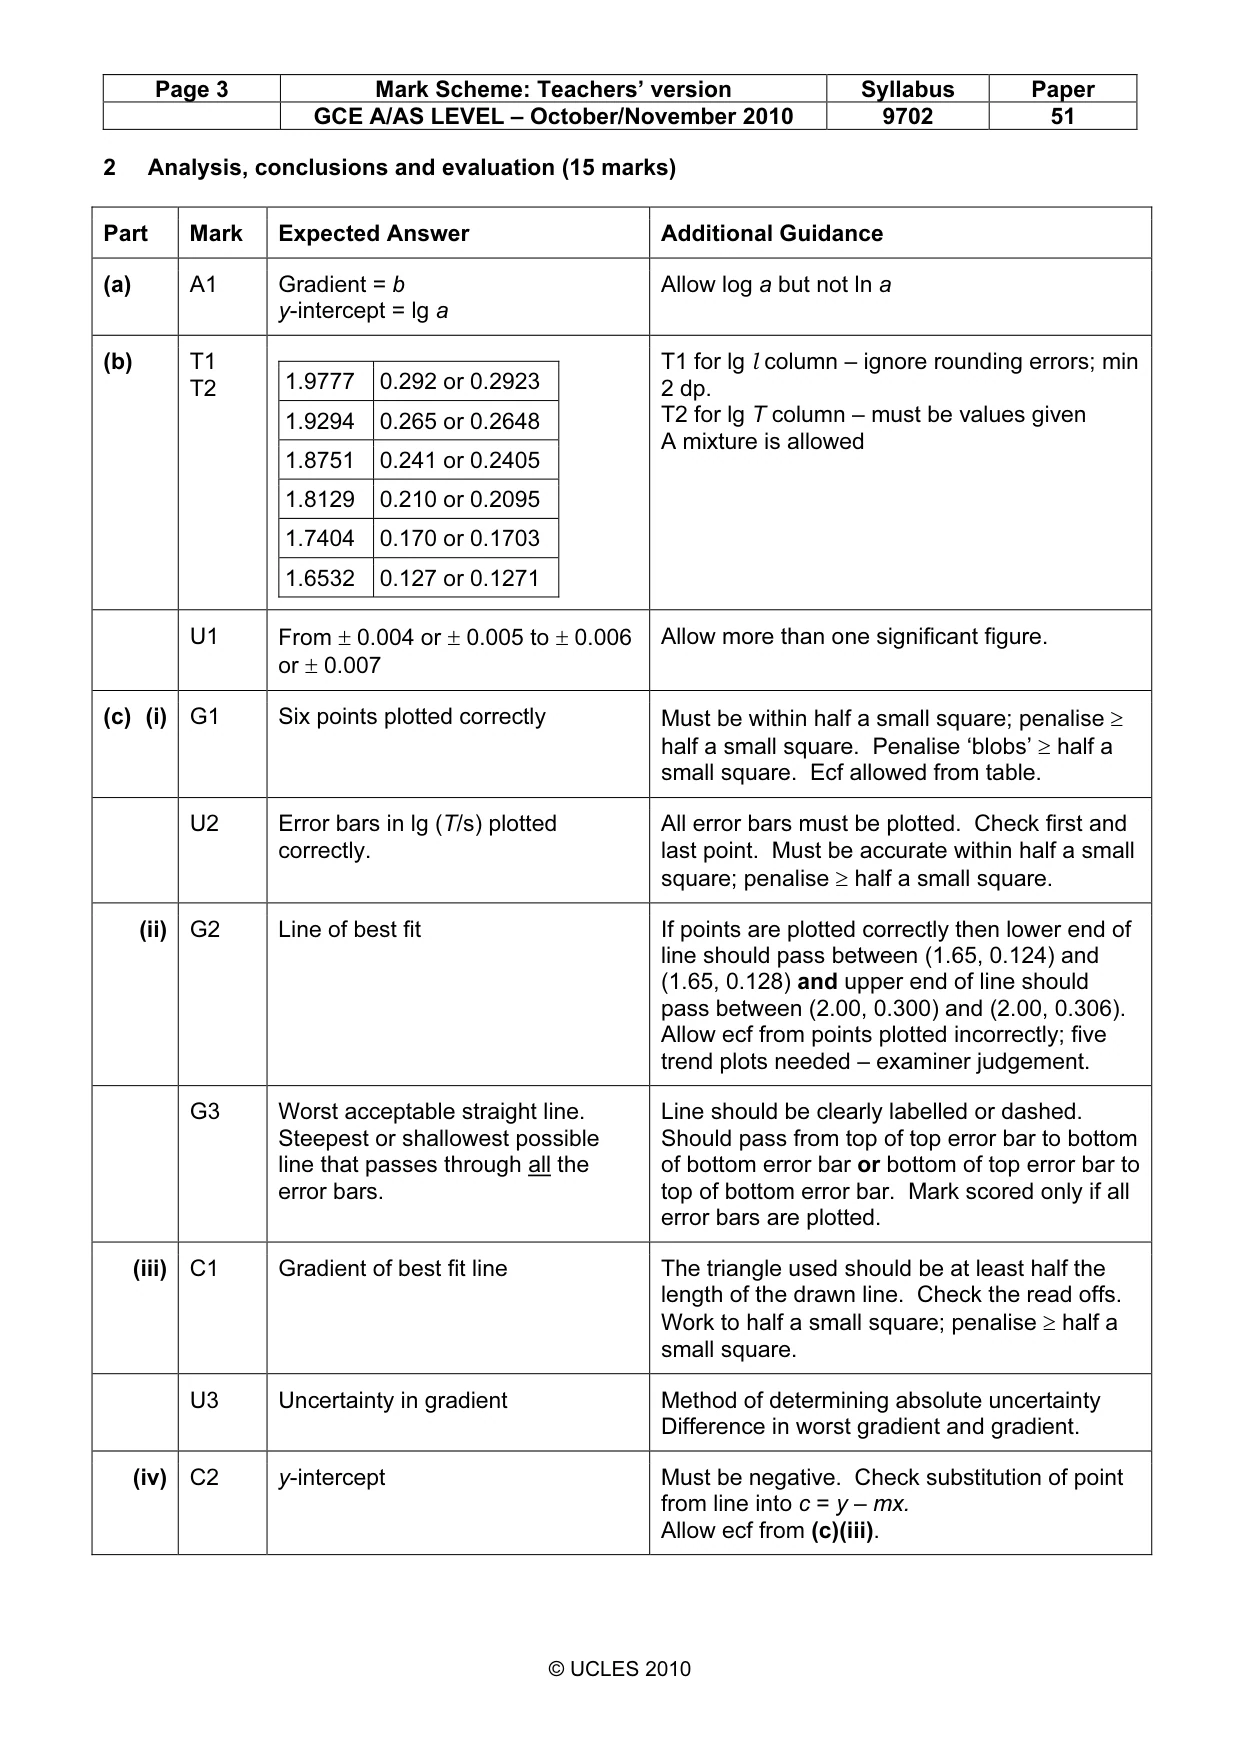
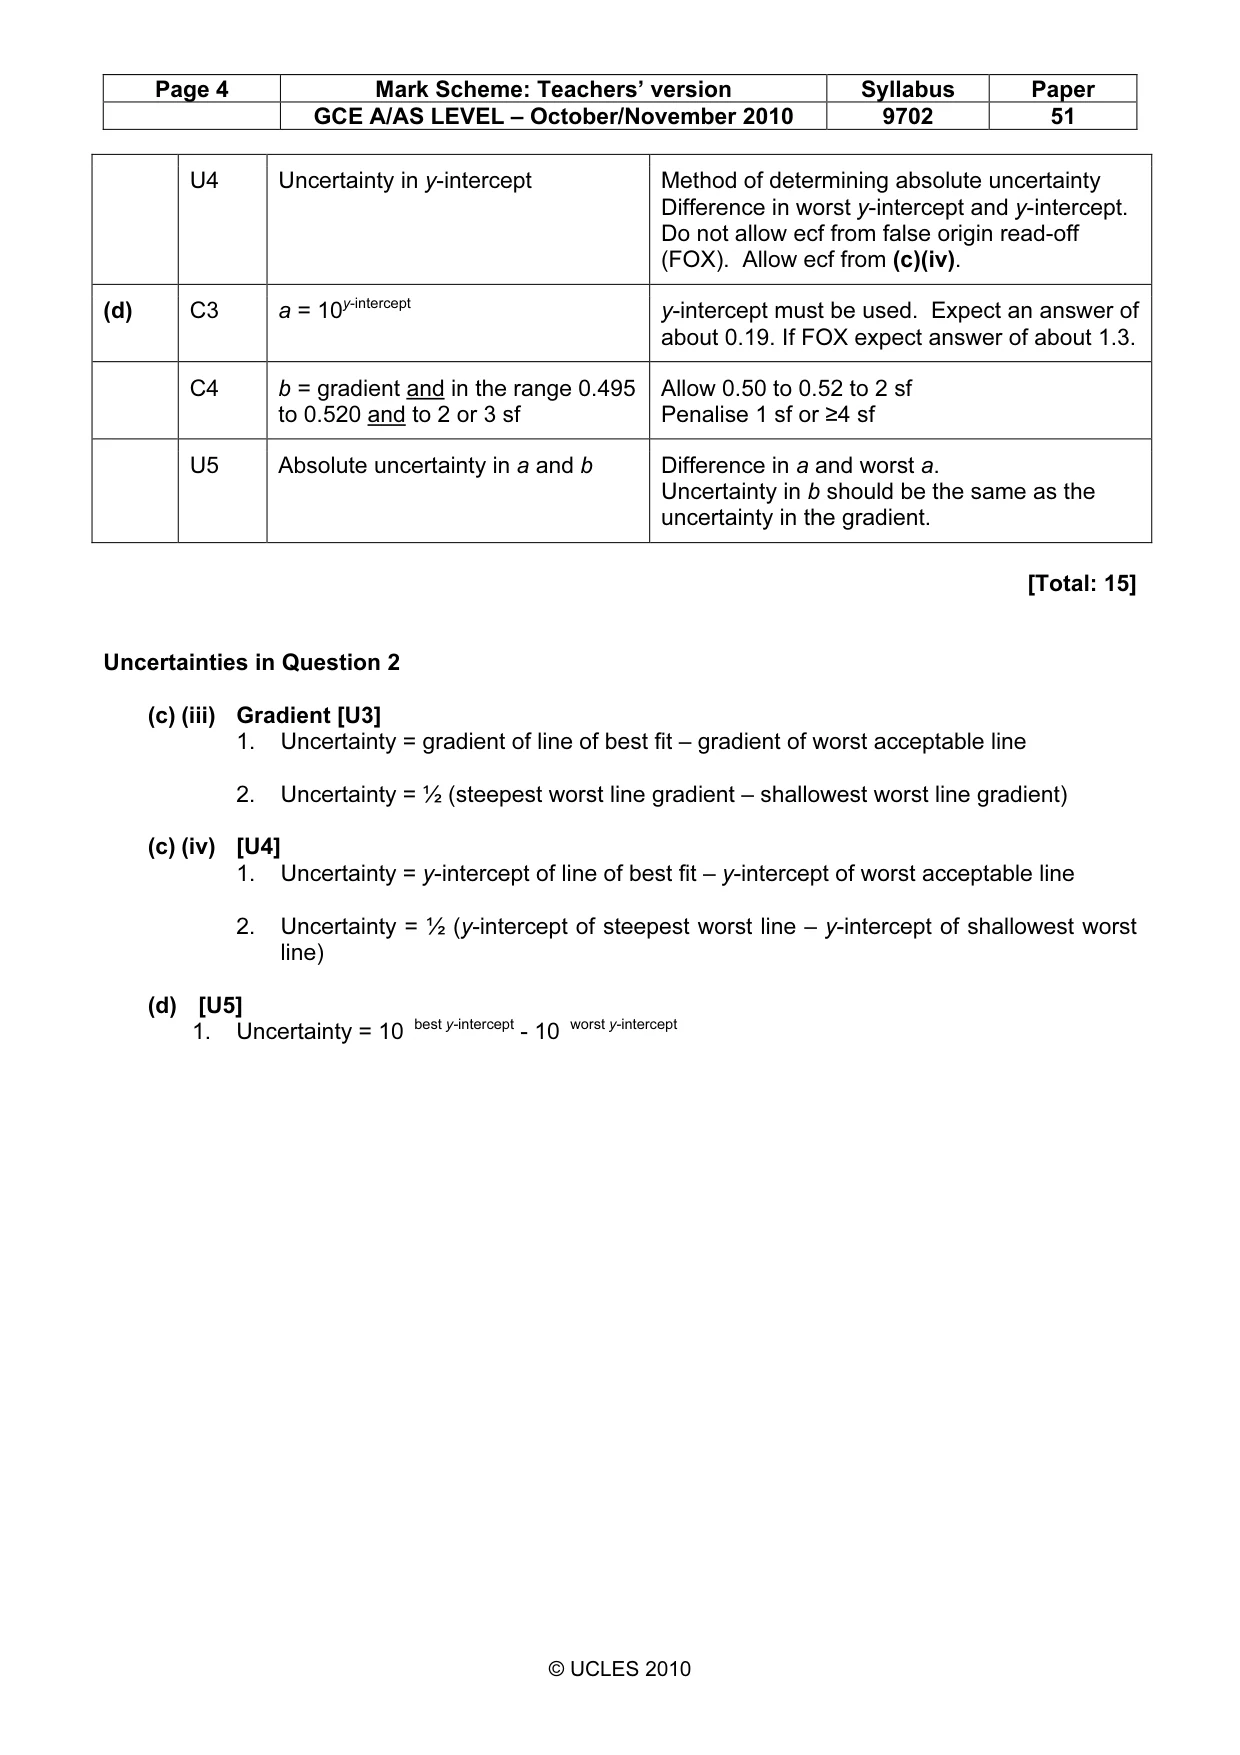
Mark scheme: 2 Analysis, conclusions and evaluation (15 marks) Part Mark Expected Answer Additional Guidance (a) A1 Gradient = b Allow log a but not ln a y-intercept = lg a (b) T1 T1 for lg l column – ignore rounding errors; min T2 1.9777 0.292 or 0.2923 2 dp. 1.9294 0.265 or 0.2648 T2 for lg T column – must be values given A mixture is allowed 1.8751 0.241 or 0.2405 1.8129 0.210 or 0.2095 1.7404 0.170 or 0.1703 1.6532 0.127 or 0.1271 U1 From ± 0.004 or ± 0.005 to ± 0.006 Allow more than one significant figure. or ± 0.007 (c) (i) G1 Six points plotted correctly Must be within half a small square; penalise ≥ half a small square. Penalise ‘blobs’ ≥ half a small square. Ecf allowed from table. U2 Error bars in lg (T/s) plotted All error bars must be plotted. Check first and correctly. last point. Must be accurate within half a small square; penalise ≥ half a small square. (ii) G2 Line of best fit If points are plotted correctly then lower end of line should pass between (1.65, 0.124) and (1.65, 0.128) and upper end of line should pass between (2.00, 0.300) and (2.00, 0.306). Allow ecf from points plotted incorrectly; five trend plots needed – examiner judgement. G3 Worst acceptable straight line. Line should be clearly labelled or dashed. Steepest or shallowest possible Should pass from top of top error bar to bottom line that passes through all the of bottom error bar or bottom of top error bar to error bars. top of bottom error bar. Mark scored only if all error bars are plotted. (iii) C1 Gradient of best fit line The triangle used should be at least half the length of the drawn line. Check the read offs. Work to half a small square; penalise ≥ half a small square. U3 Uncertainty in gradient Method of determining absolute uncertainty Difference in worst gradient and gradient. (iv) C2 y-intercept Must be negative. Check substitution of point from line into c = y – mx. Allow ecf from (c)(iii). GCE A/AS LEVEL – October/November 2010 9702 51 U4 Uncertainty in y-intercept Method of determining absolute uncertainty Difference in worst y-intercept and y-intercept. Do not allow ecf from false origin read-off (FOX). Allow ecf from (c)(iv). (d) C3 a = 10y-intercept y-intercept must be used. Expect an answer of about 0.19. If FOX expect answer of about 1.3. C4 b = gradient and in the range 0.495 Allow 0.50 to 0.52 to 2 sf to 0.520 and to 2 or 3 sf Penalise 1 sf or ≥4 sf U5 Absolute uncertainty in a and b Difference in a and worst a. Uncertainty in b should be the same as the uncertainty in the gradient. [Total: 15] Uncertainties in Question 2 (c) (iii) Gradient [U3] 1. Uncertainty = gradient of line of best fit – gradient of worst acceptable line 2. Uncertainty = ½ (steepest worst line gradient – shallowest worst line gradient) (c) (iv) [U4] 1. Uncertainty = y-intercept of line of best fit – y-intercept of worst acceptable line 2. Uncertainty = ½ (y-intercept of steepest worst line – y-intercept of shallowest worst line) (d) [U5] 1. Uncertainty = 10 best y-intercept - 10 worst y-intercept
What was in this paper
The subtopics covered by these 2 questions, and how many questions each got. Open one in a new tab to see every Cambridge question on it.
What you needed in this session
Cambridge’s own grade thresholds for 2010 Oct/Nov, Paper 5 · Variant 1. A higher threshold means an easier paper — the bar moves with how the cohort did.