Cambridge A Level Physics 9702 — 2010 Oct/Nov Paper 5 · Variant 3
9702/53/O/N/10 · 2 questions · 30 marks · ≈34 min
The question paper and its mark scheme, free to read here and free to download. This is Cambridge’s own paper, exactly as it was sat.
Question paper8 pages

Mark scheme4 pages
Answers below. Sit the paper first if you are practising.
Questions as text
Q1 · A student wishes to determine the resistivity of aluminium
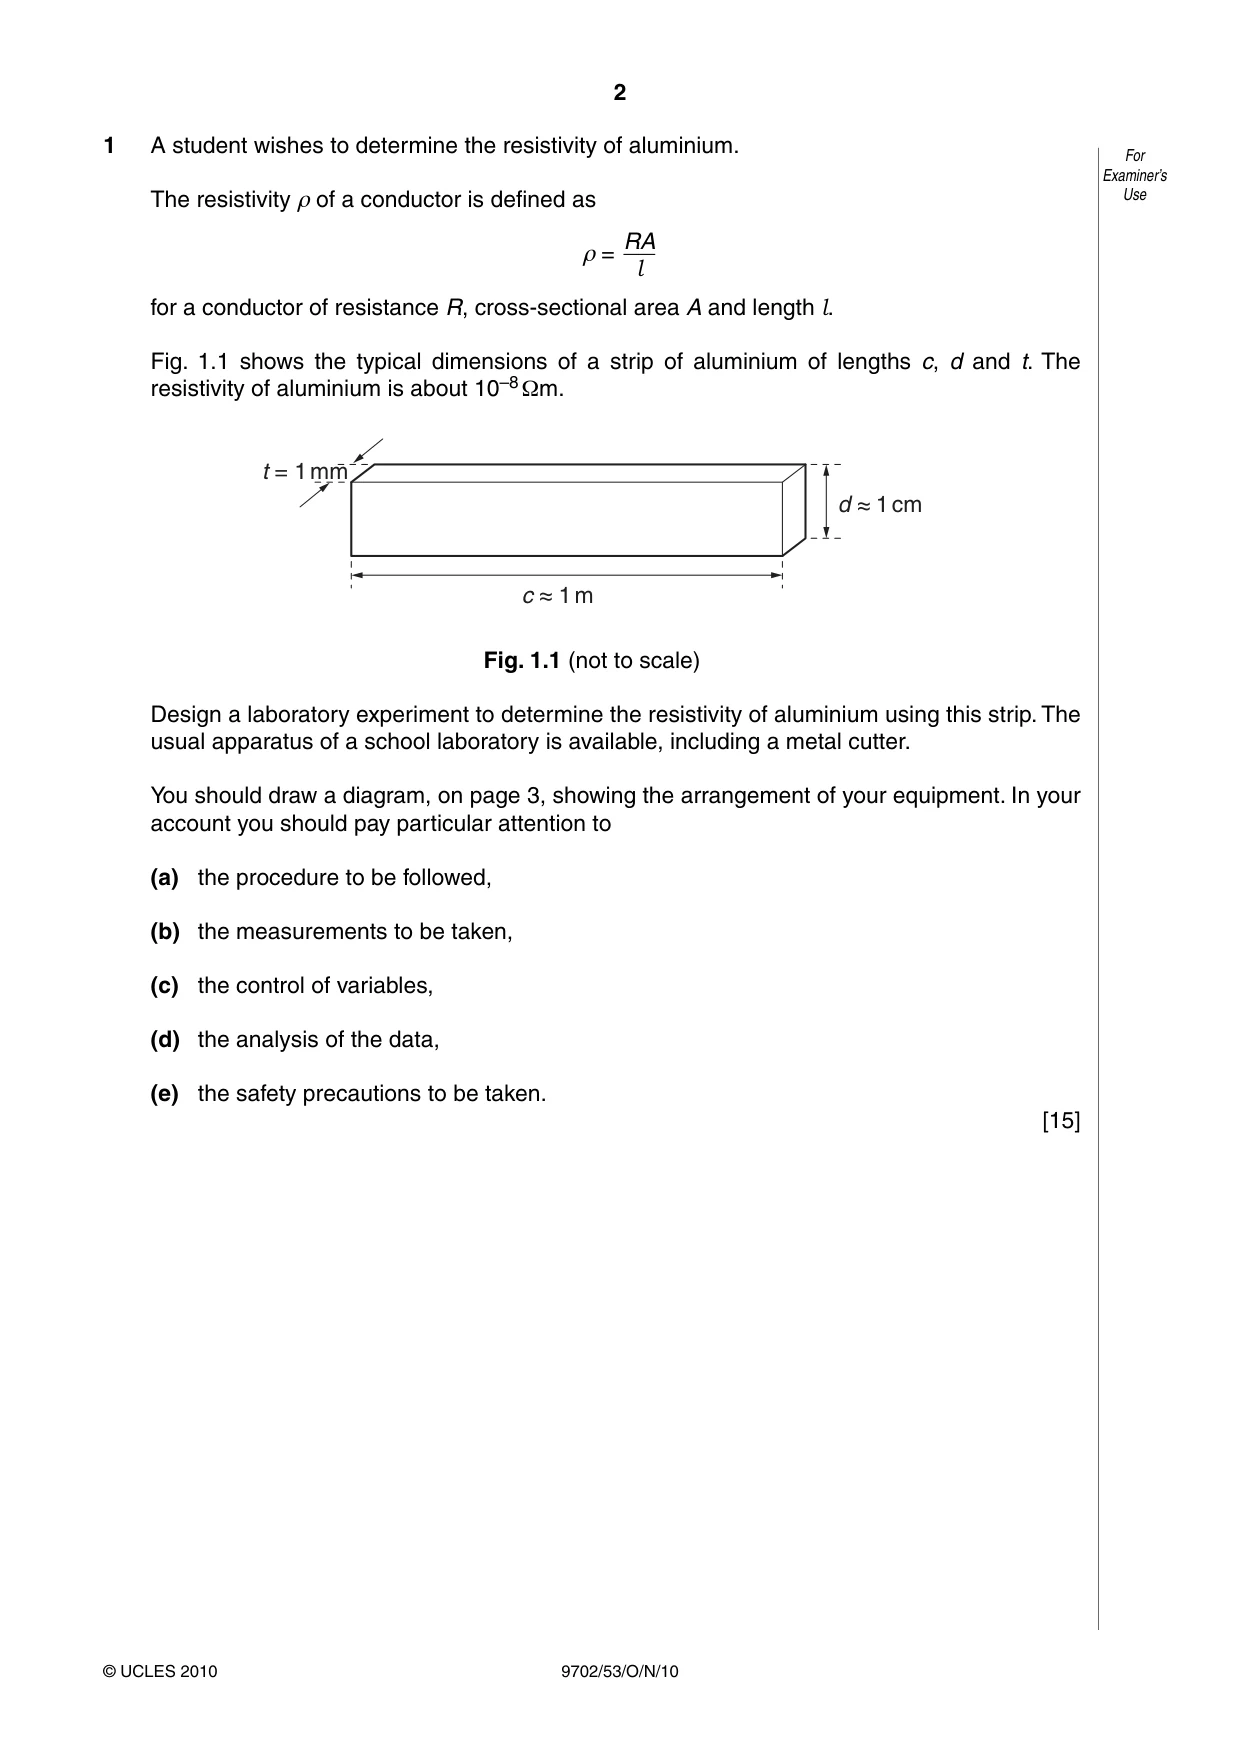
1 A student wishes to determine the resistivity of aluminium. For Examiner’s The resistivity ρ of a conductor is defined as Use RA ρ = l for a conductor of resistance R, cross-sectional area A and length l. Fig. 1.1 shows the typical dimensions of a strip of aluminium of lengths c, d and t. The resistivity of aluminium is about 10–8 Ωm. t = 1 mm d 1 cm c 1 m Fig. 1.1 (not to scale) Design a laboratory experiment to determine the resistivity of aluminium using this strip. The usual apparatus of a school laboratory is available, including a metal cutter. You should draw a diagram, on page 3, showing the arrangement of your equipment. In your account you should pay particular attention to (a) the procedure to be followed, (b) the measurements to be taken, (c) the control of variables, (d) the analysis of the data, (e) the safety precautions to be taken. [15] Diagram For Examiner’s Use ......................................................................................................................................................... ......................................................................................................................................................... ......................................................................................................................................................... ......................................................................................................................................................... ......................................................................................................................................................... ......................................................................................................................................................... ......................................................................................................................................................... ......................................................................................................................................................... ......................................................................................................................................................... ......................................................................................................................................................... ......................................................................................................................................................... ......................................................................................................................................................... ......................................................................................................................................................... ......................................................................................................................................................... For ......................................................................................................................................................... Examiner’s Use ......................................................................................................................................................... ......................................................................................................................................................... ......................................................................................................................................................... ......................................................................................................................................................... ......................................................................................................................................................... ......................................................................................................................................................... ......................................................................................................................................................... ......................................................................................................................................................... ......................................................................................................................................................... ......................................................................................................................................................... ......................................................................................................................................................... ......................................................................................................................................................... ......................................................................................................................................................... ......................................................................................................................................................... ......................................................................................................................................................... ......................................................................................................................................................... ......................................................................................................................................................... ......................................................................................................................................................... ......................................................................................................................................................... ......................................................................................................................................................... ......................................................................................................................................................... ......................................................................................................................................................... ......................................................................................................................................................... Defining the Methods of Method of Safety Additional For problem data collection analysis considerations detail Examiner’s Use
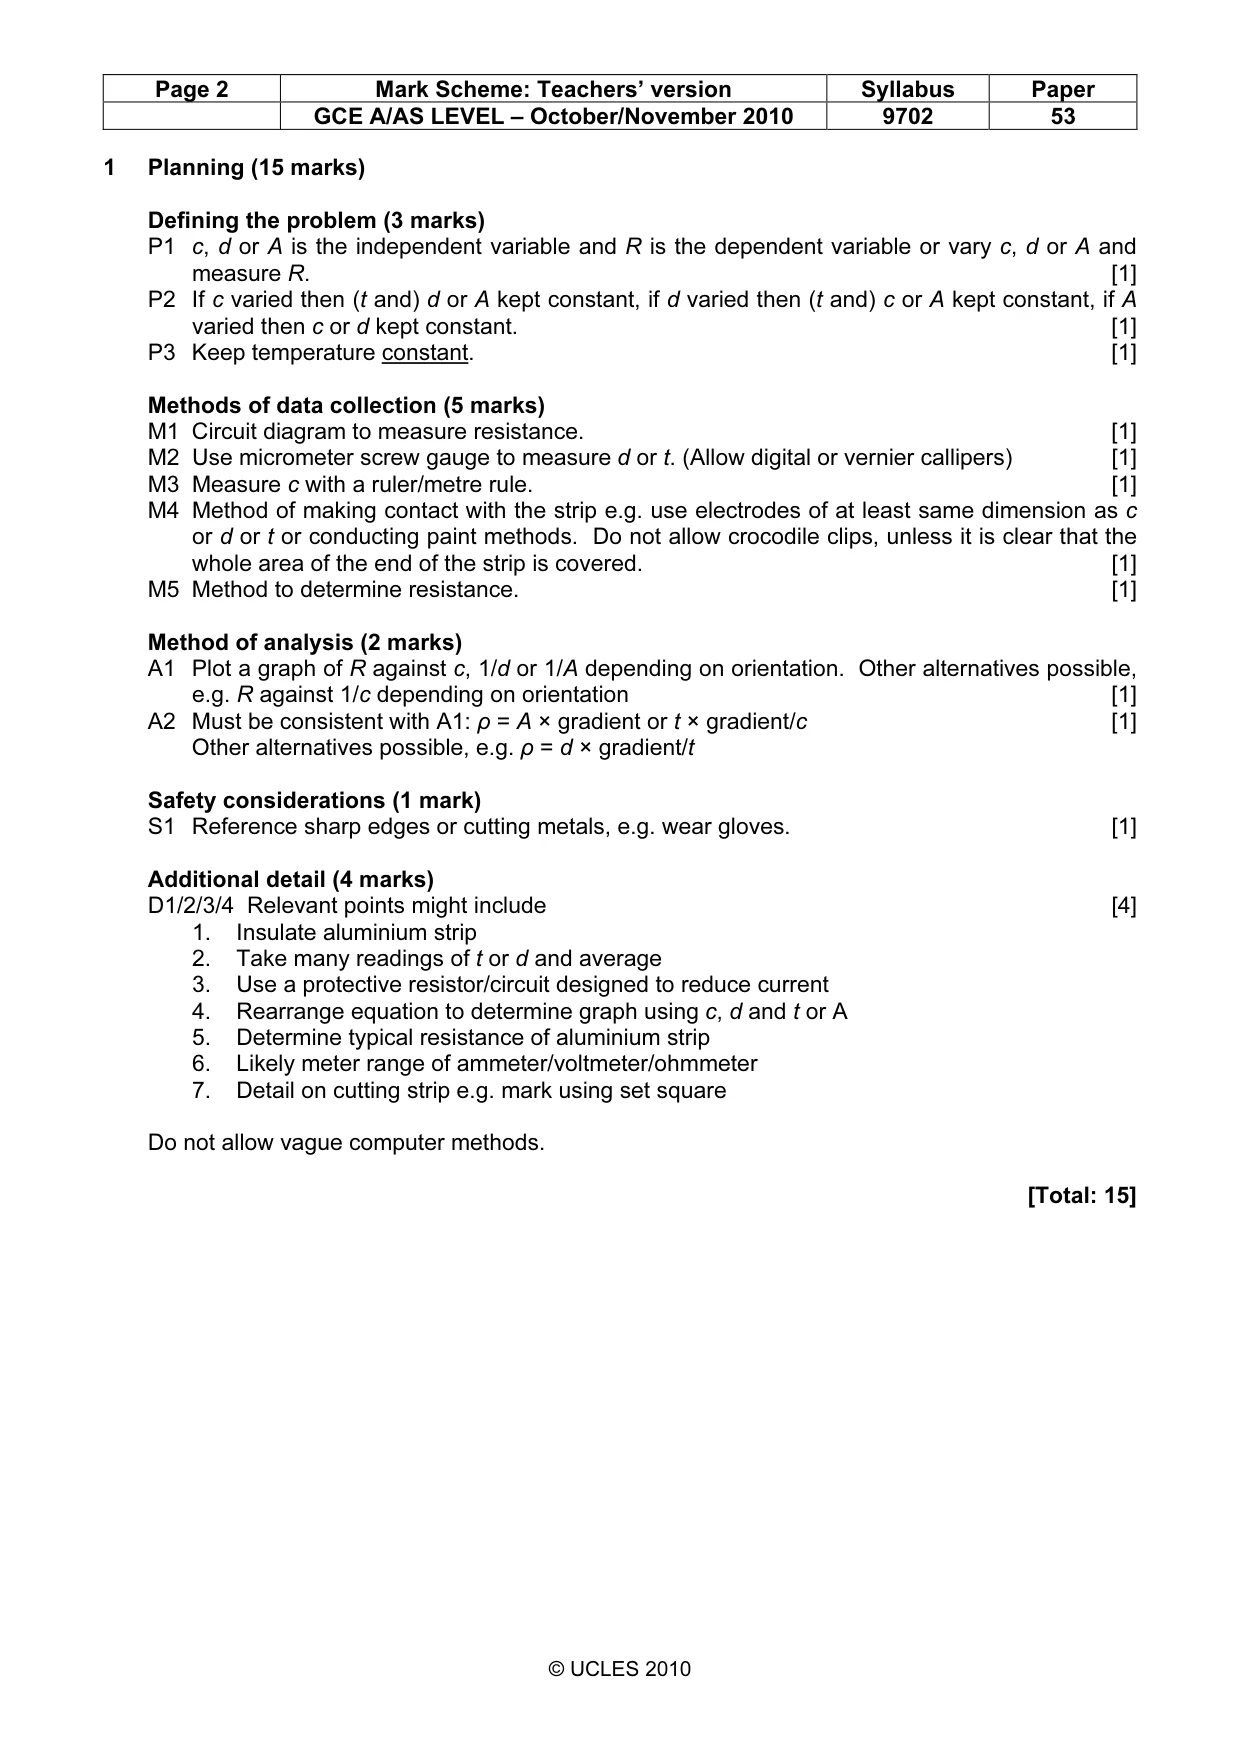
Mark scheme: 1 Planning (15 marks) Defining the problem (3 marks) P1 c, d or A is the independent variable and R is the dependent variable or vary c, d or A and measure R. [1] P2 If c varied then (t and) d or A kept constant, if d varied then (t and) c or A kept constant, if A varied then c or d kept constant. [1] P3 Keep temperature constant. [1] Methods of data collection (5 marks) M1 Circuit diagram to measure resistance. [1] M2 Use micrometer screw gauge to measure d or t. (Allow digital or vernier callipers) [1] M3 Measure c with a ruler/metre rule. [1] M4 Method of making contact with the strip e.g. use electrodes of at least same dimension as c or d or t or conducting paint methods. Do not allow crocodile clips, unless it is clear that the whole area of the end of the strip is covered. [1] M5 Method to determine resistance. [1] Method of analysis (2 marks) A1 Plot a graph of R against c, 1/d or 1/A depending on orientation. Other alternatives possible, e.g. R against 1/c depending on orientation [1] A2 Must be consistent with A1: ρ = A × gradient or t × gradient/c [1] Other alternatives possible, e.g. ρ = d × gradient/t Safety considerations (1 mark) S1 Reference sharp edges or cutting metals, e.g. wear gloves. [1] Additional detail (4 marks) D1/2/3/4 Relevant points might include [4] 1. Insulate aluminium strip 2. Take many readings of t or d and average 3. Use a protective resistor/circuit designed to reduce current 4. Rearrange equation to determine graph using c, d and t or A 5. Determine typical resistance of aluminium strip 6. Likely meter range of ammeter/voltmeter/ohmmeter 7. Detail on cutting strip e.g. mark using set square Do not allow vague computer methods. [Total: 15] GCE A/AS LEVEL – October/November 2010 9702 53
Q2 · A student is investigating how the discharge of a capacitor through a resistor depends on…
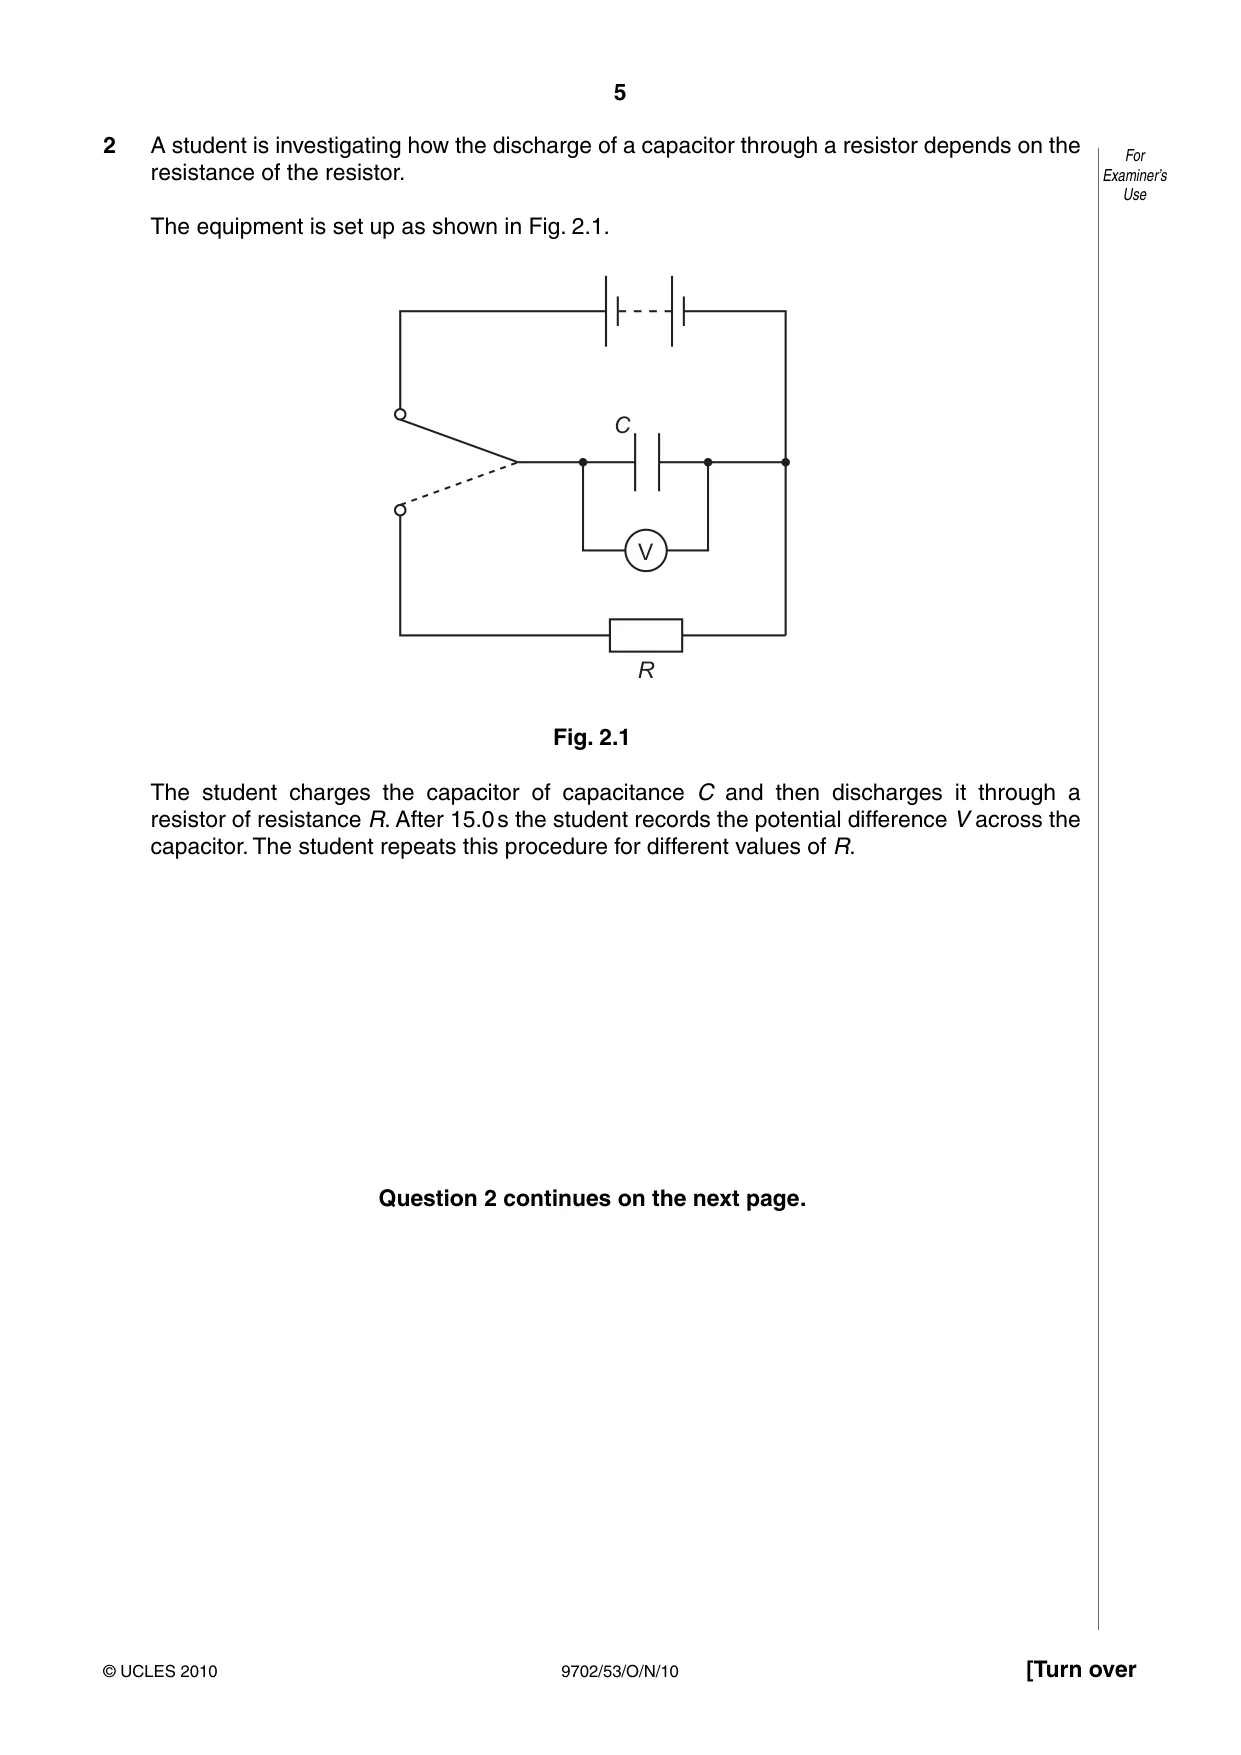
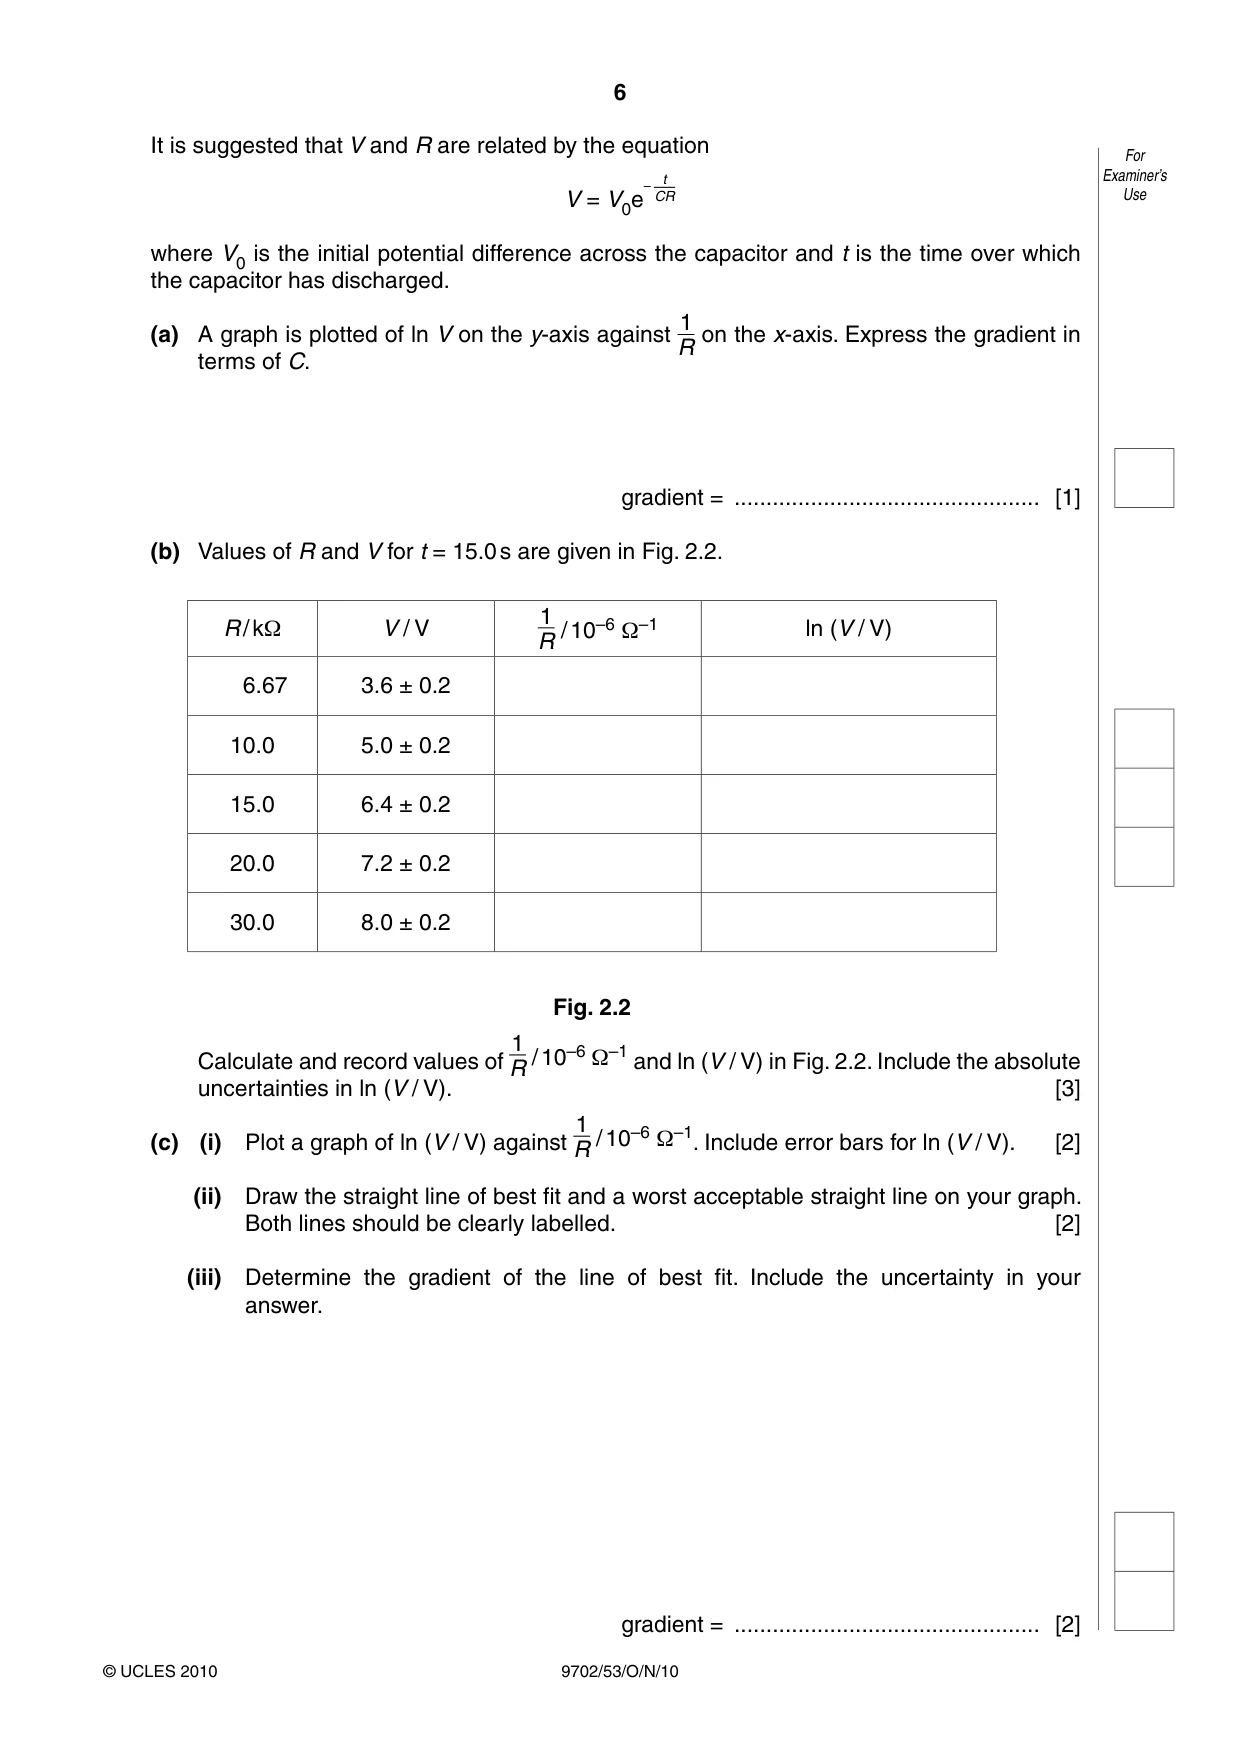
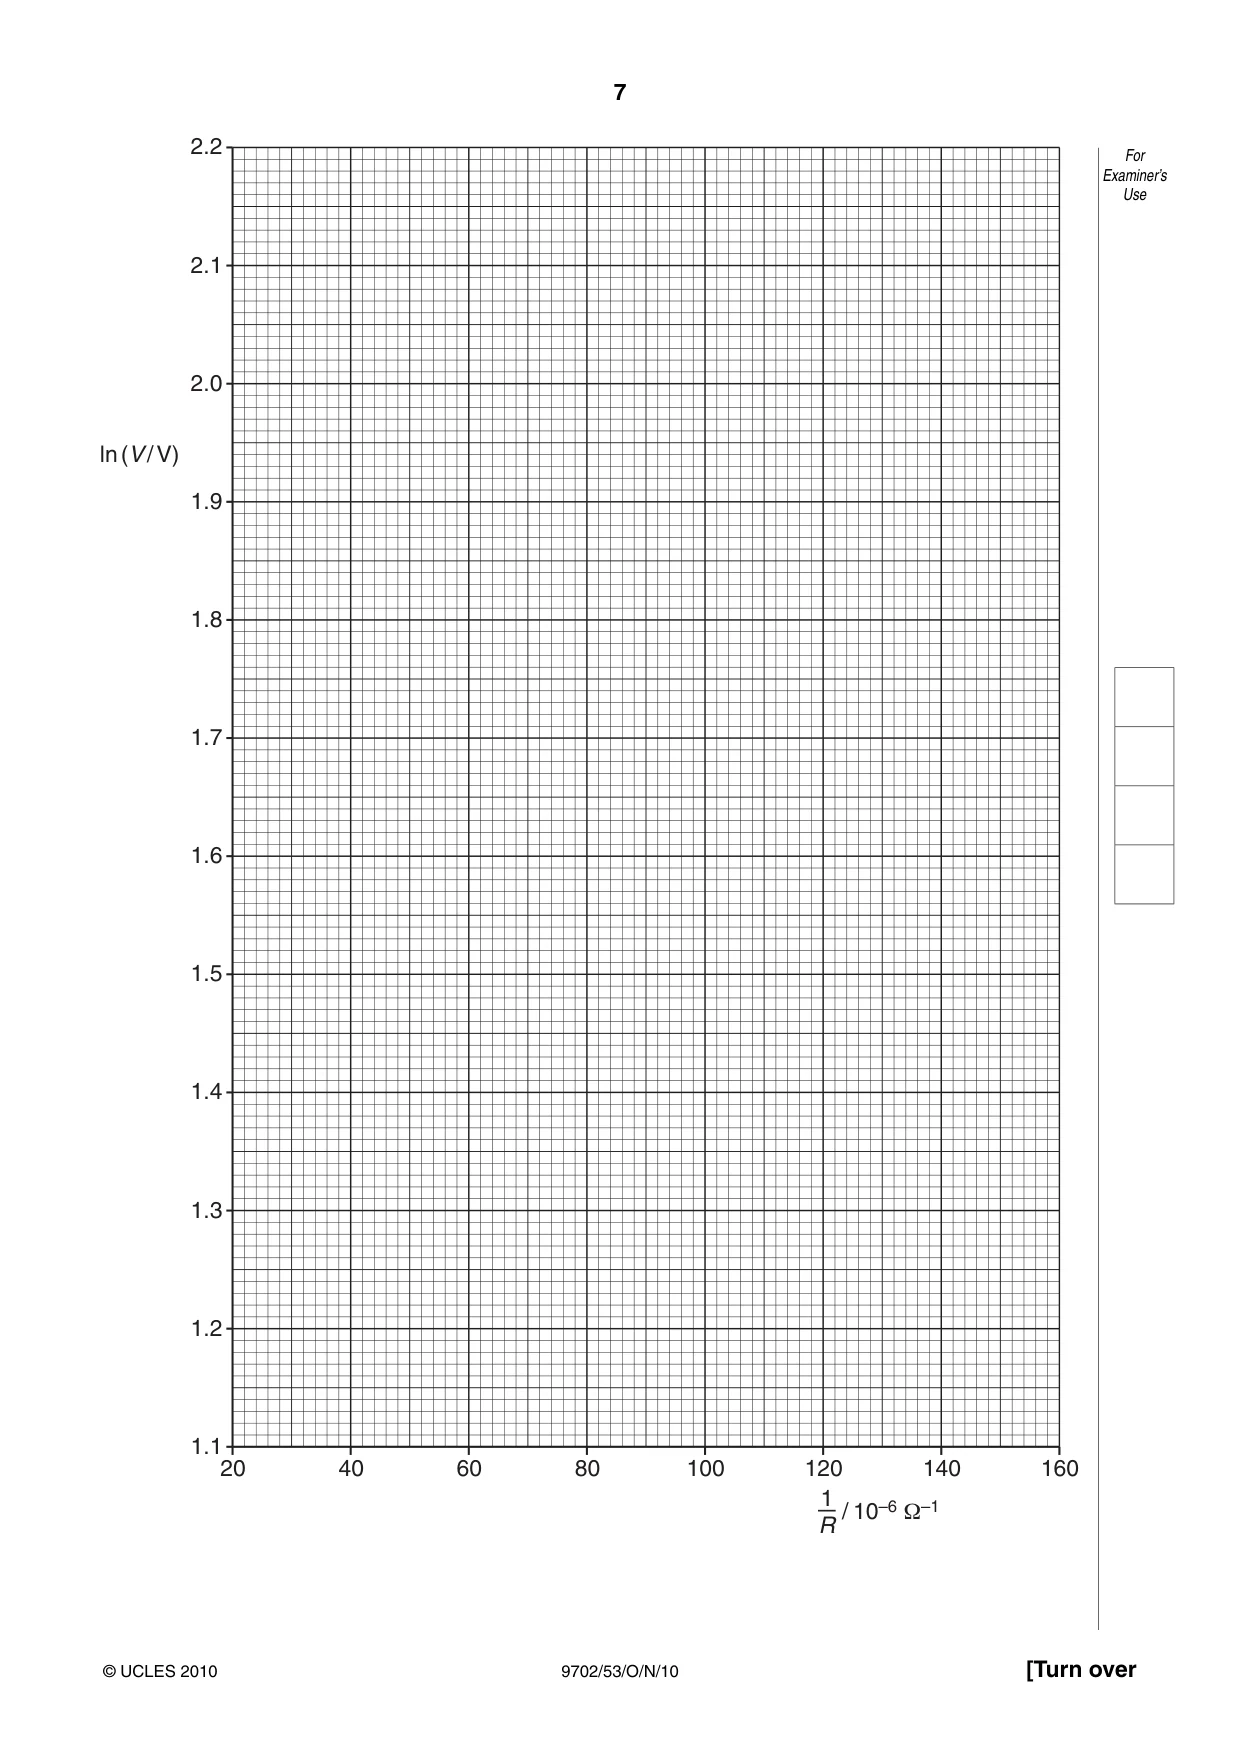
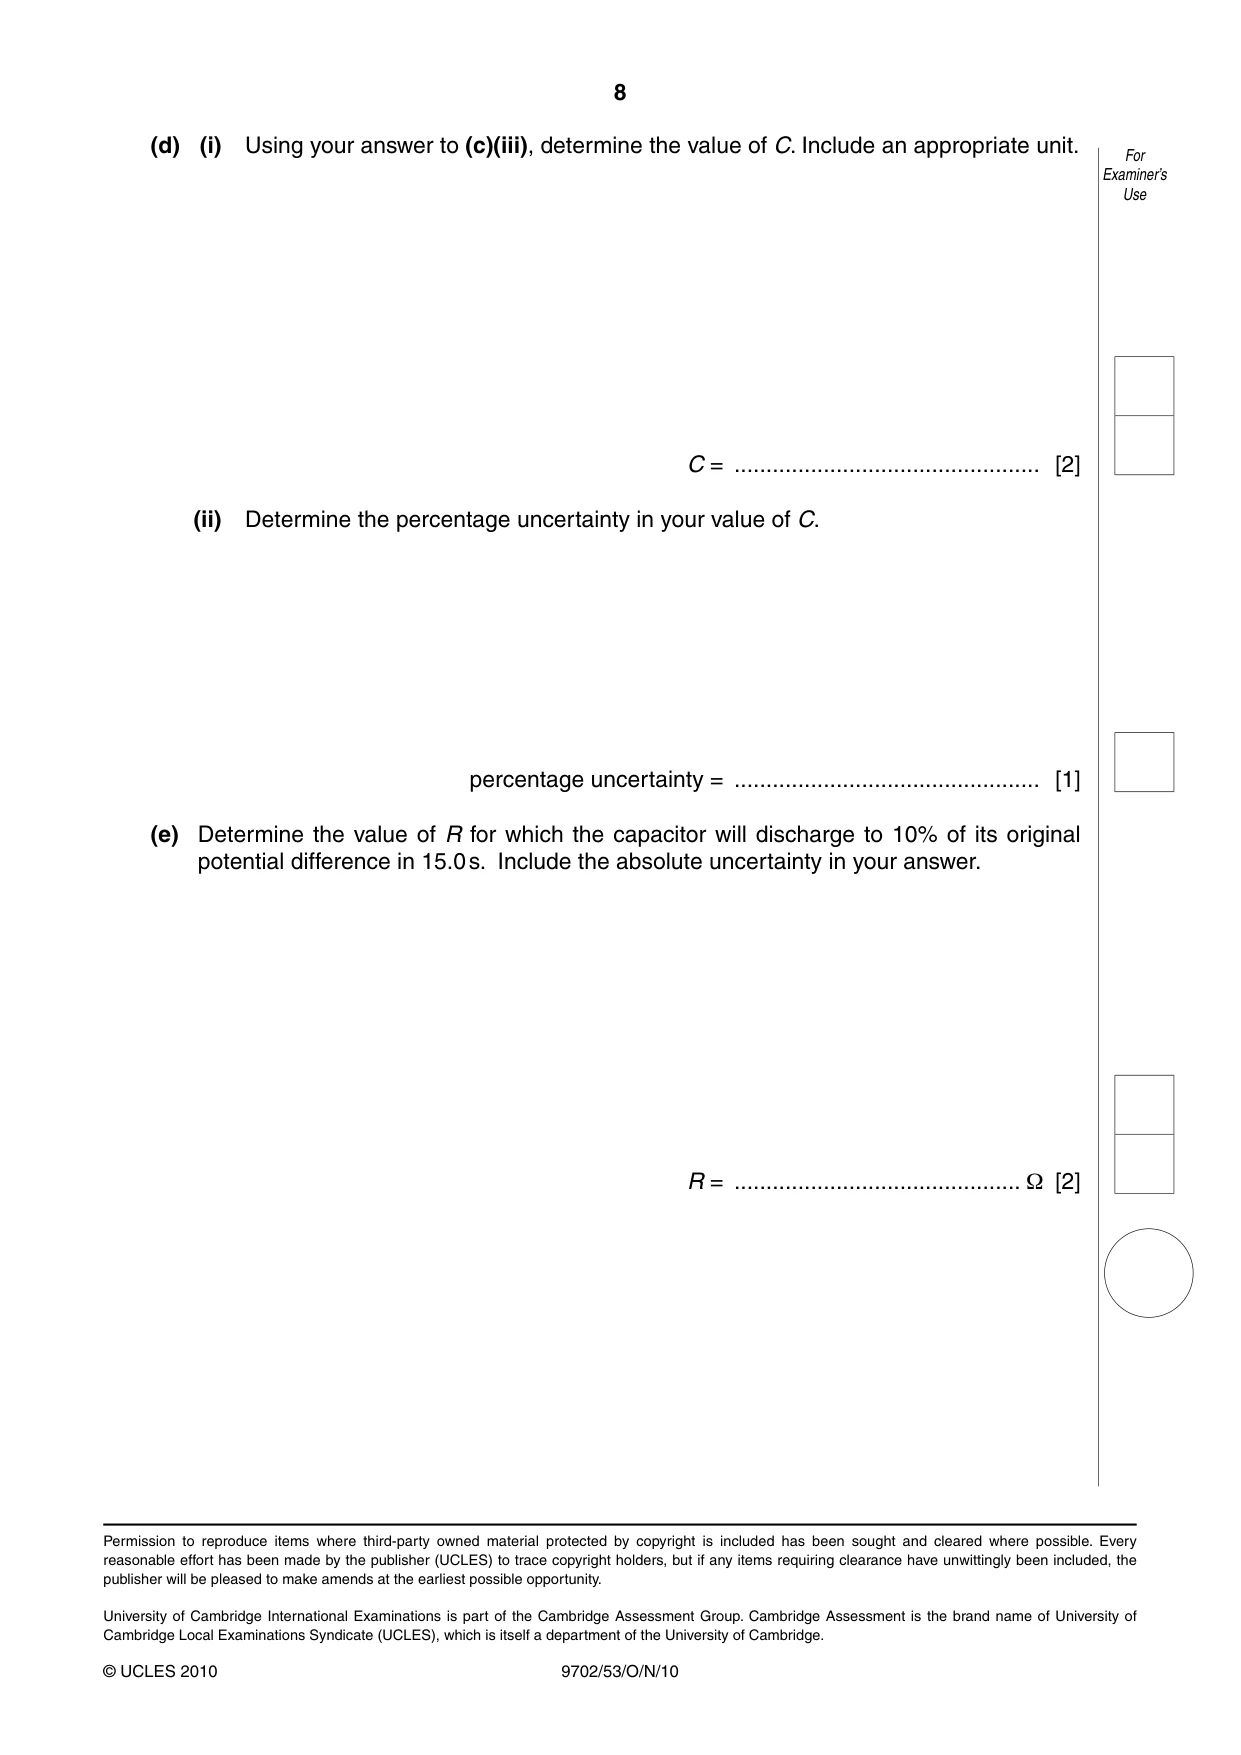
2 A student is investigating how the discharge of a capacitor through a resistor depends on the For resistance of the resistor. Examiner’s Use The equipment is set up as shown in Fig. 2.1. C V R Fig. 2.1 The student charges the capacitor of capacitance C and then discharges it through a resistor of resistance R. After 15.0 s the student records the potential difference V across the capacitor. The student repeats this procedure for different values of R. Question 2 continues on the next page. It is suggested that V and R are related by the equation For – t Examiner’s V = V0e CR Use where V0 is the initial potential difference across the capacitor and t is the time over which the capacitor has discharged. 1 (a) A graph is plotted of ln V on the y-axis against on the x-axis. Express the gradient in R terms of C. gradient = ................................................ [1] (b) Values of R and V for t = 15.0 s are given in Fig. 2.2. 1 R / kΩ V / V / 10–6 Ω–1 ln (V / V) R 6.67 3.6 ± 0.2 10.0 5.0 ± 0.2 15.0 6.4 ± 0.2 20.0 7.2 ± 0.2 30.0 8.0 ± 0.2 Fig. 2.2 1 Calculate and record values of / 10–6 Ω–1 and ln (V / V) in Fig. 2.2. Include the absolute R uncertainties in ln (V / V). [3] 1 (c) (i) Plot a graph of ln (V / V) against / 10–6 Ω–1. Include error bars for ln (V / V). [2] R (ii) Draw the straight line of best fit and a worst acceptable straight line on your graph. Both lines should be clearly labelled. [2] (iii) Determine the gradient of the line of best fit. Include the uncertainty in your answer. gradient = ................................................ [2] 2.2 For Examiner’s Use 2.1 2.0 ln (V / V) 1.9 1.8 1.7 1.6 1.5 1.4 1.3 1.2 1.1 20 40 60 80 100 120 140 160 / 10–6 Ω–1 1––R
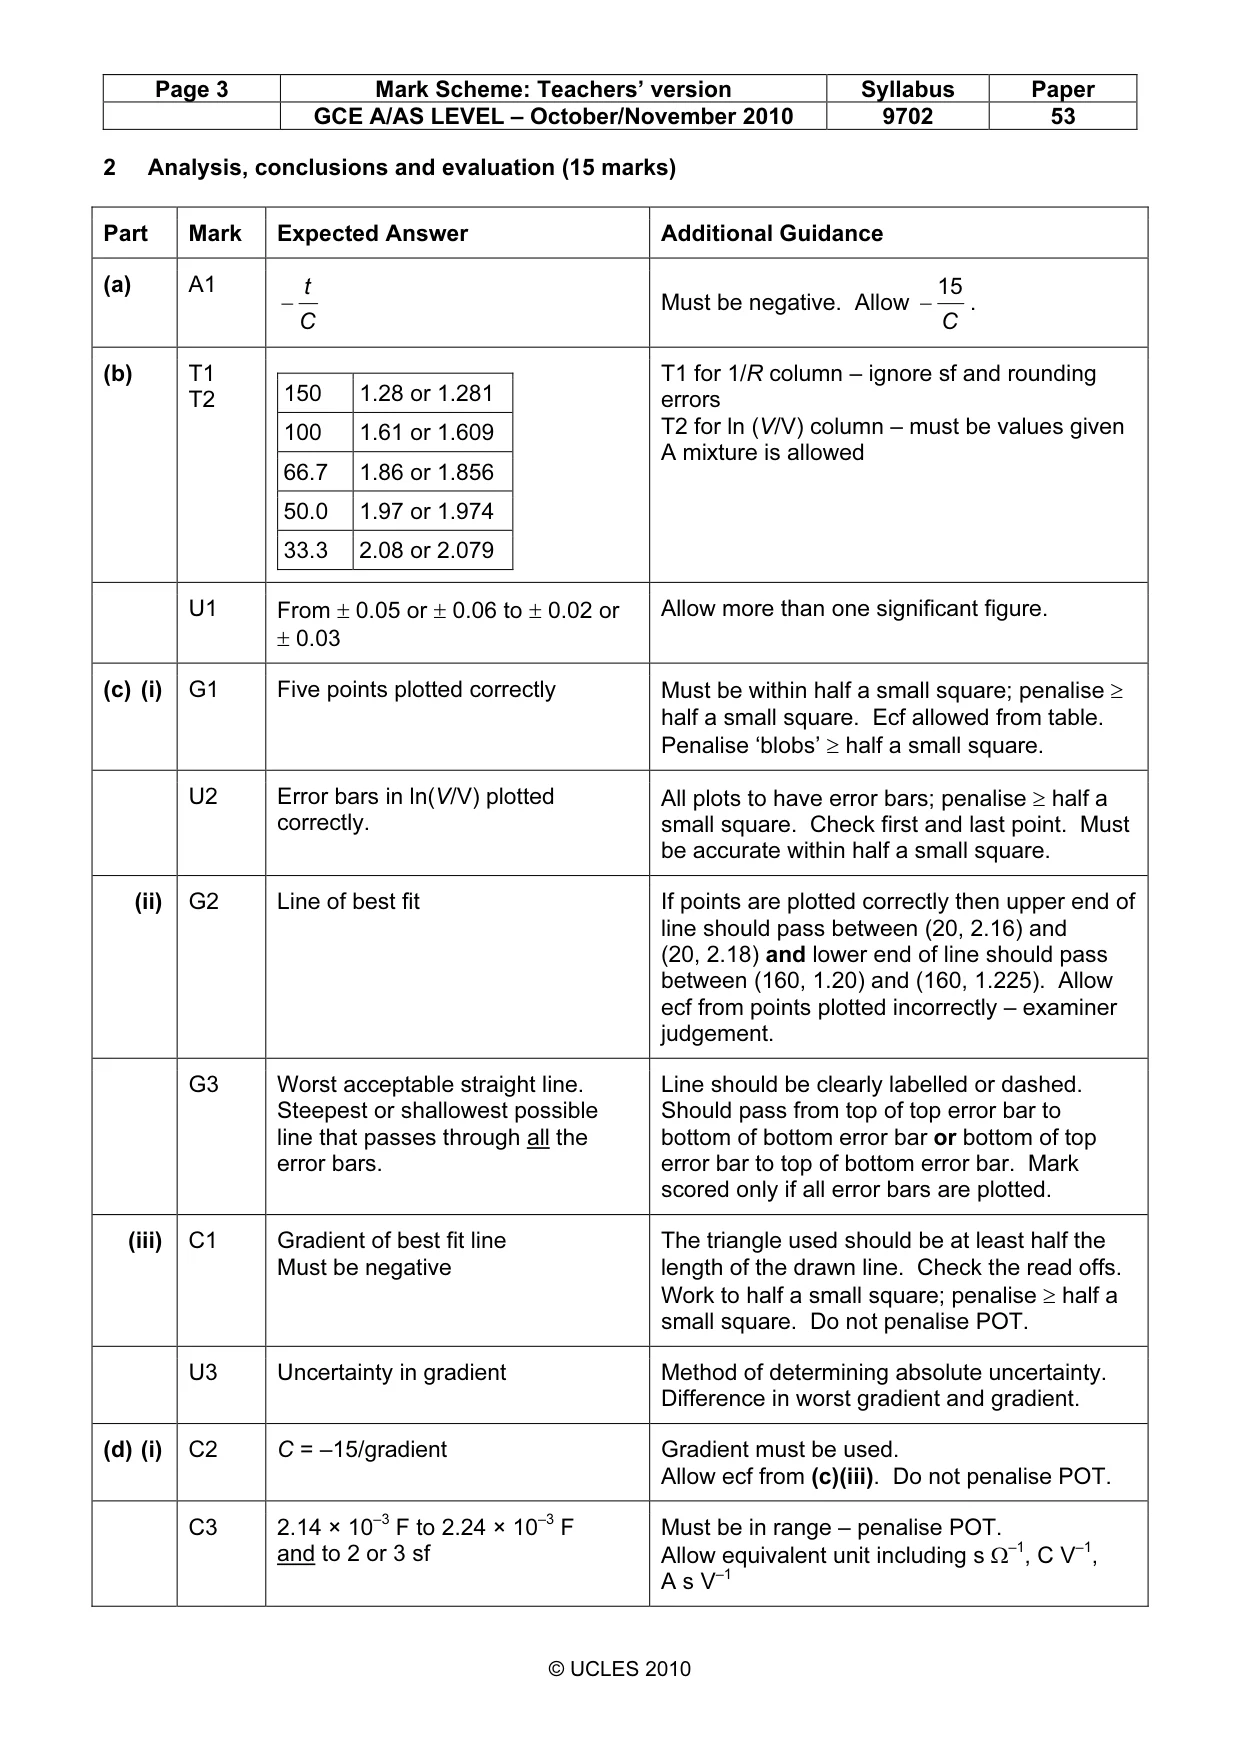
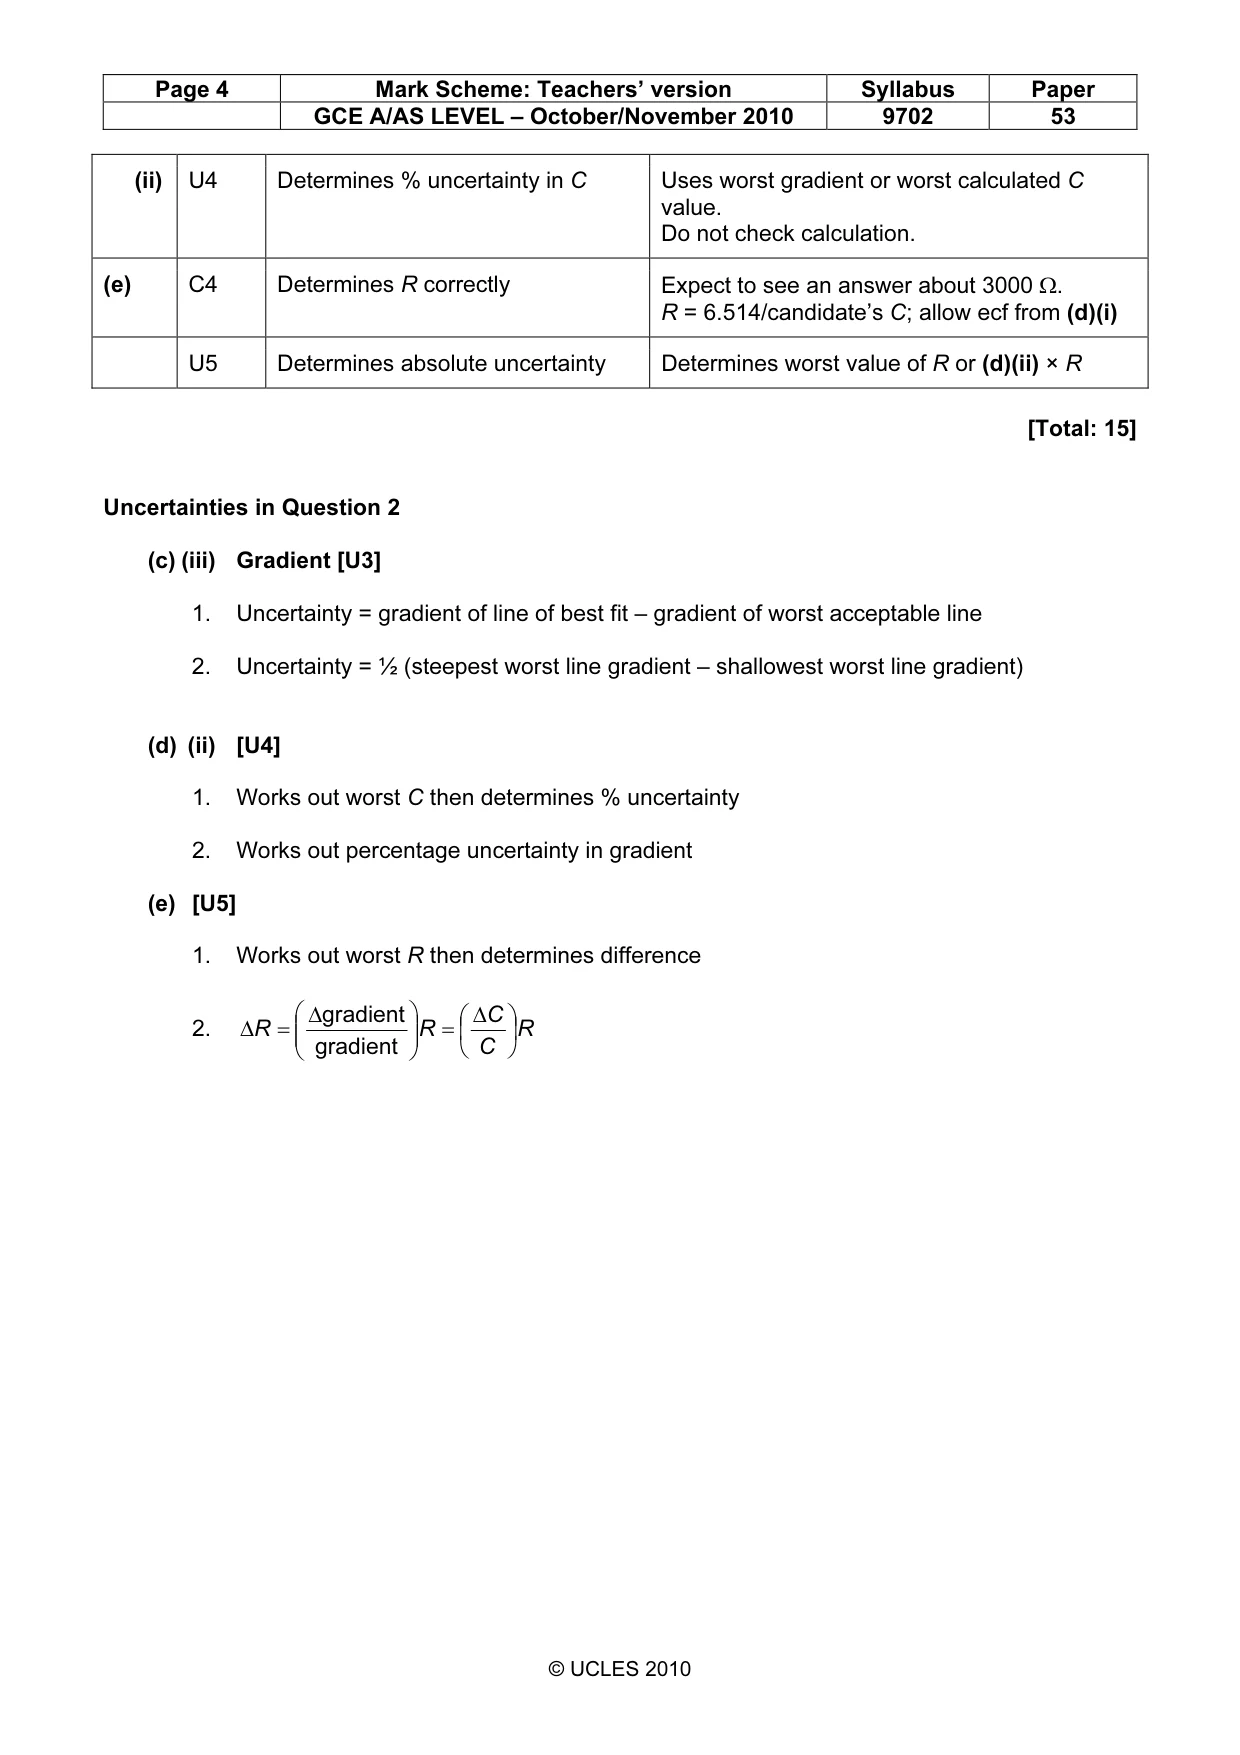
Mark scheme: 2 Analysis, conclusions and evaluation (15 marks) Part Mark Expected Answer Additional Guidance (a) A1 t 15 − Must be negative. Allow − . C C (b) T1 T1 for 1/R column – ignore sf and rounding T2 150 1.28 or 1.281 errors T2 for ln (V/V) column – must be values given 100 1.61 or 1.609 A mixture is allowed 66.7 1.86 or 1.856 50.0 1.97 or 1.974 33.3 2.08 or 2.079 U1 From ± 0.05 or ± 0.06 to ± 0.02 or Allow more than one significant figure. ± 0.03 (c) (i) G1 Five points plotted correctly Must be within half a small square; penalise ≥ half a small square. Ecf allowed from table. Penalise ‘blobs’ ≥ half a small square. U2 Error bars in ln(V/V) plotted All plots to have error bars; penalise ≥ half a correctly. small square. Check first and last point. Must be accurate within half a small square. (ii) G2 Line of best fit If points are plotted correctly then upper end of line should pass between (20, 2.16) and (20, 2.18) and lower end of line should pass between (160, 1.20) and (160, 1.225). Allow ecf from points plotted incorrectly – examiner judgement. G3 Worst acceptable straight line. Line should be clearly labelled or dashed. Steepest or shallowest possible Should pass from top of top error bar to line that passes through all the bottom of bottom error bar or bottom of top error bars. error bar to top of bottom error bar. Mark scored only if all error bars are plotted. (iii) C1 Gradient of best fit line The triangle used should be at least half the Must be negative length of the drawn line. Check the read offs. Work to half a small square; penalise ≥ half a small square. Do not penalise POT. U3 Uncertainty in gradient Method of determining absolute uncertainty. Difference in worst gradient and gradient. (d) (i) C2 C = –15/gradient Gradient must be used. Allow ecf from (c)(iii). Do not penalise POT. C3 2.14 × 10⁻³ F to 2.24 × 10⁻³ F Must be in range – penalise POT. and to 2 or 3 sf Allow equivalent unit including s Ω–1, C V–1, A s V–1 GCE A/AS LEVEL – October/November 2010 9702 53 (ii) U4 Determines % uncertainty in C Uses worst gradient or worst calculated C value. Do not check calculation. (e) C4 Determines R correctly Expect to see an answer about 3000 Ω. R = 6.514/candidate’s C; allow ecf from (d)(i) U5 Determines absolute uncertainty Determines worst value of R or (d)(ii) × R [Total: 15] Uncertainties in Question 2 (c) (iii) Gradient [U3] 1. Uncertainty = gradient of line of best fit – gradient of worst acceptable line 2. Uncertainty = ½ (steepest worst line gradient – shallowest worst line gradient) (d) (ii) [U4] 1. Works out worst C then determines % uncertainty 2. Works out percentage uncertainty in gradient (e) [U5] 1. Works out worst R then determines difference ∆gradient ∆C 2. ∆R = R = R gradient C
What was in this paper
The subtopics covered by these 2 questions, and how many questions each got. Open one in a new tab to see every Cambridge question on it.
What you needed in this session
Cambridge’s own grade thresholds for 2010 Oct/Nov, Paper 5 · Variant 3. A higher threshold means an easier paper — the bar moves with how the cohort did.