Cambridge A Level Marine Science 9693 — 2020 Oct/Nov Paper 1 · Variant 0
9693/10/O/N/20
The question paper and its mark scheme, free to read here and free to download. This is Cambridge’s own paper, exactly as it was sat.
Question paper16 pages
Mark scheme
No mark scheme is in the library for this paper.
Paper as text
Question paper, page 1
Cambridge International AS & A Level This document has 16 pages. Blank pages are indicated. DC (JC/JG) 187654/4 © UCLES 2020 [Turn over * 7 4 5 1 0 6 5 8 0 1 * MARINE SCIENCE 9693/01 Paper 1 AS Structured Questions October/November 2020 1 hour 30 minutes You must answer on the question paper. No additional materials are needed. INSTRUCTIONS ● Answer all questions. ● Use a black or dark blue pen. You may use an HB pencil for any diagrams or graphs. ● Write your name, centre number and candidate number in the boxes at the top of the page. ● Write your answer to each question in the space provided. ● Do not use an erasable pen or correction fluid. ● Do not write on any bar codes. ● You may use a calculator. ● You should show all your working and use appropriate units. INFORMATION ● The total mark for this paper is 75. ● The number of marks for each question or part question is shown in brackets [ ].
Question paper, page 2
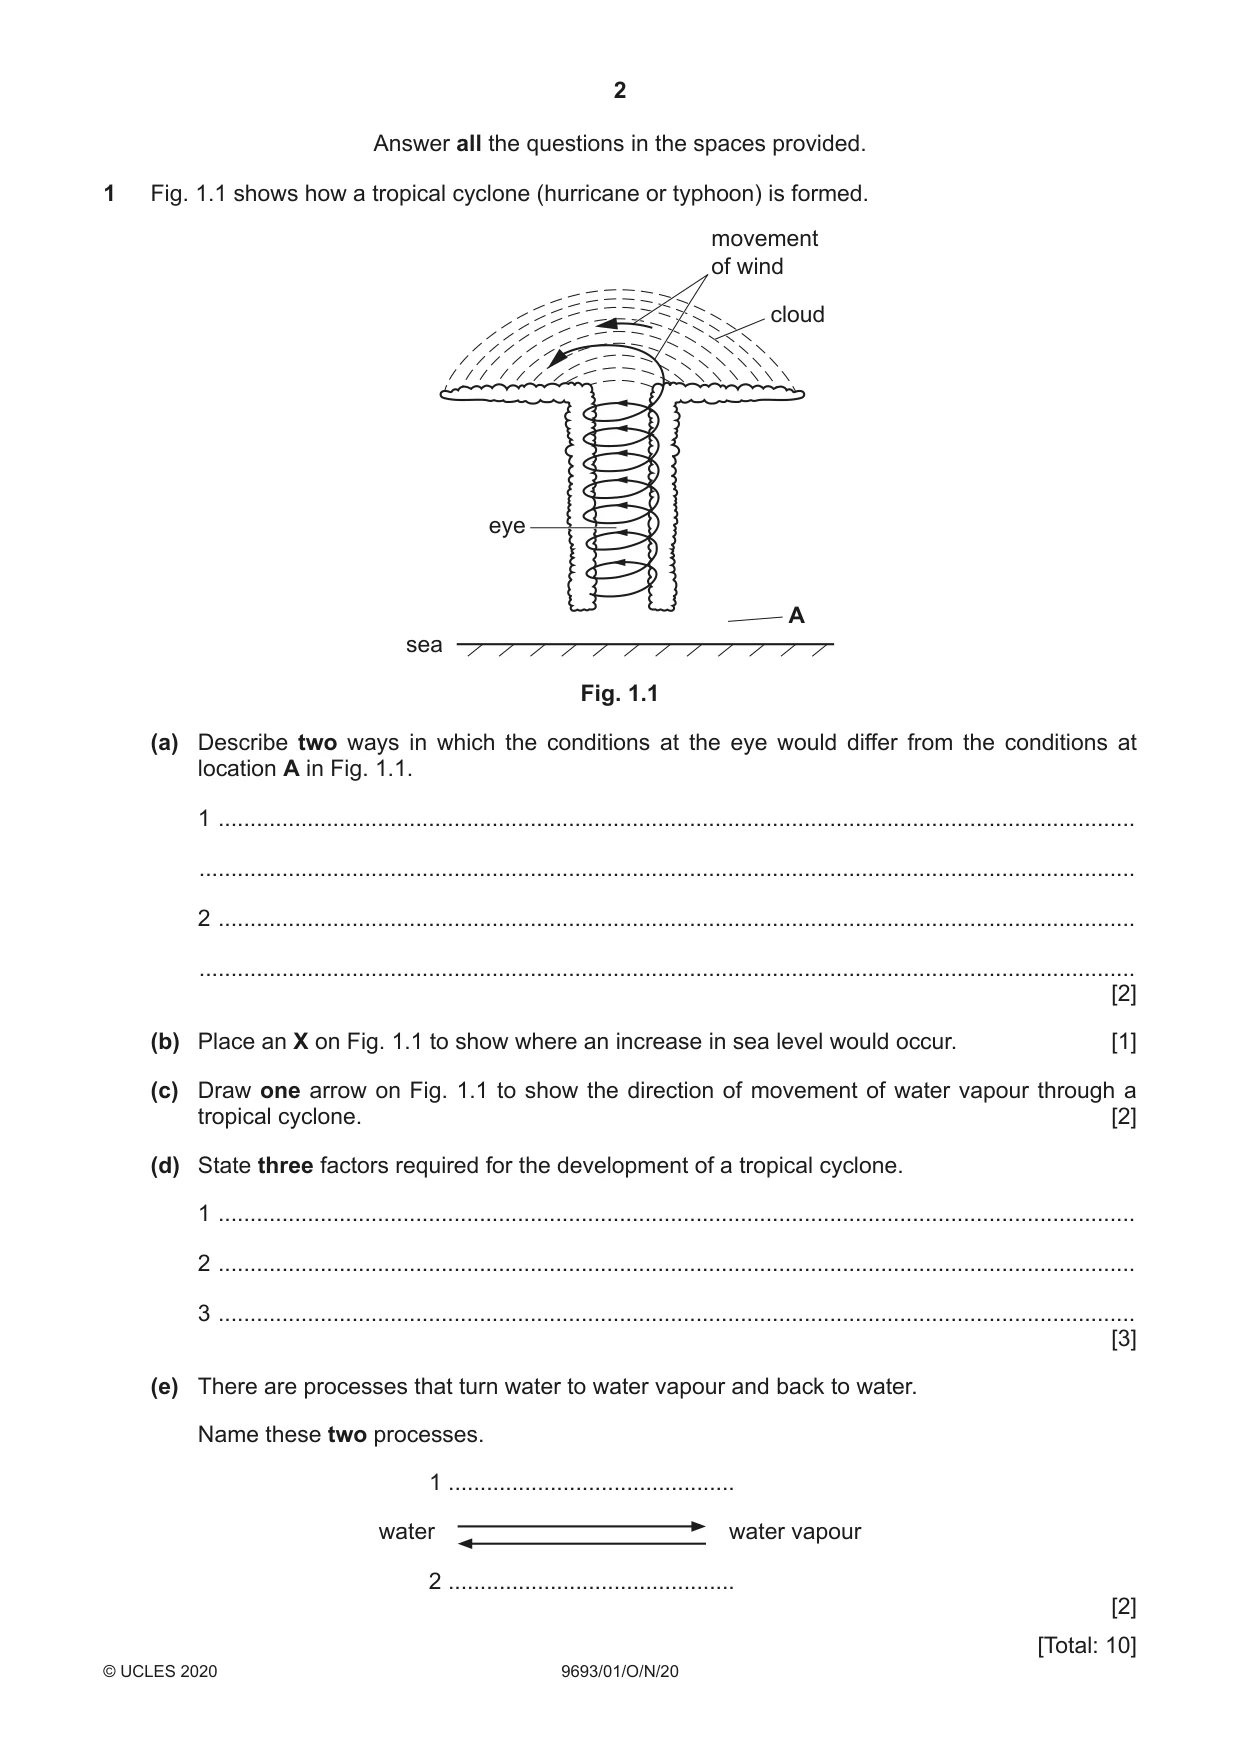
2 9693/01/O/N/20 © UCLES 2020 Answer all the questions in the spaces provided. 1 Fig. 1.1 shows how a tropical cyclone (hurricane or typhoon) is formed. eye cloud movement of wind sea A Fig. 1.1 (a) Describe two ways in which the conditions at the eye would differ from the conditions at location A in Fig. 1.1. 1 … … 2 … … [2] (b) Place an X on Fig. 1.1 to show where an increase in sea level would occur. [1] (c) Draw one arrow on Fig. 1.1 to show the direction of movement of water vapour through a tropical cyclone. [2] (d) State three factors required for the development of a tropical cyclone. 1 … 2 … 3 … [3] (e) There are processes that turn water to water vapour and back to water. Name these two processes. 1 … water water vapour 2 … [2] [Total: 10]
Question paper, page 3
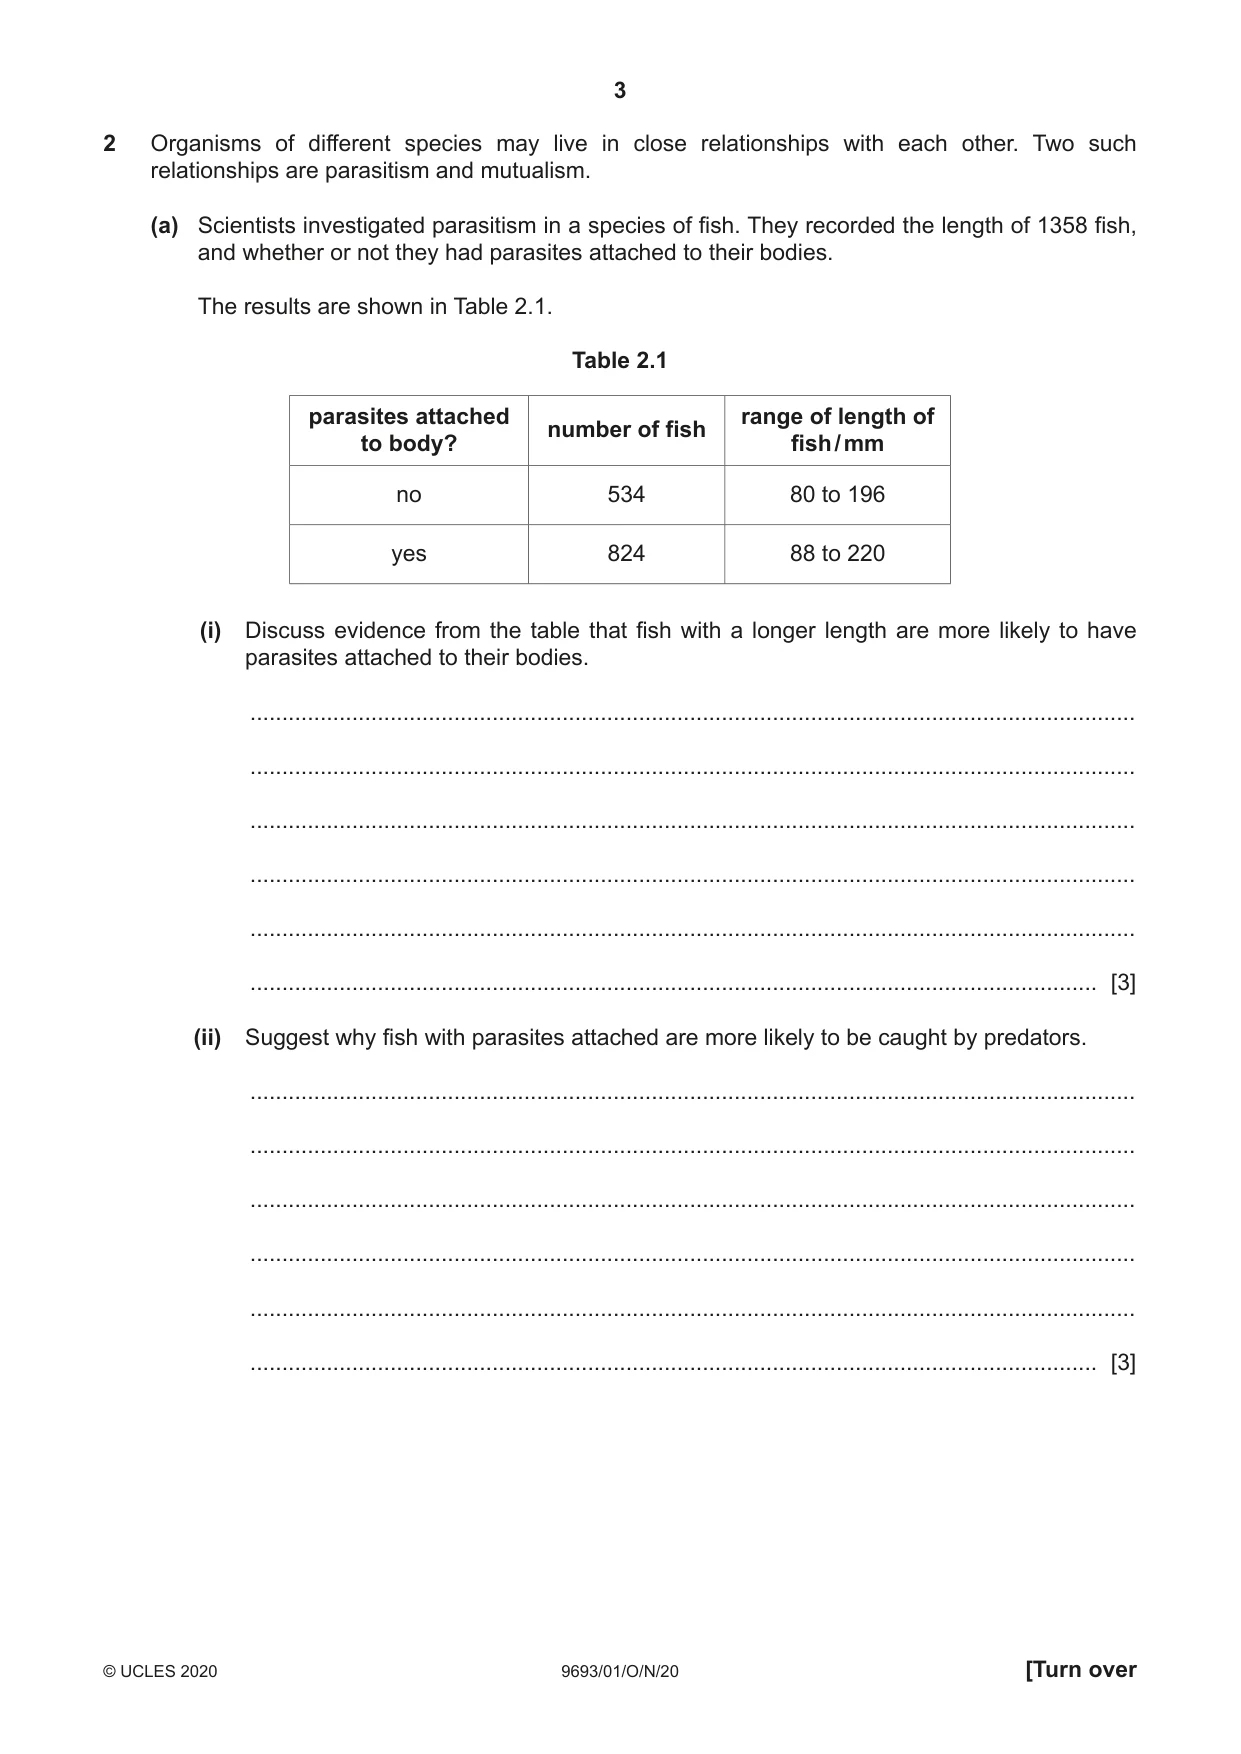
3 9693/01/O/N/20 © UCLES 2020 [Turn over 2 Organisms of different species may live in close relationships with each other. Two such relationships are parasitism and mutualism. (a) Scientists investigated parasitism in a species of fish. They recorded the length of 1358 fish, and whether or not they had parasites attached to their bodies. The results are shown in Table 2.1. Table 2.1 parasites attached to body? number of fish range of length of fish / mm no 534 80 to 196 yes 824 88 to 220 (i) Discuss evidence from the table that fish with a longer length are more likely to have parasites attached to their bodies. … … … … … … [3] (ii) Suggest why fish with parasites attached are more likely to be caught by predators. … … … … … … [3]
Question paper, page 4
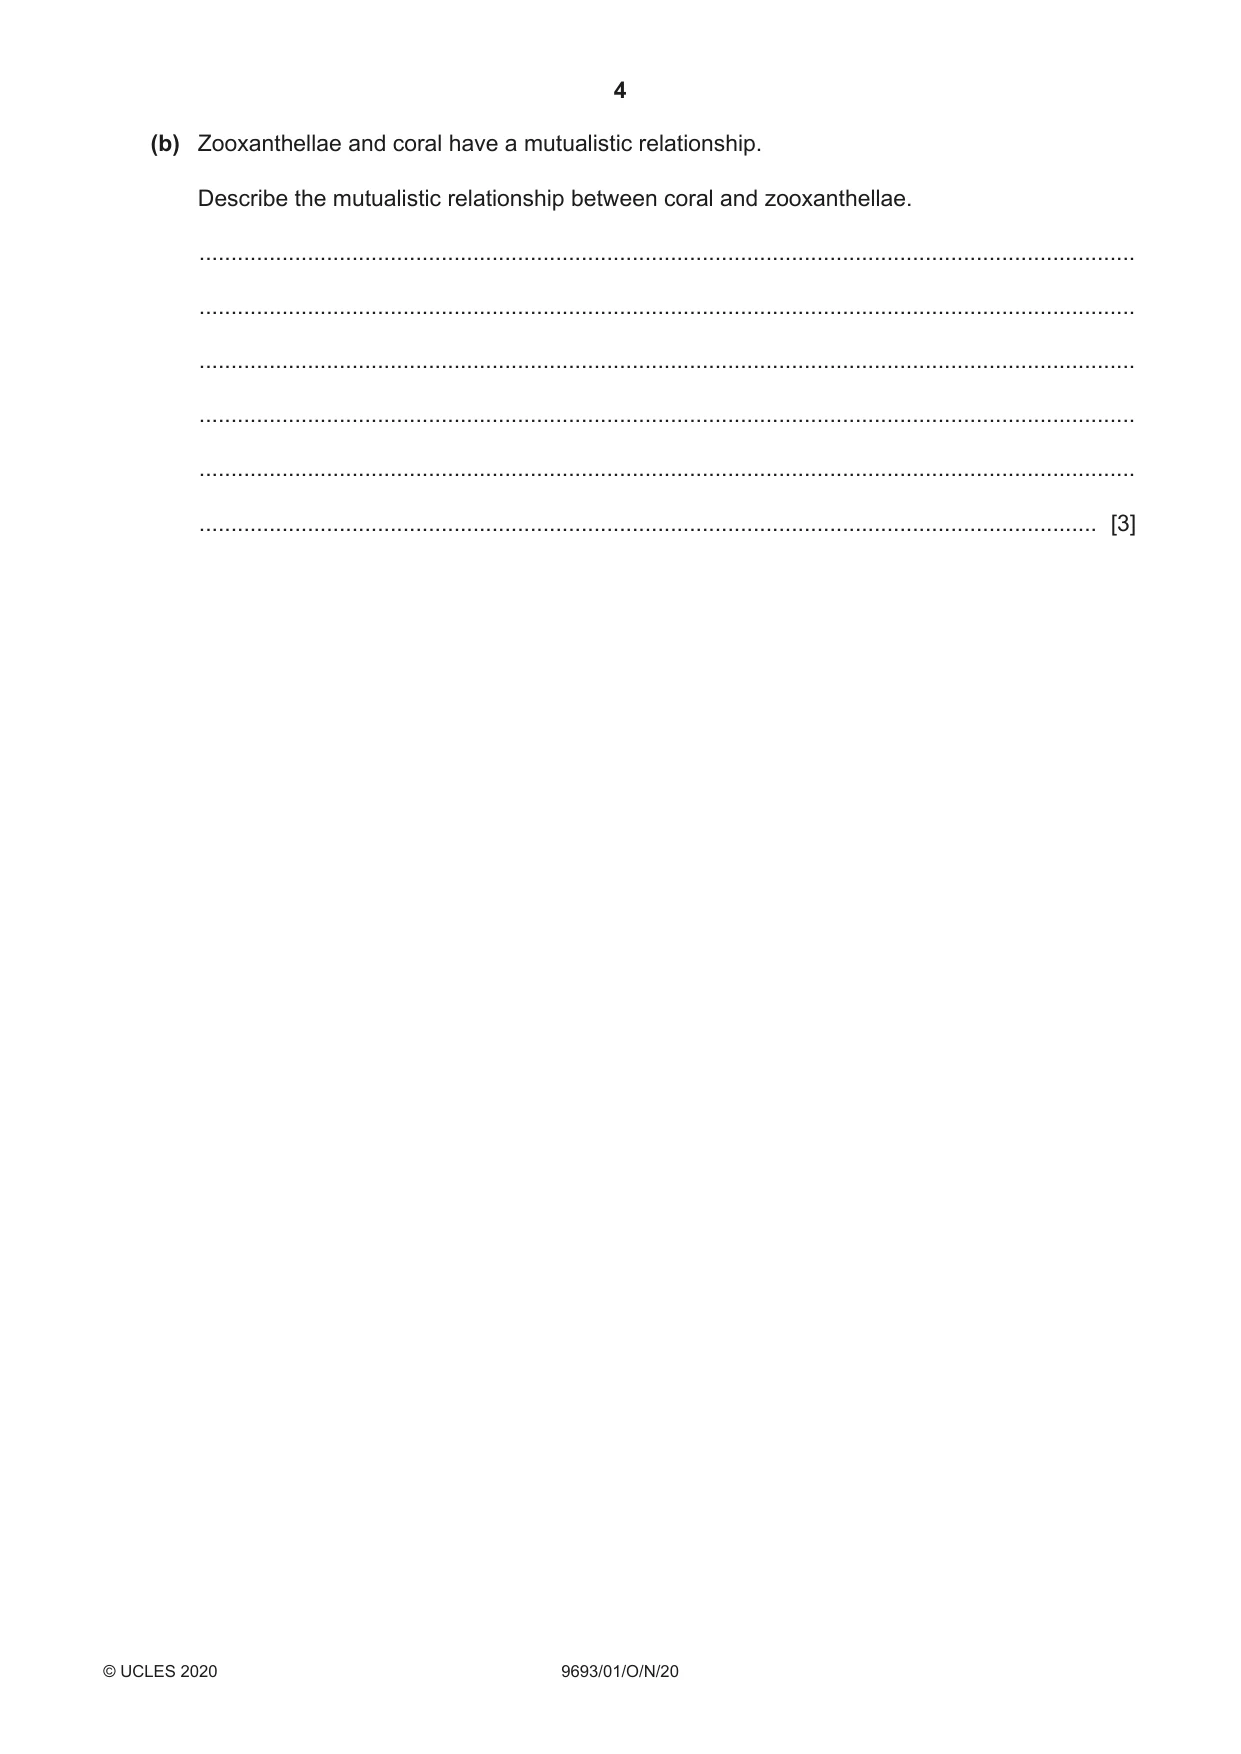
4 9693/01/O/N/20 © UCLES 2020 (b) Zooxanthellae and coral have a mutualistic relationship. Describe the mutualistic relationship between coral and zooxanthellae. … … … … … … [3]
Question paper, page 5
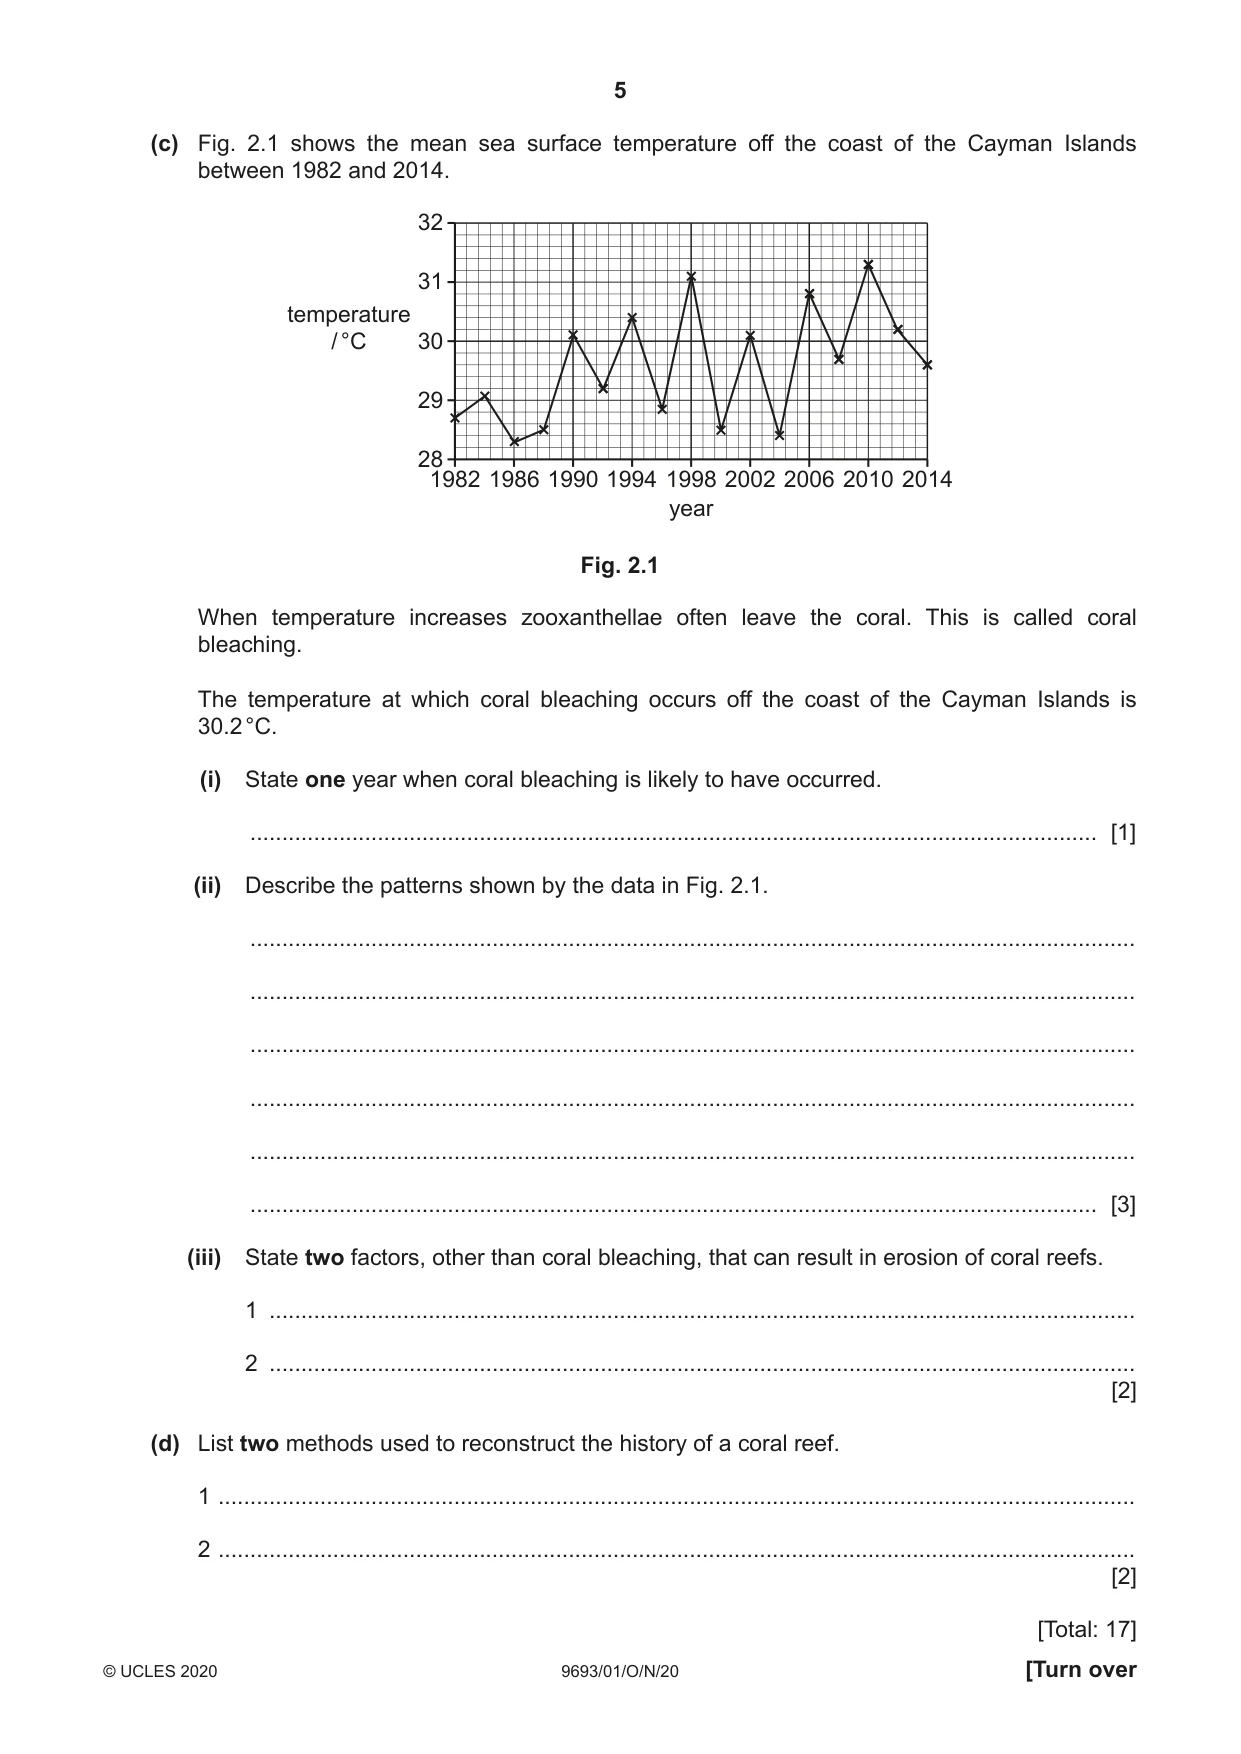
5 9693/01/O/N/20 © UCLES 2020 [Turn over (c) Fig. 2.1 shows the mean sea surface temperature off the coast of the Cayman Islands between 1982 and 2014. 32 31 30 29 28 1982 1986 1990 1994 1998 2002 2006 2010 2014 temperature / °C year Fig. 2.1 When temperature increases zooxanthellae often leave the coral. This is called coral bleaching. The temperature at which coral bleaching occurs off the coast of the Cayman Islands is 30.2 °C. (i) State one year when coral bleaching is likely to have occurred. … [1] (ii) Describe the patterns shown by the data in Fig. 2.1. … … … … … … [3] (iii) State two factors, other than coral bleaching, that can result in erosion of coral reefs. 1 … 2 … [2] (d) List two methods used to reconstruct the history of a coral reef. 1 … 2 … [2] [Total: 17]
Question paper, page 6
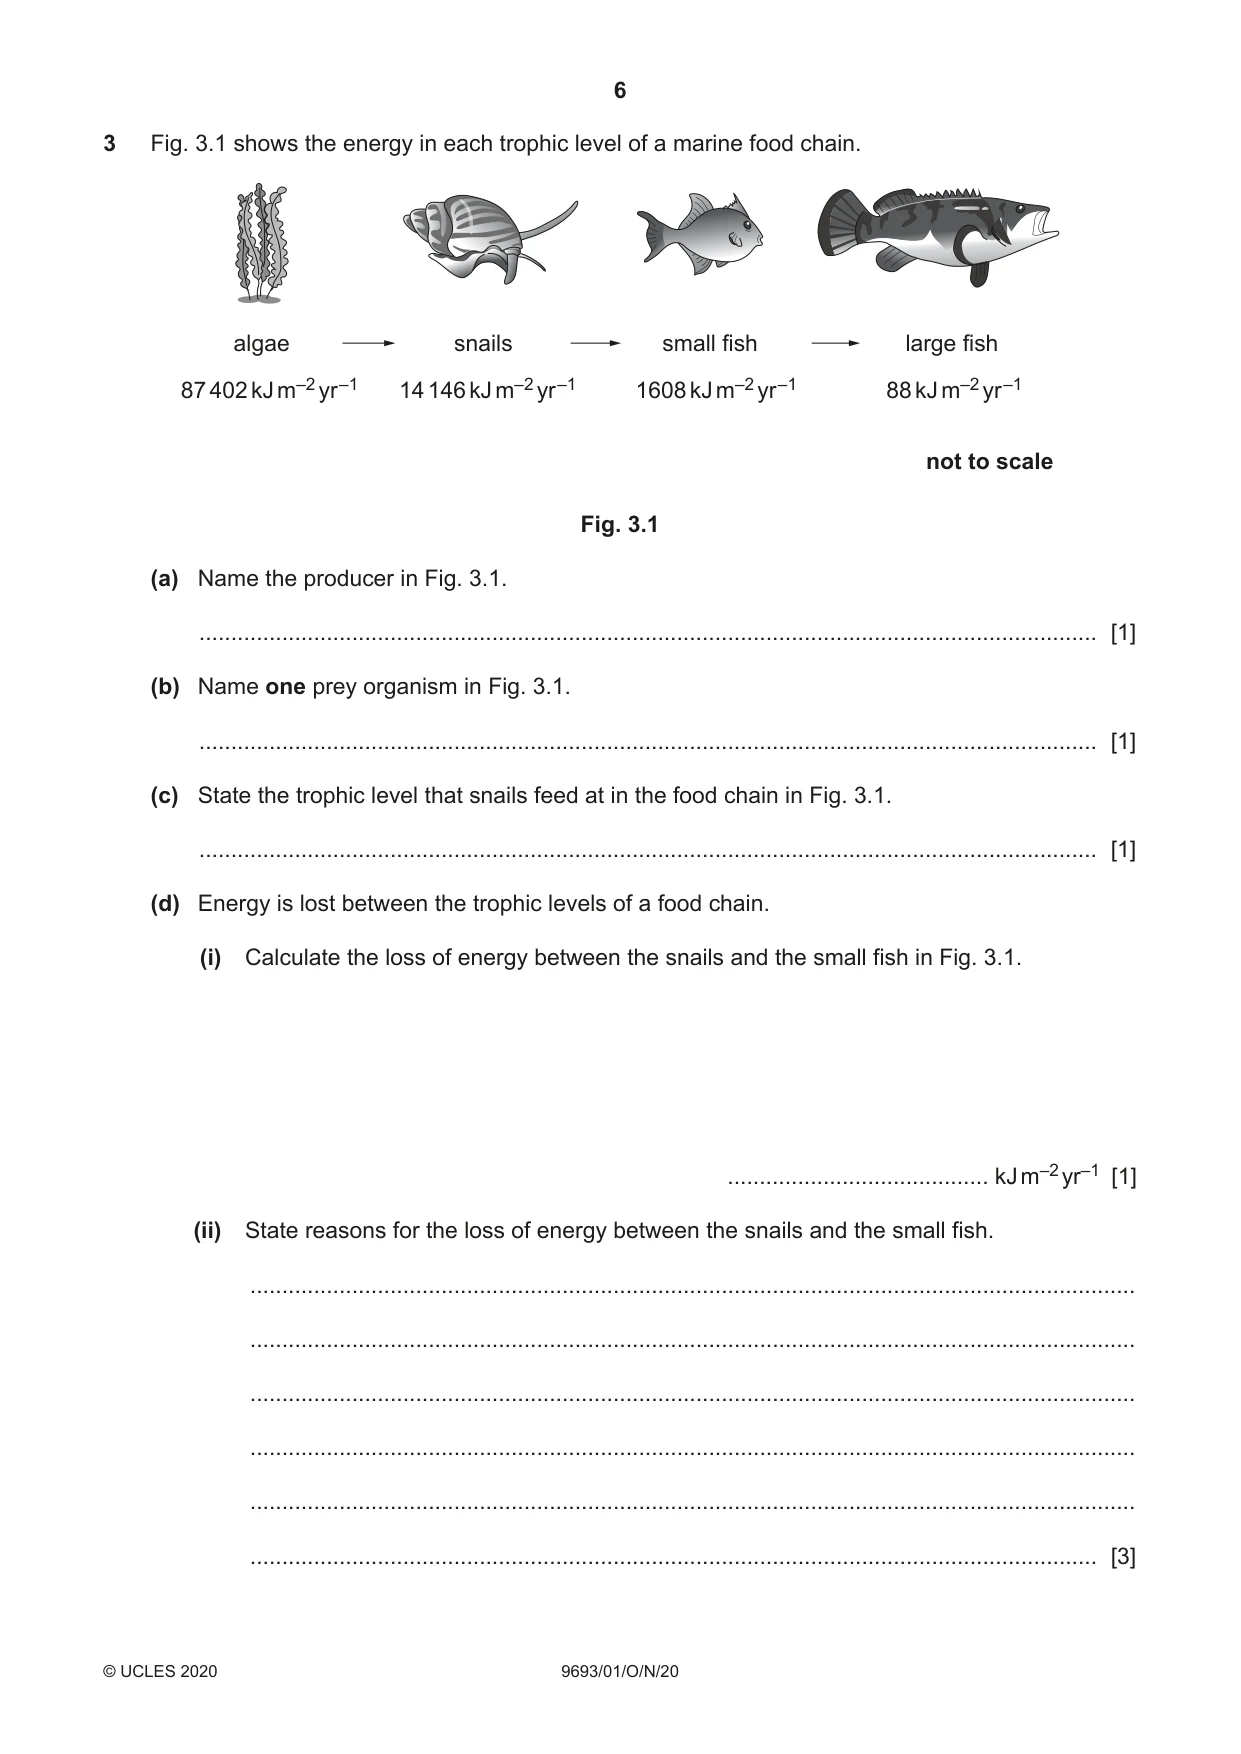
6 9693/01/O/N/20 © UCLES 2020 3 Fig. 3.1 shows the energy in each trophic level of a marine food chain. algae snails small fish large fish 87 402 kJ m–2 yr –1 14 146 kJ m–2 yr –1 1608 kJ m–2 yr –1 88 kJ m–2 yr –1 not to scale Fig. 3.1 (a) Name the producer in Fig. 3.1. … [1] (b) Name one prey organism in Fig. 3.1. … [1] (c) State the trophic level that snails feed at in the food chain in Fig. 3.1. … [1] (d) Energy is lost between the trophic levels of a food chain. (i) Calculate the loss of energy between the snails and the small fish in Fig. 3.1. … kJ m–2 yr–1 [1] (ii) State reasons for the loss of energy between the snails and the small fish. … … … … … … [3]
Question paper, page 7
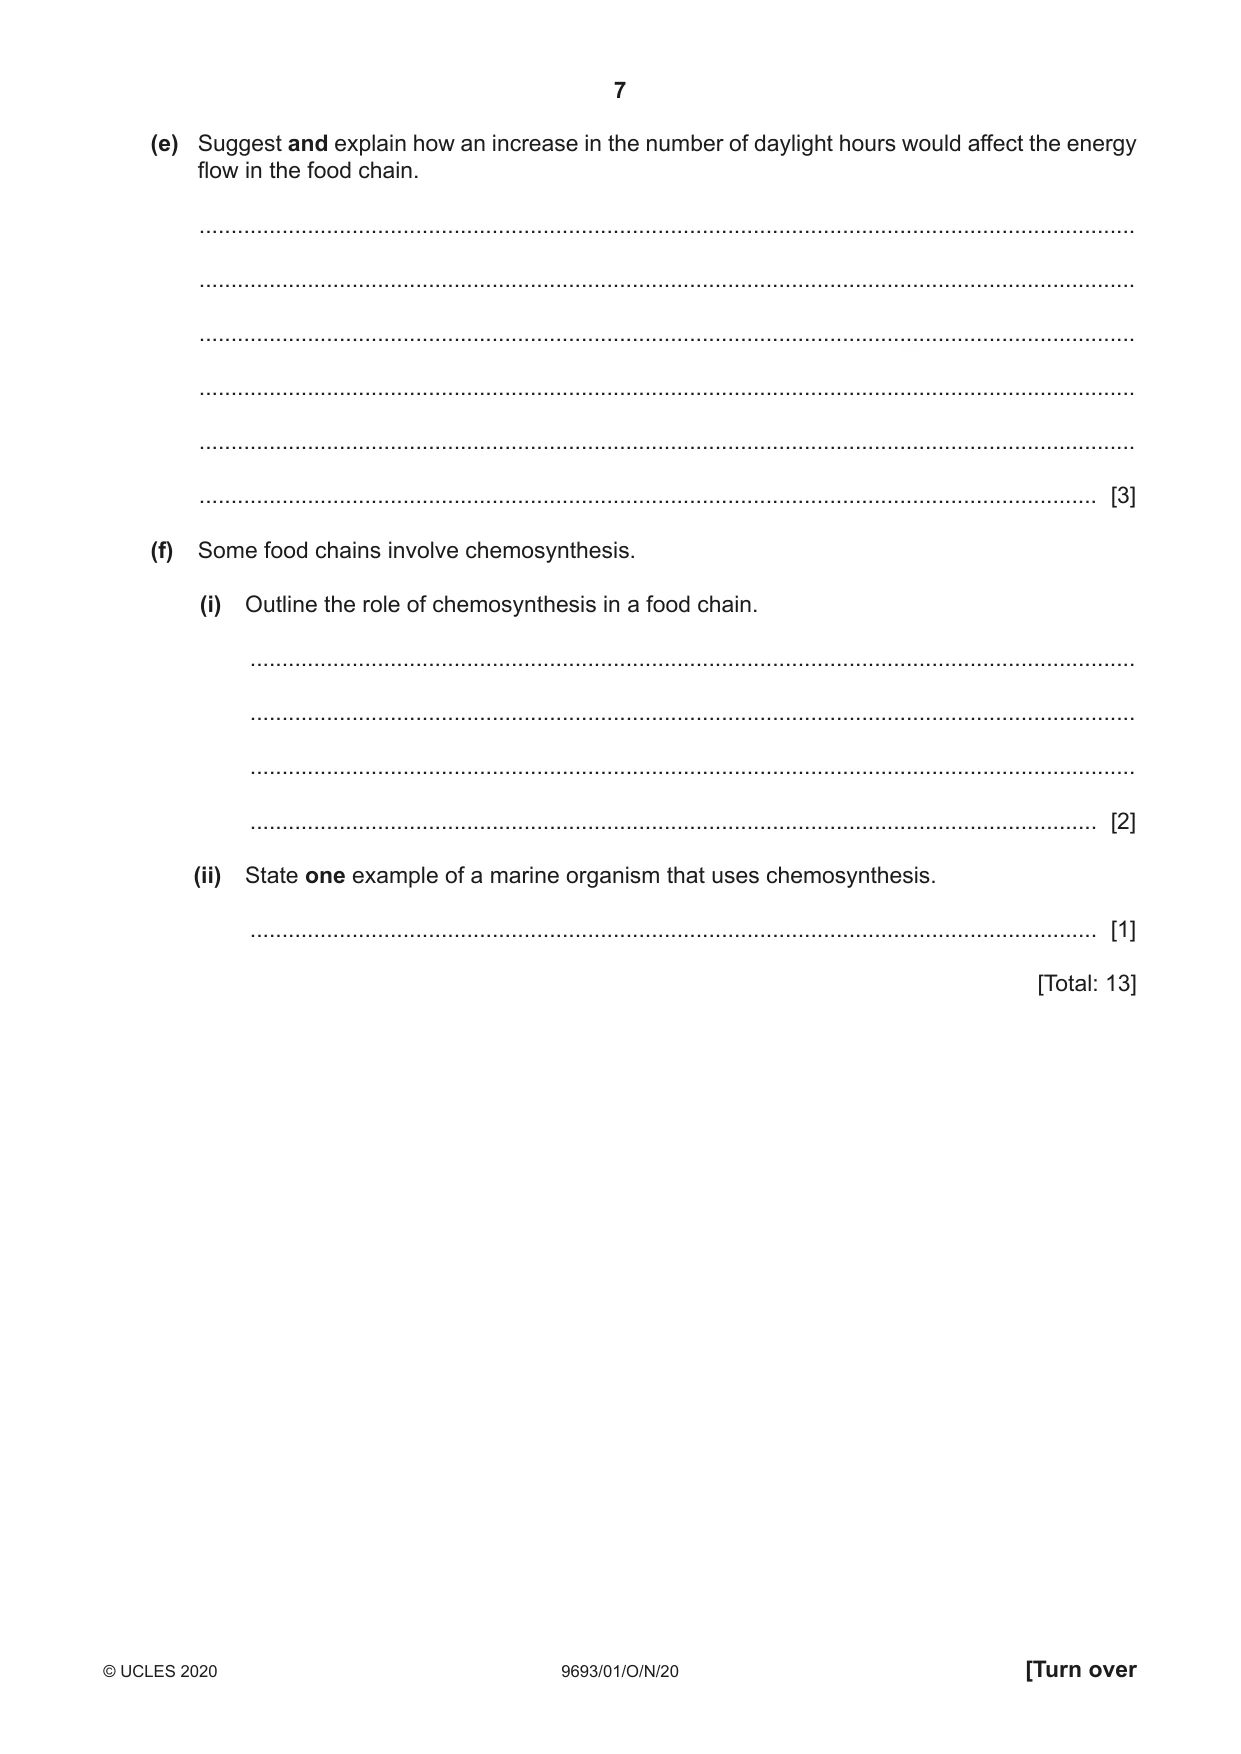
7 9693/01/O/N/20 © UCLES 2020 [Turn over (e) Suggest and explain how an increase in the number of daylight hours would affect the energy flow in the food chain. … … … … … … [3] (f) Some food chains involve chemosynthesis. (i) Outline the role of chemosynthesis in a food chain. … … … … [2] (ii) State one example of a marine organism that uses chemosynthesis. … [1] [Total: 13]
Question paper, page 8
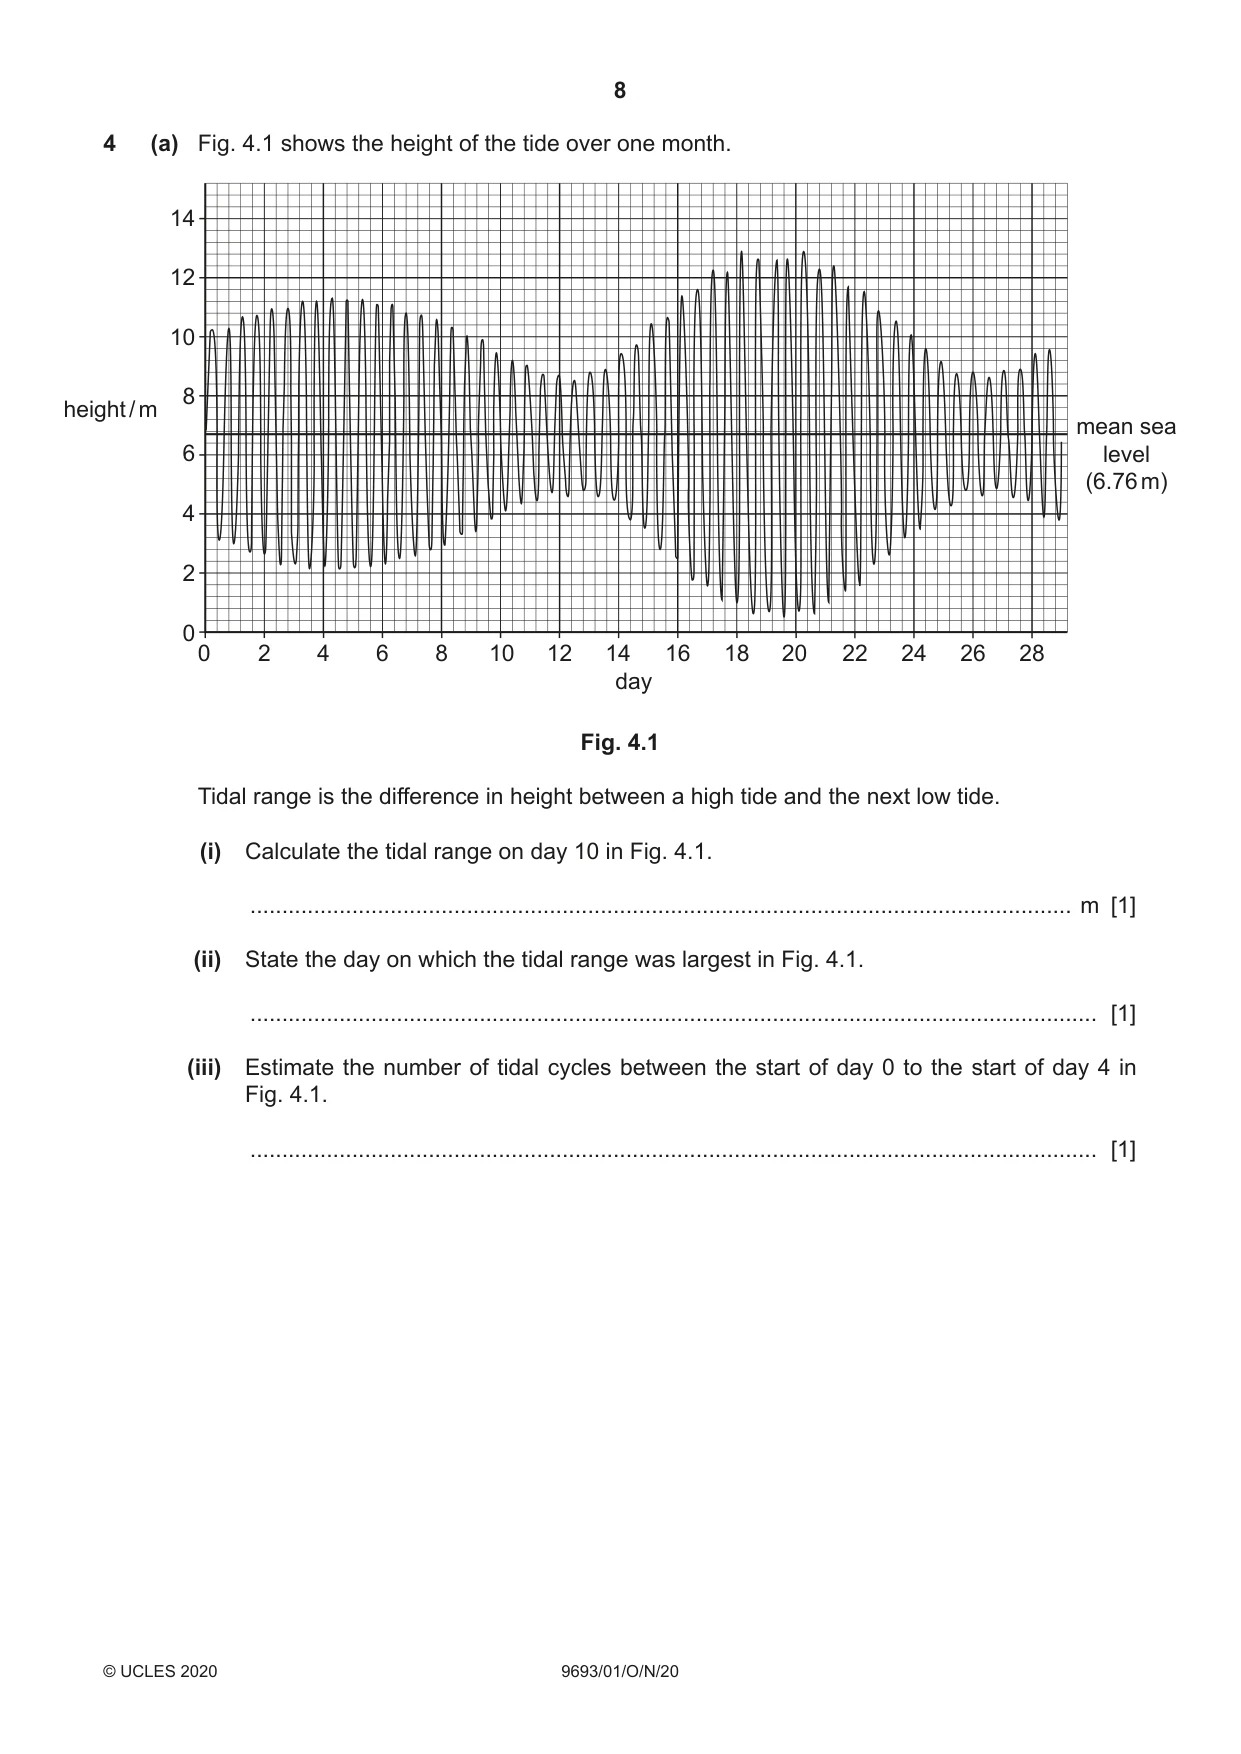
8 9693/01/O/N/20 © UCLES 2020 4 (a) Fig. 4.1 shows the height of the tide over one month. 0 2 4 8 12 14 16 18 22 24 26 28 6 0 2 4 6 8 10 12 14 10 20 day height / m mean sea level (6.76 m) Fig. 4.1 Tidal range is the difference in height between a high tide and the next low tide. (i) Calculate the tidal range on day 10 in Fig. 4.1. … m [1] (ii) State the day on which the tidal range was largest in Fig. 4.1. … [1] (iii) Estimate the number of tidal cycles between the start of day 0 to the start of day 4 in Fig. 4.1. … [1]
Question paper, page 9
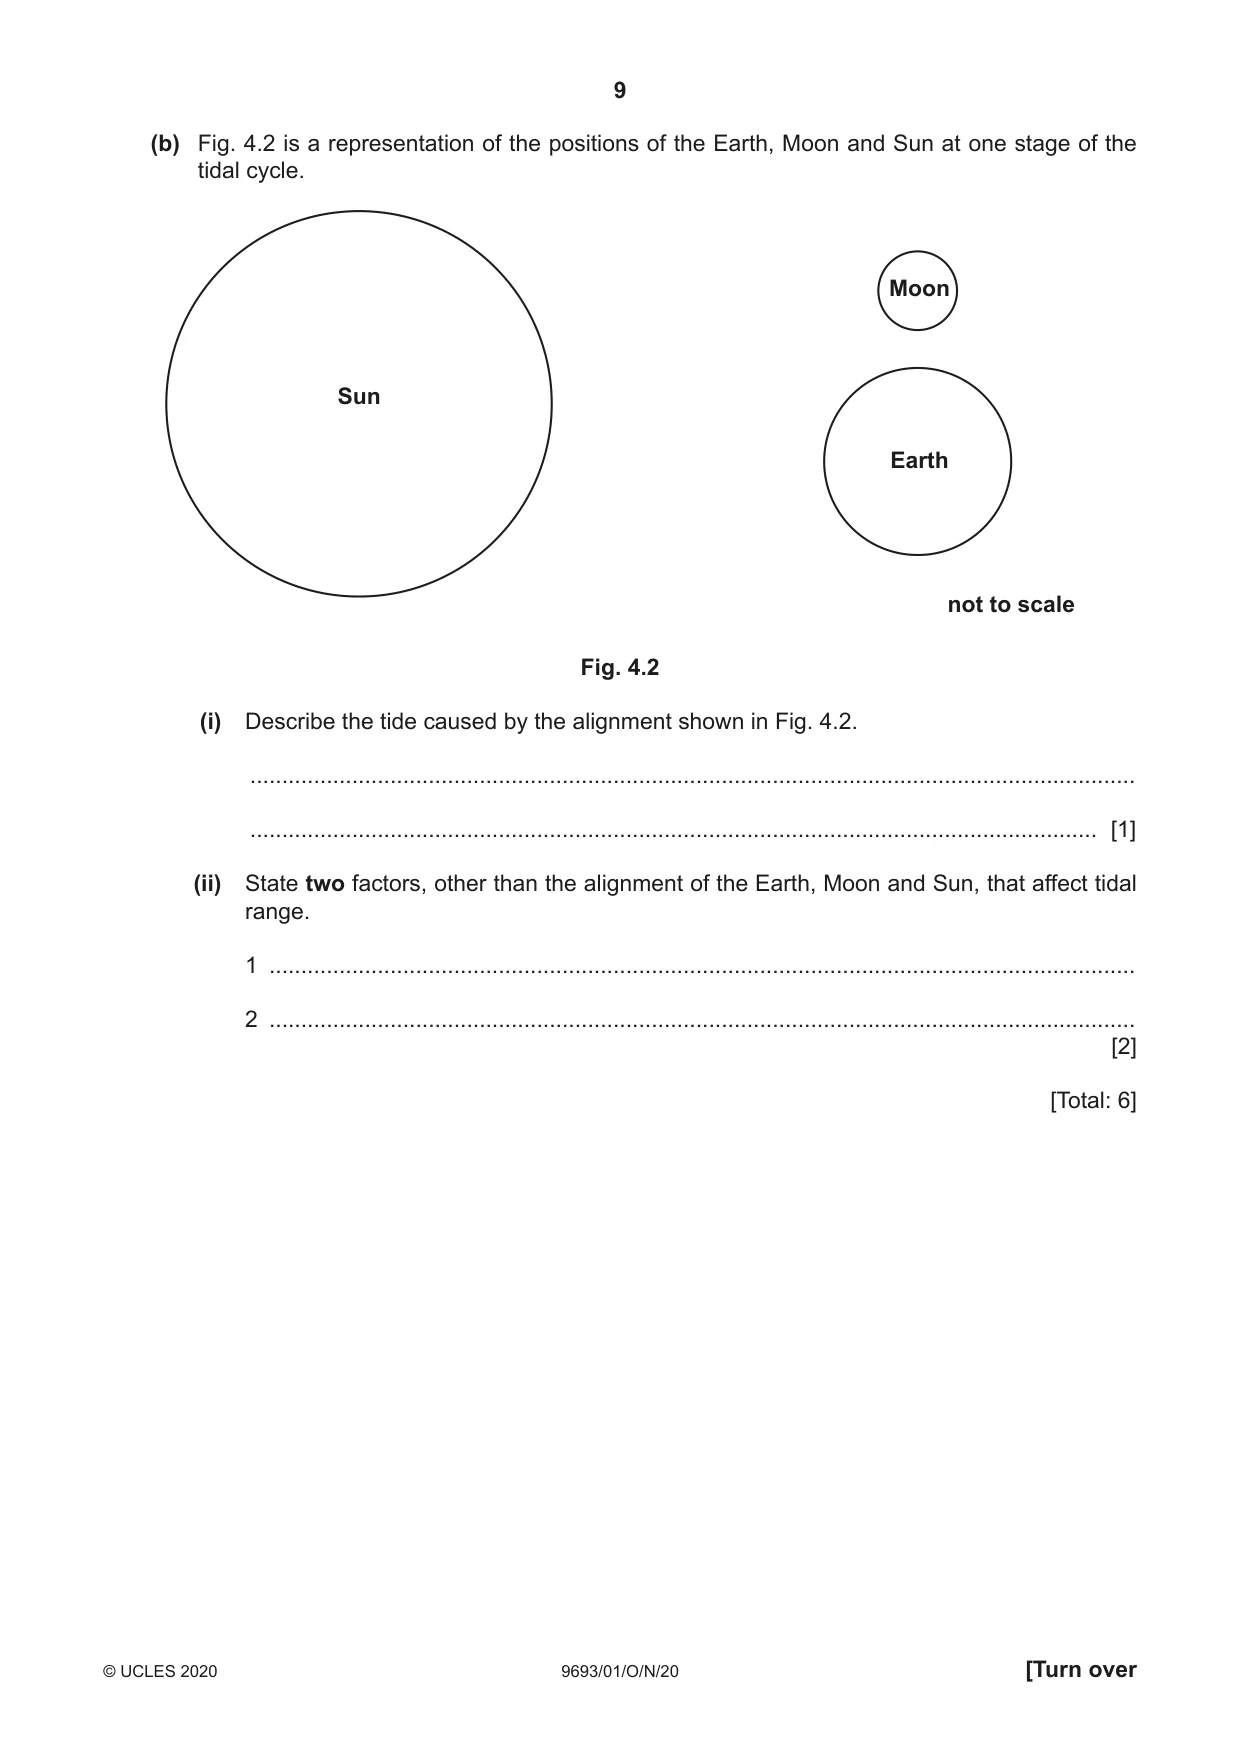
9 9693/01/O/N/20 © UCLES 2020 [Turn over (b) Fig. 4.2 is a representation of the positions of the Earth, Moon and Sun at one stage of the tidal cycle. Sun Moon Earth not to scale Fig. 4.2 (i) Describe the tide caused by the alignment shown in Fig. 4.2. … … [1] (ii) State two factors, other than the alignment of the Earth, Moon and Sun, that affect tidal range. 1 … 2 … [2] [Total: 6]
Question paper, page 10
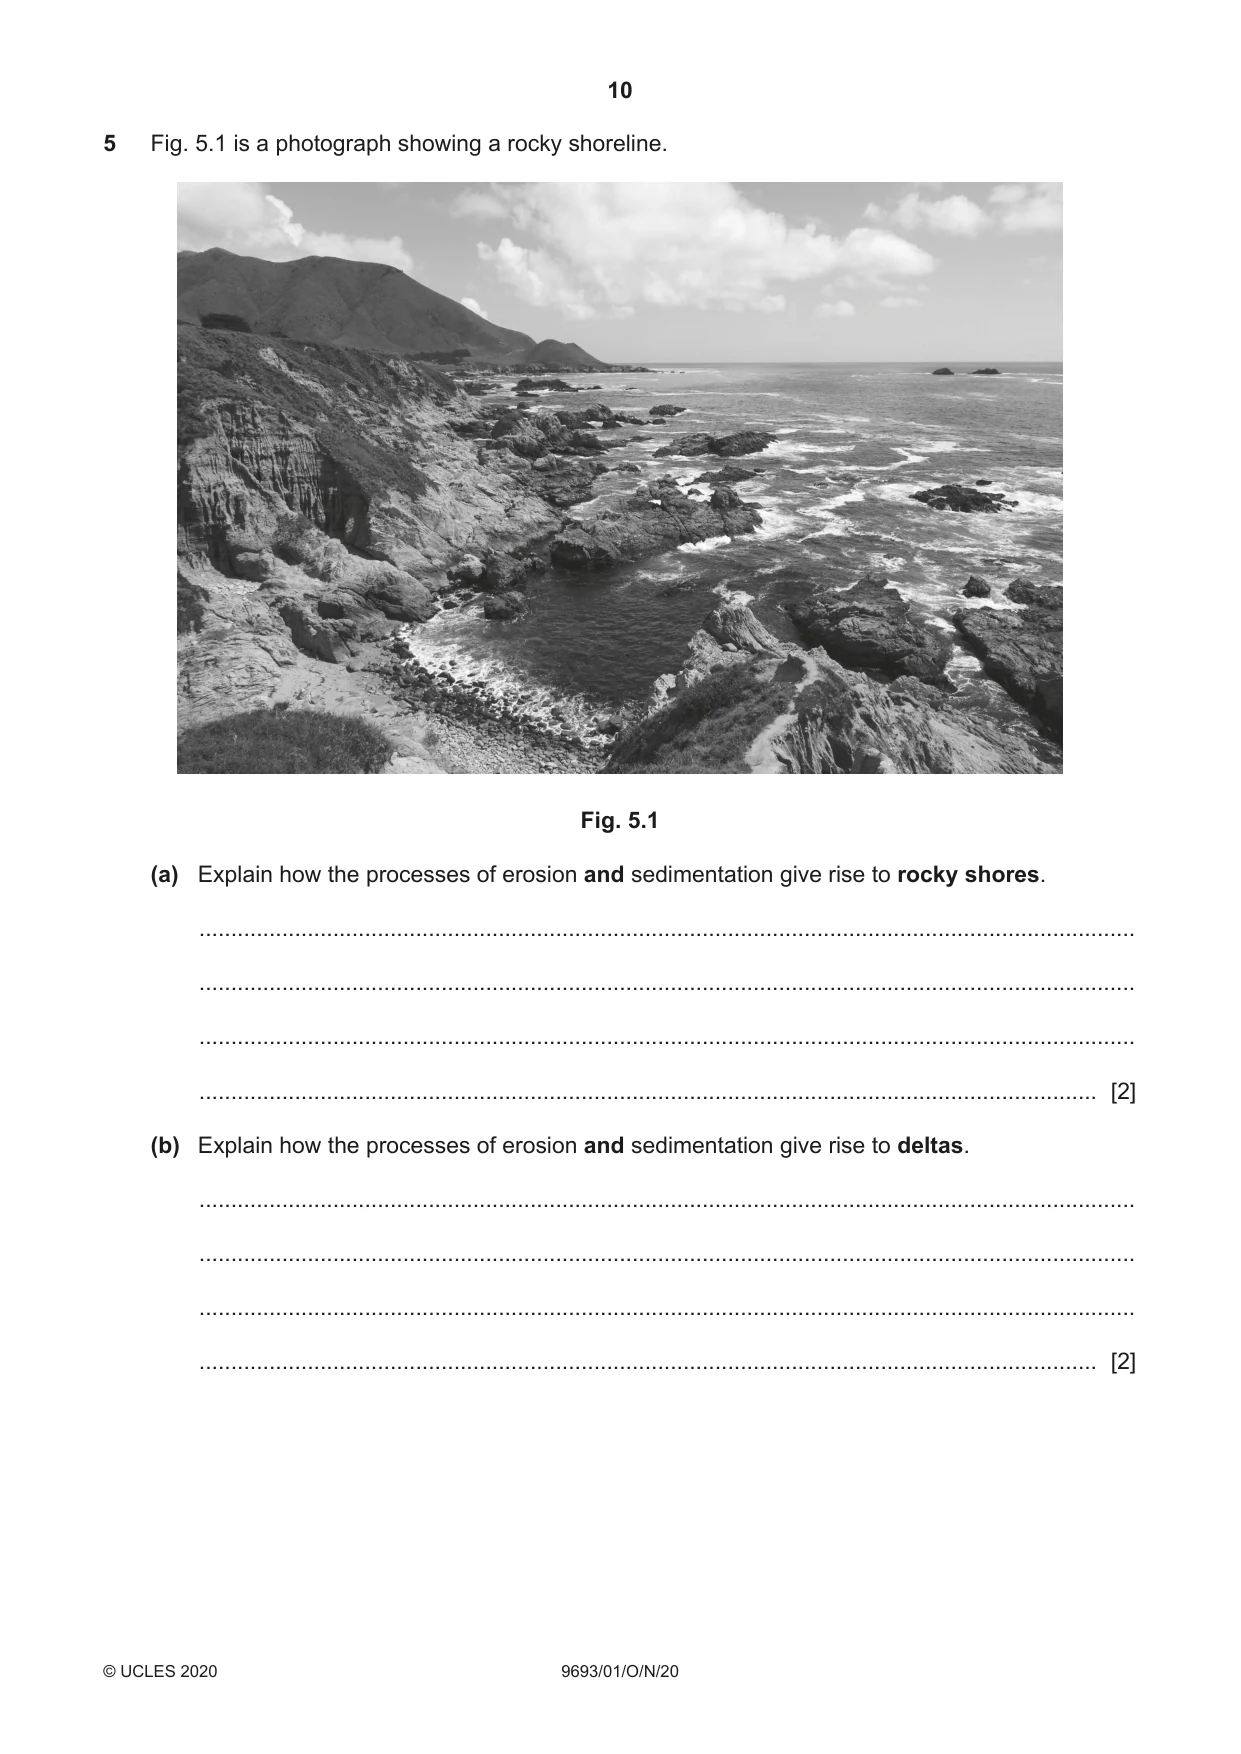
10 9693/01/O/N/20 © UCLES 2020 5 Fig. 5.1 is a photograph showing a rocky shoreline. Fig. 5.1 (a) Explain how the processes of erosion and sedimentation give rise to rocky shores. … … … … [2] (b) Explain how the processes of erosion and sedimentation give rise to deltas. … … … … [2]
Question paper, page 11
11 9693/01/O/N/20 © UCLES 2020 [Turn over (c) Explain how exposure to air and wave action influence ecological communities found on a rocky shore. exposure to air … … … … wave action … … … … [4] [Total: 8]
Question paper, page 12
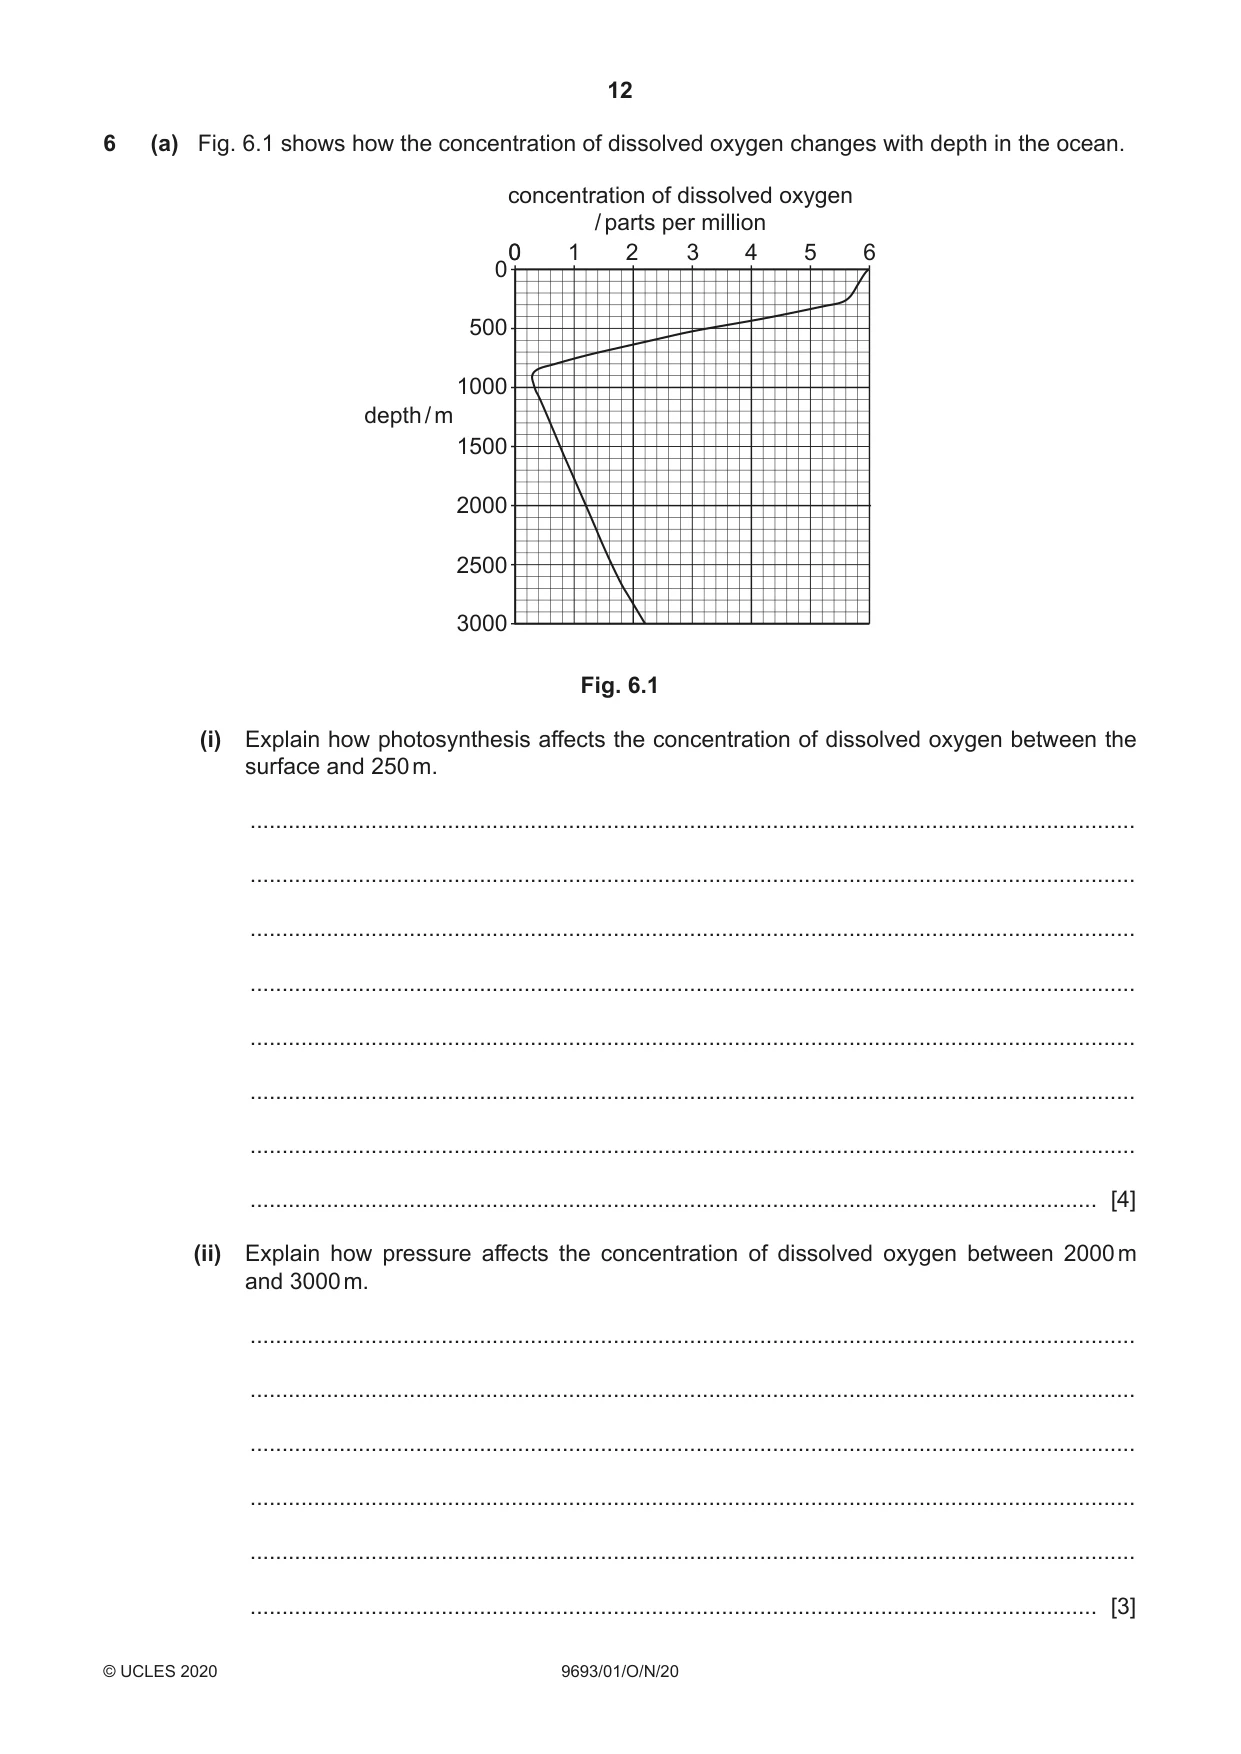
12 9693/01/O/N/20 © UCLES 2020 6 (a) Fig. 6.1 shows how the concentration of dissolved oxygen changes with depth in the ocean. 3000 2500 2000 1500 1000 500 00 1 concentration of dissolved oxygen / parts per million 2 3 4 5 6 depth / m Fig. 6.1 (i) Explain how photosynthesis affects the concentration of dissolved oxygen between the surface and 250 m. … … … … … … … … [4] (ii) Explain how pressure affects the concentration of dissolved oxygen between 2000 m and 3000 m. … … … … … … [3]
Question paper, page 13
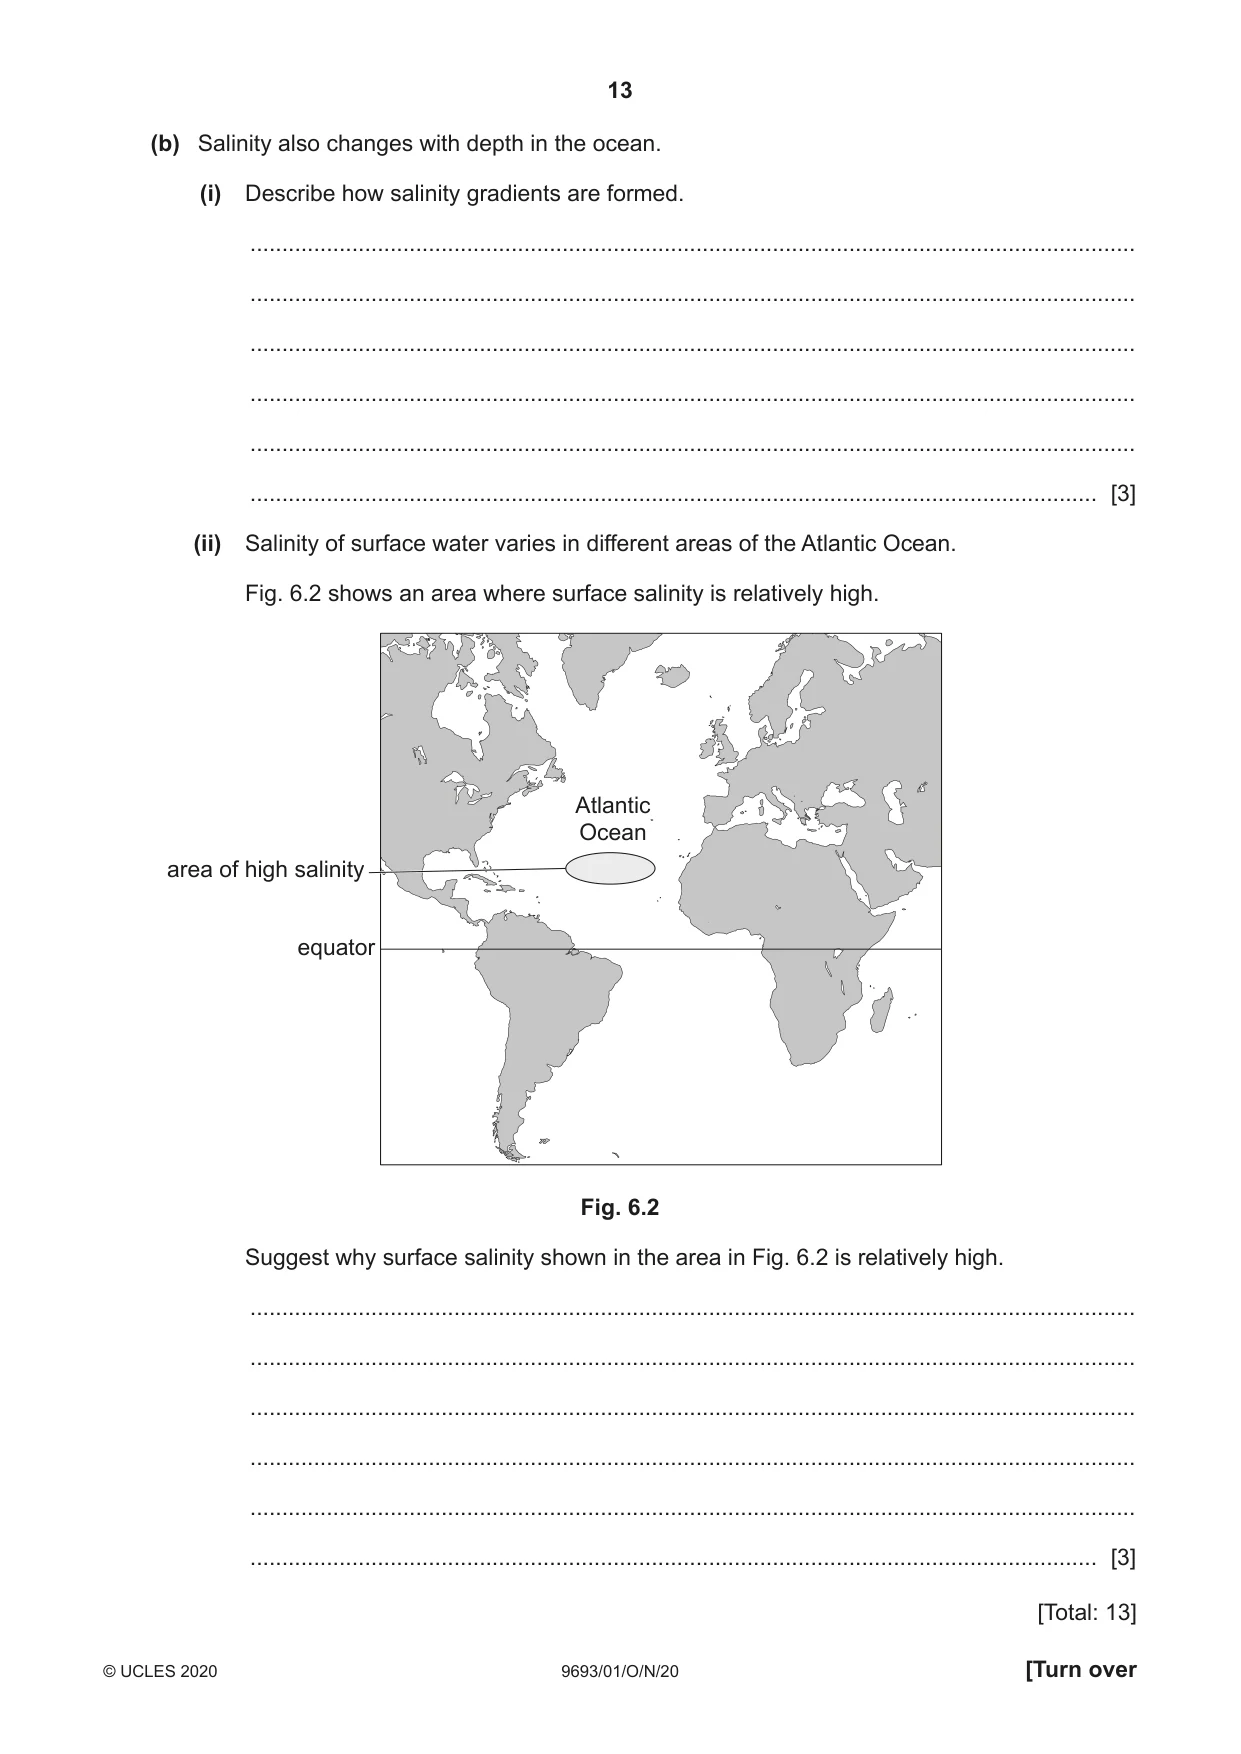
13 9693/01/O/N/20 © UCLES 2020 [Turn over (b) Salinity also changes with depth in the ocean. (i) Describe how salinity gradients are formed. … … … … … … [3] (ii) Salinity of surface water varies in different areas of the Atlantic Ocean. Fig. 6.2 shows an area where surface salinity is relatively high. area of high salinity equator Atlantic Ocean Fig. 6.2 Suggest why surface salinity shown in the area in Fig. 6.2 is relatively high. … … … … … … [3] [Total: 13]
Question paper, page 14
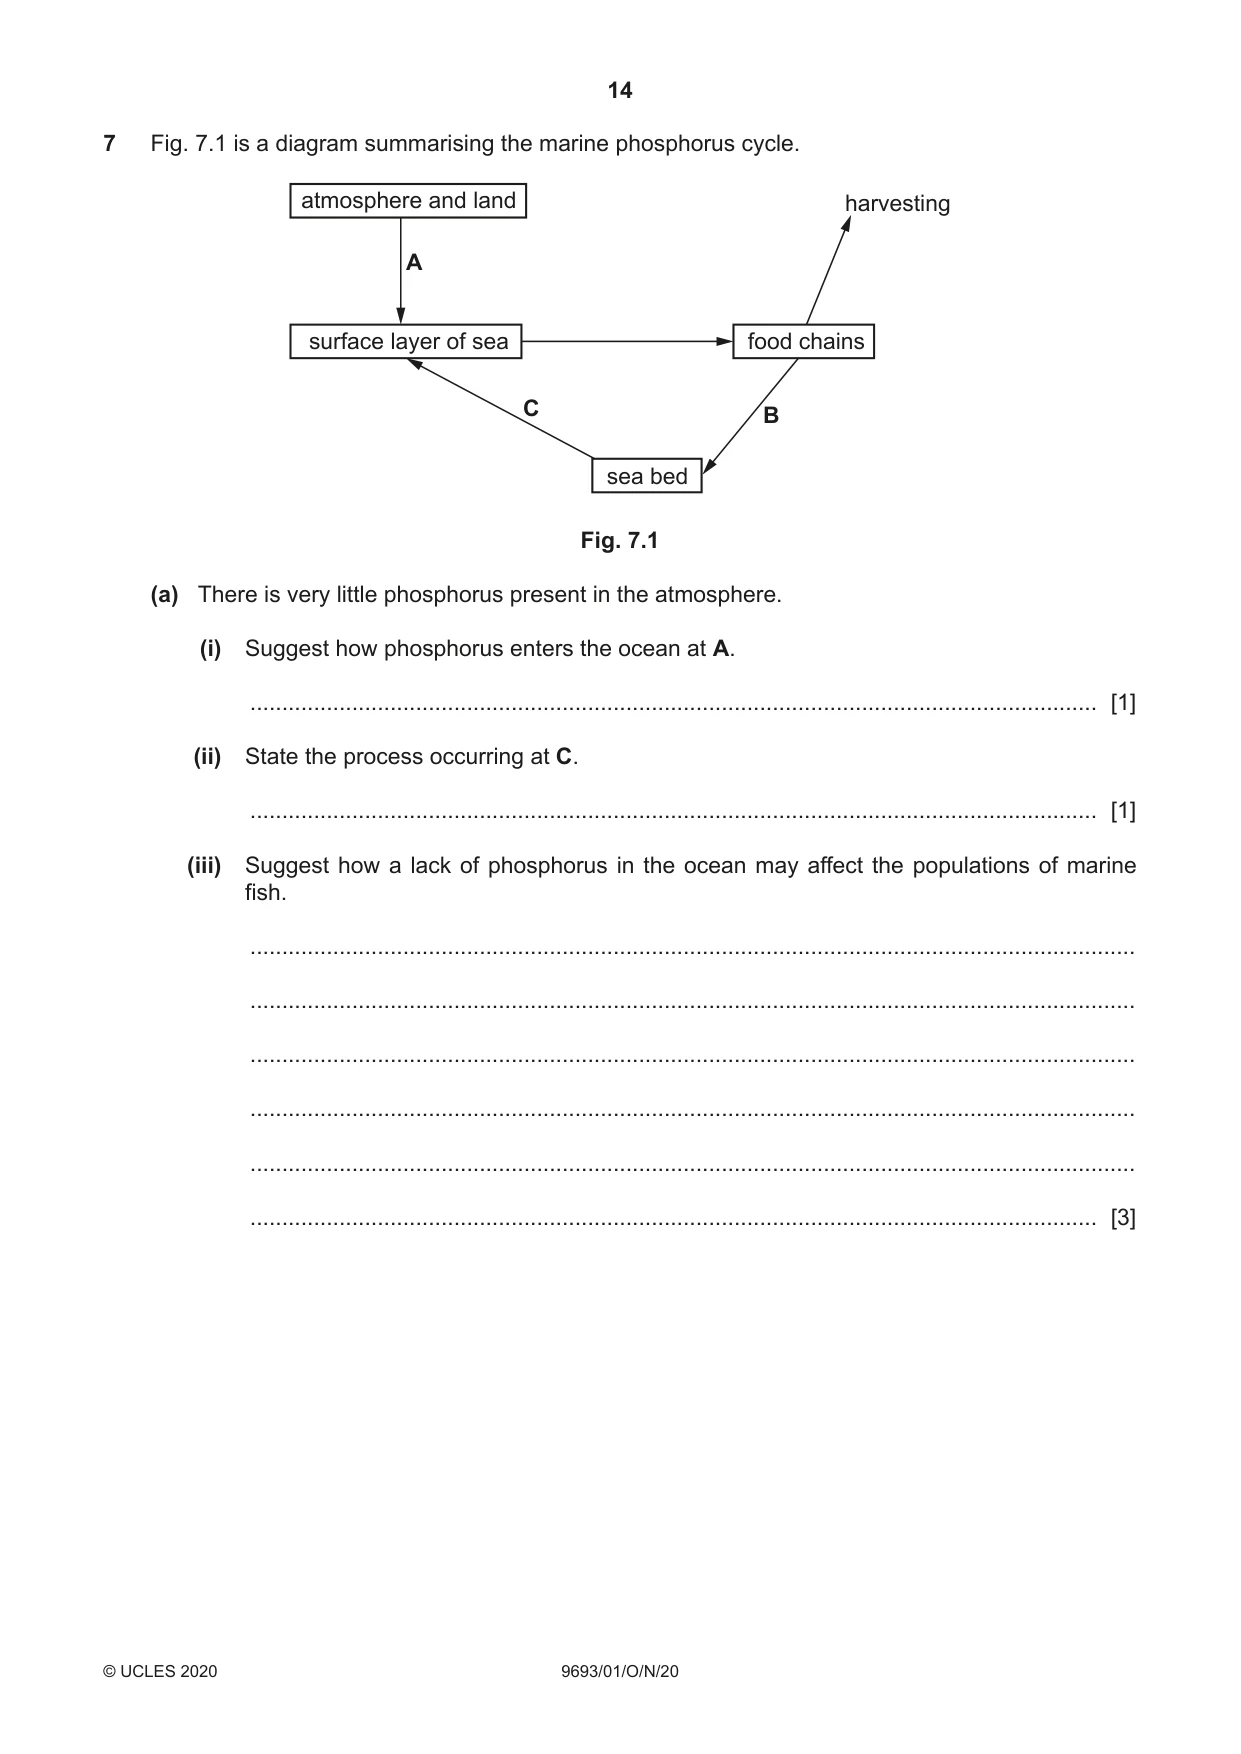
14 9693/01/O/N/20 © UCLES 2020 7 Fig. 7.1 is a diagram summarising the marine phosphorus cycle. atmosphere and land harvesting surface layer of sea food chains sea bed A C B Fig. 7.1 (a) There is very little phosphorus present in the atmosphere. (i) Suggest how phosphorus enters the ocean at A. … [1] (ii) State the process occurring at C. … [1] (iii) Suggest how a lack of phosphorus in the ocean may affect the populations of marine fish. … … … … … … [3]
Question paper, page 15
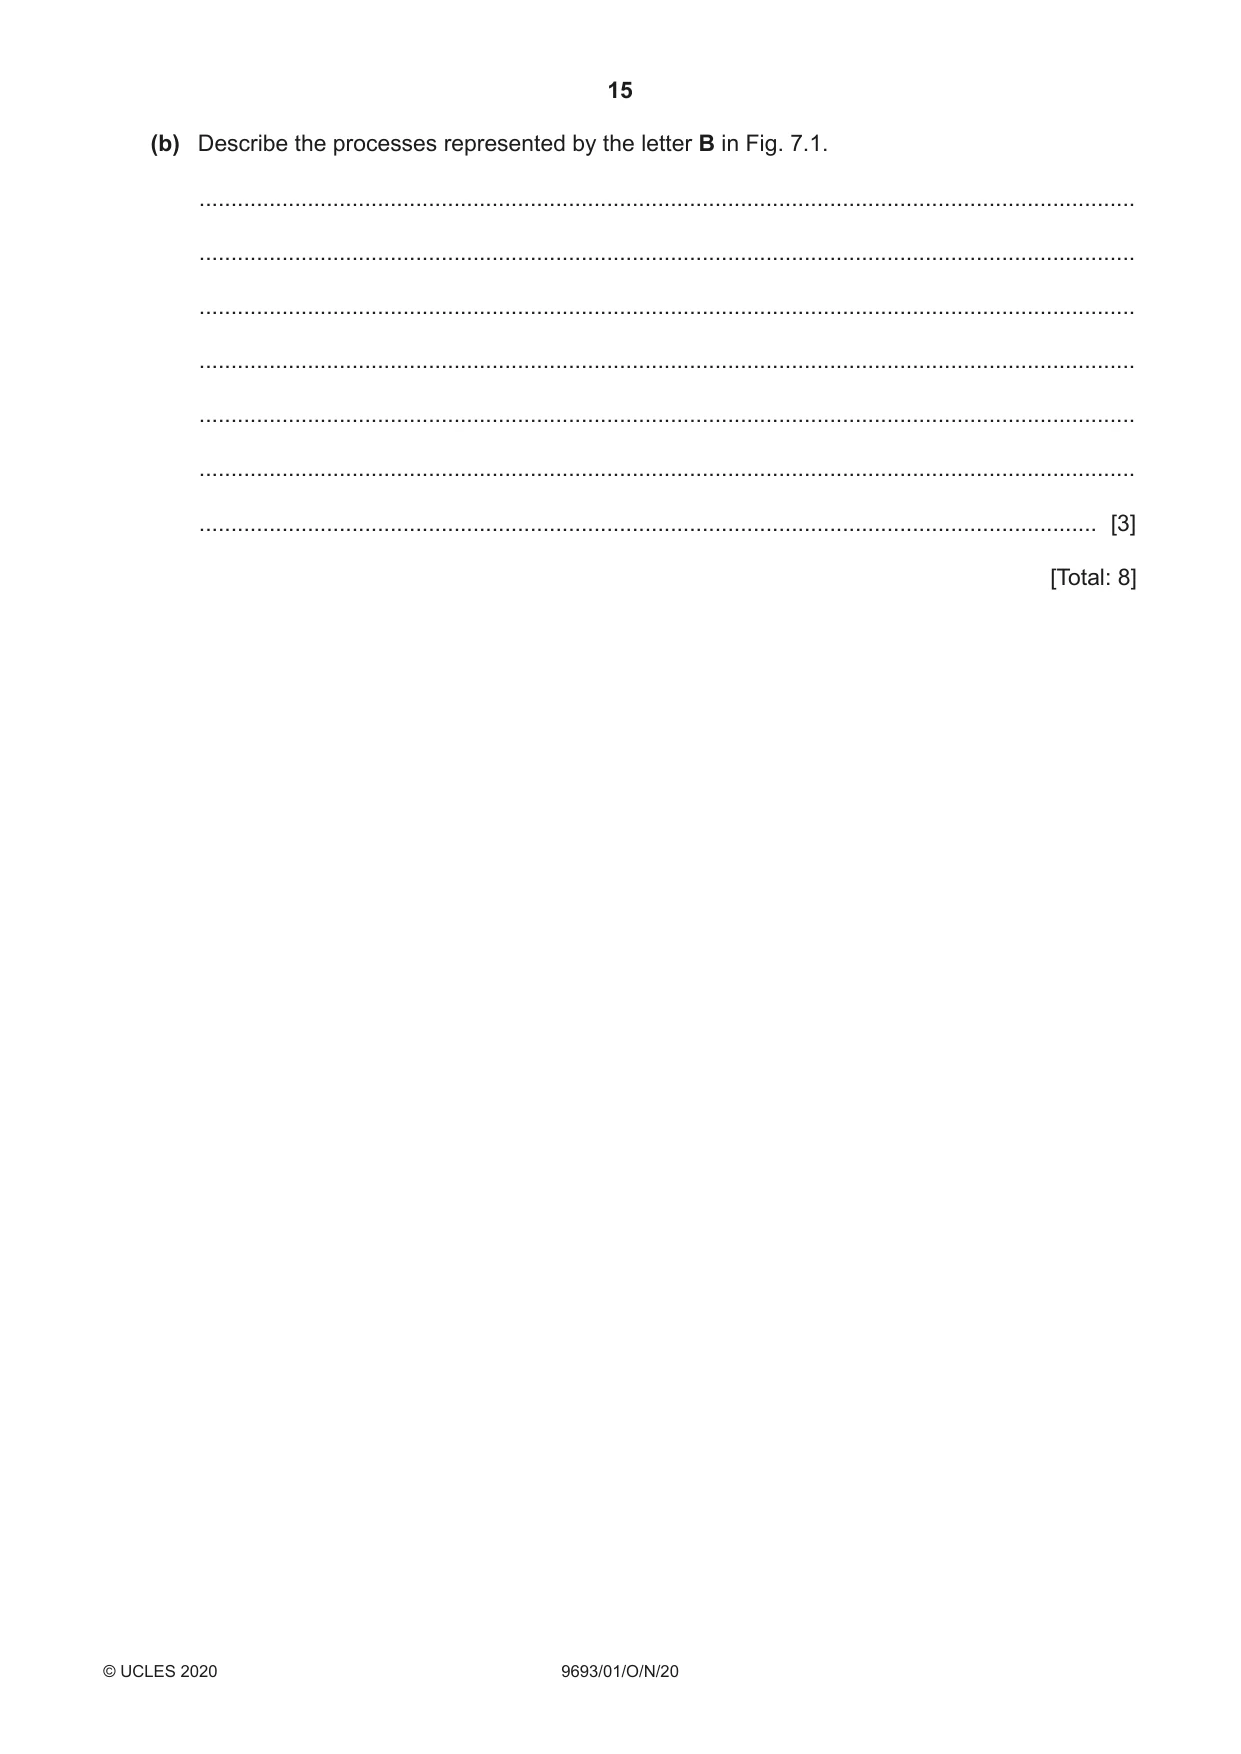
15 9693/01/O/N/20 © UCLES 2020 (b) Describe the processes represented by the letter B in Fig. 7.1. … … … … … … … [3] [Total: 8]
Question paper, page 16
16 9693/01/O/N/20 © UCLES 2020 Permission to reproduce items where third-party owned material protected by copyright is included has been sought and cleared where possible. Every reasonable effort has been made by the publisher (UCLES) to trace copyright holders, but if any items requiring clearance have unwittingly been included, the publisher will be pleased to make amends at the earliest possible opportunity. To avoid the issue of disclosure of answer-related information to candidates, all copyright acknowledgements are reproduced online in the Cambridge Assessment International Education Copyright Acknowledgements Booklet. This is produced for each series of examinations and is freely available to download at www.cambridgeinternational.org after the live examination series. Cambridge Assessment International Education is part of the Cambridge Assessment Group. Cambridge Assessment is the brand name of the University of Cambridge Local Examinations Syndicate (UCLES), which itself is a department of the University of Cambridge. BLANK PAGE