Cambridge A Level Marine Science 9693 — 2019 Oct/Nov Paper 1 · Variant 0
9693/10/O/N/19
The question paper and its mark scheme, free to read here and free to download. This is Cambridge’s own paper, exactly as it was sat.
Question paper20 pages


Mark scheme
No mark scheme is in the library for this paper.
Paper as text
Question paper, page 1
This document consists of 17 printed pages and 3 blank pages. DC (SC/SG) 170942/2 © UCLES 2019 [Turn over * 7 5 6 3 3 5 8 7 7 0 * MARINE SCIENCE 9693/01 Paper 1 AS Structured Questions October/November 2019 1 hour 30 minutes Candidates answer on the Question Paper. No Additional Materials are required. READ THESE INSTRUCTIONS FIRST Write your centre number, candidate number and name on all the work you hand in. Write in dark blue or black pen. You may use an HB pencil for any diagrams or graphs. Do not use staples, paper clips, glue or correction fluid. DO NOT WRITE IN ANY BARCODES. Answer all questions. Write your answers in the spaces provided on the Question Paper. Electronic calculators may be used. You may lose marks if you do not show your working or if you do not use appropriate units. At the end of the examination, fasten all your work securely together. The number of marks is given in brackets [ ] at the end of each question or part question. Cambridge Assessment International Education Cambridge International Advanced Subsidiary and Advanced Level
Question paper, page 2
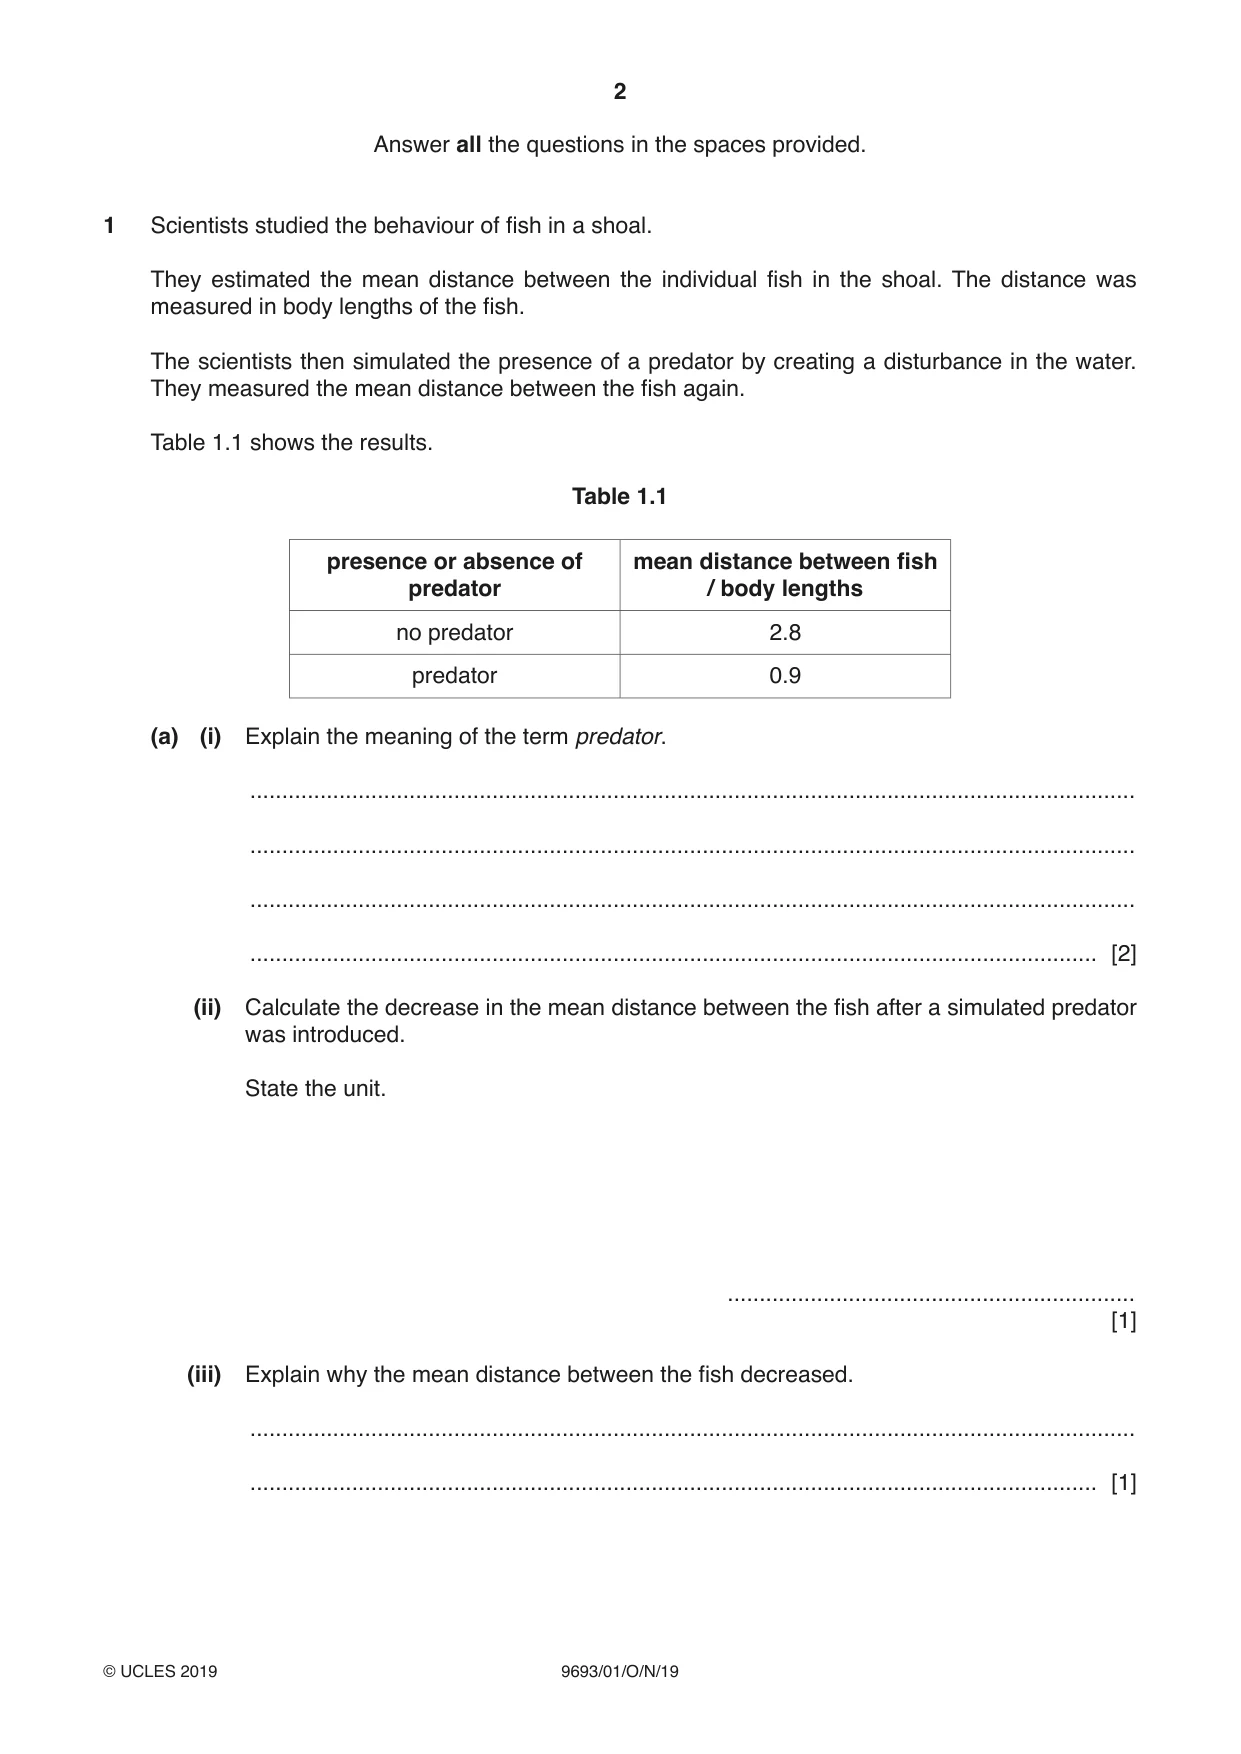
2 9693/01/O/N/19 © UCLES 2019 Answer all the questions in the spaces provided. 1 Scientists studied the behaviour of fish in a shoal. They estimated the mean distance between the individual fish in the shoal. The distance was measured in body lengths of the fish. The scientists then simulated the presence of a predator by creating a disturbance in the water. They measured the mean distance between the fish again. Table 1.1 shows the results. Table 1.1 presence or absence of predator mean distance between fish / body lengths no predator 2.8 predator 0.9 (a) (i) Explain the meaning of the term predator. … … … … [2] (ii) Calculate the decrease in the mean distance between the fish after a simulated predator was introduced. State the unit. … [1] (iii) Explain why the mean distance between the fish decreased. … … [1]
Question paper, page 3
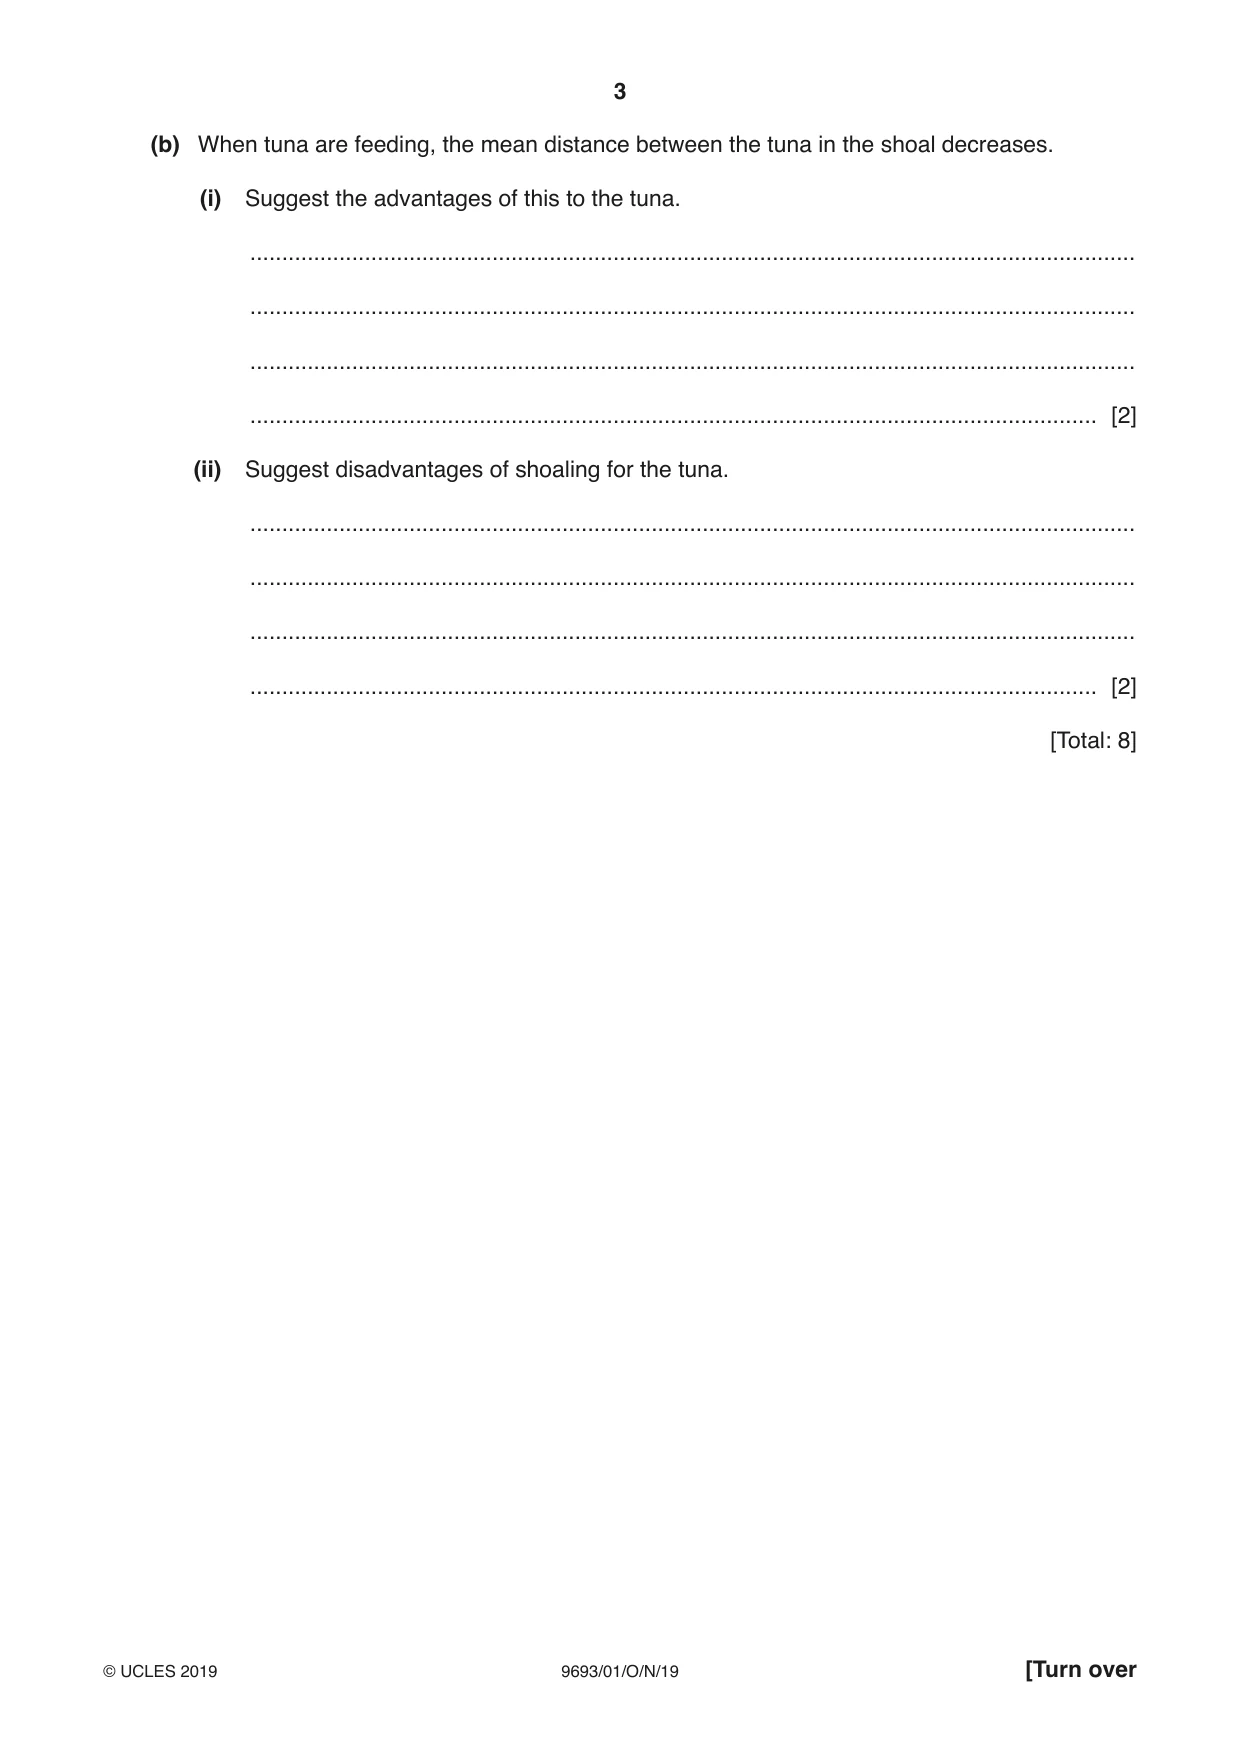
3 9693/01/O/N/19 © UCLES 2019 [Turn over (b) When tuna are feeding, the mean distance between the tuna in the shoal decreases. (i) Suggest the advantages of this to the tuna. … … … … [2] (ii) Suggest disadvantages of shoaling for the tuna. … … … … [2] [Total: 8]
Question paper, page 4
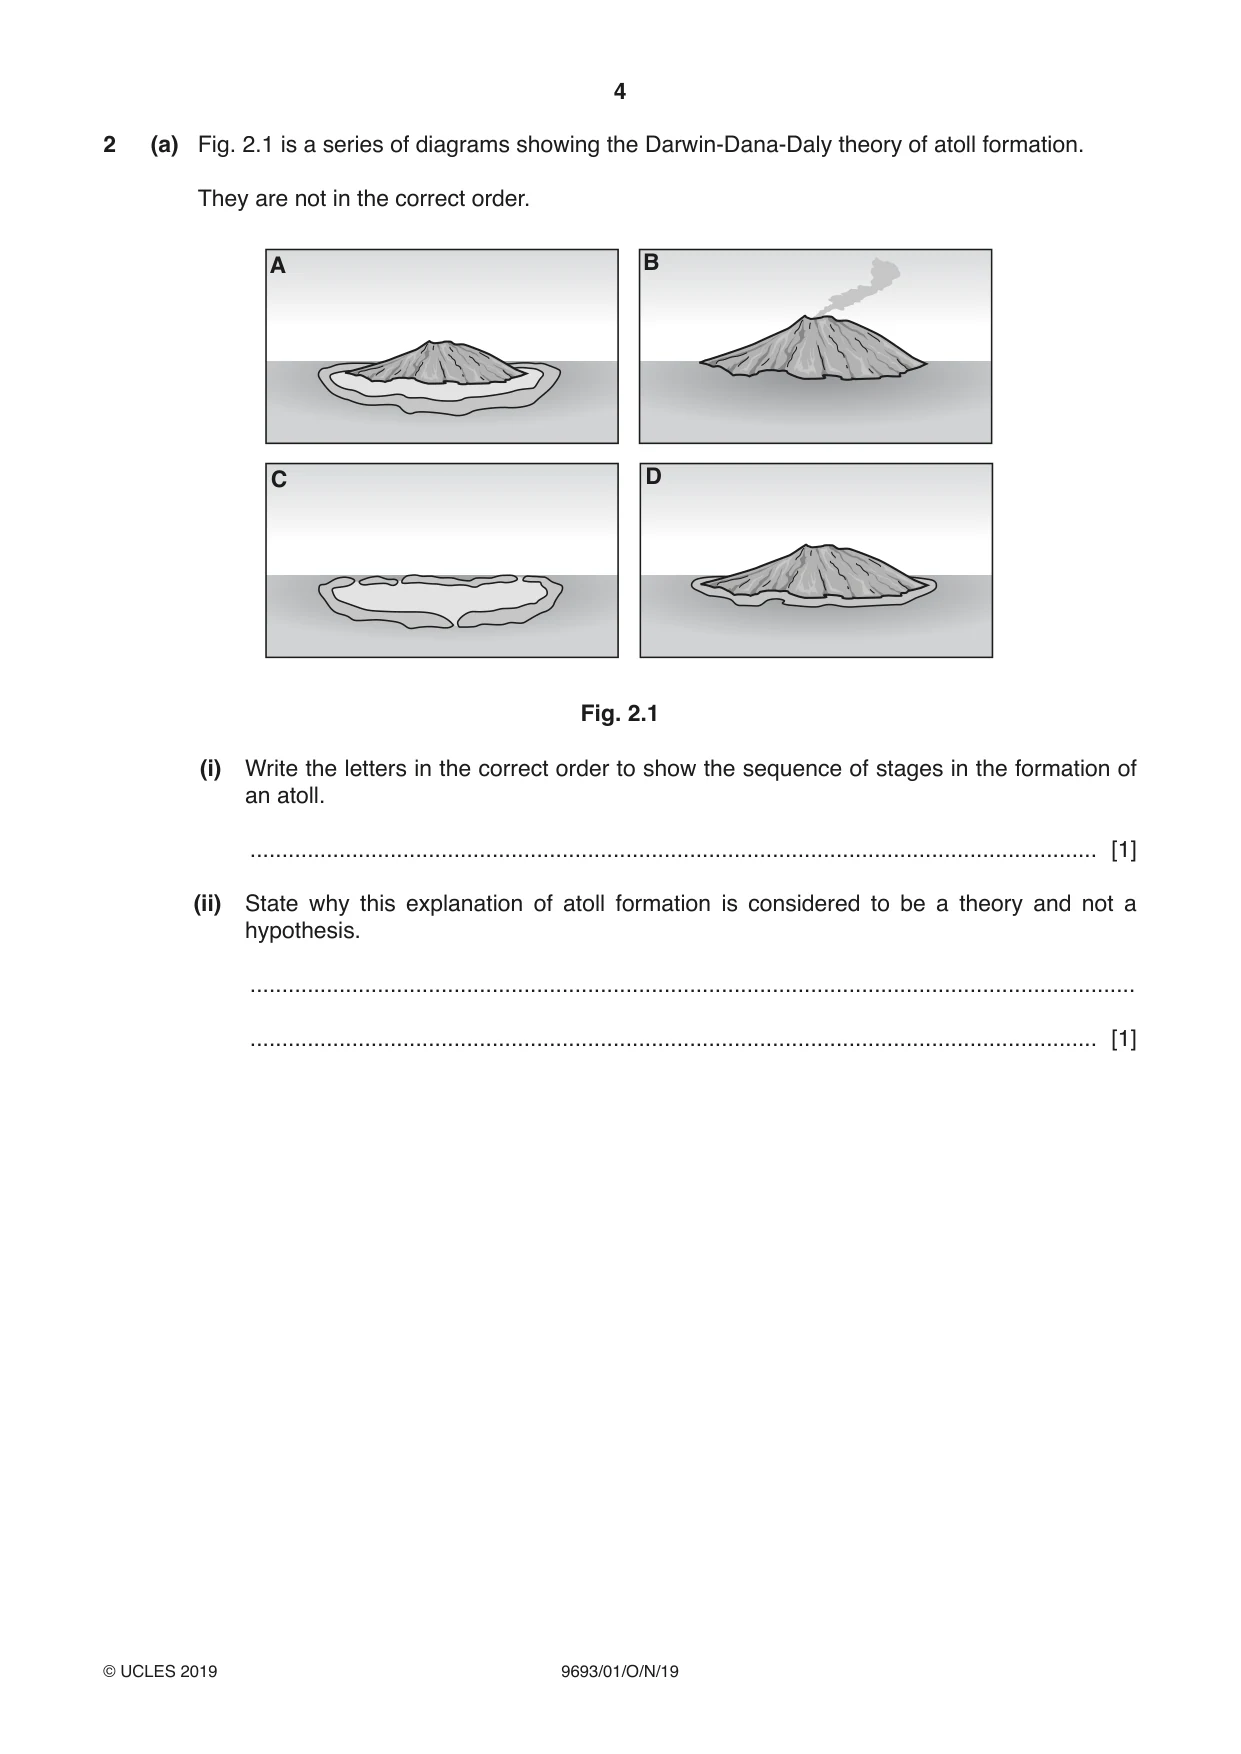
4 9693/01/O/N/19 © UCLES 2019 2 (a) Fig. 2.1 is a series of diagrams showing the Darwin-Dana-Daly theory of atoll formation. They are not in the correct order. B D A C Fig. 2.1 (i) Write the letters in the correct order to show the sequence of stages in the formation of an atoll. … [1] (ii) State why this explanation of atoll formation is considered to be a theory and not a hypothesis. … … [1]
Question paper, page 5
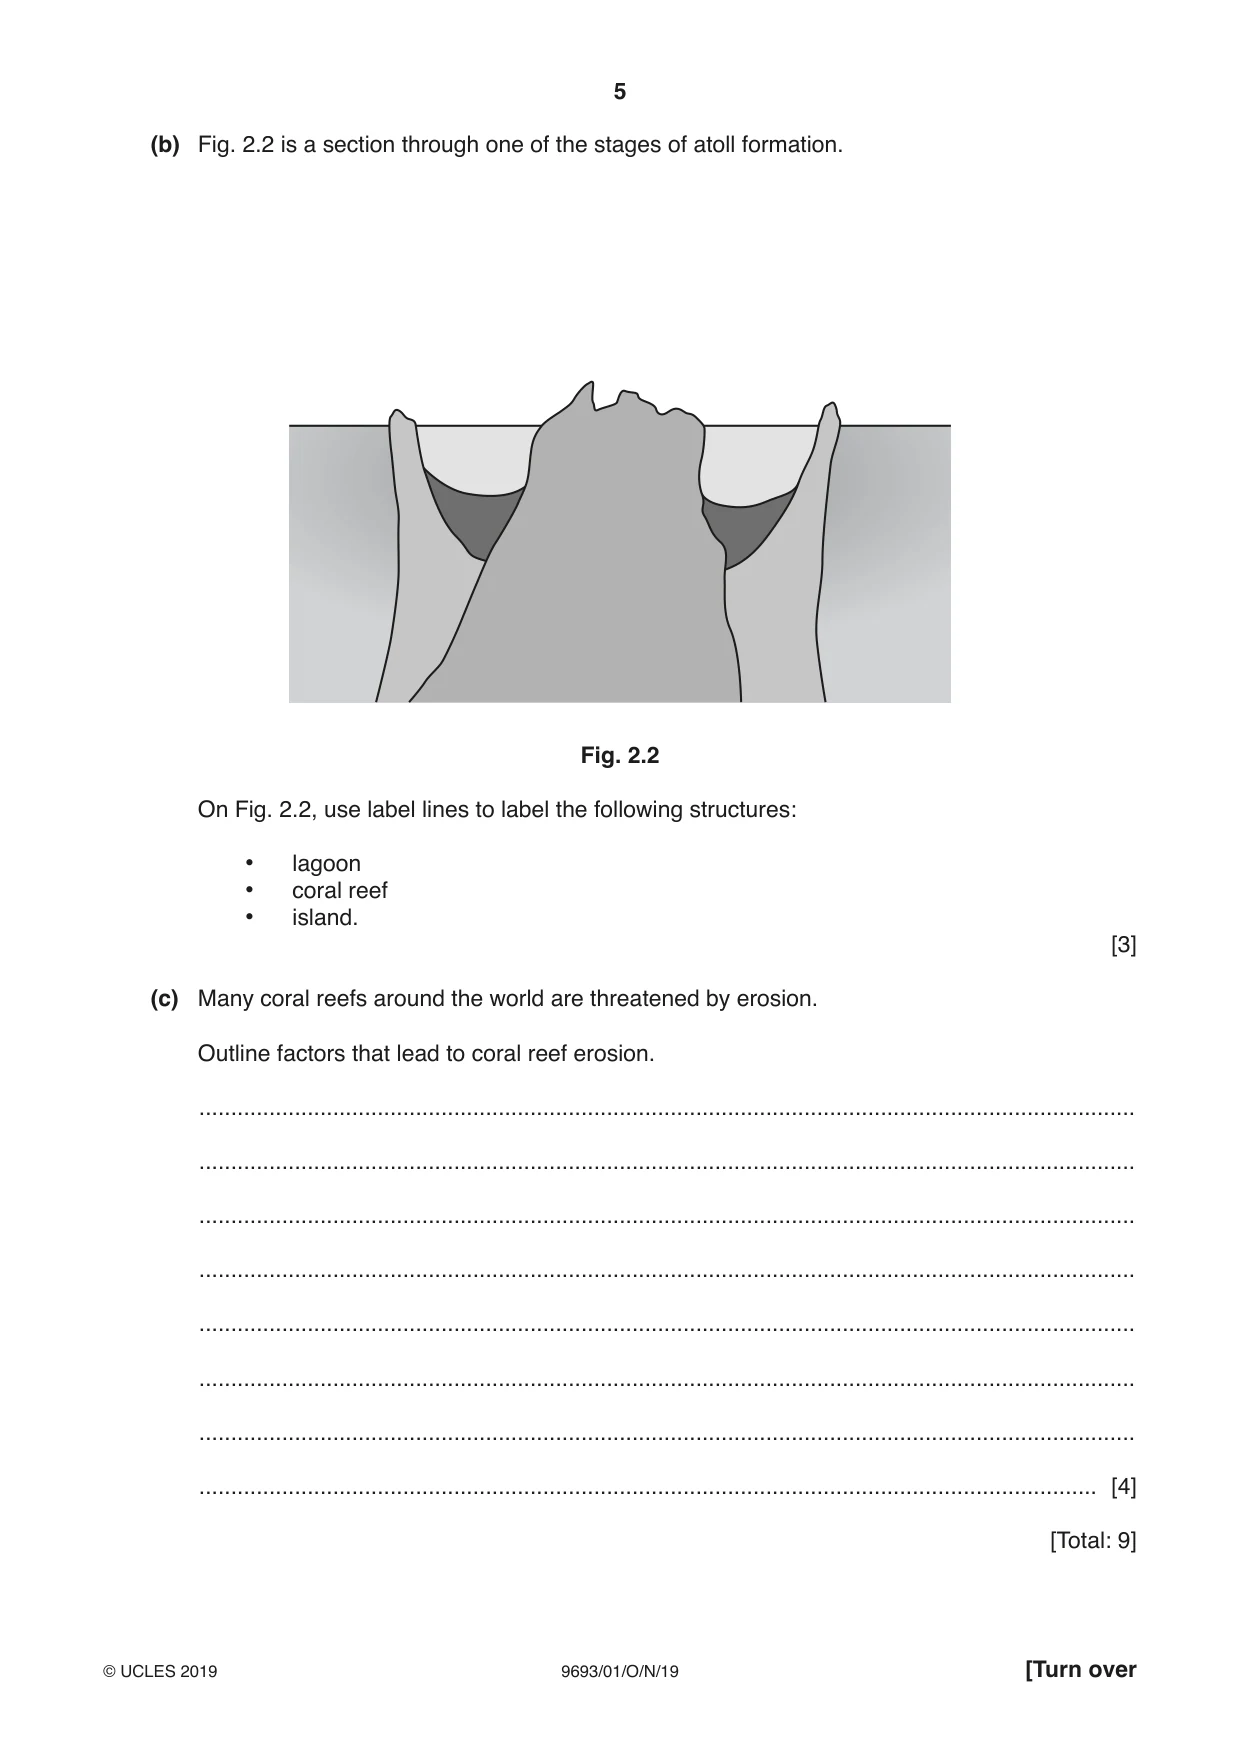
5 9693/01/O/N/19 © UCLES 2019 [Turn over (b) Fig. 2.2 is a section through one of the stages of atoll formation. Fig. 2.2 On Fig. 2.2, use label lines to label the following structures: • lagoon • coral reef • island. [3] (c) Many coral reefs around the world are threatened by erosion. Outline factors that lead to coral reef erosion. … … … … … … … … [4] [Total: 9]
Question paper, page 6
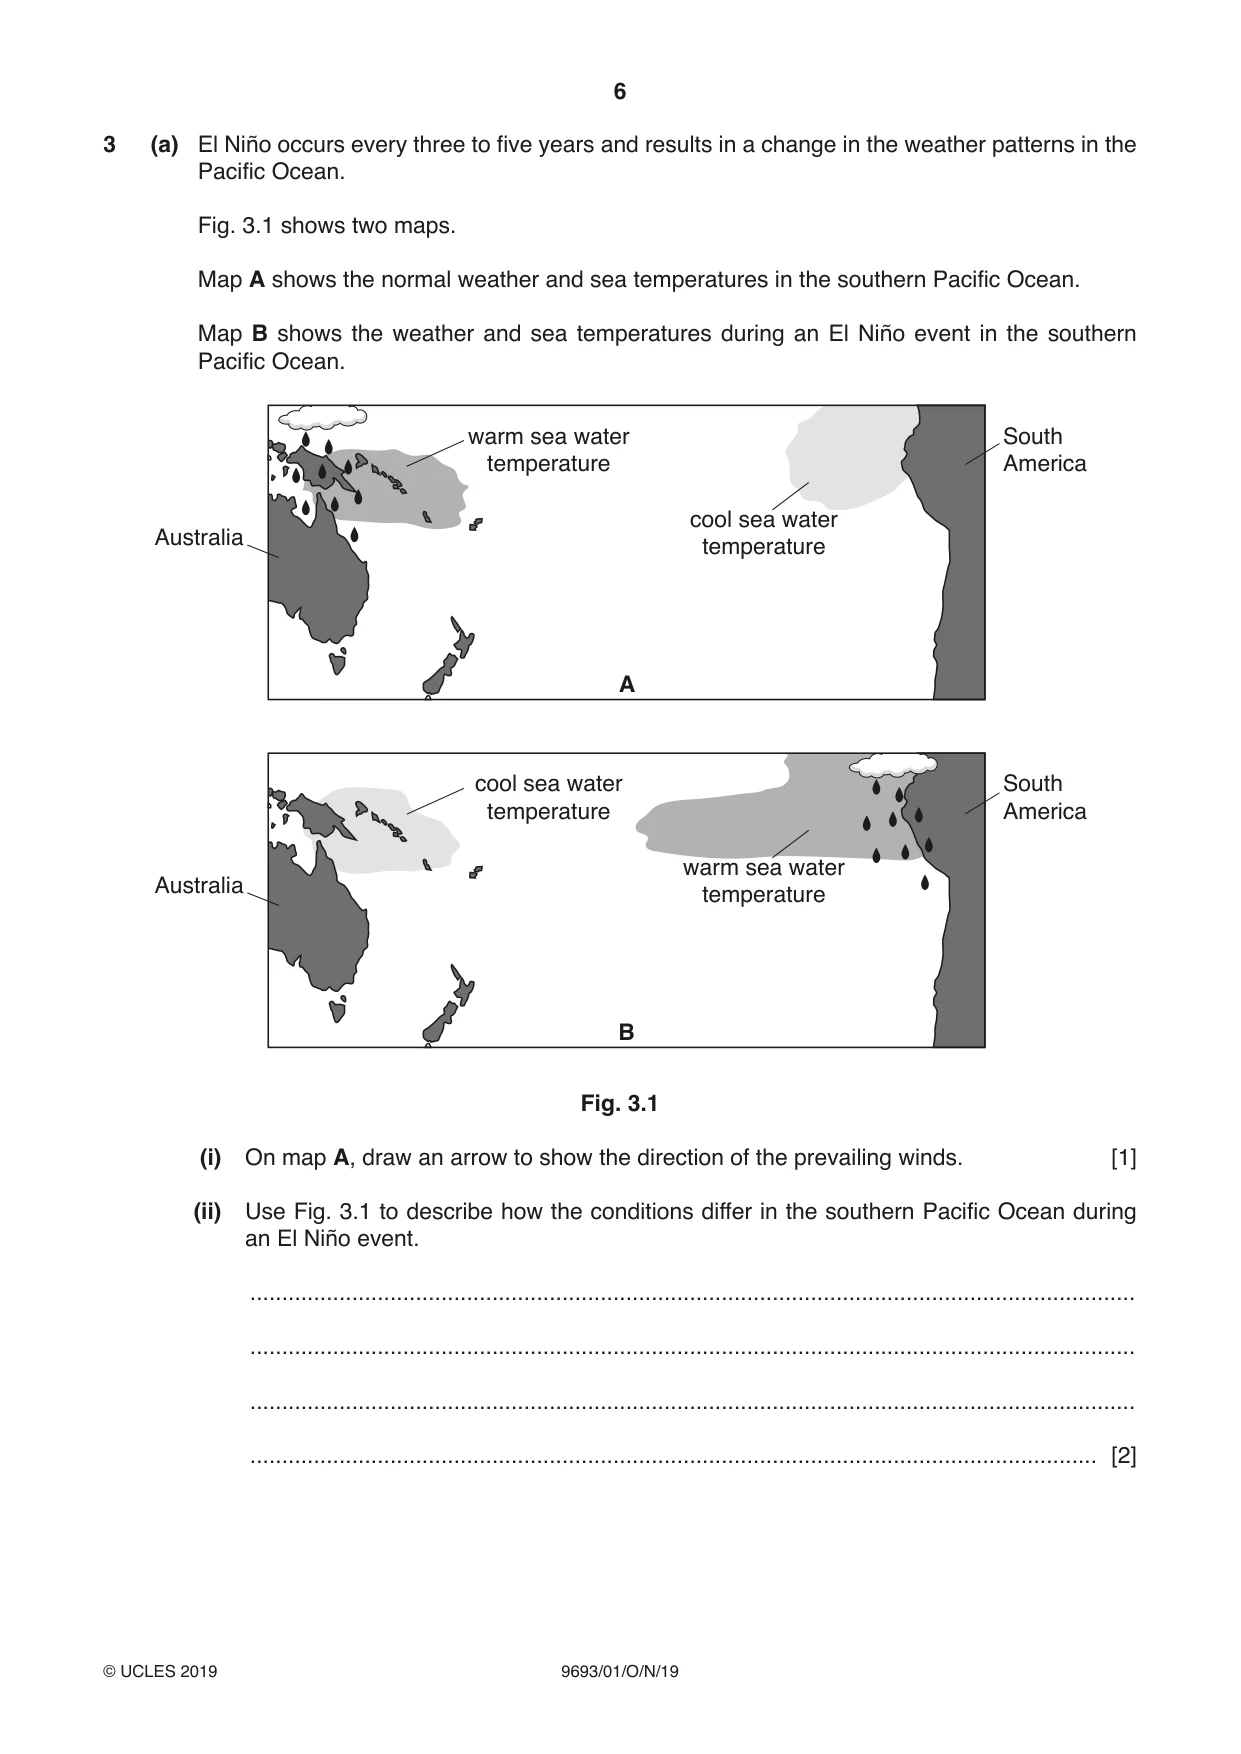
6 9693/01/O/N/19 © UCLES 2019 3 (a) El Niño occurs every three to five years and results in a change in the weather patterns in the Pacific Ocean. Fig. 3.1 shows two maps. Map A shows the normal weather and sea temperatures in the southern Pacific Ocean. Map B shows the weather and sea temperatures during an El Niño event in the southern Pacific Ocean. A South America warm sea water temperature Australia cool sea water temperature B South America cool sea water temperature Australia warm sea water temperature Fig. 3.1 (i) On map A, draw an arrow to show the direction of the prevailing winds. [1] (ii) Use Fig. 3.1 to describe how the conditions differ in the southern Pacific Ocean during an El Niño event. … … … … [2]
Question paper, page 7
7 9693/01/O/N/19 © UCLES 2019 [Turn over (iii) Describe and explain the effects of an El Niño event on the fish populations off the western coast of South America. … … … … … … … … [4] (b) Explain how ocean surface currents are produced. … … … … … … … … [4] [Total: 11]
Question paper, page 8
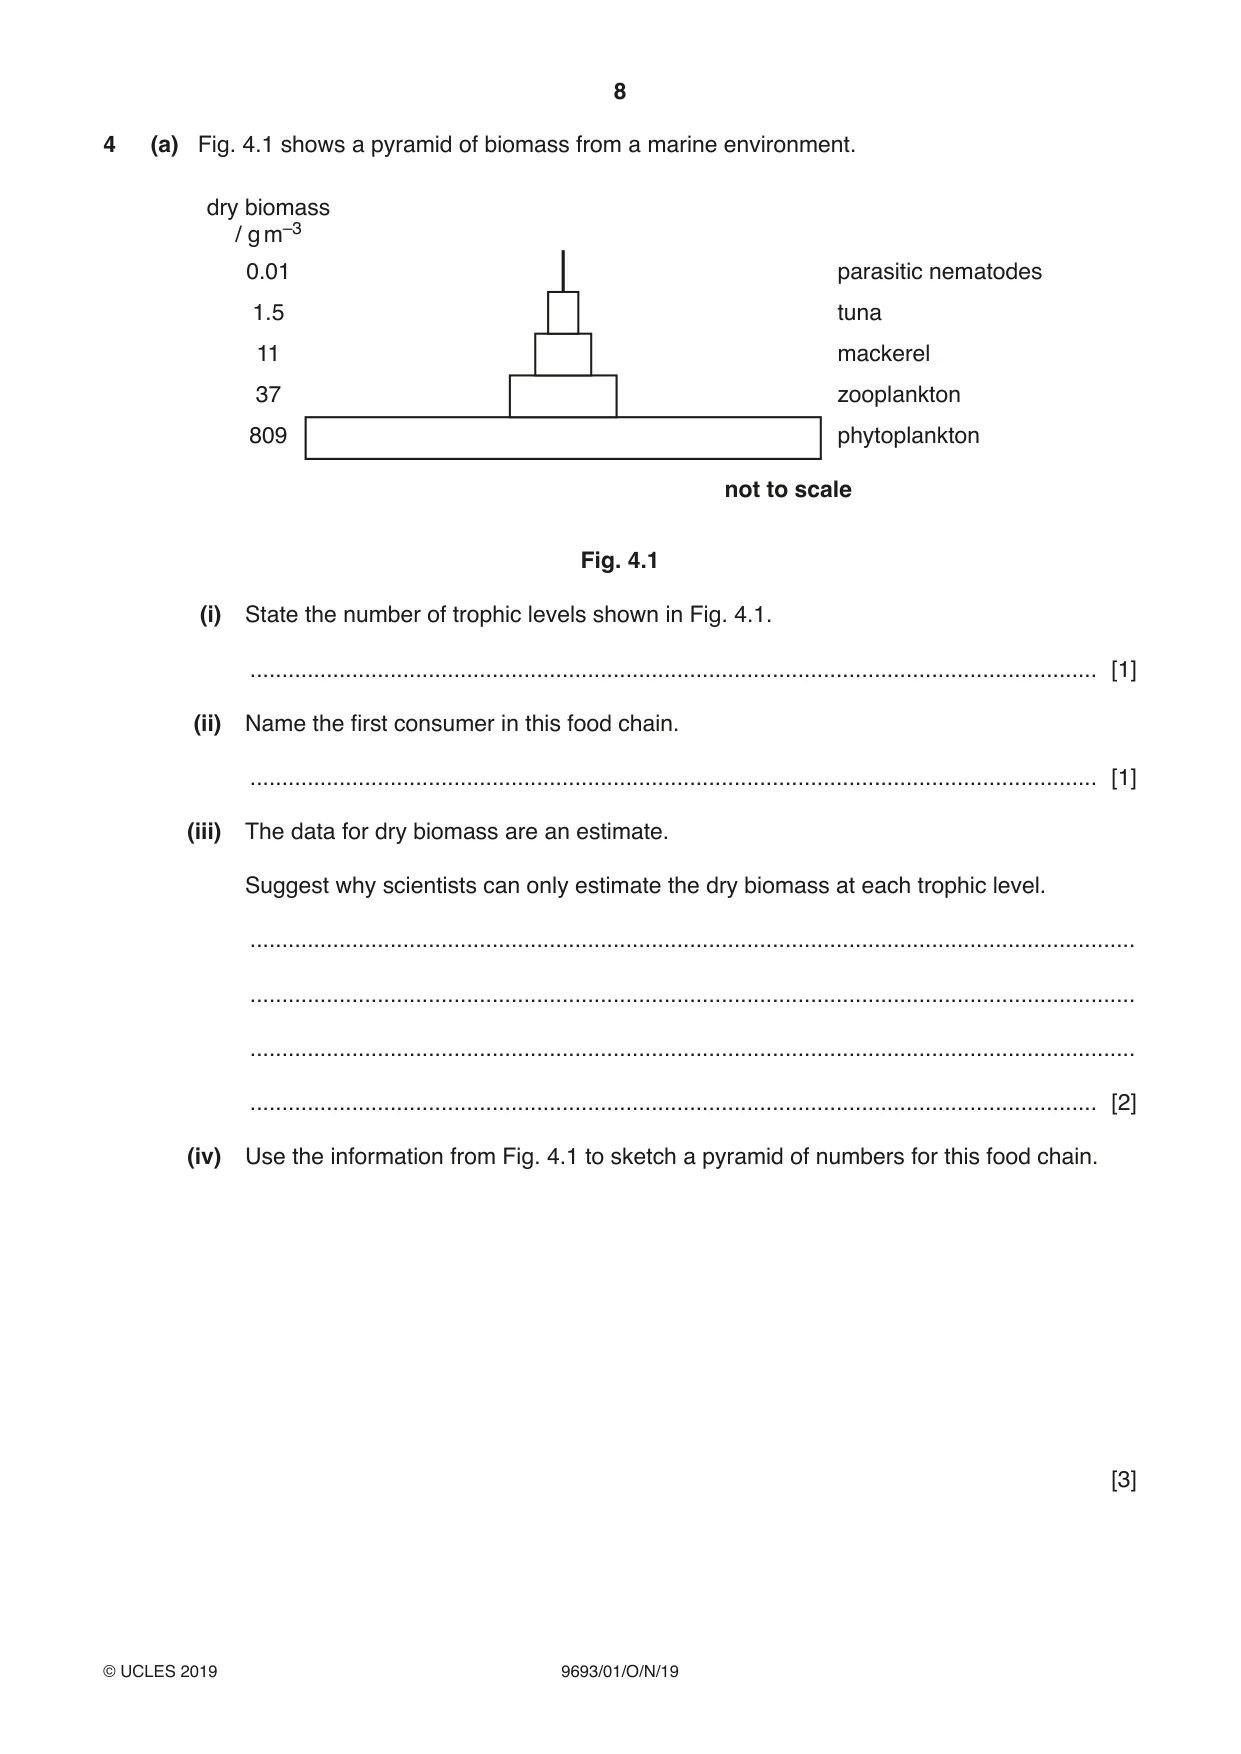
8 9693/01/O/N/19 © UCLES 2019 4 (a) Fig. 4.1 shows a pyramid of biomass from a marine environment. parasitic nematodes tuna mackerel zooplankton phytoplankton dry biomass / g m–3 0.01 1.5 11 37 809 not to scale Fig. 4.1 (i) State the number of trophic levels shown in Fig. 4.1. … [1] (ii) Name the first consumer in this food chain. … [1] (iii) The data for dry biomass are an estimate. Suggest why scientists can only estimate the dry biomass at each trophic level. … … … … [2] (iv) Use the information from Fig. 4.1 to sketch a pyramid of numbers for this food chain. [3]
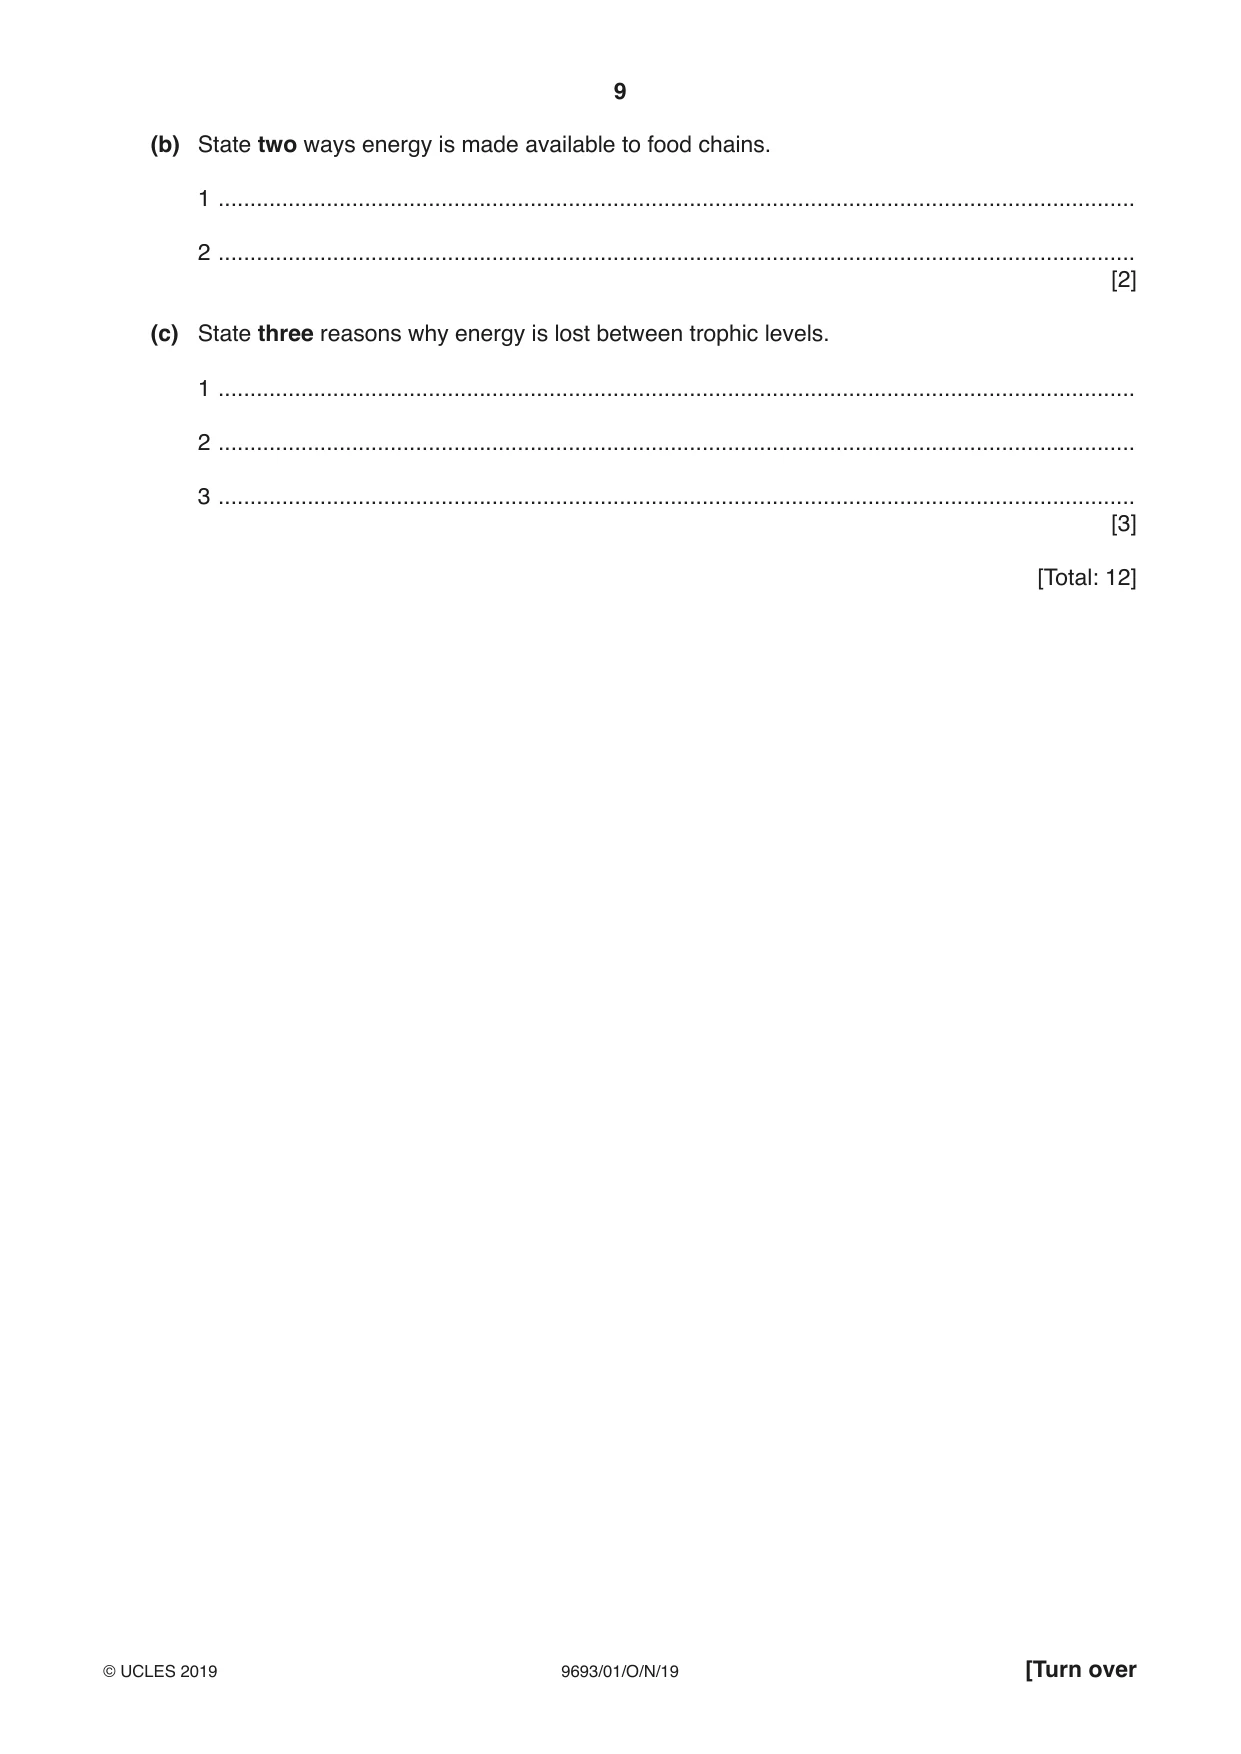
Question paper, page 9
9 9693/01/O/N/19 © UCLES 2019 [Turn over (b) State two ways energy is made available to food chains. 1 … 2 … [2] (c) State three reasons why energy is lost between trophic levels. 1 … 2 … 3 … [3] [Total: 12]
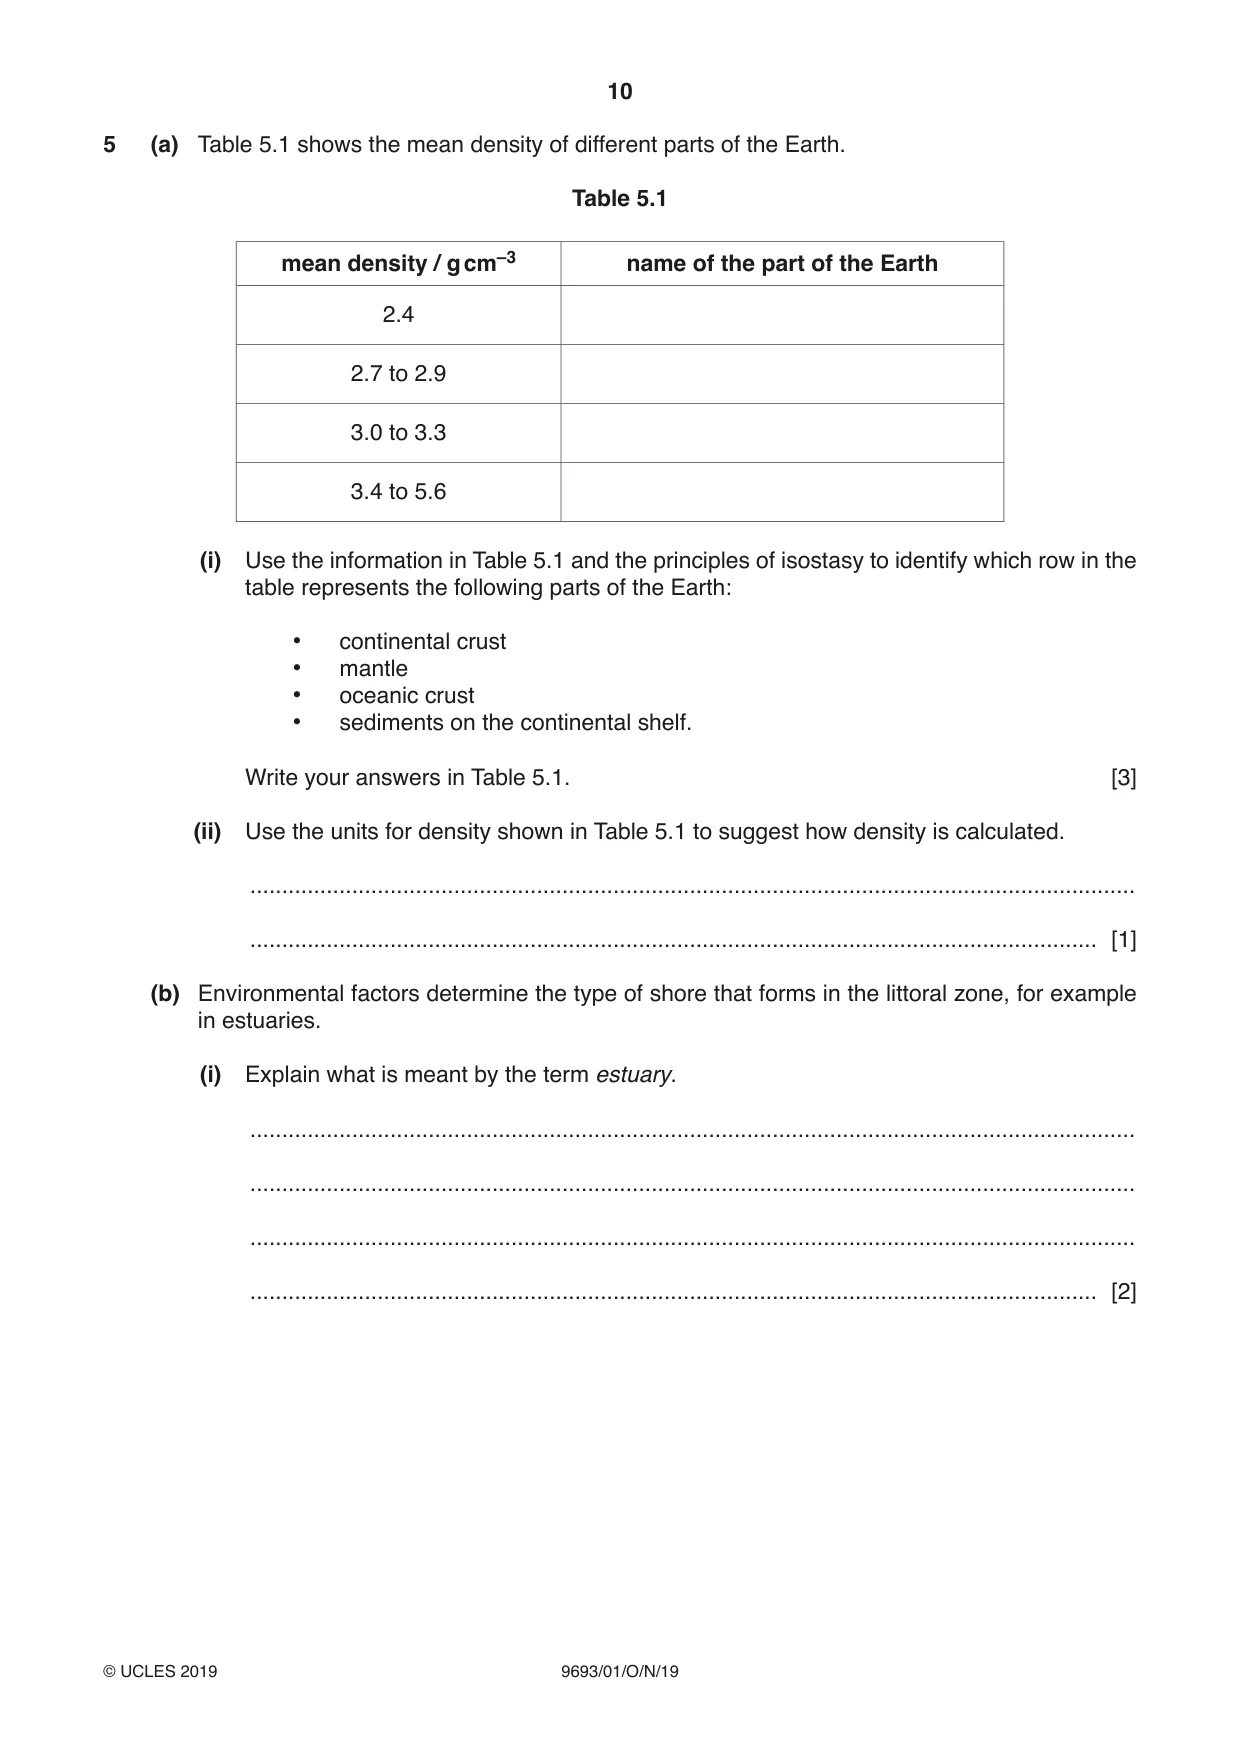
Question paper, page 10
10 9693/01/O/N/19 © UCLES 2019 5 (a) Table 5.1 shows the mean density of different parts of the Earth. Table 5.1 mean density / g cm–3 name of the part of the Earth 2.4 2.7 to 2.9 3.0 to 3.3 3.4 to 5.6 (i) Use the information in Table 5.1 and the principles of isostasy to identify which row in the table represents the following parts of the Earth: • continental crust • mantle • oceanic crust • sediments on the continental shelf. Write your answers in Table 5.1. [3] (ii) Use the units for density shown in Table 5.1 to suggest how density is calculated. … … [1] (b) Environmental factors determine the type of shore that forms in the littoral zone, for example in estuaries. (i) Explain what is meant by the term estuary. … … … … [2]
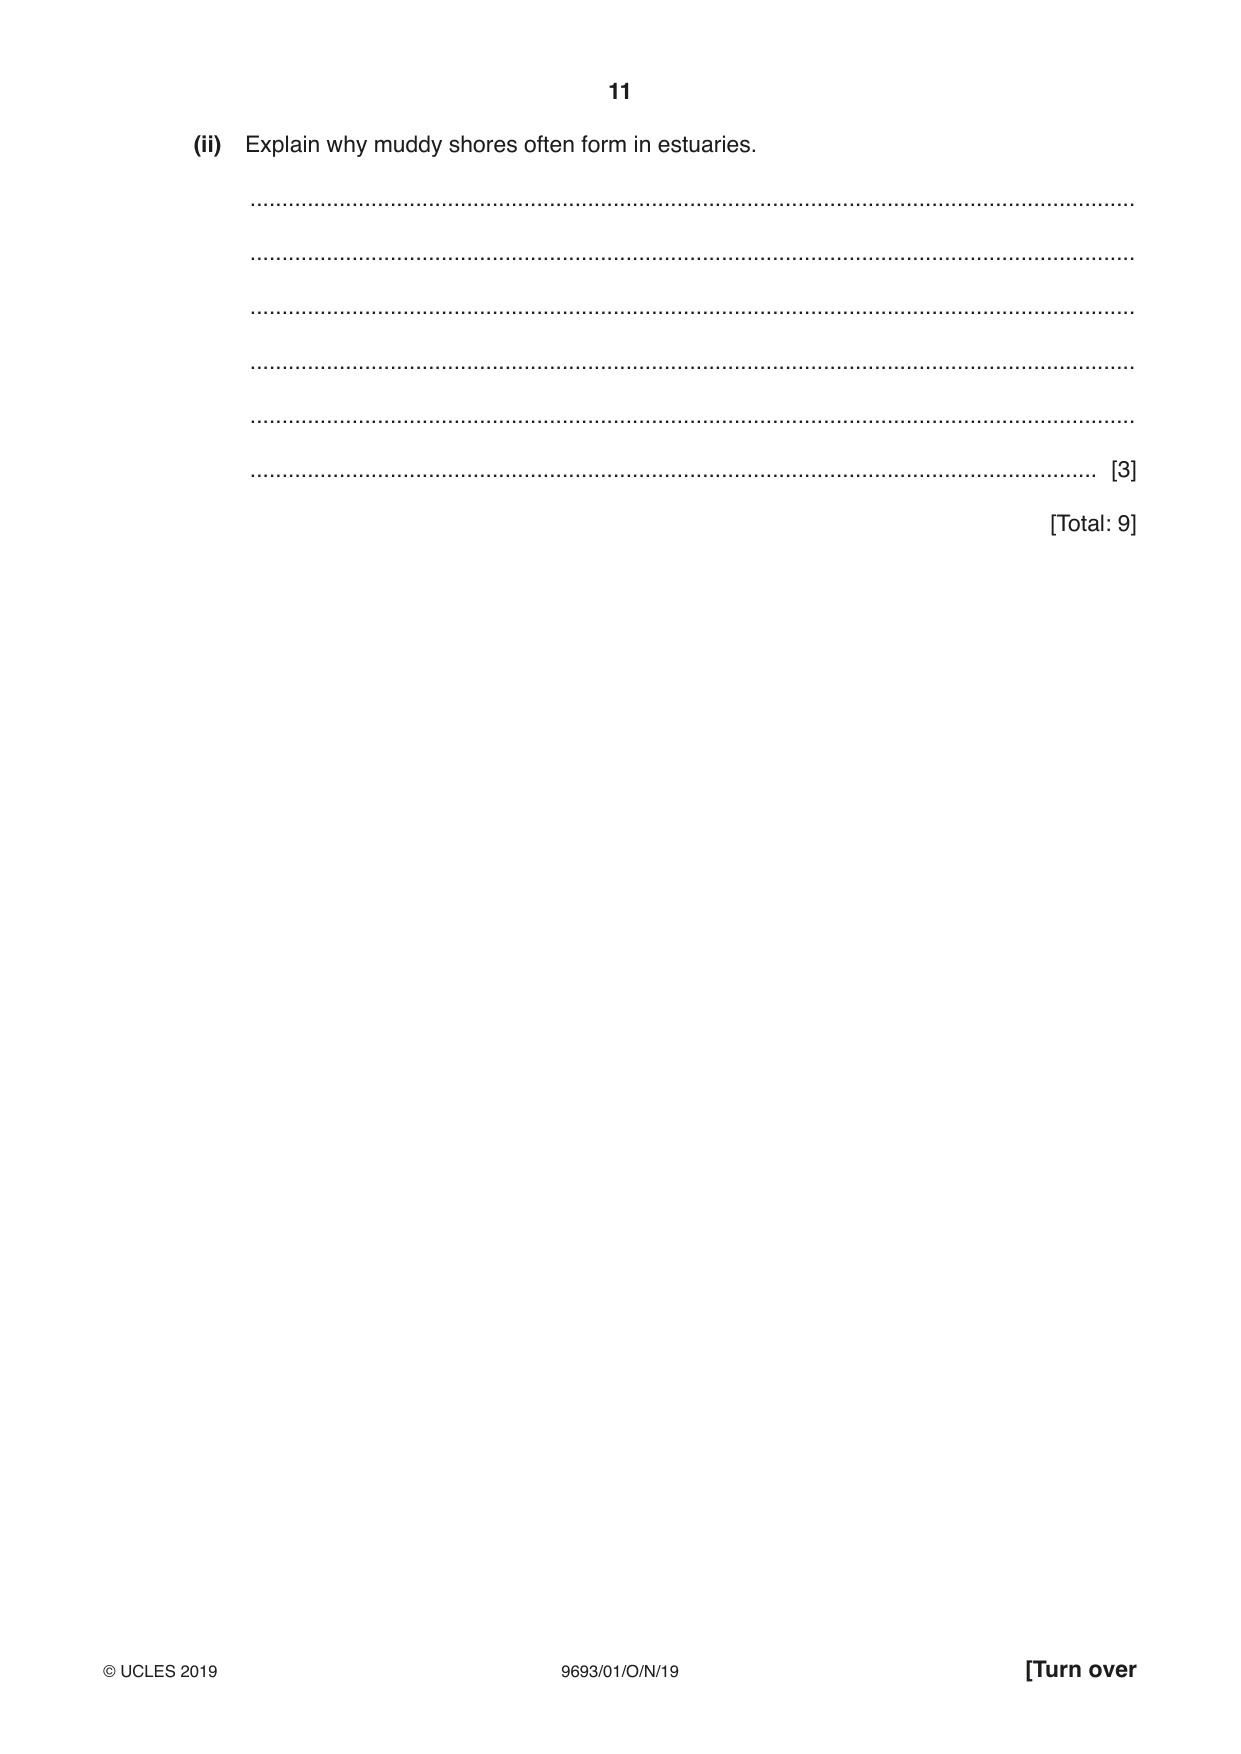
Question paper, page 11
11 9693/01/O/N/19 © UCLES 2019 [Turn over (ii) Explain why muddy shores often form in estuaries. … … … … … … [3] [Total: 9]
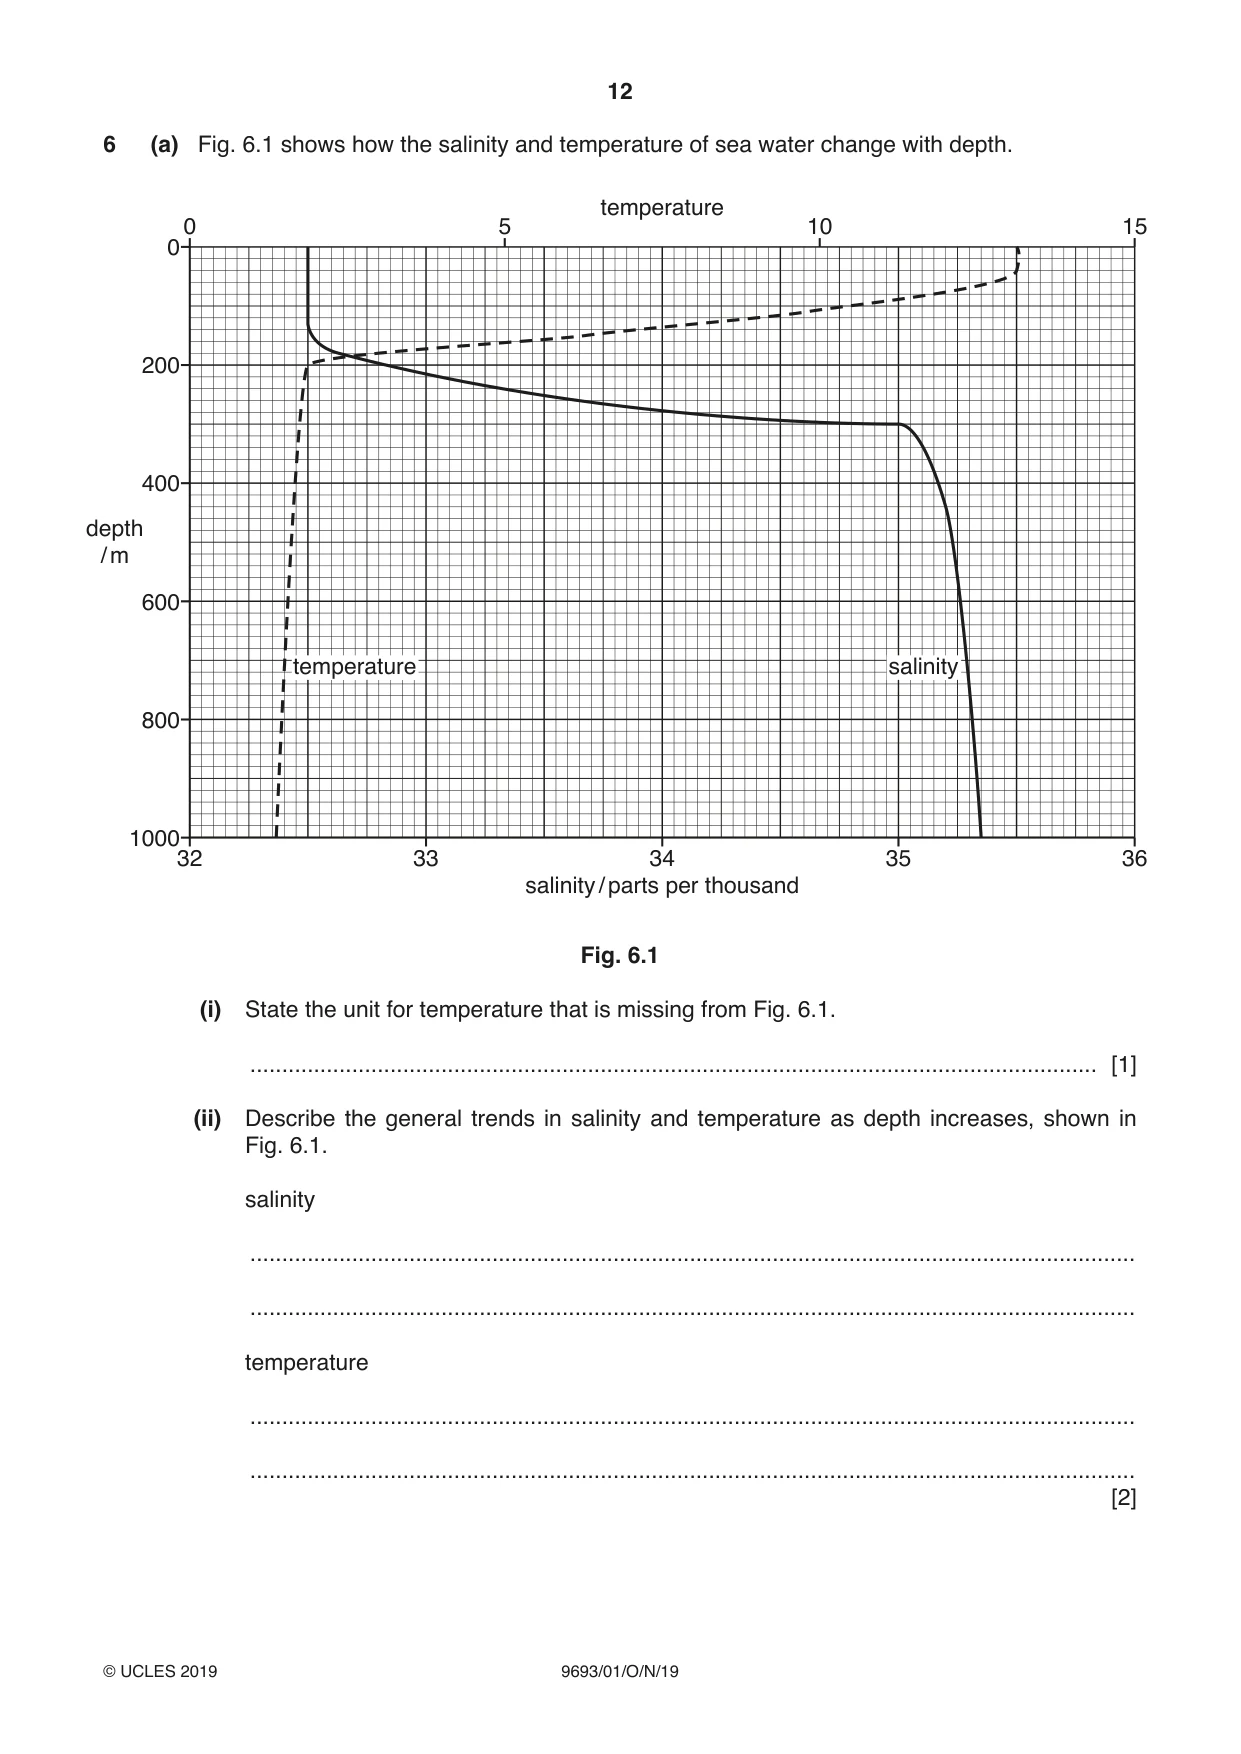
Question paper, page 12
12 9693/01/O/N/19 © UCLES 2019 6 (a) Fig. 6.1 shows how the salinity and temperature of sea water change with depth. 0 0 200 400 600 800 1000 32 33 34 35 36 5 10 15 temperature salinity / parts per thousand depth / m salinity temperature Fig. 6.1 (i) State the unit for temperature that is missing from Fig. 6.1. … [1] (ii) Describe the general trends in salinity and temperature as depth increases, shown in Fig. 6.1. salinity … … temperature … … [2]
Question paper, page 13
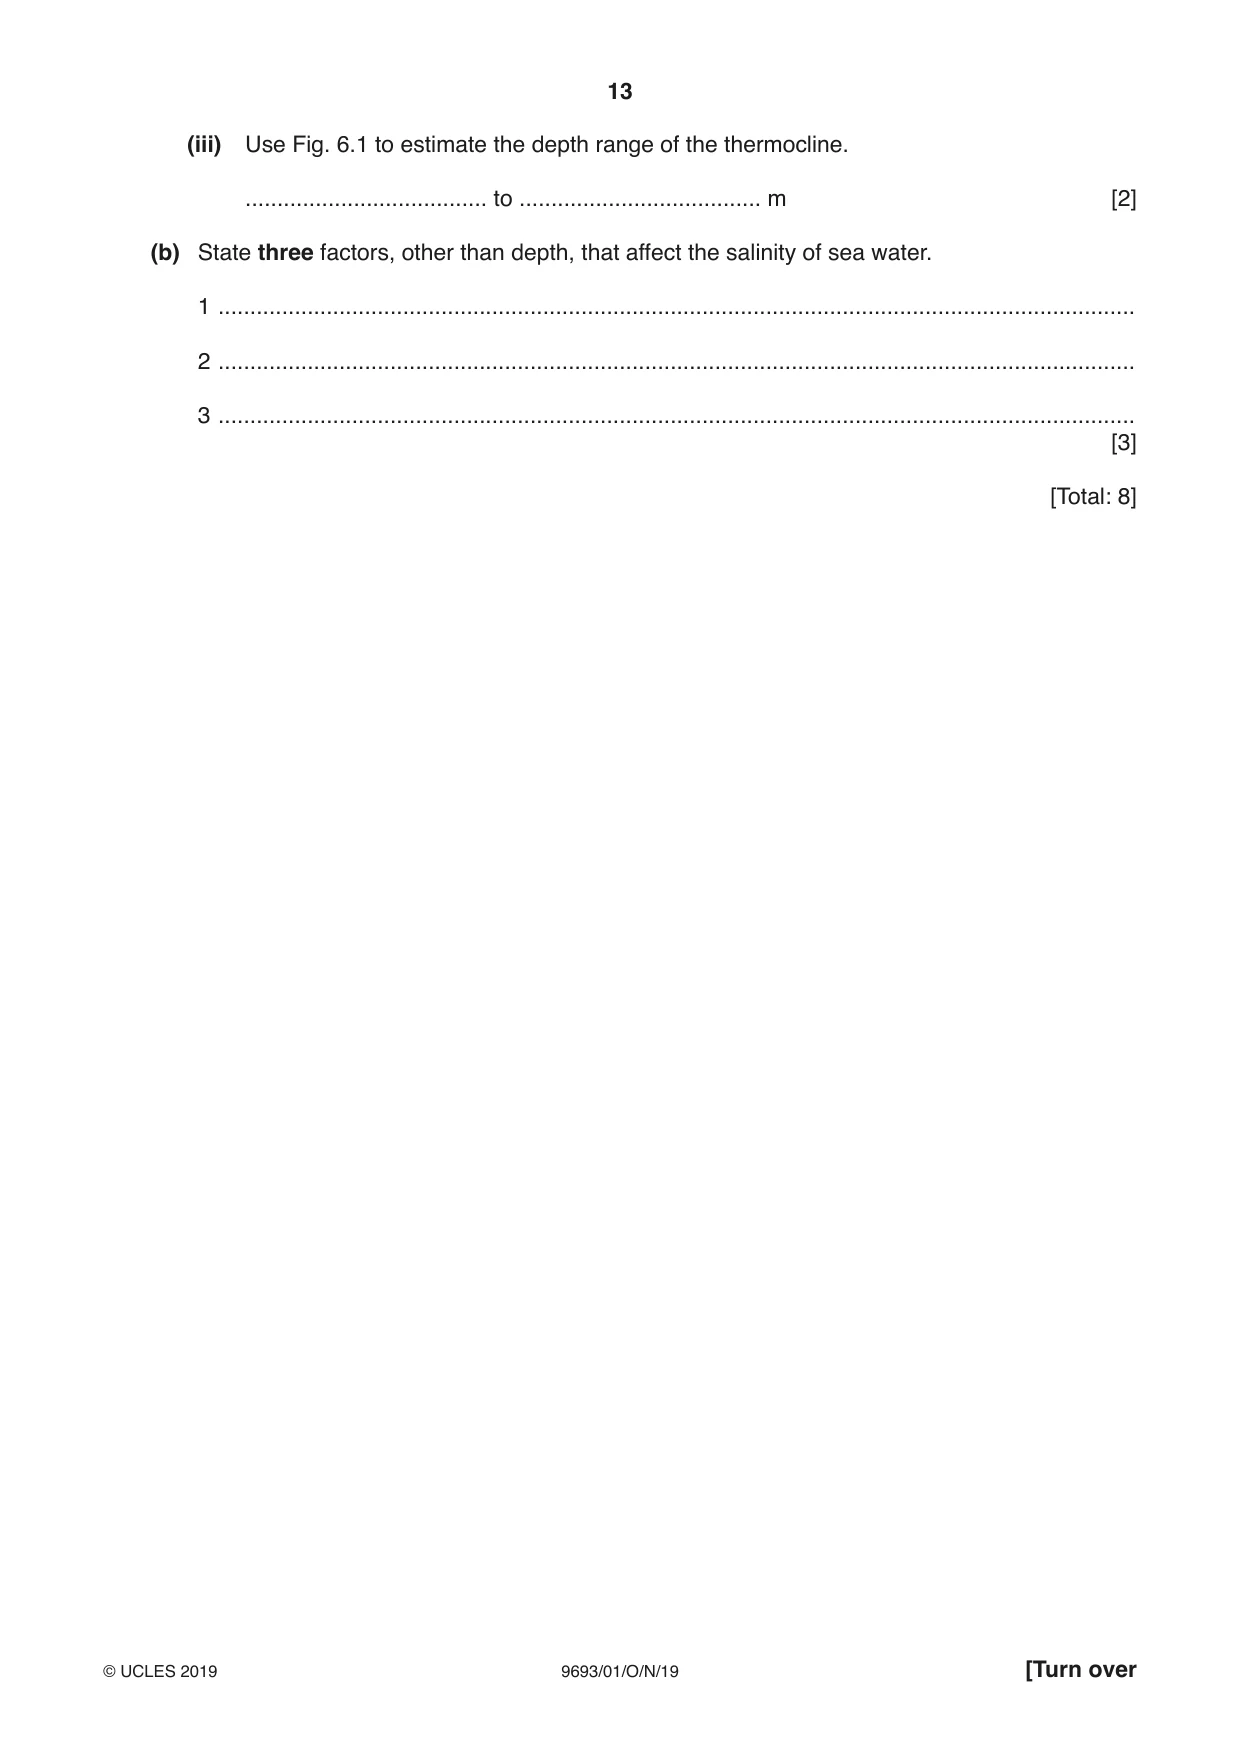
13 9693/01/O/N/19 © UCLES 2019 [Turn over (iii) Use Fig. 6.1 to estimate the depth range of the thermocline. … to … m [2] (b) State three factors, other than depth, that affect the salinity of sea water. 1 … 2 … 3 … [3] [Total: 8]
Question paper, page 14
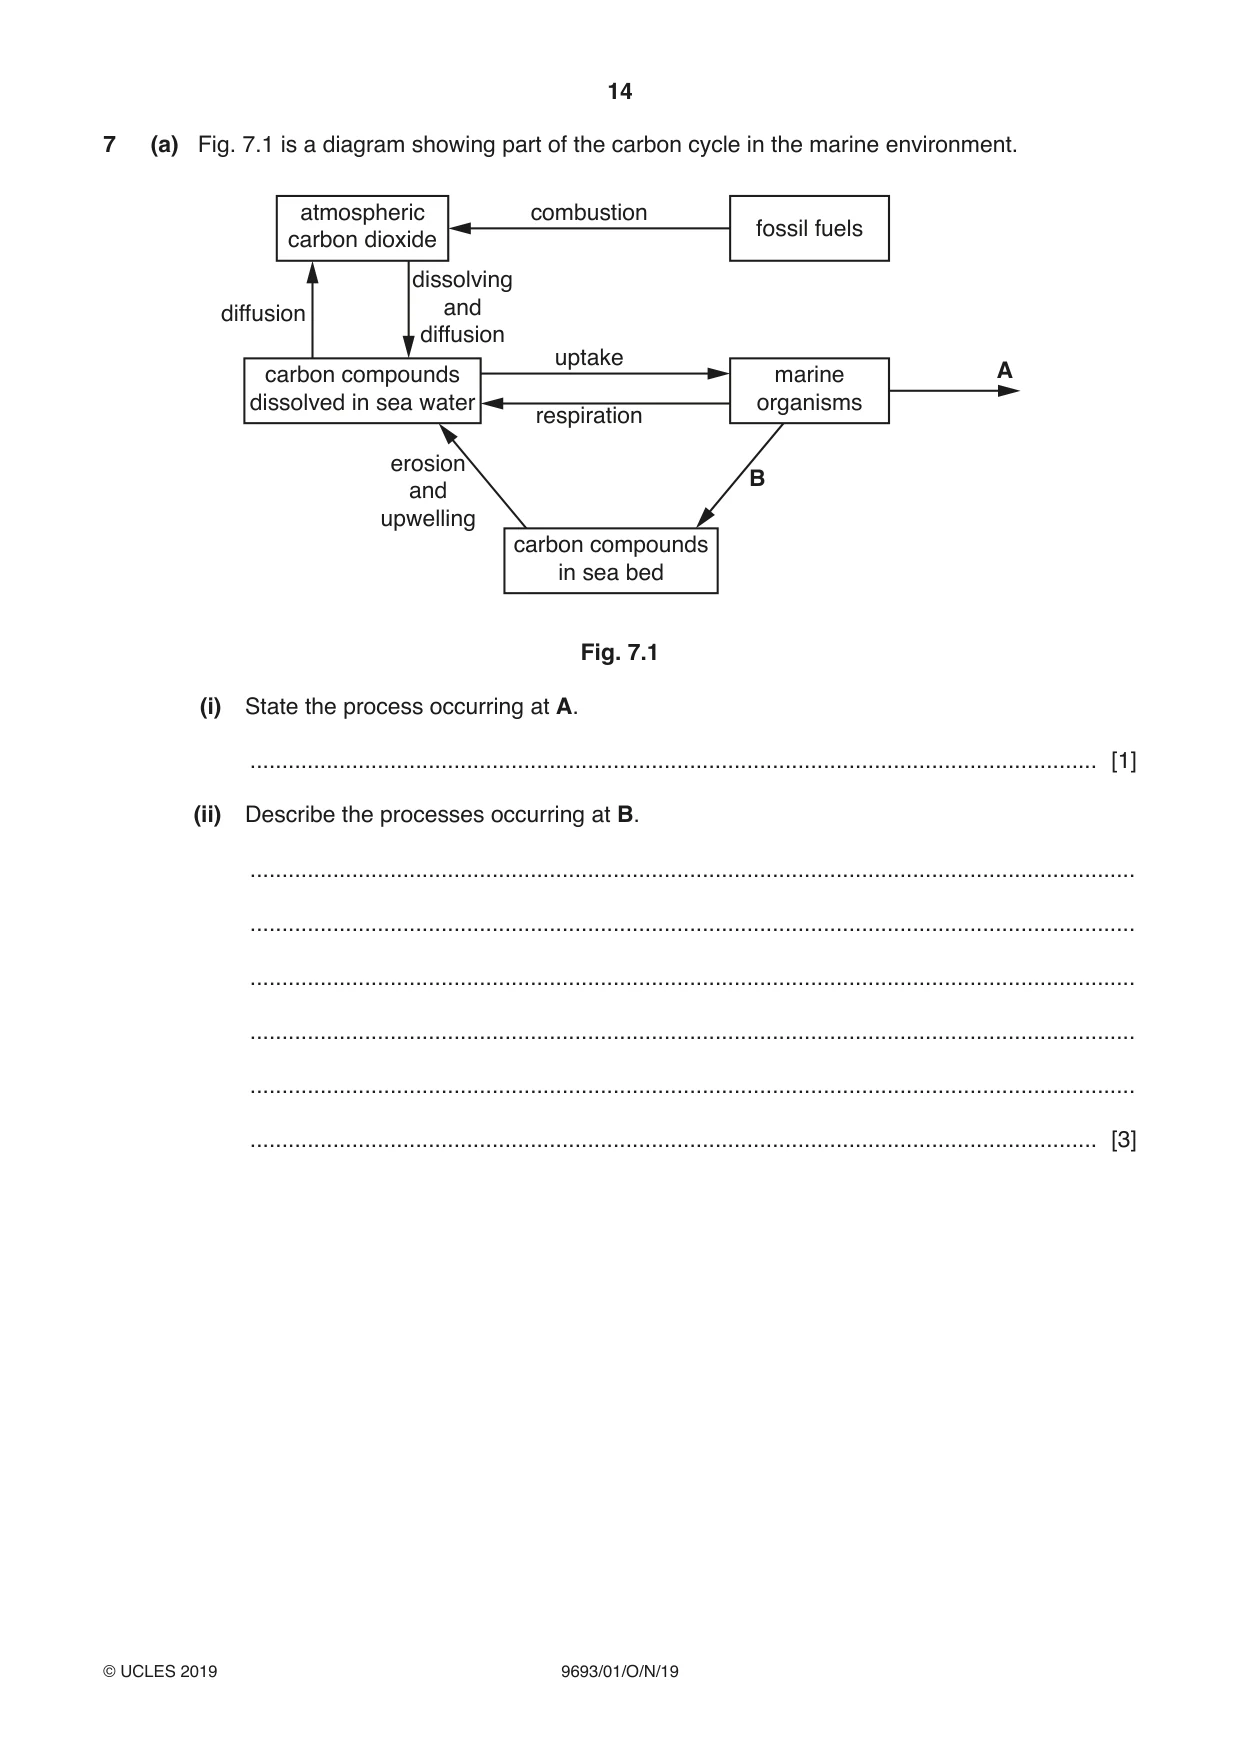
14 9693/01/O/N/19 © UCLES 2019 7 (a) Fig. 7.1 is a diagram showing part of the carbon cycle in the marine environment. atmospheric carbon dioxide carbon compounds dissolved in sea water carbon compounds in sea bed marine organisms fossil fuels combustion diffusion erosion and upwelling uptake respiration dissolving and diffusion A B Fig. 7.1 (i) State the process occurring at A. … [1] (ii) Describe the processes occurring at B. … … … … … … [3]
Question paper, page 15
15 9693/01/O/N/19 © UCLES 2019 [Turn over (b) Carbon dioxide is needed for photosynthesis. Explain how a decrease in atmospheric carbon dioxide could affect productivity in the oceans. … … … … … … … … [4] [Total: 8]
Question paper, page 16
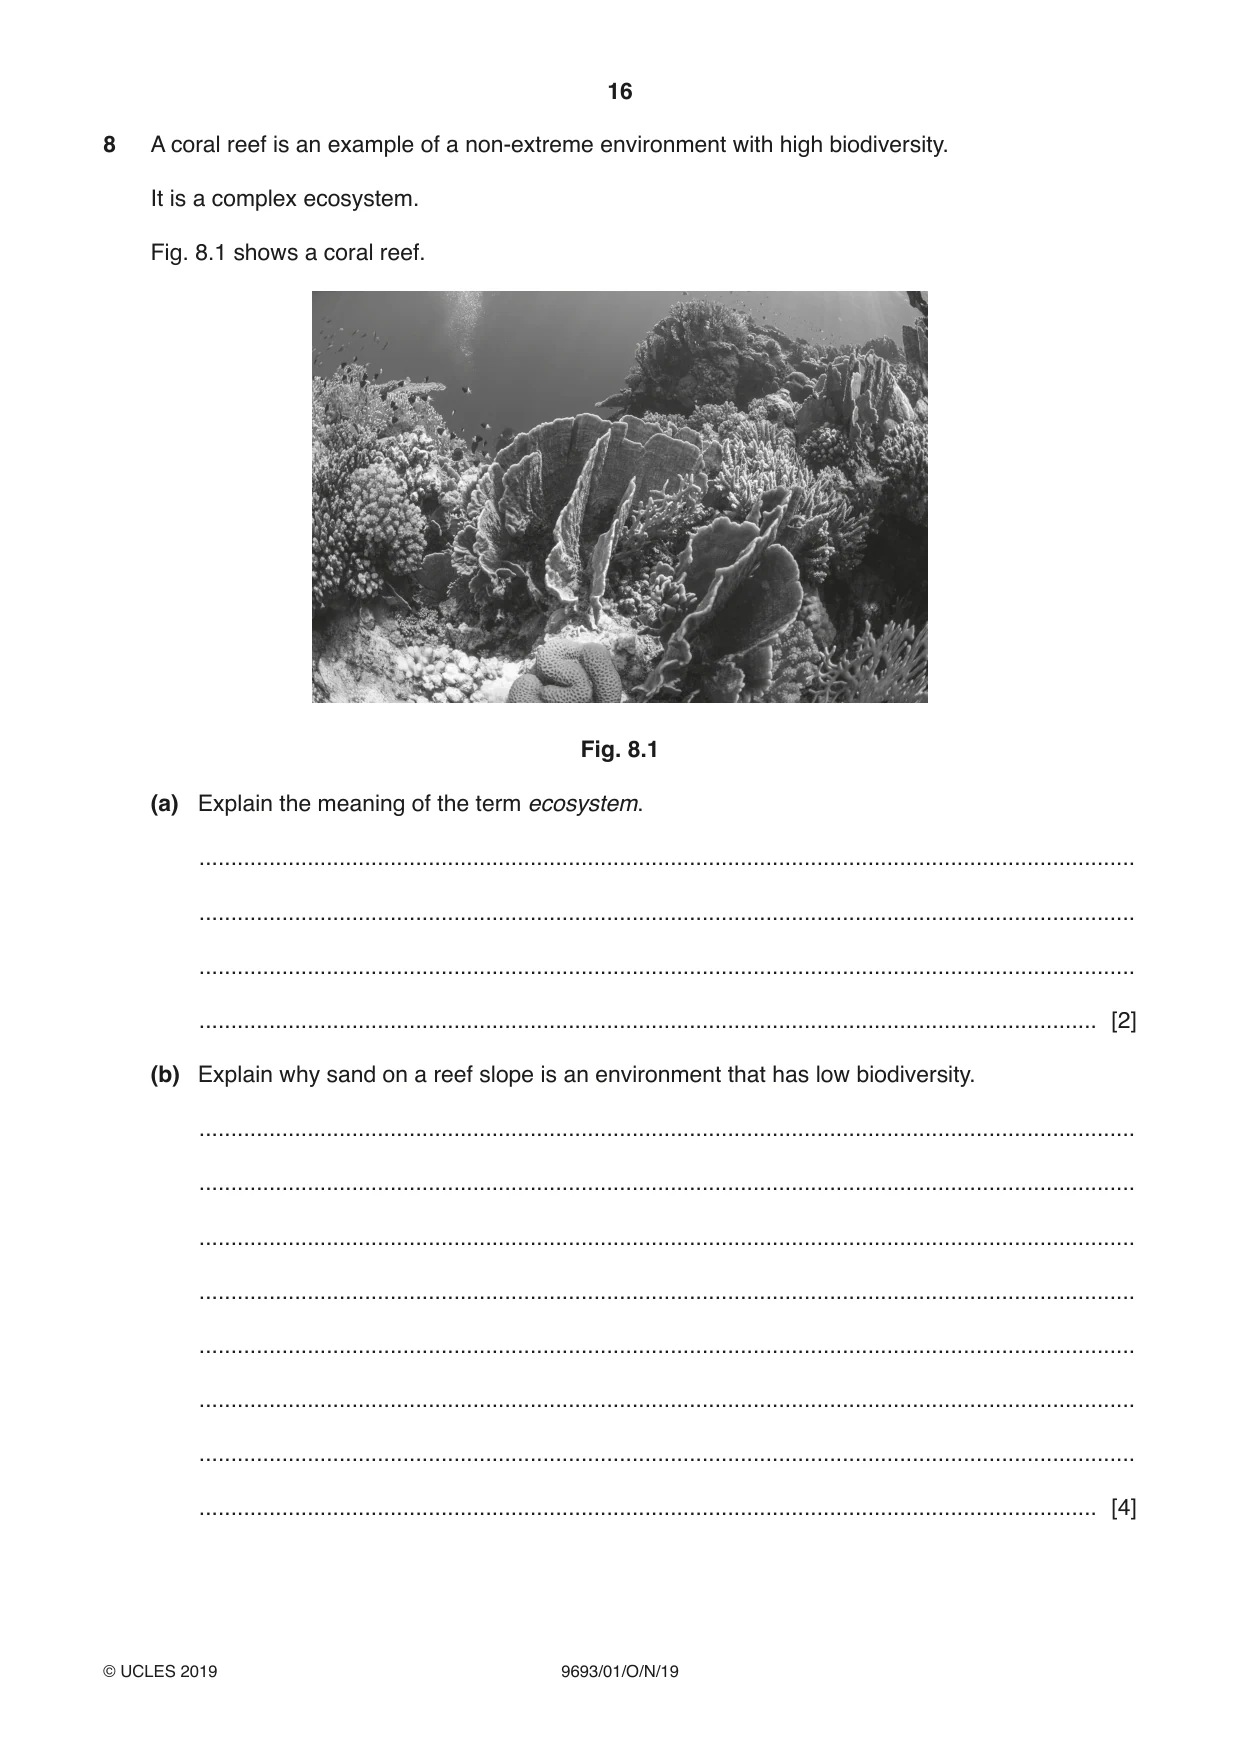
16 9693/01/O/N/19 © UCLES 2019 8 A coral reef is an example of a non-extreme environment with high biodiversity. It is a complex ecosystem. Fig. 8.1 shows a coral reef. Fig. 8.1 (a) Explain the meaning of the term ecosystem. … … … … [2] (b) Explain why sand on a reef slope is an environment that has low biodiversity. … … … … … … … … [4]
Question paper, page 17
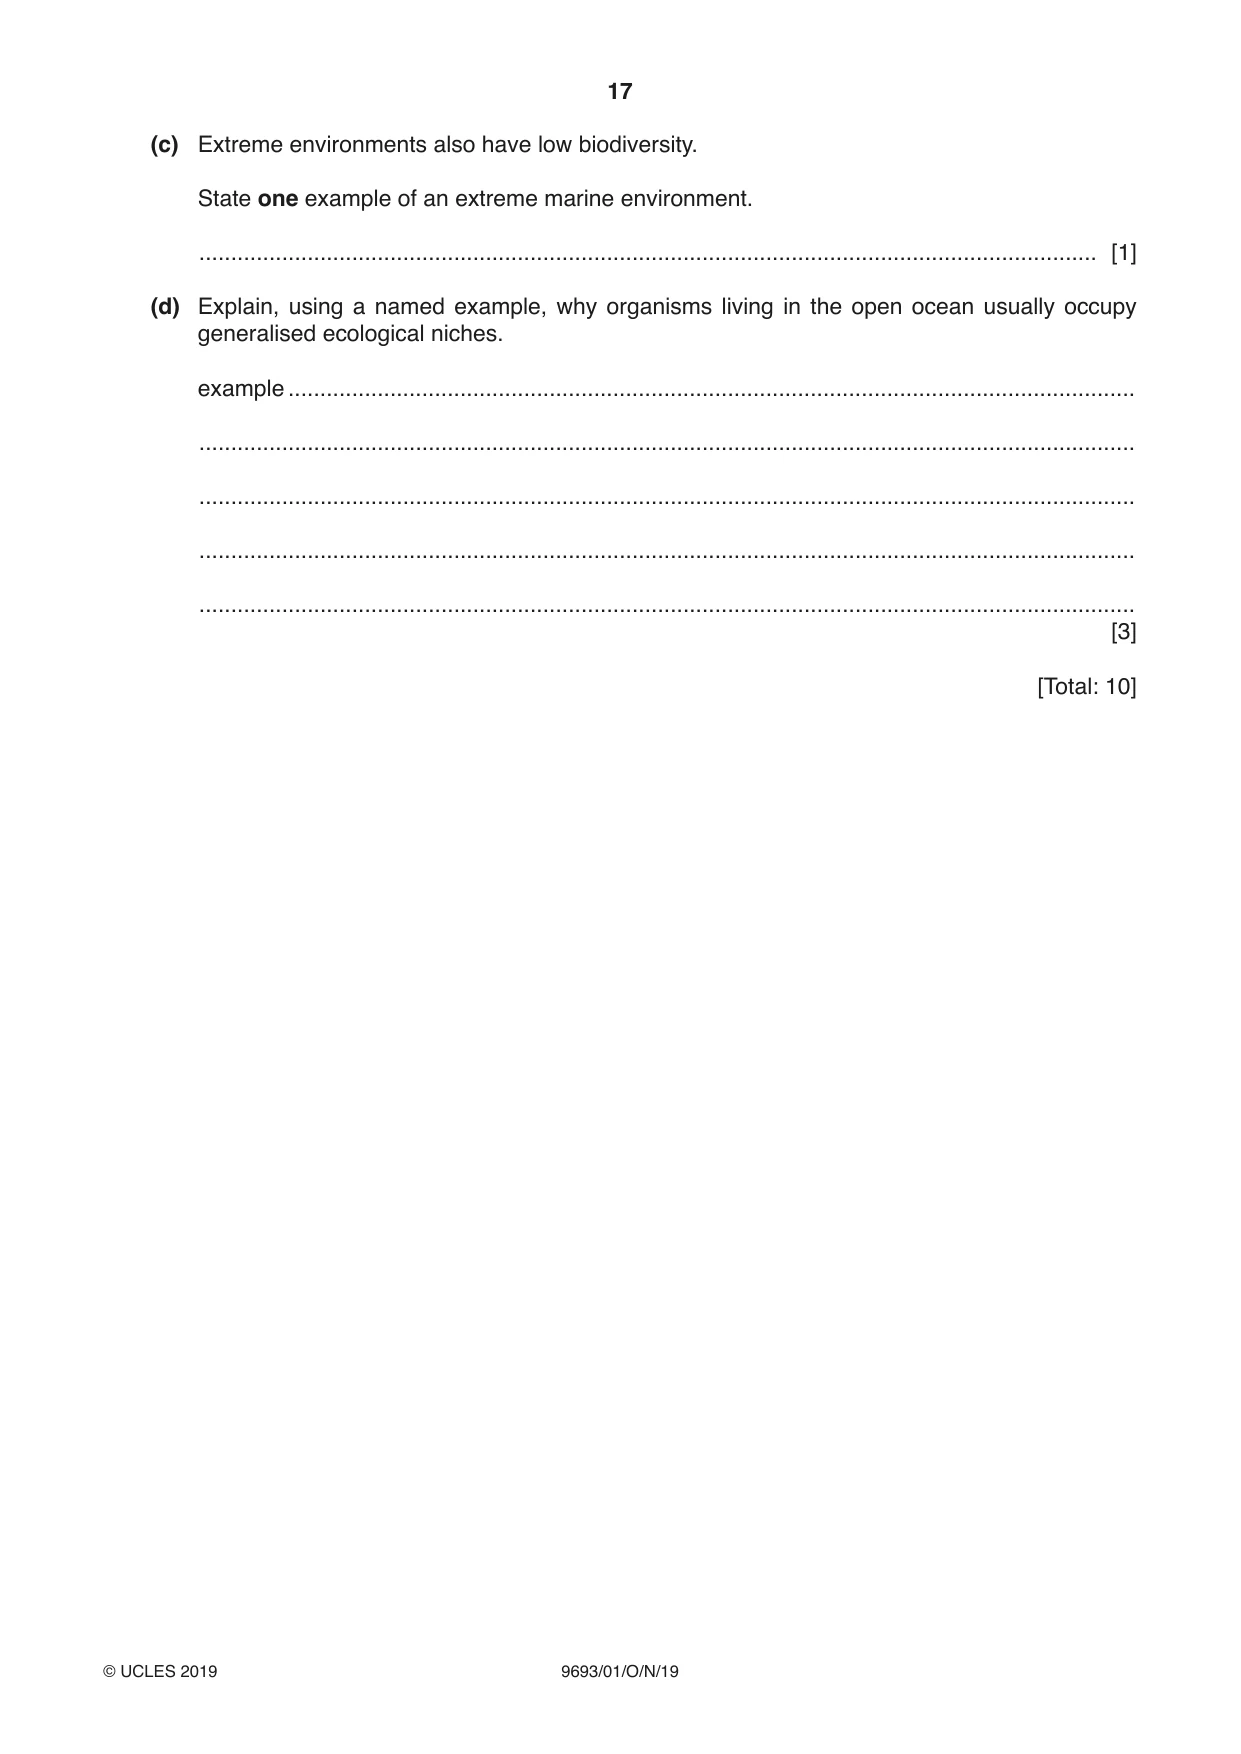
17 9693/01/O/N/19 © UCLES 2019 (c) Extreme environments also have low biodiversity. State one example of an extreme marine environment. … [1] (d) Explain, using a named example, why organisms living in the open ocean usually occupy generalised ecological niches. example … … … … … [3] [Total: 10]
Question paper, page 18
18 9693/01/O/N/19 © UCLES 2019 BLANK PAGE
Question paper, page 19
19 9693/01/O/N/19 © UCLES 2019 BLANK PAGE
Question paper, page 20
20 9693/01/O/N/19 © UCLES 2019 Permission to reproduce items where third-party owned material protected by copyright is included has been sought and cleared where possible. Every reasonable effort has been made by the publisher (UCLES) to trace copyright holders, but if any items requiring clearance have unwittingly been included, the publisher will be pleased to make amends at the earliest possible opportunity. To avoid the issue of disclosure of answer-related information to candidates, all copyright acknowledgements are reproduced online in the Cambridge Assessment International Education Copyright Acknowledgements Booklet. This is produced for each series of examinations and is freely available to download at www.cambridgeinternational.org after the live examination series. Cambridge Assessment International Education is part of the Cambridge Assessment Group. Cambridge Assessment is the brand name of the University of Cambridge Local Examinations Syndicate (UCLES), which itself is a department of the University of Cambridge. BLANK PAGE