Cambridge A Level Geography 9696 — 2013 May/June Paper 3 · Variant 3
9696/33/M/J/13 · 50 marks · ≈56 min
The question paper and its mark scheme, free to download. This is Cambridge’s own paper, exactly as it was sat — the on-screen preview is on its way; download below in the meantime.
Question paper
The on-screen preview isn’t ready for this paper yet — download it above instead.
Mark scheme10 pages
Answers below. Sit the paper first if you are practising.
Paper as text
Mark scheme, page 1
CAMBRIDGE INTERNATIONAL EXAMINATIONS GCE Advanced Subsidiary Level and GCE Advanced Level MARK SCHEME for the May/June 2013 series 9696 GEOGRAPHY 9696/33 Paper 3 (Advanced Human Options), maximum raw mark 50 This mark scheme is published as an aid to teachers and candidates, to indicate the requirements of the examination. It shows the basis on which Examiners were instructed to award marks. It does not indicate the details of the discussions that took place at an Examiners’ meeting before marking began, which would have considered the acceptability of alternative answers. Mark schemes should be read in conjunction with the question paper and the Principal Examiner Report for Teachers. Cambridge will not enter into discussions about these mark schemes. Cambridge is publishing the mark schemes for the May/June 2013 series for most IGCSE, GCE Advanced Level and Advanced Subsidiary Level components and some Ordinary Level components.
Mark scheme, page 2
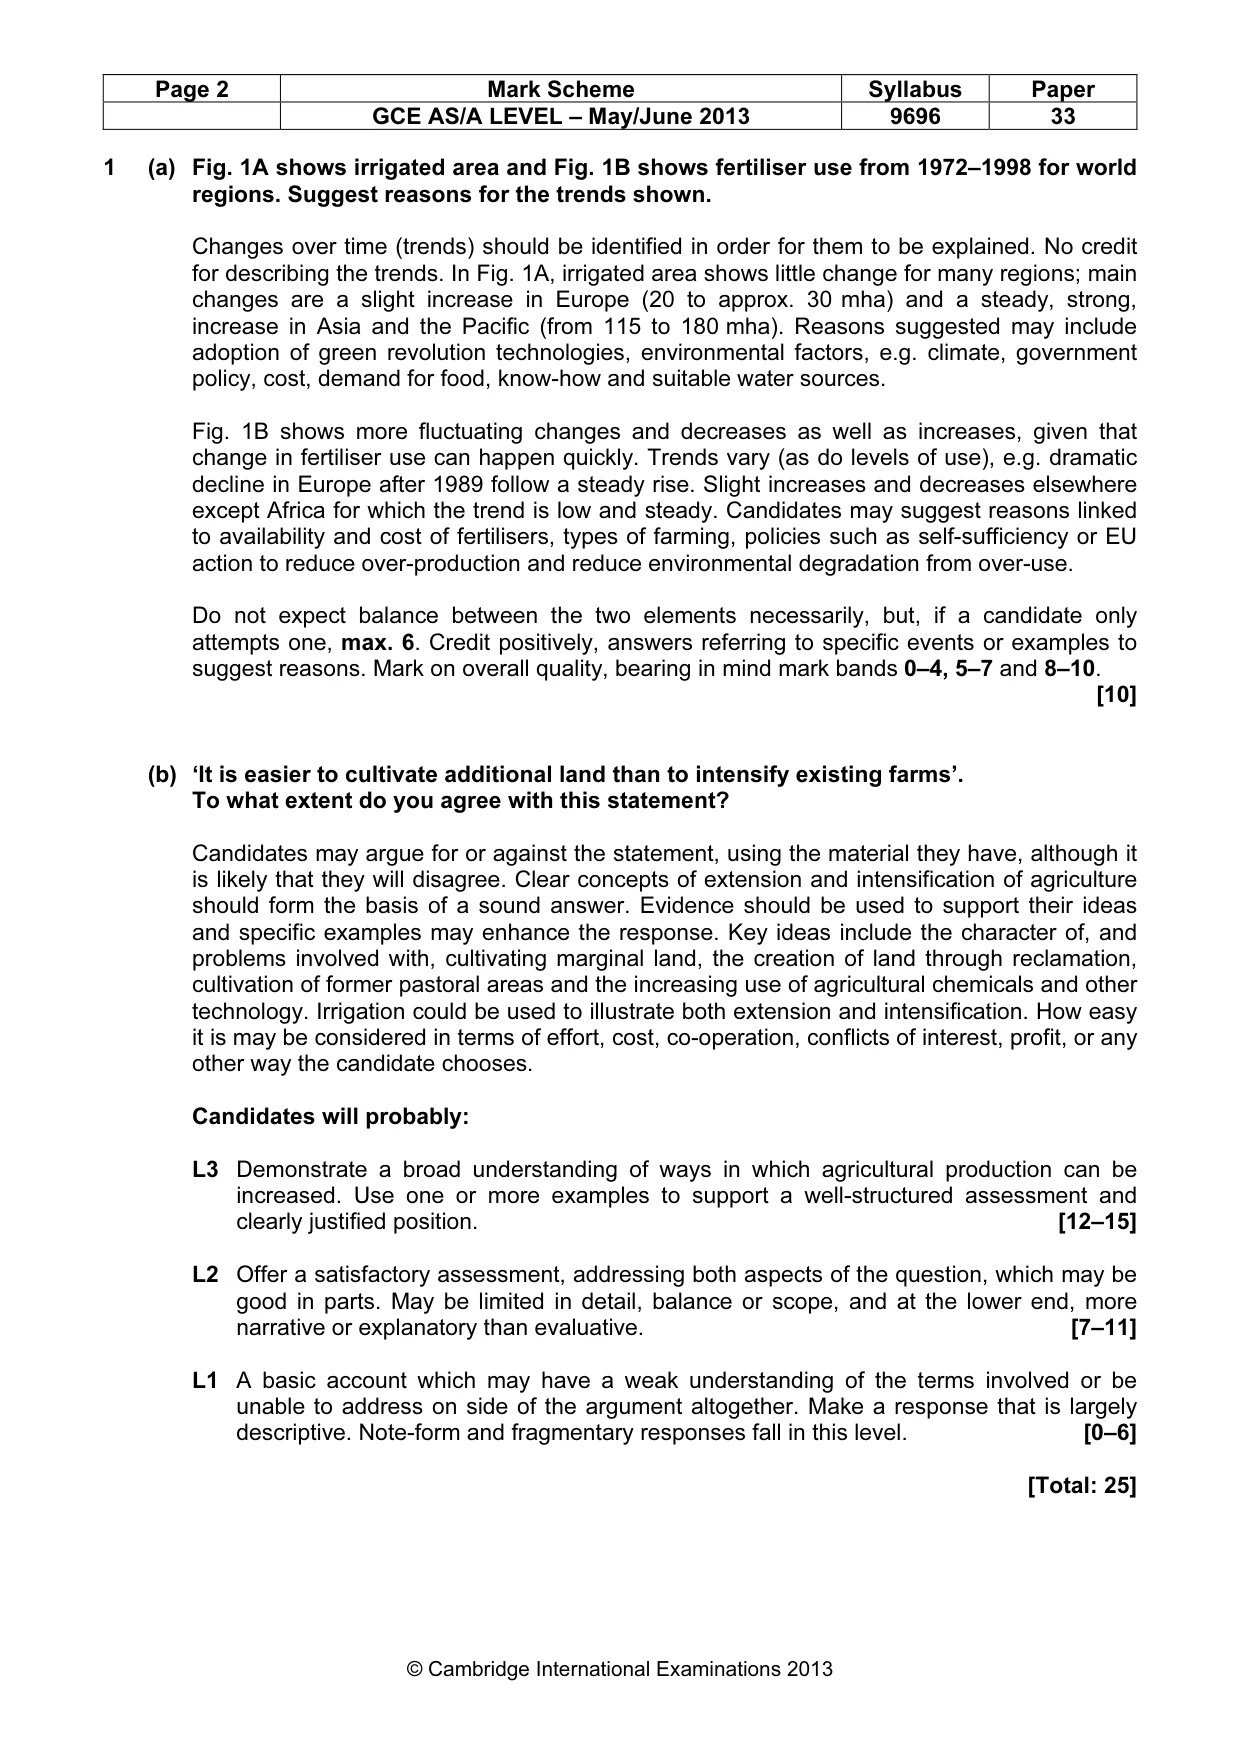
Page 2 Mark Scheme Syllabus Paper GCE AS/A LEVEL – May/June 2013 9696 33 © Cambridge International Examinations 2013 1 (a) Fig. 1A shows irrigated area and Fig. 1B shows fertiliser use from 1972–1998 for world regions. Suggest reasons for the trends shown. Changes over time (trends) should be identified in order for them to be explained. No credit for describing the trends. In Fig. 1A, irrigated area shows little change for many regions; main changes are a slight increase in Europe (20 to approx. 30 mha) and a steady, strong, increase in Asia and the Pacific (from 115 to 180 mha). Reasons suggested may include adoption of green revolution technologies, environmental factors, e.g. climate, government policy, cost, demand for food, know-how and suitable water sources. Fig. 1B shows more fluctuating changes and decreases as well as increases, given that change in fertiliser use can happen quickly. Trends vary (as do levels of use), e.g. dramatic decline in Europe after 1989 follow a steady rise. Slight increases and decreases elsewhere except Africa for which the trend is low and steady. Candidates may suggest reasons linked to availability and cost of fertilisers, types of farming, policies such as self-sufficiency or EU action to reduce over-production and reduce environmental degradation from over-use. Do not expect balance between the two elements necessarily, but, if a candidate only attempts one, max. 6. Credit positively, answers referring to specific events or examples to suggest reasons. Mark on overall quality, bearing in mind mark bands 0–4, 5–7 and 8–10. [10] (b) ‘It is easier to cultivate additional land than to intensify existing farms’. To what extent do you agree with this statement? Candidates may argue for or against the statement, using the material they have, although it is likely that they will disagree. Clear concepts of extension and intensification of agriculture should form the basis of a sound answer. Evidence should be used to support their ideas and specific examples may enhance the response. Key ideas include the character of, and problems involved with, cultivating marginal land, the creation of land through reclamation, cultivation of former pastoral areas and the increasing use of agricultural chemicals and other technology. Irrigation could be used to illustrate both extension and intensification. How easy it is may be considered in terms of effort, cost, co-operation, conflicts of interest, profit, or any other way the candidate chooses. Candidates will probably: L3 Demonstrate a broad understanding of ways in which agricultural production can be increased. Use one or more examples to support a well-structured assessment and clearly justified position. [12–15] L2 Offer a satisfactory assessment, addressing both aspects of the question, which may be good in parts. May be limited in detail, balance or scope, and at the lower end, more narrative or explanatory than evaluative. [7–11] L1 A basic account which may have a weak understanding of the terms involved or be unable to address on side of the argument altogether. Make a response that is largely descriptive. Note-form and fragmentary responses fall in this level. [0–6] [Total: 25]
Mark scheme, page 3
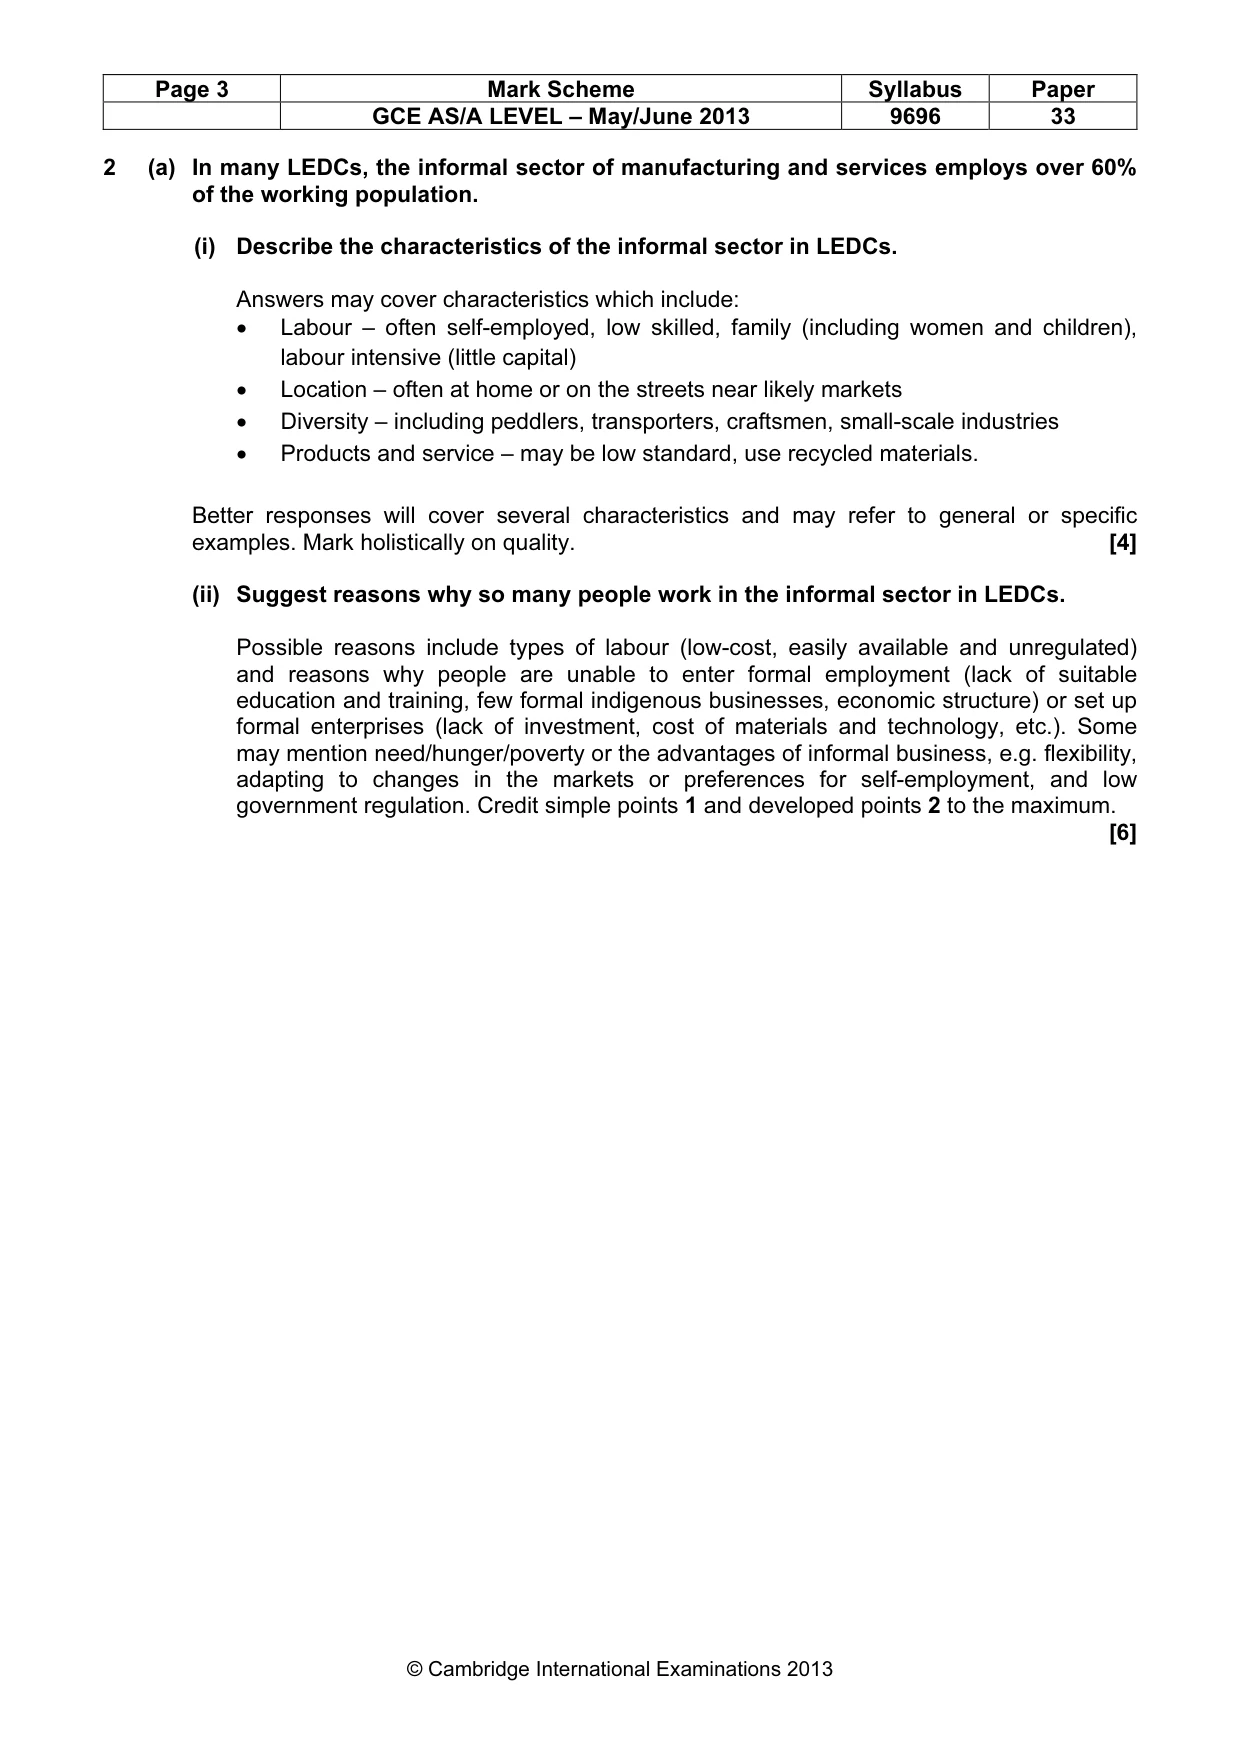
Page 3 Mark Scheme Syllabus Paper GCE AS/A LEVEL – May/June 2013 9696 33 © Cambridge International Examinations 2013 2 (a) In many LEDCs, the informal sector of manufacturing and services employs over 60% of the working population. (i) Describe the characteristics of the informal sector in LEDCs. Answers may cover characteristics which include: • Labour – often self-employed, low skilled, family (including women and children), labour intensive (little capital) • Location – often at home or on the streets near likely markets • Diversity – including peddlers, transporters, craftsmen, small-scale industries • Products and service – may be low standard, use recycled materials. Better responses will cover several characteristics and may refer to general or specific examples. Mark holistically on quality. [4] (ii) Suggest reasons why so many people work in the informal sector in LEDCs. Possible reasons include types of labour (low-cost, easily available and unregulated) and reasons why people are unable to enter formal employment (lack of suitable education and training, few formal indigenous businesses, economic structure) or set up formal enterprises (lack of investment, cost of materials and technology, etc.). Some may mention need/hunger/poverty or the advantages of informal business, e.g. flexibility, adapting to changes in the markets or preferences for self-employment, and low government regulation. Credit simple points 1 and developed points 2 to the maximum. [6]
Mark scheme, page 4
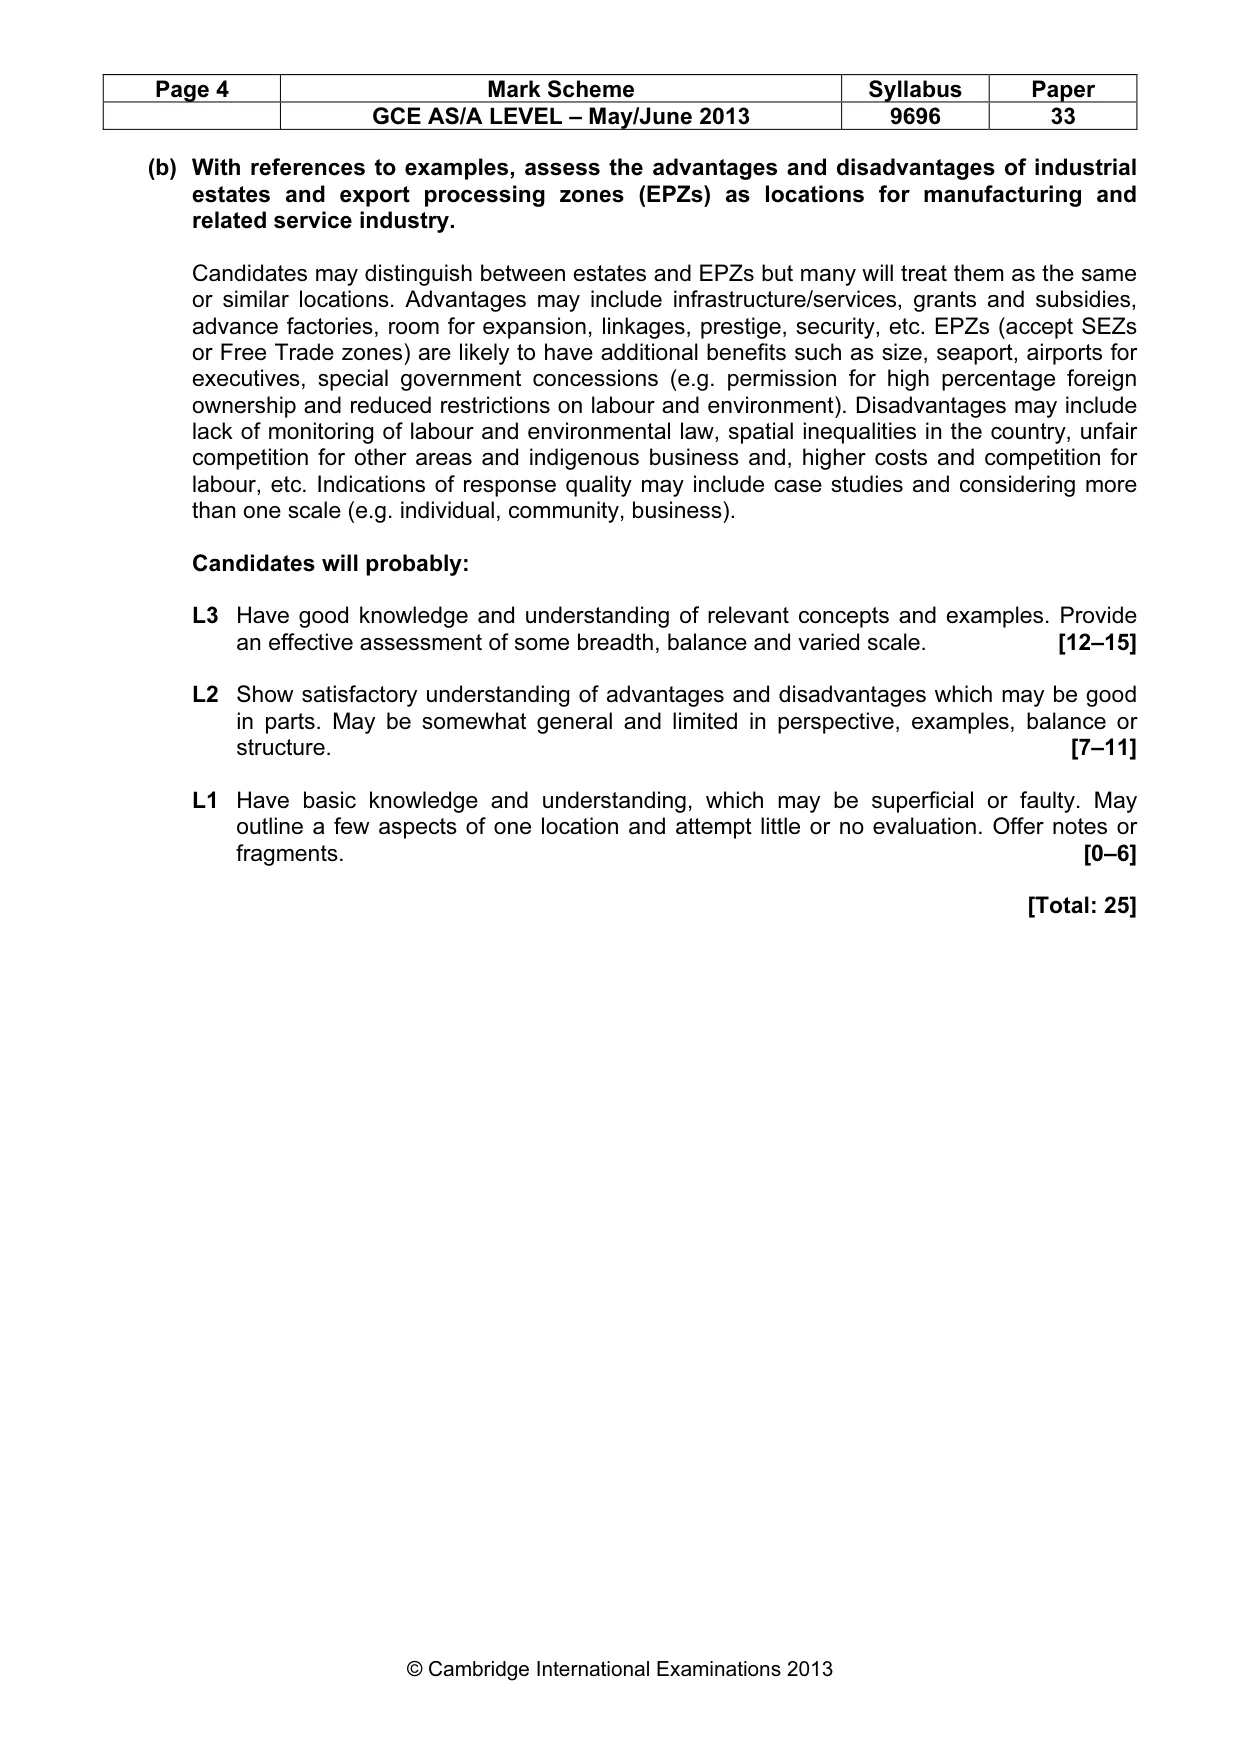
Page 4 Mark Scheme Syllabus Paper GCE AS/A LEVEL – May/June 2013 9696 33 © Cambridge International Examinations 2013 (b) With references to examples, assess the advantages and disadvantages of industrial estates and export processing zones (EPZs) as locations for manufacturing and related service industry. Candidates may distinguish between estates and EPZs but many will treat them as the same or similar locations. Advantages may include infrastructure/services, grants and subsidies, advance factories, room for expansion, linkages, prestige, security, etc. EPZs (accept SEZs or Free Trade zones) are likely to have additional benefits such as size, seaport, airports for executives, special government concessions (e.g. permission for high percentage foreign ownership and reduced restrictions on labour and environment). Disadvantages may include lack of monitoring of labour and environmental law, spatial inequalities in the country, unfair competition for other areas and indigenous business and, higher costs and competition for labour, etc. Indications of response quality may include case studies and considering more than one scale (e.g. individual, community, business). Candidates will probably: L3 Have good knowledge and understanding of relevant concepts and examples. Provide an effective assessment of some breadth, balance and varied scale. [12–15] L2 Show satisfactory understanding of advantages and disadvantages which may be good in parts. May be somewhat general and limited in perspective, examples, balance or structure. [7–11] L1 Have basic knowledge and understanding, which may be superficial or faulty. May outline a few aspects of one location and attempt little or no evaluation. Offer notes or fragments. [0–6] [Total: 25]
Mark scheme, page 5
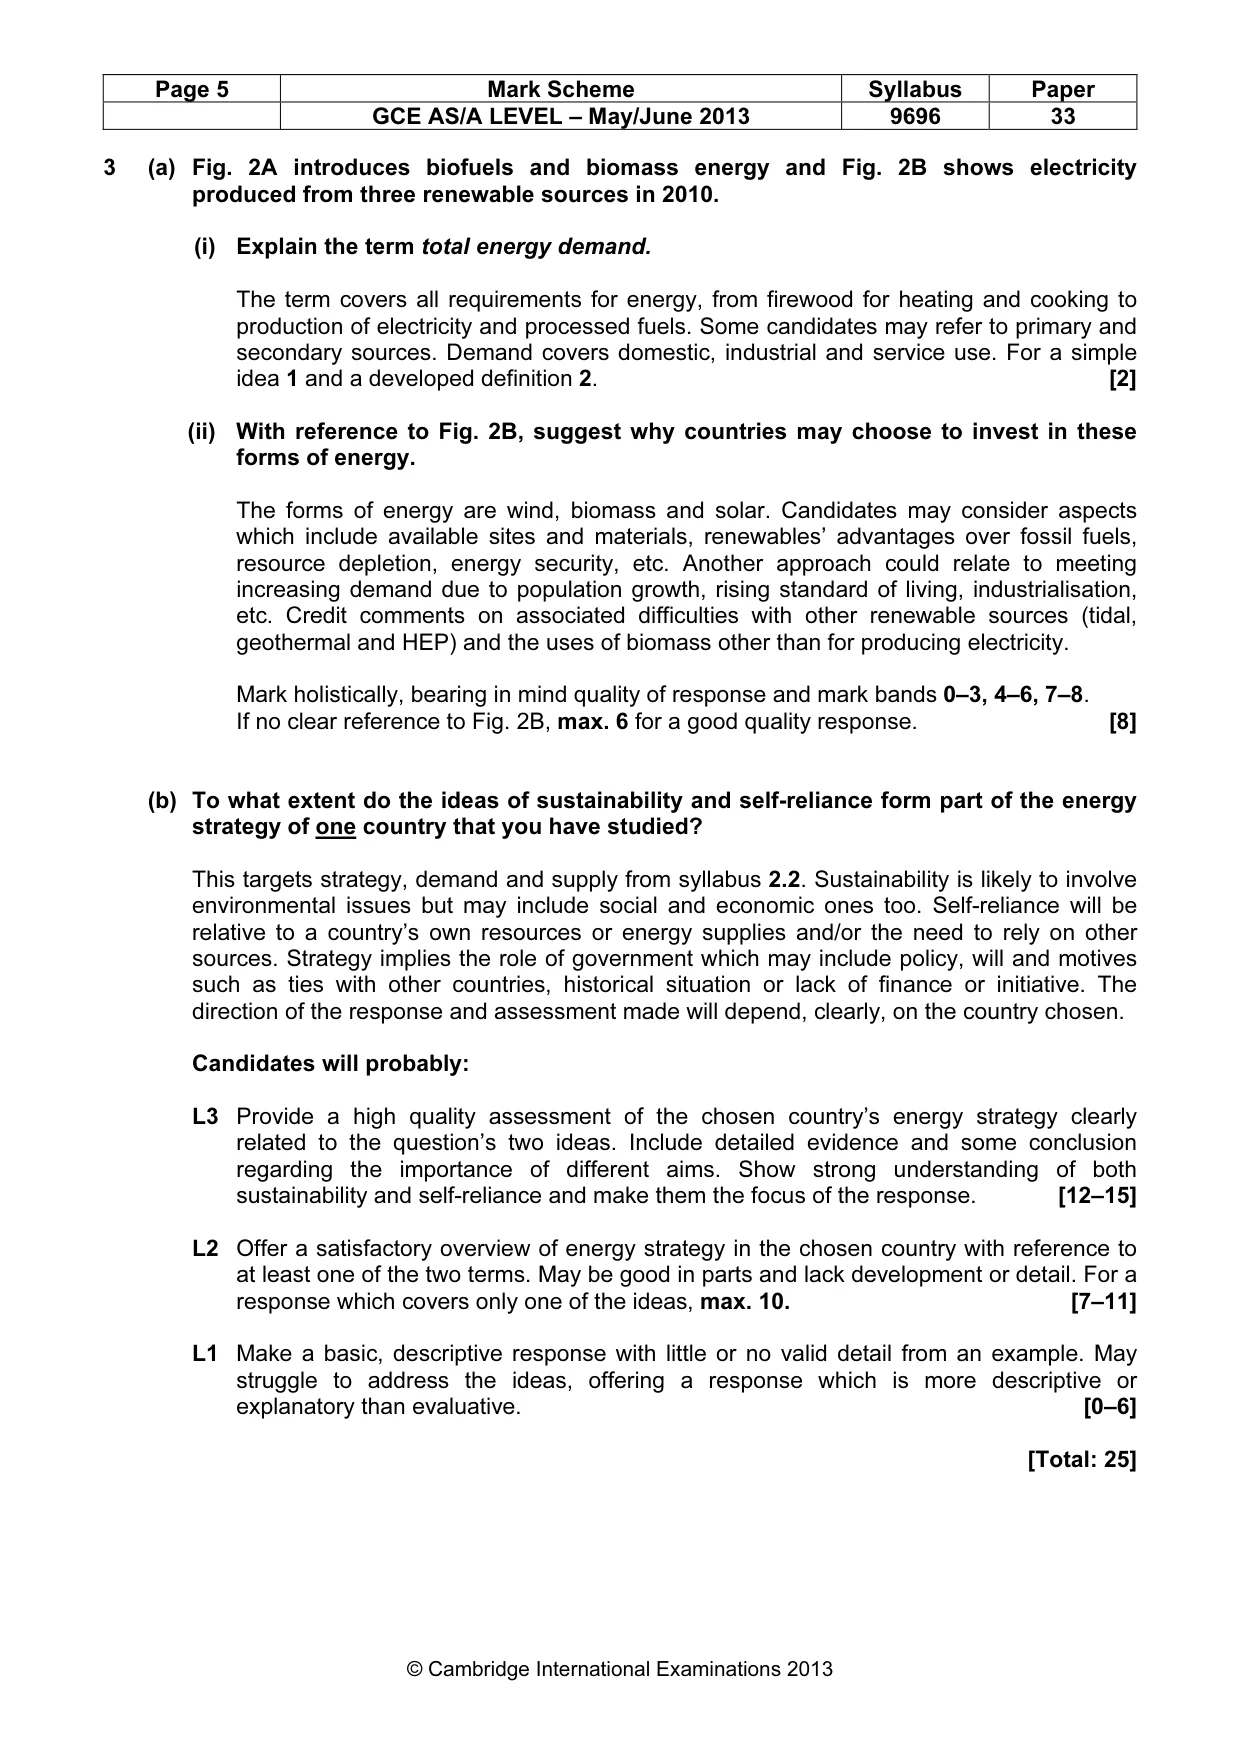
Page 5 Mark Scheme Syllabus Paper GCE AS/A LEVEL – May/June 2013 9696 33 © Cambridge International Examinations 2013 3 (a) Fig. 2A introduces biofuels and biomass energy and Fig. 2B shows electricity produced from three renewable sources in 2010. (i) Explain the term total energy demand. The term covers all requirements for energy, from firewood for heating and cooking to production of electricity and processed fuels. Some candidates may refer to primary and secondary sources. Demand covers domestic, industrial and service use. For a simple idea 1 and a developed definition 2. [2] (ii) With reference to Fig. 2B, suggest why countries may choose to invest in these forms of energy. The forms of energy are wind, biomass and solar. Candidates may consider aspects which include available sites and materials, renewables’ advantages over fossil fuels, resource depletion, energy security, etc. Another approach could relate to meeting increasing demand due to population growth, rising standard of living, industrialisation, etc. Credit comments on associated difficulties with other renewable sources (tidal, geothermal and HEP) and the uses of biomass other than for producing electricity. Mark holistically, bearing in mind quality of response and mark bands 0–3, 4–6, 7–8. If no clear reference to Fig. 2B, max. 6 for a good quality response. [8] (b) To what extent do the ideas of sustainability and self-reliance form part of the energy strategy of one country that you have studied? This targets strategy, demand and supply from syllabus 2.2. Sustainability is likely to involve environmental issues but may include social and economic ones too. Self-reliance will be relative to a country’s own resources or energy supplies and/or the need to rely on other sources. Strategy implies the role of government which may include policy, will and motives such as ties with other countries, historical situation or lack of finance or initiative. The direction of the response and assessment made will depend, clearly, on the country chosen. Candidates will probably: L3 Provide a high quality assessment of the chosen country’s energy strategy clearly related to the question’s two ideas. Include detailed evidence and some conclusion regarding the importance of different aims. Show strong understanding of both sustainability and self-reliance and make them the focus of the response. [12–15] L2 Offer a satisfactory overview of energy strategy in the chosen country with reference to at least one of the two terms. May be good in parts and lack development or detail. For a response which covers only one of the ideas, max. 10. [7–11] L1 Make a basic, descriptive response with little or no valid detail from an example. May struggle to address the ideas, offering a response which is more descriptive or explanatory than evaluative. [0–6] [Total: 25]
Mark scheme, page 6
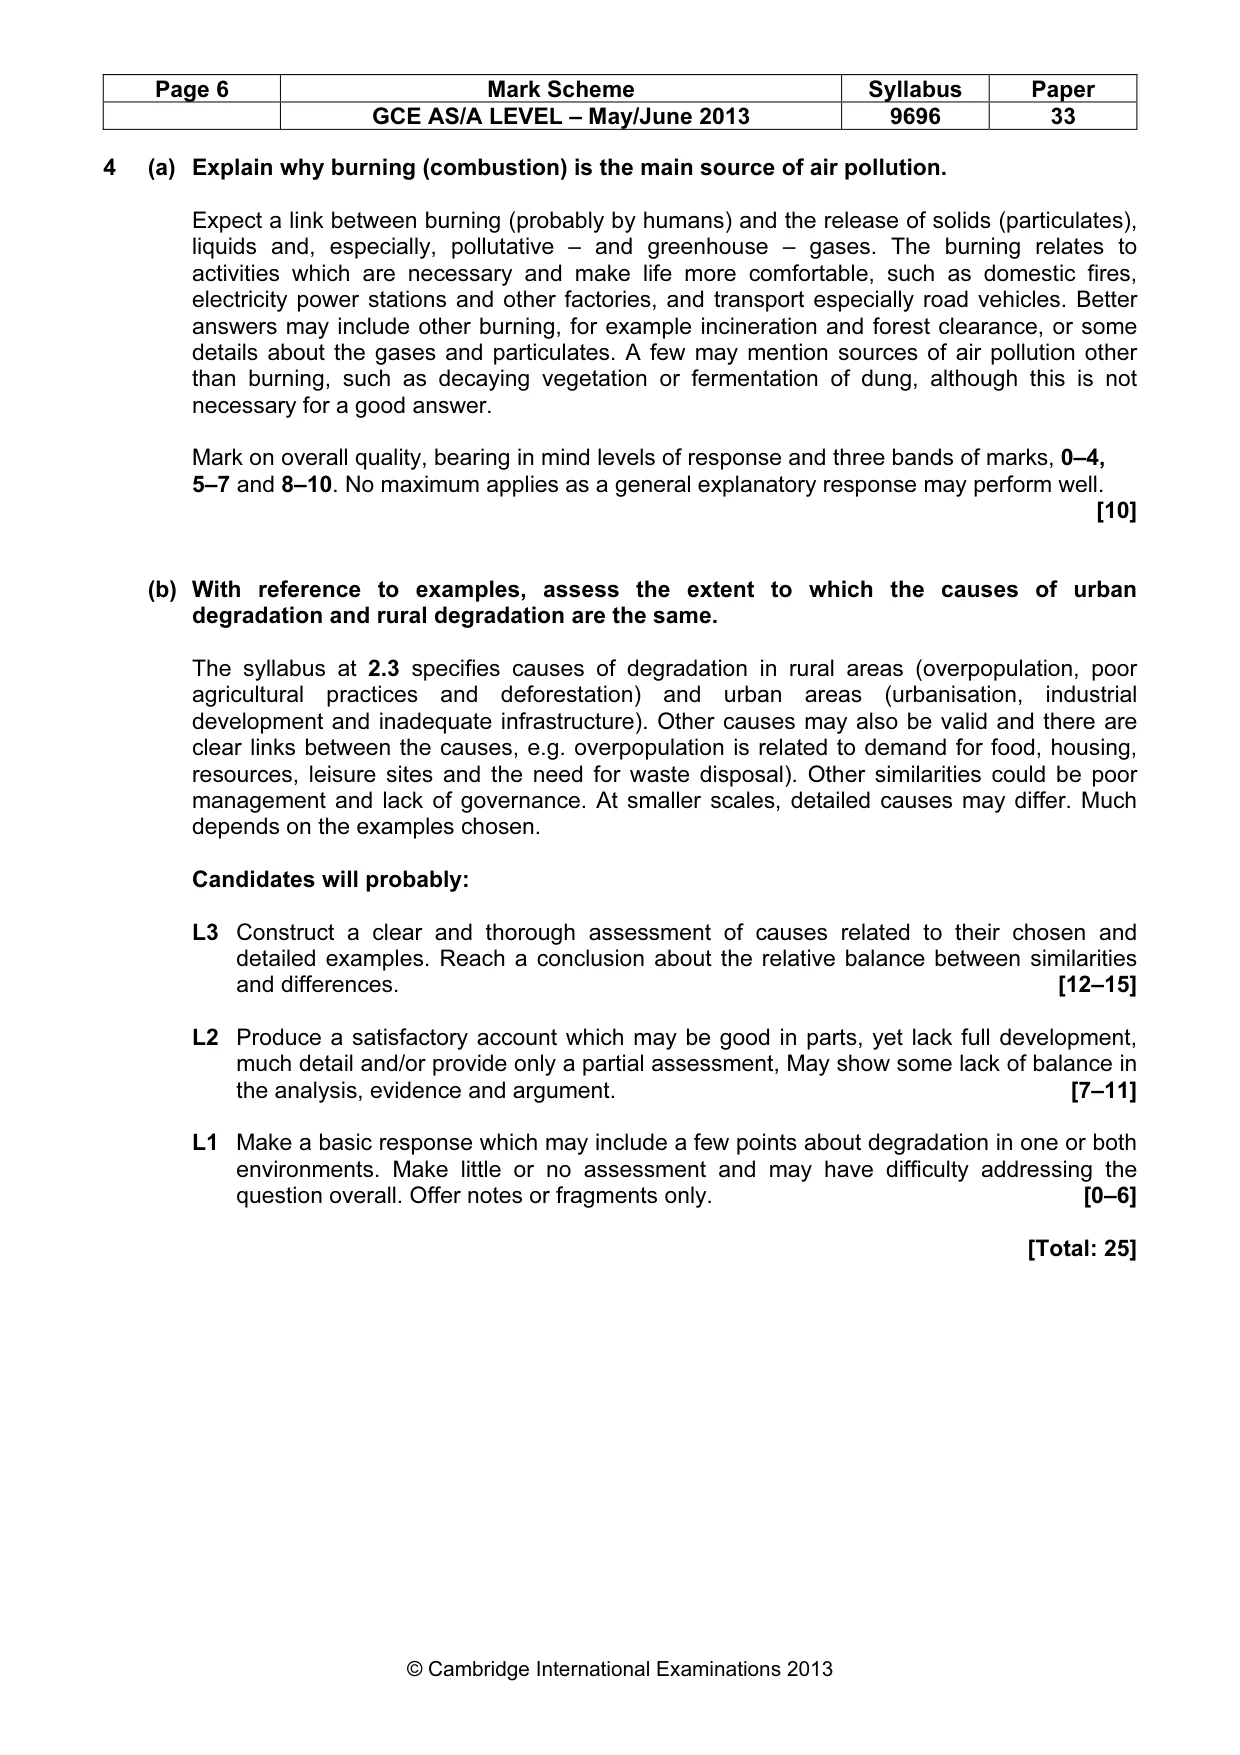
Page 6 Mark Scheme Syllabus Paper GCE AS/A LEVEL – May/June 2013 9696 33 © Cambridge International Examinations 2013 4 (a) Explain why burning (combustion) is the main source of air pollution. Expect a link between burning (probably by humans) and the release of solids (particulates), liquids and, especially, pollutative – and greenhouse – gases. The burning relates to activities which are necessary and make life more comfortable, such as domestic fires, electricity power stations and other factories, and transport especially road vehicles. Better answers may include other burning, for example incineration and forest clearance, or some details about the gases and particulates. A few may mention sources of air pollution other than burning, such as decaying vegetation or fermentation of dung, although this is not necessary for a good answer. Mark on overall quality, bearing in mind levels of response and three bands of marks, 0–4, 5–7 and 8–10. No maximum applies as a general explanatory response may perform well. [10] (b) With reference to examples, assess the extent to which the causes of urban degradation and rural degradation are the same. The syllabus at 2.3 specifies causes of degradation in rural areas (overpopulation, poor agricultural practices and deforestation) and urban areas (urbanisation, industrial development and inadequate infrastructure). Other causes may also be valid and there are clear links between the causes, e.g. overpopulation is related to demand for food, housing, resources, leisure sites and the need for waste disposal). Other similarities could be poor management and lack of governance. At smaller scales, detailed causes may differ. Much depends on the examples chosen. Candidates will probably: L3 Construct a clear and thorough assessment of causes related to their chosen and detailed examples. Reach a conclusion about the relative balance between similarities and differences. [12–15] L2 Produce a satisfactory account which may be good in parts, yet lack full development, much detail and/or provide only a partial assessment, May show some lack of balance in the analysis, evidence and argument. [7–11] L1 Make a basic response which may include a few points about degradation in one or both environments. Make little or no assessment and may have difficulty addressing the question overall. Offer notes or fragments only. [0–6] [Total: 25]
Mark scheme, page 7
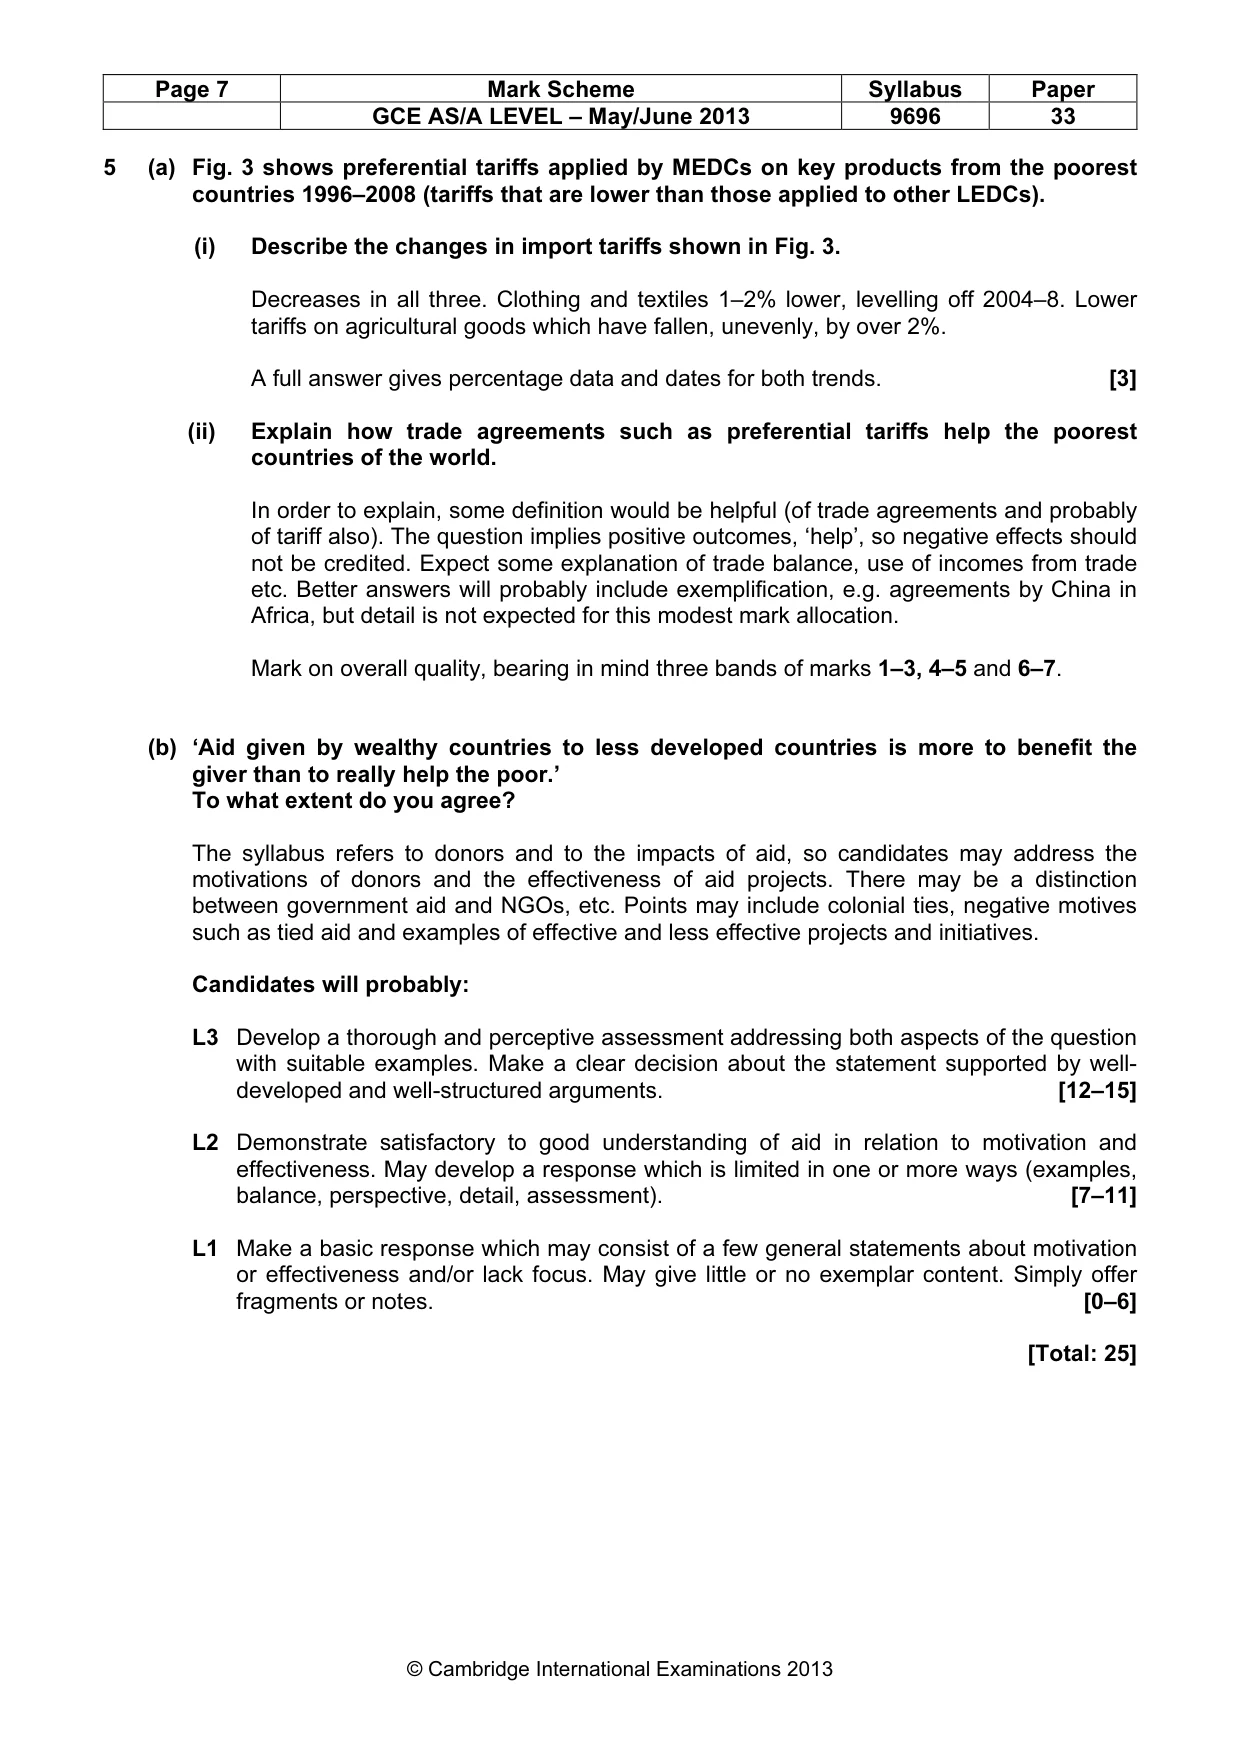
Page 7 Mark Scheme Syllabus Paper GCE AS/A LEVEL – May/June 2013 9696 33 © Cambridge International Examinations 2013 5 (a) Fig. 3 shows preferential tariffs applied by MEDCs on key products from the poorest countries 1996–2008 (tariffs that are lower than those applied to other LEDCs). (i) Describe the changes in import tariffs shown in Fig. 3. Decreases in all three. Clothing and textiles 1–2% lower, levelling off 2004–8. Lower tariffs on agricultural goods which have fallen, unevenly, by over 2%. A full answer gives percentage data and dates for both trends. [3] (ii) Explain how trade agreements such as preferential tariffs help the poorest countries of the world. In order to explain, some definition would be helpful (of trade agreements and probably of tariff also). The question implies positive outcomes, ‘help’, so negative effects should not be credited. Expect some explanation of trade balance, use of incomes from trade etc. Better answers will probably include exemplification, e.g. agreements by China in Africa, but detail is not expected for this modest mark allocation. Mark on overall quality, bearing in mind three bands of marks 1–3, 4–5 and 6–7. (b) ‘Aid given by wealthy countries to less developed countries is more to benefit the giver than to really help the poor.’ To what extent do you agree? The syllabus refers to donors and to the impacts of aid, so candidates may address the motivations of donors and the effectiveness of aid projects. There may be a distinction between government aid and NGOs, etc. Points may include colonial ties, negative motives such as tied aid and examples of effective and less effective projects and initiatives. Candidates will probably: L3 Develop a thorough and perceptive assessment addressing both aspects of the question with suitable examples. Make a clear decision about the statement supported by well- developed and well-structured arguments. [12–15] L2 Demonstrate satisfactory to good understanding of aid in relation to motivation and effectiveness. May develop a response which is limited in one or more ways (examples, balance, perspective, detail, assessment). [7–11] L1 Make a basic response which may consist of a few general statements about motivation or effectiveness and/or lack focus. May give little or no exemplar content. Simply offer fragments or notes. [0–6] [Total: 25]
Mark scheme, page 8
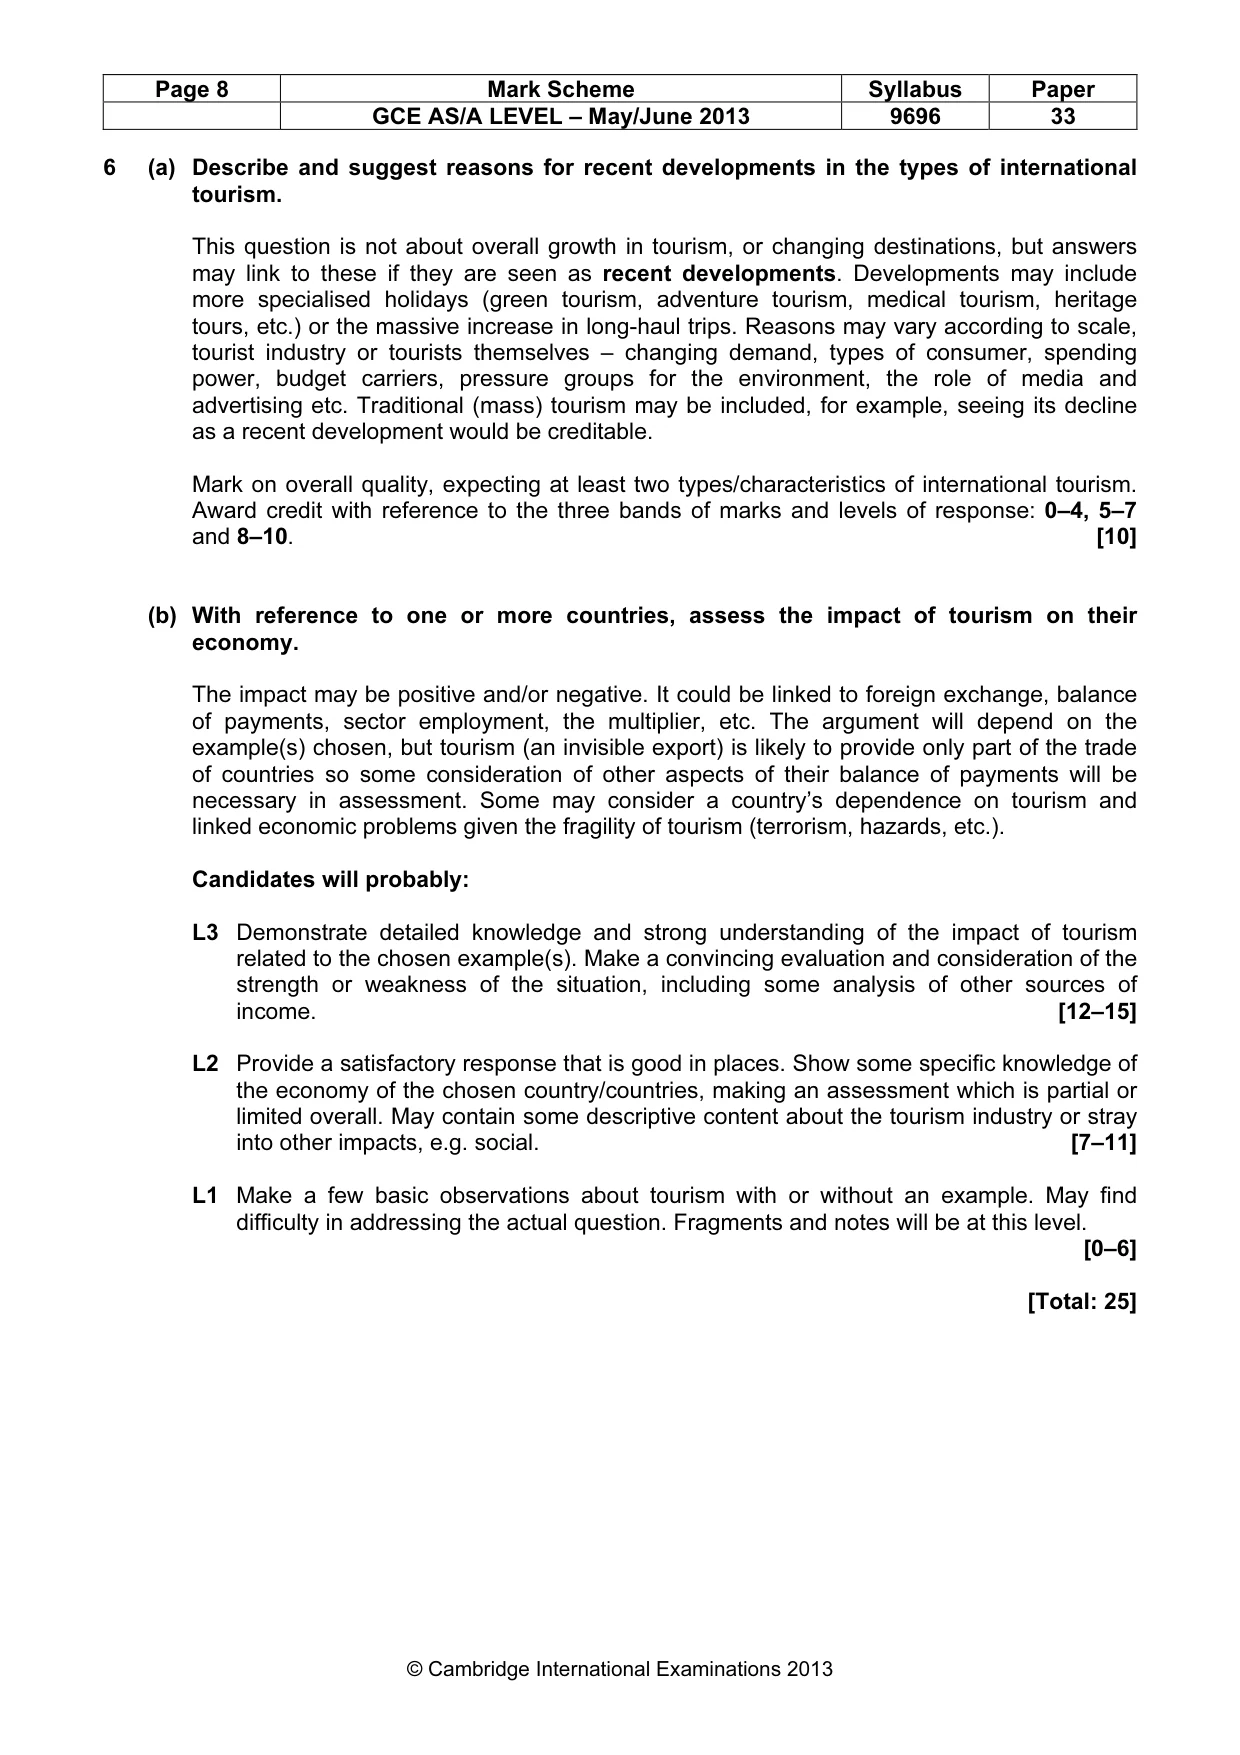
Page 8 Mark Scheme Syllabus Paper GCE AS/A LEVEL – May/June 2013 9696 33 © Cambridge International Examinations 2013 6 (a) Describe and suggest reasons for recent developments in the types of international tourism. This question is not about overall growth in tourism, or changing destinations, but answers may link to these if they are seen as recent developments. Developments may include more specialised holidays (green tourism, adventure tourism, medical tourism, heritage tours, etc.) or the massive increase in long-haul trips. Reasons may vary according to scale, tourist industry or tourists themselves – changing demand, types of consumer, spending power, budget carriers, pressure groups for the environment, the role of media and advertising etc. Traditional (mass) tourism may be included, for example, seeing its decline as a recent development would be creditable. Mark on overall quality, expecting at least two types/characteristics of international tourism. Award credit with reference to the three bands of marks and levels of response: 0–4, 5–7 and 8–10. [10] (b) With reference to one or more countries, assess the impact of tourism on their economy. The impact may be positive and/or negative. It could be linked to foreign exchange, balance of payments, sector employment, the multiplier, etc. The argument will depend on the example(s) chosen, but tourism (an invisible export) is likely to provide only part of the trade of countries so some consideration of other aspects of their balance of payments will be necessary in assessment. Some may consider a country’s dependence on tourism and linked economic problems given the fragility of tourism (terrorism, hazards, etc.). Candidates will probably: L3 Demonstrate detailed knowledge and strong understanding of the impact of tourism related to the chosen example(s). Make a convincing evaluation and consideration of the strength or weakness of the situation, including some analysis of other sources of income. [12–15] L2 Provide a satisfactory response that is good in places. Show some specific knowledge of the economy of the chosen country/countries, making an assessment which is partial or limited overall. May contain some descriptive content about the tourism industry or stray into other impacts, e.g. social. [7–11] L1 Make a few basic observations about tourism with or without an example. May find difficulty in addressing the actual question. Fragments and notes will be at this level. [0–6] [Total: 25]
Mark scheme, page 9
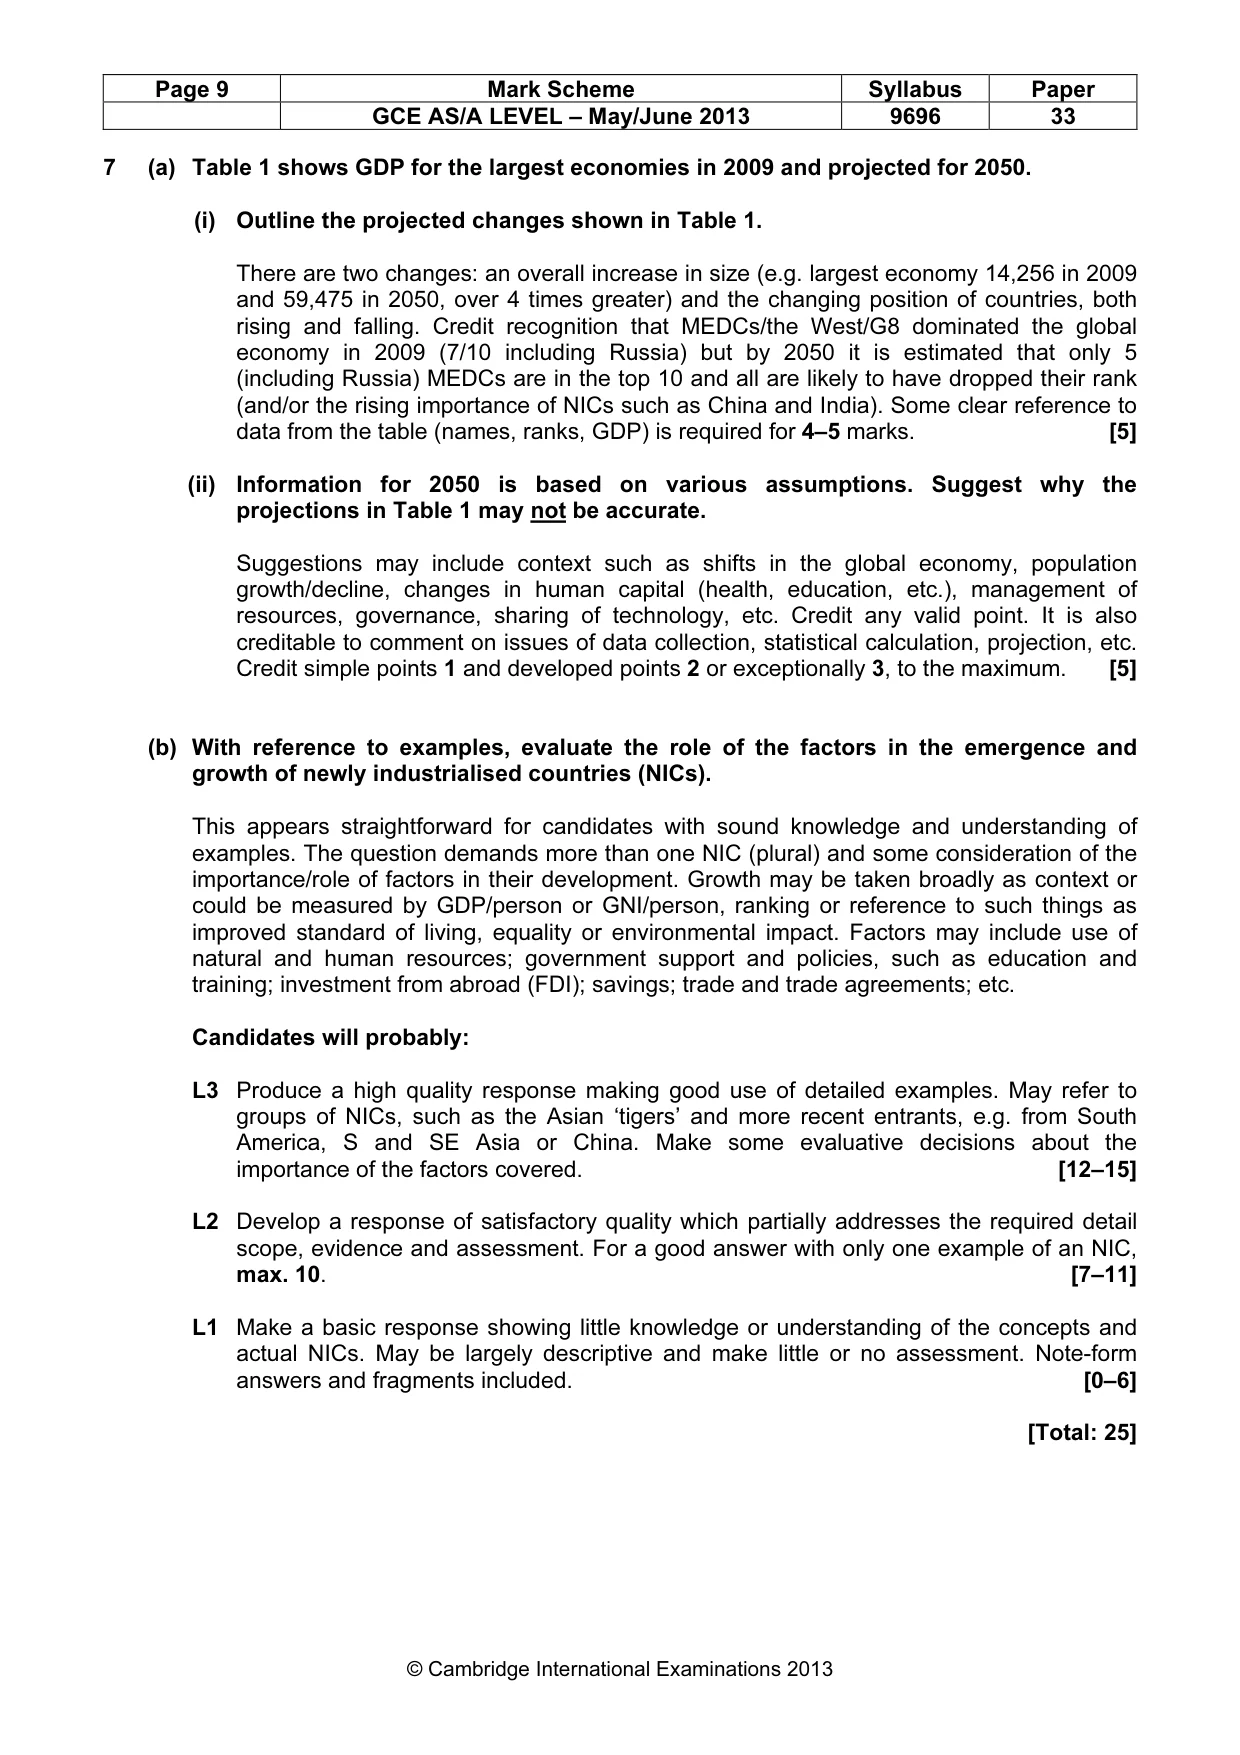
Page 9 Mark Scheme Syllabus Paper GCE AS/A LEVEL – May/June 2013 9696 33 © Cambridge International Examinations 2013 7 (a) Table 1 shows GDP for the largest economies in 2009 and projected for 2050. (i) Outline the projected changes shown in Table 1. There are two changes: an overall increase in size (e.g. largest economy 14,256 in 2009 and 59,475 in 2050, over 4 times greater) and the changing position of countries, both rising and falling. Credit recognition that MEDCs/the West/G8 dominated the global economy in 2009 (7/10 including Russia) but by 2050 it is estimated that only 5 (including Russia) MEDCs are in the top 10 and all are likely to have dropped their rank (and/or the rising importance of NICs such as China and India). Some clear reference to data from the table (names, ranks, GDP) is required for 4–5 marks. [5] (ii) Information for 2050 is based on various assumptions. Suggest why the projections in Table 1 may not be accurate. Suggestions may include context such as shifts in the global economy, population growth/decline, changes in human capital (health, education, etc.), management of resources, governance, sharing of technology, etc. Credit any valid point. It is also creditable to comment on issues of data collection, statistical calculation, projection, etc. Credit simple points 1 and developed points 2 or exceptionally 3, to the maximum. [5] (b) With reference to examples, evaluate the role of the factors in the emergence and growth of newly industrialised countries (NICs). This appears straightforward for candidates with sound knowledge and understanding of examples. The question demands more than one NIC (plural) and some consideration of the importance/role of factors in their development. Growth may be taken broadly as context or could be measured by GDP/person or GNI/person, ranking or reference to such things as improved standard of living, equality or environmental impact. Factors may include use of natural and human resources; government support and policies, such as education and training; investment from abroad (FDI); savings; trade and trade agreements; etc. Candidates will probably: L3 Produce a high quality response making good use of detailed examples. May refer to groups of NICs, such as the Asian ‘tigers’ and more recent entrants, e.g. from South America, S and SE Asia or China. Make some evaluative decisions about the importance of the factors covered. [12–15] L2 Develop a response of satisfactory quality which partially addresses the required detail scope, evidence and assessment. For a good answer with only one example of an NIC, max. 10. [7–11] L1 Make a basic response showing little knowledge or understanding of the concepts and actual NICs. May be largely descriptive and make little or no assessment. Note-form answers and fragments included. [0–6] [Total: 25]
Mark scheme, page 10
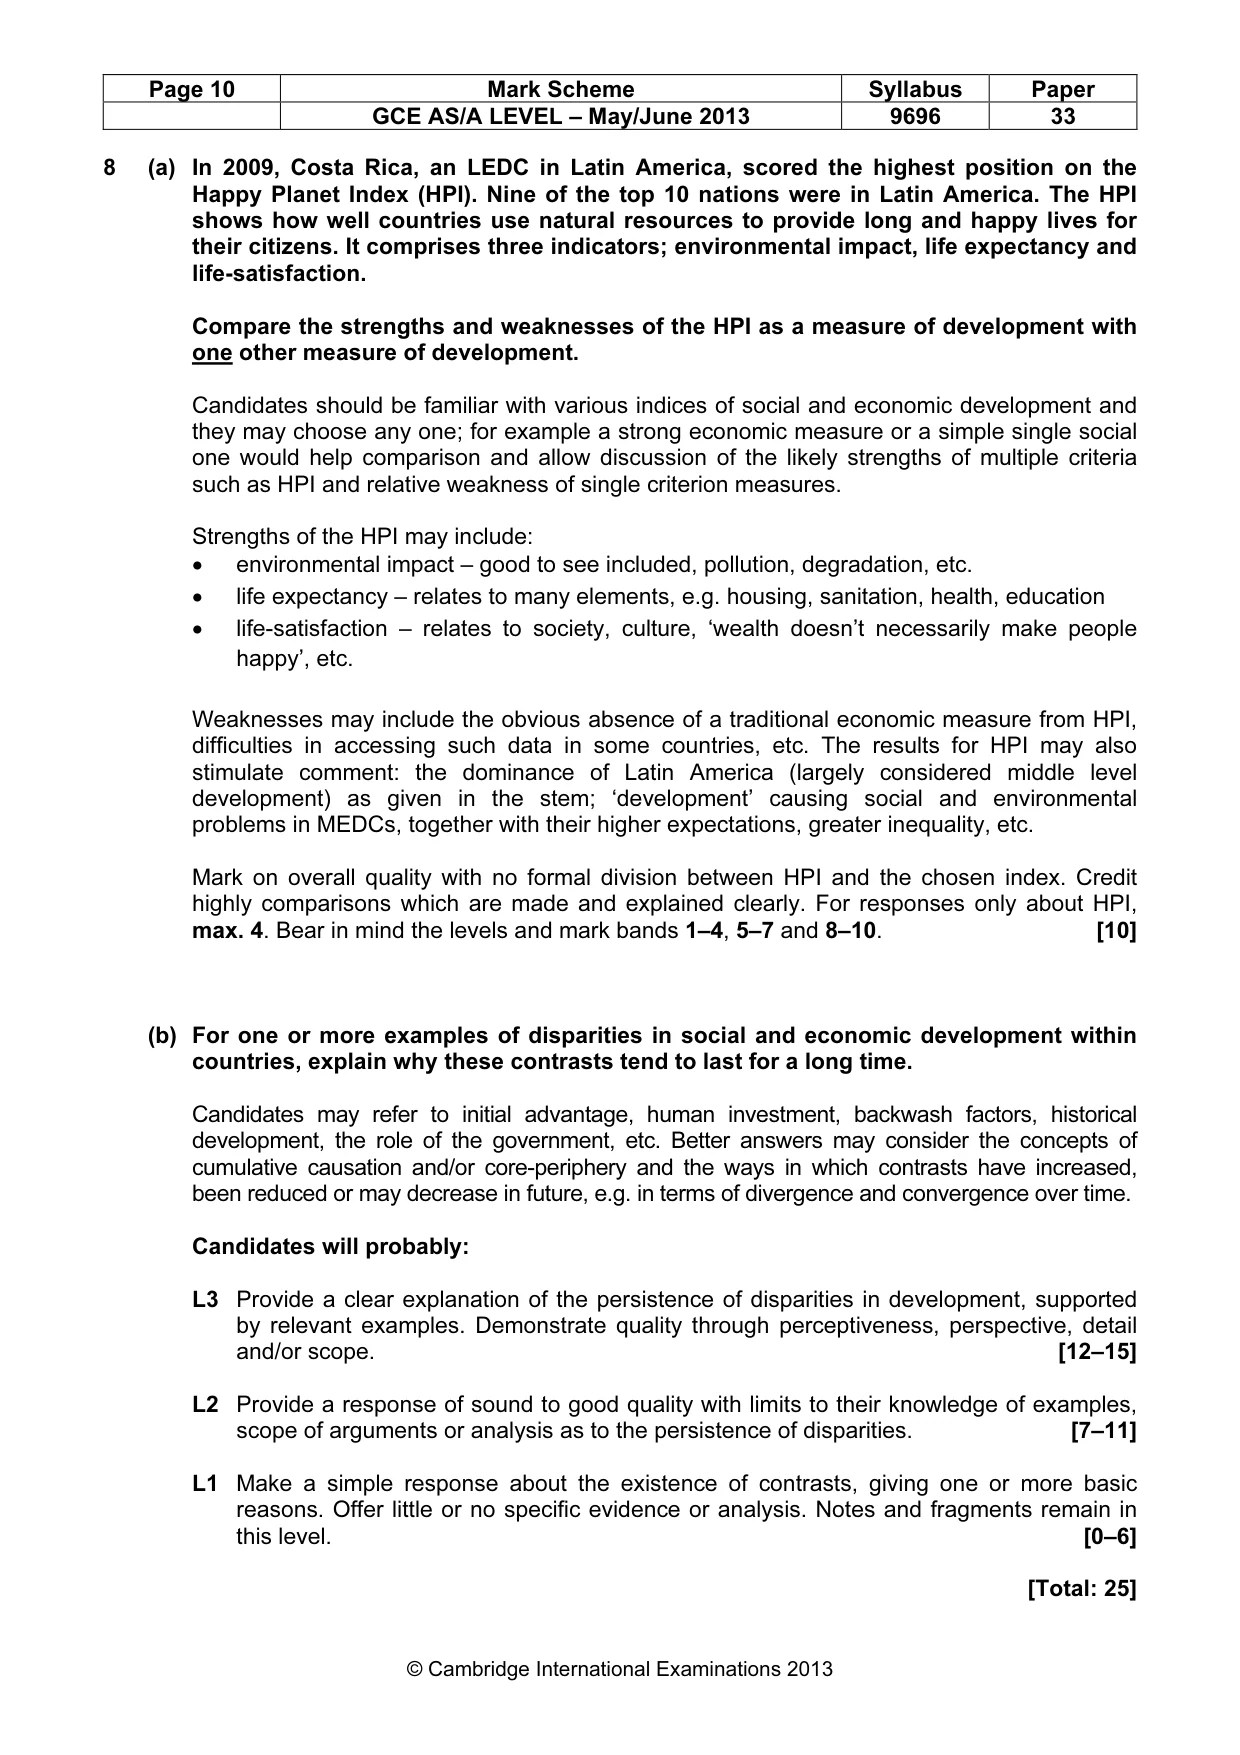
Page 10 Mark Scheme Syllabus Paper GCE AS/A LEVEL – May/June 2013 9696 33 © Cambridge International Examinations 2013 8 (a) In 2009, Costa Rica, an LEDC in Latin America, scored the highest position on the Happy Planet Index (HPI). Nine of the top 10 nations were in Latin America. The HPI shows how well countries use natural resources to provide long and happy lives for their citizens. It comprises three indicators; environmental impact, life expectancy and life-satisfaction. Compare the strengths and weaknesses of the HPI as a measure of development with one other measure of development. Candidates should be familiar with various indices of social and economic development and they may choose any one; for example a strong economic measure or a simple single social one would help comparison and allow discussion of the likely strengths of multiple criteria such as HPI and relative weakness of single criterion measures. Strengths of the HPI may include: • environmental impact – good to see included, pollution, degradation, etc. • life expectancy – relates to many elements, e.g. housing, sanitation, health, education • life-satisfaction – relates to society, culture, ‘wealth doesn’t necessarily make people happy’, etc. Weaknesses may include the obvious absence of a traditional economic measure from HPI, difficulties in accessing such data in some countries, etc. The results for HPI may also stimulate comment: the dominance of Latin America (largely considered middle level development) as given in the stem; ‘development’ causing social and environmental problems in MEDCs, together with their higher expectations, greater inequality, etc. Mark on overall quality with no formal division between HPI and the chosen index. Credit highly comparisons which are made and explained clearly. For responses only about HPI, max. 4. Bear in mind the levels and mark bands 1–4, 5–7 and 8–10. [10] (b) For one or more examples of disparities in social and economic development within countries, explain why these contrasts tend to last for a long time. Candidates may refer to initial advantage, human investment, backwash factors, historical development, the role of the government, etc. Better answers may consider the concepts of cumulative causation and/or core-periphery and the ways in which contrasts have increased, been reduced or may decrease in future, e.g. in terms of divergence and convergence over time. Candidates will probably: L3 Provide a clear explanation of the persistence of disparities in development, supported by relevant examples. Demonstrate quality through perceptiveness, perspective, detail and/or scope. [12–15] L2 Provide a response of sound to good quality with limits to their knowledge of examples, scope of arguments or analysis as to the persistence of disparities. [7–11] L1 Make a simple response about the existence of contrasts, giving one or more basic reasons. Offer little or no specific evidence or analysis. Notes and fragments remain in this level. [0–6] [Total: 25]
What you needed in this session
Cambridge’s own grade thresholds for 2013 May/June, Paper 3 · Variant 3. A higher threshold means an easier paper — the bar moves with how the cohort did.