Cambridge A Level Geography 9696 — 2012 May/June Paper 3 · Variant 3
9696/33/M/J/12 · 50 marks · ≈56 min
The question paper and its mark scheme, free to read here and free to download. This is Cambridge’s own paper, exactly as it was sat.
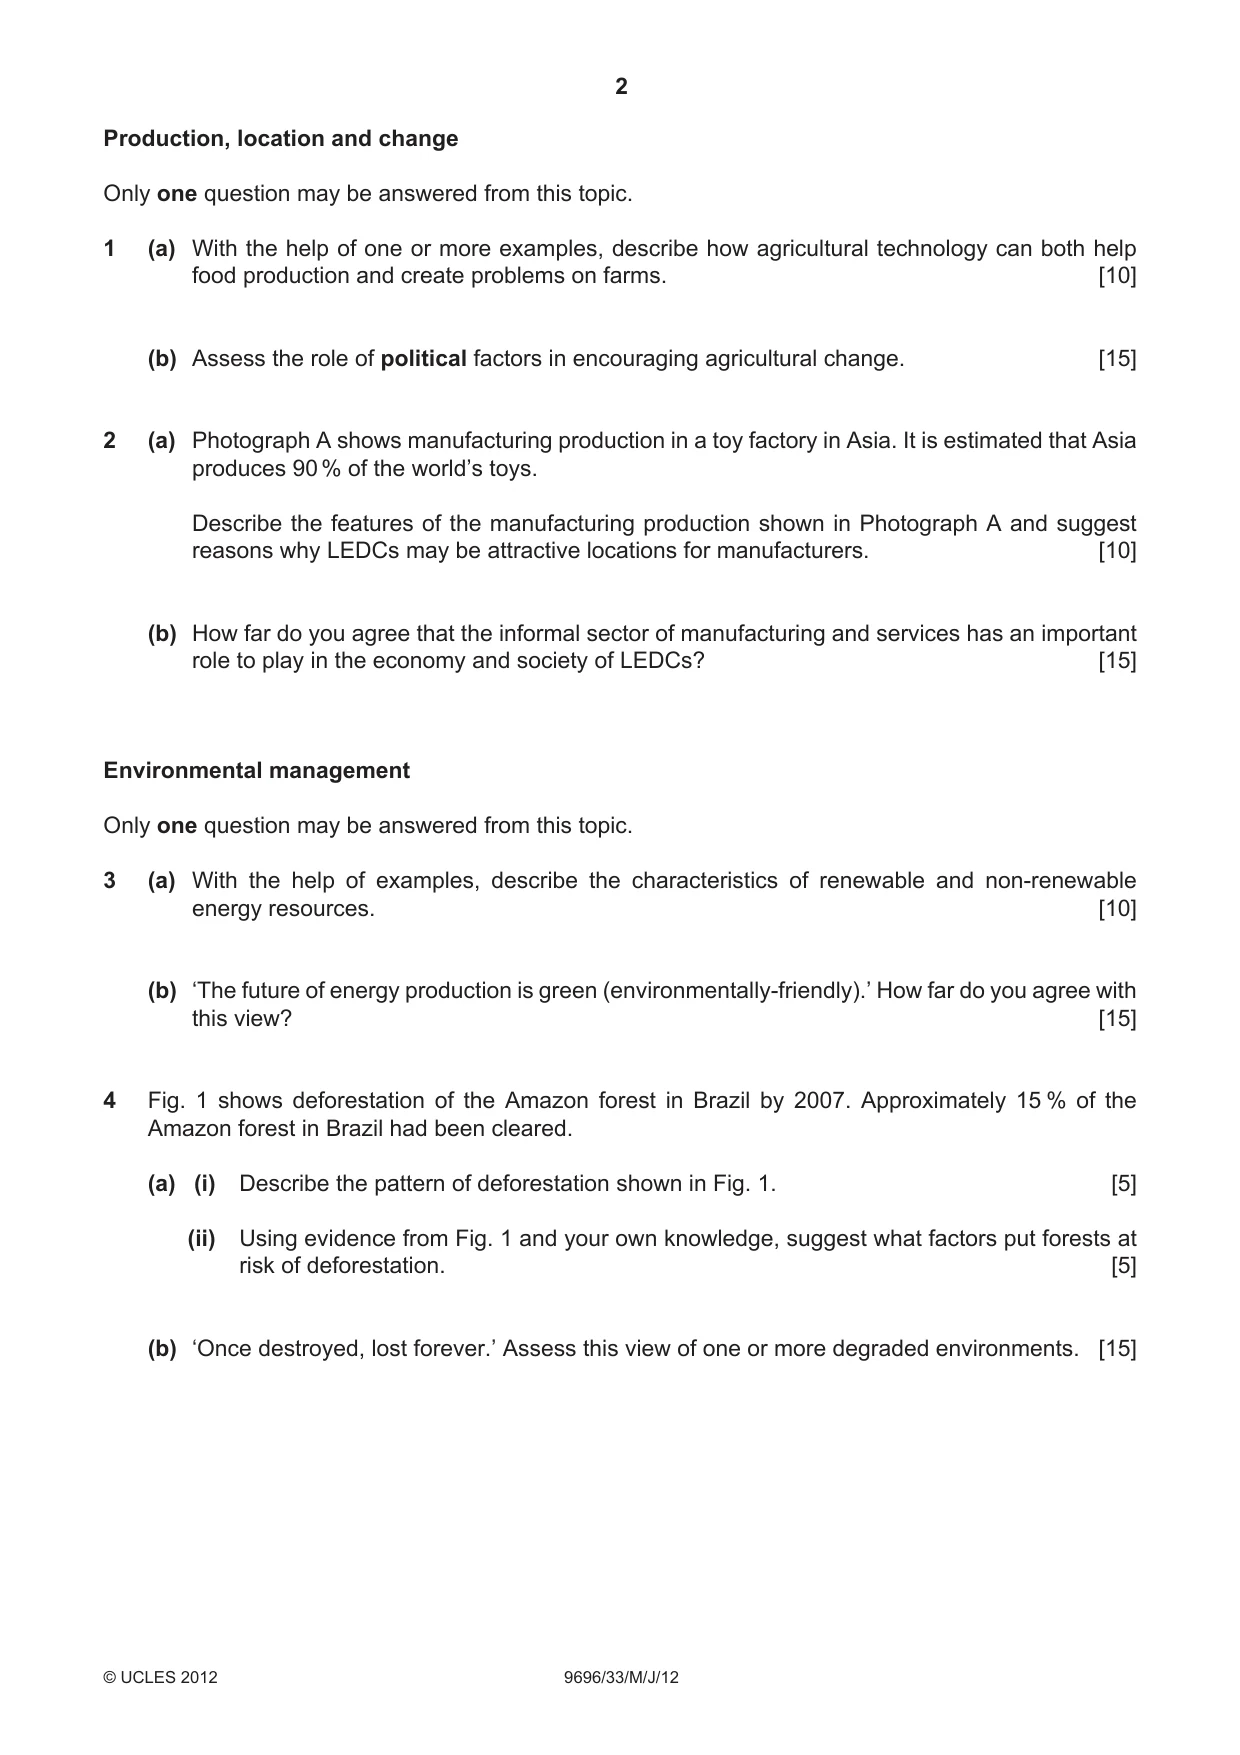
Question paper4 pages

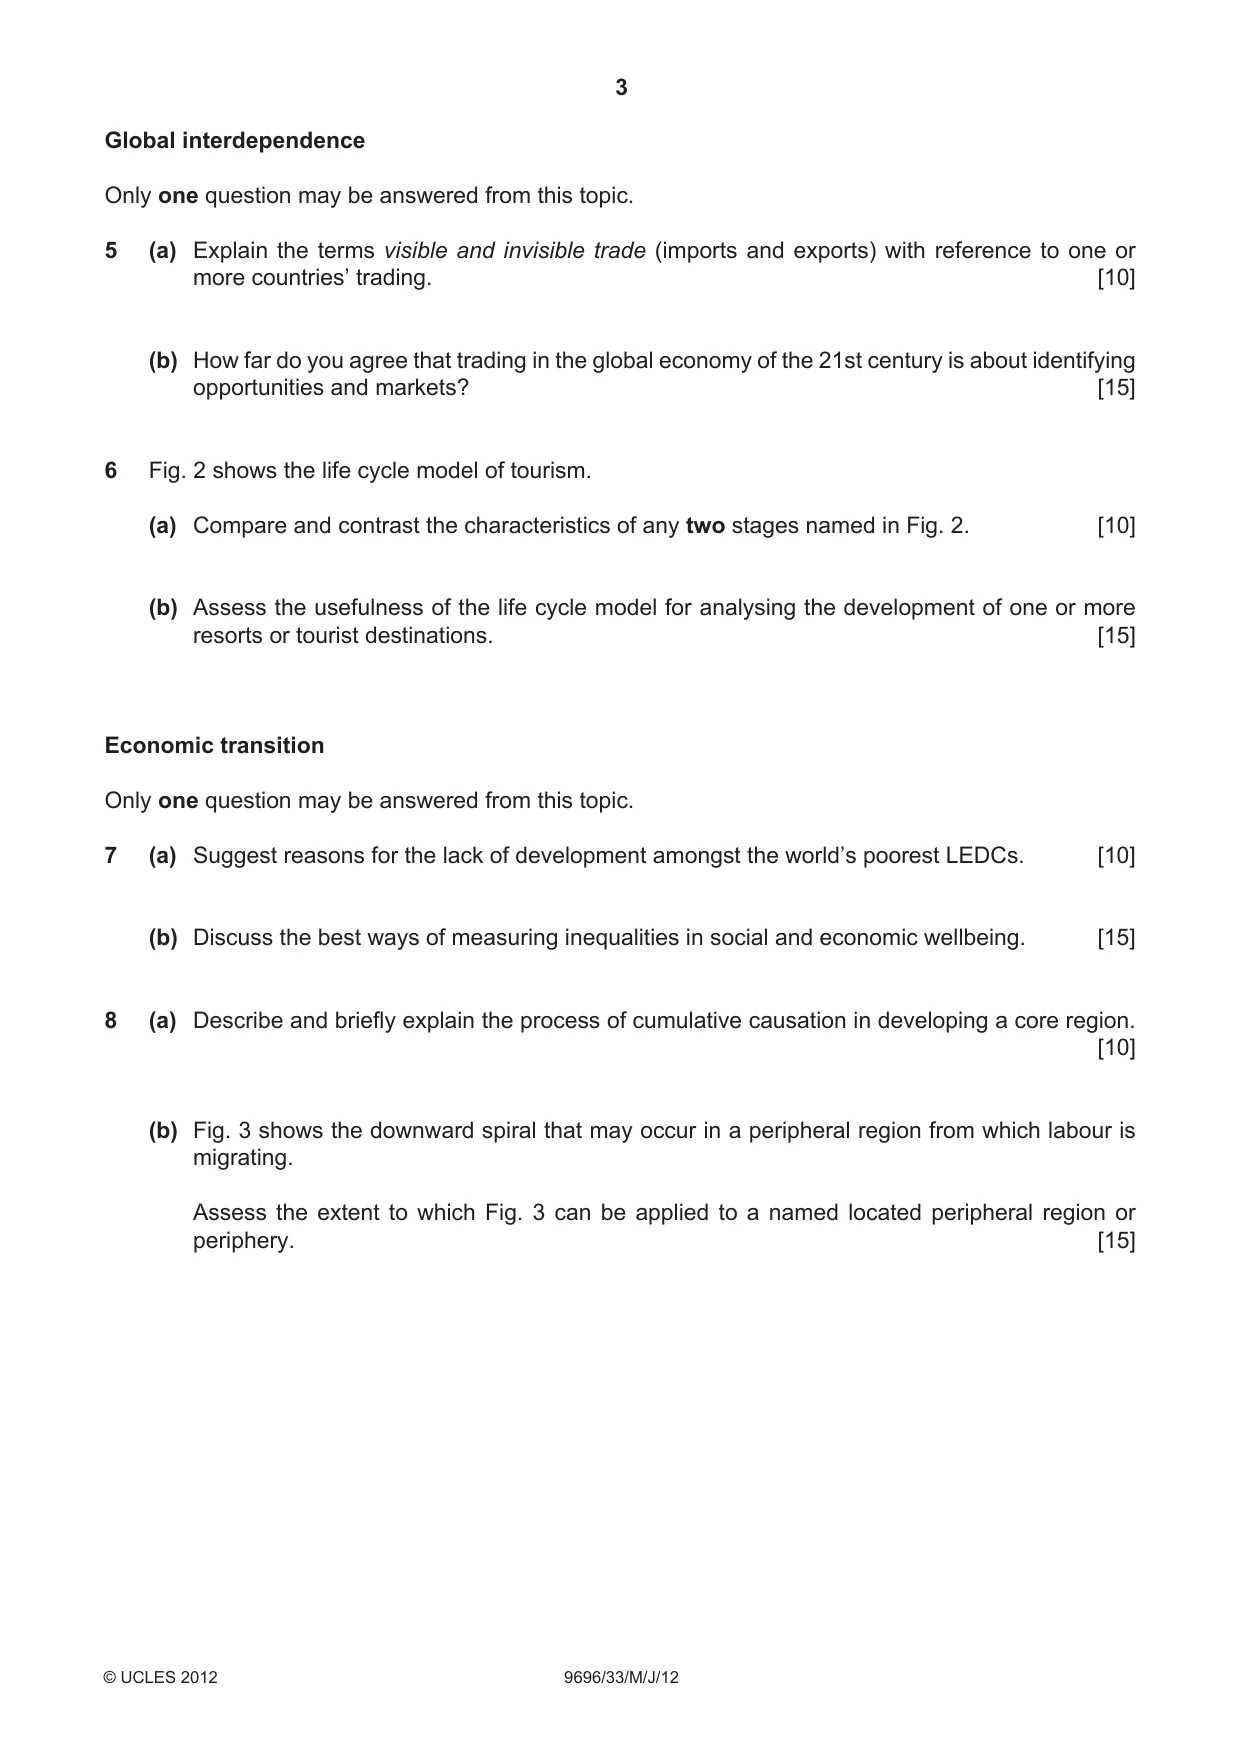

Mark scheme9 pages
Answers below. Sit the paper first if you are practising.

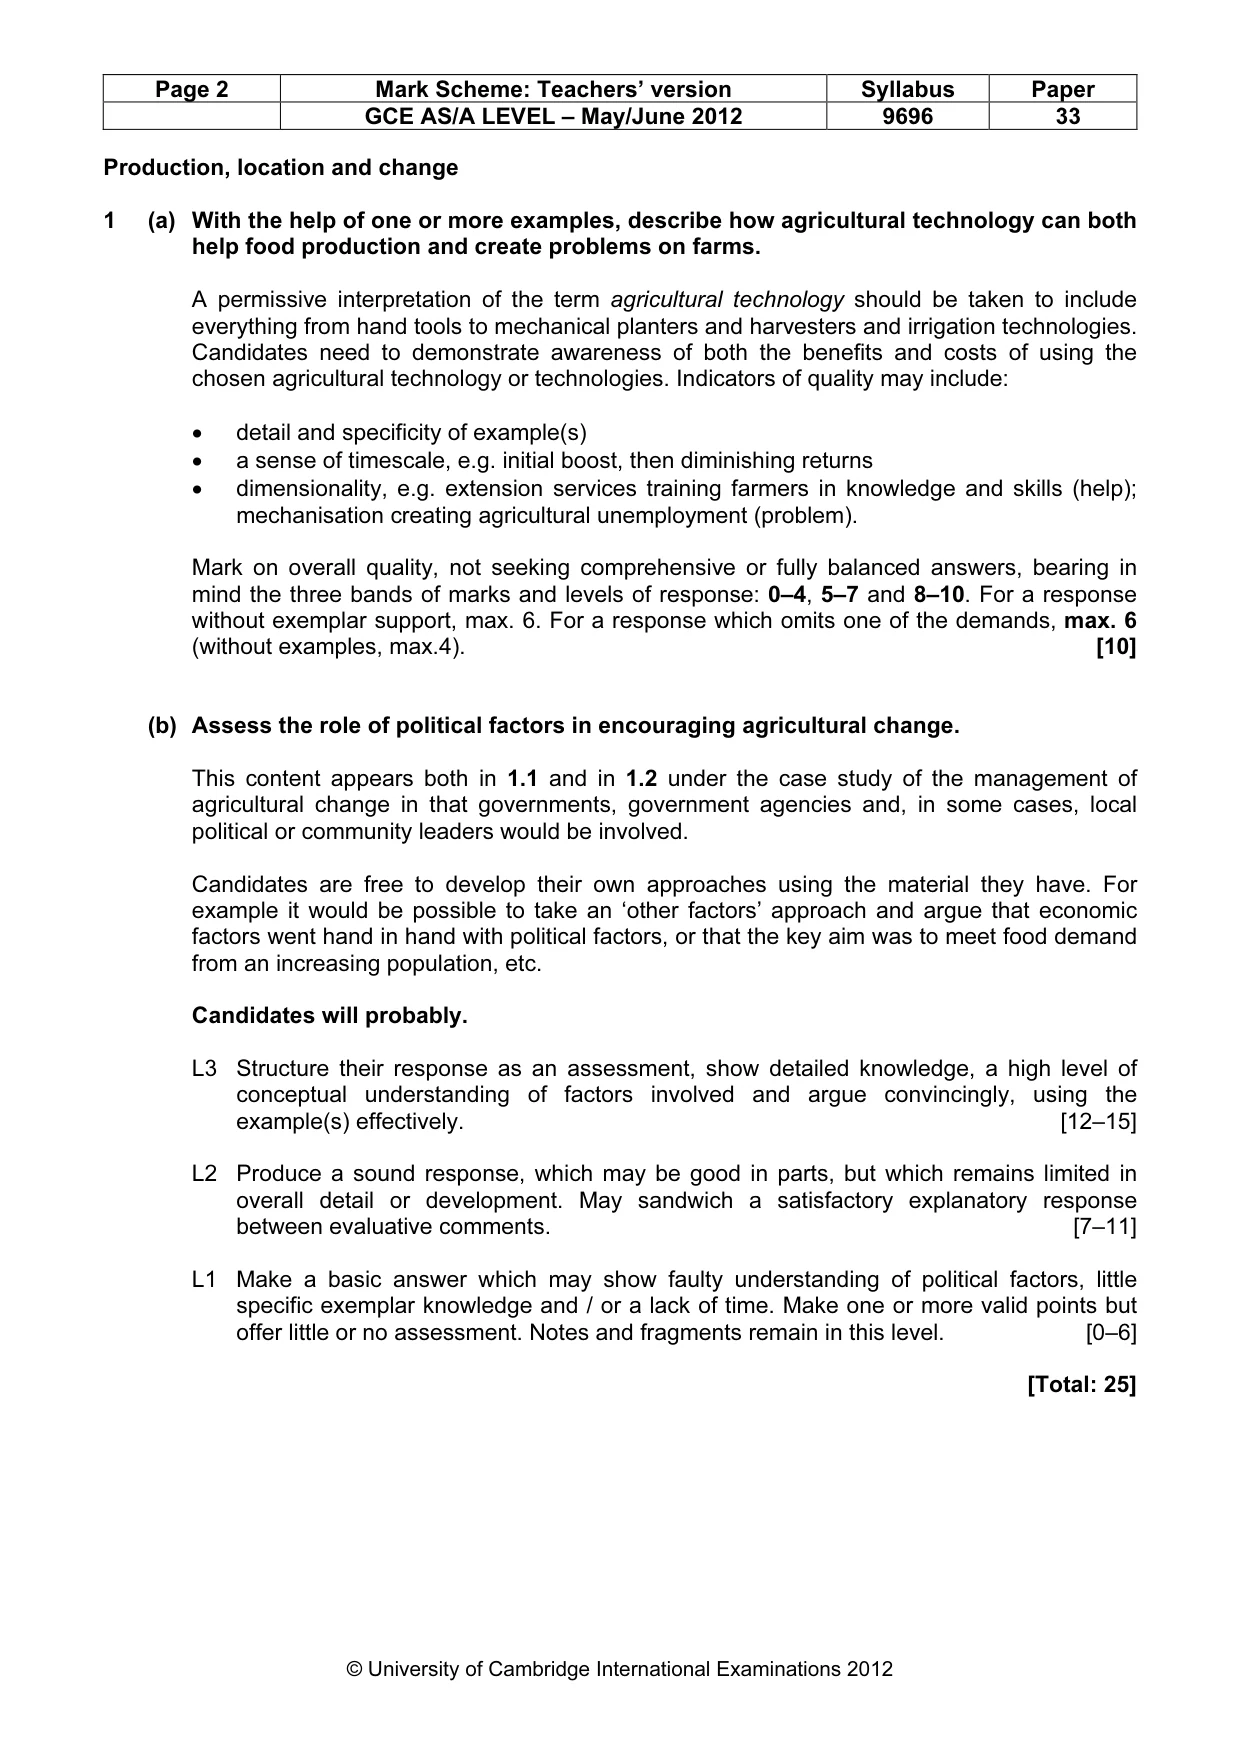

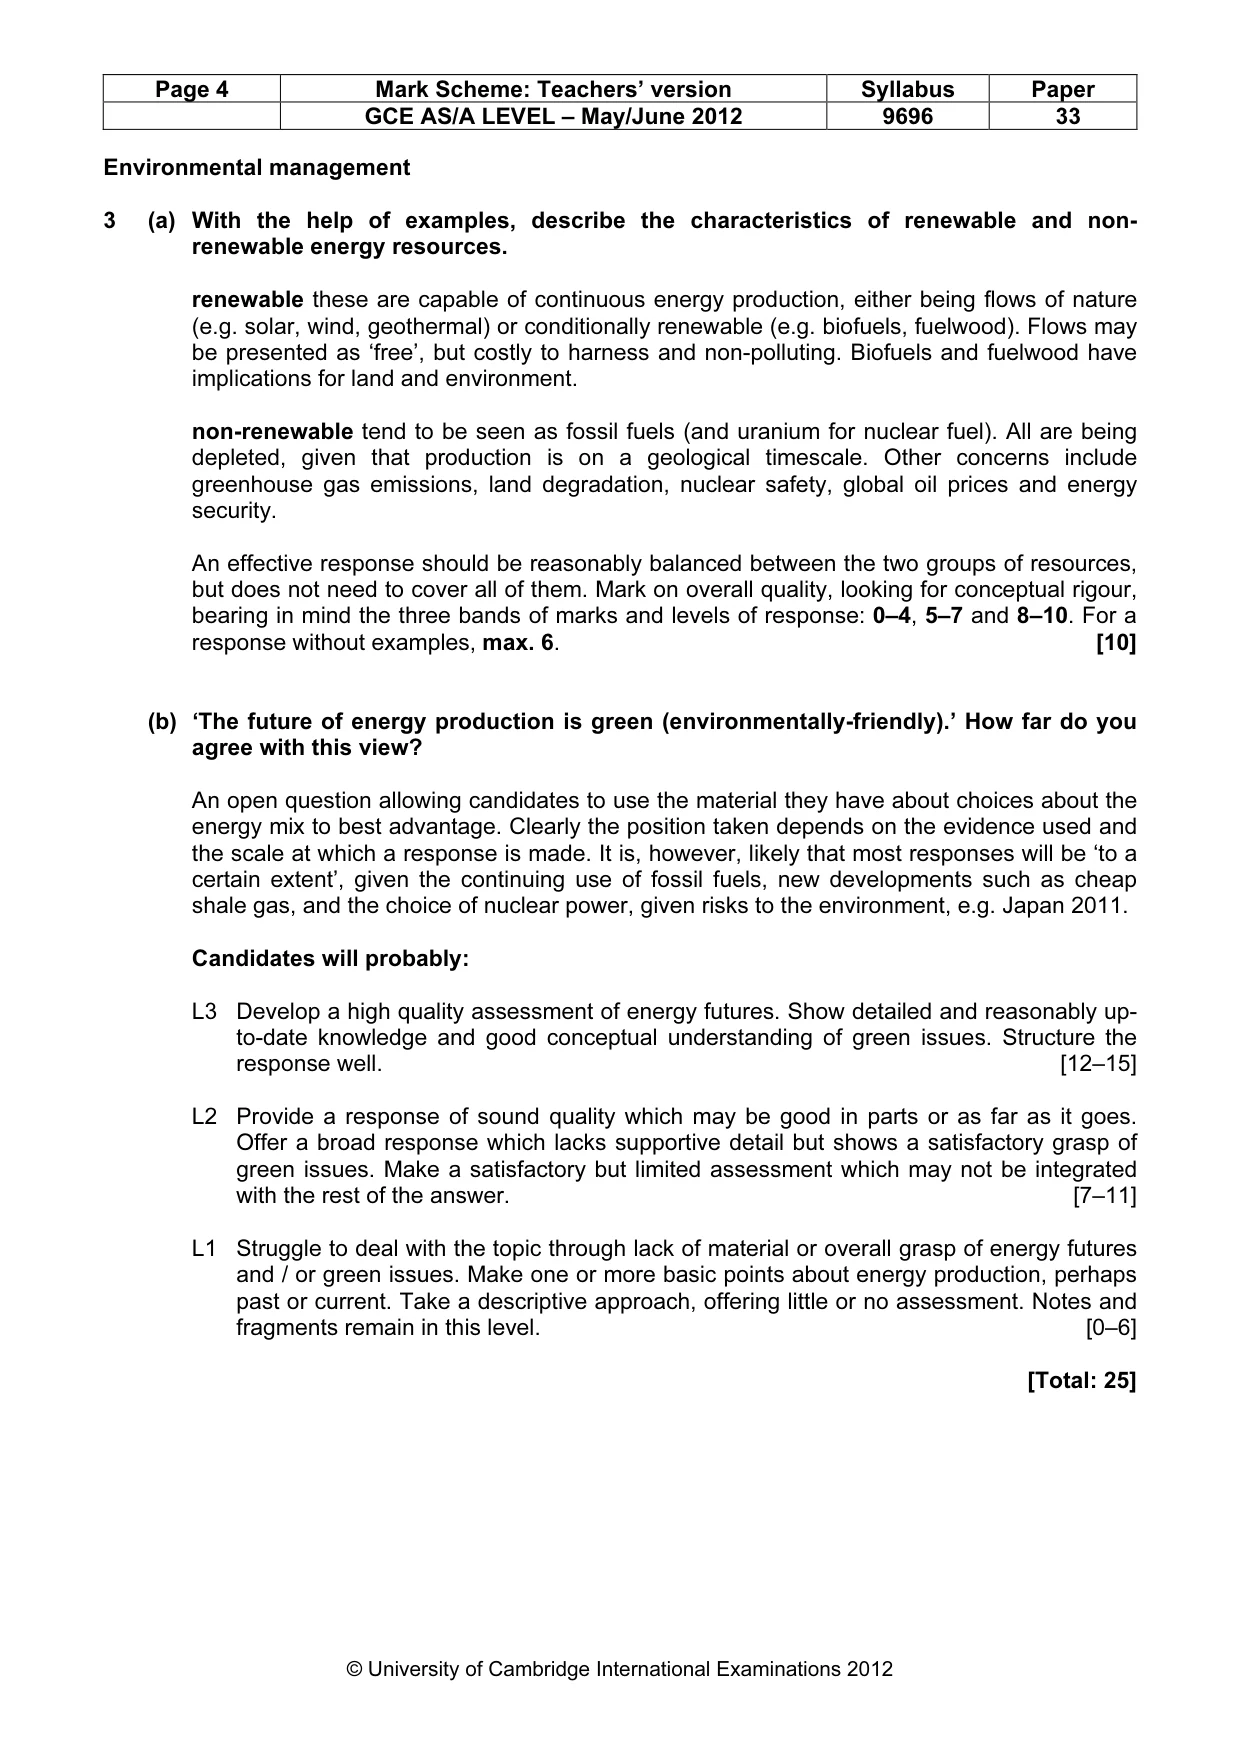
Paper as text
Question paper, page 1
READ THESE INSTRUCTIONS FIRST If you have been given an Answer Booklet, follow the instructions on the front cover of the Booklet. Write your Centre number, candidate number and name on all the work you hand in. Write in dark blue or black pen. You may use a soft pencil for any diagrams, graphs or rough working. Do not use staples, paper clips, highlighters, glue or correction fl uid. Answer two questions only. Each question answered must be from a different topic. Sketch maps and diagrams should be drawn whenever they serve to illustrate an answer. You should make reference to appropriate examples studied in the fi eld or the classroom, even where such examples are not specifi cally requested by the question. All the Figures and the Photograph referred to in the questions are contained in the Insert. At the end of the examination, fasten all your work securely together. The number of marks is given in brackets [ ] at the end of each question or part question. GEOGRAPHY 9696/33 Paper 3 Advanced Human Options May/June 2012 1 hour 30 minutes Additional Materials: Answer Booklet/Paper UNIVERSITY OF CAMBRIDGE INTERNATIONAL EXAMINATIONS General Certifi cate of Education Advanced Subsidiary Level and Advanced Level This document consists of 3 printed pages, 1 blank page and 1 Insert. [Turn over IB12 06_9696_33/FP © UCLES 2012 *7646728899*
Question paper, page 2
2 9696/33/M/J/12 © UCLES 2012 Production, location and change Only one question may be answered from this topic. 1 (a) With the help of one or more examples, describe how agricultural technology can both help food production and create problems on farms. [10] (b) Assess the role of political factors in encouraging agricultural change. [15] 2 (a) Photograph A shows manufacturing production in a toy factory in Asia. It is estimated that Asia produces 90 % of the world’s toys. Describe the features of the manufacturing production shown in Photograph A and suggest reasons why LEDCs may be attractive locations for manufacturers. [10] (b) How far do you agree that the informal sector of manufacturing and services has an important role to play in the economy and society of LEDCs? [15] Environmental management Only one question may be answered from this topic. 3 (a) With the help of examples, describe the characteristics of renewable and non-renewable energy resources. [10] (b) ‘The future of energy production is green (environmentally-friendly).’ How far do you agree with this view? [15] 4 Fig. 1 shows deforestation of the Amazon forest in Brazil by 2007. Approximately 15 % of the Amazon forest in Brazil had been cleared. (a) (i) Describe the pattern of deforestation shown in Fig. 1. [5] (ii) Using evidence from Fig. 1 and your own knowledge, suggest what factors put forests at risk of deforestation. [5] (b) ‘Once destroyed, lost forever.’ Assess this view of one or more degraded environments. [15]
Question paper, page 3
3 9696/33/M/J/12 © UCLES 2012 [Turn over Global interdependence Only one question may be answered from this topic. 5 (a) Explain the terms visible and invisible trade (imports and exports) with reference to one or more countries’ trading. [10] (b) How far do you agree that trading in the global economy of the 21st century is about identifying opportunities and markets? [15] 6 Fig. 2 shows the life cycle model of tourism. (a) Compare and contrast the characteristics of any two stages named in Fig. 2. [10] (b) Assess the usefulness of the life cycle model for analysing the development of one or more resorts or tourist destinations. [15] Economic transition Only one question may be answered from this topic. 7 (a) Suggest reasons for the lack of development amongst the world’s poorest LEDCs. [10] (b) Discuss the best ways of measuring inequalities in social and economic wellbeing. [15] 8 (a) Describe and briefly explain the process of cumulative causation in developing a core region. [10] (b) Fig. 3 shows the downward spiral that may occur in a peripheral region from which labour is migrating. Assess the extent to which Fig. 3 can be applied to a named located peripheral region or periphery. [15]
Question paper, page 4
4 Copyright Acknowledgements: Question 2 Photograph A © http://www.photomichaelwolf.com/the_real_toy_story/50.jpg. Question 4 Fig. 1 © ADAPTED: Reduction of Carbon Emissions Associated with Deforestation in Brazil: The Role of the Amazon Region Protected Areas Program (ARPA); http://www.wwf.org.uk/fi lelibrary/pdf/arpa_report.pdf. Permission to reproduce items where third-party owned material protected by copyright is included has been sought and cleared where possible. Every reasonable effort has been made by the publisher (UCLES) to trace copyright holders, but if any items requiring clearance have unwittingly been included, the publisher will be pleased to make amends at the earliest possible opportunity. University of Cambridge International Examinations is part of the Cambridge Assessment Group. Cambridge Assessment is the brand name of University of Cambridge Local Examinations Syndicate (UCLES), which is itself a department of the University of Cambridge. 9696/33/M/J/12 © UCLES 2012 BLANK PAGE
Mark scheme, page 1
UNIVERSITY OF CAMBRIDGE INTERNATIONAL EXAMINATIONS GCE Advanced Subsidiary Level and GCE Advanced Level MARK SCHEME for the May/June 2012 question paper for the guidance of teachers 9696 GEOGRAPHY 9696/33 Paper 3 (Advanced Human Options), maximum raw mark 50 This mark scheme is published as an aid to teachers and candidates, to indicate the requirements of the examination. It shows the basis on which Examiners were instructed to award marks. It does not indicate the details of the discussions that took place at an Examiners’ meeting before marking began, which would have considered the acceptability of alternative answers. Mark schemes must be read in conjunction with the question papers and the report on the examination. • Cambridge will not enter into discussions or correspondence in connection with these mark schemes. Cambridge is publishing the mark schemes for the May/June 2012 question papers for most IGCSE, GCE Advanced Level and Advanced Subsidiary Level syllabuses and some Ordinary Level syllabuses.
Mark scheme, page 2
Page 2 Mark Scheme: Teachers’ version Syllabus Paper GCE AS/A LEVEL – May/June 2012 9696 33 © University of Cambridge International Examinations 2012 Production, location and change 1 (a) With the help of one or more examples, describe how agricultural technology can both help food production and create problems on farms. A permissive interpretation of the term agricultural technology should be taken to include everything from hand tools to mechanical planters and harvesters and irrigation technologies. Candidates need to demonstrate awareness of both the benefits and costs of using the chosen agricultural technology or technologies. Indicators of quality may include: • detail and specificity of example(s) • a sense of timescale, e.g. initial boost, then diminishing returns • dimensionality, e.g. extension services training farmers in knowledge and skills (help); mechanisation creating agricultural unemployment (problem). Mark on overall quality, not seeking comprehensive or fully balanced answers, bearing in mind the three bands of marks and levels of response: 0–4, 5–7 and 8–10. For a response without exemplar support, max. 6. For a response which omits one of the demands, max. 6 (without examples, max.4). [10] (b) Assess the role of political factors in encouraging agricultural change. This content appears both in 1.1 and in 1.2 under the case study of the management of agricultural change in that governments, government agencies and, in some cases, local political or community leaders would be involved. Candidates are free to develop their own approaches using the material they have. For example it would be possible to take an ‘other factors’ approach and argue that economic factors went hand in hand with political factors, or that the key aim was to meet food demand from an increasing population, etc. Candidates will probably. L3 Structure their response as an assessment, show detailed knowledge, a high level of conceptual understanding of factors involved and argue convincingly, using the example(s) effectively. [12–15] L2 Produce a sound response, which may be good in parts, but which remains limited in overall detail or development. May sandwich a satisfactory explanatory response between evaluative comments. [7–11] L1 Make a basic answer which may show faulty understanding of political factors, little specific exemplar knowledge and / or a lack of time. Make one or more valid points but offer little or no assessment. Notes and fragments remain in this level. [0–6] [Total: 25]
Mark scheme, page 3
Page 3 Mark Scheme: Teachers’ version Syllabus Paper GCE AS/A LEVEL – May/June 2012 9696 33 © University of Cambridge International Examinations 2012 2 (a) Photograph A shows manufacturing production in a toy factory in Asia. It is estimated that Asia produces 90% of the world’s toys. Describe the features of the manufacturing production shown in Photograph A and suggest reasons why LEDCs may be attractive locations for manufacturers. Close reading of the photograph shows: assembly lines; large scale, high intensity; supervised; highly organised; manual labour requiring dexterity; repetitive tasks; largely female (?) labour force; clean conditions; overalls, caps and hairnets to avoid contamination; etc. No specific knowledge of Asia is expected, but candidates should draw on their knowledge and understanding of location decision-making and of LEDC contexts to give reasons such as low cost production, profitability, incentives, EPZs, access to world markets, efficiency, work ethic, non-unionisation of labour, weak environmental controls, etc. It is also valid to refer to the relative unattractiveness of locations in MEDCs (and NICs?), but beware giving ‘double credit’ for the same point expressed in the opposite way. Mark on overall quality, not seeking comprehensive or fully balanced answers, bearing in mind the three bands of marks and levels of response: 0–4, 5–7 and 8–10. For only one of the two elements (describe / suggest reasons), max.6. [10] (b) How far do you agree that the informal sector of manufacturing and services has an important role to play in the economy and society of LEDCs? Some responses will argue ‘to a large extent’ given the percentages employed, functions fulfilled and government investment, e.g. in Zambia, Kenya (jua kali). Responses on the scale and significance of the formal sector may differ. Better responses should do justice to both economy and society, e.g. as the informal sector affects the lives of producers / consumers, living standard, diet, education. Candidates will probably: L3 Use detailed knowledge of the informal sector as the foundation for a perceptive and well-structured assessment of its role in both the economy and the society of LEDCs. [12–15] L2 Show reasonable to good knowledge and understanding of the informal sector, but make an assessment which is partial or limited overall, perhaps with a ‘tacked on’ quality after a narrative approach. May be quite narrow, with little or no reference to society. For a response about one LEDC only, max. 10. [7–11] L1 Find it difficult to make more than descriptive comments about the informal sector. Produce a response of basic quality which may remain general or broadly located. Offer little or no assessment or a ‘safe’ and unsupported response. Notes and fragments remain in this level. [0–6] [Total: 25]
Mark scheme, page 4
Page 4 Mark Scheme: Teachers’ version Syllabus Paper GCE AS/A LEVEL – May/June 2012 9696 33 © University of Cambridge International Examinations 2012 Environmental management 3 (a) With the help of examples, describe the characteristics of renewable and non- renewable energy resources. renewable these are capable of continuous energy production, either being flows of nature (e.g. solar, wind, geothermal) or conditionally renewable (e.g. biofuels, fuelwood). Flows may be presented as ‘free’, but costly to harness and non-polluting. Biofuels and fuelwood have implications for land and environment. non-renewable tend to be seen as fossil fuels (and uranium for nuclear fuel). All are being depleted, given that production is on a geological timescale. Other concerns include greenhouse gas emissions, land degradation, nuclear safety, global oil prices and energy security. An effective response should be reasonably balanced between the two groups of resources, but does not need to cover all of them. Mark on overall quality, looking for conceptual rigour, bearing in mind the three bands of marks and levels of response: 0–4, 5–7 and 8–10. For a response without examples, max. 6. [10] (b) ‘The future of energy production is green (environmentally-friendly).’ How far do you agree with this view? An open question allowing candidates to use the material they have about choices about the energy mix to best advantage. Clearly the position taken depends on the evidence used and the scale at which a response is made. It is, however, likely that most responses will be ‘to a certain extent’, given the continuing use of fossil fuels, new developments such as cheap shale gas, and the choice of nuclear power, given risks to the environment, e.g. Japan 2011. Candidates will probably: L3 Develop a high quality assessment of energy futures. Show detailed and reasonably up- to-date knowledge and good conceptual understanding of green issues. Structure the response well. [12–15] L2 Provide a response of sound quality which may be good in parts or as far as it goes. Offer a broad response which lacks supportive detail but shows a satisfactory grasp of green issues. Make a satisfactory but limited assessment which may not be integrated with the rest of the answer. [7–11] L1 Struggle to deal with the topic through lack of material or overall grasp of energy futures and / or green issues. Make one or more basic points about energy production, perhaps past or current. Take a descriptive approach, offering little or no assessment. Notes and fragments remain in this level. [0–6] [Total: 25]
Mark scheme, page 5
Page 5 Mark Scheme: Teachers’ version Syllabus Paper GCE AS/A LEVEL – May/June 2012 9696 33 © University of Cambridge International Examinations 2012 4 (a) Fig. 1 shows deforestation of the Amazon forest in Brazil by 2007. Approximately 15% of the Amazon forest in Brazil had been cleared. (i) Describe the pattern of deforestation shown in Fig. 1. The main element is what ARPA (the programme to protect the forest) terms “the deforestation arc”, i.e. a curving area (yellow) on the eastern and southern margins of the Amazon, extending from NE Pará to the eastern edge of Acre in the west. It is both continuous (solid yellow) and discontinuous or patchy, interspersed with green. Other areas of deforestation are seen, notably S of Boa Vista, in coastal Amapá and in the interior around Santarem and Manaus; along roads, e.g. in Pará; and small pockets located deep within the forest. Mark holistically, looking for close observation and detail, with reference to the three mark bands 0–1, 2–3 and 4–5. [5] (ii) Using evidence from Fig. 1 and your own knowledge, suggest what factors put forests at risk of deforestation. From Fig. 1 candidates should be able to derive urban expansion and road construction / the access to the forest that roads give (0–1). To this may be added activities: ‘the world’s largest expanding agricultural frontier’, ranching, logging, wood for fuel and construction, mining, power production, resettlement, tourism, etc. Another approach would be factors such as population pressure, profit motive, corruption, the lack of protection, etc. Again, use the mark bands 0–1, 2–3 and 4–5. [5] (b) ‘Once destroyed, lost forever.’ Assess this view of one or more degraded environments. The judgement or opinion is a stimulus to consider how final or how remediable environmental degradation may be. Much depends on the example(s) taken. Possible indicators of quality may be a sense of diversity; of how outcomes vary with conditions; of constraints and problems; and of attempts to first halt degradation and then to recover the environment(s). Candidates will probably: L3 Produce a high quality assessment, well-founded in detailed knowledge of the chosen environment(s) and show strong conceptual understanding. Impress by overall perspective and use of material in evaluating the statement’s validity in the chosen context(s). [12–15] L2 Develop a response of sound to good quality. Whilst satisfactory as far as it goes, candidates may lack one or more of exemplar detail, conceptual grasp, skills in assessment. At the lower end may deal with the statement slightly or quite generally. [7–11] L1 Make a response which is more descriptive than evaluative. Give a few basic observations about the environment(s) which may be general. Fragmentary and note- form responses remain in this level. [0–6] [Total: 25]
Mark scheme, page 6
Page 6 Mark Scheme: Teachers’ version Syllabus Paper GCE AS/A LEVEL – May/June 2012 9696 33 © University of Cambridge International Examinations 2012 Global interdependence 5 (a) Explain the terms visible and invisible trade (imports and exports) with reference to one or more countries’ trading. The first pair of terms needs to be defined and illustrated. The bracketed pair may be assumed or used to advantage. visibles are trade items that can be seen and / or touched, such as agricultural products, raw materials or manufactured and processed goods invisibles are trade items that cannot be seen except on a balance sheet, computer screen or in delivery, they are services (tertiary, quaternary sectors) and include tourism, education, banking, consultancy, etc. (imports are trade flows into a country and, exports, trade flows out of a country) Although diverse examples may be used, it may be effective and economical in terms of time to explain the terms through the example of one country. Candidates may include the ideas of the balance of trade or payments creditably, but these are not necessary for full marks. Mark on overall quality, understanding of the terms, scope and detail of examples, bearing in mind three levels of response and the mark bands of 0–4, 5–7 and 8–10. For a general response without examples, max.6. [10] (b) How far do you agree that trading in the global economy of the 21st century is about identifying opportunities and markets? An open question allowing candidates to use the material they have to advantage. Visibles and invisibles are acceptable. Better responses should be contemporary in tone to reflect the wording of the question, and may separate opportunities from markets or take both together. Recent events are likely to furnish examples, such as China’s growing market domination; the impact of the ash cloud on Kenyan growers’ exports by air in 2010; and problems with supply chains, quality control, etc. A counter-argument for safer, more stable trading could use material about trade agreements, colonial ties and the WTO. Candidates will probably: L3 Demonstrate strong understanding of trade, its opportunities and markets and, whilst not making a comprehensive response, convince by their ‘big picture’ perspective, use of examples and evidence-based assessment. [12–15] L2 Produce a satisfactory to good explanation of overall sound quality. Show some knowledge of the realities of contemporary trading, but develop a response which remains limited in one or more ways (perspective, examples, argument or structure). [7–11] L1 Make a few basic points which may be quite generally descriptive of trade, or fail to address the actual question set to a large extent. Fragmentary and note-form responses remain in this level. [0–6] [Total: 25]
Mark scheme, page 7
Page 7 Mark Scheme: Teachers’ version Syllabus Paper GCE AS/A LEVEL – May/June 2012 9696 33 © University of Cambridge International Examinations 2012 6 Fig. 2 shows the life cycle model of tourism. (a) Compare and contrast the characteristics of any two stages named in Fig. 2. In this fuller version of the model (as in the version published by Butler in 1980), candidates have ten stages to choose from. The command compare and contrast involves identifying similarities and differences, although it is the differences between the chosen stages which may dominate a response. An effective answer is likely to involve both description and explanation of the chosen stages, but higher skills will be demonstrated in pointing out the similarities and differences in an explicit way, rather than leaving the examiner to pick them out. Mark on overall quality, understanding of the chosen stages and specificity, with reference to three levels of response and the mark bands of 0–4, 5–7 and 8–10. As, in this case, a general response could be highly effective, the maximum of 6 for a general response should not be applied, although exemplar support which develops the response should be credited. [10] (b) Assess the usefulness of the life cycle model for analysing the development of one or more resorts or tourist destinations. Expect responses using locations which fit to a large extent, such as the Costa Del Sol, Spain; Goa, India; or Rotorua, NZ; as well as those that do not, such as an ecotourism project or protected wilderness. Ambitious responses may be seen which demonstrate both aspects. Candidates will probably: L3 Structure the whole response as an assessment and consider the model‘s usefulness analytically. Show strong conceptual grasp of the role of models in geography. Make perceptive and effective use of a detailed example or examples as evidence. [12–15] L2 Provide a response of sound to good quality which is satisfactory as far as it goes, but which remains underdeveloped in detail, or in the overall assessment offered. May ‘top and tail’ a narrative of the case(s) with evaluative comments. [7–11] L1 Make one or more simple observations about the life cycle model and how it relates to the named area(s). Offer a generalised piece lacking a clear located example. Take a descriptive more than an evaluative approach. Notes and fragments remain in this level. [0–6] [Total: 25]
Mark scheme, page 8
Page 8 Mark Scheme: Teachers’ version Syllabus Paper GCE AS/A LEVEL – May/June 2012 9696 33 © University of Cambridge International Examinations 2012 Economic transition 7 (a) Suggest reasons for the lack of development amongst the world’s poorest LEDCs. The lack of development is a relative state, suggesting that there is potential for further development (economic, social and political). The causes are complex, interactive and dynamic (and some may be viewed as specific to individual countries). The reasons combine both the presence of some characteristics (such as instability) and the absence or relative absence of others (such as good governance). The UN has a category of Least Developed Countries (LDCs): in Africa 33, Asia 14, Latin America and the Caribbean 1; total 48 (2011). LDCs are defined by low income, human resource weakness and economic vulnerability. Mark on overall quality of reasoning, not looking for fully comprehensive responses, and with reference to three levels of response and the mark bands 0–4, 5–7 and 8–10. For a general response without examples, max.6. [10] (b) Discuss the best ways of measuring social and economic wellbeing. An evaluative question about indices. It is likely that composite indices, such as HDI, HPI or PQLI will be seen as better than single-criterion indices. HDI was the UN measure of choice but was supplemented by the new MPI (Multidimensional poverty index) in the Human Development Report 2010. Some indices such as infant mortality rate (IMR) reflect development in a number of dimensions and may be considered very useful. Observations about overcoming difficulties in gathering information and in establishing a basis of comparability, etc. are creditable within the response in terms of ‘best practice’, but are not necessary. Candidates will probably: L3 Offer a convincing discussion which does not need to be comprehensive to impress by its global perspective, diverse examples and robust approach to the topic of measurement by indices. [12–15] L2 Provide a response of sound quality overall, which may be good in parts, but which remains limited in knowledge and understanding of indices. At the lower end may offer more of an explanation than a discussion. [7–11] L1 Make one or more simple observations about inequalities of basic quality, which may be faulty. Struggle to select and apply their material in response to the question set. Answer generally and / or descriptively, perhaps simply asserting the best way(s). Fragmentary and note-form responses remain in this level. [0–6] [Total: 25]
Mark scheme, page 9
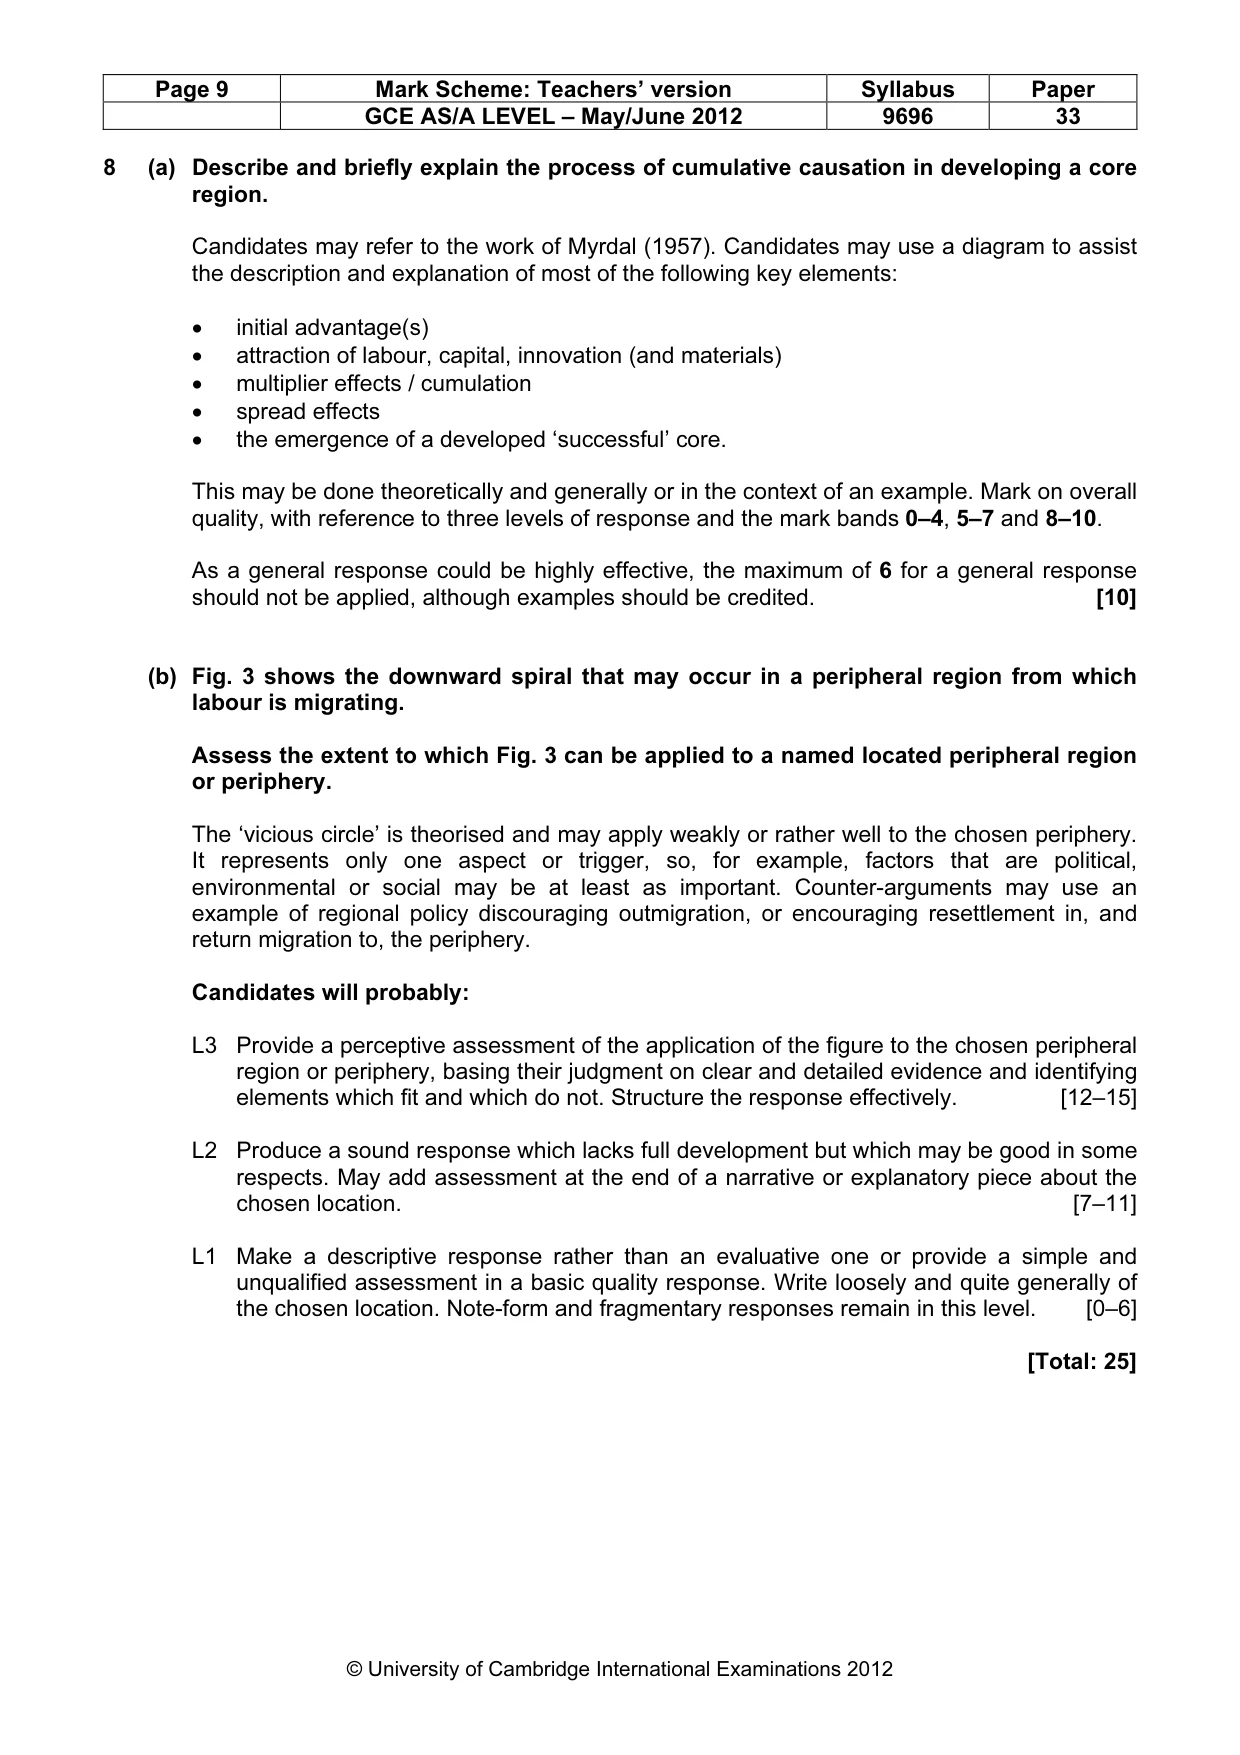
Page 9 Mark Scheme: Teachers’ version Syllabus Paper GCE AS/A LEVEL – May/June 2012 9696 33 © University of Cambridge International Examinations 2012 8 (a) Describe and briefly explain the process of cumulative causation in developing a core region. Candidates may refer to the work of Myrdal (1957). Candidates may use a diagram to assist the description and explanation of most of the following key elements: • initial advantage(s) • attraction of labour, capital, innovation (and materials) • multiplier effects / cumulation • spread effects • the emergence of a developed ‘successful’ core. This may be done theoretically and generally or in the context of an example. Mark on overall quality, with reference to three levels of response and the mark bands 0–4, 5–7 and 8–10. As a general response could be highly effective, the maximum of 6 for a general response should not be applied, although examples should be credited. [10] (b) Fig. 3 shows the downward spiral that may occur in a peripheral region from which labour is migrating. Assess the extent to which Fig. 3 can be applied to a named located peripheral region or periphery. The ‘vicious circle’ is theorised and may apply weakly or rather well to the chosen periphery. It represents only one aspect or trigger, so, for example, factors that are political, environmental or social may be at least as important. Counter-arguments may use an example of regional policy discouraging outmigration, or encouraging resettlement in, and return migration to, the periphery. Candidates will probably: L3 Provide a perceptive assessment of the application of the figure to the chosen peripheral region or periphery, basing their judgment on clear and detailed evidence and identifying elements which fit and which do not. Structure the response effectively. [12–15] L2 Produce a sound response which lacks full development but which may be good in some respects. May add assessment at the end of a narrative or explanatory piece about the chosen location. [7–11] L1 Make a descriptive response rather than an evaluative one or provide a simple and unqualified assessment in a basic quality response. Write loosely and quite generally of the chosen location. Note-form and fragmentary responses remain in this level. [0–6] [Total: 25]
What you needed in this session
Cambridge’s own grade thresholds for 2012 May/June, Paper 3 · Variant 3. A higher threshold means an easier paper — the bar moves with how the cohort did.