Cambridge A Level Geography 9696 — 2011 Oct/Nov Paper 1 · Variant 1
9696/11/O/N/11 · 100 marks · ≈113 min
The question paper and its mark scheme, free to read here and free to download. This is Cambridge’s own paper, exactly as it was sat.
Question paper8 pages



Mark scheme14 pages
Answers below. Sit the paper first if you are practising.


Paper as text
Question paper, page 1
READ THESE INSTRUCTIONS FIRST If you have been given an Answer Booklet, follow the instructions on the front cover of the Booklet. Write your Centre number, candidate number and name on all the work you hand in. Write in dark blue or black pen. You may use a soft pencil for any diagrams, graphs or rough working. Do not use staples, paper clips, highlighters, glue or correction fl uid. Section A Answer fi ve questions. Section B Answer one question. Section C Answer one question. Sketch maps and diagrams should be drawn whenever they serve to illustrate an answer. All the Figures and the Table referred to in the questions are contained in the Insert. At the end of the examination, fasten all your work securely together. The number of marks is given in brackets [ ] at the end of each question or part question. GEOGRAPHY 9696/11 Paper 1 Core Geography October/November 2011 3 hours Additional Materials: Answer Booklet/Paper UNIVERSITY OF CAMBRIDGE INTERNATIONAL EXAMINATIONS General Certifi cate of Education Advanced Subsidiary Level and Advanced Level This document consists of 5 printed pages, 3 blank pages and 1 Insert. [Turn over IB11 11_9696_11/2RP © UCLES 2011 *9787402986*
Question paper, page 2
2 9696/11/O/N/11 © UCLES 2011 Section A Answer five questions from this section. All questions carry 10 marks. Hydrology and fluvial geomorphology 1 Fig. 1 shows a storm hydrograph along with the characteristics of that drainage basin. (a) Calculate the lag time. [1] (b) Identify the following features of the hydrograph. (i) A (ii) B (iii) C [3] (c) Explain how two of the catchment conditions given in Fig. 1 affect the shape of the hydrograph. [6] Atmosphere and weather 2 Fig. 2 shows an idealised global pattern of pressure and winds. (a) (i) Identify the pressure area marked as A. (ii) Identify the pressure areas marked as B. [2] (b) (i) Name the winds marked as C. (ii) Name the winds marked as D. [2] (c) Explain how the pressure systems develop and how they influence the pattern of global winds. [6] Rocks and weathering 3 Fig. 3 is a diagram which relates climate to types of weathering. (a) (i) What type of weathering would be dominant in an area with an annual temperature of 24 °C and mean annual rainfall of 1800 mm? (ii) Which weathering process would be most dominant in an area with an annual temperature of –12 °C and mean annual rainfall of 600 mm? [2] (b) In what type of climate would ‘very slight weathering’ occur? Explain why weathering would be limited in such a climate. [4] (c) With reference to a specific process, explain why strong chemical weathering occurs in that area shown in the graph. [4]
Question paper, page 3
3 9696/11/O/N/11 © UCLES 2011 [Turn over Population 4 Table 1 shows the actual and predicted percentage of world population by region between 1950 and 2100. (a) Using data from Table 1: (i) which region had experienced the largest decline in its share of population between 1950 and 2008? (ii) name the region with the largest predicted increase in its share of population between 2008 and 2100. [2] (b) Describe how the share of world population shown in Table 1 changes for Asia and Northern America between 1950 and 2100. [3] (c) Outline the possible demographic consequences of the predicted population change in Africa. [5] Migration 5 (a) Fig. 4 shows the main countries of origin of international migrants seeking asylum in 2008. Asylum-seekers who are granted the protection of the country to which they migrated are called refugees. Describe the distribution shown in Fig. 4. [5] (b) Outline the impacts of the flow of refugees on the countries to which they migrate (the receiving countries). [5] Settlement dynamics 6 Fig. 5 shows population change in two villages in a rural area of an LEDC. (a) (i) State the 5 year period in which village X had the greatest increase in population. [1] (ii) Compare the population changes in the two villages since 1970. [3] (b) Suggest reasons for the population changes in the two villages between 1970 and 2010. [6]
Question paper, page 4
4 9696/11/O/N/11 © UCLES 2011 Section B: The Physical Core Answer one question from this section. All questions carry 25 marks. Hydrology and fluvial geomorphology 7 (a) (i) Define the terms hydraulic action and solution as they apply to processes in a river channel. [4] (ii) Describe how variations in discharge could lead to braiding in a river channel. [3] (b) With the use of diagrams, explain how a pool and riffle sequence may lead to the development of meanders. [8] (c) With reference to the Hjulstrom Curve, explain the relationship between velocity and sediment size in terms of erosion, transportation and deposition in a river. [10] Atmosphere and weather 8 (a) (i) Define the terms fog and dew. [4] (ii) Briefly describe one set of conditions under which fog may be formed. [3] (b) Using diagrams explain the differences between the local energy budget (the heating and cooling of the atmosphere), during daytime and night-time. [8] (c) Explain the extent to which the climate in rural areas differs from that of nearby urban areas. [10] Rocks and weathering 9 (a) (i) Define the terms flow and slide as they apply to mass movements. [4] (ii) Briefly describe how a rock slide can affect the shape of a slope. [3] (b) With the use of a diagram or diagrams, show how ocean trenches and island arcs may develop at a convergent plate margin. [8] (c) Explain how human activities can both increase and decrease mass movements on slopes. [10]
Question paper, page 5
5 9696/11/O/N/11 © UCLES 2011 [Turn over Section C: The Human Core Answer one question from this section. All questions carry 25 marks. Population 10 (a) With the help of examples, briefly explain how food shortages can occur. [7] (b) Describe and explain the possible impacts of food shortages. [8] (c) To what extent is the level of education the most important factor in determining fertility rate? [10] Migration 11 (a) (i) Explain the term internal migration. [3] (ii) Explain why urban-rural migration occurs in LEDCs. [4] (b) With the help of examples, describe how constraints, obstacles and barriers affect internal migrations. [8] (c) To what extent are pull factors more important than push factors in voluntary migration? [10] Settlement dynamics 12 (a) (i) Give the meaning of the term urbanisation. [3] (ii) Outline two possible causes of the rapid urban growth experienced by some cities in LEDCs. [4] (b) Explain the slow rate of urban growth in MEDCs. [8] (c) With reference to examples from either LEDCs or MEDCs, assess the attempts made to solve the problems associated with rapid urban growth. [10]
Question paper, page 6
6 9696/11/O/N/11 © UCLES 2011 BLANK PAGE
Question paper, page 7
7 9696/11/O/N/11 © UCLES 2011 [Turn over BLANK PAGE
Question paper, page 8
8 Permission to reproduce items where third-party owned material protected by copyright is included has been sought and cleared where possible. Every reasonable effort has been made by the publisher (UCLES) to trace copyright holders, but if any items requiring clearance have unwittingly been included, the publisher will be pleased to make amends at the earliest possible opportunity. University of Cambridge International Examinations is part of the Cambridge Assessment Group. Cambridge Assessment is the brand name of University of Cambridge Local Examinations Syndicate (UCLES), which is itself a department of the University of Cambridge. 9696/11/O/N/11 © UCLES 2011 BLANK PAGE
Mark scheme, page 1
© University of Cambridge International Examinations 2011 UNIVERSITY OF CAMBRIDGE INTERNATIONAL EXAMINATIONS GCE Advanced Subsidiary Level and GCE Advanced Level MARK SCHEME for the October/November 2011 question paper for the guidance of teachers 9696 GEOGRAPHY 9696/11 Paper 1 (Core Geography), maximum raw mark 100 This mark scheme is published as an aid to teachers and candidates, to indicate the requirements of the examination. It shows the basis on which Examiners were instructed to award marks. It does not indicate the details of the discussions that took place at an Examiners’ meeting before marking began, which would have considered the acceptability of alternative answers. Mark schemes must be read in conjunction with the question papers and the report on the examination. • Cambridge will not enter into discussions or correspondence in connection with these mark schemes. Cambridge is publishing the mark schemes for the October/November 2011 question papers for most IGCSE, GCE Advanced Level and Advanced Subsidiary Level syllabuses and some Ordinary Level syllabuses.
Mark scheme, page 2
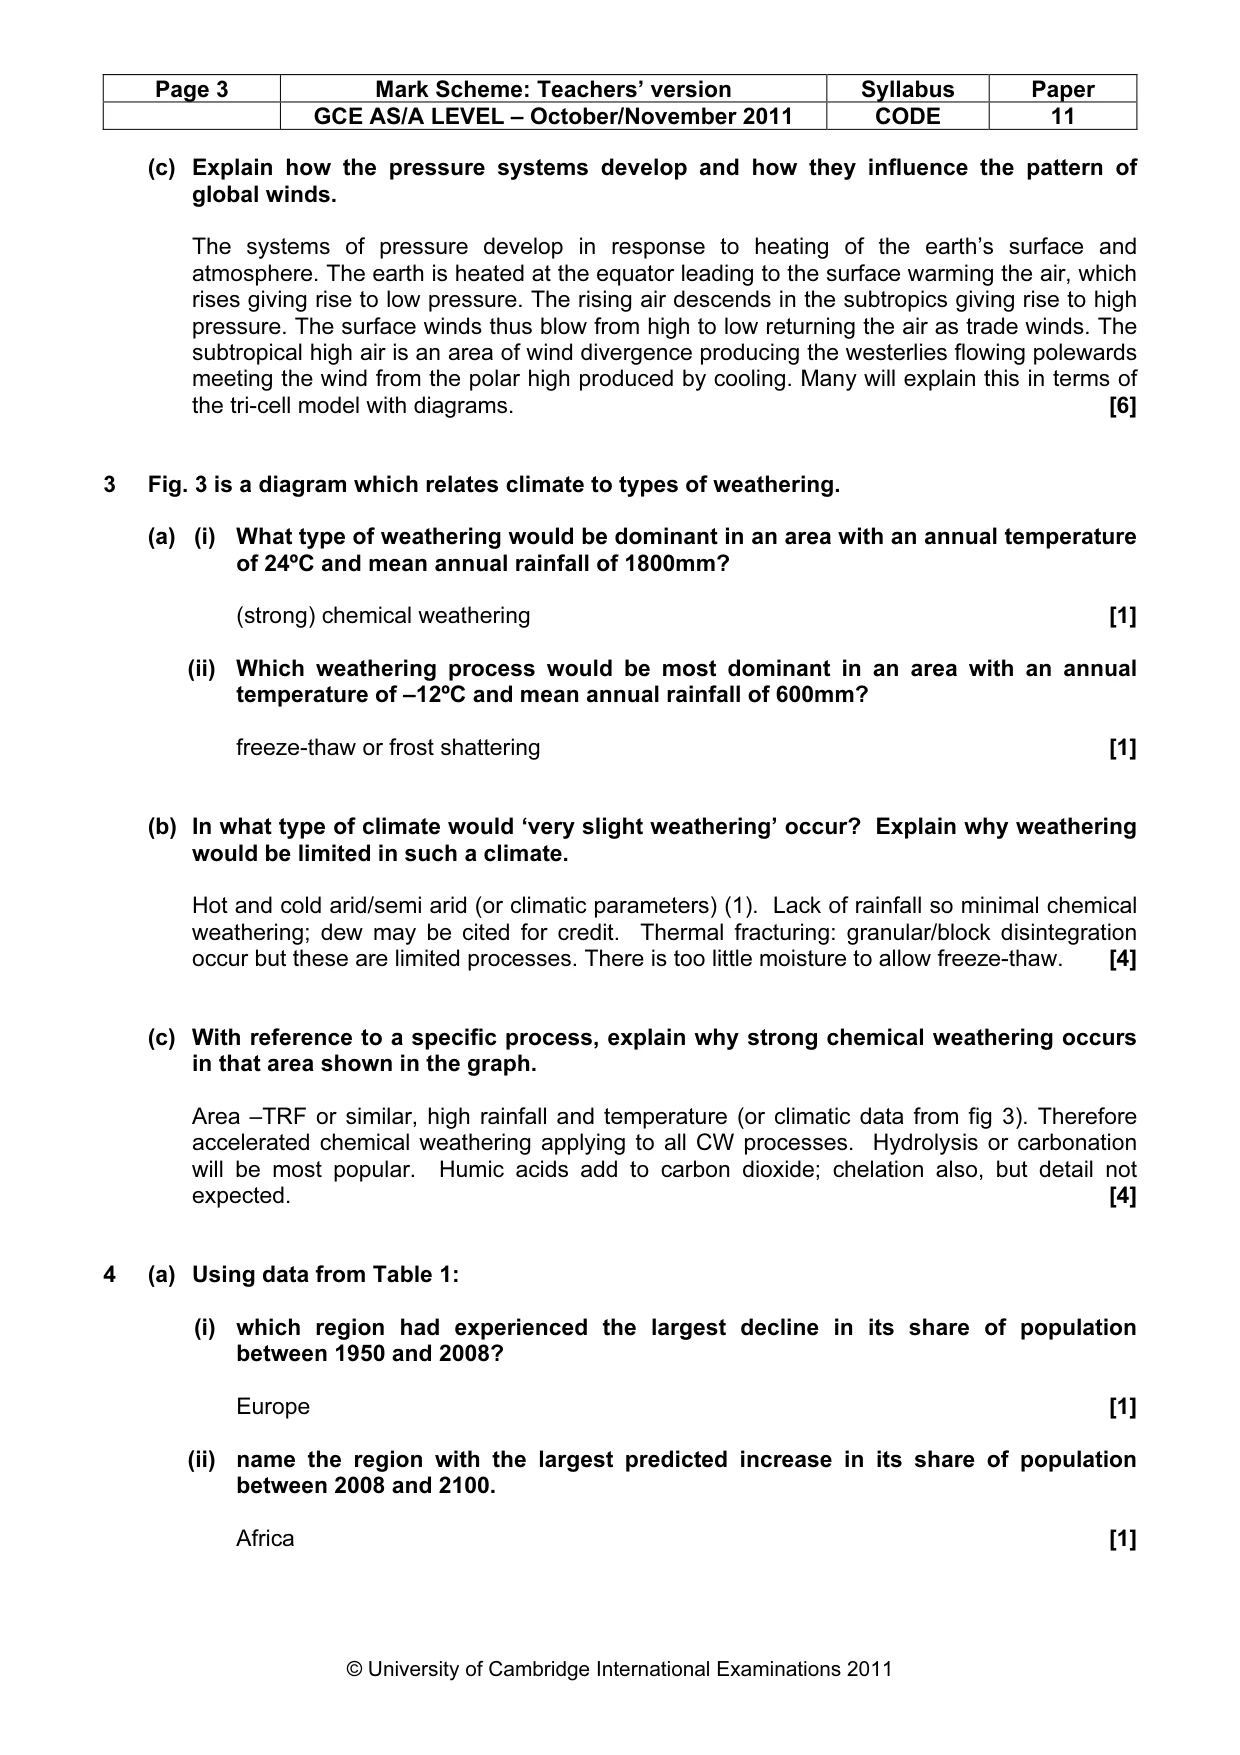
Page 2 Mark Scheme: Teachers’ version Syllabus Paper GCE AS/A LEVEL – October/November 2011 CODE 11 © University of Cambridge International Examinations 2011 Section A Hydrology and Fluvial Geomorphology: 1 (a) Calculate the lag time. 5–7 hours [1] (b) Identify the following features of the hydrograph. (i) A rising limb (ii) B peak discharge (iii) C baseflow [3] (c) Explain how two of the catchment conditions given in Fig.1 affect the shape of the hydrograph. – Clay allows little infiltration as it gets saturated quickly and therefore the more water would form overland flow. – The steep sided topography means that water will flow quickly into the channel contributing to the high level of run off. – The rounded drainage basin shape means that all the points from the watershed are approximately equidistant from the point where the discharge was recorded. In all cases the effects on the hydrograph are similar i.e. a relatively short lag time, steep rising and recessional limbs and relatively low baseflow. [6] 2 Fig. 2 shows an idealized global pattern of pressure and winds. (a) (i) Identify the pressure area marked as A. Equatorial low or ITCZ [1] (ii) Identify the pressure areas marked as B. Subtropical highs [1] (b) (i) Name the winds marked as C. Trades [1] (ii) Name the winds marked as D. Westerlies [1]
Mark scheme, page 3
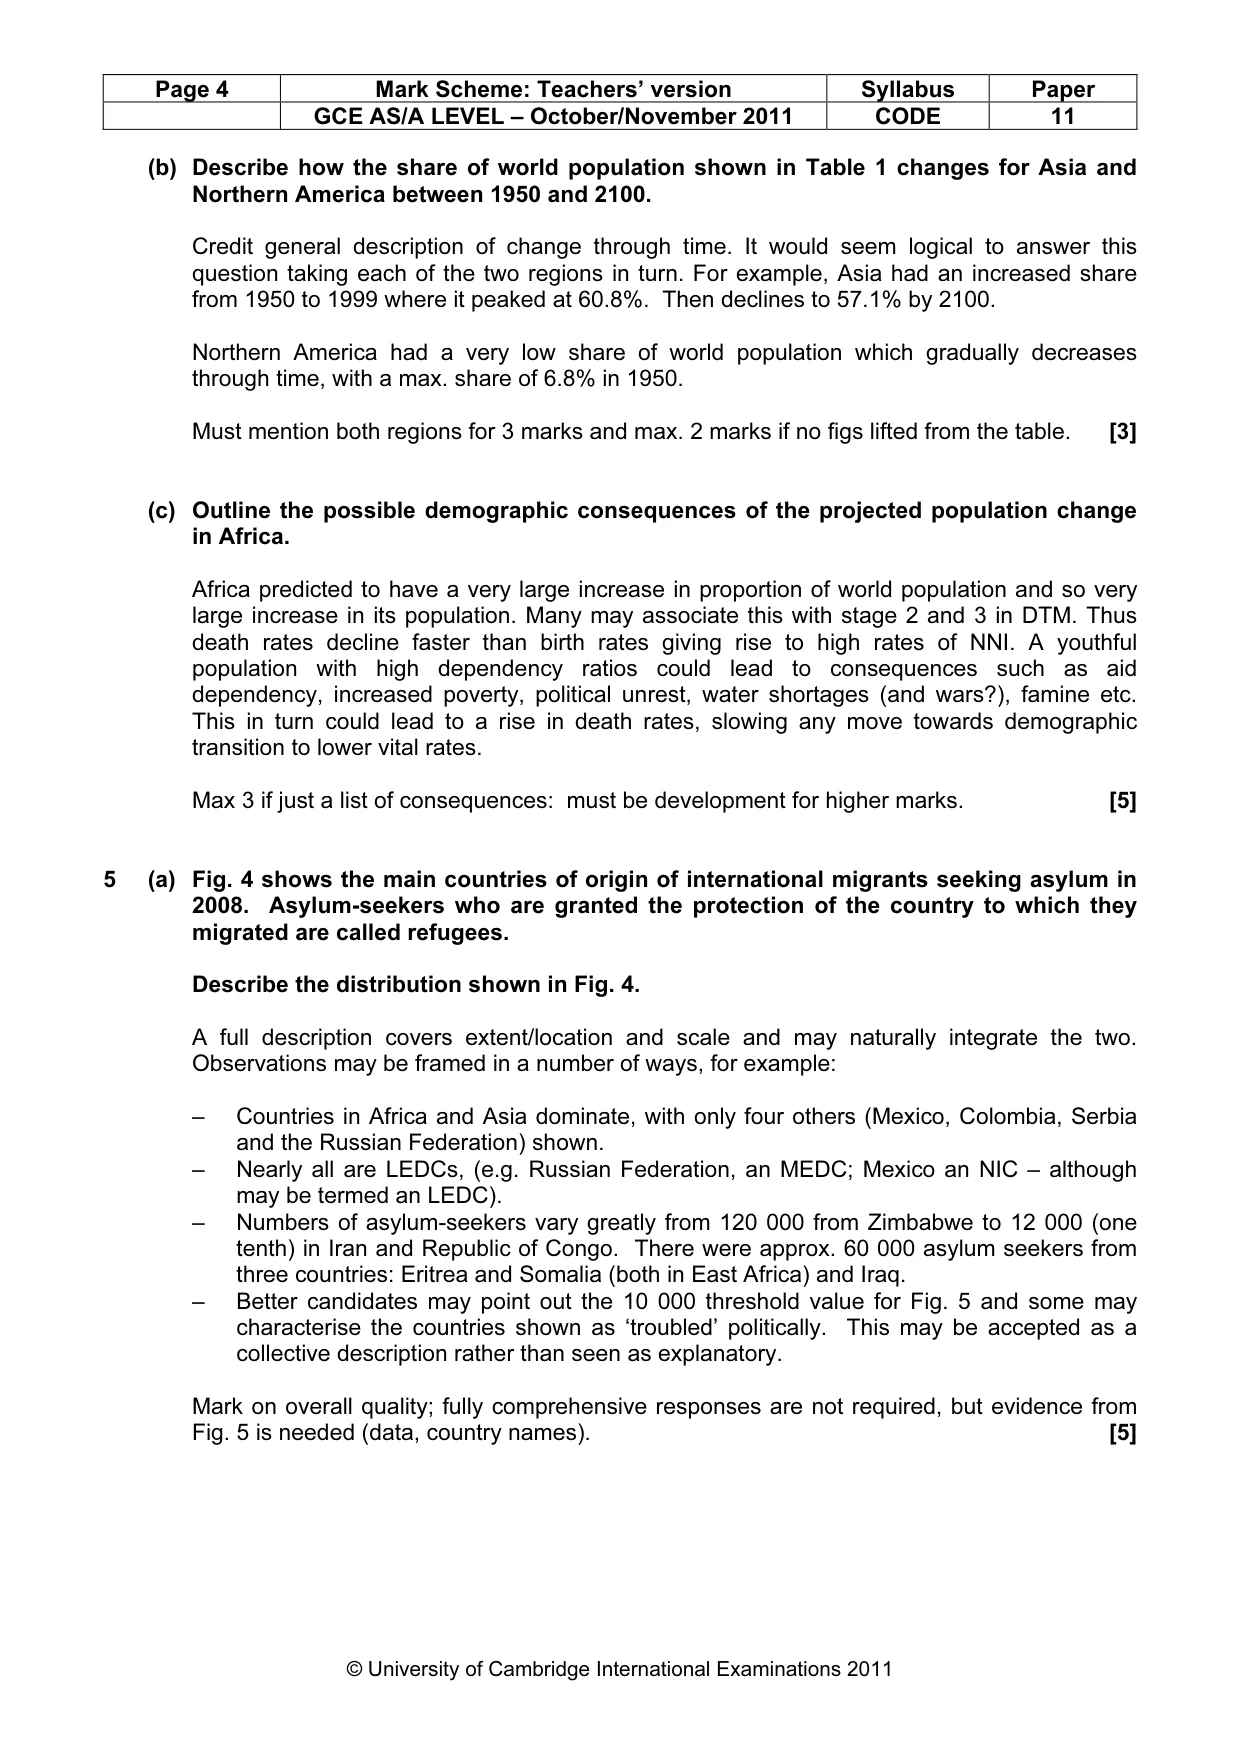
Page 3 Mark Scheme: Teachers’ version Syllabus Paper GCE AS/A LEVEL – October/November 2011 CODE 11 © University of Cambridge International Examinations 2011 (c) Explain how the pressure systems develop and how they influence the pattern of global winds. The systems of pressure develop in response to heating of the earth’s surface and atmosphere. The earth is heated at the equator leading to the surface warming the air, which rises giving rise to low pressure. The rising air descends in the subtropics giving rise to high pressure. The surface winds thus blow from high to low returning the air as trade winds. The subtropical high air is an area of wind divergence producing the westerlies flowing polewards meeting the wind from the polar high produced by cooling. Many will explain this in terms of the tri-cell model with diagrams. [6] 3 Fig. 3 is a diagram which relates climate to types of weathering. (a) (i) What type of weathering would be dominant in an area with an annual temperature of 24ºC and mean annual rainfall of 1800mm? (strong) chemical weathering [1] (ii) Which weathering process would be most dominant in an area with an annual temperature of –12ºC and mean annual rainfall of 600mm? freeze-thaw or frost shattering [1] (b) In what type of climate would ‘very slight weathering’ occur? Explain why weathering would be limited in such a climate. Hot and cold arid/semi arid (or climatic parameters) (1). Lack of rainfall so minimal chemical weathering; dew may be cited for credit. Thermal fracturing: granular/block disintegration occur but these are limited processes. There is too little moisture to allow freeze-thaw. [4] (c) With reference to a specific process, explain why strong chemical weathering occurs in that area shown in the graph. Area –TRF or similar, high rainfall and temperature (or climatic data from fig 3). Therefore accelerated chemical weathering applying to all CW processes. Hydrolysis or carbonation will be most popular. Humic acids add to carbon dioxide; chelation also, but detail not expected. [4] 4 (a) Using data from Table 1: (i) which region had experienced the largest decline in its share of population between 1950 and 2008? Europe [1] (ii) name the region with the largest predicted increase in its share of population between 2008 and 2100. Africa [1]
Mark scheme, page 4
Page 4 Mark Scheme: Teachers’ version Syllabus Paper GCE AS/A LEVEL – October/November 2011 CODE 11 © University of Cambridge International Examinations 2011 (b) Describe how the share of world population shown in Table 1 changes for Asia and Northern America between 1950 and 2100. Credit general description of change through time. It would seem logical to answer this question taking each of the two regions in turn. For example, Asia had an increased share from 1950 to 1999 where it peaked at 60.8%. Then declines to 57.1% by 2100. Northern America had a very low share of world population which gradually decreases through time, with a max. share of 6.8% in 1950. Must mention both regions for 3 marks and max. 2 marks if no figs lifted from the table. [3] (c) Outline the possible demographic consequences of the projected population change in Africa. Africa predicted to have a very large increase in proportion of world population and so very large increase in its population. Many may associate this with stage 2 and 3 in DTM. Thus death rates decline faster than birth rates giving rise to high rates of NNI. A youthful population with high dependency ratios could lead to consequences such as aid dependency, increased poverty, political unrest, water shortages (and wars?), famine etc. This in turn could lead to a rise in death rates, slowing any move towards demographic transition to lower vital rates. Max 3 if just a list of consequences: must be development for higher marks. [5] 5 (a) Fig. 4 shows the main countries of origin of international migrants seeking asylum in 2008. Asylum-seekers who are granted the protection of the country to which they migrated are called refugees. Describe the distribution shown in Fig. 4. A full description covers extent/location and scale and may naturally integrate the two. Observations may be framed in a number of ways, for example: – Countries in Africa and Asia dominate, with only four others (Mexico, Colombia, Serbia and the Russian Federation) shown. – Nearly all are LEDCs, (e.g. Russian Federation, an MEDC; Mexico an NIC – although may be termed an LEDC). – Numbers of asylum-seekers vary greatly from 120 000 from Zimbabwe to 12 000 (one tenth) in Iran and Republic of Congo. There were approx. 60 000 asylum seekers from three countries: Eritrea and Somalia (both in East Africa) and Iraq. – Better candidates may point out the 10 000 threshold value for Fig. 5 and some may characterise the countries shown as ‘troubled’ politically. This may be accepted as a collective description rather than seen as explanatory. Mark on overall quality; fully comprehensive responses are not required, but evidence from Fig. 5 is needed (data, country names). [5]
Mark scheme, page 5
Page 5 Mark Scheme: Teachers’ version Syllabus Paper GCE AS/A LEVEL – October/November 2011 CODE 11 © University of Cambridge International Examinations 2011 (b) Outline the impacts of the flow of refugees on the countries to which they migrate (the receiving countries). Some candidates may have a detailed example (2.4), others will have studied refugee flows generically (2.3) and may have only a broad case “e.g. South Africa”. Either approach is acceptable, credit being for the impacts, such as: - increased population pressure / exceeding carrying capacity - conflicts with existing population - in MEDCs, needs for authorities to supply a range of services from housing to translation - cultural clashes / cultural positives - in MEDCs, political issues over benefit payments, etc. - mostly in LEDCs, health and disease issues in camps and spontaneous settlements around water and sanitation – positive impacts could be in additions to the labour force and cultural diversity Mark on overall quality of impacts (not causes). Better responses will be clearly identified with refugees rather than international migration more generally. [5] 6 Fig. 5 shows population change in two villages in a rural area of a LEDC. (a) (i) State the 5 year period in which village X had the greatest increase in population. 1980–85 [1] (ii) Compare the population changes in the two villages since 1970. Y has decreased in population as X has increased – with figures. Y fallen by 100 in 60 years and X grown by 50. Look for comments on the continuous or smoothness of Y’s decline against X’s more varied, fluctuating growth. X did decline and grow. Population figures should be cited as evidence. [3] (b) Suggest reasons for the population changes in the two villages between 1970 and 2010. Reasons should support why villages decline: ageing population, loss of local jobs, out migration, poverty, remoteness (typical rural push factors) and why they grow: in migration (e.g. retirement), jobs e.g. tourism. Mark on range or depth of reasoning. Two reasons developed in depth could achieve maximum. Credit those that suggest any reasons for why X has fluctuated in population. [6]
Mark scheme, page 6
Page 6 Mark Scheme: Teachers’ version Syllabus Paper GCE AS/A LEVEL – October/November 2011 CODE 11 © University of Cambridge International Examinations 2011 Section B 7 (a) (i) Define the terms hydraulic action and solution as they apply to processes in a river channel. Hydraulic action is an erosional process. It is the force of the water hitting the side of the river. The particles are thus dislodged from the river bed. It can also lead to the compression of air in cracks which subsequently weakens them. Solution is related to the chemical composition of the water and happens continuously. It is a chemical action which dissolves carbonate rocks such as limestone. [4] (ii) Describe how variations in discharge could lead to braiding in a river channel. With high levels of discharge the stream is capable of moving large amounts of sediment. As discharge decreases so does competence leading to deposition of material as eyots dividing the channel (braiding). [3] (b) With the use of diagrams explain how a pool and riffle sequence may lead to the development of meanders. A meandering channel has a sinuous form. Whilst the theory of meander development is still uncertain, there is a strong association whereby a pool riffle sequence may develop into a meander sequence. The sequence suggested should be that firstly a pool riffle sequence develops along a straight section of river. Typically the distance between the pools are 5–7 times the bed width of that river. The thalweg (line of fastest flow) follows a sinuous path, because of the friction caused between flowing water and channel bed. Secondary flows (helicoidal flows) help take material from the outside of one pool onto the inside of another. Over time the pools (areas of higher velocity and deeper water) are then found on the outer bend of meanders, whereas riffles are found between the meanders. The meanders themselves develop a typical wavelength about 10 times the bedwidth. A series of labelled diagrams should be used to gain the higher marks. [8] (c) With reference to the Hjulstrom Curve, explain the relationship between velocity and sediment size in terms of erosion, transportation and deposition in a river. The Hjulstrom curve (graph) shows the relationship between the velocities necessary for erosion, transportation and deposition of a particle of a given size. The graph therefore shows the approximate velocity needed to pick up and transport (in suspension) the sediment of a particular size. The lower curve (the settling or mean fall curve) illustrates the point at which sediment of a particular size will become too heavy and be deposited on the river bed. Clay particles will settle out only at very low velocities. Basic principles should be drawn out, such as the velocities required to hold sediment in suspension are lower than those required to pick them up. In general the larger the sediment size, the higher the velocity needed to pick the sediment up. The exception to this is for sediments smaller than 0.2mm (silts and clays) – because of their cohesive nature – will need higher velocities to dislodge them. A basic diagram of the curve which has been referenced in their answer is creditworthy. [10]
Mark scheme, page 7
Page 7 Mark Scheme: Teachers’ version Syllabus Paper GCE AS/A LEVEL – October/November 2011 CODE 11 © University of Cambridge International Examinations 2011 Candidates will probably: Level 3 Produce a good summary of the Hjulstrom curve, and be able to discuss in detail what it shows and how this relates to observations in a river. [8–10] Level 2 Show some of the principles of the Hjulstrom curve but not be able to discuss this detail. They probably would only refer to basic patterns and not explain more complex ideas such as the cohesive nature of smaller sediment sizes. [5–7] Level 1 Show a basic awareness of sediment size and velocity. They may refer solely to one principle of the graph, for instance the relationship between sediment size and when sediment is transported. [0–4]
Mark scheme, page 8
Page 8 Mark Scheme: Teachers’ version Syllabus Paper GCE AS/A LEVEL – October/November 2011 CODE 11 © University of Cambridge International Examinations 2011 8 (a) (i) Define the terms fog and dew. Fog is water droplets caused by condensation in the surface part of the atmosphere with a visibility of less than 1km. Dew is moisture deposited as water droplets on the surface of vegetation or other surface objects due to condensation from radiation cooling. [4] (ii) Briefly describe one set of conditions under which fog may be formed. Fog occurs where cooling of air takes place at the surface and water condenses around hygroscopic nuclei. Either advection cooling or radiation cooling is acceptable. [3] (b) Using diagrams explain the differences between the local energy budget (the heating and cooling of the atmosphere), during daytime and night time. Diagrams should show the day ‘model’ of incoming short wave radiation with scattering and reflection heating the earth’s surface and the atmosphere warmed n by terrestrial long wave radiation % not required but can be credited. The night time model has no incoming radiation, earth cooling and cooling of the atmosphere through terrestrial radiation. Well annotated diagrams would be sufficient for all marks. [8] (c) Explain the extent to which the climate in rural areas differs from that of nearby urban areas. A reversal of the more usual way of asking the question, which many will find taxing and probably ignore. Rural areas will be cooler at night due to the lack of thermal capacity of vegetation of bricks and mortar and anthropogenic derived heat. Similarly the relative lack of hygroscopic nuclei and convection may lead to less rainfall but more frosts, dew etc. RH may be higher due to greater evapotranspiration which could lead to fogs but with less pollution smogs will be uncommon. Winds will not be restricted by buildings but will not have funnel effects. Very good answers may provide some quantitative data. [10] Candidates will probably: Level 3 Informed attempts to answer question by dealing with rural and then urban contrasts. [8–10] Level 2 The more usual urban climate approach with understanding of the driving mechanism of heat islands. [5–7] Level 1 Little understanding other than hotter/ colder, wetter/ drier approach. [0–4]
Mark scheme, page 9
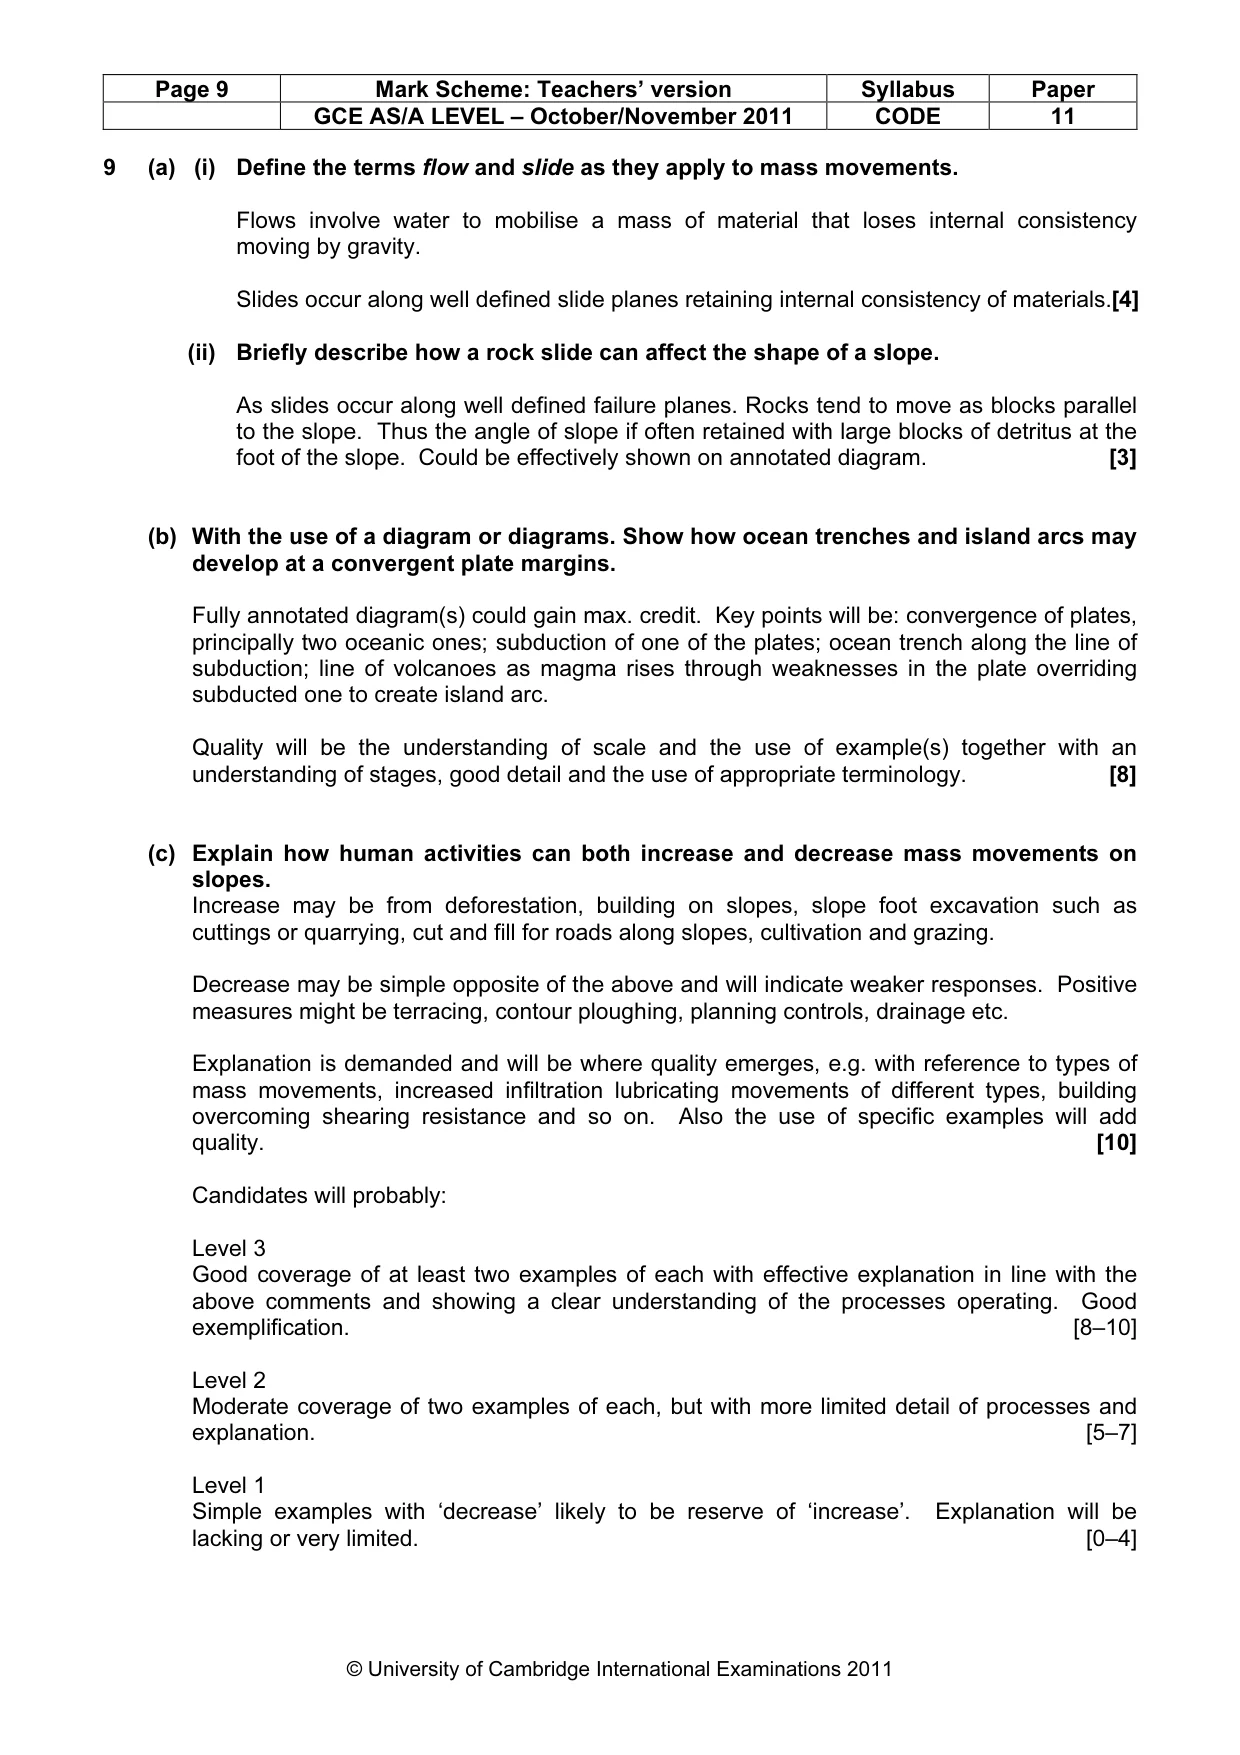
Page 9 Mark Scheme: Teachers’ version Syllabus Paper GCE AS/A LEVEL – October/November 2011 CODE 11 © University of Cambridge International Examinations 2011 9 (a) (i) Define the terms flow and slide as they apply to mass movements. Flows involve water to mobilise a mass of material that loses internal consistency moving by gravity. Slides occur along well defined slide planes retaining internal consistency of materials.[4] (ii) Briefly describe how a rock slide can affect the shape of a slope. As slides occur along well defined failure planes. Rocks tend to move as blocks parallel to the slope. Thus the angle of slope if often retained with large blocks of detritus at the foot of the slope. Could be effectively shown on annotated diagram. [3] (b) With the use of a diagram or diagrams. Show how ocean trenches and island arcs may develop at a convergent plate margins. Fully annotated diagram(s) could gain max. credit. Key points will be: convergence of plates, principally two oceanic ones; subduction of one of the plates; ocean trench along the line of subduction; line of volcanoes as magma rises through weaknesses in the plate overriding subducted one to create island arc. Quality will be the understanding of scale and the use of example(s) together with an understanding of stages, good detail and the use of appropriate terminology. [8] (c) Explain how human activities can both increase and decrease mass movements on slopes. Increase may be from deforestation, building on slopes, slope foot excavation such as cuttings or quarrying, cut and fill for roads along slopes, cultivation and grazing. Decrease may be simple opposite of the above and will indicate weaker responses. Positive measures might be terracing, contour ploughing, planning controls, drainage etc. Explanation is demanded and will be where quality emerges, e.g. with reference to types of mass movements, increased infiltration lubricating movements of different types, building overcoming shearing resistance and so on. Also the use of specific examples will add quality. [10] Candidates will probably: Level 3 Good coverage of at least two examples of each with effective explanation in line with the above comments and showing a clear understanding of the processes operating. Good exemplification. [8–10] Level 2 Moderate coverage of two examples of each, but with more limited detail of processes and explanation. [5–7] Level 1 Simple examples with ‘decrease’ likely to be reserve of ‘increase’. Explanation will be lacking or very limited. [0–4]
Mark scheme, page 10
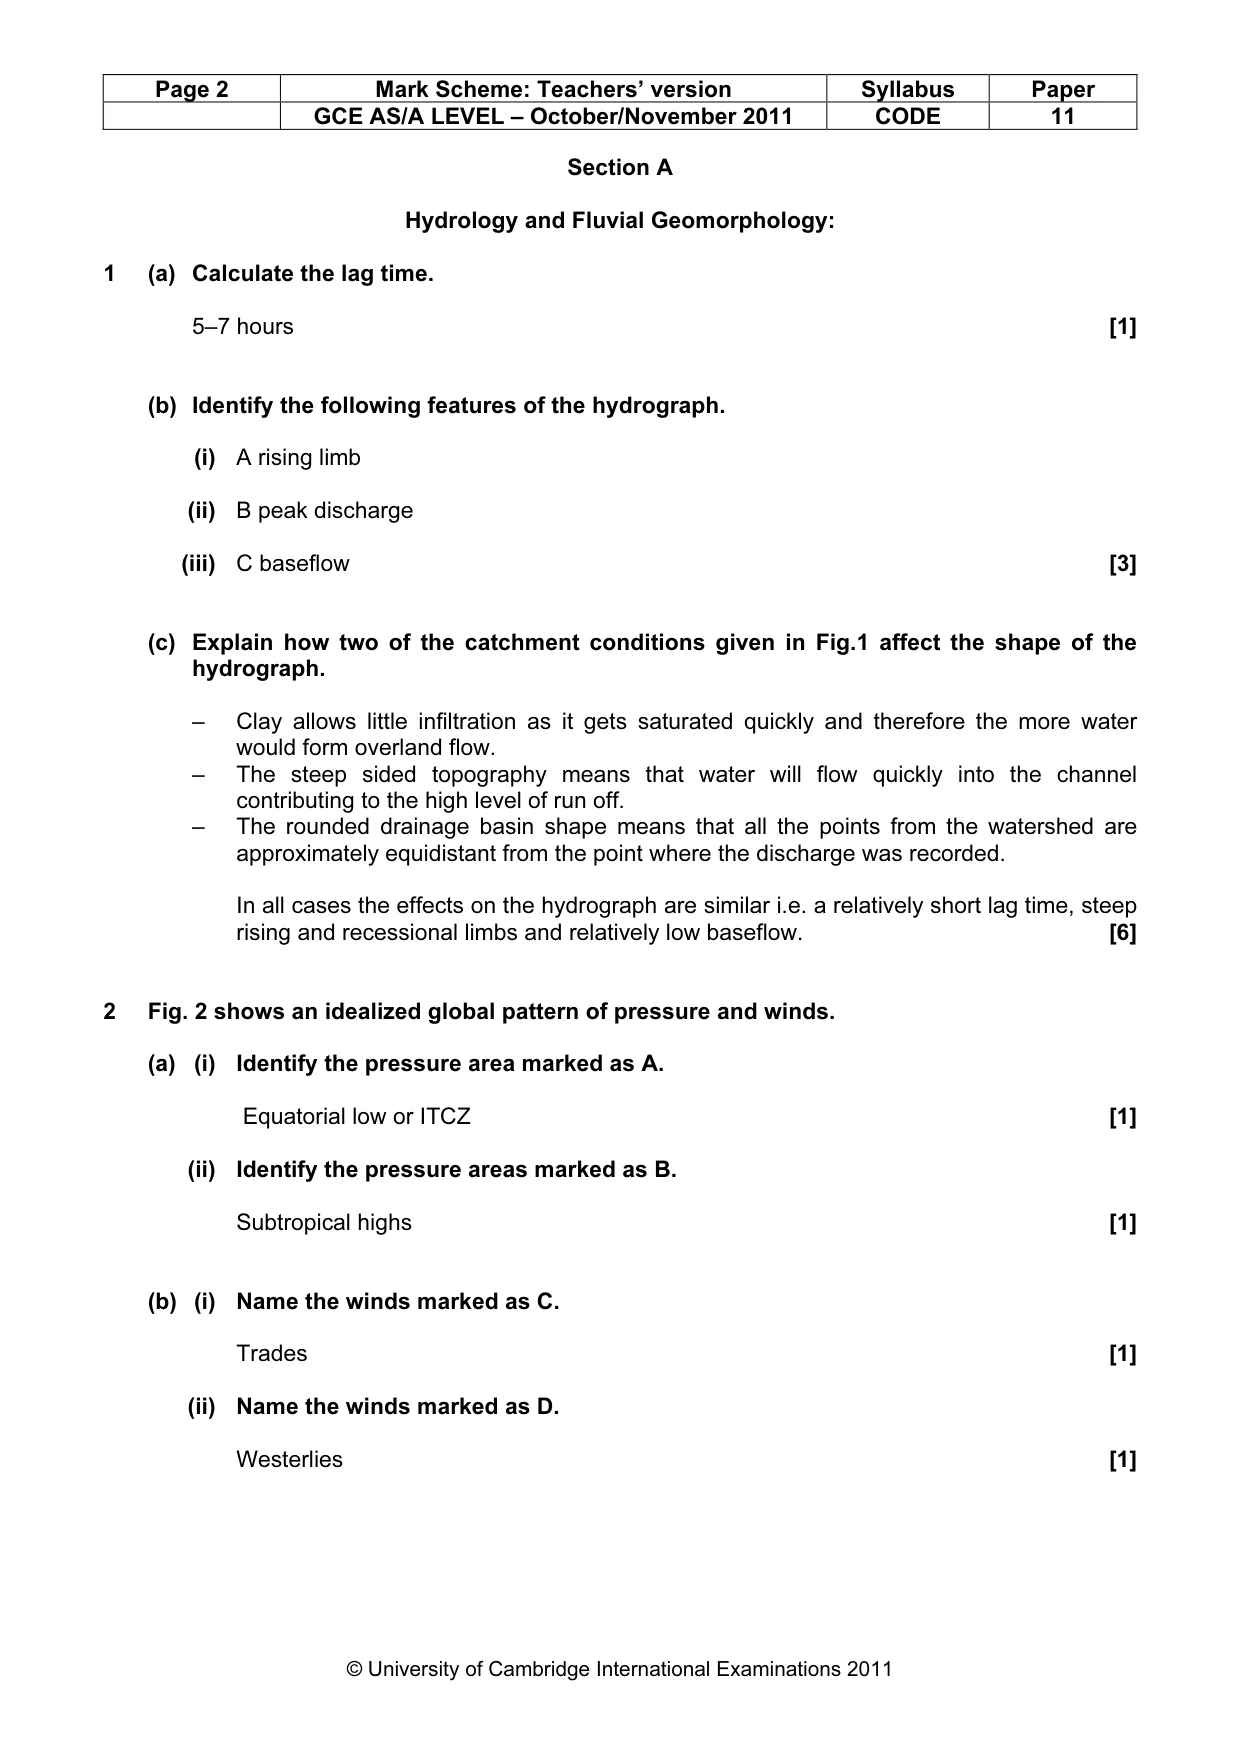
Page 10 Mark Scheme: Teachers’ version Syllabus Paper GCE AS/A LEVEL – October/November 2011 9696 11 © University of Cambridge International Examinations 2011 Section C 10 (a) With the help of examples briefly explain how food shortages can occur. Candidates should look at both sides of the food equation – demand and supply. Demand may rise with population growth (natural increase and/or in migration) or rise in incomes whilst supplies may fall due to climate problems (e.g. drought), pests or disease (e.g. Locusts), soil erosion or from failures in production or transport. Suggest that a full answer develops both sides using examples. A one sided explanation or with no effective examples, max. 5. [7] (b) Describe and explain the possible impacts of food shortages. A sense that the physical, economic, social and political impacts are linked is highly creditable. Very effective answers may look at the knock-on effects e.g. rural food shortage encourages rural urban migration which makes the shortages worse as rural labour falls. Not all impacts are negative – it could stimulate agricultural reform. An area may be at any scale but credit attempts to support explanations using appropriate examples. Answers may take a wide range of impacts or develop a few in depth. Suggest that description and explanation are taken together. [8] (c) To what extent is the level of education the most important factor in determining fertility rate? The generally accepted relationship is the inverse one that as education increases (years of schooling, level of schooling and educational attainment) fertility decreases. Most candidates will associate this with women. However better candidates may also the link to men's education. Should also identify other factors and maybe relate these back to education Education seems to affect fertility in a number of ways, including, • understanding that there are alternatives to having large numbers of children • raising awareness of birth control methods • greater level of education often leads to greater wealth and a different way of life and values. • raising the status of and empowering women • challenging traditional views of family size • raising social and economic aspirations • bringing understanding of the need for and means of birth control • etc. Examples comparing LEDCs and MEDCs and their levels of education and fertility rates are expected, and better candidates may identify anomalies. [10]
Mark scheme, page 11
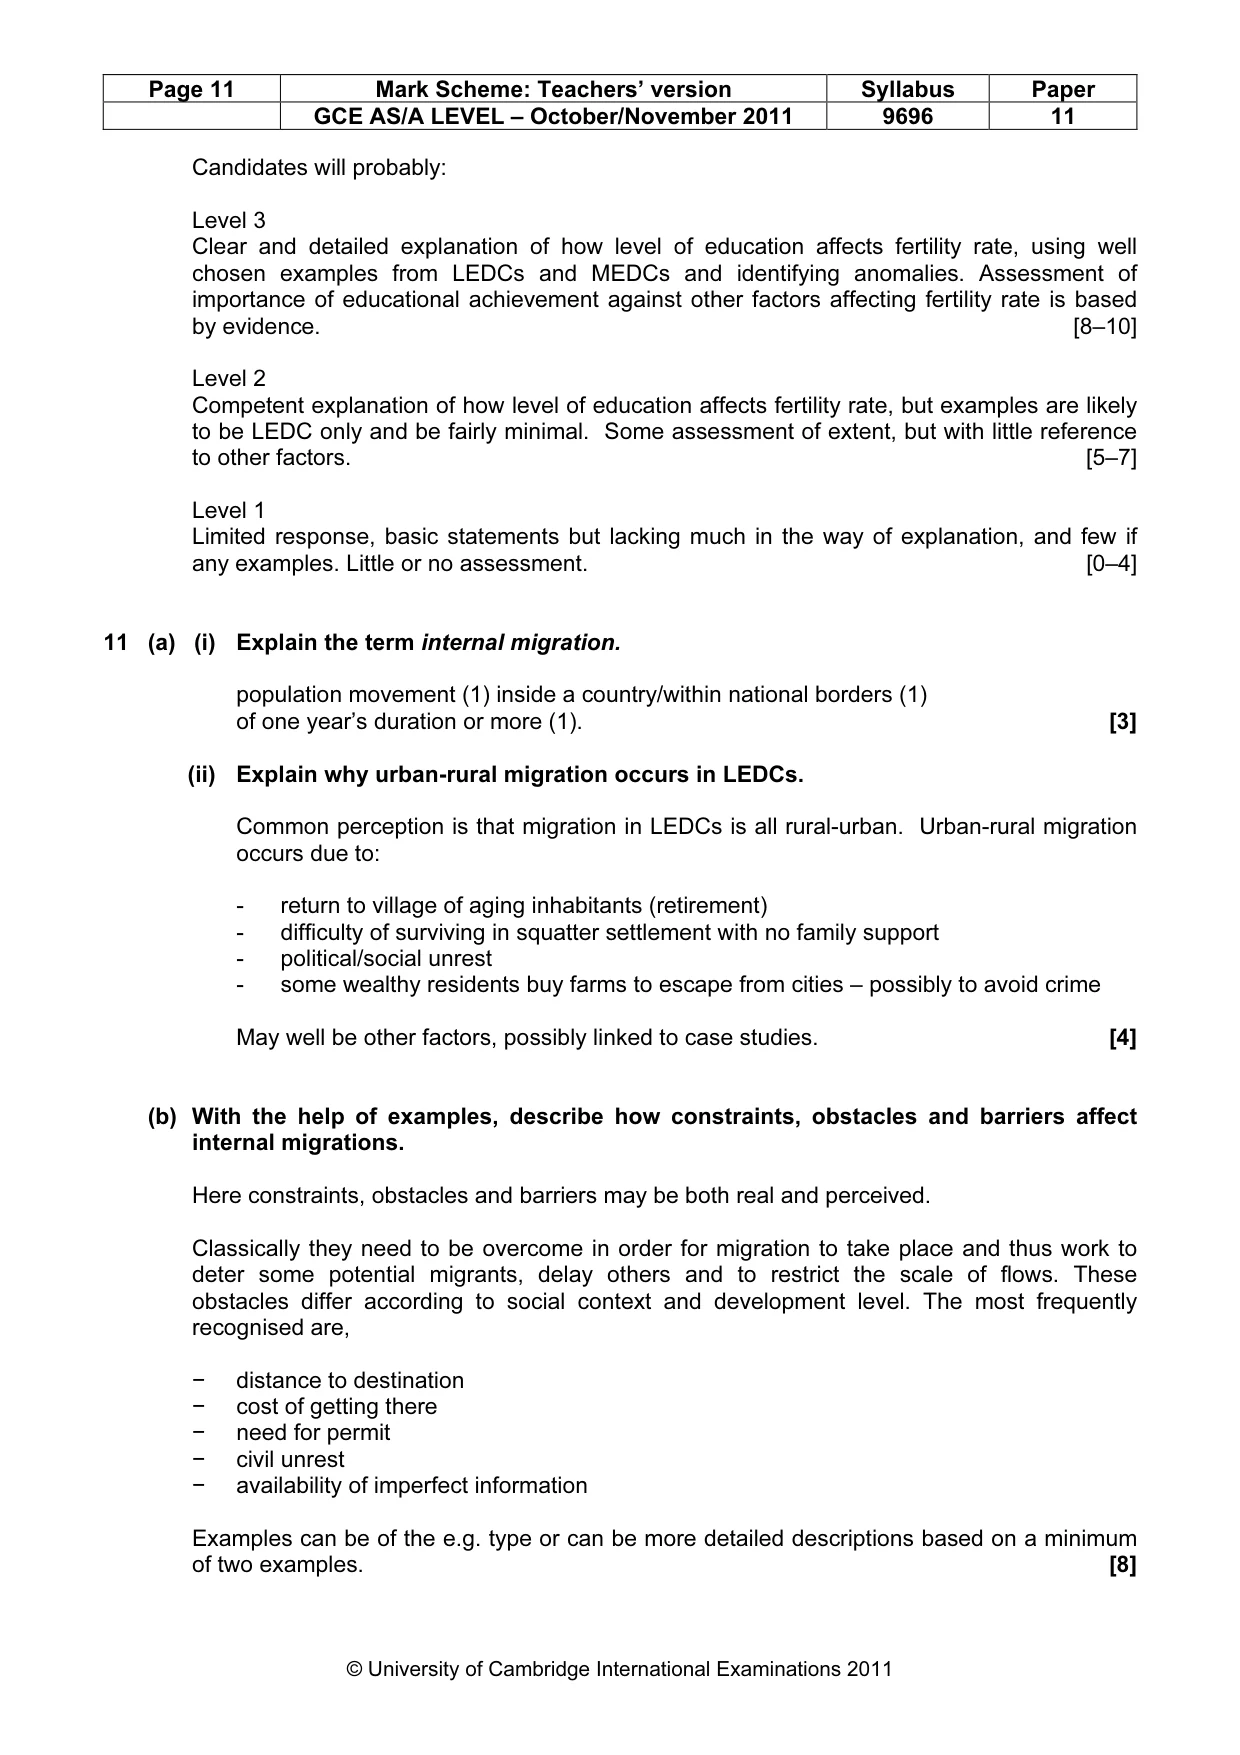
Page 11 Mark Scheme: Teachers’ version Syllabus Paper GCE AS/A LEVEL – October/November 2011 9696 11 © University of Cambridge International Examinations 2011 Candidates will probably: Level 3 Clear and detailed explanation of how level of education affects fertility rate, using well chosen examples from LEDCs and MEDCs and identifying anomalies. Assessment of importance of educational achievement against other factors affecting fertility rate is based by evidence. [8–10] Level 2 Competent explanation of how level of education affects fertility rate, but examples are likely to be LEDC only and be fairly minimal. Some assessment of extent, but with little reference to other factors. [5–7] Level 1 Limited response, basic statements but lacking much in the way of explanation, and few if any examples. Little or no assessment. [0–4] 11 (a) (i) Explain the term internal migration. population movement (1) inside a country/within national borders (1) of one year’s duration or more (1). [3] (ii) Explain why urban-rural migration occurs in LEDCs. Common perception is that migration in LEDCs is all rural-urban. Urban-rural migration occurs due to: - return to village of aging inhabitants (retirement) - difficulty of surviving in squatter settlement with no family support - political/social unrest - some wealthy residents buy farms to escape from cities – possibly to avoid crime May well be other factors, possibly linked to case studies. [4] (b) With the help of examples, describe how constraints, obstacles and barriers affect internal migrations. Here constraints, obstacles and barriers may be both real and perceived. Classically they need to be overcome in order for migration to take place and thus work to deter some potential migrants, delay others and to restrict the scale of flows. These obstacles differ according to social context and development level. The most frequently recognised are, − distance to destination − cost of getting there − need for permit − civil unrest − availability of imperfect information Examples can be of the e.g. type or can be more detailed descriptions based on a minimum of two examples. [8]
Mark scheme, page 12
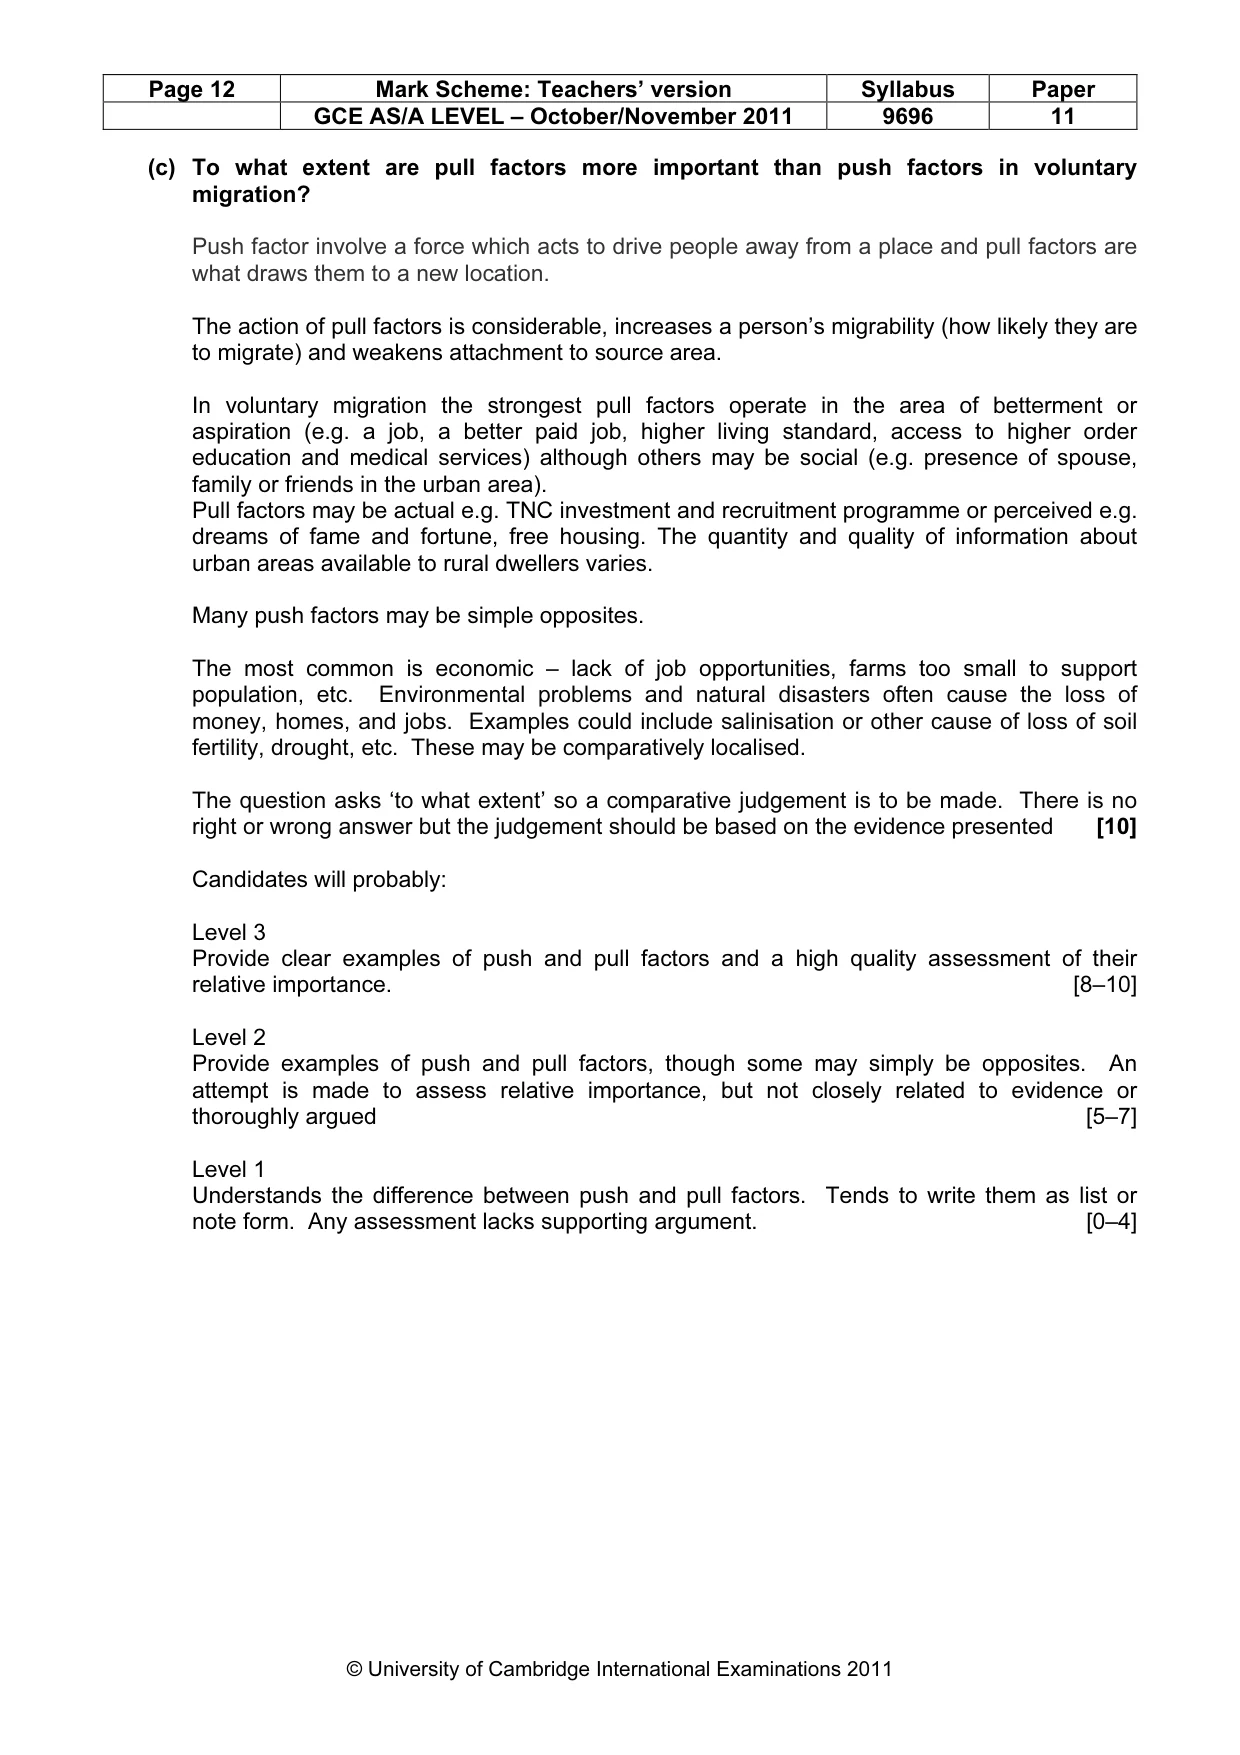
Page 12 Mark Scheme: Teachers’ version Syllabus Paper GCE AS/A LEVEL – October/November 2011 9696 11 © University of Cambridge International Examinations 2011 (c) To what extent are pull factors more important than push factors in voluntary migration? Push factor involve a force which acts to drive people away from a place and pull factors are what draws them to a new location. The action of pull factors is considerable, increases a person’s migrability (how likely they are to migrate) and weakens attachment to source area. In voluntary migration the strongest pull factors operate in the area of betterment or aspiration (e.g. a job, a better paid job, higher living standard, access to higher order education and medical services) although others may be social (e.g. presence of spouse, family or friends in the urban area). Pull factors may be actual e.g. TNC investment and recruitment programme or perceived e.g. dreams of fame and fortune, free housing. The quantity and quality of information about urban areas available to rural dwellers varies. Many push factors may be simple opposites. The most common is economic – lack of job opportunities, farms too small to support population, etc. Environmental problems and natural disasters often cause the loss of money, homes, and jobs. Examples could include salinisation or other cause of loss of soil fertility, drought, etc. These may be comparatively localised. The question asks ‘to what extent’ so a comparative judgement is to be made. There is no right or wrong answer but the judgement should be based on the evidence presented [10] Candidates will probably: Level 3 Provide clear examples of push and pull factors and a high quality assessment of their relative importance. [8–10] Level 2 Provide examples of push and pull factors, though some may simply be opposites. An attempt is made to assess relative importance, but not closely related to evidence or thoroughly argued [5–7] Level 1 Understands the difference between push and pull factors. Tends to write them as list or note form. Any assessment lacks supporting argument. [0–4]
Mark scheme, page 13
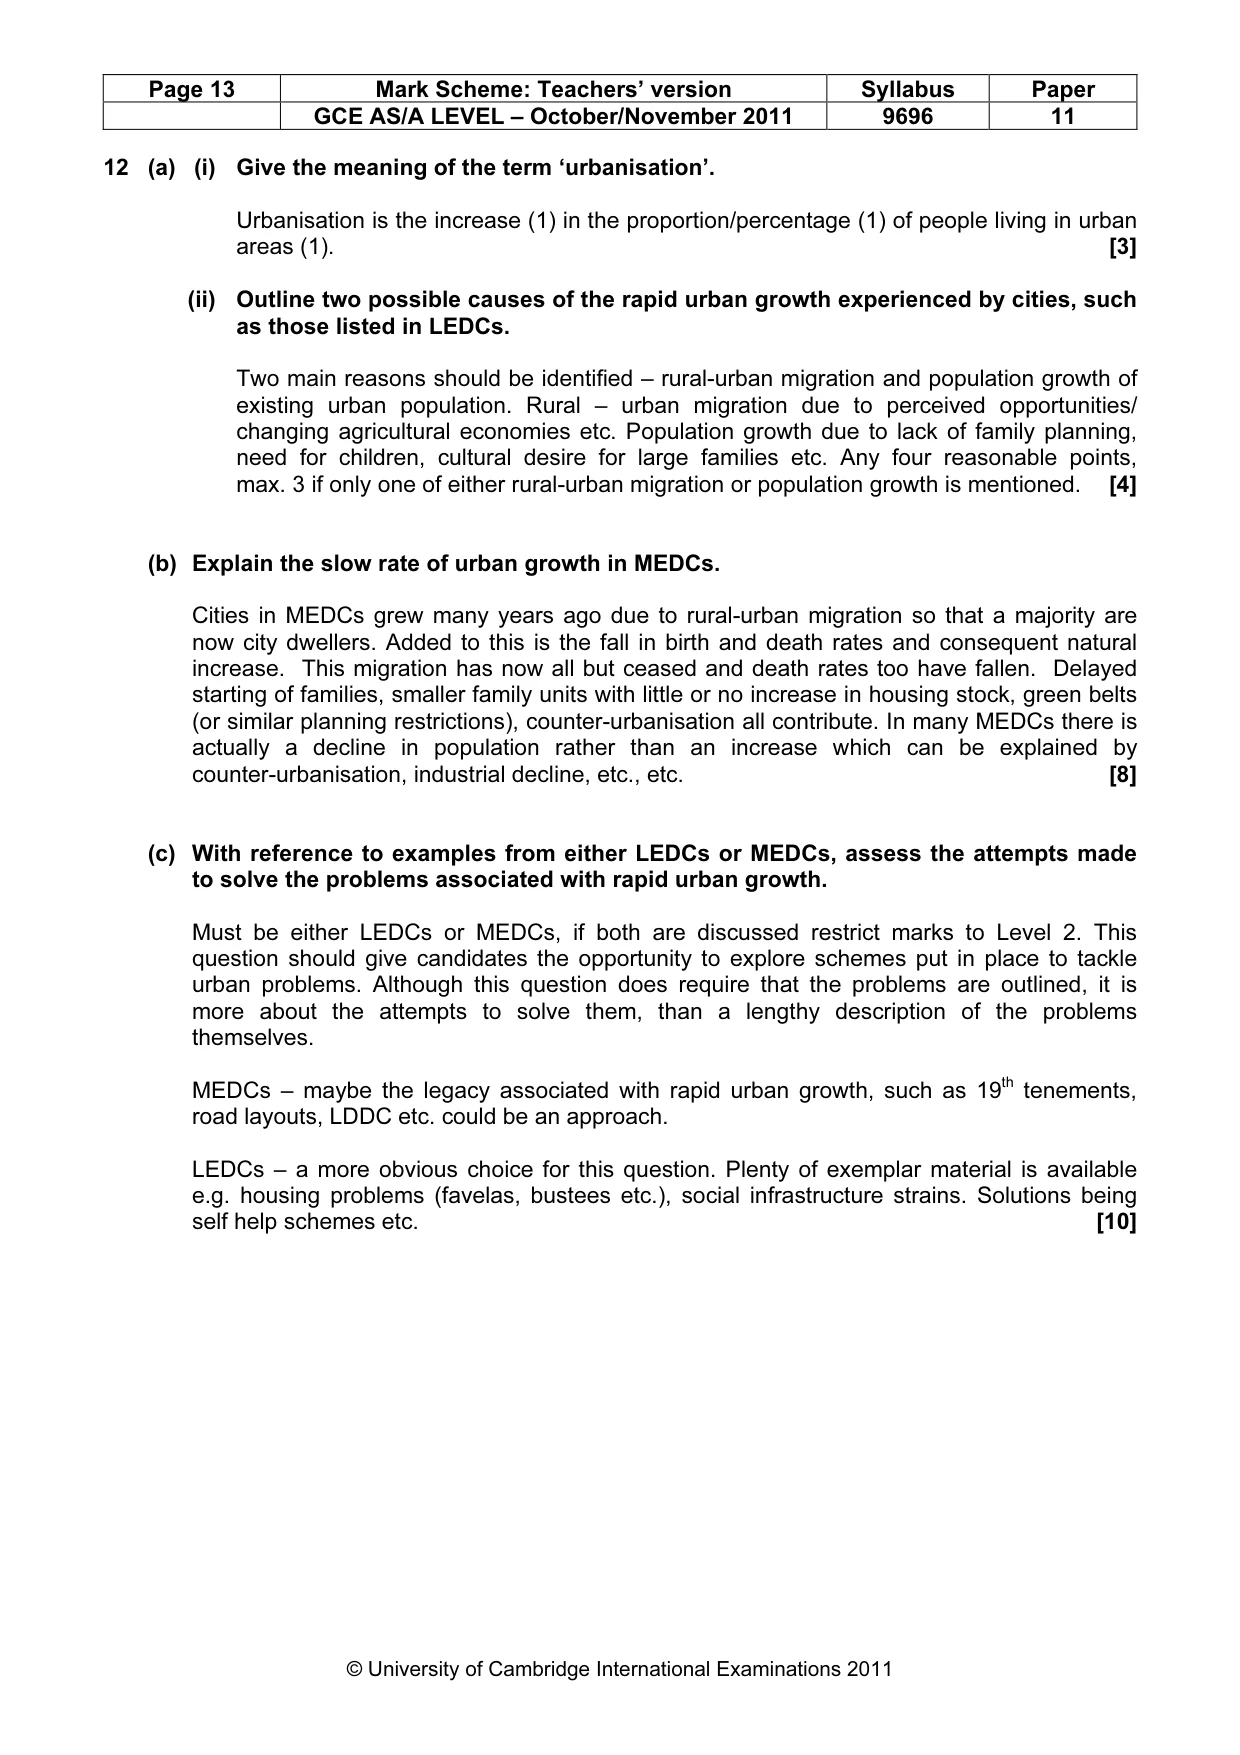
Page 13 Mark Scheme: Teachers’ version Syllabus Paper GCE AS/A LEVEL – October/November 2011 9696 11 © University of Cambridge International Examinations 2011 12 (a) (i) Give the meaning of the term ‘urbanisation’. Urbanisation is the increase (1) in the proportion/percentage (1) of people living in urban areas (1). [3] (ii) Outline two possible causes of the rapid urban growth experienced by cities, such as those listed in LEDCs. Two main reasons should be identified – rural-urban migration and population growth of existing urban population. Rural – urban migration due to perceived opportunities/ changing agricultural economies etc. Population growth due to lack of family planning, need for children, cultural desire for large families etc. Any four reasonable points, max. 3 if only one of either rural-urban migration or population growth is mentioned. [4] (b) Explain the slow rate of urban growth in MEDCs. Cities in MEDCs grew many years ago due to rural-urban migration so that a majority are now city dwellers. Added to this is the fall in birth and death rates and consequent natural increase. This migration has now all but ceased and death rates too have fallen. Delayed starting of families, smaller family units with little or no increase in housing stock, green belts (or similar planning restrictions), counter-urbanisation all contribute. In many MEDCs there is actually a decline in population rather than an increase which can be explained by counter-urbanisation, industrial decline, etc., etc. [8] (c) With reference to examples from either LEDCs or MEDCs, assess the attempts made to solve the problems associated with rapid urban growth. Must be either LEDCs or MEDCs, if both are discussed restrict marks to Level 2. This question should give candidates the opportunity to explore schemes put in place to tackle urban problems. Although this question does require that the problems are outlined, it is more about the attempts to solve them, than a lengthy description of the problems themselves. MEDCs – maybe the legacy associated with rapid urban growth, such as 19th tenements, road layouts, LDDC etc. could be an approach. LEDCs – a more obvious choice for this question. Plenty of exemplar material is available e.g. housing problems (favelas, bustees etc.), social infrastructure strains. Solutions being self help schemes etc. [10]
Mark scheme, page 14
Page 14 Mark Scheme: Teachers’ version Syllabus Paper GCE AS/A LEVEL – October/November 2011 9696 11 © University of Cambridge International Examinations 2011 Candidates will probably: Level 3 Clear and detailed description and explanation. The candidate will comprehensively discuss what was done and why, using well chosen examples. There may also be some critique of the attempted solutions. [8–10] Level 2 A reasonable response that covers both description and explanation, although there may be more emphasis on the description of the solutions, or on the problems themselves. The examples will have some detail and relevance. [5–7] Level 1 Limited response, basic statements of the problems, possibly not specified examples. Little more than e.g. self help in Rio or not even a mention of the solutions. [0–4]
What you needed in this session
Cambridge’s own grade thresholds for 2011 Oct/Nov, Paper 1 · Variant 1. A higher threshold means an easier paper — the bar moves with how the cohort did.