Cambridge A Level Geography 9696 — 2011 May/June Paper 1 · Variant 1
9696/11/M/J/11 · 100 marks · ≈113 min
The question paper and its mark scheme, free to read here and free to download. This is Cambridge’s own paper, exactly as it was sat.
Question paper8 pages



Mark scheme13 pages
Answers below. Sit the paper first if you are practising.
Paper as text
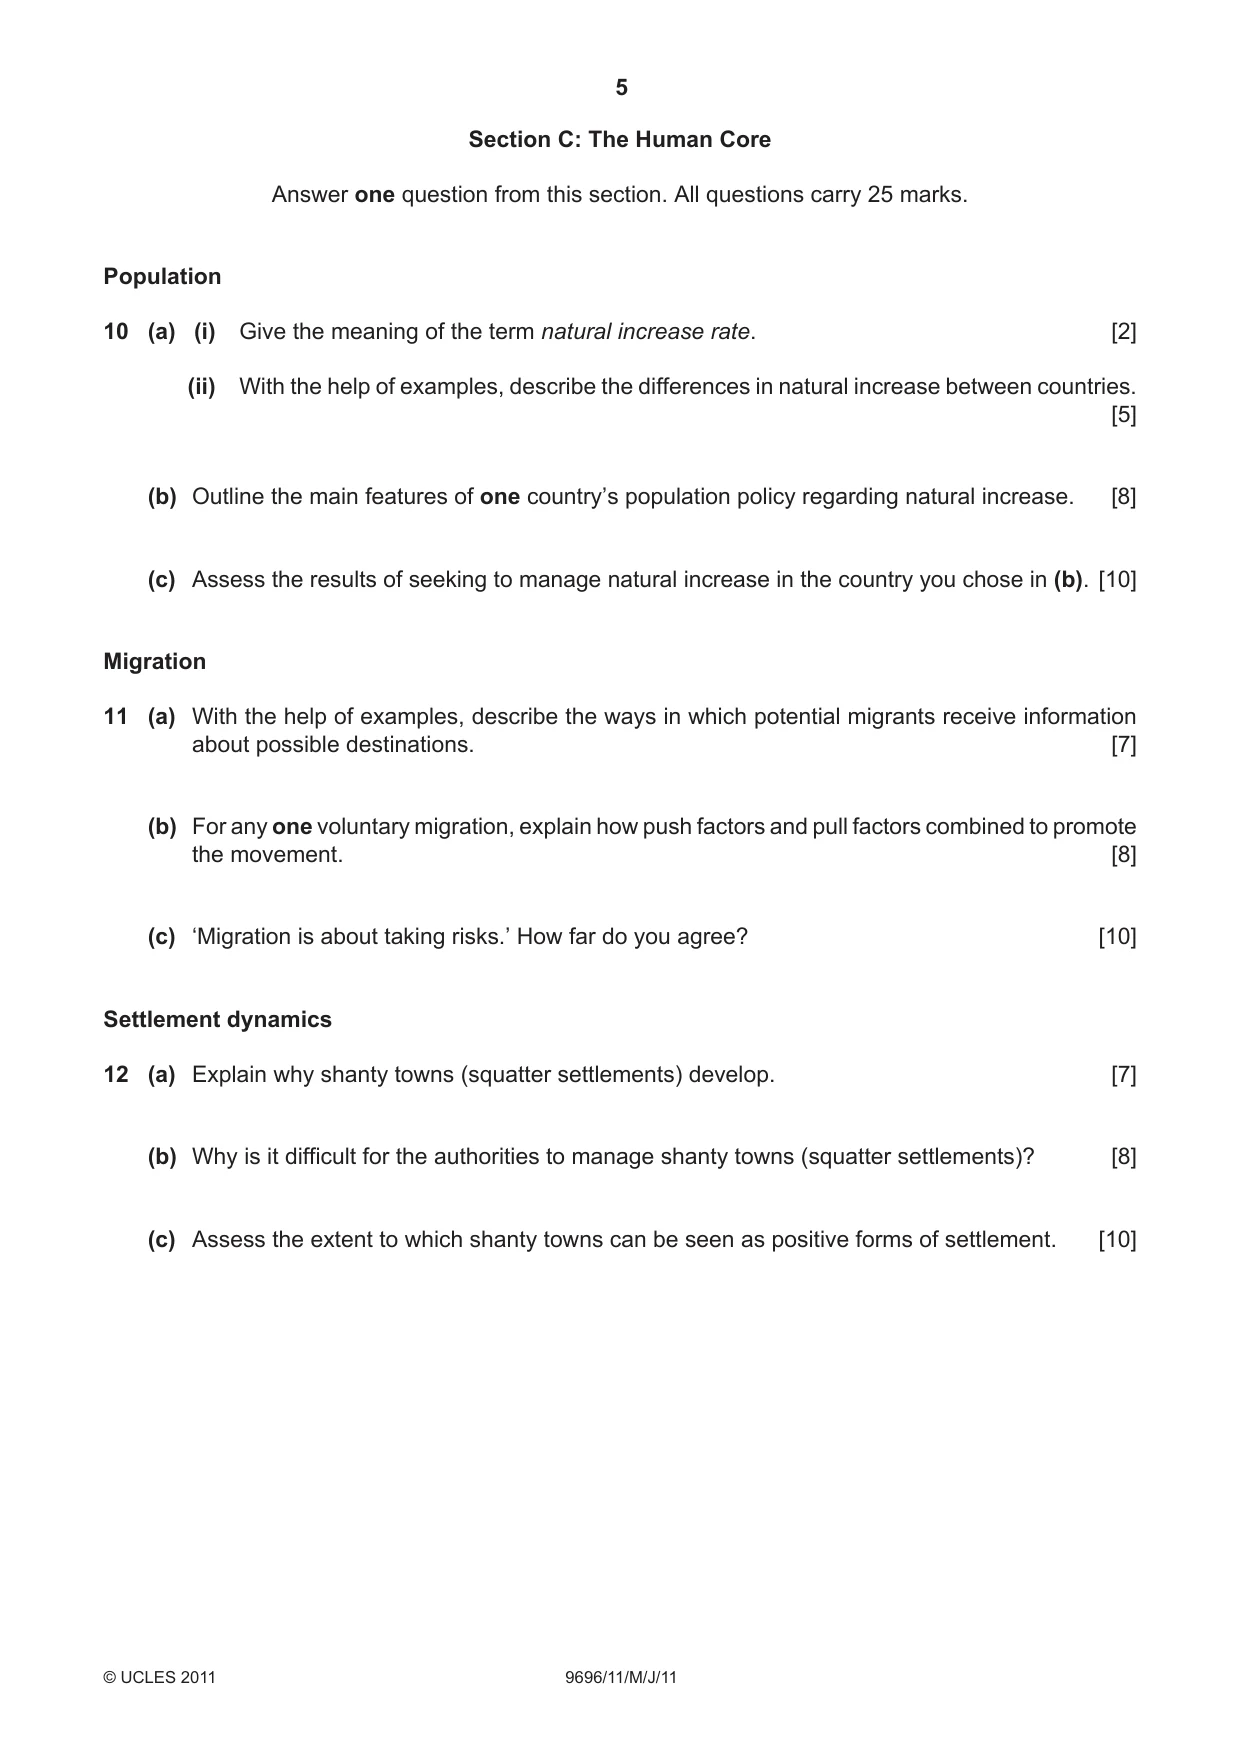
Question paper, page 1
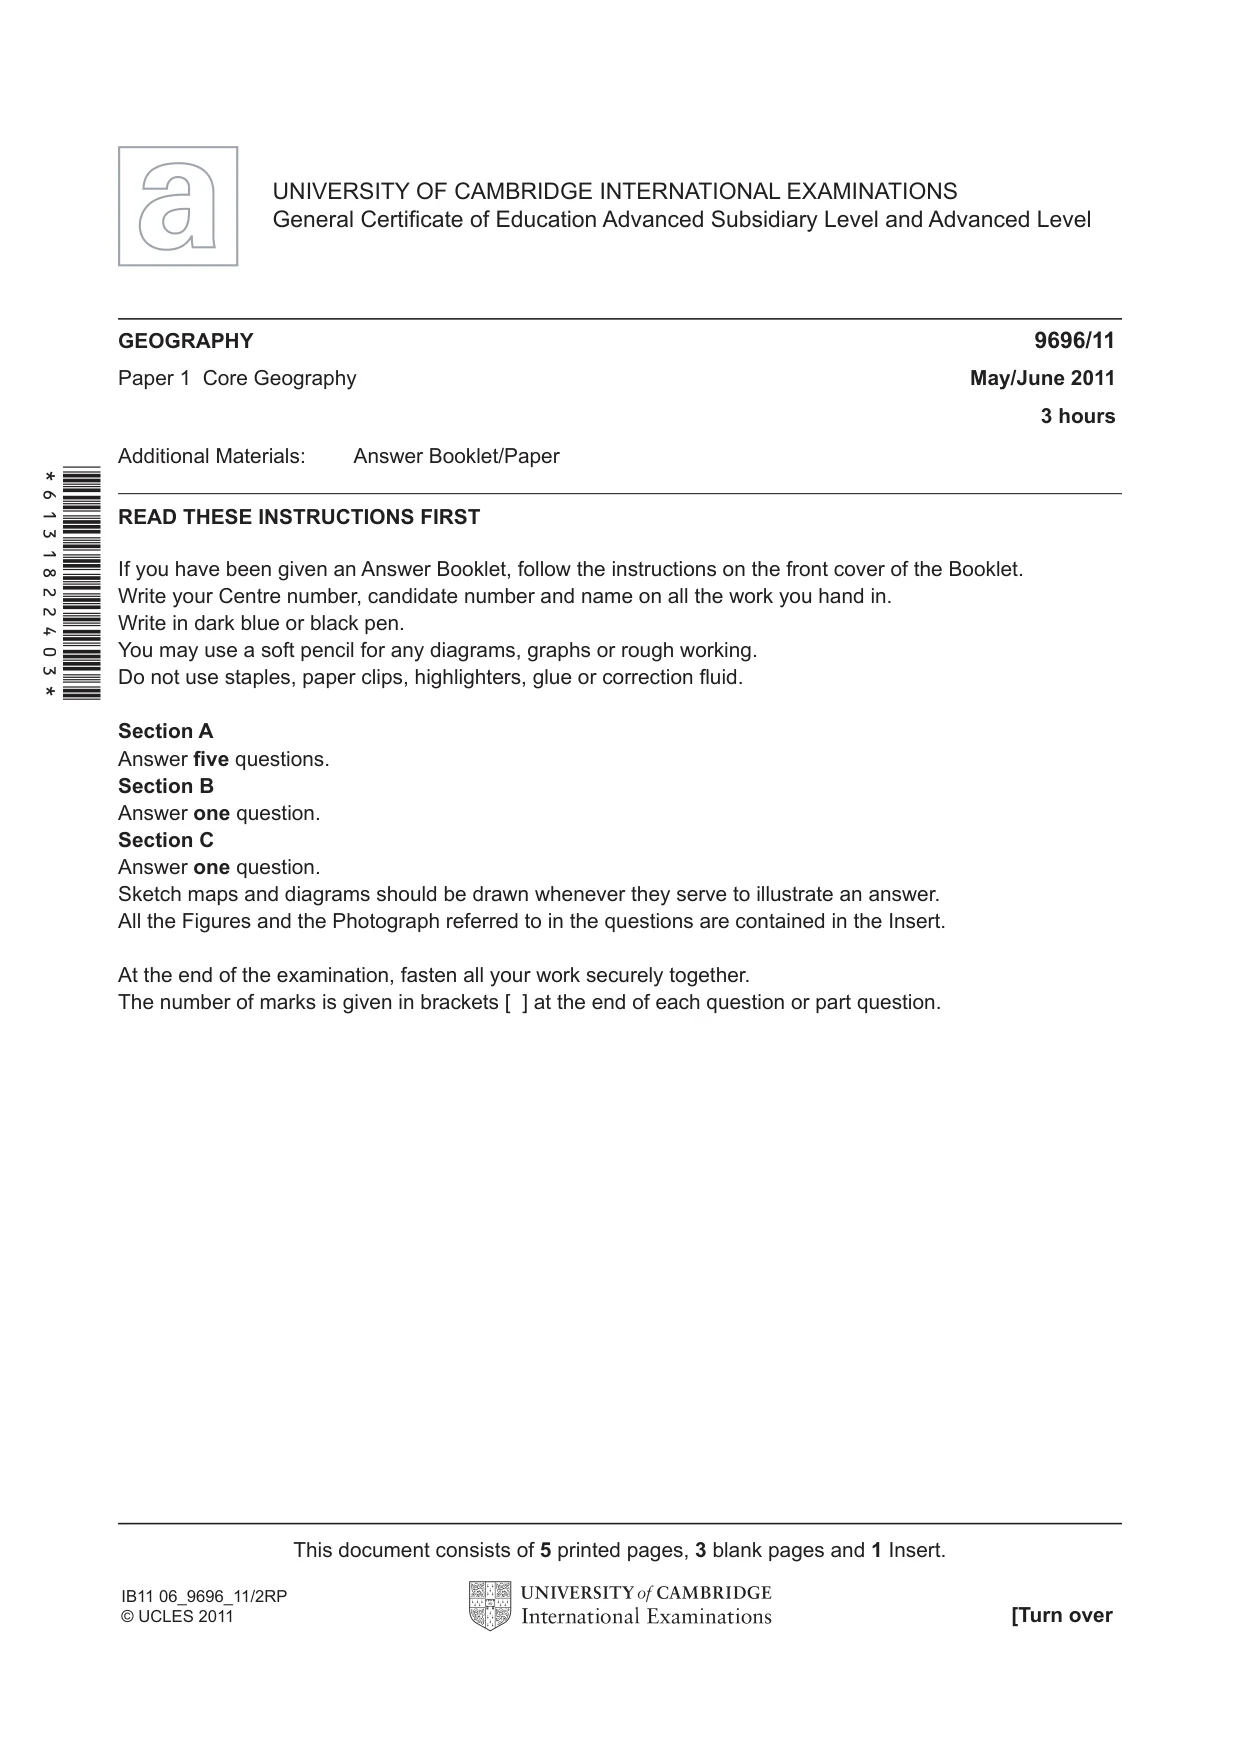
READ THESE INSTRUCTIONS FIRST If you have been given an Answer Booklet, follow the instructions on the front cover of the Booklet. Write your Centre number, candidate number and name on all the work you hand in. Write in dark blue or black pen. You may use a soft pencil for any diagrams, graphs or rough working. Do not use staples, paper clips, highlighters, glue or correction fl uid. Section A Answer fi ve questions. Section B Answer one question. Section C Answer one question. Sketch maps and diagrams should be drawn whenever they serve to illustrate an answer. All the Figures and the Photograph referred to in the questions are contained in the Insert. At the end of the examination, fasten all your work securely together. The number of marks is given in brackets [ ] at the end of each question or part question. GEOGRAPHY 9696/11 Paper 1 Core Geography May/June 2011 3 hours Additional Materials: Answer Booklet/Paper UNIVERSITY OF CAMBRIDGE INTERNATIONAL EXAMINATIONS General Certifi cate of Education Advanced Subsidiary Level and Advanced Level This document consists of 5 printed pages, 3 blank pages and 1 Insert. [Turn over IB11 06_9696_11/2RP © UCLES 2011 *6131822403*
Question paper, page 2
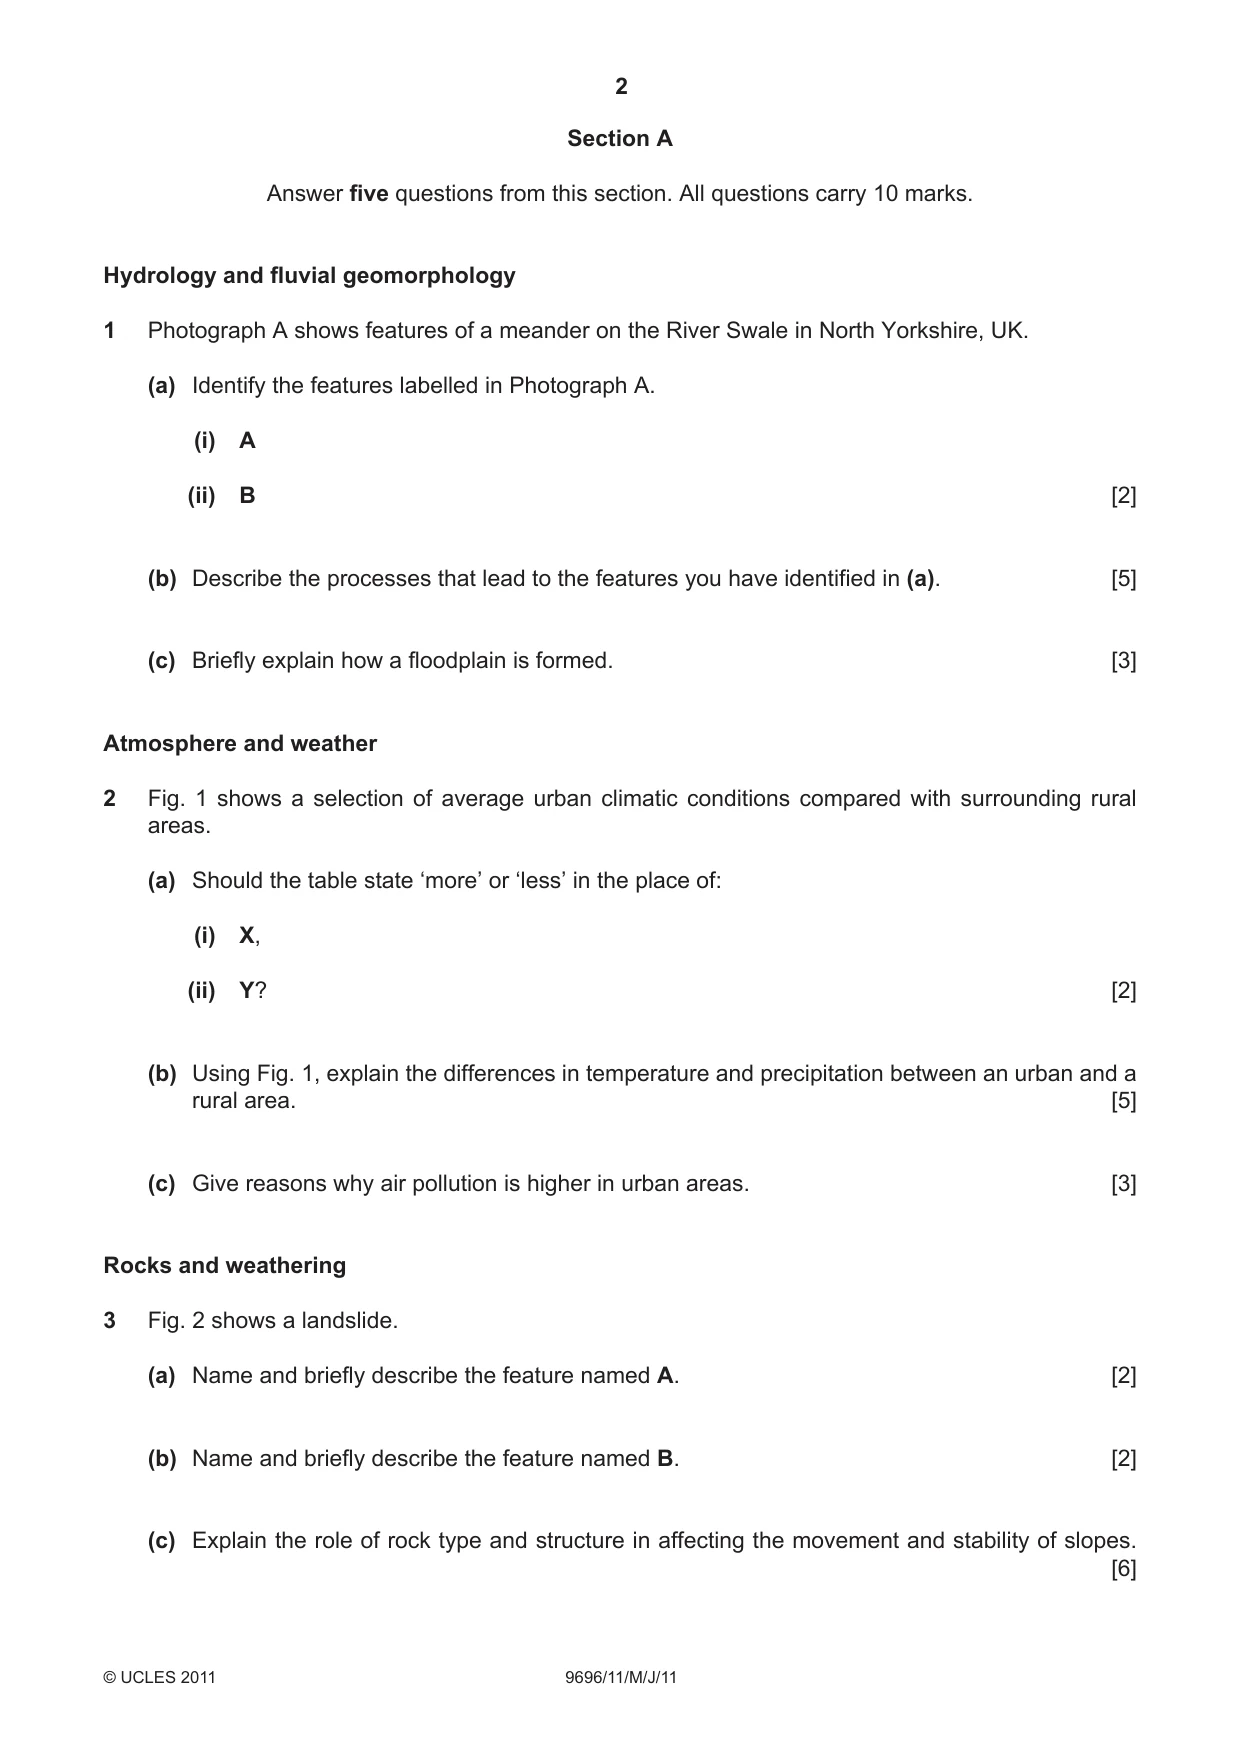
2 9696/11/M/J/11 © UCLES 2011 Section A Answer five questions from this section. All questions carry 10 marks. Hydrology and fluvial geomorphology 1 Photograph A shows features of a meander on the River Swale in North Yorkshire, UK. (a) Identify the features labelled in Photograph A. (i) A (ii) B [2] (b) Describe the processes that lead to the features you have identified in (a). [5] (c) Briefly explain how a floodplain is formed. [3] Atmosphere and weather 2 Fig. 1 shows a selection of average urban climatic conditions compared with surrounding rural areas. (a) Should the table state ‘more’ or ‘less’ in the place of: (i) X, (ii) Y? [2] (b) Using Fig. 1, explain the differences in temperature and precipitation between an urban and a rural area. [5] (c) Give reasons why air pollution is higher in urban areas. [3] Rocks and weathering 3 Fig. 2 shows a landslide. (a) Name and briefly describe the feature named A. [2] (b) Name and briefly describe the feature named B. [2] (c) Explain the role of rock type and structure in affecting the movement and stability of slopes. [6]
Question paper, page 3
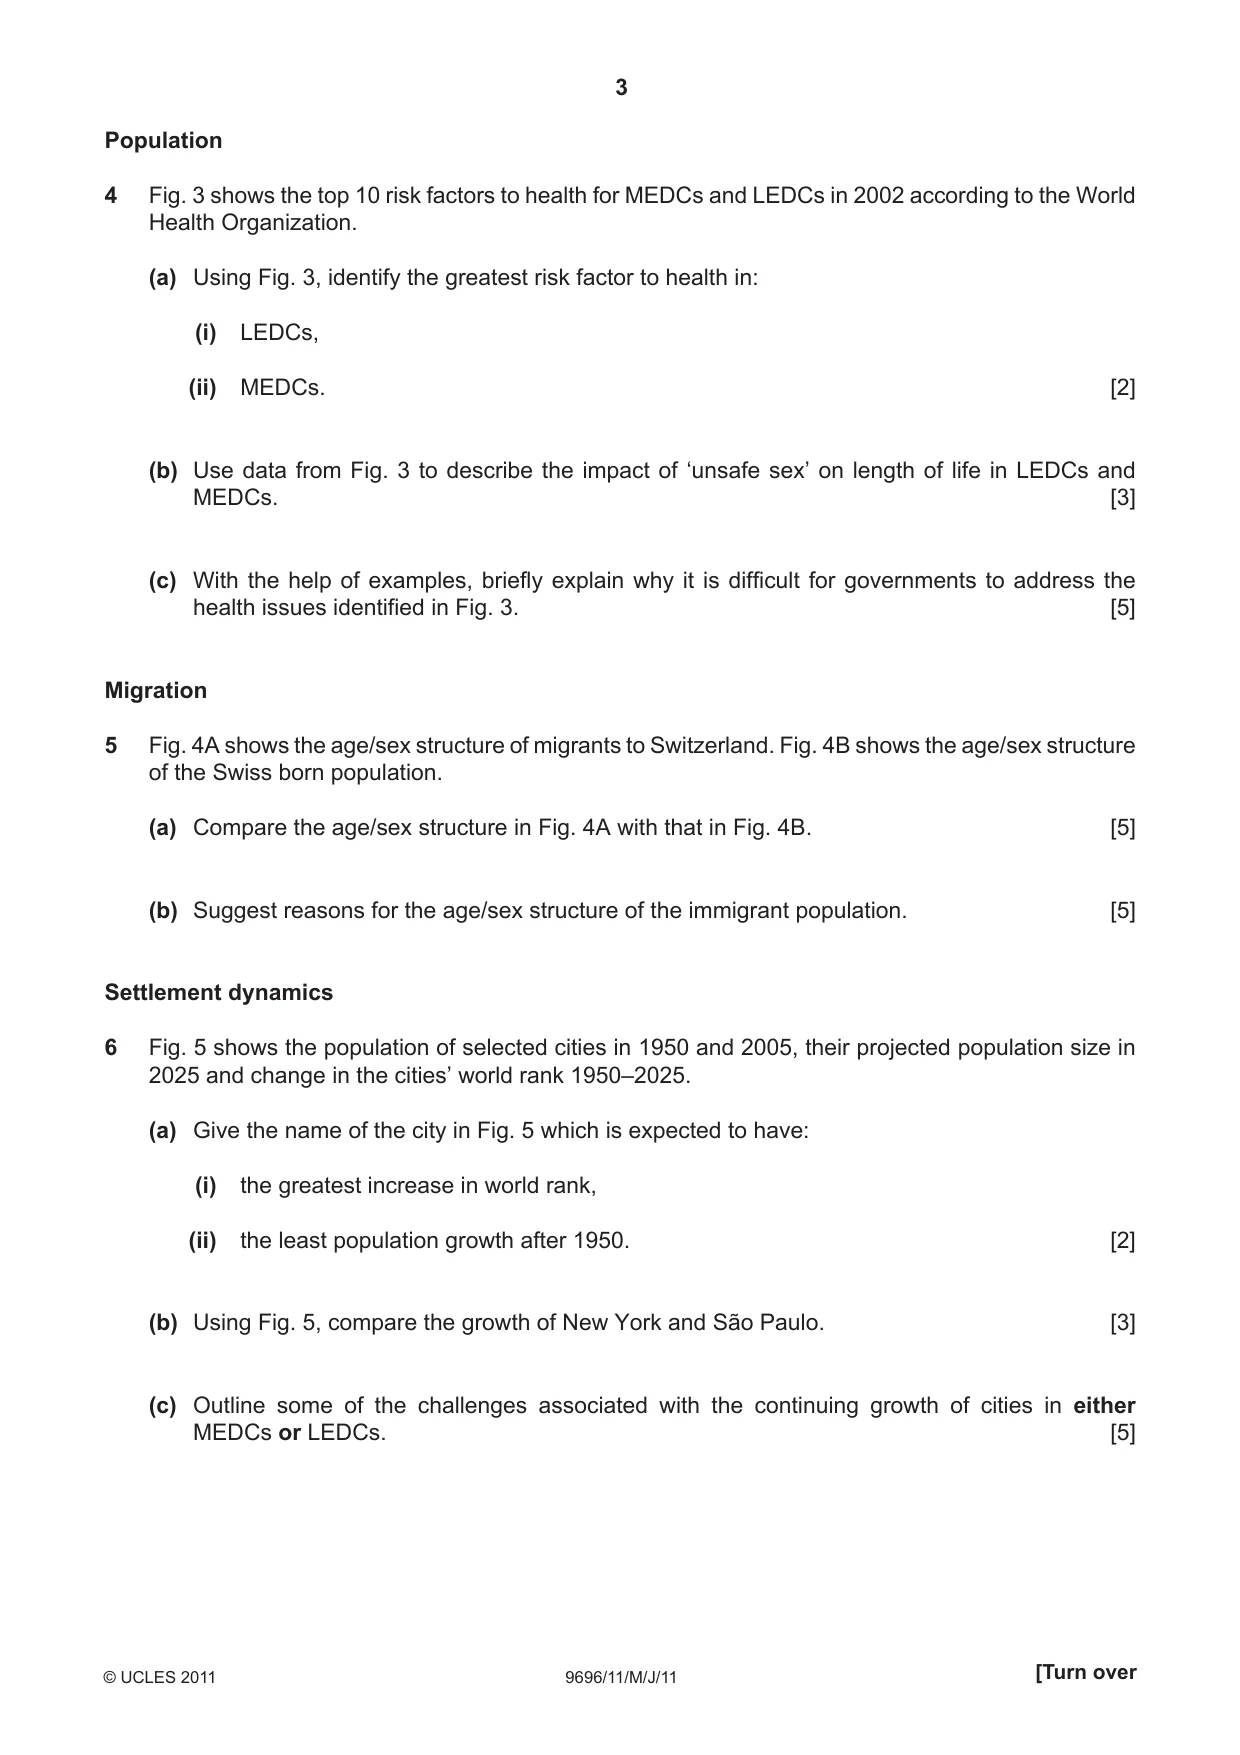
3 9696/11/M/J/11 © UCLES 2011 [Turn over Population 4 Fig. 3 shows the top 10 risk factors to health for MEDCs and LEDCs in 2002 according to the World Health Organization. (a) Using Fig. 3, identify the greatest risk factor to health in: (i) LEDCs, (ii) MEDCs. [2] (b) Use data from Fig. 3 to describe the impact of ‘unsafe sex’ on length of life in LEDCs and MEDCs. [3] (c) With the help of examples, briefly explain why it is difficult for governments to address the health issues identified in Fig. 3. [5] Migration 5 Fig. 4A shows the age/sex structure of migrants to Switzerland. Fig. 4B shows the age/sex structure of the Swiss born population. (a) Compare the age/sex structure in Fig. 4A with that in Fig. 4B. [5] (b) Suggest reasons for the age/sex structure of the immigrant population. [5] Settlement dynamics 6 Fig. 5 shows the population of selected cities in 1950 and 2005, their projected population size in 2025 and change in the cities’ world rank 1950–2025. (a) Give the name of the city in Fig. 5 which is expected to have: (i) the greatest increase in world rank, (ii) the least population growth after 1950. [2] (b) Using Fig. 5, compare the growth of New York and São Paulo. [3] (c) Outline some of the challenges associated with the continuing growth of cities in either MEDCs or LEDCs. [5]
Question paper, page 4
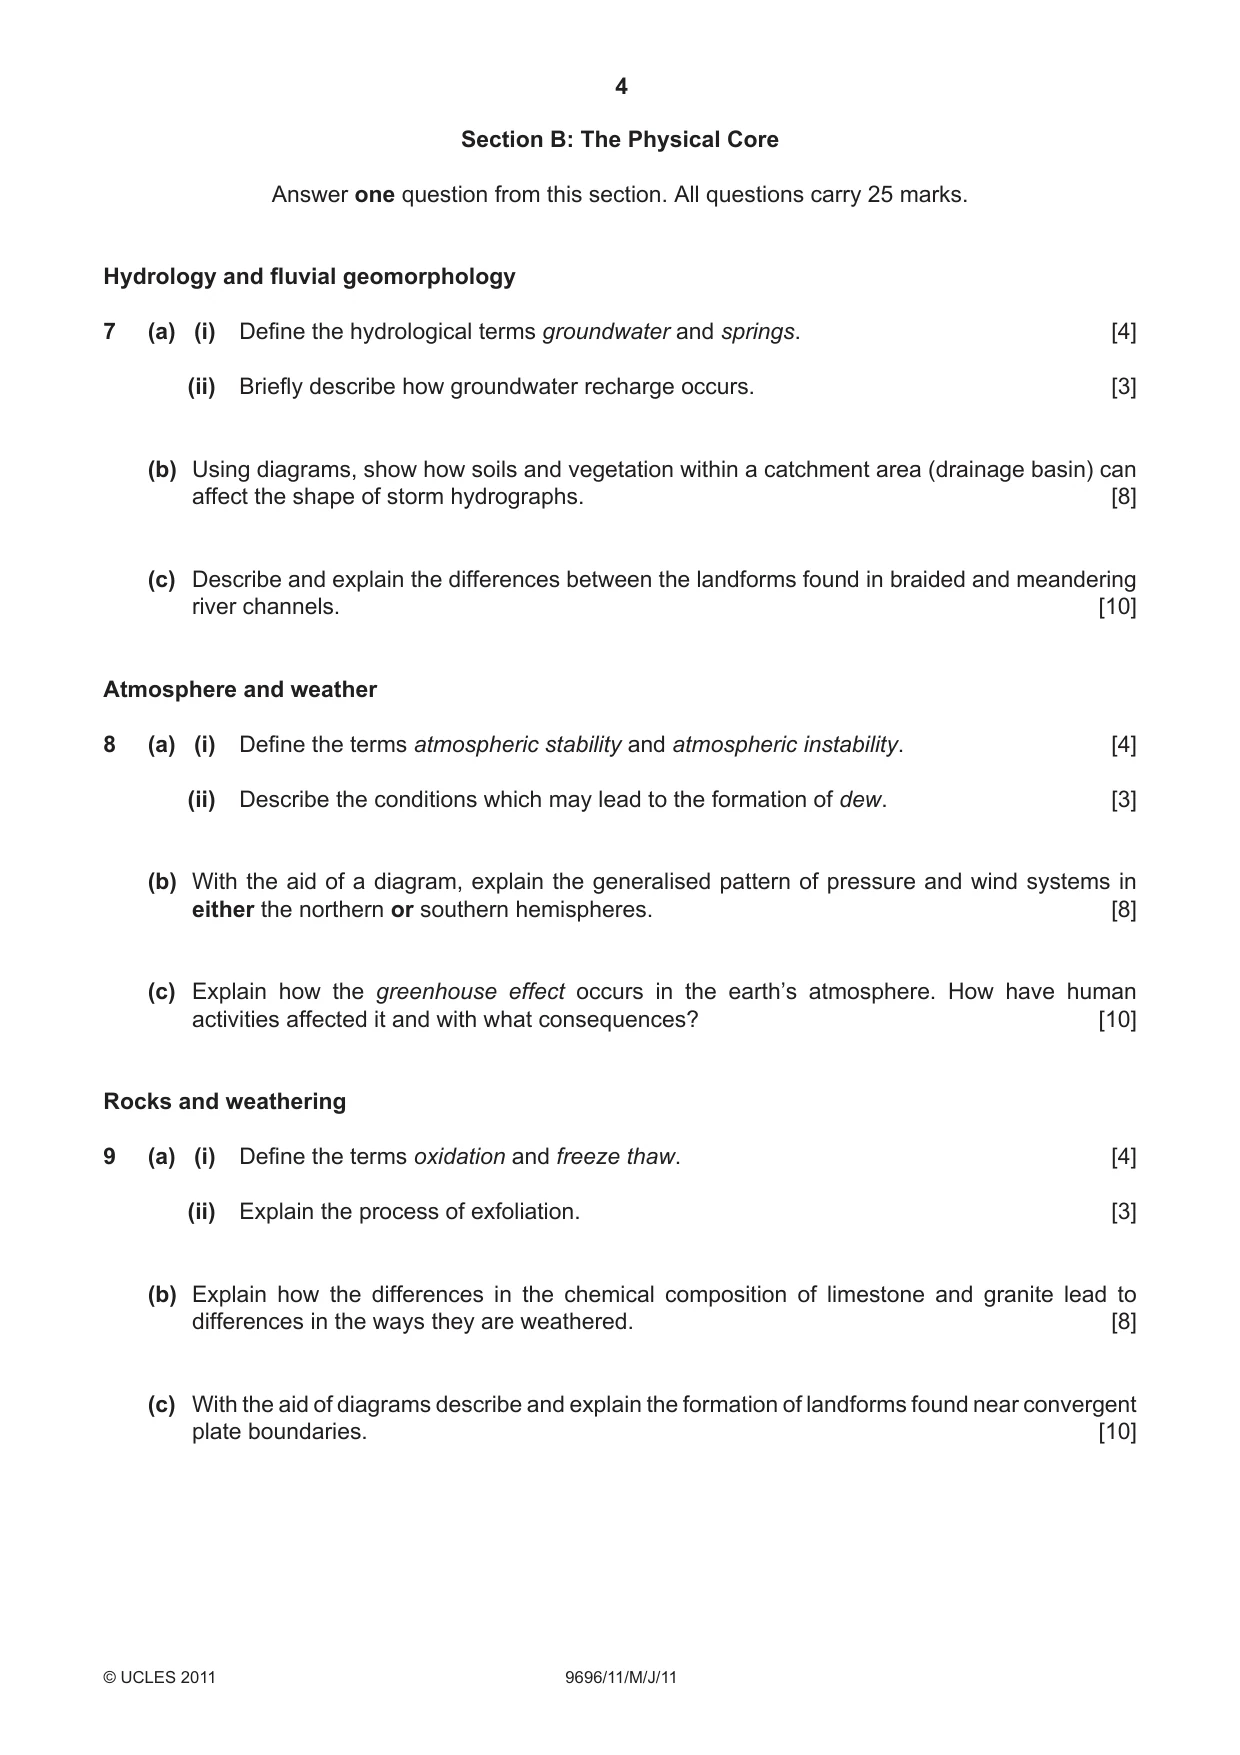
4 9696/11/M/J/11 © UCLES 2011 Section B: The Physical Core Answer one question from this section. All questions carry 25 marks. Hydrology and fluvial geomorphology 7 (a) (i) Define the hydrological terms groundwater and springs. [4] (ii) Briefly describe how groundwater recharge occurs. [3] (b) Using diagrams, show how soils and vegetation within a catchment area (drainage basin) can affect the shape of storm hydrographs. [8] (c) Describe and explain the differences between the landforms found in braided and meandering river channels. [10] Atmosphere and weather 8 (a) (i) Define the terms atmospheric stability and atmospheric instability. [4] (ii) Describe the conditions which may lead to the formation of dew. [3] (b) With the aid of a diagram, explain the generalised pattern of pressure and wind systems in either the northern or southern hemispheres. [8] (c) Explain how the greenhouse effect occurs in the earth’s atmosphere. How have human activities affected it and with what consequences? [10] Rocks and weathering 9 (a) (i) Define the terms oxidation and freeze thaw. [4] (ii) Explain the process of exfoliation. [3] (b) Explain how the differences in the chemical composition of limestone and granite lead to differences in the ways they are weathered. [8] (c) With the aid of diagrams describe and explain the formation of landforms found near convergent plate boundaries. [10]
Question paper, page 5
5 9696/11/M/J/11 © UCLES 2011 [Turn over Section C: The Human Core Answer one question from this section. All questions carry 25 marks. Population 10 (a) (i) Give the meaning of the term natural increase rate. [2] (ii) With the help of examples, describe the differences in natural increase between countries. [5] (b) Outline the main features of one country’s population policy regarding natural increase. [8] (c) Assess the results of seeking to manage natural increase in the country you chose in (b). [10] Migration 11 (a) With the help of examples, describe the ways in which potential migrants receive information about possible destinations. [7] (b) For any one voluntary migration, explain how push factors and pull factors combined to promote the movement. [8] (c) ‘Migration is about taking risks.’ How far do you agree? [10] Settlement dynamics 12 (a) Explain why shanty towns (squatter settlements) develop. [7] (b) Why is it difficult for the authorities to manage shanty towns (squatter settlements)? [8] (c) Assess the extent to which shanty towns can be seen as positive forms of settlement. [10]
Question paper, page 6
6 9696/11/M/J/11 © UCLES 2011 BLANK PAGE
Question paper, page 7
7 9696/11/M/J/11 © UCLES 2011 [Turn over BLANK PAGE
Question paper, page 8
8 Copyright Acknowledgements: Question 1 Liz Donoghue; © UCLES. Question 4 © Geofi le Online No.578; Global patterns of death, disease and health; Nelson Thornes Ltd; September 2008. Question 5 © www.migrationinformation.org/USfocus/display.cfm?ID=284; 10 June 2010. Question 6 © Raconteur on Smart Cities; Total projected population by 2028; http:/np.netpublicator.com/netpublication/n04578744/5. Permission to reproduce items where third-party owned material protected by copyright is included has been sought and cleared where possible. Every reasonable effort has been made by the publisher (UCLES) to trace copyright holders, but if any items requiring clearance have unwittingly been included, the publisher will be pleased to make amends at the earliest possible opportunity. University of Cambridge International Examinations is part of the Cambridge Assessment Group. Cambridge Assessment is the brand name of University of Cambridge Local Examinations Syndicate (UCLES), which is itself a department of the University of Cambridge. 9696/11/M/J/11 © UCLES 2011 BLANK PAGE
Mark scheme, page 1
UNIVERSITY OF CAMBRIDGE INTERNATIONAL EXAMINATIONS GCE Advanced Subsidiary Level and GCE Advanced Level MARK SCHEME for the May/June 2011 question paper for the guidance of teachers 9696 GEOGRAPHY 9696/11 Paper 1 (Core Geography), maximum raw mark 100 This mark scheme is published as an aid to teachers and candidates, to indicate the requirements of the examination. It shows the basis on which Examiners were instructed to award marks. It does not indicate the details of the discussions that took place at an Examiners’ meeting before marking began, which would have considered the acceptability of alternative answers. Mark schemes must be read in conjunction with the question papers and the report on the examination. • Cambridge will not enter into discussions or correspondence in connection with these mark schemes. Cambridge is publishing the mark schemes for the May/June 2011 question papers for most IGCSE, GCE Advanced Level and Advanced Subsidiary Level syllabuses and some Ordinary Level syllabuses.
Mark scheme, page 2
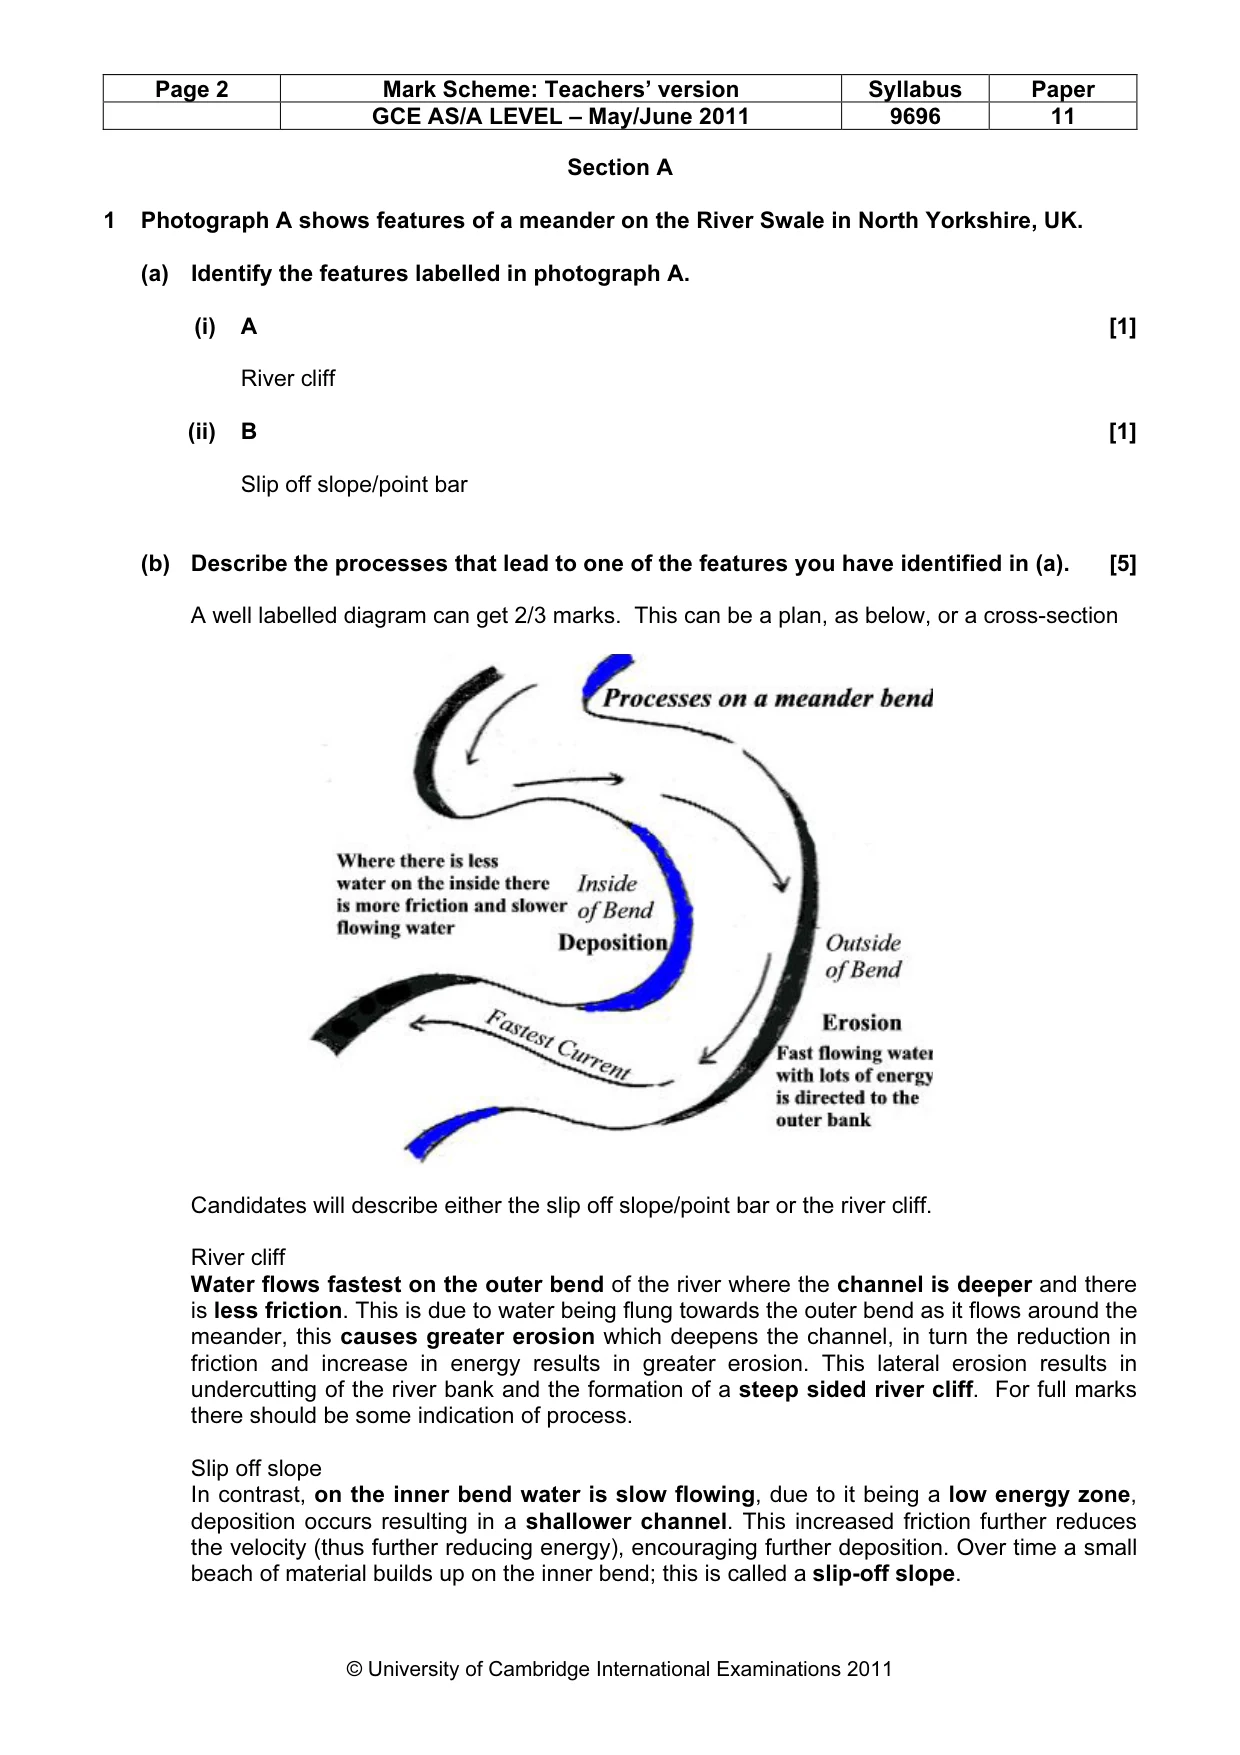
Page 2 Mark Scheme: Teachers’ version Syllabus Paper GCE AS/A LEVEL – May/June 2011 9696 11 © University of Cambridge International Examinations 2011 Section A 1 Photograph A shows features of a meander on the River Swale in North Yorkshire, UK. (a) Identify the features labelled in photograph A. (i) A [1] River cliff (ii) B [1] Slip off slope/point bar (b) Describe the processes that lead to one of the features you have identified in (a). [5] A well labelled diagram can get 2/3 marks. This can be a plan, as below, or a cross-section Candidates will describe either the slip off slope/point bar or the river cliff. River cliff Water flows fastest on the outer bend of the river where the channel is deeper and there is less friction. This is due to water being flung towards the outer bend as it flows around the meander, this causes greater erosion which deepens the channel, in turn the reduction in friction and increase in energy results in greater erosion. This lateral erosion results in undercutting of the river bank and the formation of a steep sided river cliff. For full marks there should be some indication of process. Slip off slope In contrast, on the inner bend water is slow flowing, due to it being a low energy zone, deposition occurs resulting in a shallower channel. This increased friction further reduces the velocity (thus further reducing energy), encouraging further deposition. Over time a small beach of material builds up on the inner bend; this is called a slip-off slope.
Mark scheme, page 3
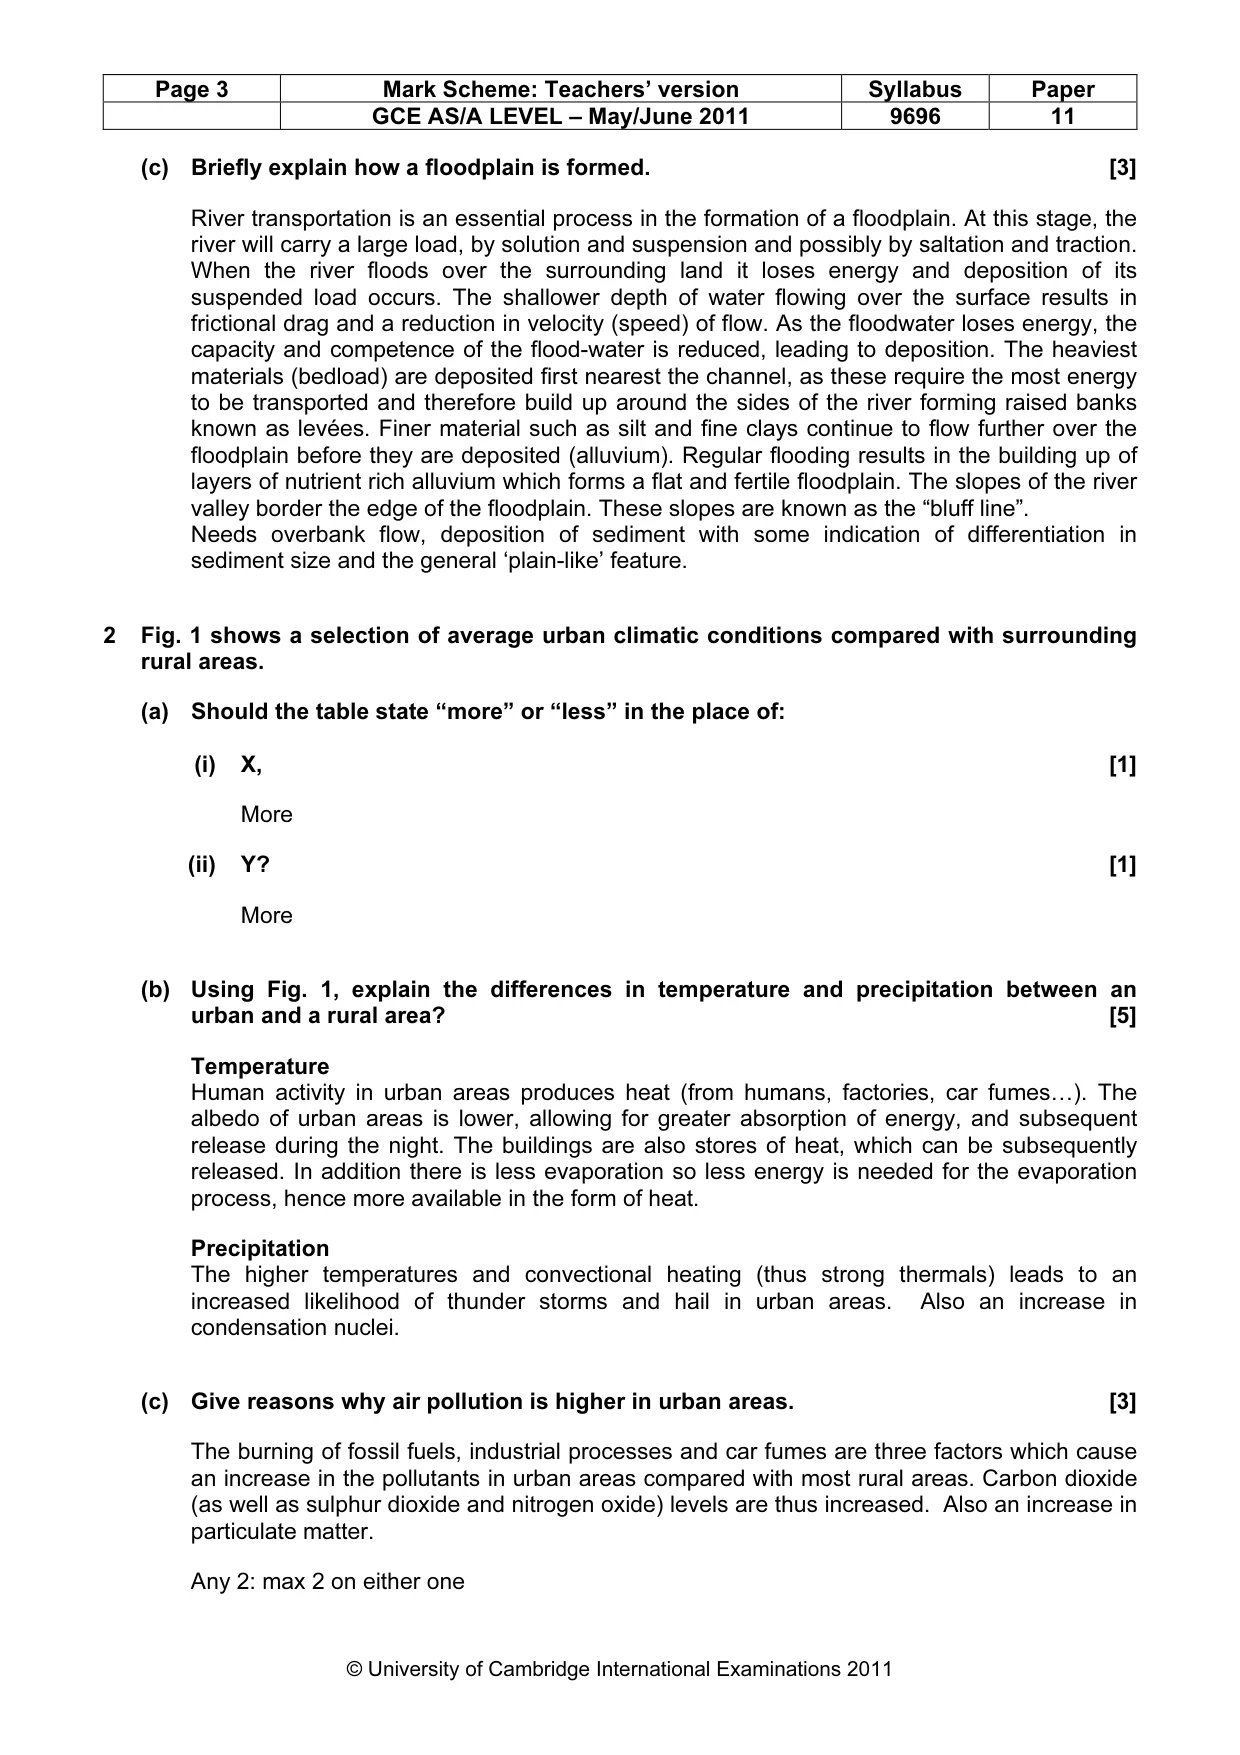
Page 3 Mark Scheme: Teachers’ version Syllabus Paper GCE AS/A LEVEL – May/June 2011 9696 11 © University of Cambridge International Examinations 2011 (c) Briefly explain how a floodplain is formed. [3] River transportation is an essential process in the formation of a floodplain. At this stage, the river will carry a large load, by solution and suspension and possibly by saltation and traction. When the river floods over the surrounding land it loses energy and deposition of its suspended load occurs. The shallower depth of water flowing over the surface results in frictional drag and a reduction in velocity (speed) of flow. As the floodwater loses energy, the capacity and competence of the flood-water is reduced, leading to deposition. The heaviest materials (bedload) are deposited first nearest the channel, as these require the most energy to be transported and therefore build up around the sides of the river forming raised banks known as levées. Finer material such as silt and fine clays continue to flow further over the floodplain before they are deposited (alluvium). Regular flooding results in the building up of layers of nutrient rich alluvium which forms a flat and fertile floodplain. The slopes of the river valley border the edge of the floodplain. These slopes are known as the “bluff line”. Needs overbank flow, deposition of sediment with some indication of differentiation in sediment size and the general ‘plain-like’ feature. 2 Fig. 1 shows a selection of average urban climatic conditions compared with surrounding rural areas. (a) Should the table state “more” or “less” in the place of: (i) X, [1] More (ii) Y? [1] More (b) Using Fig. 1, explain the differences in temperature and precipitation between an urban and a rural area? [5] Temperature Human activity in urban areas produces heat (from humans, factories, car fumes…). The albedo of urban areas is lower, allowing for greater absorption of energy, and subsequent release during the night. The buildings are also stores of heat, which can be subsequently released. In addition there is less evaporation so less energy is needed for the evaporation process, hence more available in the form of heat. Precipitation The higher temperatures and convectional heating (thus strong thermals) leads to an increased likelihood of thunder storms and hail in urban areas. Also an increase in condensation nuclei. (c) Give reasons why air pollution is higher in urban areas. [3] The burning of fossil fuels, industrial processes and car fumes are three factors which cause an increase in the pollutants in urban areas compared with most rural areas. Carbon dioxide (as well as sulphur dioxide and nitrogen oxide) levels are thus increased. Also an increase in particulate matter. Any 2: max 2 on either one
Mark scheme, page 4
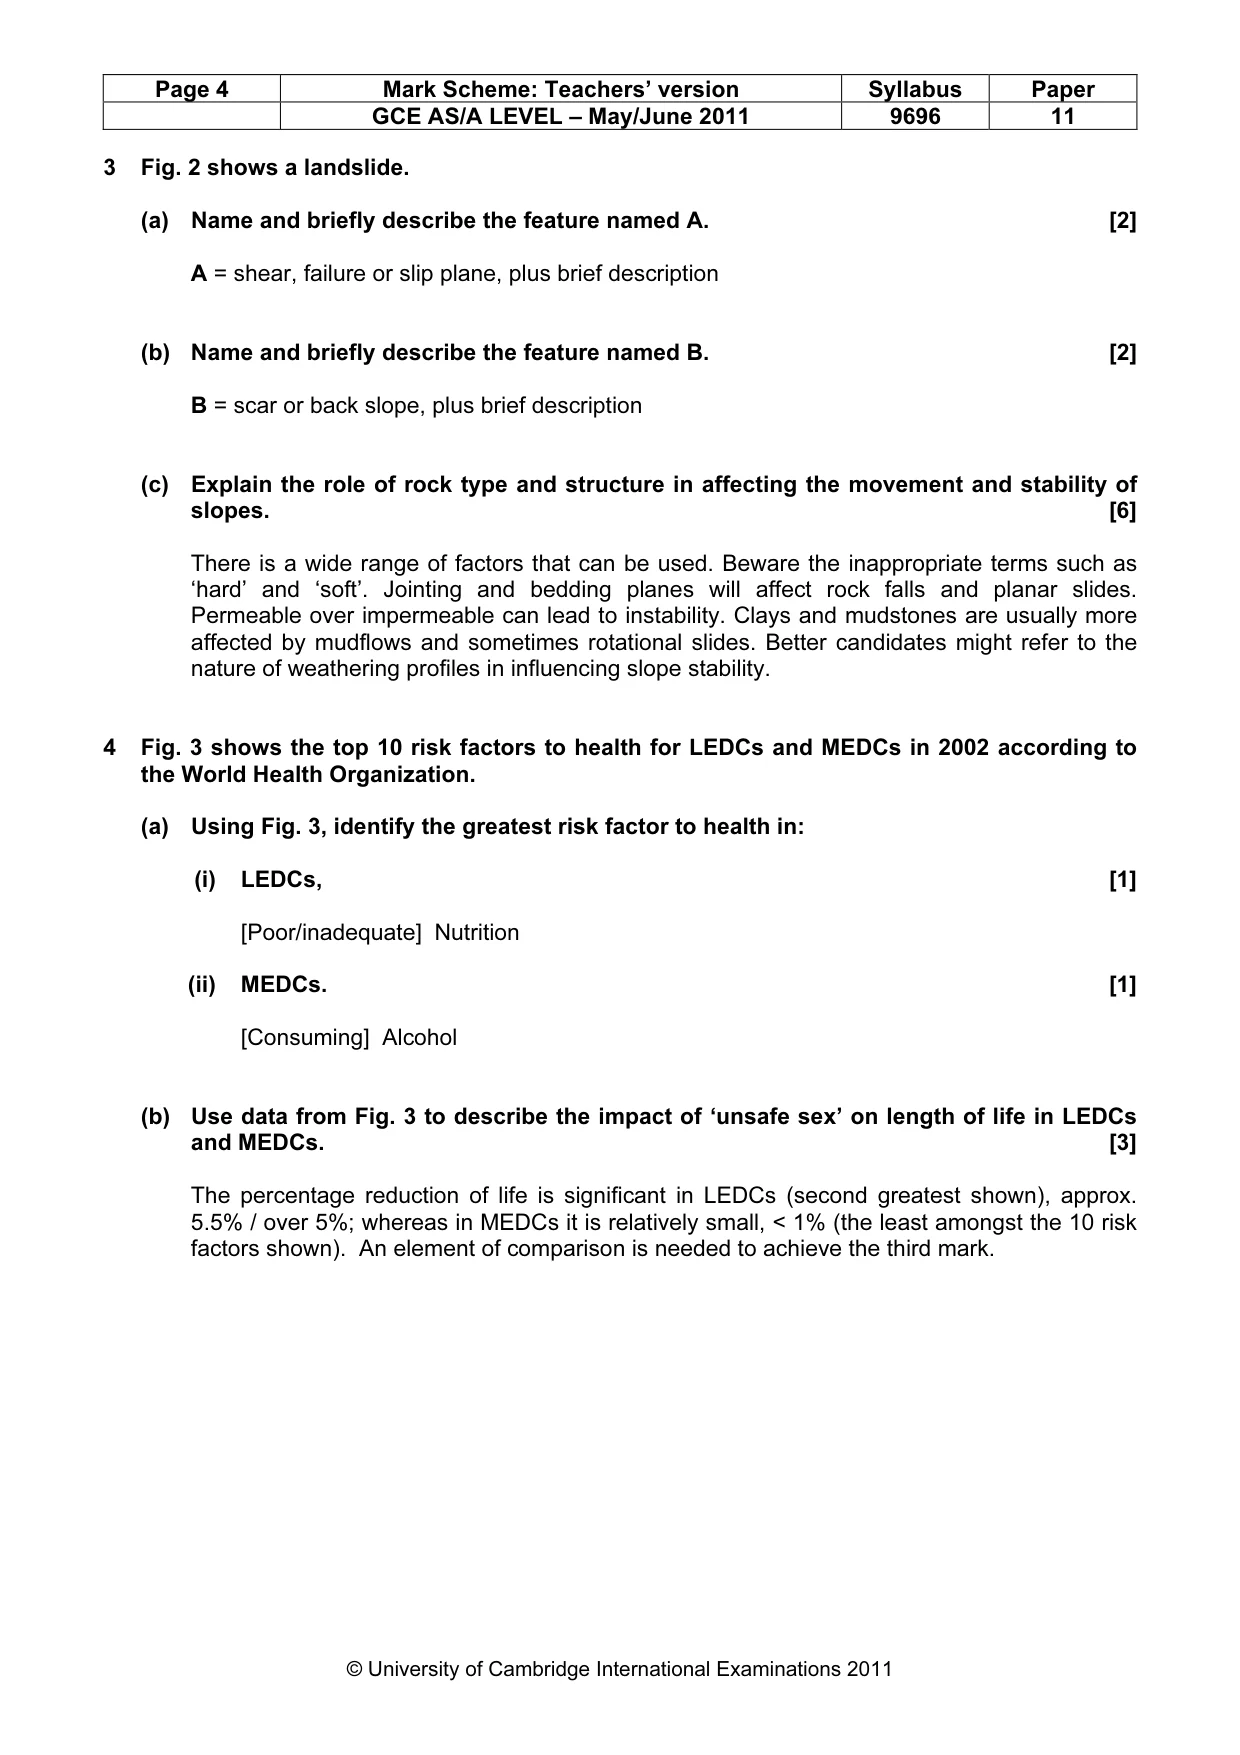
Page 4 Mark Scheme: Teachers’ version Syllabus Paper GCE AS/A LEVEL – May/June 2011 9696 11 © University of Cambridge International Examinations 2011 3 Fig. 2 shows a landslide. (a) Name and briefly describe the feature named A. [2] A = shear, failure or slip plane, plus brief description (b) Name and briefly describe the feature named B. [2] B = scar or back slope, plus brief description (c) Explain the role of rock type and structure in affecting the movement and stability of slopes. [6] There is a wide range of factors that can be used. Beware the inappropriate terms such as ‘hard’ and ‘soft’. Jointing and bedding planes will affect rock falls and planar slides. Permeable over impermeable can lead to instability. Clays and mudstones are usually more affected by mudflows and sometimes rotational slides. Better candidates might refer to the nature of weathering profiles in influencing slope stability. 4 Fig. 3 shows the top 10 risk factors to health for LEDCs and MEDCs in 2002 according to the World Health Organization. (a) Using Fig. 3, identify the greatest risk factor to health in: (i) LEDCs, [1] [Poor/inadequate] Nutrition (ii) MEDCs. [1] [Consuming] Alcohol (b) Use data from Fig. 3 to describe the impact of ‘unsafe sex’ on length of life in LEDCs and MEDCs. [3] The percentage reduction of life is significant in LEDCs (second greatest shown), approx. 5.5% / over 5%; whereas in MEDCs it is relatively small, < 1% (the least amongst the 10 risk factors shown). An element of comparison is needed to achieve the third mark.
Mark scheme, page 5
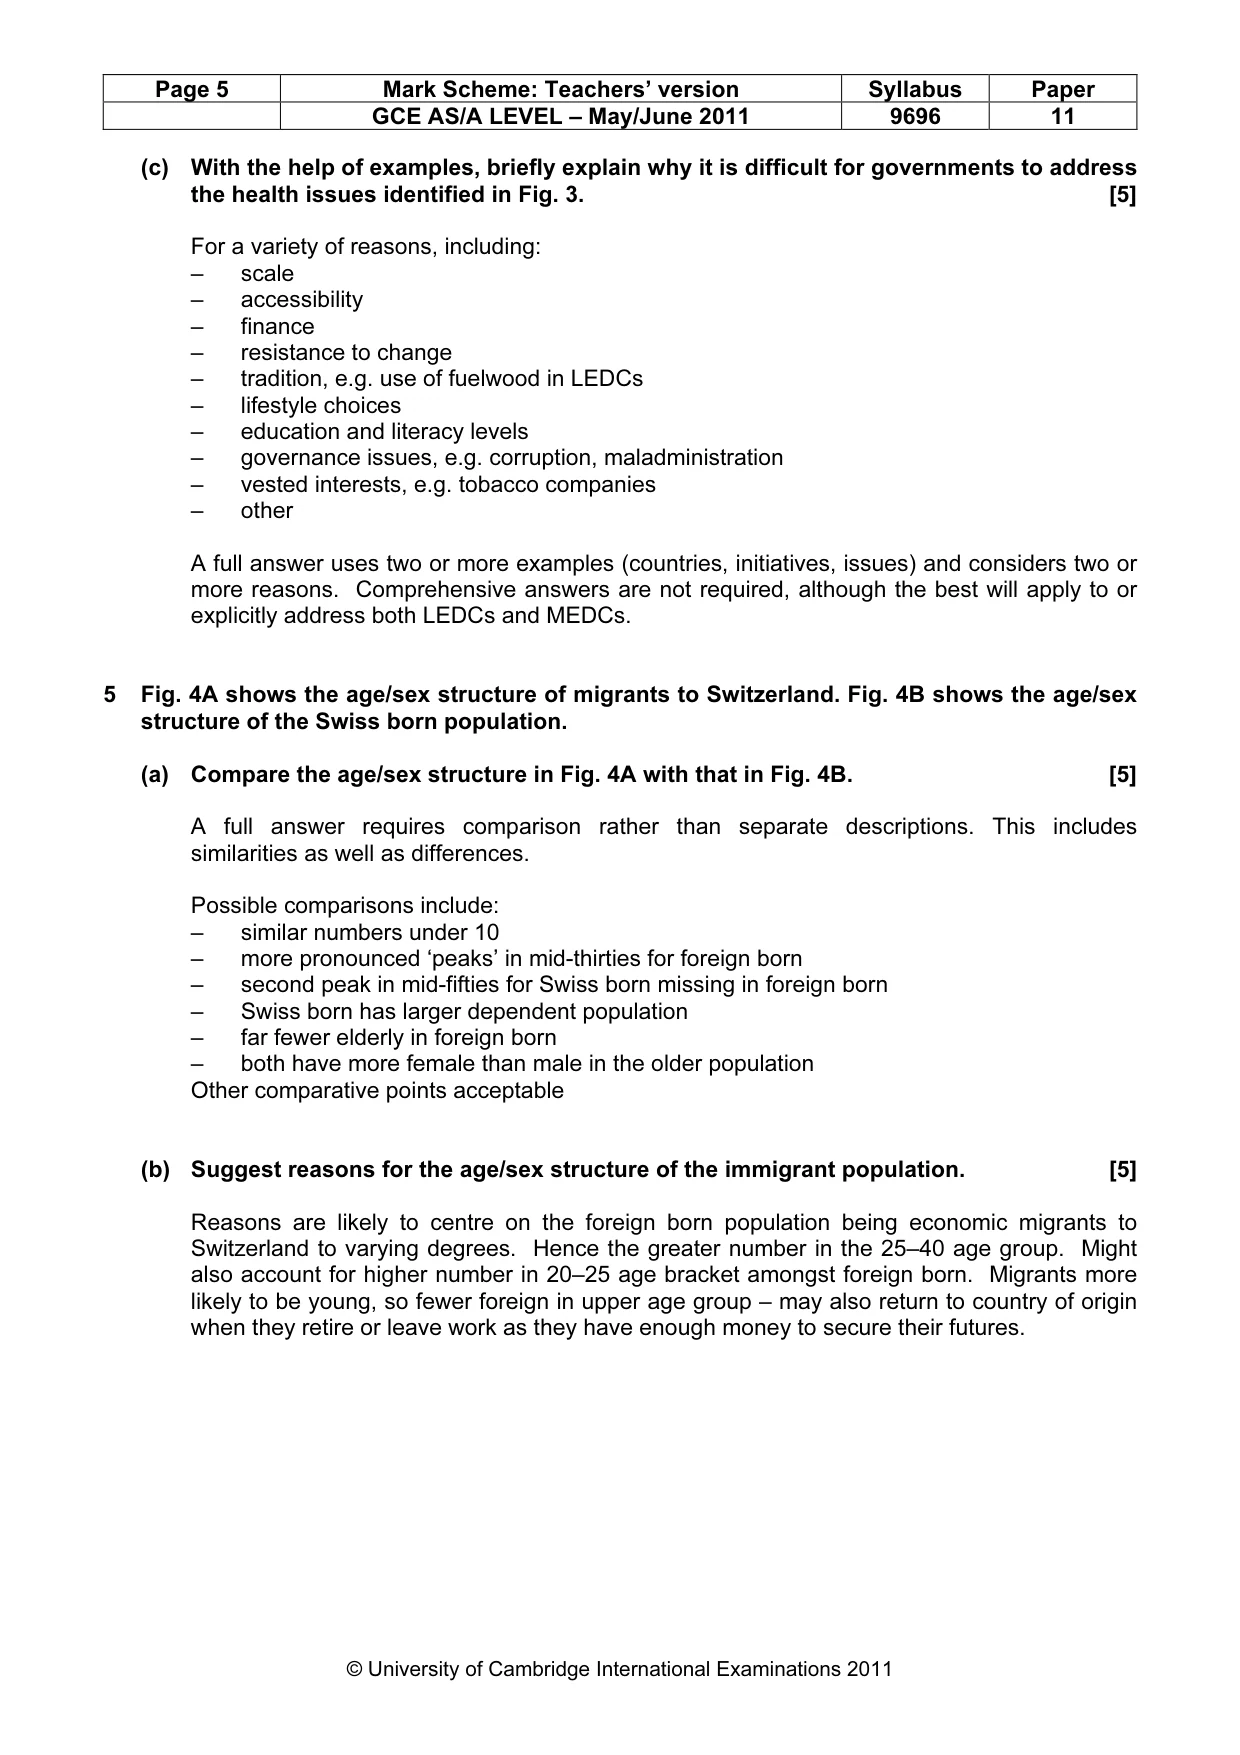
Page 5 Mark Scheme: Teachers’ version Syllabus Paper GCE AS/A LEVEL – May/June 2011 9696 11 © University of Cambridge International Examinations 2011 (c) With the help of examples, briefly explain why it is difficult for governments to address the health issues identified in Fig. 3. [5] For a variety of reasons, including: – scale – accessibility – finance – resistance to change – tradition, e.g. use of fuelwood in LEDCs – lifestyle choices – education and literacy levels – governance issues, e.g. corruption, maladministration – vested interests, e.g. tobacco companies – other A full answer uses two or more examples (countries, initiatives, issues) and considers two or more reasons. Comprehensive answers are not required, although the best will apply to or explicitly address both LEDCs and MEDCs. 5 Fig. 4A shows the age/sex structure of migrants to Switzerland. Fig. 4B shows the age/sex structure of the Swiss born population. (a) Compare the age/sex structure in Fig. 4A with that in Fig. 4B. [5] A full answer requires comparison rather than separate descriptions. This includes similarities as well as differences. Possible comparisons include: – similar numbers under 10 – more pronounced ‘peaks’ in mid-thirties for foreign born – second peak in mid-fifties for Swiss born missing in foreign born – Swiss born has larger dependent population – far fewer elderly in foreign born – both have more female than male in the older population Other comparative points acceptable (b) Suggest reasons for the age/sex structure of the immigrant population. [5] Reasons are likely to centre on the foreign born population being economic migrants to Switzerland to varying degrees. Hence the greater number in the 25–40 age group. Might also account for higher number in 20–25 age bracket amongst foreign born. Migrants more likely to be young, so fewer foreign in upper age group – may also return to country of origin when they retire or leave work as they have enough money to secure their futures.
Mark scheme, page 6
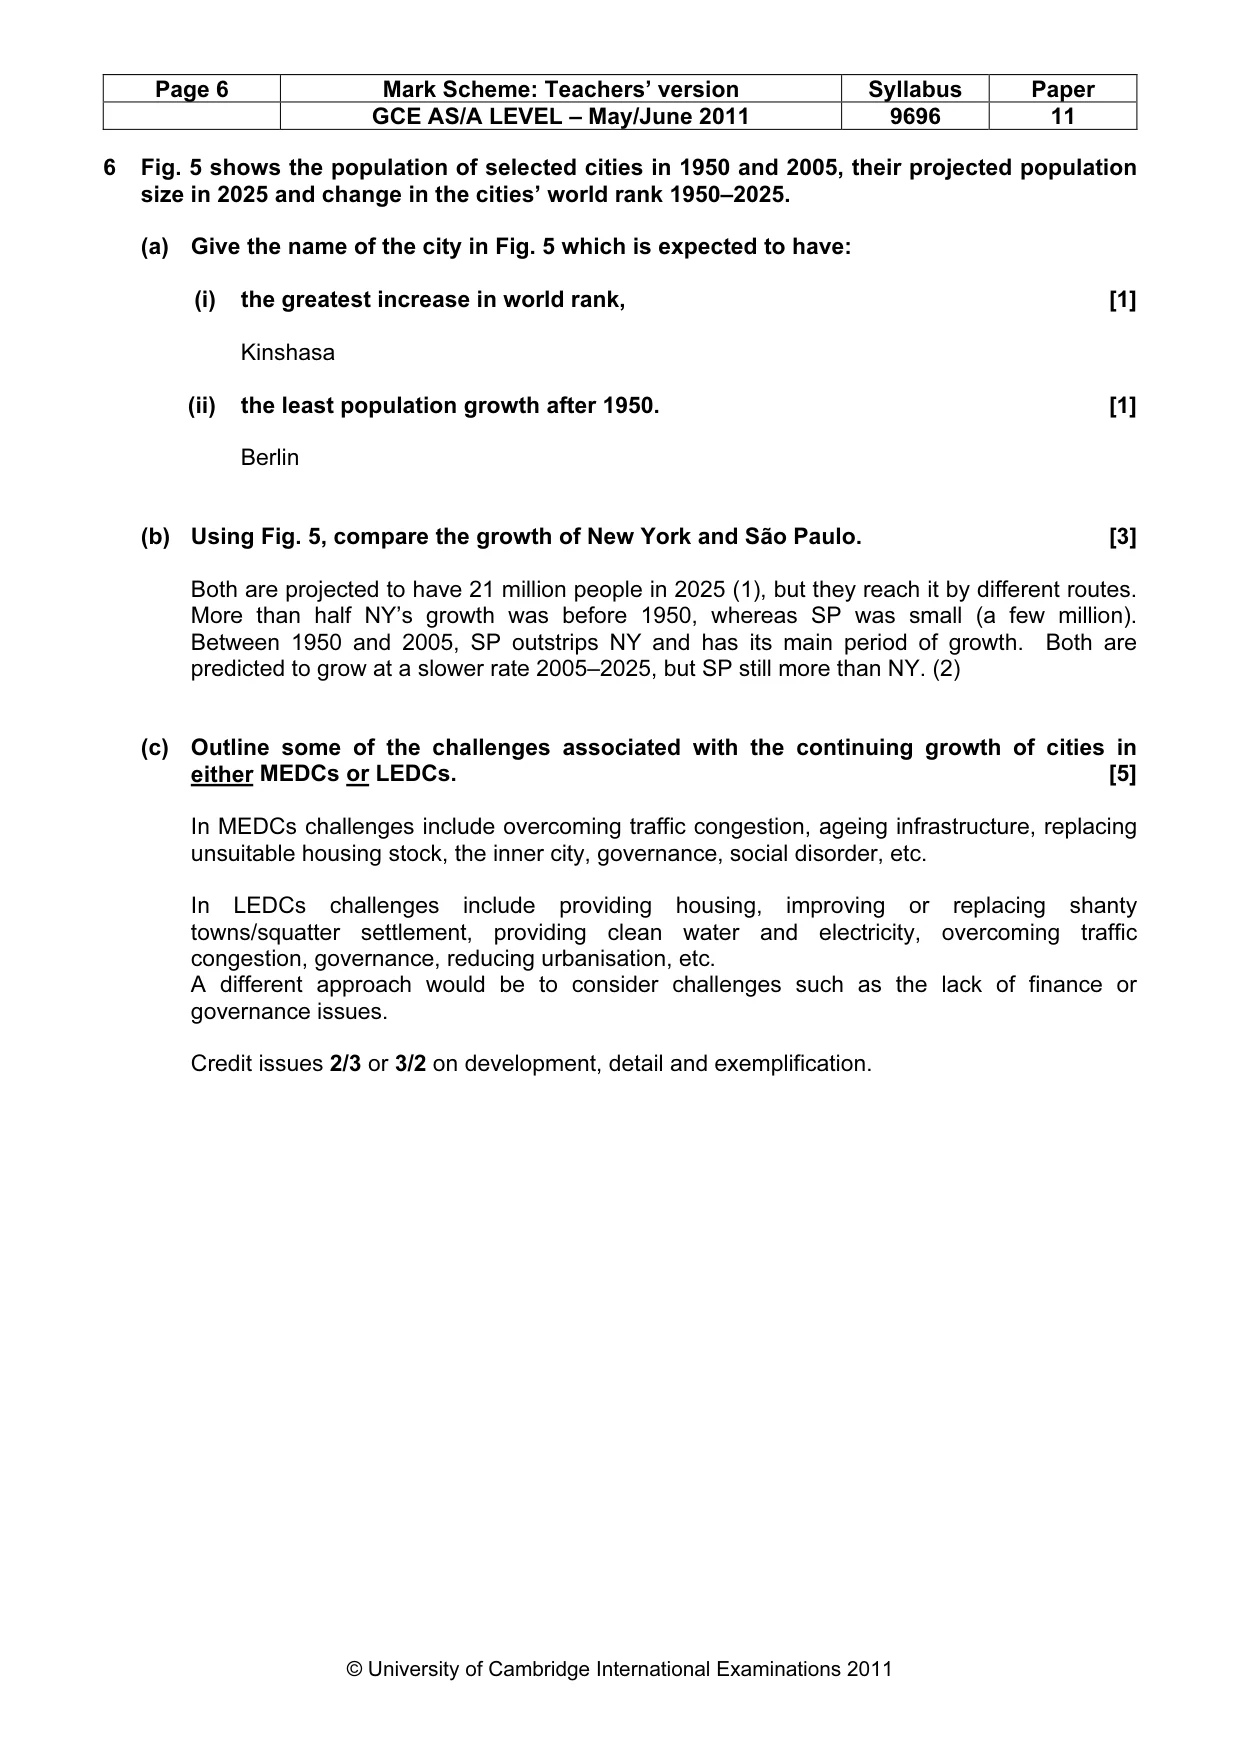
Page 6 Mark Scheme: Teachers’ version Syllabus Paper GCE AS/A LEVEL – May/June 2011 9696 11 © University of Cambridge International Examinations 2011 6 Fig. 5 shows the population of selected cities in 1950 and 2005, their projected population size in 2025 and change in the cities’ world rank 1950–2025. (a) Give the name of the city in Fig. 5 which is expected to have: (i) the greatest increase in world rank, [1] Kinshasa (ii) the least population growth after 1950. [1] Berlin (b) Using Fig. 5, compare the growth of New York and São Paulo. [3] Both are projected to have 21 million people in 2025 (1), but they reach it by different routes. More than half NY’s growth was before 1950, whereas SP was small (a few million). Between 1950 and 2005, SP outstrips NY and has its main period of growth. Both are predicted to grow at a slower rate 2005–2025, but SP still more than NY. (2) (c) Outline some of the challenges associated with the continuing growth of cities in either MEDCs or LEDCs. [5] In MEDCs challenges include overcoming traffic congestion, ageing infrastructure, replacing unsuitable housing stock, the inner city, governance, social disorder, etc. In LEDCs challenges include providing housing, improving or replacing shanty towns/squatter settlement, providing clean water and electricity, overcoming traffic congestion, governance, reducing urbanisation, etc. A different approach would be to consider challenges such as the lack of finance or governance issues. Credit issues 2/3 or 3/2 on development, detail and exemplification.
Mark scheme, page 7
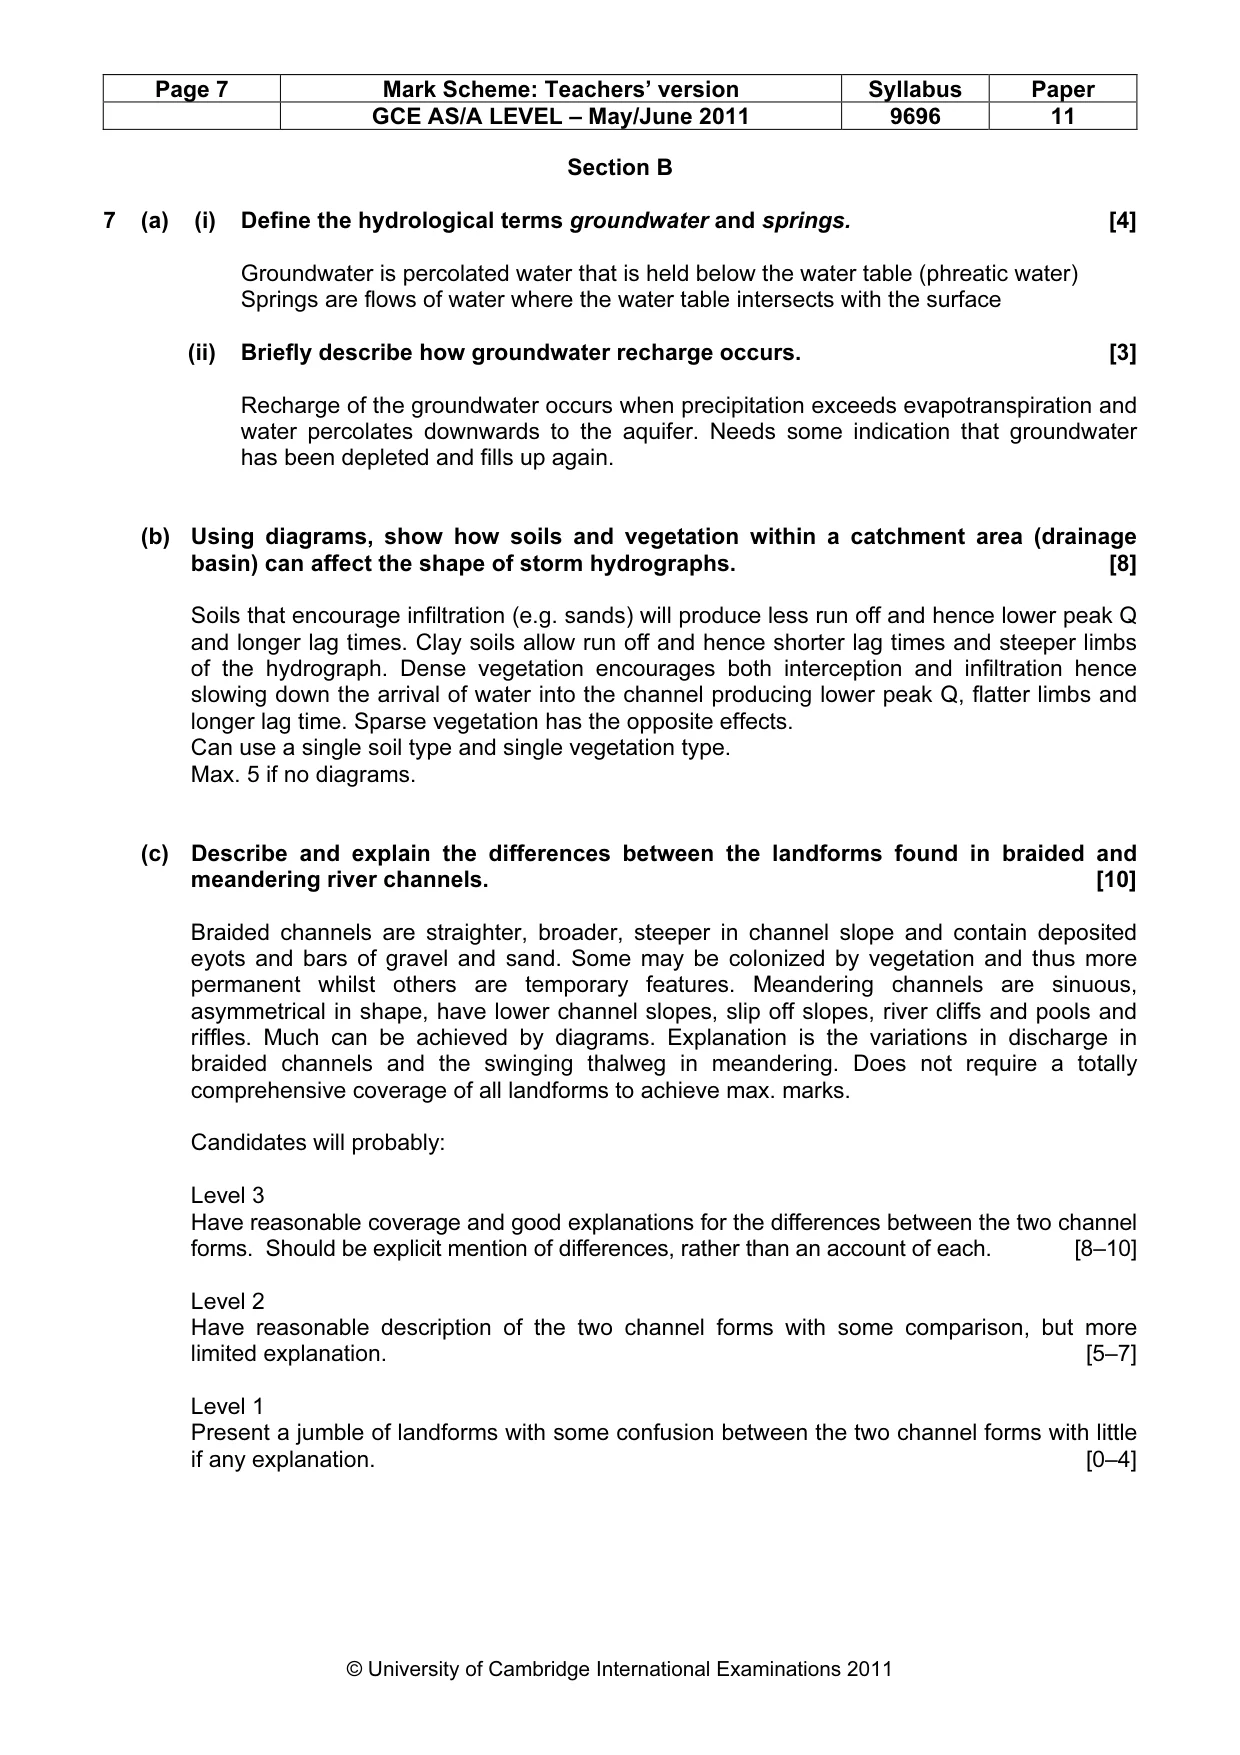
Page 7 Mark Scheme: Teachers’ version Syllabus Paper GCE AS/A LEVEL – May/June 2011 9696 11 © University of Cambridge International Examinations 2011 Section B 7 (a) (i) Define the hydrological terms groundwater and springs. [4] Groundwater is percolated water that is held below the water table (phreatic water) Springs are flows of water where the water table intersects with the surface (ii) Briefly describe how groundwater recharge occurs. [3] Recharge of the groundwater occurs when precipitation exceeds evapotranspiration and water percolates downwards to the aquifer. Needs some indication that groundwater has been depleted and fills up again. (b) Using diagrams, show how soils and vegetation within a catchment area (drainage basin) can affect the shape of storm hydrographs. [8] Soils that encourage infiltration (e.g. sands) will produce less run off and hence lower peak Q and longer lag times. Clay soils allow run off and hence shorter lag times and steeper limbs of the hydrograph. Dense vegetation encourages both interception and infiltration hence slowing down the arrival of water into the channel producing lower peak Q, flatter limbs and longer lag time. Sparse vegetation has the opposite effects. Can use a single soil type and single vegetation type. Max. 5 if no diagrams. (c) Describe and explain the differences between the landforms found in braided and meandering river channels. [10] Braided channels are straighter, broader, steeper in channel slope and contain deposited eyots and bars of gravel and sand. Some may be colonized by vegetation and thus more permanent whilst others are temporary features. Meandering channels are sinuous, asymmetrical in shape, have lower channel slopes, slip off slopes, river cliffs and pools and riffles. Much can be achieved by diagrams. Explanation is the variations in discharge in braided channels and the swinging thalweg in meandering. Does not require a totally comprehensive coverage of all landforms to achieve max. marks. Candidates will probably: Level 3 Have reasonable coverage and good explanations for the differences between the two channel forms. Should be explicit mention of differences, rather than an account of each. [8–10] Level 2 Have reasonable description of the two channel forms with some comparison, but more limited explanation. [5–7] Level 1 Present a jumble of landforms with some confusion between the two channel forms with little if any explanation. [0–4]
Mark scheme, page 8
Page 8 Mark Scheme: Teachers’ version Syllabus Paper GCE AS/A LEVEL – May/June 2011 9696 11 © University of Cambridge International Examinations 2011 8 (a) (i) Define the terms atmospheric stability and atmospheric instability. [4] stability – where, if a parcel of air is displaced upwards it will return to its original position (because it remains cooler and heavier than the surrounding air). (2) instability – where, if a parcel of air rises, it will continue to rise as it remains warmer than the surrounding air even though being cooled adiabatically. (2) (ii) Describe the conditions which may lead to the formation of dew. [3] Nocturnal (long wave) radiation (on clear nights) leading to cooling of surfaces which cool air in contact with them sufficiently to cause condensation of water vapour to droplets on vegetation etc. Three positive points needed. (b) With the aid of a diagram, explain the generalised pattern of pressure and wind systems in either the northern or southern hemispheres. [8] Can be achieved totally from a clearly annotated diagram/sketch map showing essentially: equatorial low, polar high and tropical high with the winds deflected appropriately as they move from areas of high to low pressure. Explanation should be in terms of the ITCZ as warmed air at the equator rises, the Hadley and Ferrel cells. Good candidates will show an understanding of the low pressure systems at the polar front. Max. 5 if no diagrams. (c) Explain how the greenhouse effect occurs in the earth’s atmosphere. How have human activities affected it and with what consequences? [10] The greenhouse effect is the warming of the earth’s atmosphere with short-wave radiation readily penetrating to the surface, whereas long wave radiation from the earth is impeded by the greenhouse gases in the atmosphere. Thus less heat escapes from the earth’s surface than that arriving. The effect is increased with cloud cover and with particulate matter and certain gases in the atmosphere. Ever since humans started clearing forests and cultivating the land they have affected the composition of the atmosphere and increased the greenhouse effect, but industrialisation since the nineteenth century, pouring CO2 into the atmosphere from burning fossil fuels, will be the main factor, plus emissions from I.C.Es and jet engines. The consequences will have been well rehearsed; global warming, polar and glacial ice melting, rising sea level, increased energy to fuel atmospheric disturbances, changing climatic patterns. Candidates will probably: Level 3 Accurate detail, knowledge and understanding of the science and demonstrated throughout the answer. Well balanced in covering the three demands in the question. Appropriate awareness of the scale of human factors and likely consequences [8–10] Level 2 Covers the essential demands but lacking in some of the accurate detail. Less well balanced on consequences which may be exaggerated or less detailed. [5–7] Level 1 Weak answers lacking accurate understanding of the science behind the topic. Limited coverage of the question with imprecision and generalisations. [0–4]
Mark scheme, page 9
Page 9 Mark Scheme: Teachers’ version Syllabus Paper GCE AS/A LEVEL – May/June 2011 9696 11 © University of Cambridge International Examinations 2011 9 (a) (i) Define the terms oxidation and freeze thaw. [4] Oxidation is a chemical weathering process. This occurs when a rock is exposed to oxygen from air or water. The most common example is when iron is present in rock, and thus turns from a ferrous state to a ferric state turning a reddish brown colour (better known as the process of rusting). Freeze thaw is a physical weathering process. The water enters cracks in the rocks. When the temperature falls below 0oC the water freezes and expands by 9%. This forces open the crack in the rock. The temperature subsequently rises and the ice melts, allowing more water to enter and repeat the process. A sequence of diagrams would suffice for full marks. (ii) Explain the process of exfoliation. [3] Exfoliation is a form of physical weathering. It is commonly found with granite, where the overlying rock/material has been removed and this unloading allows pressure release. Exfoliation may also be caused by the temperature changes in the rock due to the differences in the expansion and contraction of the outer rock and that of its core. The term onion skin weathering may be referred to. Full marks may be gained from reference to only one of the causes if sufficient detail is given. (b) Explain how the differences in the chemical composition of limestone and granite lead to differences in the ways they are weathered. [8] The answer should focus on the differences in the chemical composition of the rocks. The answer is therefore likely to focus on the different nature of chemical weathering. Limestone is a sedimentary carbonate rock. The small proportion of carbon dioxide within rainwater acts as a weak acid, and is able to dissolve limestone rock. This process is carbonation. Granite is an igneous rock, formed as a result of intrusive activity. Whilst granite may take many forms, the dominant chemical composition is mica, feldspars and quartz. It is crystalline. The three minerals react differently with water – quartz remains mainly unchanged, mica releases aluminium and iron under more acidic conditions and feldspar reacts markedly, producing kaolin (china clay). This process can be termed hydrolysis. The best answers will focus on the differences between the two rock types, rather than give a general dialogue on factors which affect the rates of weathering.
Mark scheme, page 10
Page 10 Mark Scheme: Teachers’ version Syllabus Paper GCE AS/A LEVEL – May/June 2011 9696 11 © University of Cambridge International Examinations 2011 (c) With the aid of diagrams describe and explain the formation of landforms produced near convergent plate boundaries. [10] The diagrams should illustrate landforms such as ocean trenches, island arcs, volcanoes and fold mountains. The explanation can include the plates moving on convection currents. An oceanic plate is denser and thus is subducted under a continental plate. An example would be the Nasca Plate subducting under the South American Plate. The oceanic crust melting at the subduction zone supplies magma which subsequently rises creating features such as island arcs. Fold mountains, such as the Andes, may also have volcanoes present. High marks can be gained with the good use of annotated diagrams. Landforms should be related to the type of convergence: continental – continental; oceanic – continental; oceanic – oceanic. Max. 6 if no diagrams. Candidates will probably: Level 3 Diagrams are accurate and well labelled and are referred to in the text, or annotated so well that little text is needed, such that all the major features are covered, probably in an integrated way. For fold mountains needs mention of sediments such as accretionary wedges. [8–10] Level 2 Diagrams are reasonable but with labelling/annotation a little insecure. Reference to diagrams in text possibly limited and either explanations lack some detail or some major feature(s) not discussed. [5–7] Level 1 Weak diagrams with limited useful labelling/annotation. Little understanding shown of the formation of features and limited features discussed. [0–4]
Mark scheme, page 11
Page 11 Mark Scheme: Teachers’ version Syllabus Paper GCE AS/A LEVEL – May/June 2011 9696 11 © University of Cambridge International Examinations 2011 Section C 10 (a) (i) Give the meaning of the term natural increase rate. [2] birth rate – death rate = natural increase rate or the difference between gains from births and losses from deaths (excluding migration) (ii) With the help of examples, describe the differences in natural increase between countries. [5] Some indication of high, moderate and low rates, maybe ZPG (zero population growth), and negative natural increase (sometimes called natural decrease). Not all need to be exemplified. A sense of change over time / population dynamics is highly creditable. Will allow choice of 2 countries. (b) Outline the main features of one country’s population policy regarding natural increase. [8] Much depends on the chosen country, straightforward descriptions might achieve up to 5 marks. Award 6–8 marks for responses which seek to do as required – to identify “main features”. e.g. focus on educating women; incentives to promote sterilisation (India); coercion (China); tax breaks for larger families (France); responsive change from “one is enough”, to “have three if you can afford it” (Singapore). (c) Assess the results of seeking to manage natural increase in the country you chose in (b). [10] Again, dependent on the case chosen, but “results” may be expected and unforeseen and include the outworking or consequences, e.g. China’s “little emperors” or high percentage of unmarried men. Credit the use of data and any wider or global perspective offered. Candidates will probably: Level 3 Offer an appropriate assessment of the policy’s results, showing detailed knowledge and strong conceptual understanding. [8–10] Level 2 Make a reasonable attempt, which may contain good points, but which remains limited in scope, detail or the assessment offered. [5–7] Level 1 Offer one or more basic ideas about results. May write generally or loosely, offering little or no assessment. [0–4]
Mark scheme, page 12
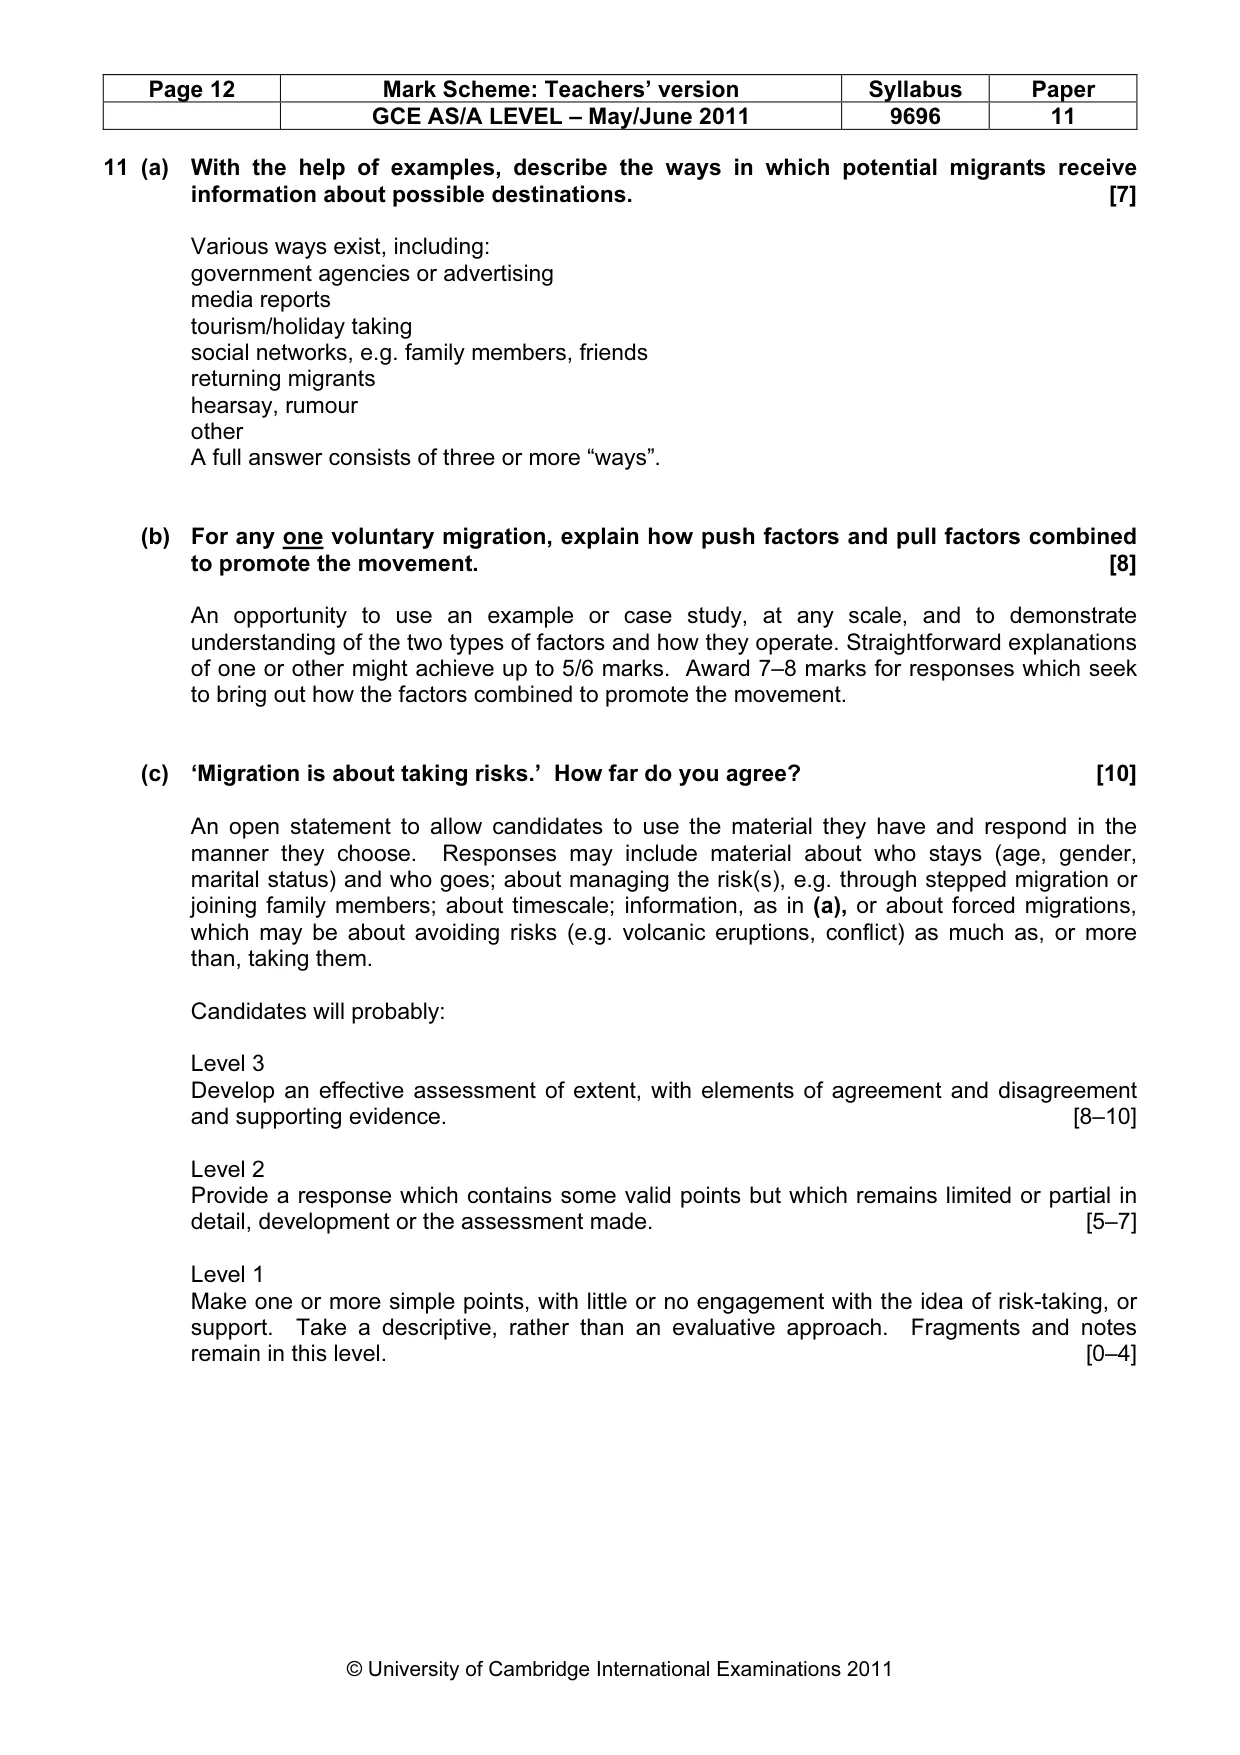
Page 12 Mark Scheme: Teachers’ version Syllabus Paper GCE AS/A LEVEL – May/June 2011 9696 11 © University of Cambridge International Examinations 2011 11 (a) With the help of examples, describe the ways in which potential migrants receive information about possible destinations. [7] Various ways exist, including: government agencies or advertising media reports tourism/holiday taking social networks, e.g. family members, friends returning migrants hearsay, rumour other A full answer consists of three or more “ways”. (b) For any one voluntary migration, explain how push factors and pull factors combined to promote the movement. [8] An opportunity to use an example or case study, at any scale, and to demonstrate understanding of the two types of factors and how they operate. Straightforward explanations of one or other might achieve up to 5/6 marks. Award 7–8 marks for responses which seek to bring out how the factors combined to promote the movement. (c) ‘Migration is about taking risks.’ How far do you agree? [10] An open statement to allow candidates to use the material they have and respond in the manner they choose. Responses may include material about who stays (age, gender, marital status) and who goes; about managing the risk(s), e.g. through stepped migration or joining family members; about timescale; information, as in (a), or about forced migrations, which may be about avoiding risks (e.g. volcanic eruptions, conflict) as much as, or more than, taking them. Candidates will probably: Level 3 Develop an effective assessment of extent, with elements of agreement and disagreement and supporting evidence. [8–10] Level 2 Provide a response which contains some valid points but which remains limited or partial in detail, development or the assessment made. [5–7] Level 1 Make one or more simple points, with little or no engagement with the idea of risk-taking, or support. Take a descriptive, rather than an evaluative approach. Fragments and notes remain in this level. [0–4]
Mark scheme, page 13
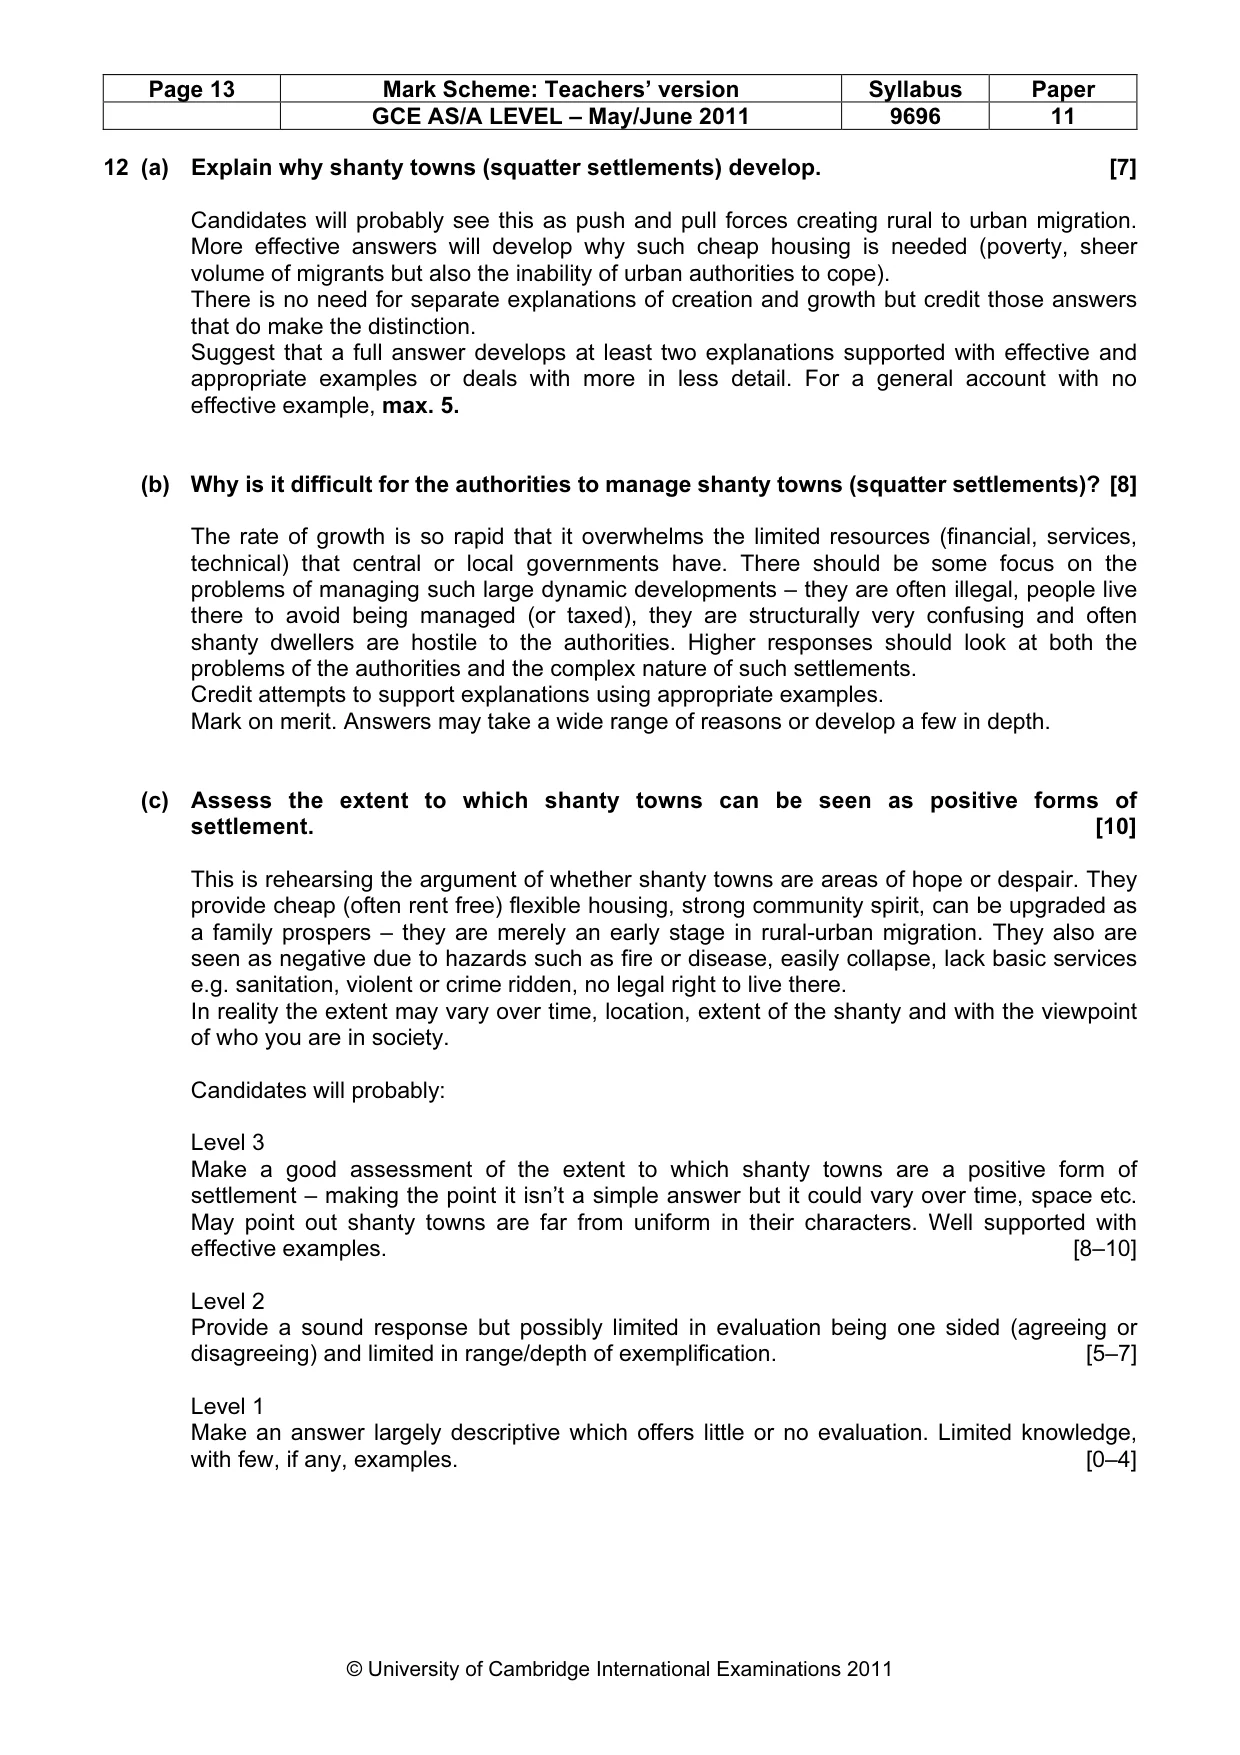
Page 13 Mark Scheme: Teachers’ version Syllabus Paper GCE AS/A LEVEL – May/June 2011 9696 11 © University of Cambridge International Examinations 2011 12 (a) Explain why shanty towns (squatter settlements) develop. [7] Candidates will probably see this as push and pull forces creating rural to urban migration. More effective answers will develop why such cheap housing is needed (poverty, sheer volume of migrants but also the inability of urban authorities to cope). There is no need for separate explanations of creation and growth but credit those answers that do make the distinction. Suggest that a full answer develops at least two explanations supported with effective and appropriate examples or deals with more in less detail. For a general account with no effective example, max. 5. (b) Why is it difficult for the authorities to manage shanty towns (squatter settlements)? [8] The rate of growth is so rapid that it overwhelms the limited resources (financial, services, technical) that central or local governments have. There should be some focus on the problems of managing such large dynamic developments – they are often illegal, people live there to avoid being managed (or taxed), they are structurally very confusing and often shanty dwellers are hostile to the authorities. Higher responses should look at both the problems of the authorities and the complex nature of such settlements. Credit attempts to support explanations using appropriate examples. Mark on merit. Answers may take a wide range of reasons or develop a few in depth. (c) Assess the extent to which shanty towns can be seen as positive forms of settlement. [10] This is rehearsing the argument of whether shanty towns are areas of hope or despair. They provide cheap (often rent free) flexible housing, strong community spirit, can be upgraded as a family prospers – they are merely an early stage in rural-urban migration. They also are seen as negative due to hazards such as fire or disease, easily collapse, lack basic services e.g. sanitation, violent or crime ridden, no legal right to live there. In reality the extent may vary over time, location, extent of the shanty and with the viewpoint of who you are in society. Candidates will probably: Level 3 Make a good assessment of the extent to which shanty towns are a positive form of settlement – making the point it isn’t a simple answer but it could vary over time, space etc. May point out shanty towns are far from uniform in their characters. Well supported with effective examples. [8–10] Level 2 Provide a sound response but possibly limited in evaluation being one sided (agreeing or disagreeing) and limited in range/depth of exemplification. [5–7] Level 1 Make an answer largely descriptive which offers little or no evaluation. Limited knowledge, with few, if any, examples. [0–4]
What you needed in this session
Cambridge’s own grade thresholds for 2011 May/June, Paper 1 · Variant 1. A higher threshold means an easier paper — the bar moves with how the cohort did.