Cambridge A Level Geography 9696 — 2010 Oct/Nov Paper 1 · Variant 1
9696/11/O/N/10 · 100 marks · ≈113 min
The question paper and its mark scheme, free to read here and free to download. This is Cambridge’s own paper, exactly as it was sat.
Question paper8 pages




Mark scheme12 pages
Answers below. Sit the paper first if you are practising.




Paper as text
Question paper, page 1
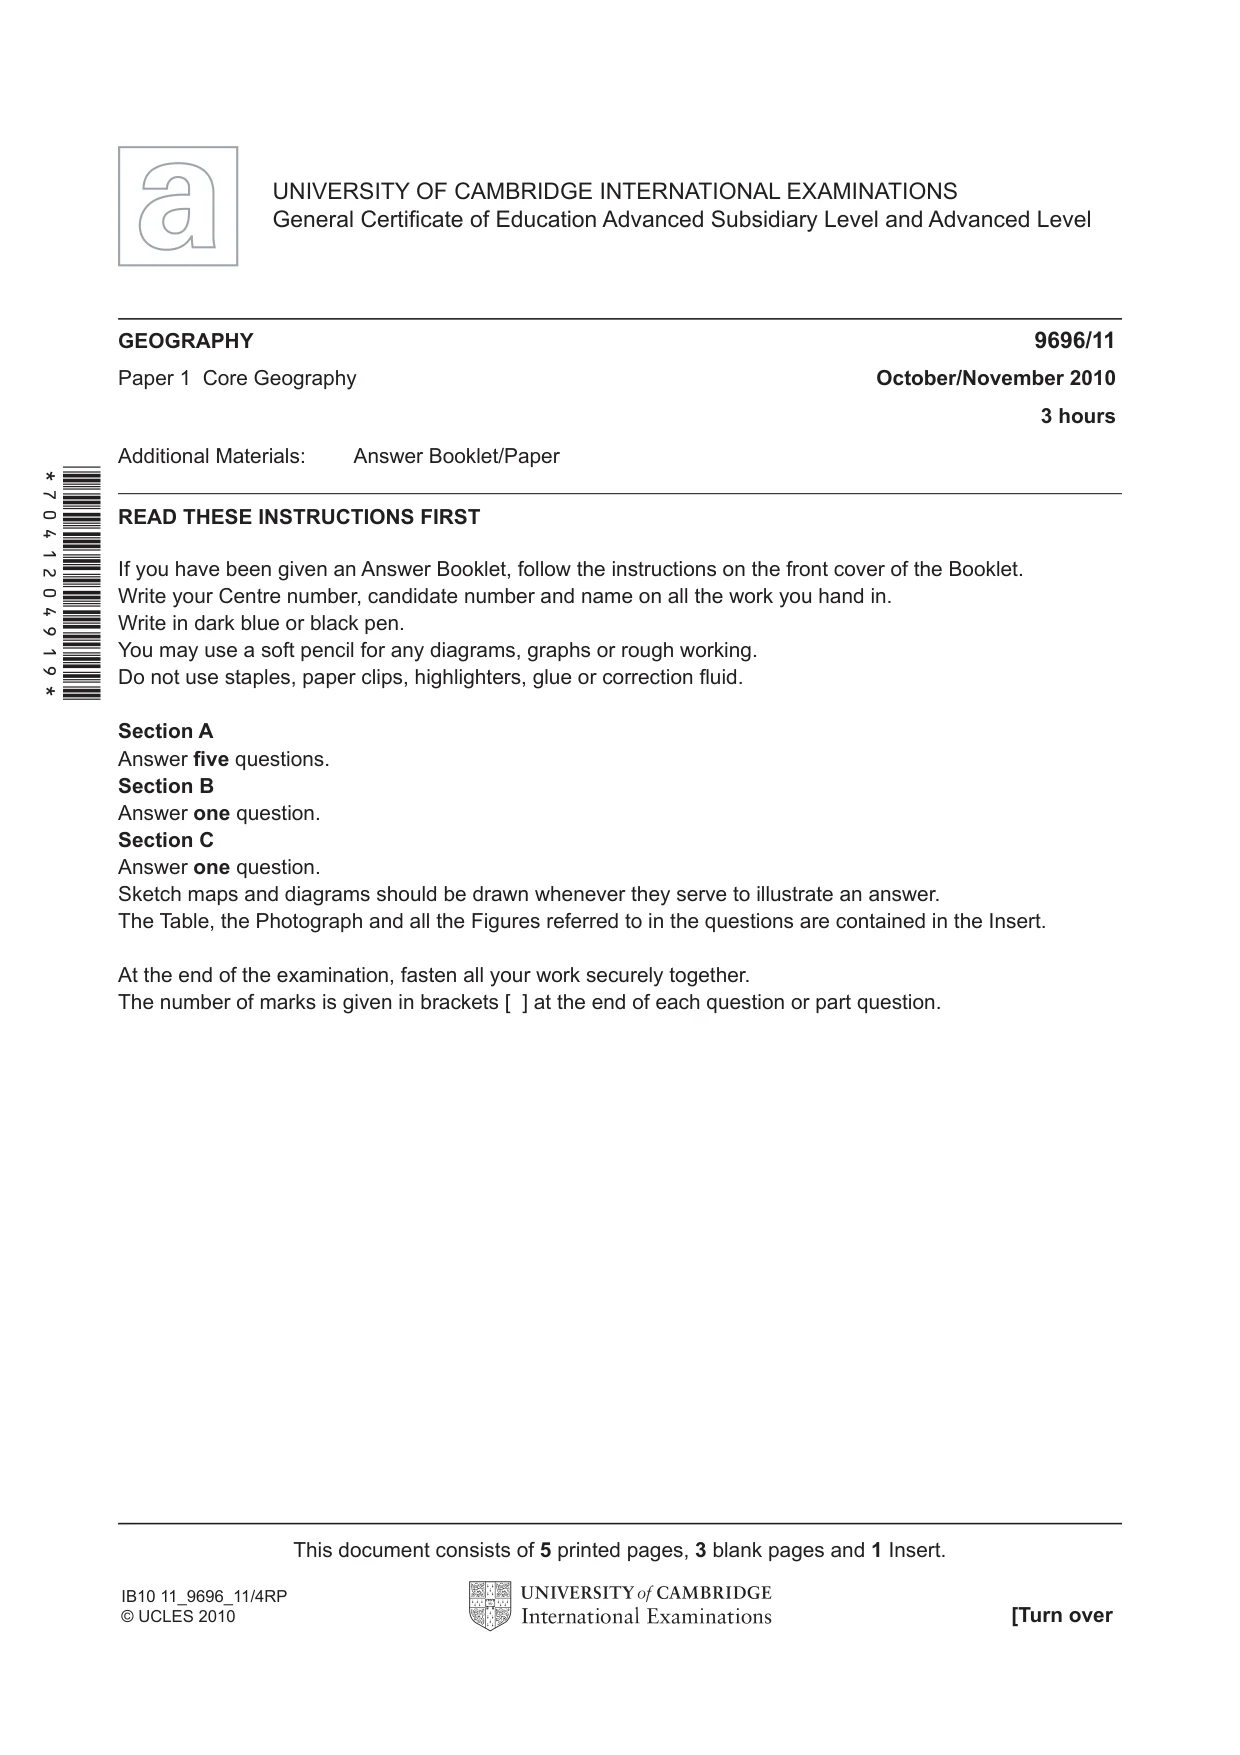
READ THESE INSTRUCTIONS FIRST If you have been given an Answer Booklet, follow the instructions on the front cover of the Booklet. Write your Centre number, candidate number and name on all the work you hand in. Write in dark blue or black pen. You may use a soft pencil for any diagrams, graphs or rough working. Do not use staples, paper clips, highlighters, glue or correction fl uid. Section A Answer fi ve questions. Section B Answer one question. Section C Answer one question. Sketch maps and diagrams should be drawn whenever they serve to illustrate an answer. The Table, the Photograph and all the Figures referred to in the questions are contained in the Insert. At the end of the examination, fasten all your work securely together. The number of marks is given in brackets [ ] at the end of each question or part question. GEOGRAPHY 9696/11 Paper 1 Core Geography October/November 2010 3 hours Additional Materials: Answer Booklet/Paper UNIVERSITY OF CAMBRIDGE INTERNATIONAL EXAMINATIONS General Certifi cate of Education Advanced Subsidiary Level and Advanced Level This document consists of 5 printed pages, 3 blank pages and 1 Insert. [Turn over IB10 11_9696_11/4RP © UCLES 2010 *7041204919*
Question paper, page 2
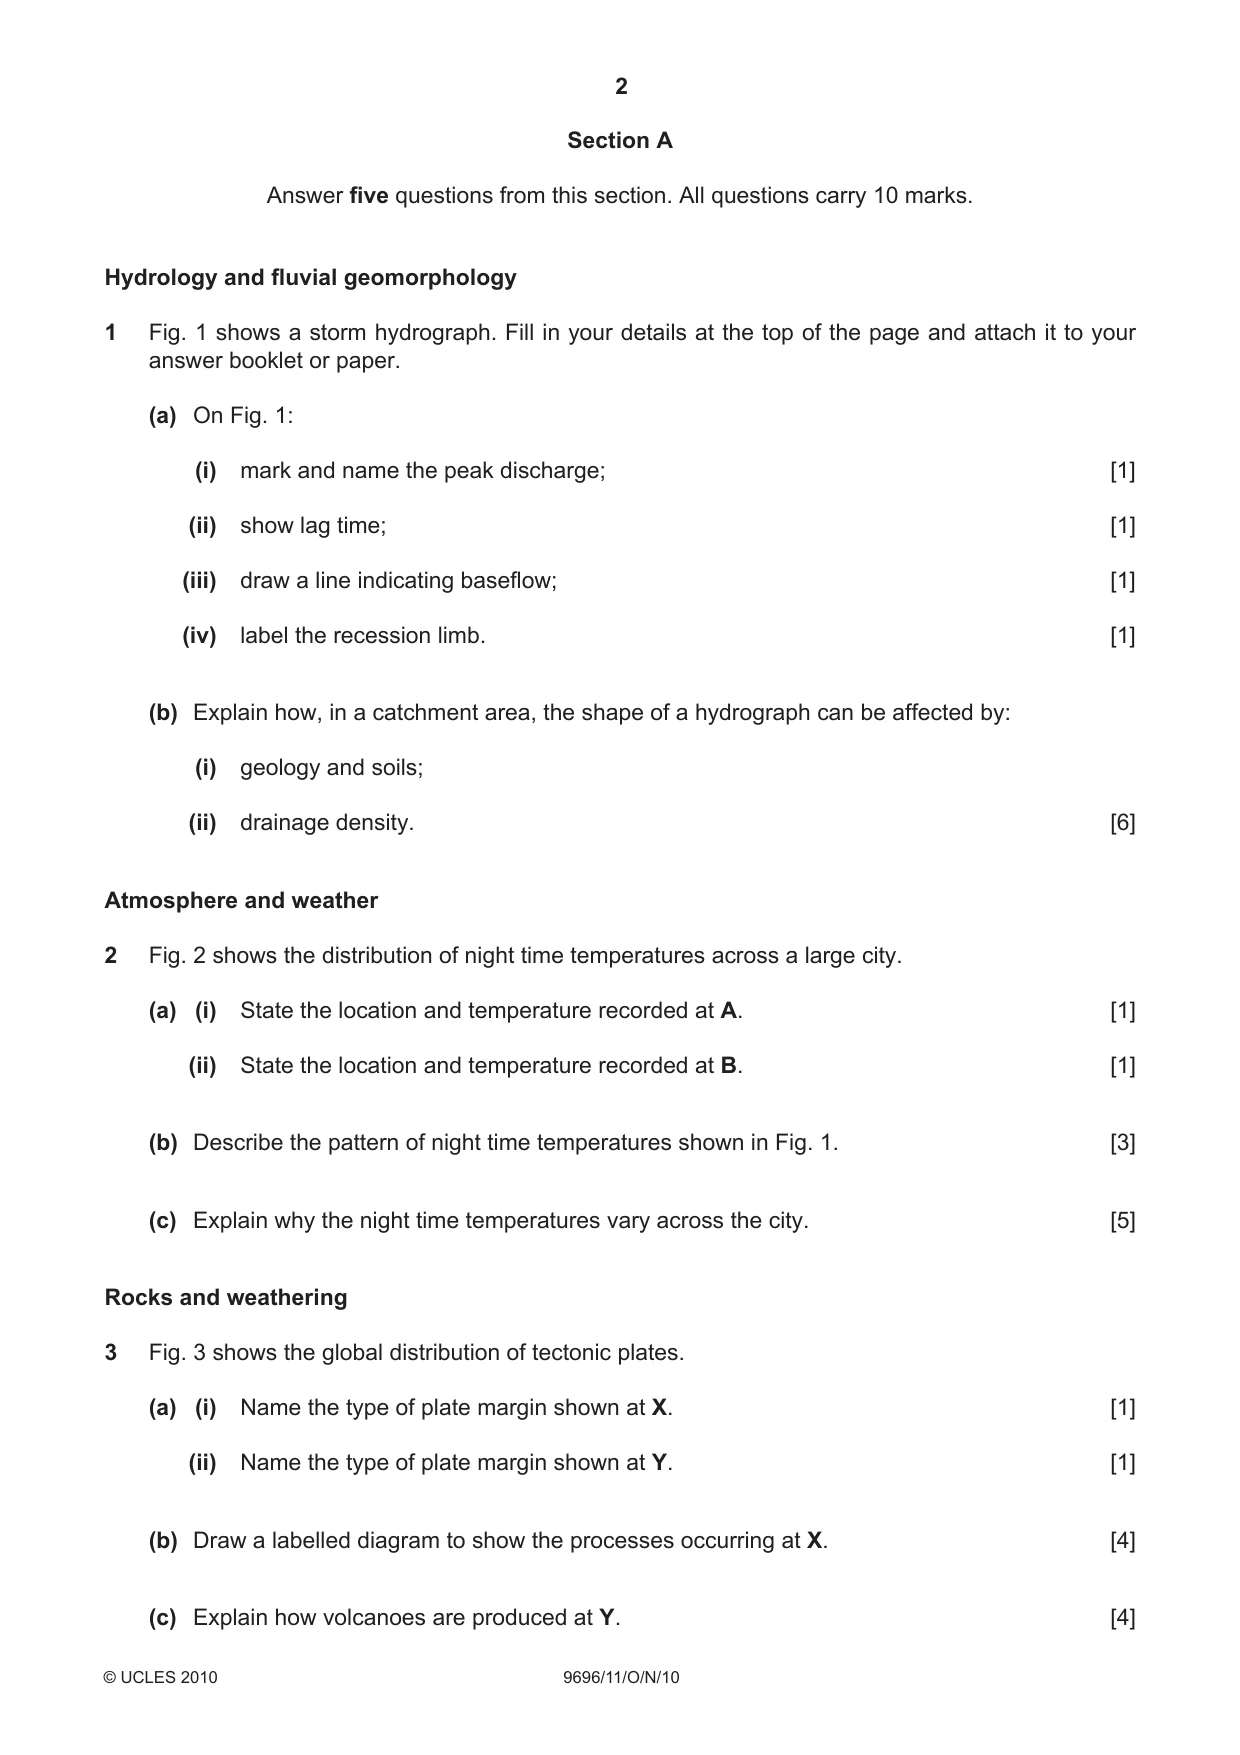
2 9696/11/O/N/10 © UCLES 2010 Section A Answer five questions from this section. All questions carry 10 marks. Hydrology and fluvial geomorphology 1 Fig. 1 shows a storm hydrograph. Fill in your details at the top of the page and attach it to your answer booklet or paper. (a) On Fig. 1: (i) mark and name the peak discharge; [1] (ii) show lag time; [1] (iii) draw a line indicating baseflow; [1] (iv) label the recession limb. [1] (b) Explain how, in a catchment area, the shape of a hydrograph can be affected by: (i) geology and soils; (ii) drainage density. [6] Atmosphere and weather 2 Fig. 2 shows the distribution of night time temperatures across a large city. (a) (i) State the location and temperature recorded at A. [1] (ii) State the location and temperature recorded at B. [1] (b) Describe the pattern of night time temperatures shown in Fig. 1. [3] (c) Explain why the night time temperatures vary across the city. [5] Rocks and weathering 3 Fig. 3 shows the global distribution of tectonic plates. (a) (i) Name the type of plate margin shown at X. [1] (ii) Name the type of plate margin shown at Y. [1] (b) Draw a labelled diagram to show the processes occurring at X. [4] (c) Explain how volcanoes are produced at Y. [4]
Question paper, page 3
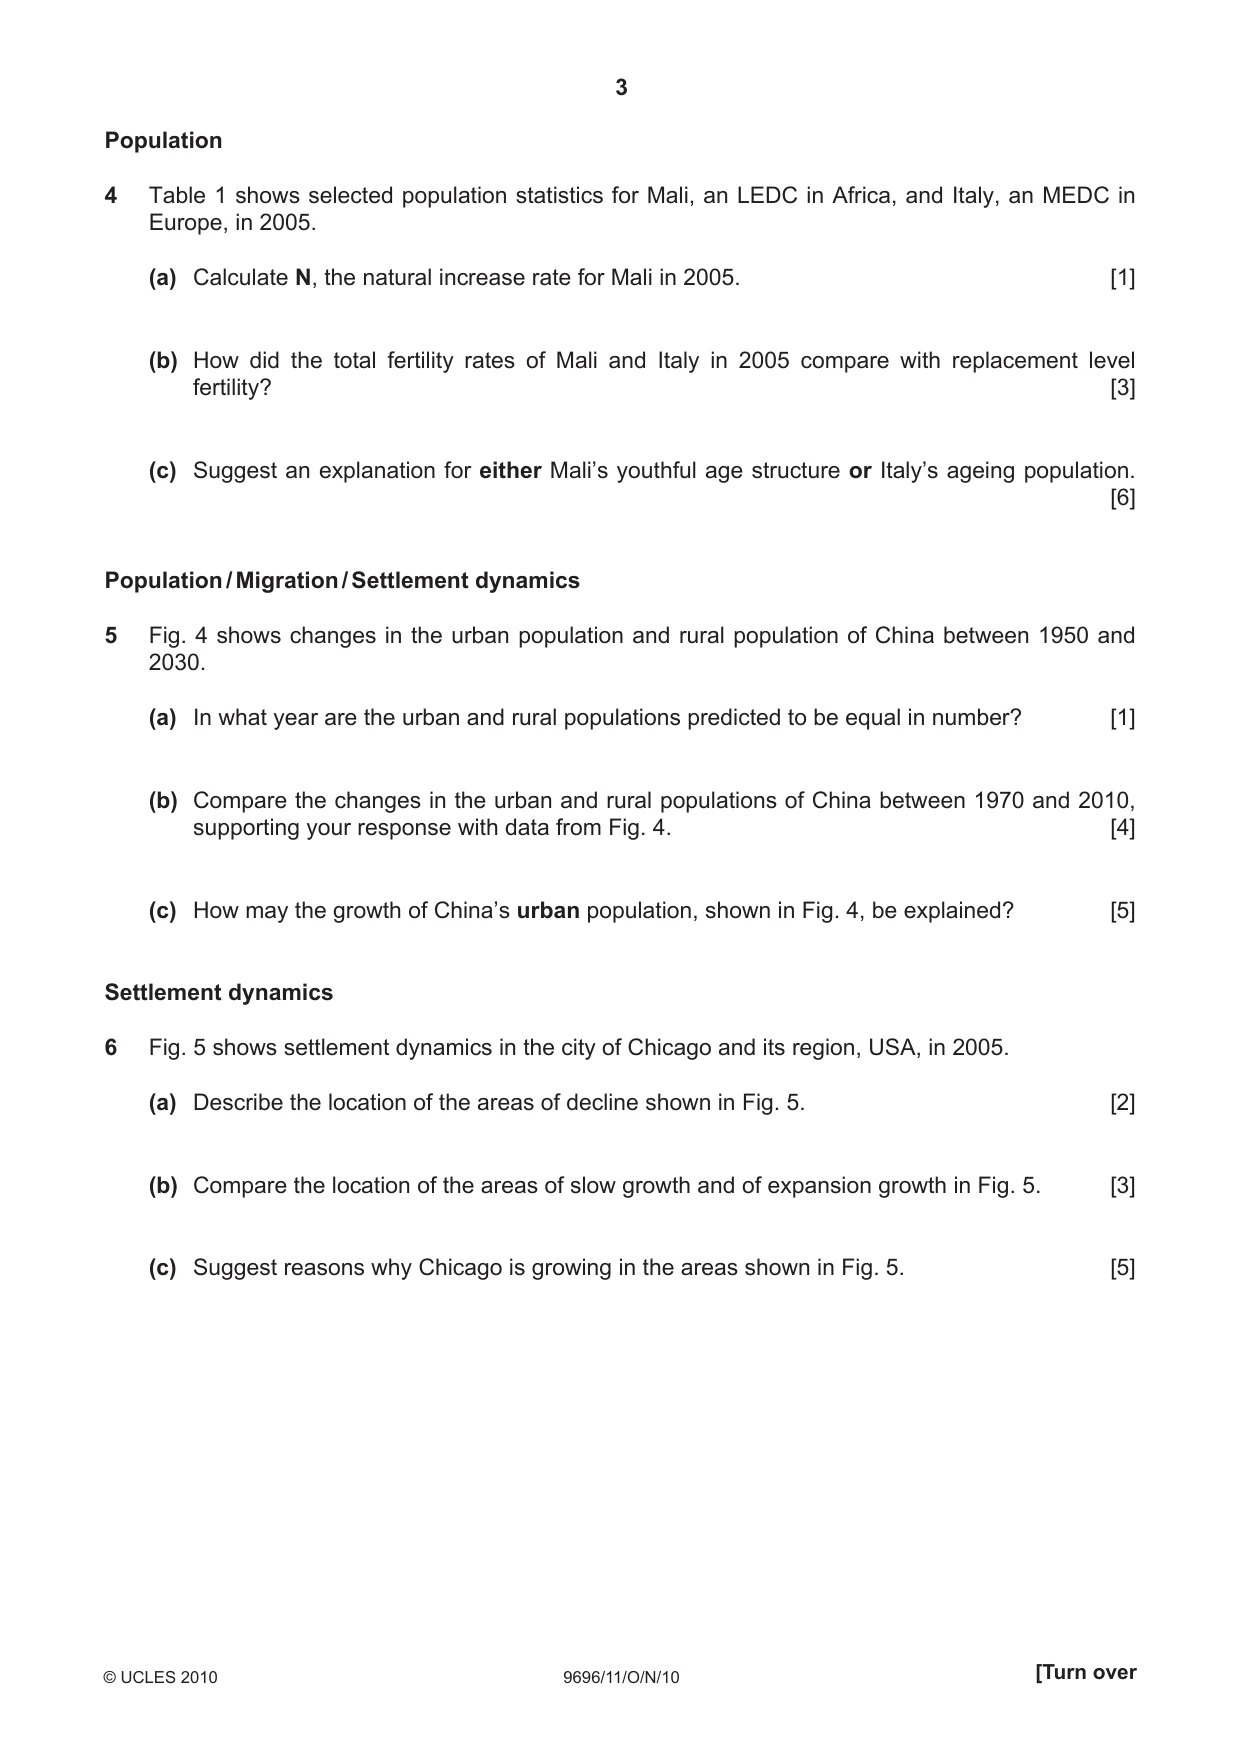
3 9696/11/O/N/10 © UCLES 2010 [Turn over Population 4 Table 1 shows selected population statistics for Mali, an LEDC in Africa, and Italy, an MEDC in Europe, in 2005. (a) Calculate N, the natural increase rate for Mali in 2005. [1] (b) How did the total fertility rates of Mali and Italy in 2005 compare with replacement level fertility? [3] (c) Suggest an explanation for either Mali’s youthful age structure or Italy’s ageing population. [6] Population / Migration / Settlement dynamics 5 Fig. 4 shows changes in the urban population and rural population of China between 1950 and 2030. (a) In what year are the urban and rural populations predicted to be equal in number? [1] (b) Compare the changes in the urban and rural populations of China between 1970 and 2010, supporting your response with data from Fig. 4. [4] (c) How may the growth of China’s urban population, shown in Fig. 4, be explained? [5] Settlement dynamics 6 Fig. 5 shows settlement dynamics in the city of Chicago and its region, USA, in 2005. (a) Describe the location of the areas of decline shown in Fig. 5. [2] (b) Compare the location of the areas of slow growth and of expansion growth in Fig. 5. [3] (c) Suggest reasons why Chicago is growing in the areas shown in Fig. 5. [5]
Question paper, page 4
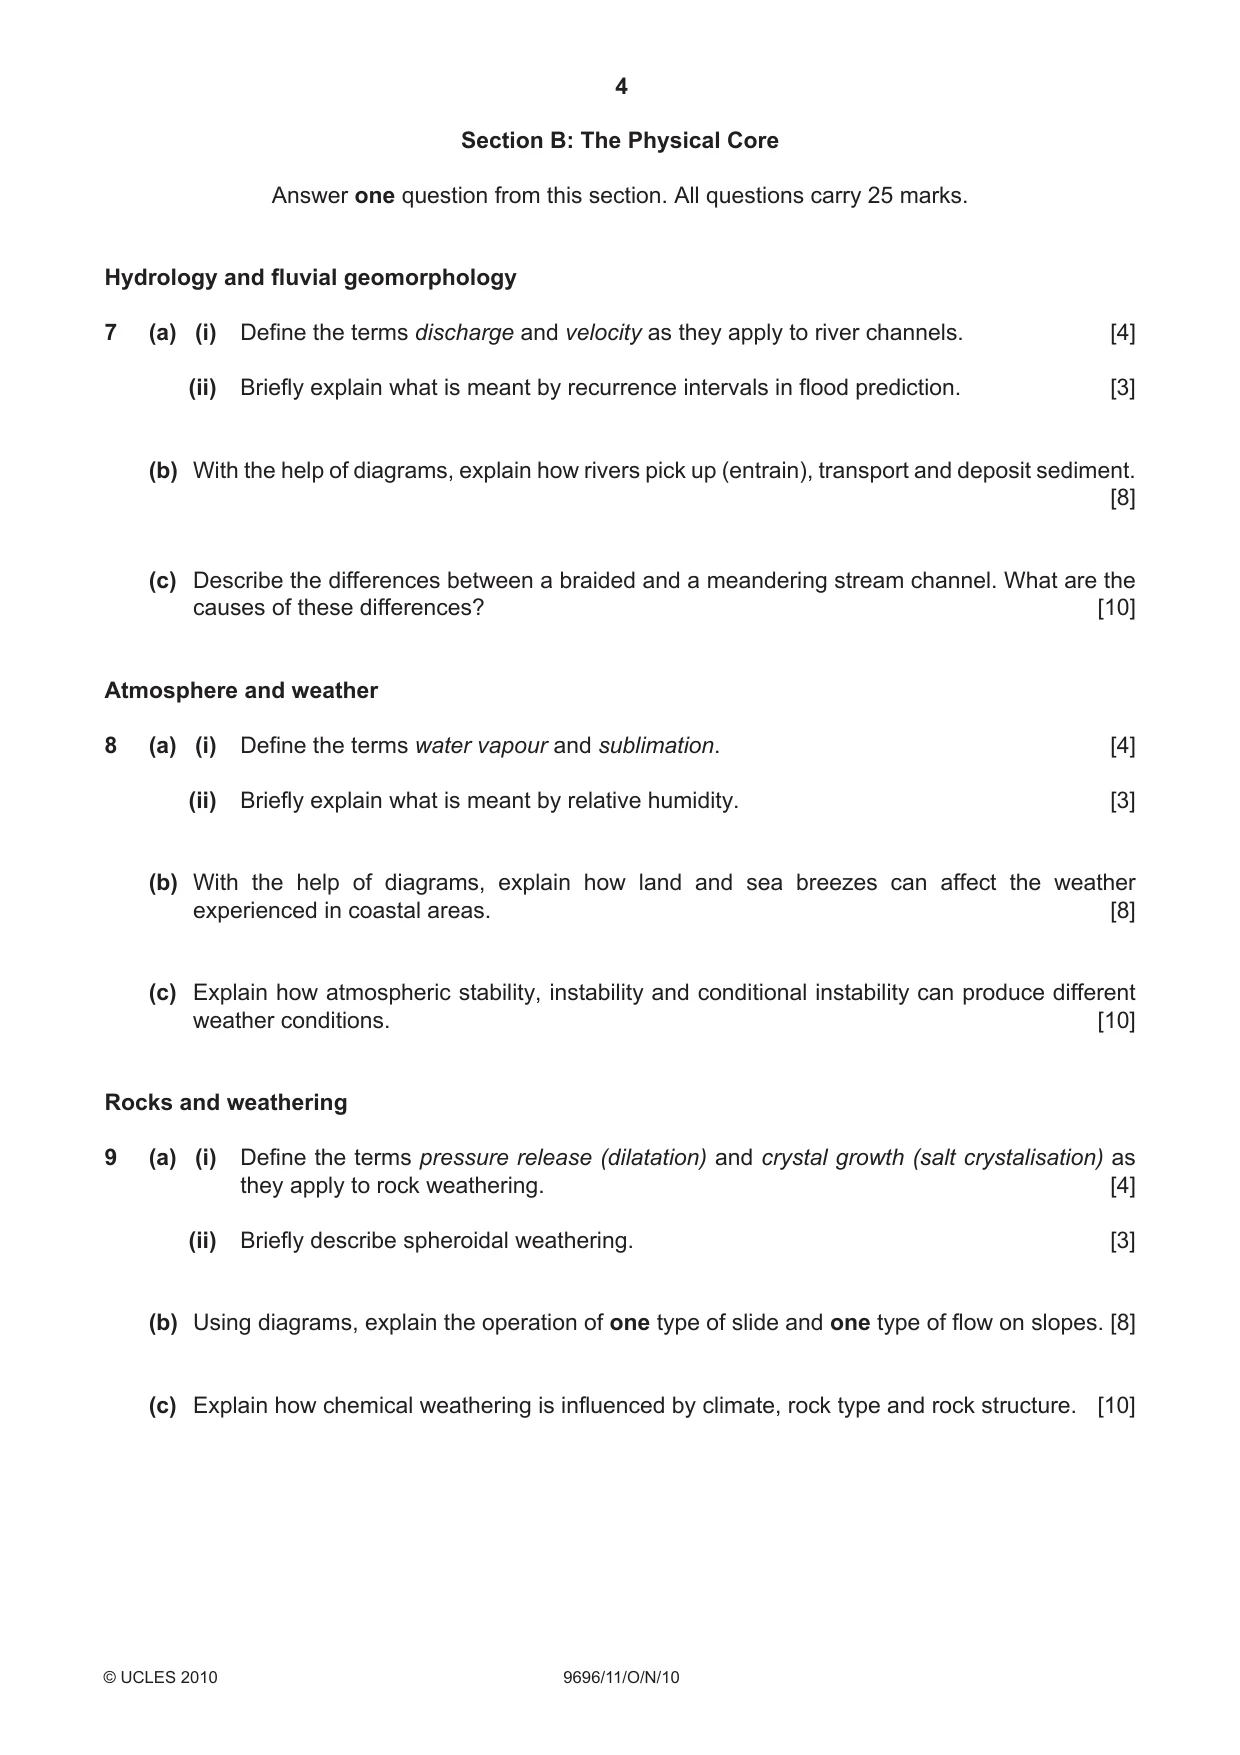
4 9696/11/O/N/10 © UCLES 2010 Section B: The Physical Core Answer one question from this section. All questions carry 25 marks. Hydrology and fluvial geomorphology 7 (a) (i) Define the terms discharge and velocity as they apply to river channels. [4] (ii) Briefly explain what is meant by recurrence intervals in flood prediction. [3] (b) With the help of diagrams, explain how rivers pick up (entrain), transport and deposit sediment. [8] (c) Describe the differences between a braided and a meandering stream channel. What are the causes of these differences? [10] Atmosphere and weather 8 (a) (i) Define the terms water vapour and sublimation. [4] (ii) Briefly explain what is meant by relative humidity. [3] (b) With the help of diagrams, explain how land and sea breezes can affect the weather experienced in coastal areas. [8] (c) Explain how atmospheric stability, instability and conditional instability can produce different weather conditions. [10] Rocks and weathering 9 (a) (i) Define the terms pressure release (dilatation) and crystal growth (salt crystalisation) as they apply to rock weathering. [4] (ii) Briefly describe spheroidal weathering. [3] (b) Using diagrams, explain the operation of one type of slide and one type of flow on slopes. [8] (c) Explain how chemical weathering is influenced by climate, rock type and rock structure. [10]
Question paper, page 5
5 9696/11/O/N/10 © UCLES 2010 [Turn over Section C: The Human Core Answer one question from this section. All questions carry 25 marks. Population 10 (a) (i) Give the meaning of the term life expectancy. [3] (ii) Explain two ways in which education may help to increase life expectancy. [4] (b) With the help of examples, explain why, in LEDCs, life expectancy is usually higher in urban areas than in rural areas. [8] (c) Why may attempts to increase life expectancy sometimes fail? [10] Migration 11 (a) (i) Give the meaning of the term international economic migration. [3] (ii) Suggest two reasons why international migration is increasing. [4] With reference to one case study of international migration: (b) describe its causes, character and scale; [8] (c) assess its impacts on the places people left (source areas) and the places people migrated to (receiving areas). [10] Settlement dynamics 12 (a) With reference to one or more examples, describe the location of shanty towns (squatter settlements) in urban areas in LEDCs. [7] (b) Study Photograph A, which shows part of a shanty town within Manila in the Philippines, an LEDC in Asia. (i) Describe what risks the residents may face living in such areas. [4] (ii) Suggest two ways in which the city authorities could improve the quality of life for people who live there. [4] (c) ‘Where people live in urban areas is about their ability to pay’. How far do you agree? [10]
Question paper, page 6
6 9696/11/O/N/10 © UCLES 2010 BLANK PAGE
Question paper, page 7
7 9696/11/O/N/10 © UCLES 2010 BLANK PAGE
Question paper, page 8
8 Copyright Acknowledgements: Question 4 Table 1 © www.nationmaster.com/country/ml-mali/peo-people3d/country/it.italy/peo-people; 29 May 2009. Question 6 Figure 5 © John C Hudson; Chicago, A Geography of the City and its Region; The Center for American Places Inc.; 2006. Question 12 Photograph A © www.learner.org/channel/courses/envsci/visual/img_med/open_canal.jpg; 7 August 2008. Permission to reproduce items where third-party owned material protected by copyright is included has been sought and cleared where possible. Every reasonable effort has been made by the publisher (UCLES) to trace copyright holders, but if any items requiring clearance have unwittingly been included, the publisher will be pleased to make amends at the earliest possible opportunity. University of Cambridge International Examinations is part of the Cambridge Assessment Group. Cambridge Assessment is the brand name of University of Cambridge Local Examinations Syndicate (UCLES), which is itself a department of the University of Cambridge. 9696/11/O/N/10 © UCLES 2010 BLANK PAGE
Mark scheme, page 1
UNIVERSITY OF CAMBRIDGE INTERNATIONAL EXAMINATIONS GCE Advanced Subsidiary Level and GCE Advanced Level MARK SCHEME for the October/November 2010 question paper for the guidance of teachers 9696 GEOGRAPHY 9696/11 Paper 1 (Core Geography), maximum raw mark 100 This mark scheme is published as an aid to teachers and candidates, to indicate the requirements of the examination. It shows the basis on which Examiners were instructed to award marks. It does not indicate the details of the discussions that took place at an Examiners’ meeting before marking began, which would have considered the acceptability of alternative answers. Mark schemes must be read in conjunction with the question papers and the report on the examination. • CIE will not enter into discussions or correspondence in connection with these mark schemes. CIE is publishing the mark schemes for the October/November 2010 question papers for most IGCSE, GCE Advanced Level and Advanced Subsidiary Level syllabuses and some Ordinary Level syllabuses.
Mark scheme, page 2
Page 2 Mark Scheme: Teachers’ version Syllabus Paper GCE AS/A LEVEL – October/November 2010 9696 11 © UCLES 2010 Section A Answer five questions in this section. All questions carry 10 marks. Hydrology and fluvial geomorphology 1 Fig.1 shows a storm hydrograph. (a) On Fig.1: (i) Mark and name the peak discharge; [1] Top of discharge curve (ii) Show lag time; [1] Highest ppt to peak discharge (iii) Draw a line indicating baseflow; [1] Line joining pts where rising limb begins and recession limb flattens (iv) Label the recession limb. [1] Declining discharge limb (b) Explain how, in a catchment area, the shape of a hydrograph can be affected by: (i) geology and soil; Permeable rocks (chalk, limestone) store ppt and release it slowly as base flow lengthening lag time and flattening discharge curve (lower peak discharge). Impermable rocks (granite, schists) have more rapid response shortening lag time and giving higher peak discharge with steeper rising and recession limbs. Similarly clay soils as against sandy or loamy soils. (ii) drainage density. [6] (Ave length of stream channel per sq. km) High dd gives faster flow to the channel giving short lag times and high peak discharge. [Total: 10]
Mark scheme, page 3
Page 3 Mark Scheme: Teachers’ version Syllabus Paper GCE AS/A LEVEL – October/November 2010 9696 11 © UCLES 2010 Atmosphere and weather 2 Fig. 2 shows the distribution of night time temperatures across a large city. (a) (i) State the location and temperature recorded at A. [1] City centre 11°C (ii) State the location and temperature recorded at B. [1] Urban fringe (edge of city/rural) 6°C (b) Describe the pattern of night time temperatures shown in Fig. 2. [3] There is a decline of T by 6°C from the city centre to the urban fringe over a distance of about 20 kms. Temperatures decline most rapidly where the urban fringe is most intermittent (i.e. near B) and along the north of the main river which is relatively free of urban development. Temps decline most slowly over the inner urban area. (c) Explain why night time temperatures vary across the city. [5] The night time temperatures remain warmer within the city due to the urban heat island effect. Incoming radiation is stored by the darker surfaces during the day and slowly released at night. Anthropogenic heat also adds to the higher temperatures and the greater concentration of activity in the centre gives the highest temperatures. The intrusion of the river valley produces quicker cooling due to its more open aspect and lower specific heat capacity. [Total: 10] Rocks and weathering 3 Fig. 3 shows the global distribution of tectonic plates. (a) (i) Name the type of plate margin shown at X. [1] Constructive boundary (ii) Name the type of plate margin shown at Y. [1] Destructive boundary (b) Draw a labelled diagram to show the processes occurring at X. [4] Diagram should show sea floor spreading driven by convection currents around a central oceanic ridge. (c) Explain how volcanoes are produced at Y. [4] As the oceanic plate is subducted beneath the continental plate, melting occurs in the Benioff zone and molten magma forces its way through faults to the surface to form volcanoes. [Total: 10]
Mark scheme, page 4
Page 4 Mark Scheme: Teachers’ version Syllabus Paper GCE AS/A LEVEL – October/November 2010 9696 11 © UCLES 2010 Population 4 Table 1 shows selected population statistics for Mali, an LEDC in Africa, and Italy, an MEDC in Europe, in 2005. (a) Calculate N, the natural increase rate for Mali. [1] 33 per 1000, ideally or, less likely, as 3.3% (b) How did the total fertility rates of Mali and Italy in 2005 compare with replacement level fertility? [3] Replacement level is 2.1. Mali’s TFR is very high, 7.3, an average of over 7 children per woman, so more than 3 times replacement level, whereas Italy’s is very low, an average of 1.3, meaning that many women have no child or one child. It is below replacement level; the population is not replacing itself. Credit understanding shown in the comparison offered 2 and data support 1. (c) Suggest an explanation for either Mali’s youthful age structure or Italy’s ageing population. [6] Both are likely to locate the country in a stage in the demographic transition (which is a descriptive model), then explain relative trends in BR and DR. Mali Stage 2 or 3 BR far higher than DR, but maybe starting to drop (no evidence from static 2005 data) BR is high because of traditional society, value placed on children, cultural beliefs about family size, need for labour and income, lack of access to family planning, etc. DR has been lowered by improvements in healthcare, food supply, sanitation, through the work of UN, government, NGOs, etc. Italy Stage 4 or 5 BR below DR (fluctuating if Stage 4, no evidence from static 2005 data), population is declining slowly. BR is very low because of changes in attitudes to children, cost of raising children, social change, new norms, ease of access to and low cost of contraception, and an age structure where a smaller proportion of women are of childbearing age. DR is very low because of advanced healthcare systems, high standards of living, etc. so that most people die of old age. Over time the average age rises, hence an ageing population. For full marks, candidates should consider BR, DR and age structure. For BR only, if done well, suggest max. 4. [Total: 10]
Mark scheme, page 5
Page 5 Mark Scheme: Teachers’ version Syllabus Paper GCE AS/A LEVEL – October/November 2010 9696 11 © UCLES 2010 Population / Migration / Settlement dynamics 5 Fig. 4 shows changes in the urban population and rural population of China between 1970 and 2030. (a) In what year are the urban and rural populations predicted to be equal in number? [1] 2015 (b) Compare the changes in the urban and rural populations of China between 1970 and 2010, supporting your response with data from Fig. 4. [4] The overall trend is a rise and fall in rural population, at a high level, compared with continuous strong growth in urban population at a lower level, progressively closing the gap between the two. Urban population growth accelerates between 1970 and 1985. In 1970, the urban population is approx. 150 million, the rural far greater, just under 700 million. In 2010, the urban population had grown very fast to 600 million (four times its size in 1970), whereas the rural population, having increased up to 1990/1995, had declined back to 750 million. A full answer should include some reference to both dates and population numbers as data. For two separate descriptions without ‘an element of comparison’, max. 2. Comparison may be made using simple words such as “but” or “however”. (c) How may the growth of China’s urban population, shown in Fig. 4, be explained? [5] Note that the syllabus requires no specific knowledge of China, although some will know of its population policies and recent economic development. Credit wider understanding of the dynamics involved, a combination of: • rural-urban migration. Candidates may make reference to rural push factors and urban pull factors. • urbanisation (the progressive concentration of population into urban areas). • natural increase should be allowed. Mention of population momentum may also be useful. [Total: 10]
Mark scheme, page 6
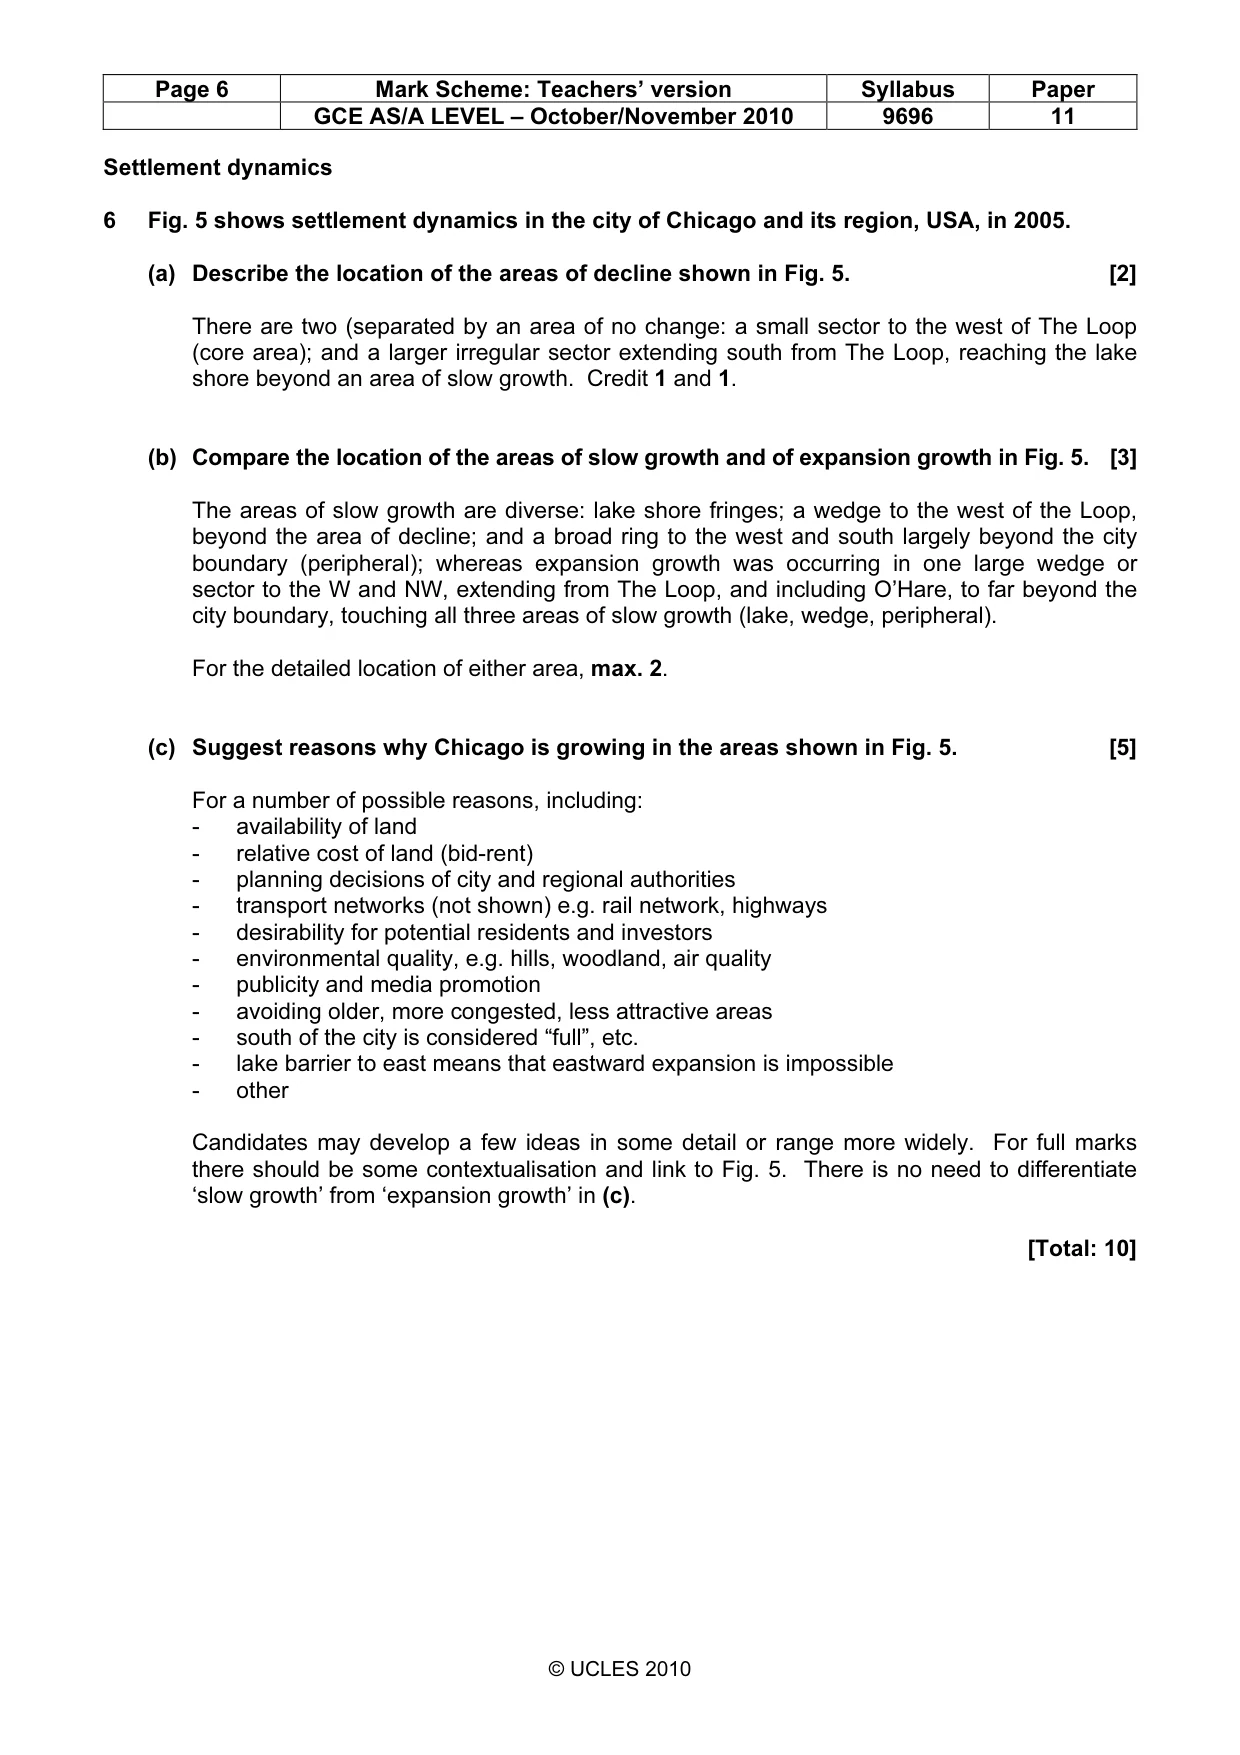
Page 6 Mark Scheme: Teachers’ version Syllabus Paper GCE AS/A LEVEL – October/November 2010 9696 11 © UCLES 2010 Settlement dynamics 6 Fig. 5 shows settlement dynamics in the city of Chicago and its region, USA, in 2005. (a) Describe the location of the areas of decline shown in Fig. 5. [2] There are two (separated by an area of no change: a small sector to the west of The Loop (core area); and a larger irregular sector extending south from The Loop, reaching the lake shore beyond an area of slow growth. Credit 1 and 1. (b) Compare the location of the areas of slow growth and of expansion growth in Fig. 5. [3] The areas of slow growth are diverse: lake shore fringes; a wedge to the west of the Loop, beyond the area of decline; and a broad ring to the west and south largely beyond the city boundary (peripheral); whereas expansion growth was occurring in one large wedge or sector to the W and NW, extending from The Loop, and including O’Hare, to far beyond the city boundary, touching all three areas of slow growth (lake, wedge, peripheral). For the detailed location of either area, max. 2. (c) Suggest reasons why Chicago is growing in the areas shown in Fig. 5. [5] For a number of possible reasons, including: - availability of land - relative cost of land (bid-rent) - planning decisions of city and regional authorities - transport networks (not shown) e.g. rail network, highways - desirability for potential residents and investors - environmental quality, e.g. hills, woodland, air quality - publicity and media promotion - avoiding older, more congested, less attractive areas - south of the city is considered “full”, etc. - lake barrier to east means that eastward expansion is impossible - other Candidates may develop a few ideas in some detail or range more widely. For full marks there should be some contextualisation and link to Fig. 5. There is no need to differentiate ‘slow growth’ from ‘expansion growth’ in (c). [Total: 10]
Mark scheme, page 7
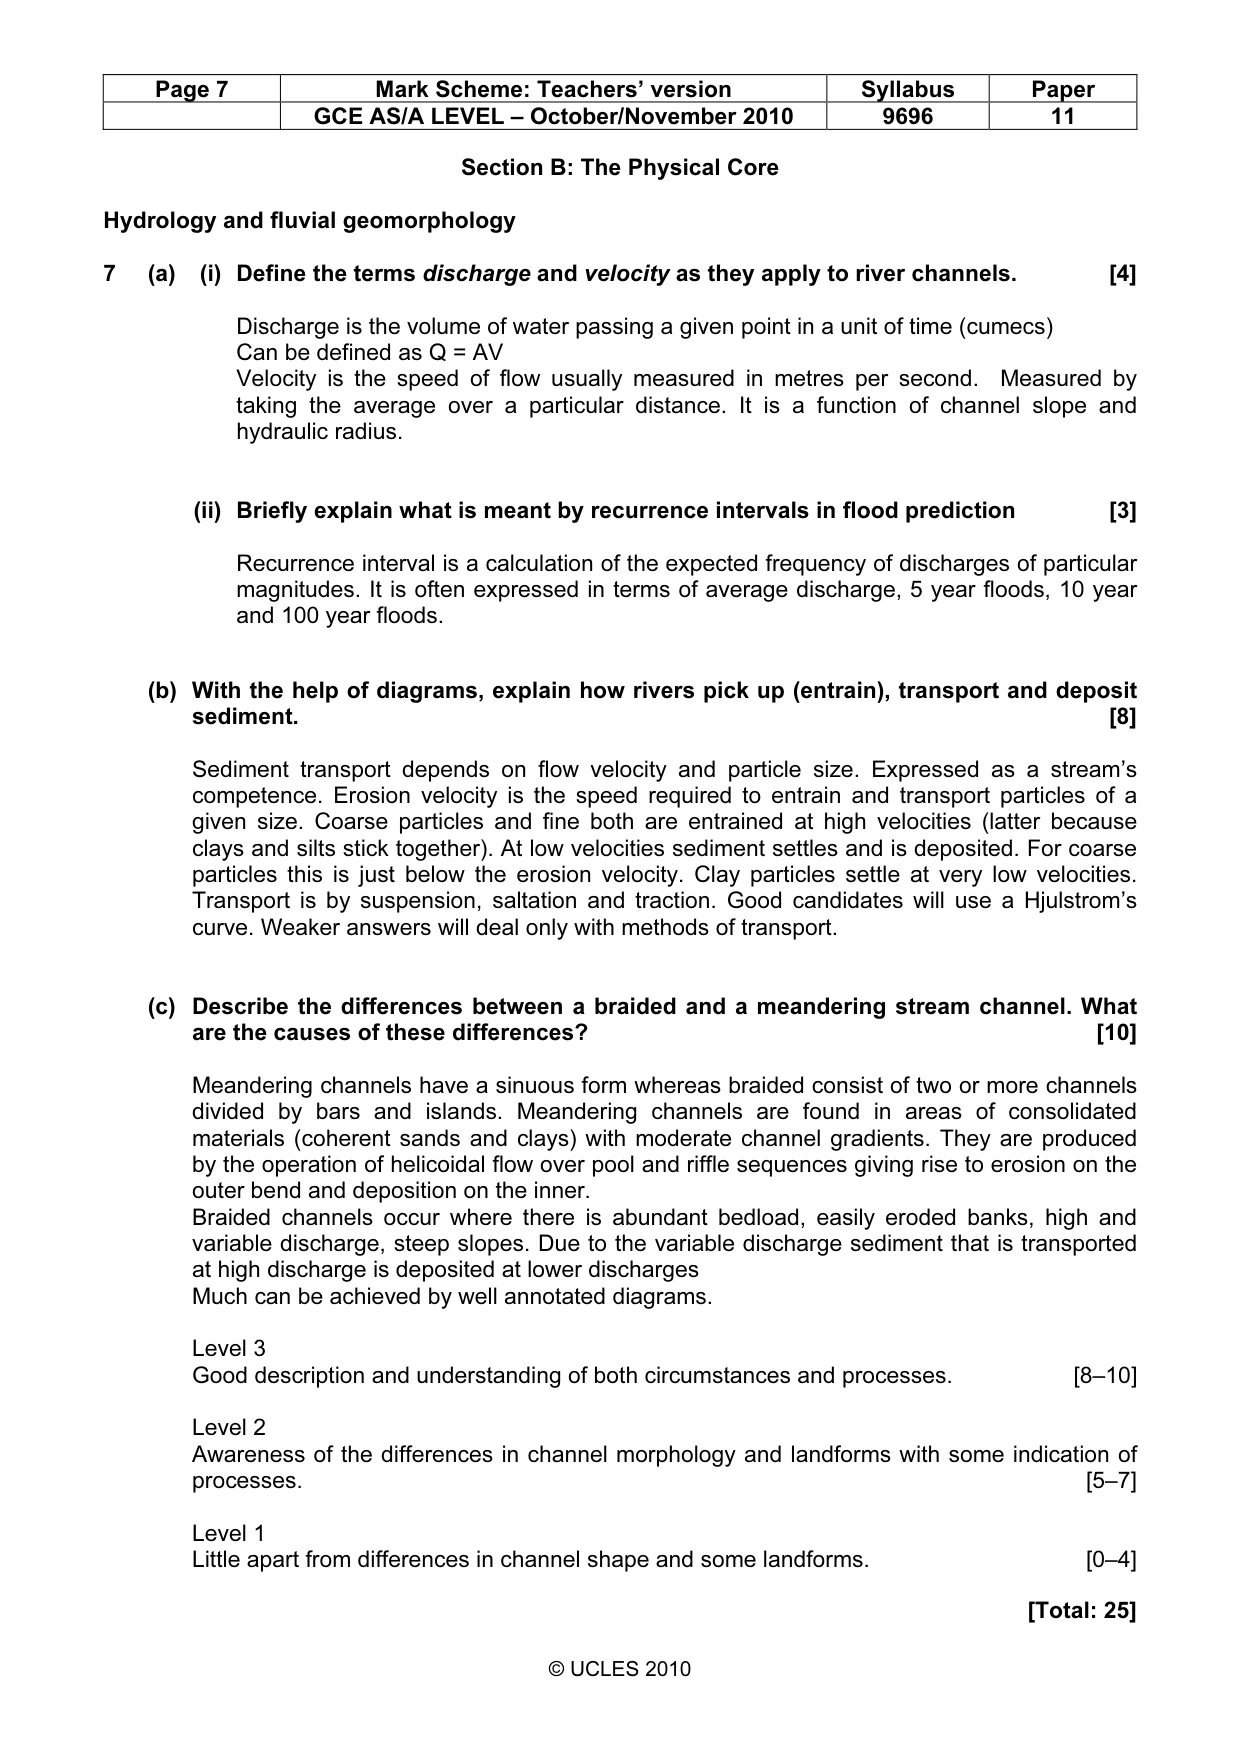
Page 7 Mark Scheme: Teachers’ version Syllabus Paper GCE AS/A LEVEL – October/November 2010 9696 11 © UCLES 2010 Section B: The Physical Core Hydrology and fluvial geomorphology 7 (a) (i) Define the terms discharge and velocity as they apply to river channels. [4] Discharge is the volume of water passing a given point in a unit of time (cumecs) Can be defined as Q = AV Velocity is the speed of flow usually measured in metres per second. Measured by taking the average over a particular distance. It is a function of channel slope and hydraulic radius. (ii) Briefly explain what is meant by recurrence intervals in flood prediction [3] Recurrence interval is a calculation of the expected frequency of discharges of particular magnitudes. It is often expressed in terms of average discharge, 5 year floods, 10 year and 100 year floods. (b) With the help of diagrams, explain how rivers pick up (entrain), transport and deposit sediment. [8] Sediment transport depends on flow velocity and particle size. Expressed as a stream’s competence. Erosion velocity is the speed required to entrain and transport particles of a given size. Coarse particles and fine both are entrained at high velocities (latter because clays and silts stick together). At low velocities sediment settles and is deposited. For coarse particles this is just below the erosion velocity. Clay particles settle at very low velocities. Transport is by suspension, saltation and traction. Good candidates will use a Hjulstrom’s curve. Weaker answers will deal only with methods of transport. (c) Describe the differences between a braided and a meandering stream channel. What are the causes of these differences? [10] Meandering channels have a sinuous form whereas braided consist of two or more channels divided by bars and islands. Meandering channels are found in areas of consolidated materials (coherent sands and clays) with moderate channel gradients. They are produced by the operation of helicoidal flow over pool and riffle sequences giving rise to erosion on the outer bend and deposition on the inner. Braided channels occur where there is abundant bedload, easily eroded banks, high and variable discharge, steep slopes. Due to the variable discharge sediment that is transported at high discharge is deposited at lower discharges Much can be achieved by well annotated diagrams. Level 3 Good description and understanding of both circumstances and processes. [8–10] Level 2 Awareness of the differences in channel morphology and landforms with some indication of processes. [5–7] Level 1 Little apart from differences in channel shape and some landforms. [0–4] [Total: 25]
Mark scheme, page 8
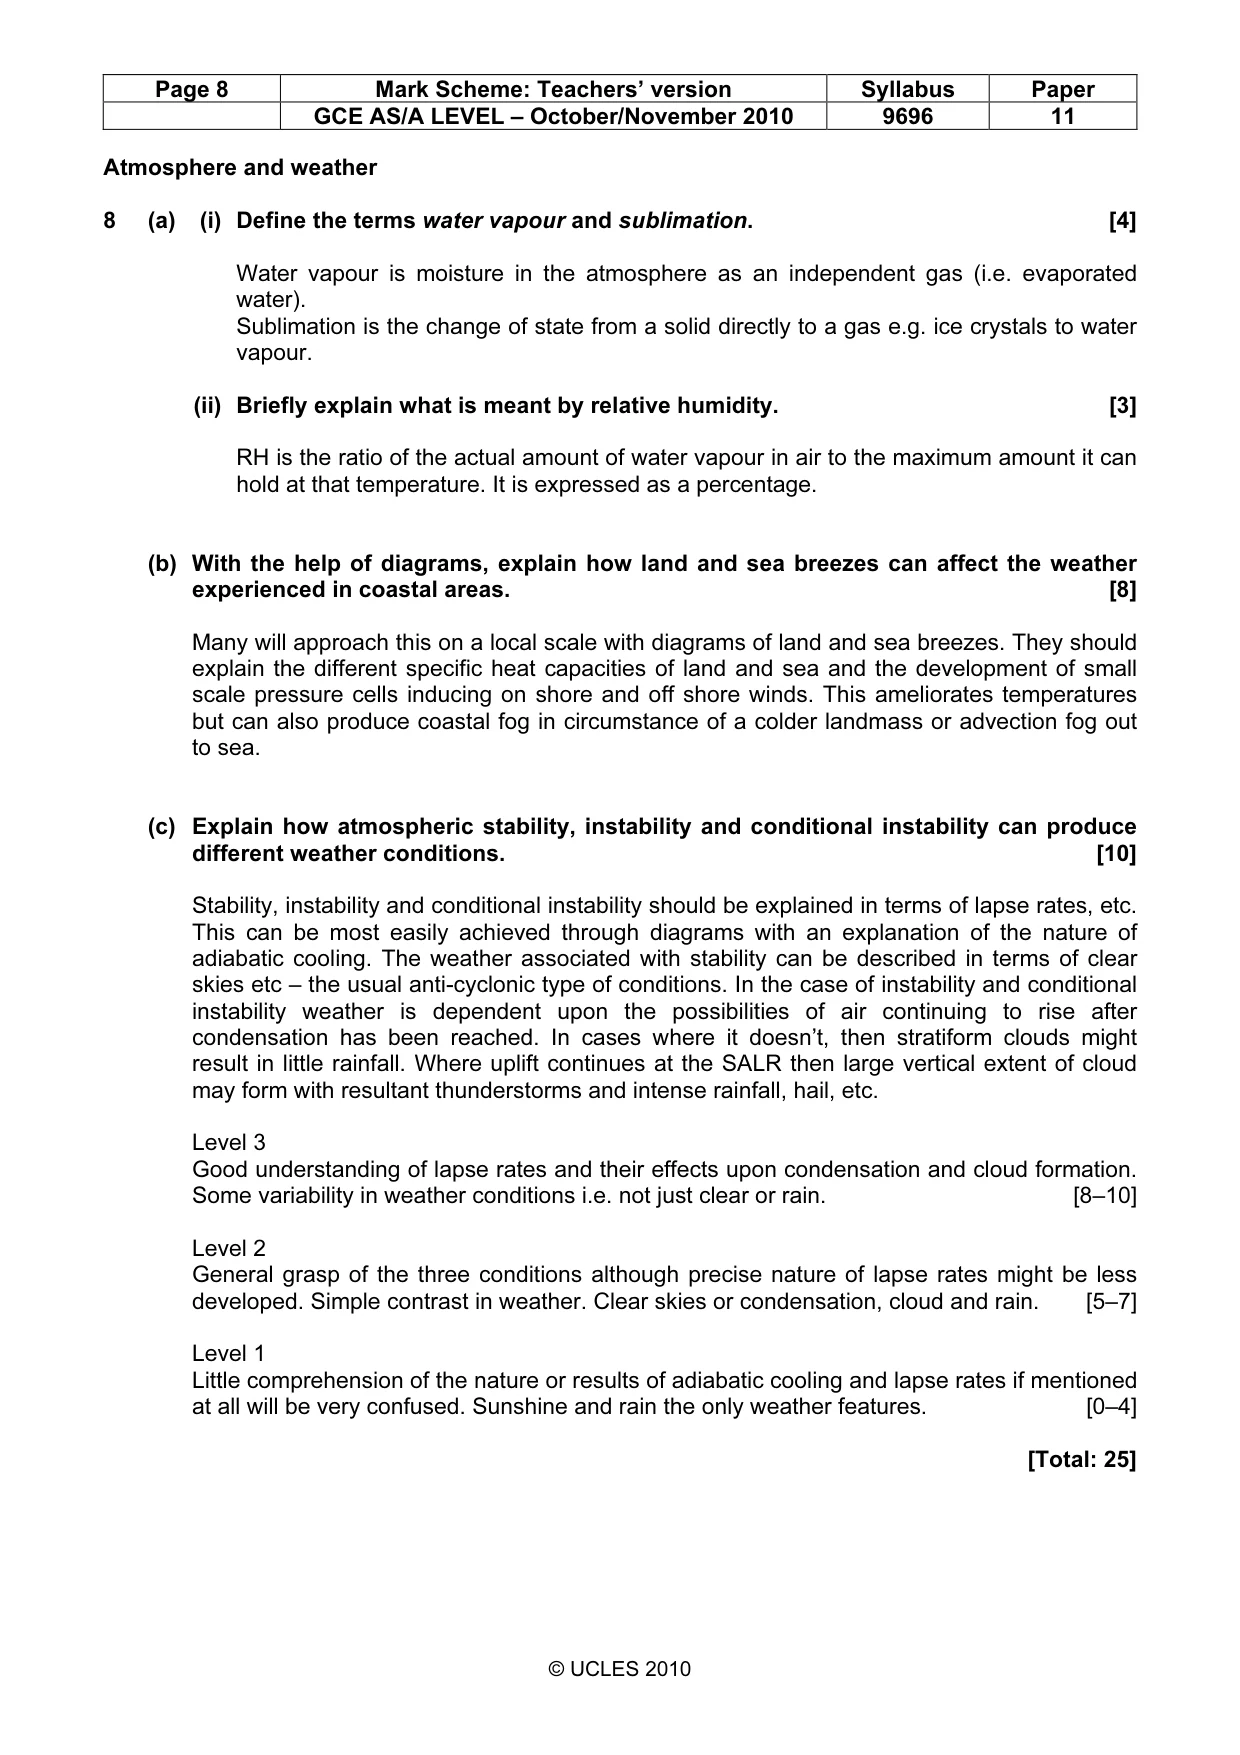
Page 8 Mark Scheme: Teachers’ version Syllabus Paper GCE AS/A LEVEL – October/November 2010 9696 11 © UCLES 2010 Atmosphere and weather 8 (a) (i) Define the terms water vapour and sublimation. [4] Water vapour is moisture in the atmosphere as an independent gas (i.e. evaporated water). Sublimation is the change of state from a solid directly to a gas e.g. ice crystals to water vapour. (ii) Briefly explain what is meant by relative humidity. [3] RH is the ratio of the actual amount of water vapour in air to the maximum amount it can hold at that temperature. It is expressed as a percentage. (b) With the help of diagrams, explain how land and sea breezes can affect the weather experienced in coastal areas. [8] Many will approach this on a local scale with diagrams of land and sea breezes. They should explain the different specific heat capacities of land and sea and the development of small scale pressure cells inducing on shore and off shore winds. This ameliorates temperatures but can also produce coastal fog in circumstance of a colder landmass or advection fog out to sea. (c) Explain how atmospheric stability, instability and conditional instability can produce different weather conditions. [10] Stability, instability and conditional instability should be explained in terms of lapse rates, etc. This can be most easily achieved through diagrams with an explanation of the nature of adiabatic cooling. The weather associated with stability can be described in terms of clear skies etc – the usual anti-cyclonic type of conditions. In the case of instability and conditional instability weather is dependent upon the possibilities of air continuing to rise after condensation has been reached. In cases where it doesn’t, then stratiform clouds might result in little rainfall. Where uplift continues at the SALR then large vertical extent of cloud may form with resultant thunderstorms and intense rainfall, hail, etc. Level 3 Good understanding of lapse rates and their effects upon condensation and cloud formation. Some variability in weather conditions i.e. not just clear or rain. [8–10] Level 2 General grasp of the three conditions although precise nature of lapse rates might be less developed. Simple contrast in weather. Clear skies or condensation, cloud and rain. [5–7] Level 1 Little comprehension of the nature or results of adiabatic cooling and lapse rates if mentioned at all will be very confused. Sunshine and rain the only weather features. [0–4] [Total: 25]
Mark scheme, page 9
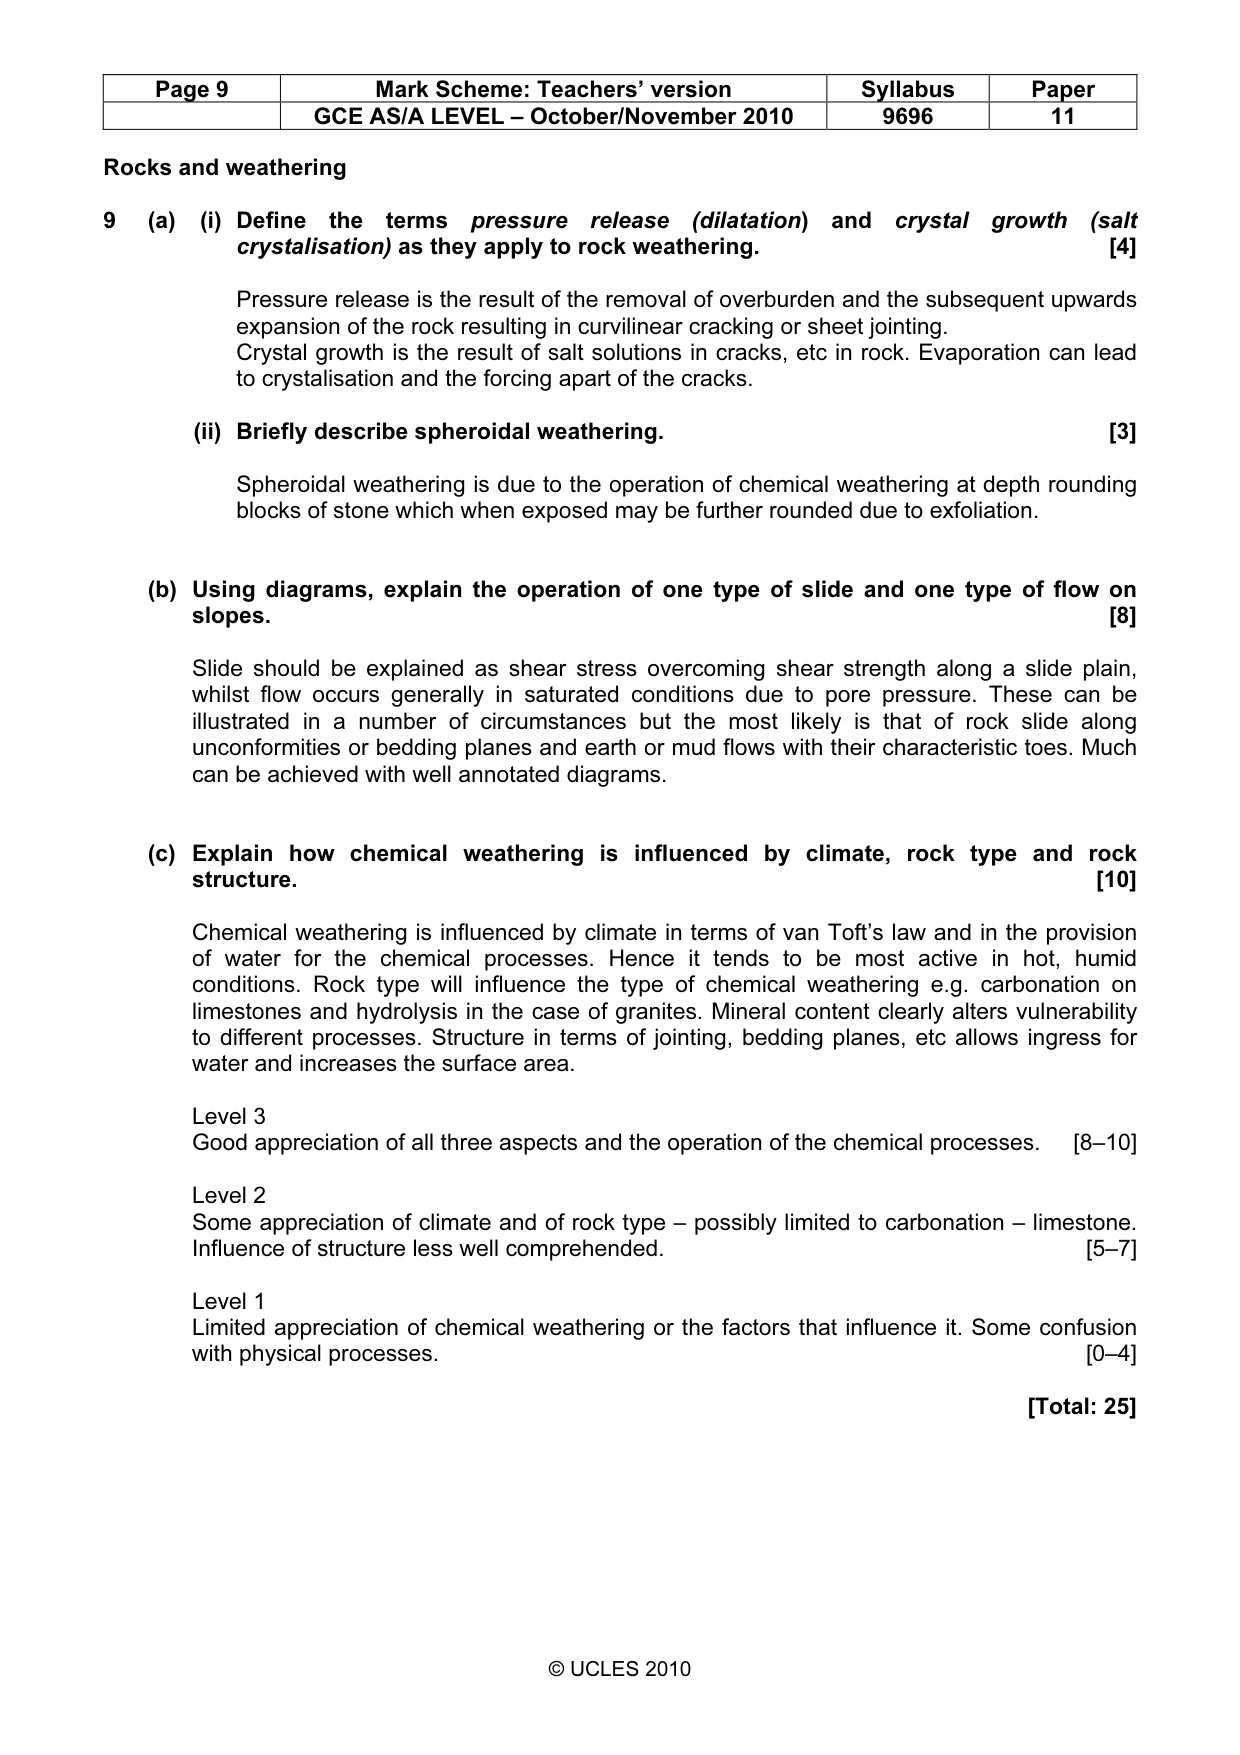
Page 9 Mark Scheme: Teachers’ version Syllabus Paper GCE AS/A LEVEL – October/November 2010 9696 11 © UCLES 2010 Rocks and weathering 9 (a) (i) Define the terms pressure release (dilatation) and crystal growth (salt crystalisation) as they apply to rock weathering. [4] Pressure release is the result of the removal of overburden and the subsequent upwards expansion of the rock resulting in curvilinear cracking or sheet jointing. Crystal growth is the result of salt solutions in cracks, etc in rock. Evaporation can lead to crystalisation and the forcing apart of the cracks. (ii) Briefly describe spheroidal weathering. [3] Spheroidal weathering is due to the operation of chemical weathering at depth rounding blocks of stone which when exposed may be further rounded due to exfoliation. (b) Using diagrams, explain the operation of one type of slide and one type of flow on slopes. [8] Slide should be explained as shear stress overcoming shear strength along a slide plain, whilst flow occurs generally in saturated conditions due to pore pressure. These can be illustrated in a number of circumstances but the most likely is that of rock slide along unconformities or bedding planes and earth or mud flows with their characteristic toes. Much can be achieved with well annotated diagrams. (c) Explain how chemical weathering is influenced by climate, rock type and rock structure. [10] Chemical weathering is influenced by climate in terms of van Toft’s law and in the provision of water for the chemical processes. Hence it tends to be most active in hot, humid conditions. Rock type will influence the type of chemical weathering e.g. carbonation on limestones and hydrolysis in the case of granites. Mineral content clearly alters vulnerability to different processes. Structure in terms of jointing, bedding planes, etc allows ingress for water and increases the surface area. Level 3 Good appreciation of all three aspects and the operation of the chemical processes. [8–10] Level 2 Some appreciation of climate and of rock type – possibly limited to carbonation – limestone. Influence of structure less well comprehended. [5–7] Level 1 Limited appreciation of chemical weathering or the factors that influence it. Some confusion with physical processes. [0–4] [Total: 25]
Mark scheme, page 10
Page 10 Mark Scheme: Teachers’ version Syllabus Paper GCE AS/A LEVEL – October/November 2010 9696 11 © UCLES 2010 Section C: The Human Core Population 10 (a) (i) Give the meaning of the term life expectancy. [3] the average 1 number of years 1 that a person is expected to live from birth 1 (ii) Explain two ways in which education may help to increase life expectancy. [4] There are many possible ways, e.g. educating future mothers about childcare and nutrition; teaching adults in MEDCs about the need for healthier diets; govt. anti-smoking campaigns; HIV awareness, etc. Credit each way 2. (b) With the help of examples, explain why, in LEDCs, life expectancy is usually higher in urban areas than in rural areas. [8] Despite some of the negatives associated with urban residence, LE is usually higher for a number of reasons; - social e.g. higher literacy, younger age structure (subtle point), access to healthcare - economic e.g. if work is available wages may be higher, so more nutritious food can be bought, doctors may be consulted, etc. - environmental e.g. higher % access to piped water and sanitation, less dependency on annual harvest - political e.g. urban areas may be investment priority, elites live there and may favour them, urban refuge from civil war or disasters, etc. Comprehensive answers are not needed, examples may be generic or named and located. (c) Why may attempts to increase life expectancy sometimes fail? [10] Candidates may appeal to any reasons of which they are aware, e.g. attempts may be inappropriate, culturally insensitive, run out of funding, suffer from corruption. Some problems are hard to address, e.g. malaria, HIV/AIDS, people’s wills, or overcome e.g. illiteracy, language barriers, remoteness. Persistent war or socio-economic collapse may decrease LE, etc. Candidates will probably: Level 3 Develop a high quality explanation, showing strong conceptual understanding and detailed knowledge. [8–10] Level 2 Make a reasonable attempt, which may contain good points, but which remains limited in depth or development. [5–7] Level 1 Offer one or more basic ideas and struggle to deal with the issue. Notes and fragments remain in this level. [0–4] [Total: 25]
Mark scheme, page 11
Page 11 Mark Scheme: Teachers’ version Syllabus Paper GCE AS/A LEVEL – October/November 2010 9696 11 © UCLES 2010 Migration 11 (a) (i) Give the meaning of the term international economic migration. [3] the movement of people for one year or more 1 from one country to another / across national borders 1 for the purposes of employment / to earn money / a labour stream 1 (ii) Suggest two reasons why international migration is increasing. [4] Accept any two reasons, e.g. the globalisation of economic activity; improved transport systems; refugee movements; more information available e.g. from media and web. Please do not credit circulation (movements of less than one year, for example in relation to tourism). Credit 2 and 2 With reference to one case study of international migration: (b) describe its causes, character and scale; [8] Suggest no division of marks so that examiners can respond to candidates’ best use of the case study they have. All three elements should be found for full marks. For any one, such as causes, max. 5. (c) assess its impacts on the places people left (source areas) and the places people migrated to (receiving areas). [10] Much depends on the nature of the case study, e.g. an economic migration may impact the population structure, especially of young adults, reduce the birth rate but provide remittances and increase standards of living in source areas. Migrants may be rejected in receiving areas, be perceived as taking locals jobs, or become the backbone of the local economy, e.g. taking menial jobs. The case study of a refugee stream from a natural disaster would clearly differ. Candidates will probably: Level 3 Assess the impacts in both source and receiving areas in a reasonably balanced way, with detailed exemplar support. Identify both positive and negative impacts perceptively. [8–10] Level 2 Provide a sound assessment which may be good in parts, but which is limited through lack of detailed knowledge or by attention to one type of area (source/receiving). [5–7] Level 1 Lack the knowledge or time to make more than a basic response. Write generally, describe impacts rather than assess them. [0–4] [Total: 25]
Mark scheme, page 12
Page 12 Mark Scheme: Teachers’ version Syllabus Paper GCE AS/A LEVEL – October/November 2010 9696 11 © UCLES 2010 Settlement dynamics 12 (a) With reference to one or more examples, describe the location of shanty towns (squatter settlements) in urban areas in LEDCs. [7] Tend to develop illegally on available land, wherever that is found, e.g. vacant plots, on the periphery, along main roads or railway lines, or on areas rejected by other users, such as steep slopes or marshy areas. Some urban authorities designate areas. Many offer proximity to workplaces or to places where jobs might be found e.g. near an industrial zone. Credit a sense of reality, exemplar detail and conceptual understanding of the urban system. (b) Study Photograph A, which shows part of a shanty town within Manila in the Philippines, an LEDC in Asia. (i) Describe what risks the residents may face living in such areas. [4] Candidates may combine observation e.g. contagious disease, risk of fire spreading, illegal electricity tapping, with their wider knowledge, e.g. floods, crime, control by local gangs, etc. (ii) Suggest two ways in which the city authorities could improve the quality of life for people who live there. [4] Accept any sensible way whether or not it relates to a risk in (i), such as, • relocation to a site and services scheme • providing piped water • giving people title to the land they occupy • a community-based literacy scheme Credit 2 and 2, or, exceptionally, 3 and 1. (c) ‘Where people live in urban areas is about their ability to pay’. How far do you agree? [10] A broad invitation to get candidates to consider the ability to pay (bid-rent, etc.) as an economic factor and other factors: social, e.g. culture; historical; and political. Environmental factors tend to mirror the economic, with more desirable locations, e.g. with better views or more open space, costing more. Candidates will probably: Level 3 Develop a good assessment, with detailed support from one or more urban areas, making effective appeal to other factors. [8–10] Level 2 Make a satisfactory but limited response, which may be rather general. The assessment may be broad, partial or lack support. [5–7] Level 1 Make one or more basic points in a response which is more a description than an assessment. Write generally about urban areas or use an example in name only. Offer notes or fragments. [0–4] [Total: 25]
What you needed in this session
Cambridge’s own grade thresholds for 2010 Oct/Nov, Paper 1 · Variant 1. A higher threshold means an easier paper — the bar moves with how the cohort did.