Cambridge A Level Environmental Management (AS only) 8291 — 2017 May/June Paper 1 · Variant 3
8291/13/M/J/17 · 80 marks · ≈90 min
The question paper and its mark scheme, free to read here and free to download. This is Cambridge’s own paper, exactly as it was sat.
Question paper12 pages
Mark scheme15 pages
Answers below. Sit the paper first if you are practising.
Paper as text
Question paper, page 1
This document consists of 12 printed pages. DC (CE/FC) 144118 © UCLES 2017 [Turn over Cambridge International Examinations Cambridge International Advanced Subsidiary Level * 3 8 3 7 0 3 7 4 0 8 * ENVIRONMENTAL MANAGEMENT 8291/13 Paper 1 Lithosphere and Atmosphere May/June 2017 1 hour 30 minutes Additional Materials: Answer Booklet/Paper READ THESE INSTRUCTIONS FIRST Write your Centre number, candidate number and name on all the work you hand in. Write in dark blue or black pen. You may use an HB pencil for any diagrams or graphs. Do not use staples, paper clips, glue or correction fluid. DO NOT WRITE IN ANY BARCODES. Electronic calculators may be used. You may lose marks if you do not show your working or if you do not use appropriate units. Section A Answer all questions in this section. Write your answers in the spaces provided on the question paper. Section B Answer one question from this section. Write your answers on the separate answer paper provided. At the end of the examination, 1. fasten all separate answer paper securely to the question paper; 2. enter the question number from Section B in the grid. For Examiner’s Use Section A 1 2 Section B Total
Question paper, page 2
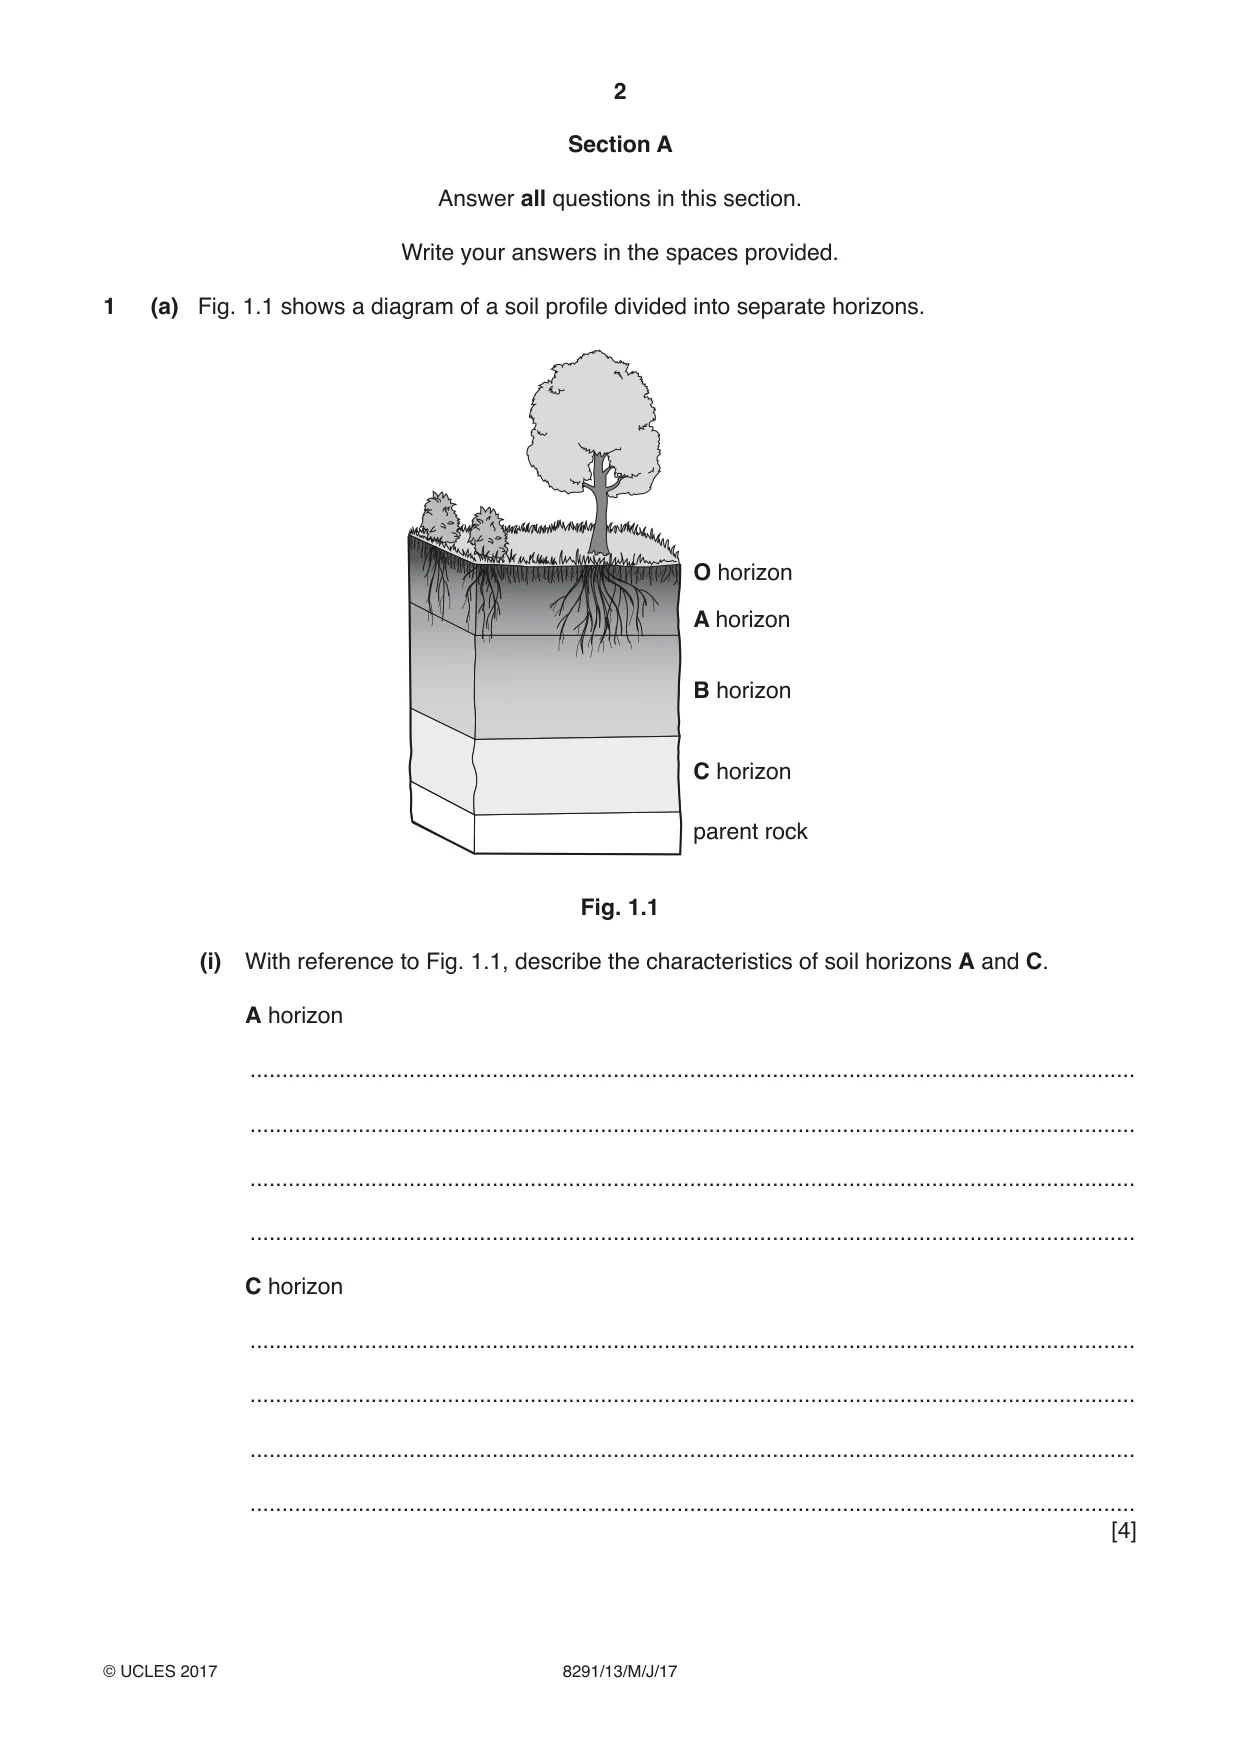
2 8291/13/M/J/17 © UCLES 2017 Section A Answer all questions in this section. Write your answers in the spaces provided. 1 (a) Fig. 1.1 shows a diagram of a soil profile divided into separate horizons. O horizon A horizon B horizon C horizon parent rock Fig. 1.1 (i) With reference to Fig. 1.1, describe the characteristics of soil horizons A and C. A horizon … … … … C horizon … … … … [4]
Question paper, page 3
3 8291/13/M/J/17 © UCLES 2017 [Turn over (ii) State in which horizon in Fig. 1.1 you would expect to find the highest concentration of humus. Explain your answer. … … … …[2] (iii) Explain two ways in which the vegetation shown in Fig. 1.1 may influence the development of the soil. … … … … … … … …[4]
Question paper, page 4
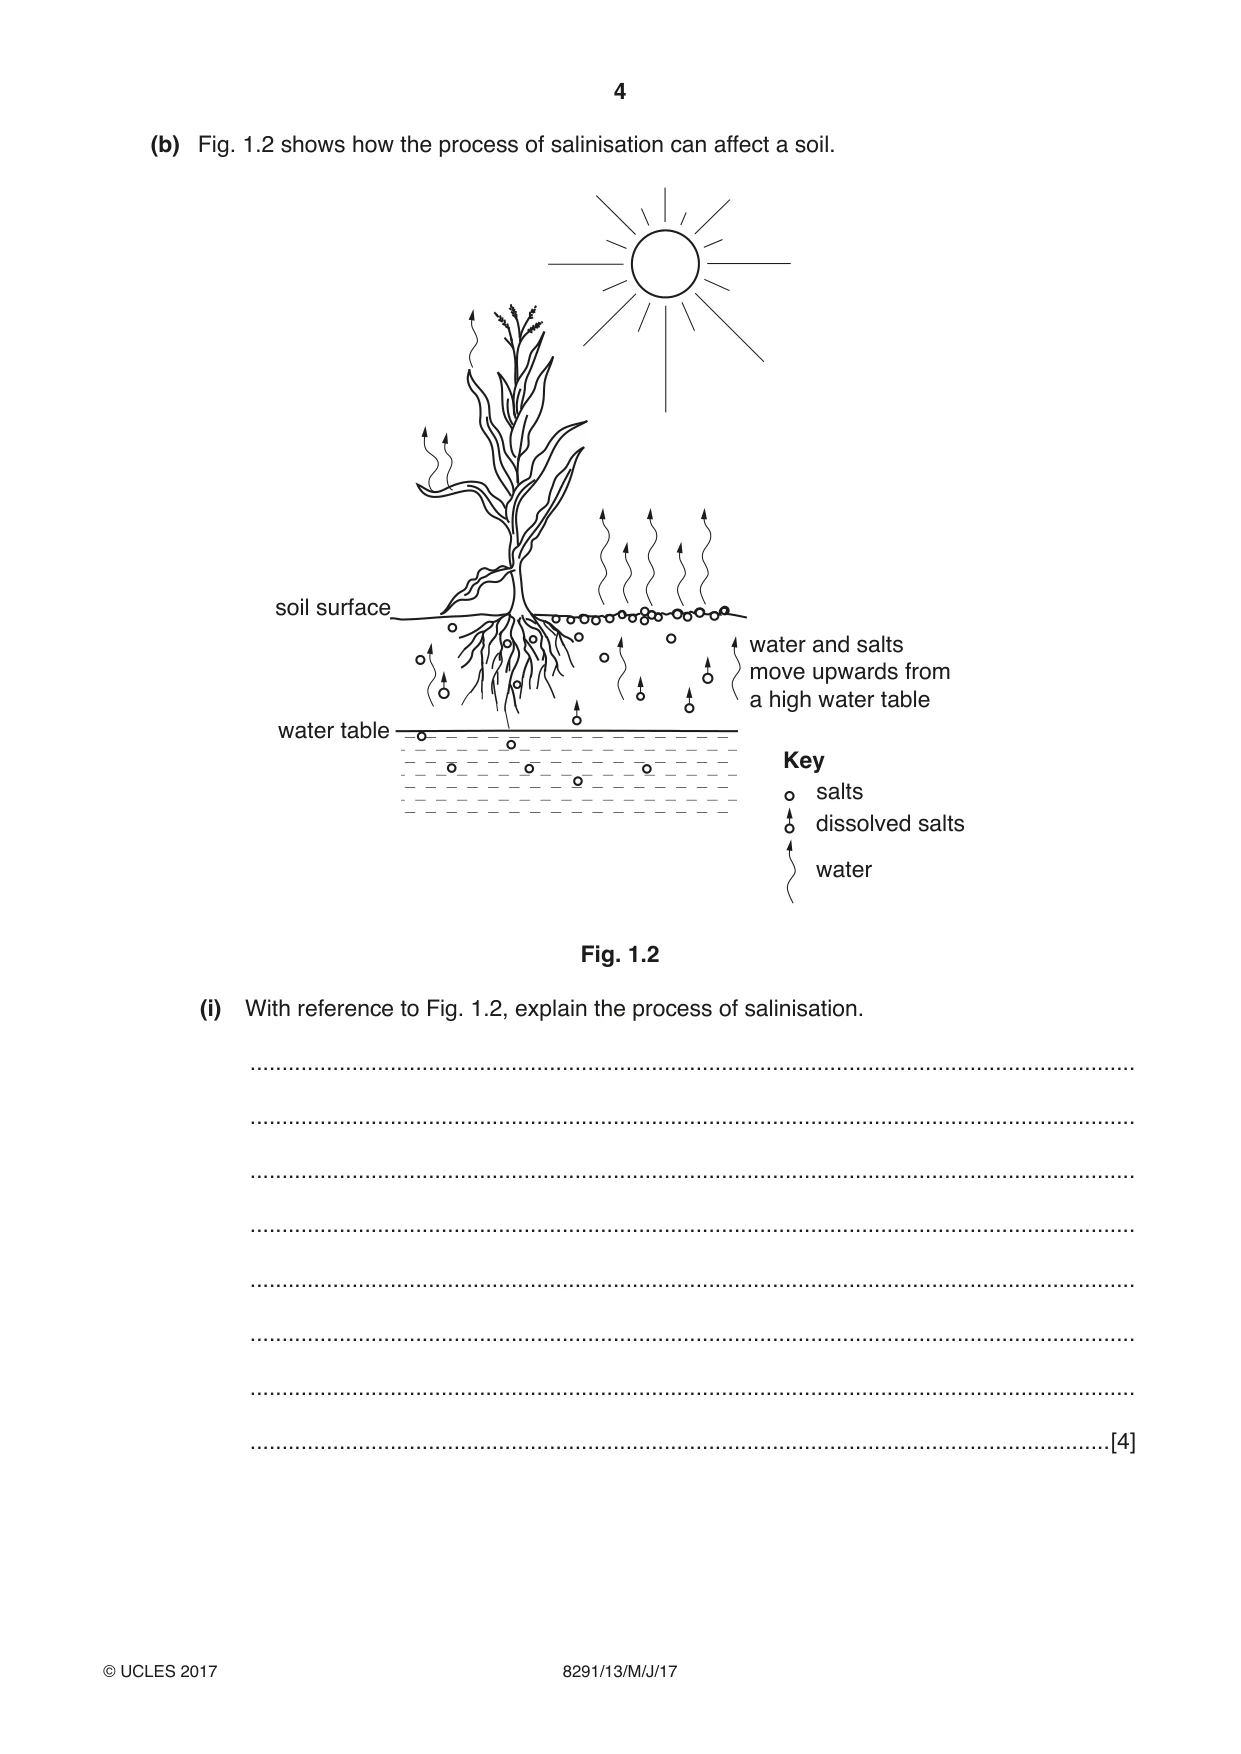
4 8291/13/M/J/17 © UCLES 2017 (b) Fig. 1.2 shows how the process of salinisation can affect a soil. water and salts move upwards from a high water table soil surface water table Key salts dissolved salts water Fig. 1.2 (i) With reference to Fig. 1.2, explain the process of salinisation. … … … … … … … …[4]
Question paper, page 5
5 8291/13/M/J/17 © UCLES 2017 [Turn over (ii) Suggest two ways in which the soil shown in Fig. 1.2 might be managed to allow sustainable use of the soil for agriculture. … … … … … … … … … … … …[6] [Total: 20]
Question paper, page 6
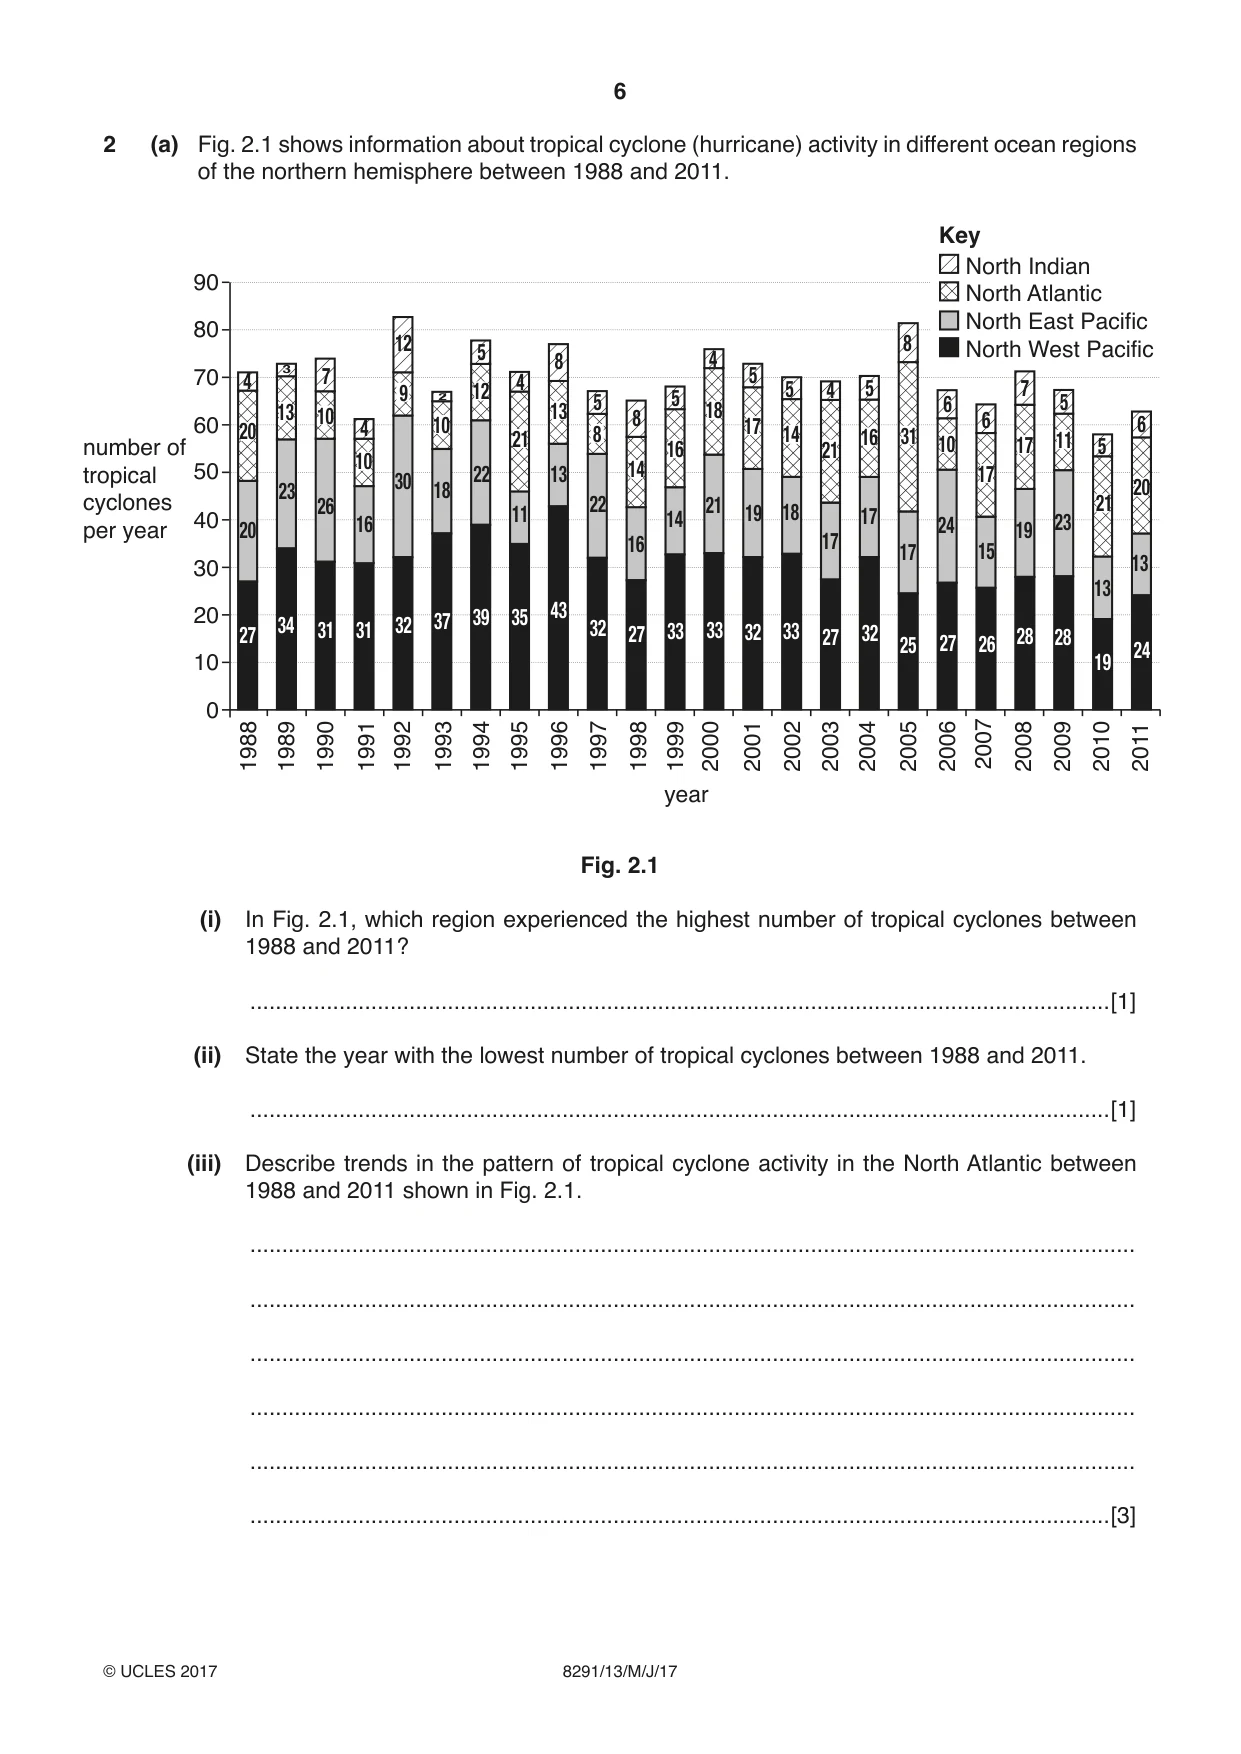
6 8291/13/M/J/17 © UCLES 2017 2 (a) Fig. 2.1 shows information about tropical cyclone (hurricane) activity in different ocean regions of the northern hemisphere between 1988 and 2011. 1988 0 10 20 30 40 50 60 70 80 90 1989 1990 1991 1992 1993 1994 1995 1996 1997 1998 1999 2000 2001 2002 2003 2004 2005 2006 2007 2008 2009 2010 2011 year number of tropical cyclones per year 10 27 20 20 23 13 26 16 30 18 22 11 13 22 16 14 21 19 18 17 17 17 24 31 15 19 23 13 13 20 6 6 6 8 5 4 4 5 5 5 8 5 8 4 5 8 13 9 12 10 10 4 7 3 2 4 14 16 18 17 14 16 21 5 5 7 17 17 10 21 11 34 31 31 32 37 39 35 43 32 27 33 33 32 33 27 32 25 27 26 28 28 19 24 North Indian Key North Atlantic North East Pacific North West Pacific 12 21 Fig. 2.1 (i) In Fig. 2.1, which region experienced the highest number of tropical cyclones between 1988 and 2011? …[1] (ii) State the year with the lowest number of tropical cyclones between 1988 and 2011. …[1] (iii) Describe trends in the pattern of tropical cyclone activity in the North Atlantic between 1988 and 2011 shown in Fig. 2.1. … … … … … …[3]
Question paper, page 7
7 8291/13/M/J/17 © UCLES 2017 [Turn over (iv) Outline one factor that might explain the variability of tropical cyclone activity as shown in Fig. 2.1. … … … …[2]
Question paper, page 8
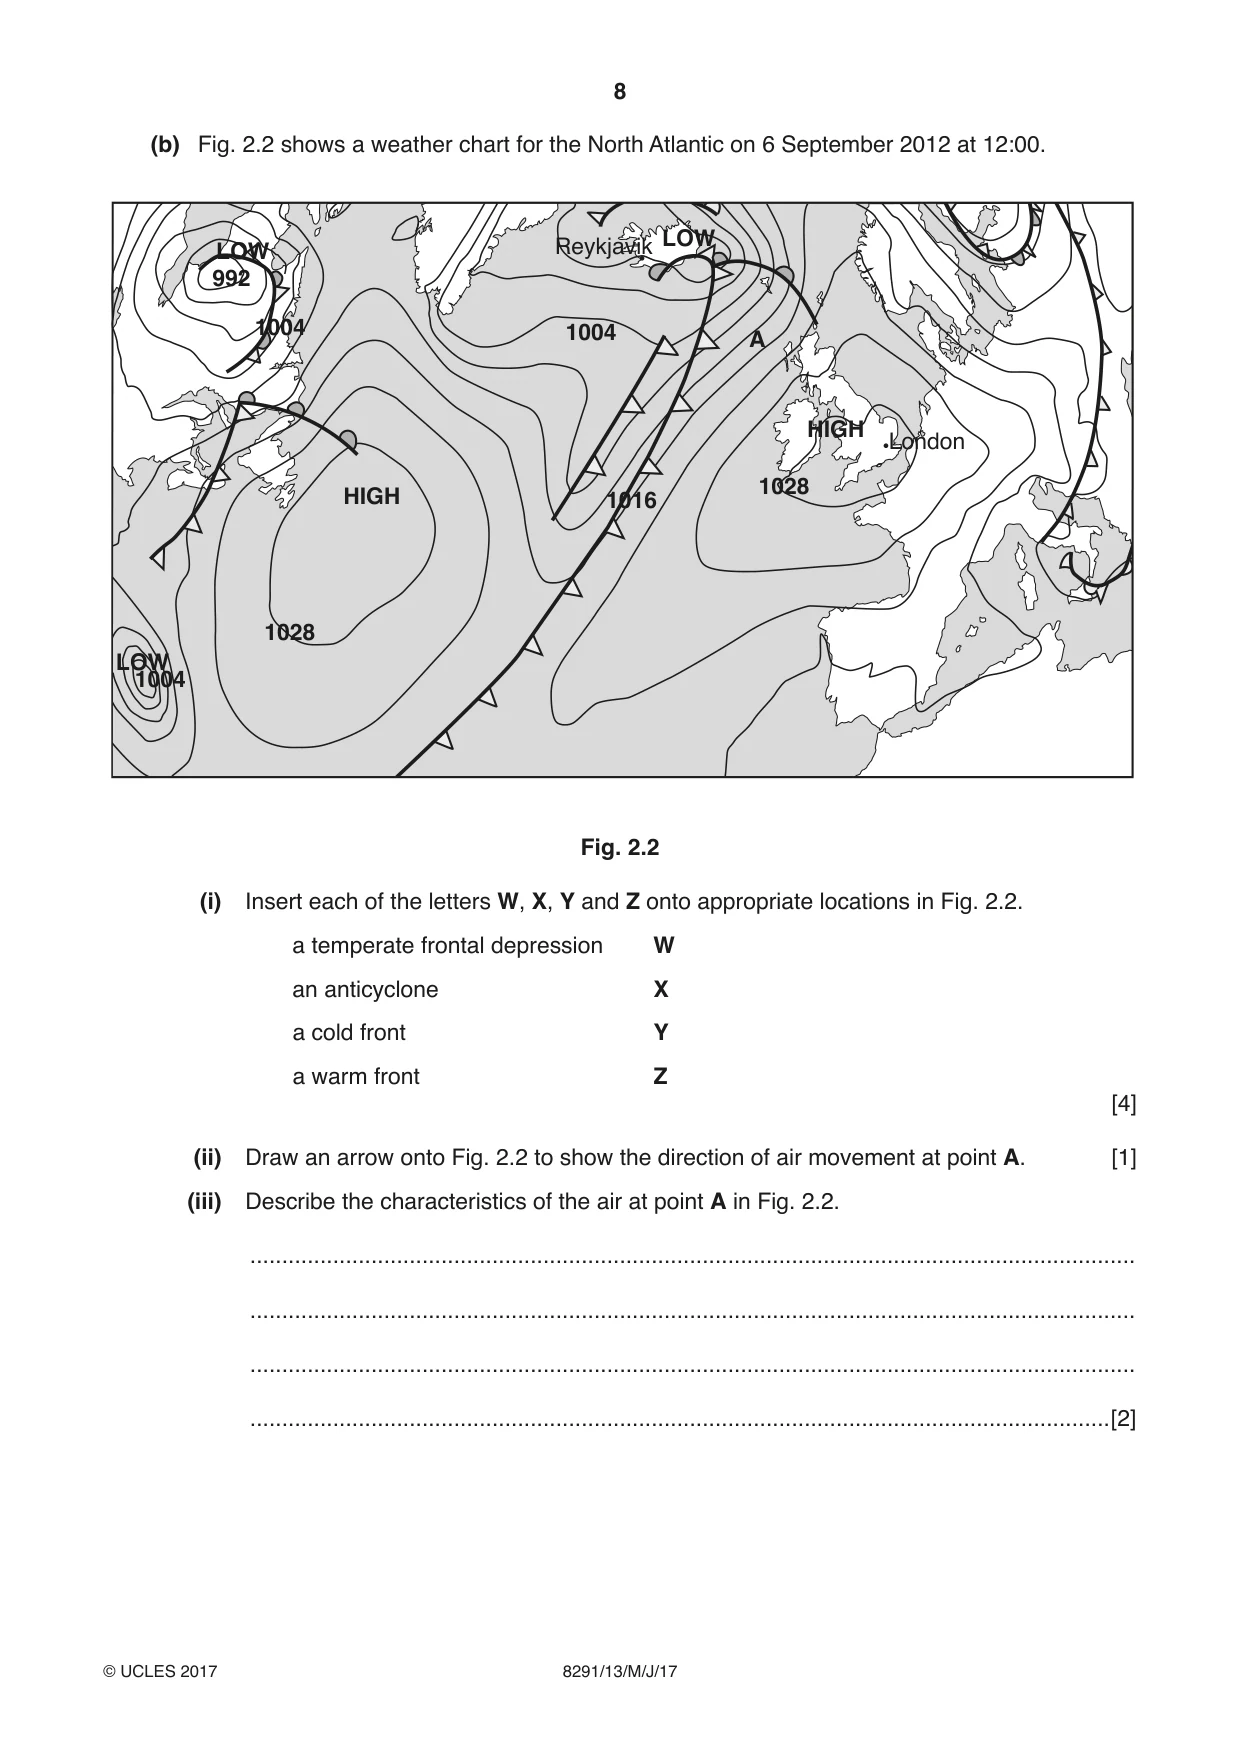
8 8291/13/M/J/17 © UCLES 2017 (b) Fig. 2.2 shows a weather chart for the North Atlantic on 6 September 2012 at 12:00. HIGH HIGH LOW LOW LOW 1028 1028 1016 1004 1004 1004 992 London Reykjavik A Fig. 2.2 (i) Insert each of the letters W, X, Y and Z onto appropriate locations in Fig. 2.2. a temperate frontal depression W an anticyclone X a cold front Y a warm front Z [4] (ii) Draw an arrow onto Fig. 2.2 to show the direction of air movement at point A. [1] (iii) Describe the characteristics of the air at point A in Fig. 2.2. … … … …[2]
Question paper, page 9
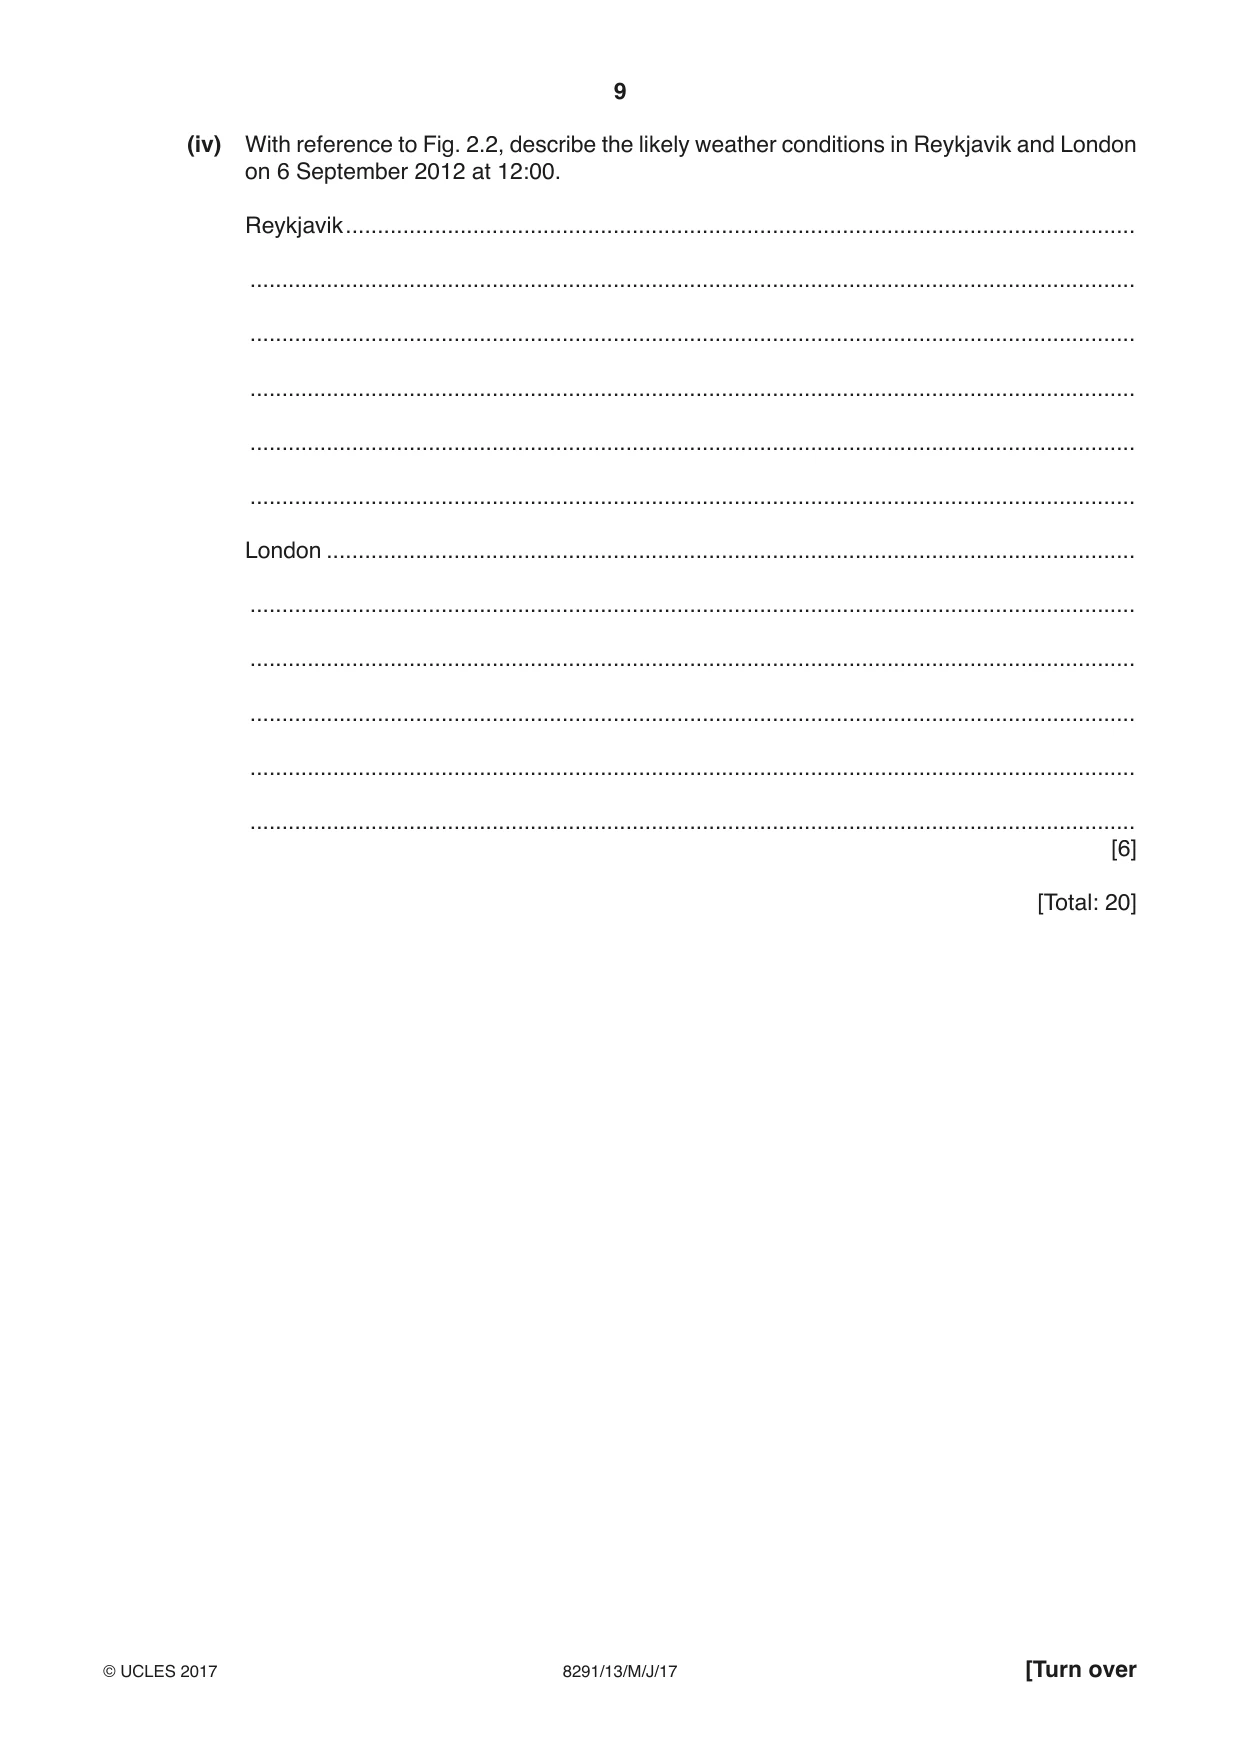
9 8291/13/M/J/17 © UCLES 2017 [Turn over (iv) With reference to Fig. 2.2, describe the likely weather conditions in Reykjavik and London on 6 September 2012 at 12:00. Reykjavik … … … … … … London … … … … … … [6] [Total: 20]
Question paper, page 10
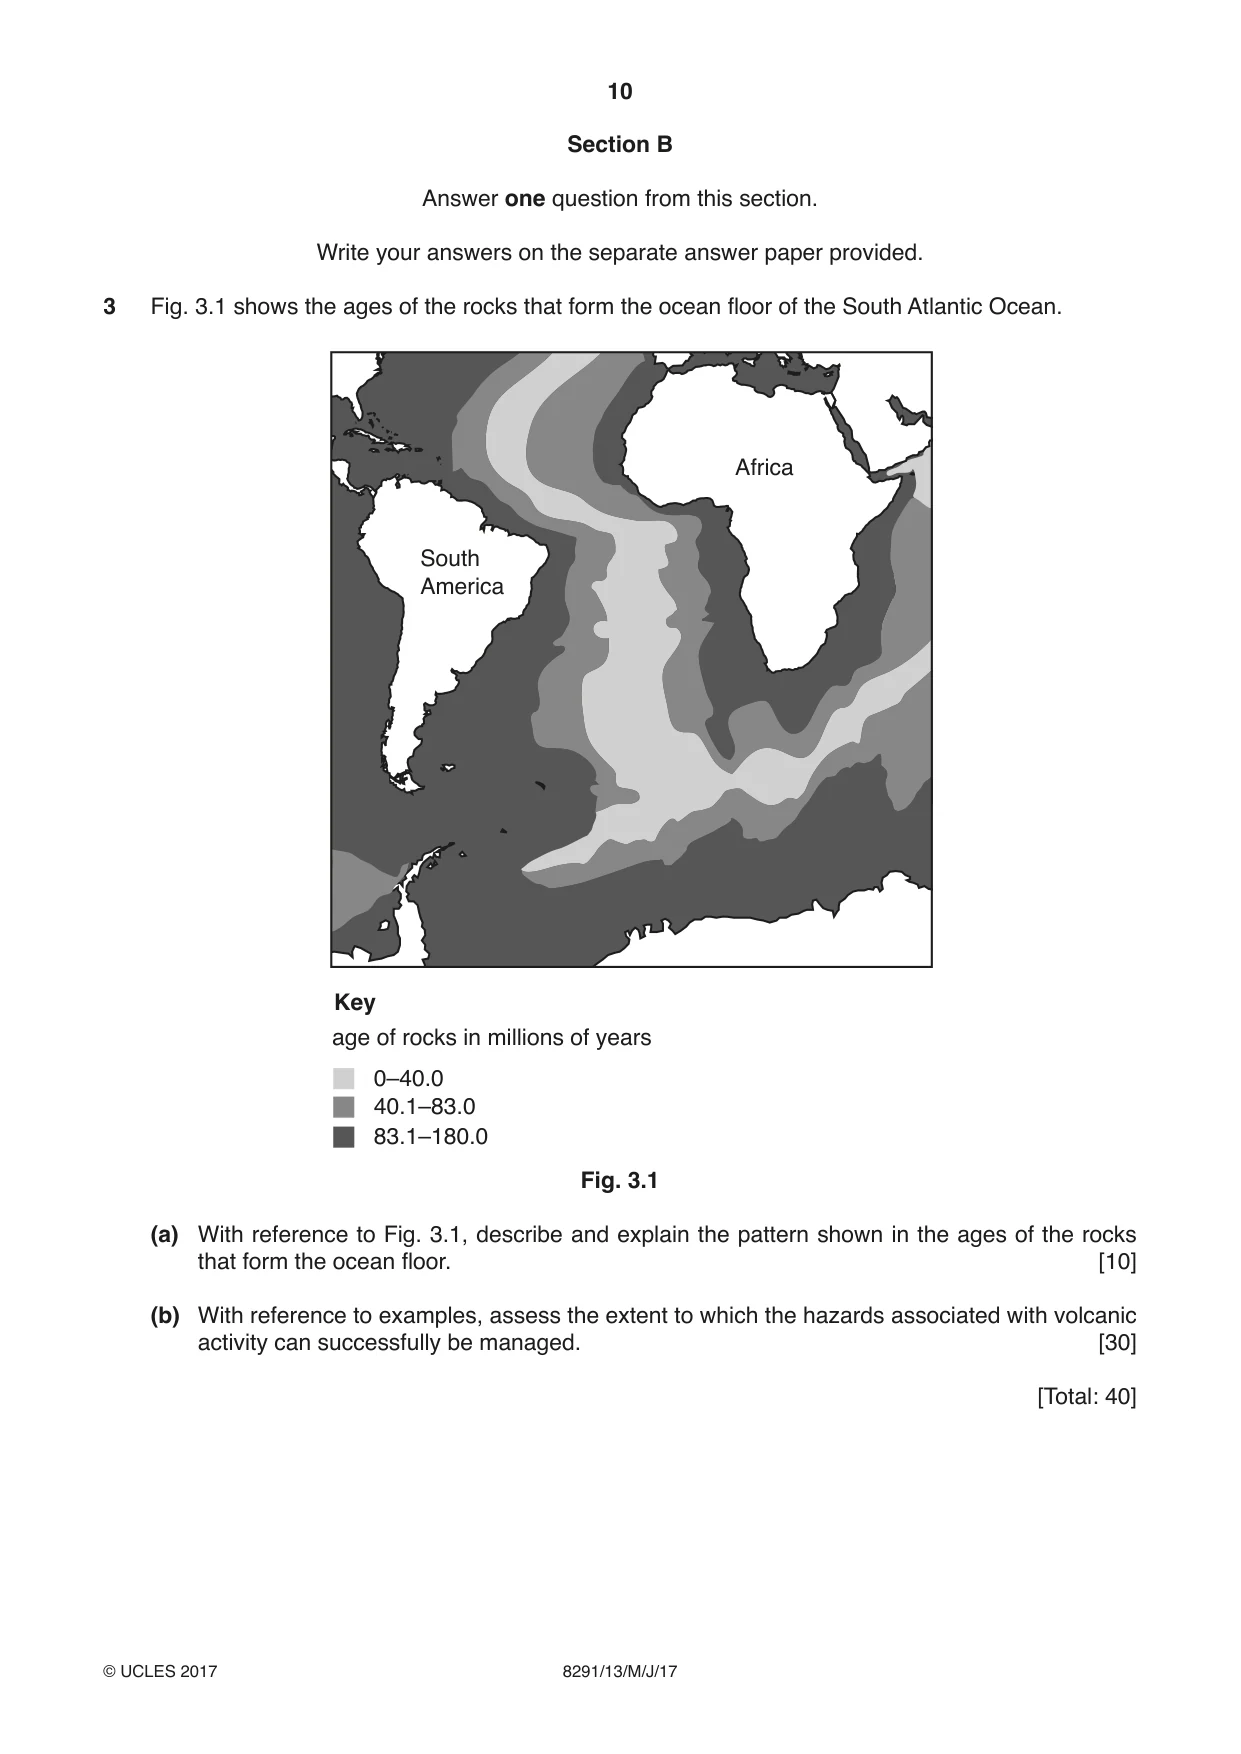
10 8291/13/M/J/17 © UCLES 2017 Section B Answer one question from this section. Write your answers on the separate answer paper provided. 3 Fig. 3.1 shows the ages of the rocks that form the ocean floor of the South Atlantic Ocean. 0–40.0 age of rocks in millions of years 40.1–83.0 83.1–180.0 Key Africa South America Fig. 3.1 (a) With reference to Fig. 3.1, describe and explain the pattern shown in the ages of the rocks that form the ocean floor. [10] (b) With reference to examples, assess the extent to which the hazards associated with volcanic activity can successfully be managed. [30] [Total: 40]
Question paper, page 11
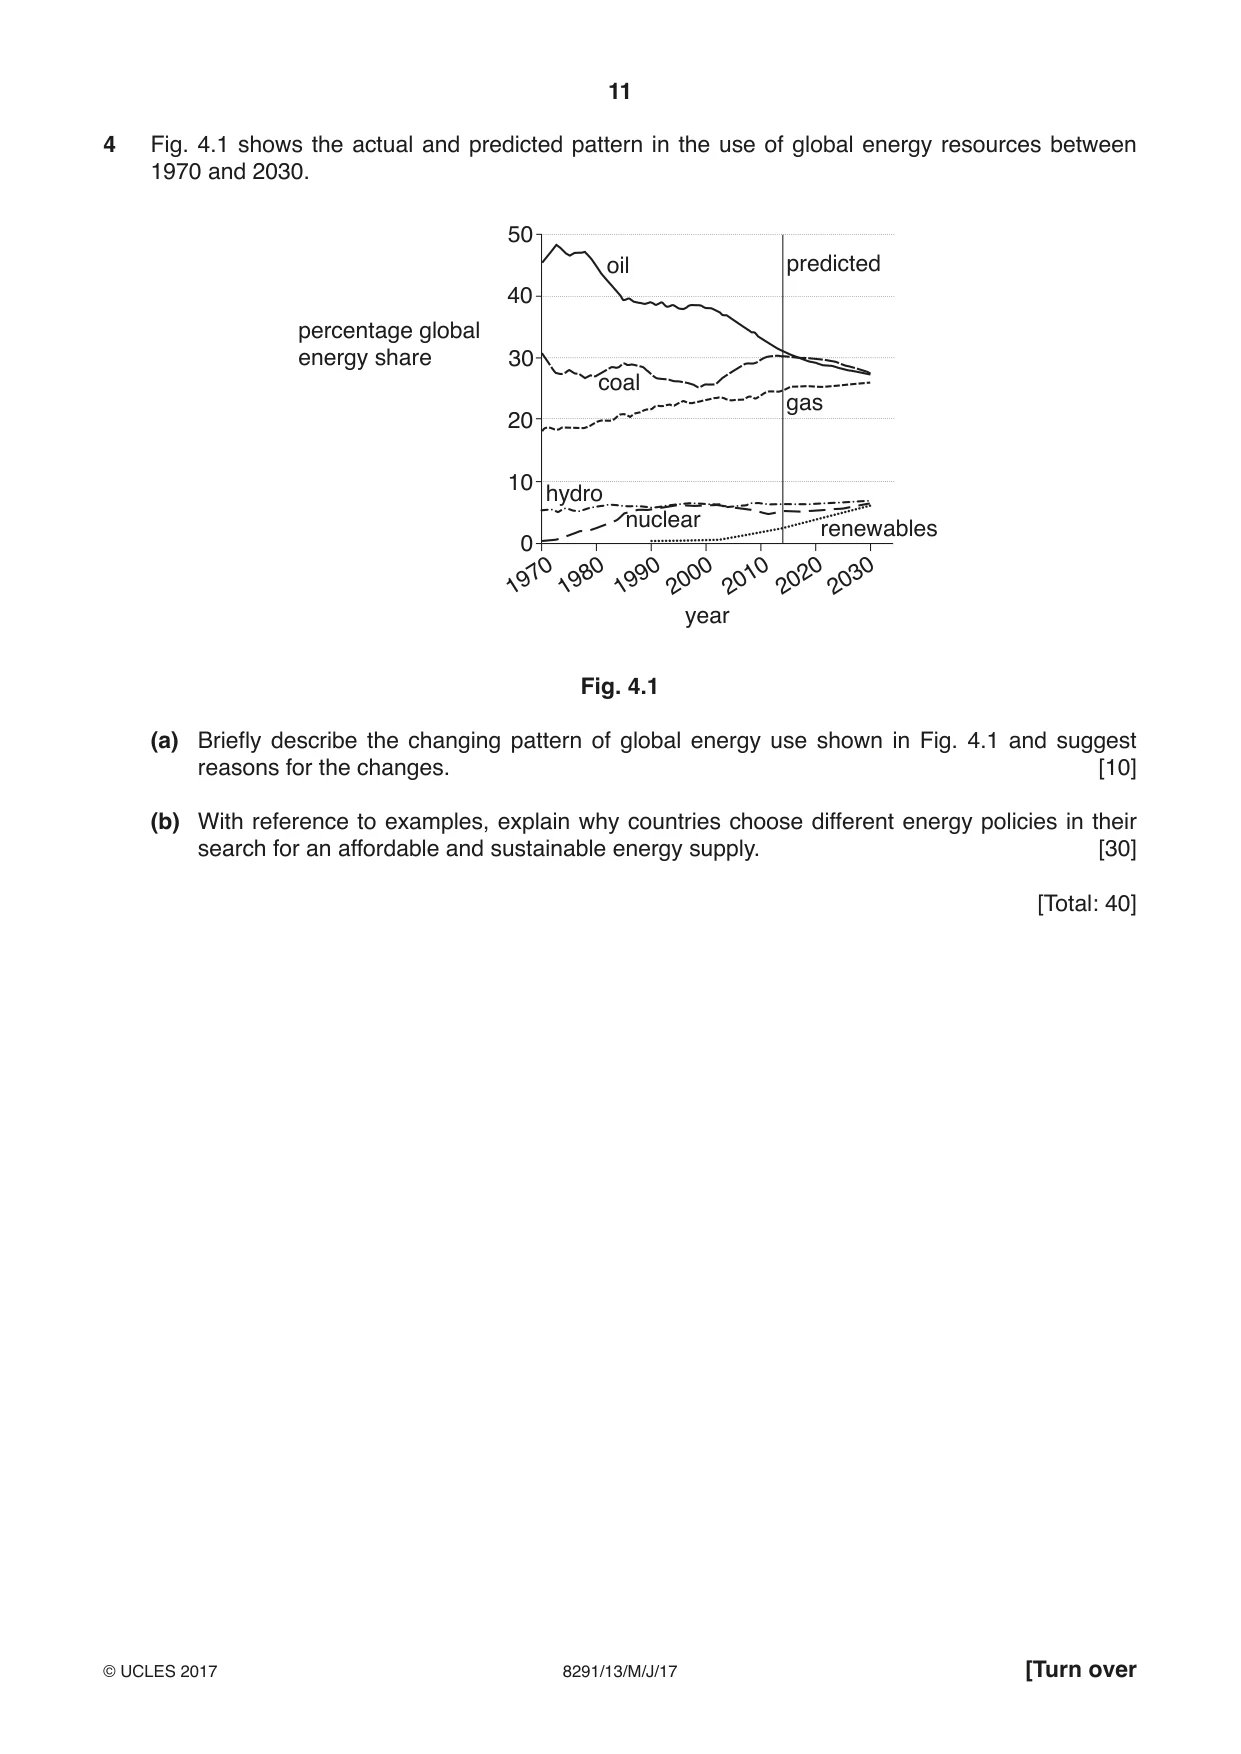
11 8291/13/M/J/17 © UCLES 2017 [Turn over 4 Fig. 4.1 shows the actual and predicted pattern in the use of global energy resources between 1970 and 2030. 50 40 30 20 10 0 oil coal gas nuclear hydro renewables predicted year 1970 1980 1990 2000 2010 2020 2030 percentage global energy share Fig. 4.1 (a) Briefly describe the changing pattern of global energy use shown in Fig. 4.1 and suggest reasons for the changes. [10] (b) With reference to examples, explain why countries choose different energy policies in their search for an affordable and sustainable energy supply. [30] [Total: 40]
Question paper, page 12
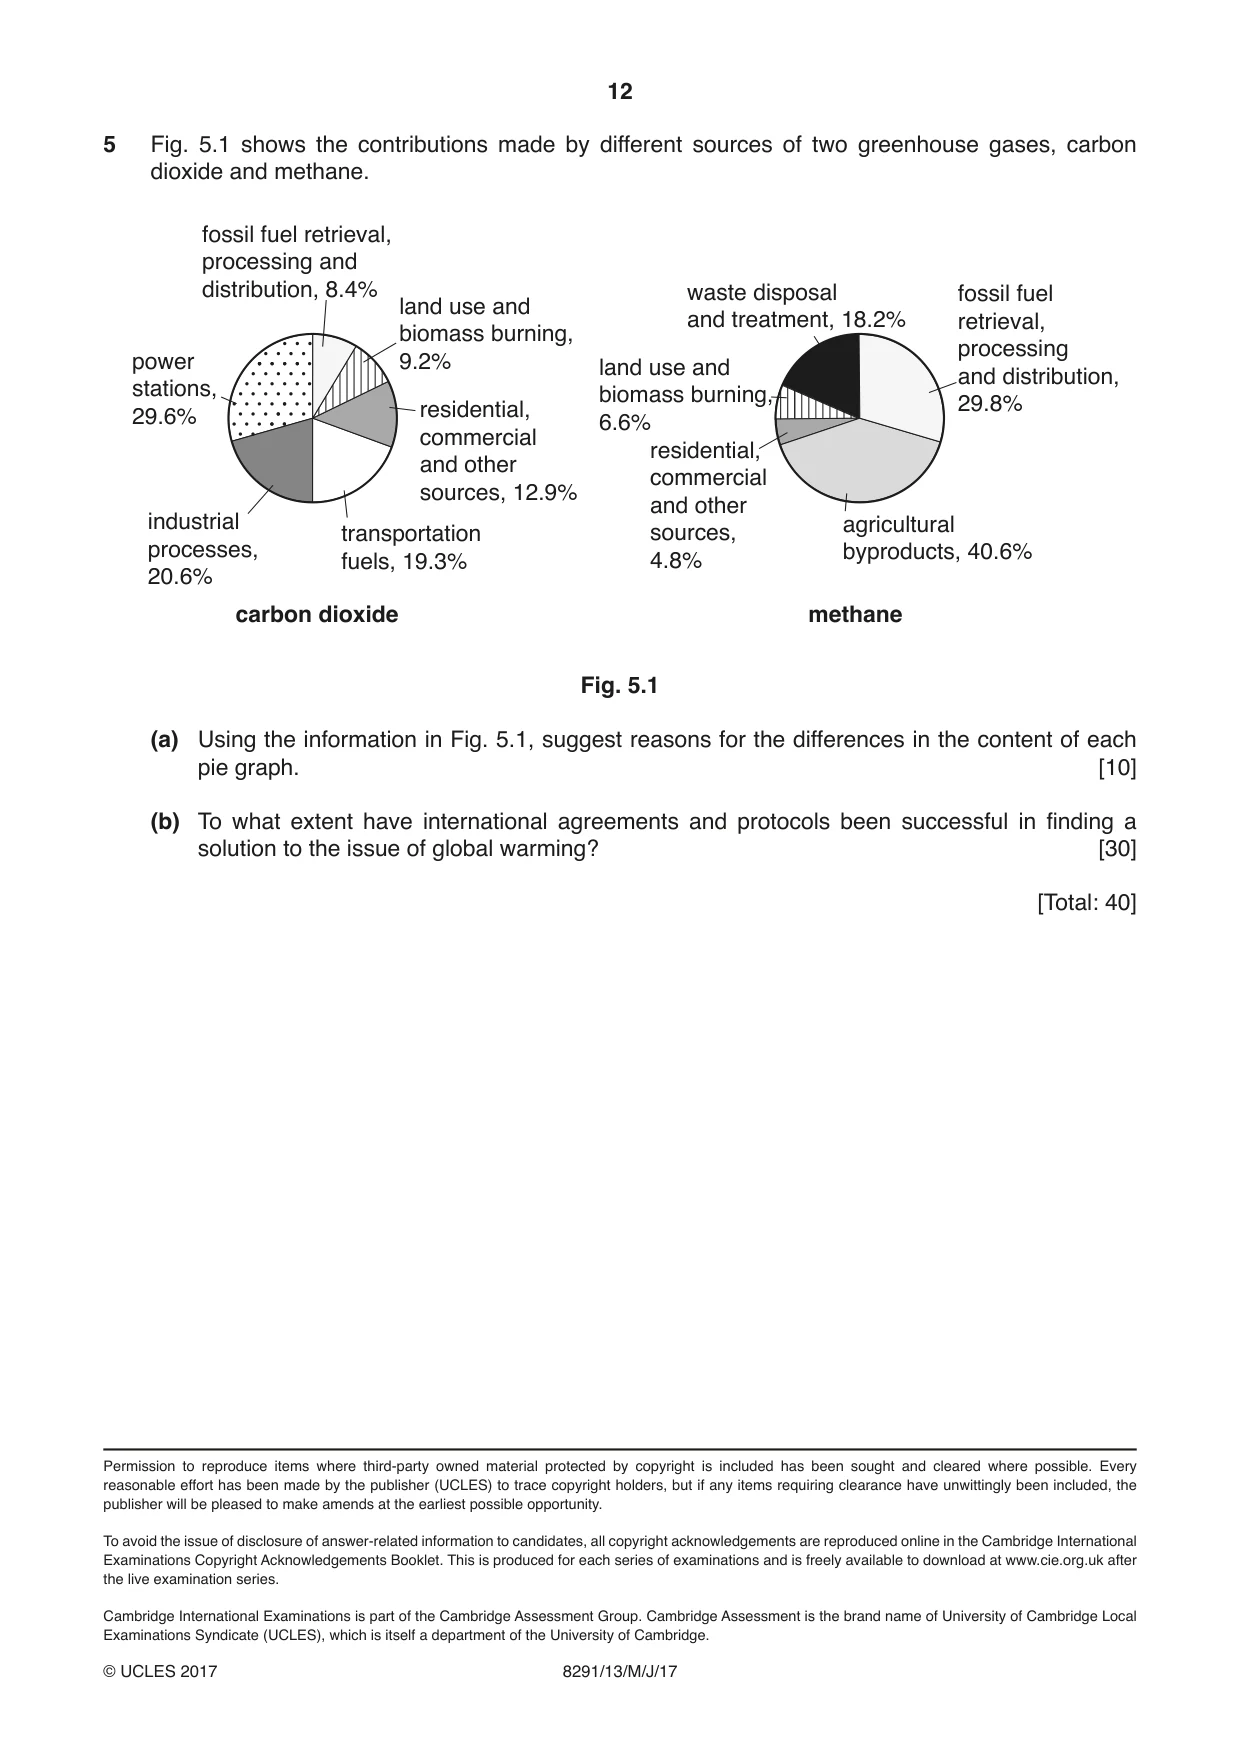
12 8291/13/M/J/17 © UCLES 2017 Permission to reproduce items where third-party owned material protected by copyright is included has been sought and cleared where possible. Every reasonable effort has been made by the publisher (UCLES) to trace copyright holders, but if any items requiring clearance have unwittingly been included, the publisher will be pleased to make amends at the earliest possible opportunity. To avoid the issue of disclosure of answer-related information to candidates, all copyright acknowledgements are reproduced online in the Cambridge International Examinations Copyright Acknowledgements Booklet. This is produced for each series of examinations and is freely available to download at www.cie.org.uk after the live examination series. Cambridge International Examinations is part of the Cambridge Assessment Group. Cambridge Assessment is the brand name of University of Cambridge Local Examinations Syndicate (UCLES), which is itself a department of the University of Cambridge. 5 Fig. 5.1 shows the contributions made by different sources of two greenhouse gases, carbon dioxide and methane. fossil fuel retrieval, processing and distribution, 29.8% fossil fuel retrieval, processing and distribution, 8.4% agricultural byproducts, 40.6% transportation fuels, 19.3% industrial processes, 20.6% power stations, 29.6% waste disposal and treatment, 18.2% land use and biomass burning, 9.2% land use and biomass burning, 6.6% residential, commercial and other sources, 4.8% residential, commercial and other sources, 12.9% carbon dioxide methane Fig. 5.1 (a) Using the information in Fig. 5.1, suggest reasons for the differences in the content of each pie graph. [10] (b) To what extent have international agreements and protocols been successful in finding a solution to the issue of global warming? [30] [Total: 40]
Mark scheme, page 1
® IGCSE is a registered trademark. This document consists of 15 printed pages. © UCLES 2017 [Turn over Cambridge International Examinations Cambridge International Advanced Subsidiary Level ENVIRONMENTAL MANAGEMENT 8291/13 Paper 1 May/June 2017 MARK SCHEME Maximum Mark: 80 Published This mark scheme is published as an aid to teachers and candidates, to indicate the requirements of the examination. It shows the basis on which Examiners were instructed to award marks. It does not indicate the details of the discussions that took place at an Examiners’ meeting before marking began, which would have considered the acceptability of alternative answers. Mark schemes should be read in conjunction with the question paper and the Principal Examiner Report for Teachers. Cambridge will not enter into discussions about these mark schemes. Cambridge is publishing the mark schemes for the May/June 2017 series for most Cambridge IGCSE®, Cambridge International A and AS Level and Cambridge Pre-U components, and some Cambridge O Level components.
Mark scheme, page 2
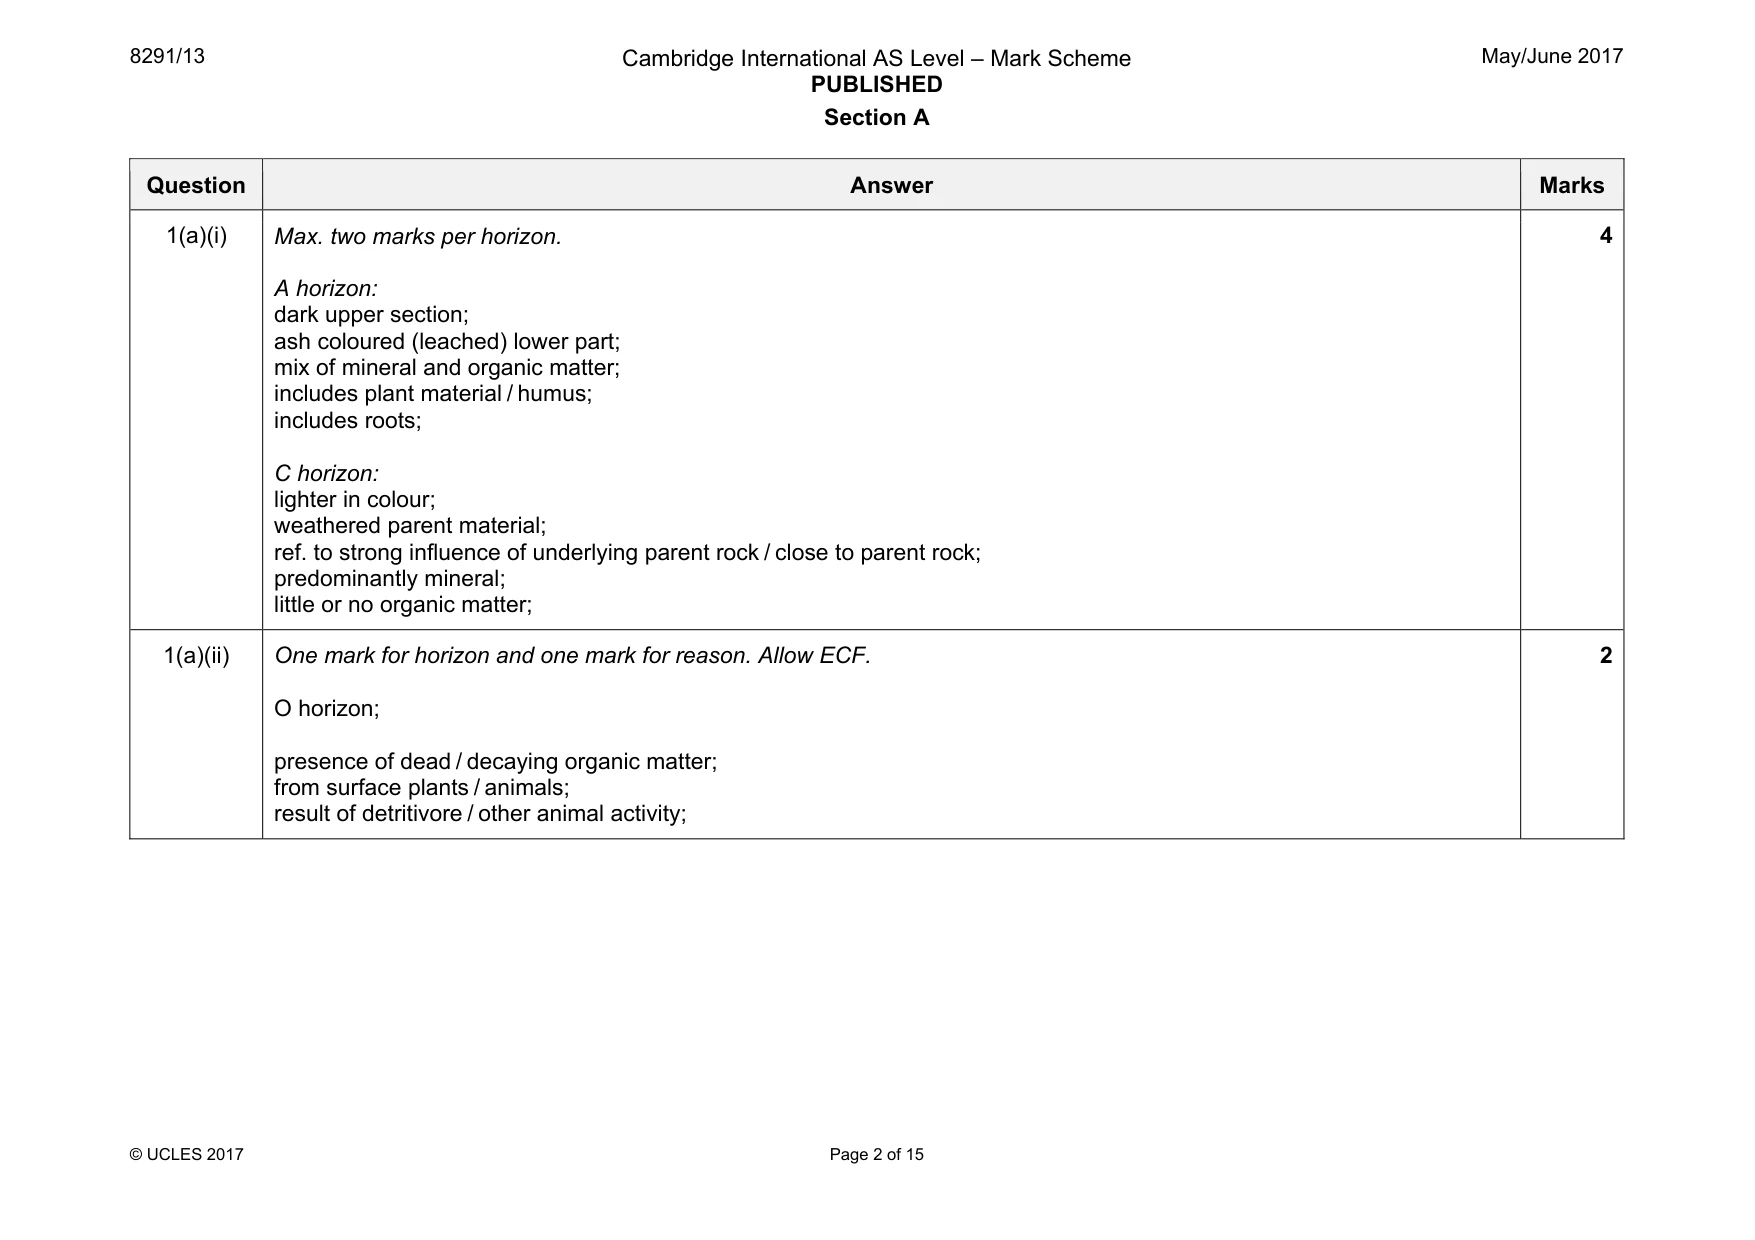
8291/13 Cambridge International AS Level – Mark Scheme PUBLISHED May/June 2017 © UCLES 2017 Page 2 of 15 Section A Question Answer Marks 1(a)(i) Max. two marks per horizon. A horizon: dark upper section; ash coloured (leached) lower part; mix of mineral and organic matter; includes plant material / humus; includes roots; C horizon: lighter in colour; weathered parent material; ref. to strong influence of underlying parent rock / close to parent rock; predominantly mineral; little or no organic matter; 4 1(a)(ii) One mark for horizon and one mark for reason. Allow ECF. O horizon; presence of dead / decaying organic matter; from surface plants / animals; result of detritivore / other animal activity; 2
Mark scheme, page 3
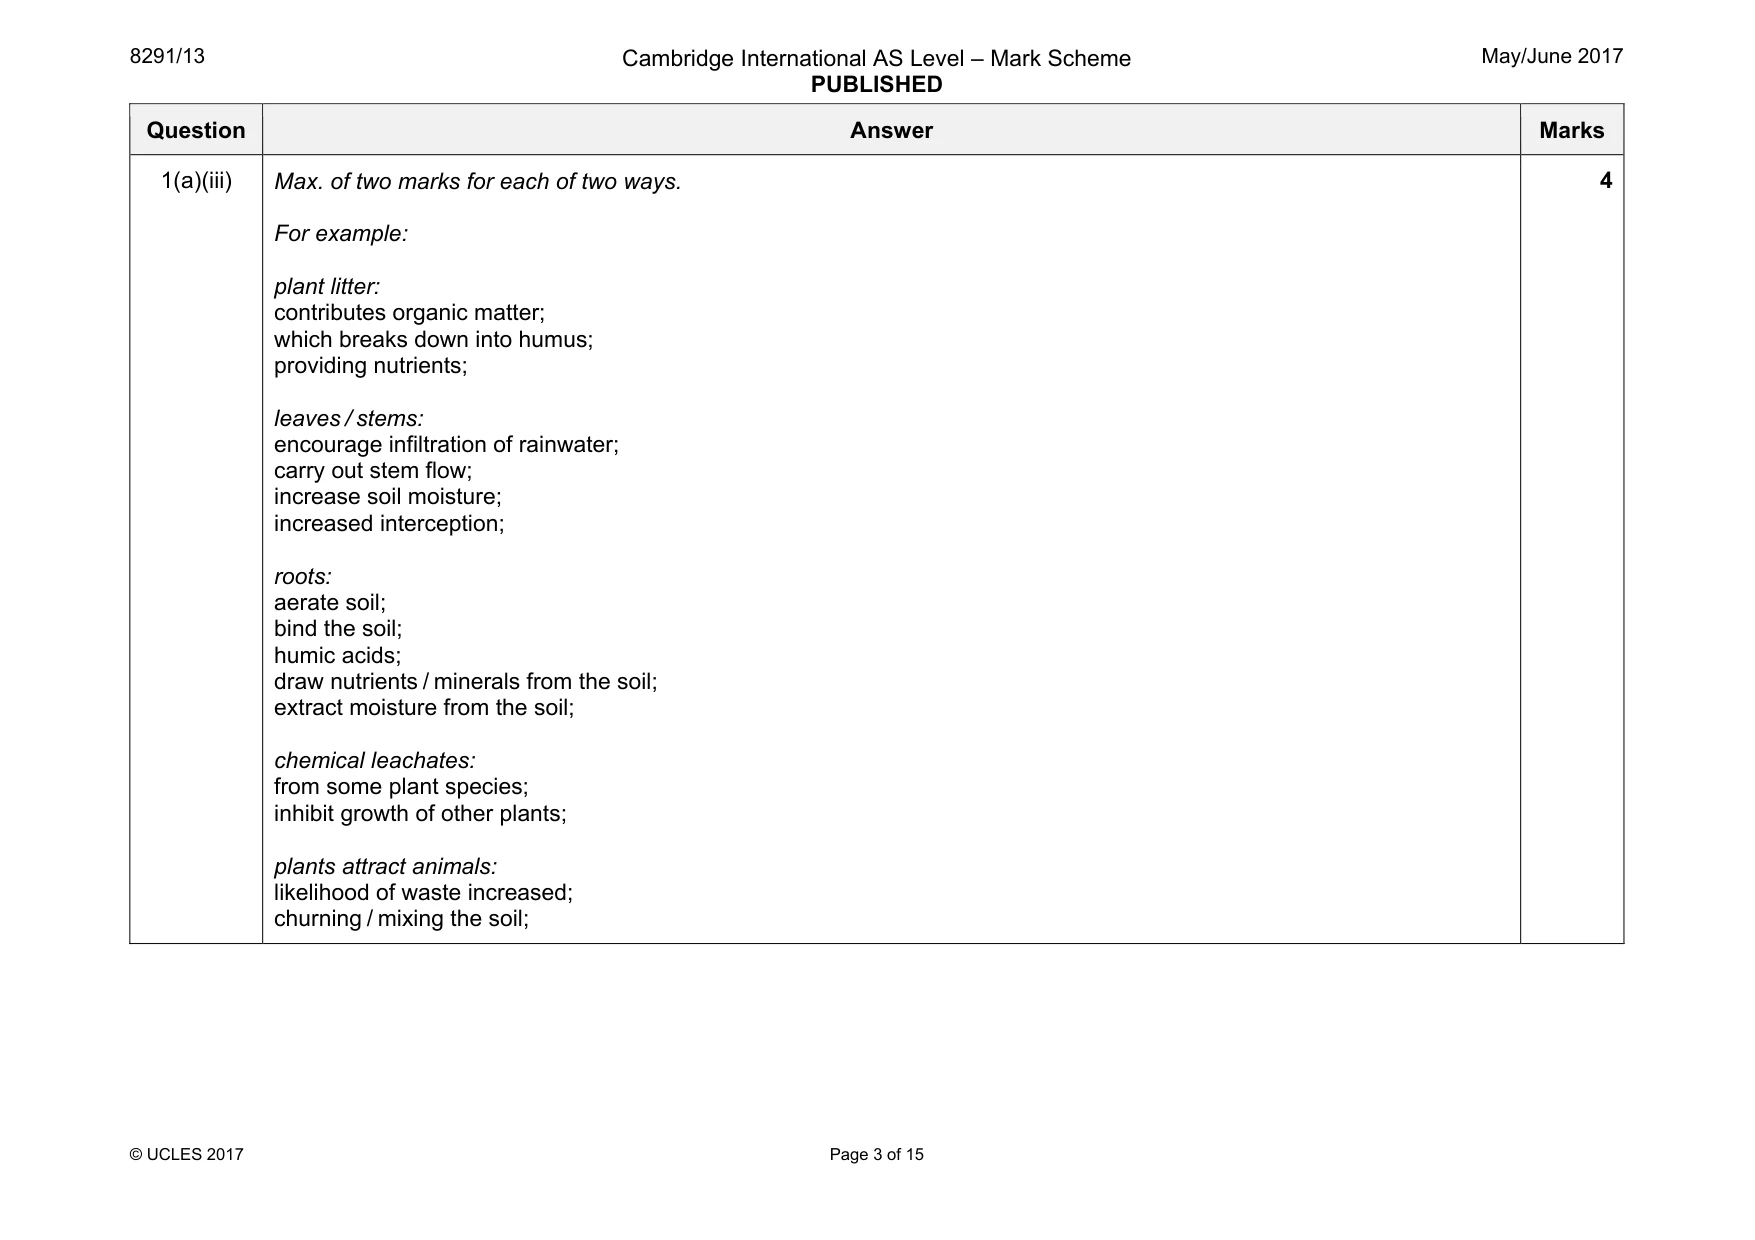
8291/13 Cambridge International AS Level – Mark Scheme PUBLISHED May/June 2017 © UCLES 2017 Page 3 of 15 Question Answer Marks 1(a)(iii) Max. of two marks for each of two ways. For example: plant litter: contributes organic matter; which breaks down into humus; providing nutrients; leaves / stems: encourage infiltration of rainwater; carry out stem flow; increase soil moisture; increased interception; roots: aerate soil; bind the soil; humic acids; draw nutrients / minerals from the soil; extract moisture from the soil; chemical leachates: from some plant species; inhibit growth of other plants; plants attract animals: likelihood of waste increased; churning / mixing the soil; 4
Mark scheme, page 4
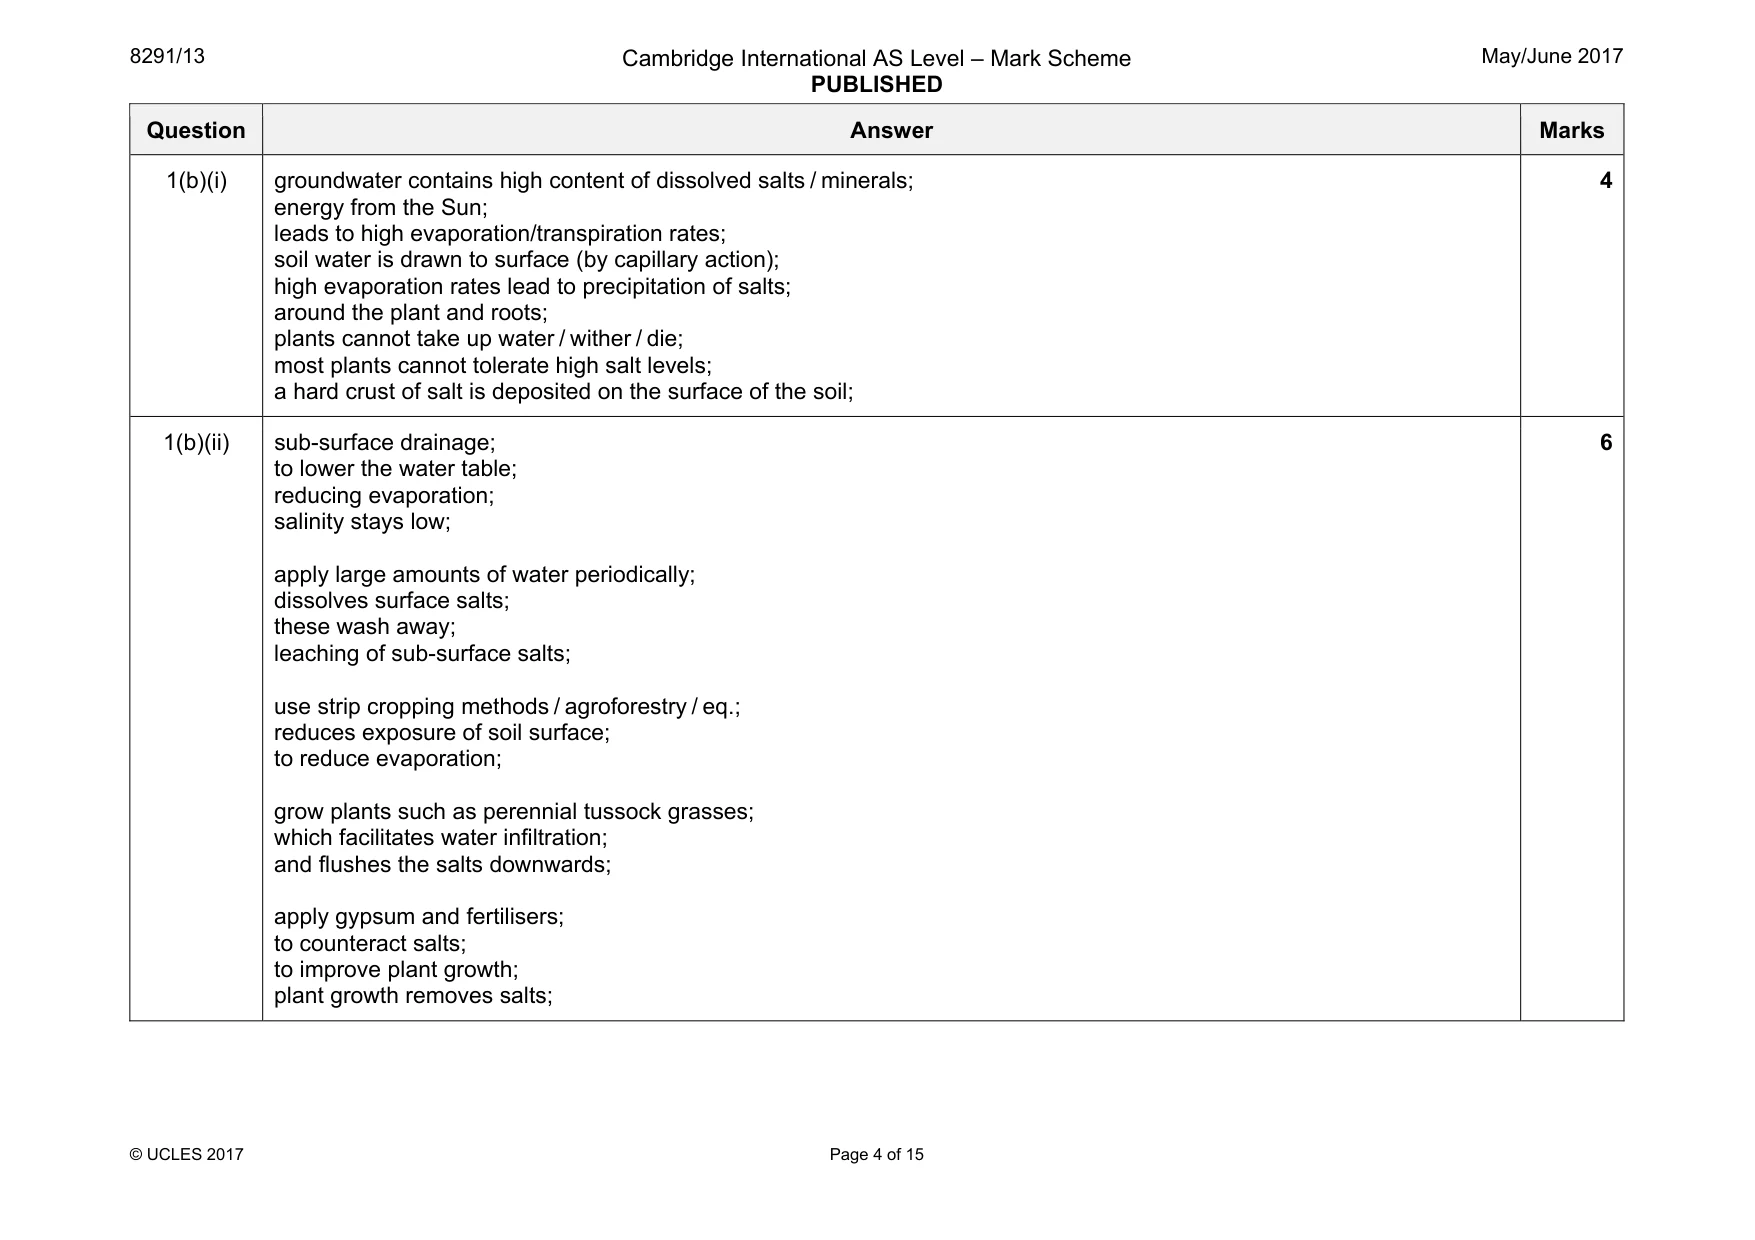
8291/13 Cambridge International AS Level – Mark Scheme PUBLISHED May/June 2017 © UCLES 2017 Page 4 of 15 Question Answer Marks 1(b)(i) groundwater contains high content of dissolved salts / minerals; energy from the Sun; leads to high evaporation/transpiration rates; soil water is drawn to surface (by capillary action); high evaporation rates lead to precipitation of salts; around the plant and roots; plants cannot take up water / wither / die; most plants cannot tolerate high salt levels; a hard crust of salt is deposited on the surface of the soil; 4 1(b)(ii) sub-surface drainage; to lower the water table; reducing evaporation; salinity stays low; apply large amounts of water periodically; dissolves surface salts; these wash away; leaching of sub-surface salts; use strip cropping methods / agroforestry / eq.; reduces exposure of soil surface; to reduce evaporation; grow plants such as perennial tussock grasses; which facilitates water infiltration; and flushes the salts downwards; apply gypsum and fertilisers; to counteract salts; to improve plant growth; plant growth removes salts; 6
Mark scheme, page 5
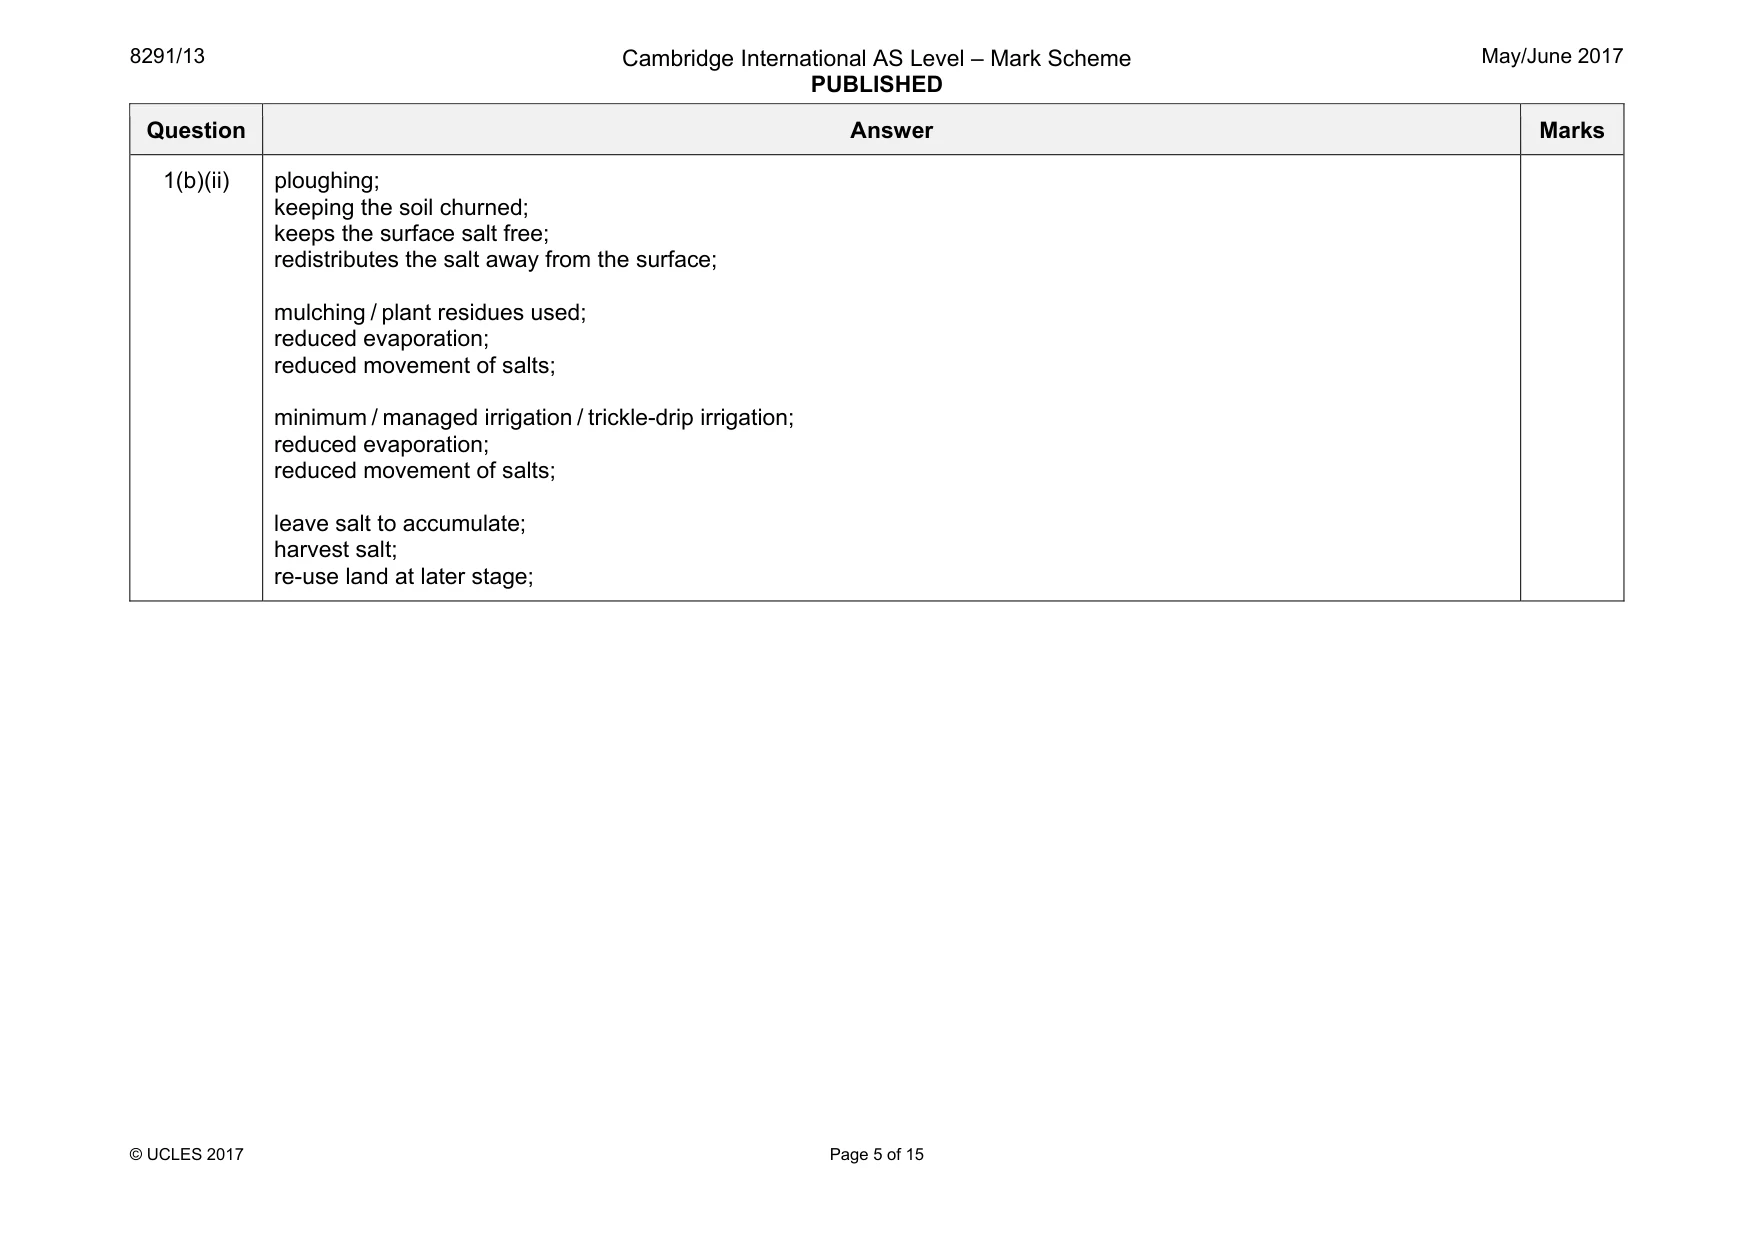
8291/13 Cambridge International AS Level – Mark Scheme PUBLISHED May/June 2017 © UCLES 2017 Page 5 of 15 Question Answer Marks 1(b)(ii) ploughing; keeping the soil churned; keeps the surface salt free; redistributes the salt away from the surface; mulching / plant residues used; reduced evaporation; reduced movement of salts; minimum / managed irrigation / trickle-drip irrigation; reduced evaporation; reduced movement of salts; leave salt to accumulate; harvest salt; re-use land at later stage;
Mark scheme, page 6
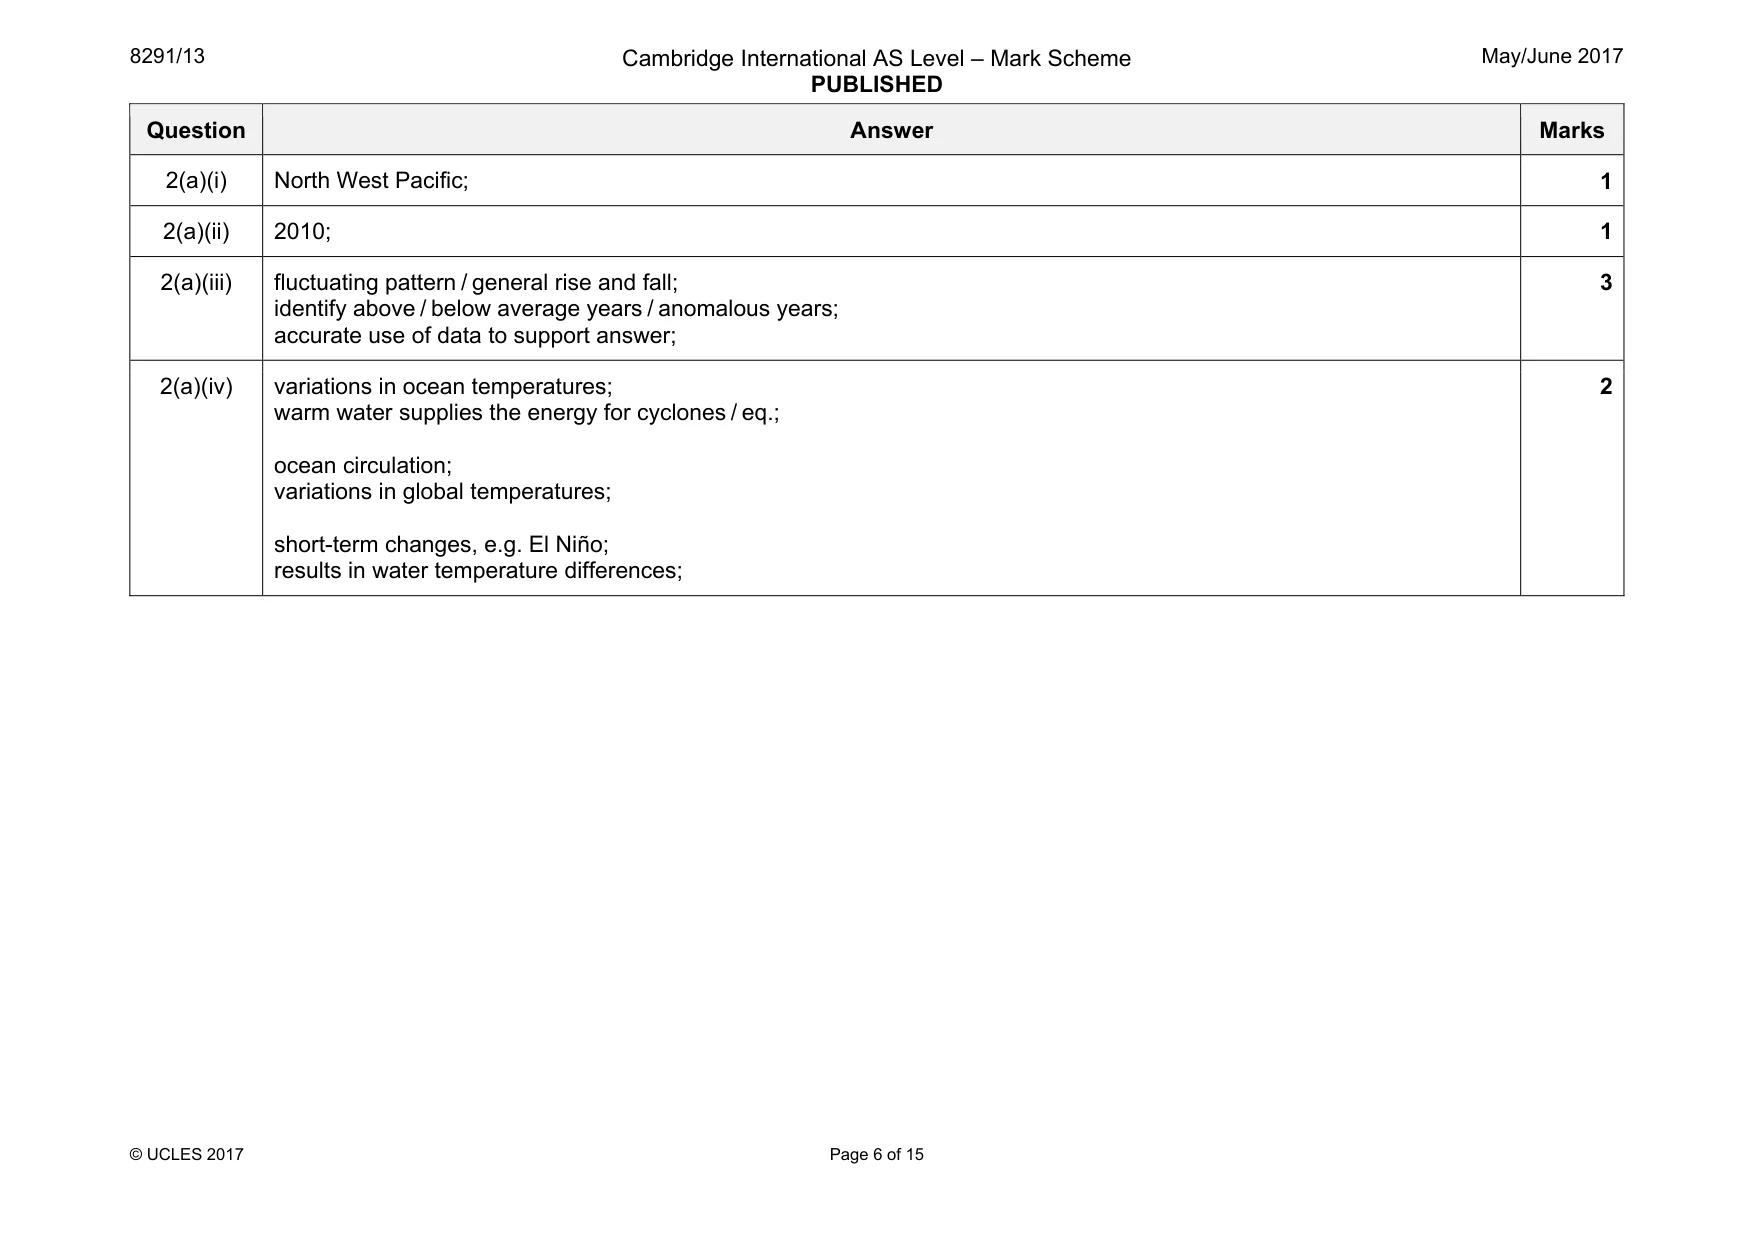
8291/13 Cambridge International AS Level – Mark Scheme PUBLISHED May/June 2017 © UCLES 2017 Page 6 of 15 Question Answer Marks 2(a)(i) North West Pacific; 1 2(a)(ii) 2010; 1 2(a)(iii) fluctuating pattern / general rise and fall; identify above / below average years / anomalous years; accurate use of data to support answer; 3 2(a)(iv) variations in ocean temperatures; warm water supplies the energy for cyclones / eq.; ocean circulation; variations in global temperatures; short-term changes, e.g. El Niño; results in water temperature differences; 2
Mark scheme, page 7
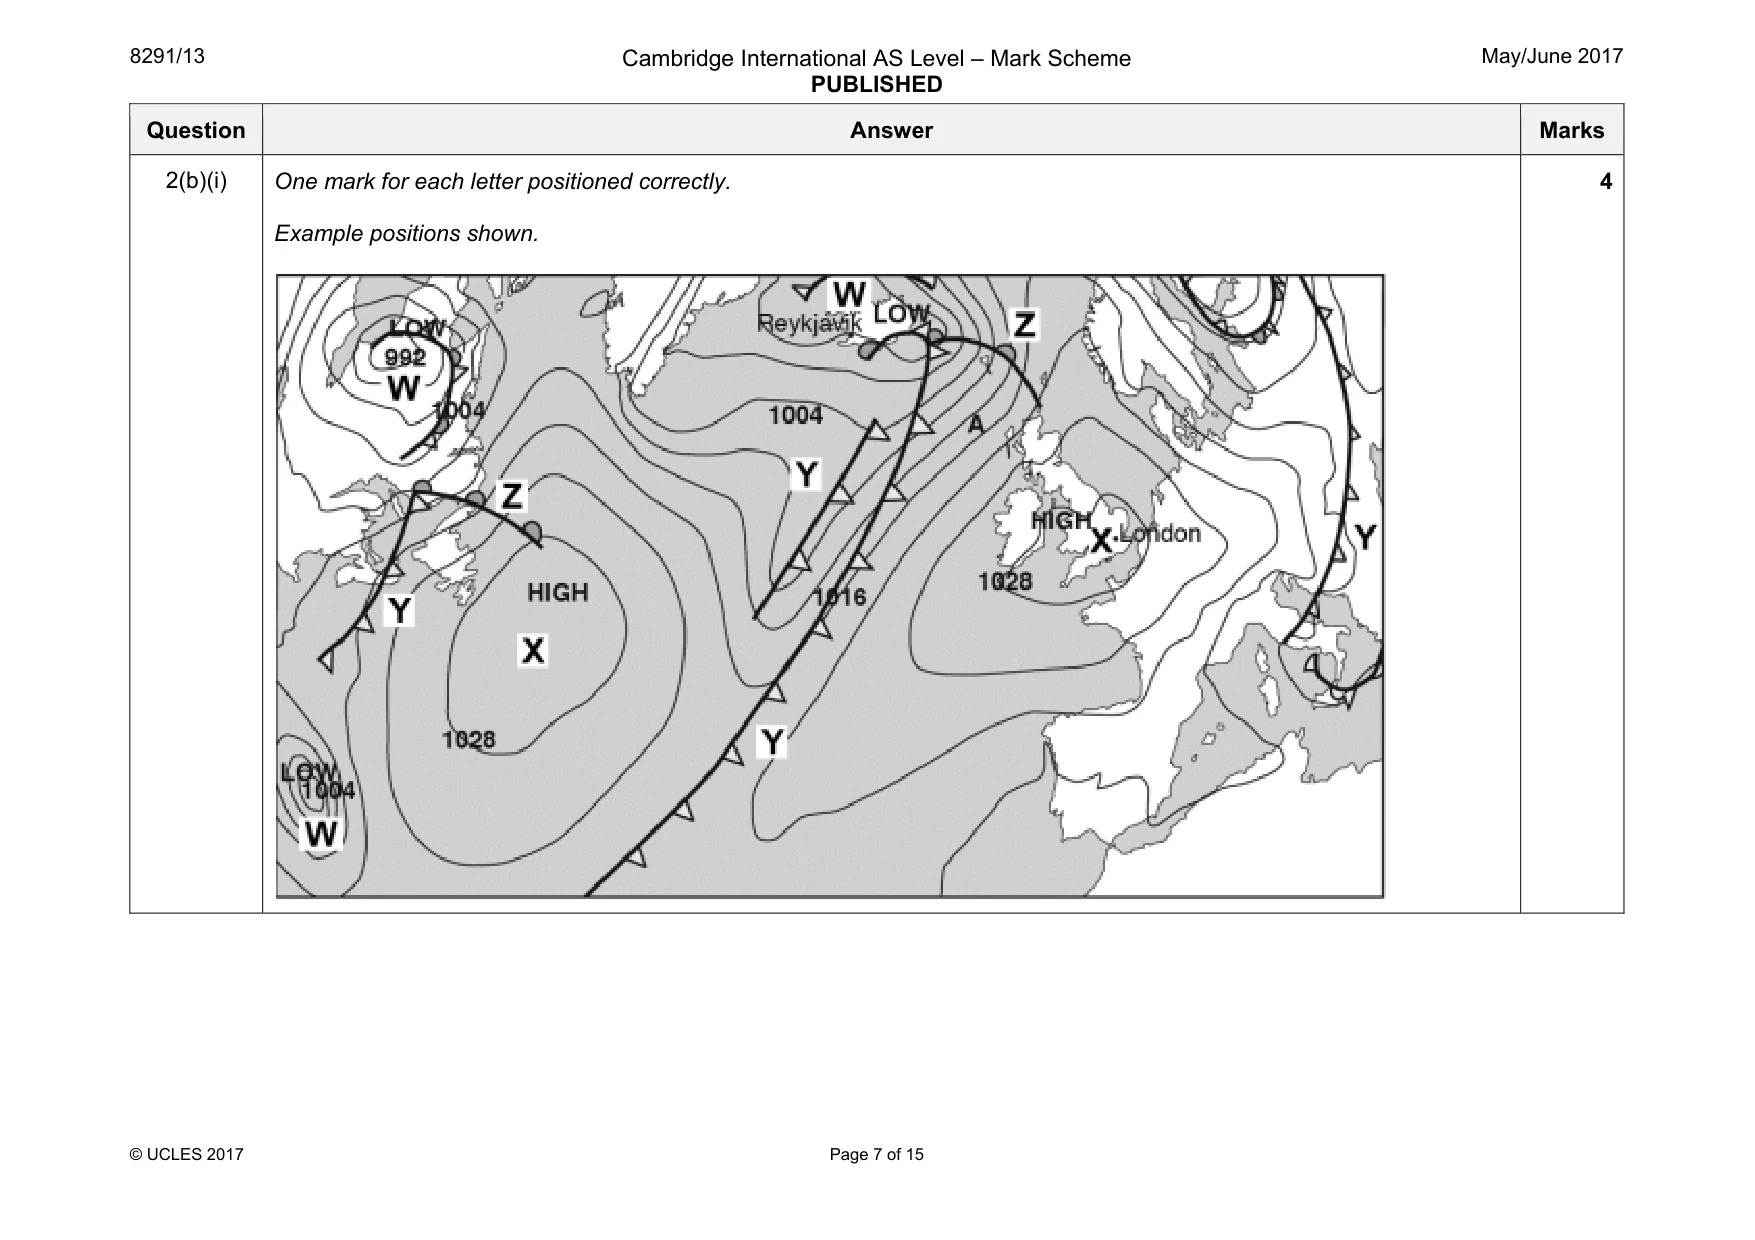
8291/13 Cambridge International AS Level – Mark Scheme PUBLISHED May/June 2017 © UCLES 2017 Page 7 of 15 Question Answer Marks 2(b)(i) One mark for each letter positioned correctly. Example positions shown. 4
Mark scheme, page 8
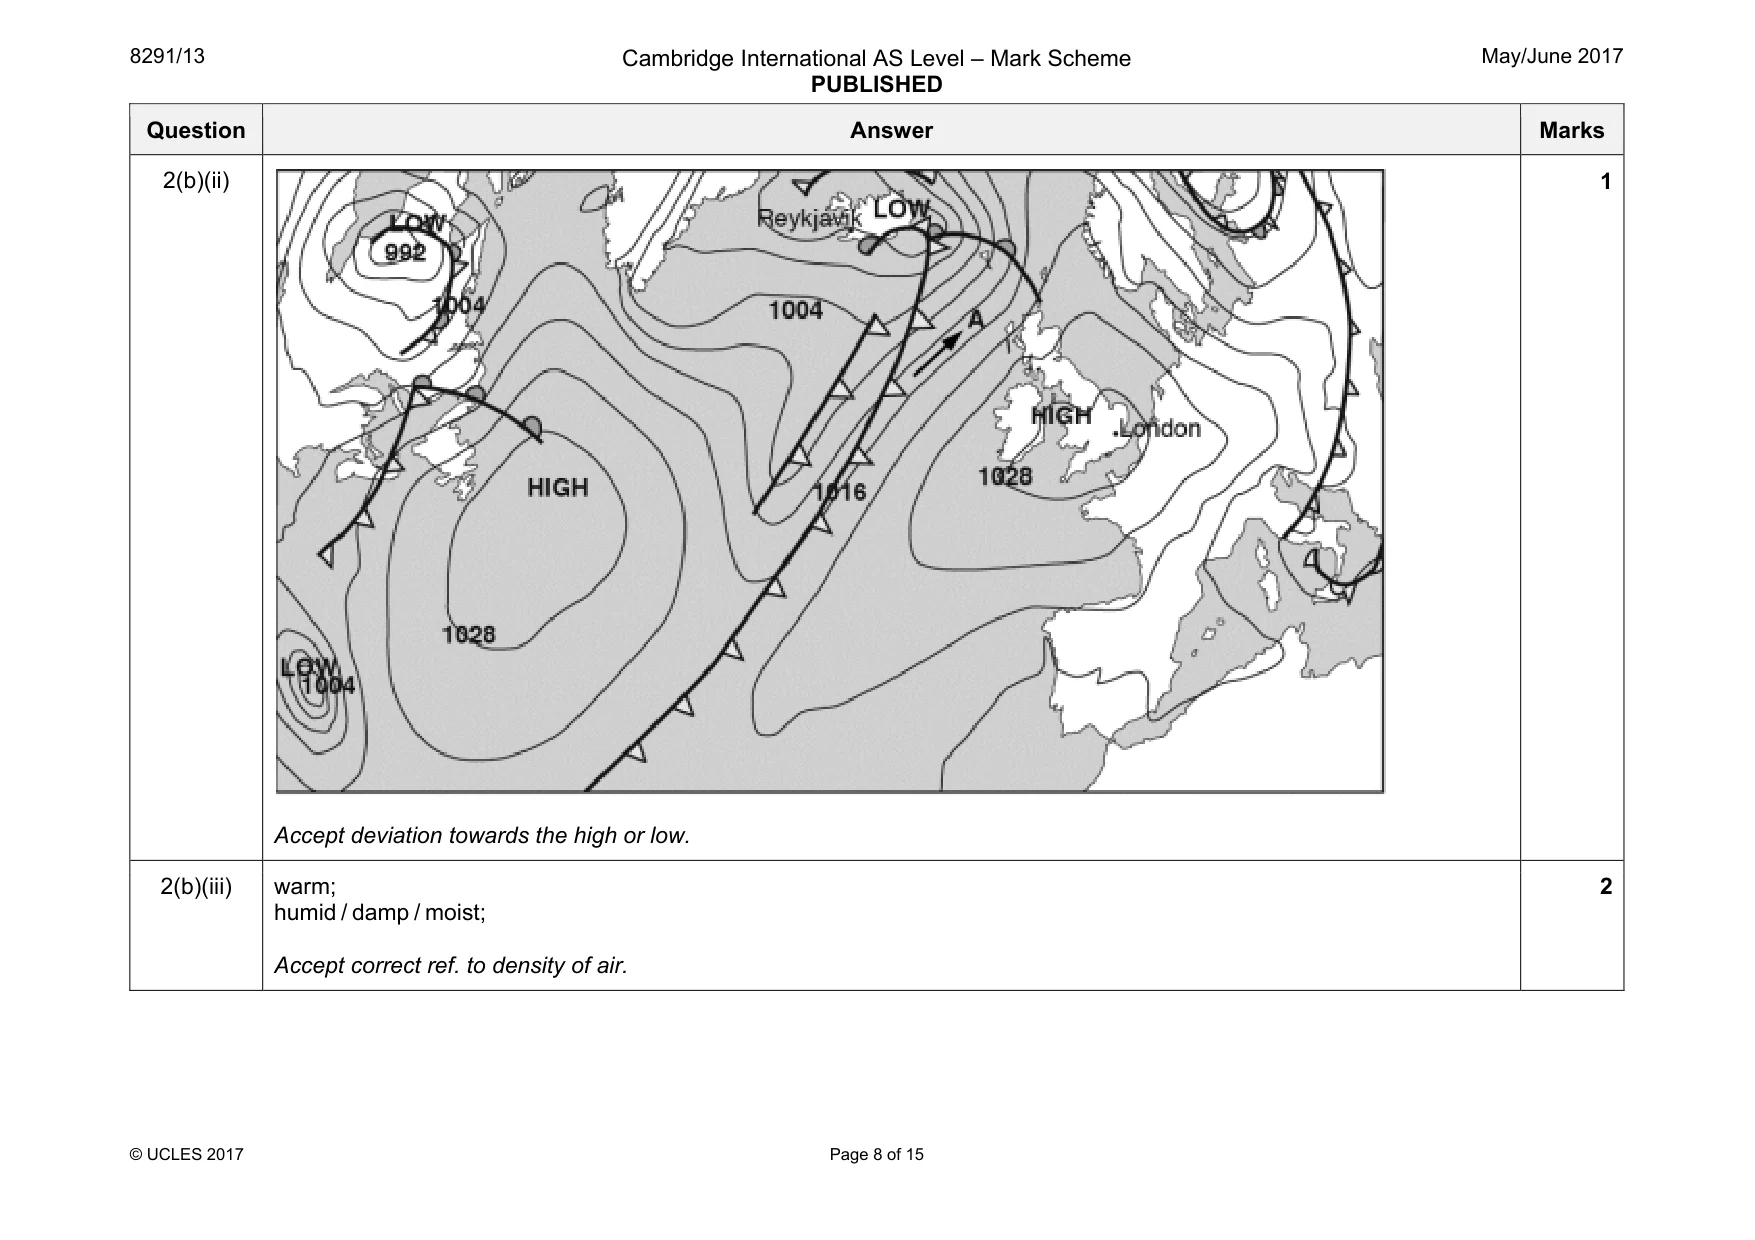
8291/13 Cambridge International AS Level – Mark Scheme PUBLISHED May/June 2017 © UCLES 2017 Page 8 of 15 Question Answer Marks 2(b)(ii) Accept deviation towards the high or low. 1 2(b)(iii) warm; humid / damp / moist; Accept correct ref. to density of air. 2
Mark scheme, page 9
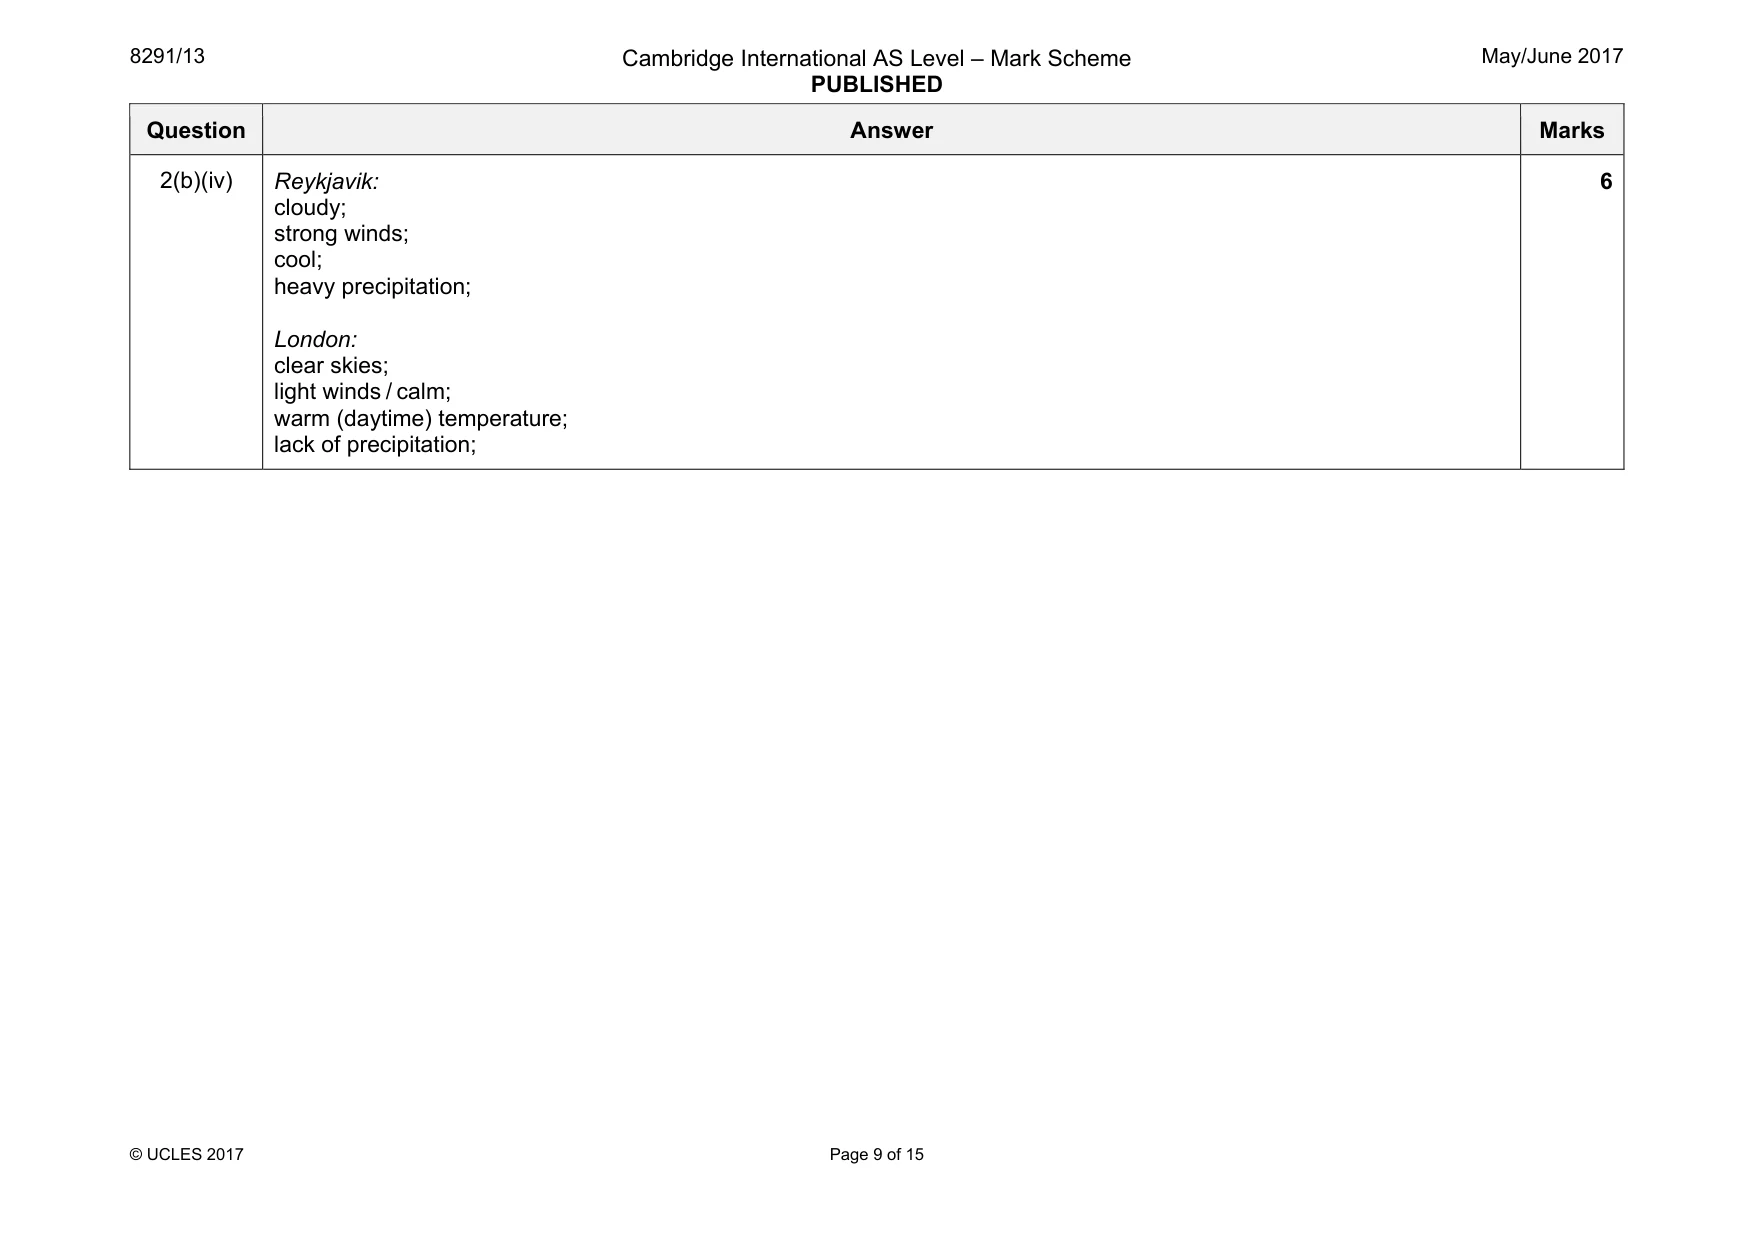
8291/13 Cambridge International AS Level – Mark Scheme PUBLISHED May/June 2017 © UCLES 2017 Page 9 of 15 Question Answer Marks 2(b)(iv) Reykjavik: cloudy; strong winds; cool; heavy precipitation; London: clear skies; light winds / calm; warm (daytime) temperature; lack of precipitation; 6
Mark scheme, page 10
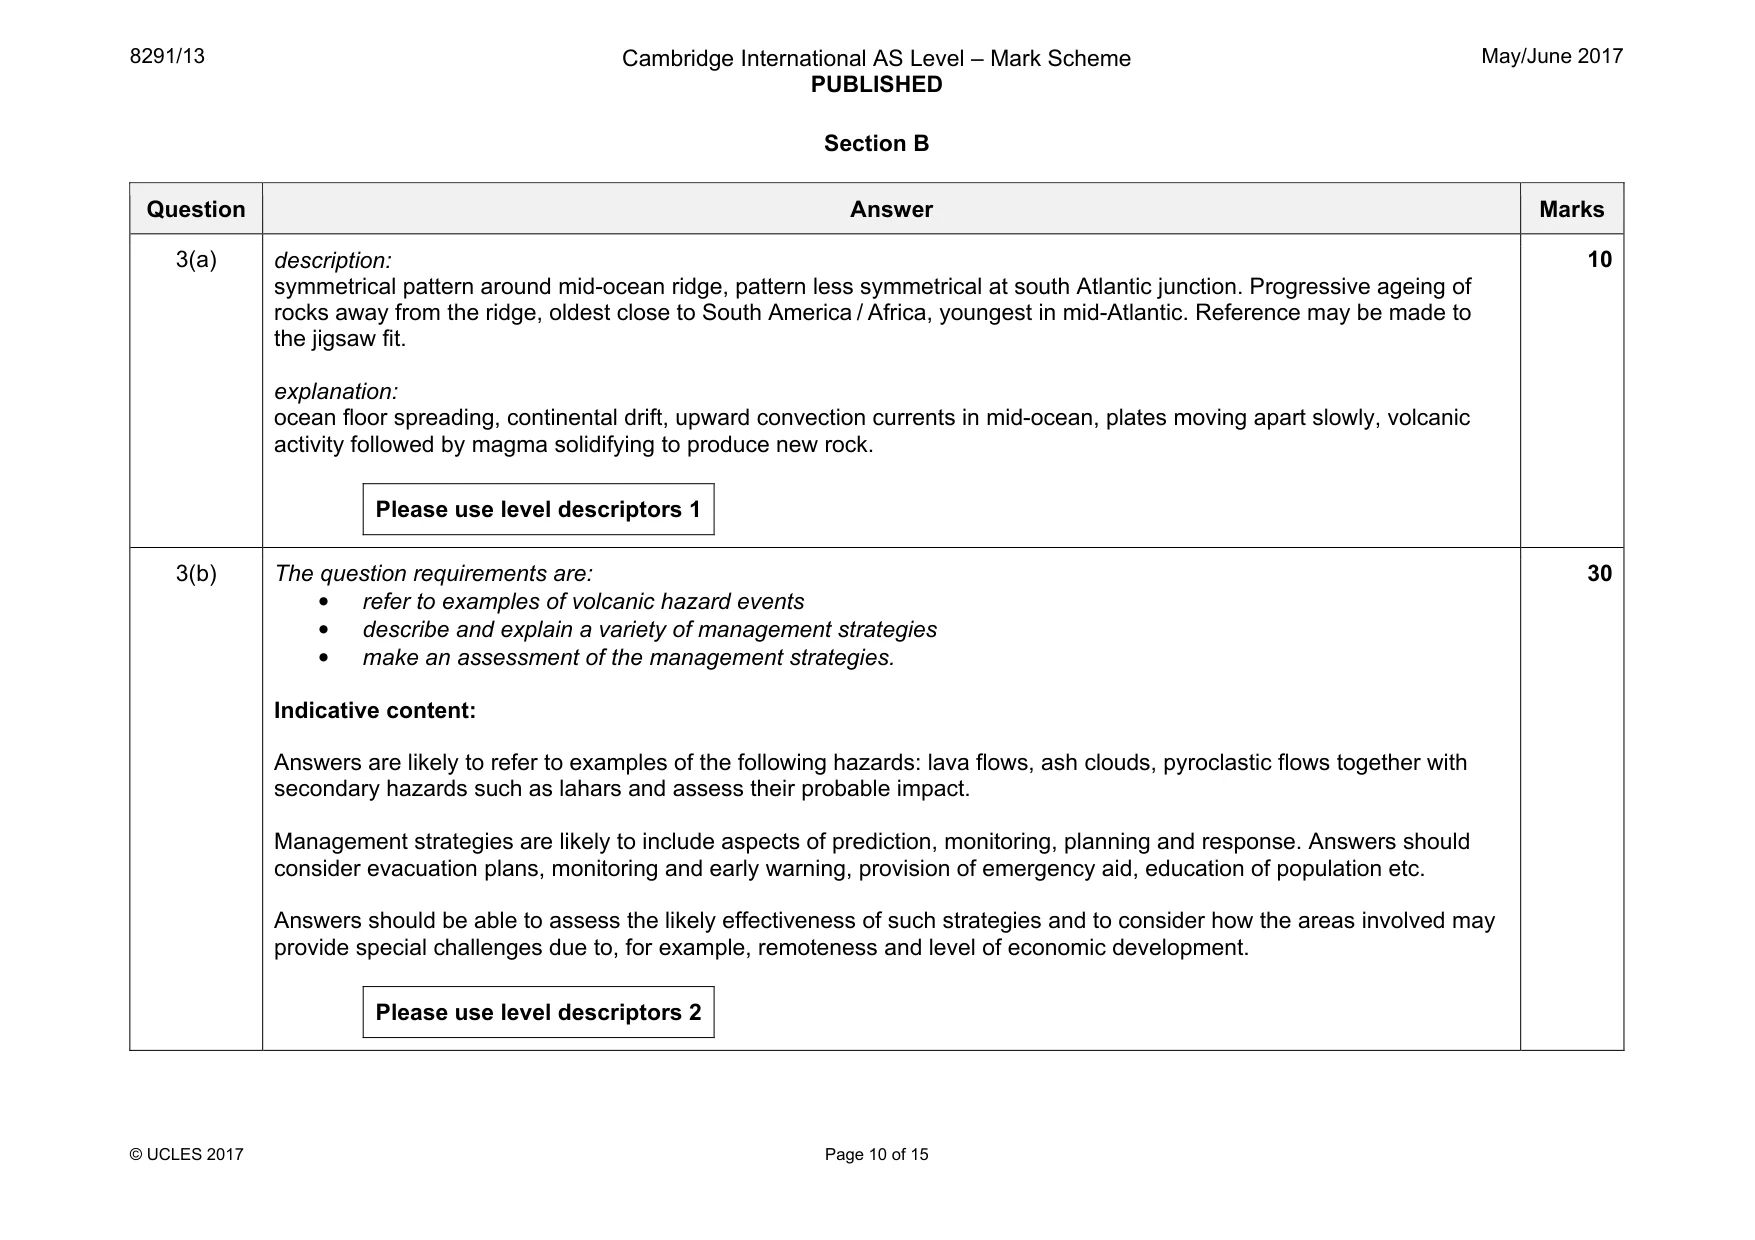
8291/13 Cambridge International AS Level – Mark Scheme PUBLISHED May/June 2017 © UCLES 2017 Page 10 of 15 Section B Question Answer Marks 3(a) description: symmetrical pattern around mid-ocean ridge, pattern less symmetrical at south Atlantic junction. Progressive ageing of rocks away from the ridge, oldest close to South America / Africa, youngest in mid-Atlantic. Reference may be made to the jigsaw fit. explanation: ocean floor spreading, continental drift, upward convection currents in mid-ocean, plates moving apart slowly, volcanic activity followed by magma solidifying to produce new rock. Please use level descriptors 1 10 3(b) The question requirements are: • refer to examples of volcanic hazard events • describe and explain a variety of management strategies • make an assessment of the management strategies. Indicative content: Answers are likely to refer to examples of the following hazards: lava flows, ash clouds, pyroclastic flows together with secondary hazards such as lahars and assess their probable impact. Management strategies are likely to include aspects of prediction, monitoring, planning and response. Answers should consider evacuation plans, monitoring and early warning, provision of emergency aid, education of population etc. Answers should be able to assess the likely effectiveness of such strategies and to consider how the areas involved may provide special challenges due to, for example, remoteness and level of economic development. Please use level descriptors 2 30
Mark scheme, page 11
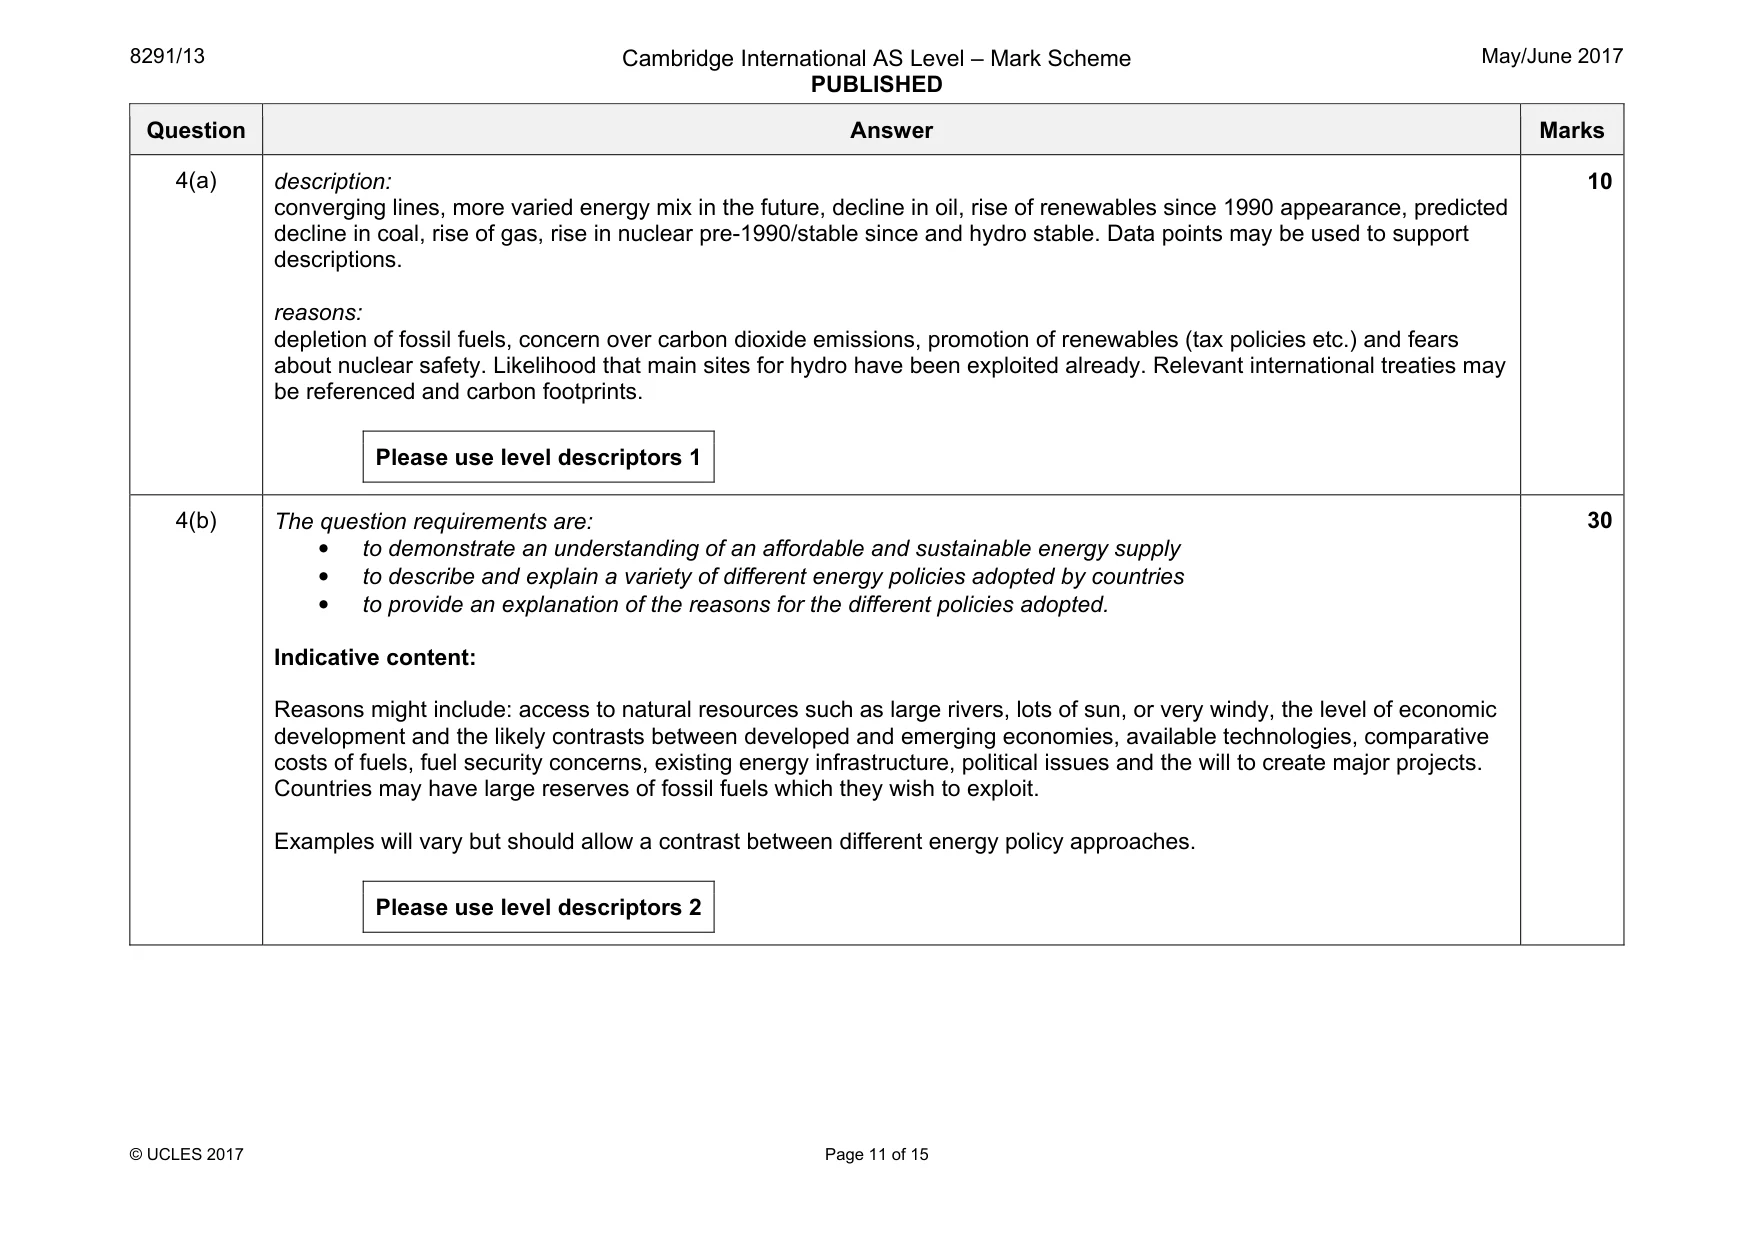
8291/13 Cambridge International AS Level – Mark Scheme PUBLISHED May/June 2017 © UCLES 2017 Page 11 of 15 Question Answer Marks 4(a) description: converging lines, more varied energy mix in the future, decline in oil, rise of renewables since 1990 appearance, predicted decline in coal, rise of gas, rise in nuclear pre-1990/stable since and hydro stable. Data points may be used to support descriptions. reasons: depletion of fossil fuels, concern over carbon dioxide emissions, promotion of renewables (tax policies etc.) and fears about nuclear safety. Likelihood that main sites for hydro have been exploited already. Relevant international treaties may be referenced and carbon footprints. Please use level descriptors 1 10 4(b) The question requirements are: • to demonstrate an understanding of an affordable and sustainable energy supply • to describe and explain a variety of different energy policies adopted by countries • to provide an explanation of the reasons for the different policies adopted. Indicative content: Reasons might include: access to natural resources such as large rivers, lots of sun, or very windy, the level of economic development and the likely contrasts between developed and emerging economies, available technologies, comparative costs of fuels, fuel security concerns, existing energy infrastructure, political issues and the will to create major projects. Countries may have large reserves of fossil fuels which they wish to exploit. Examples will vary but should allow a contrast between different energy policy approaches. Please use level descriptors 2 30
Mark scheme, page 12
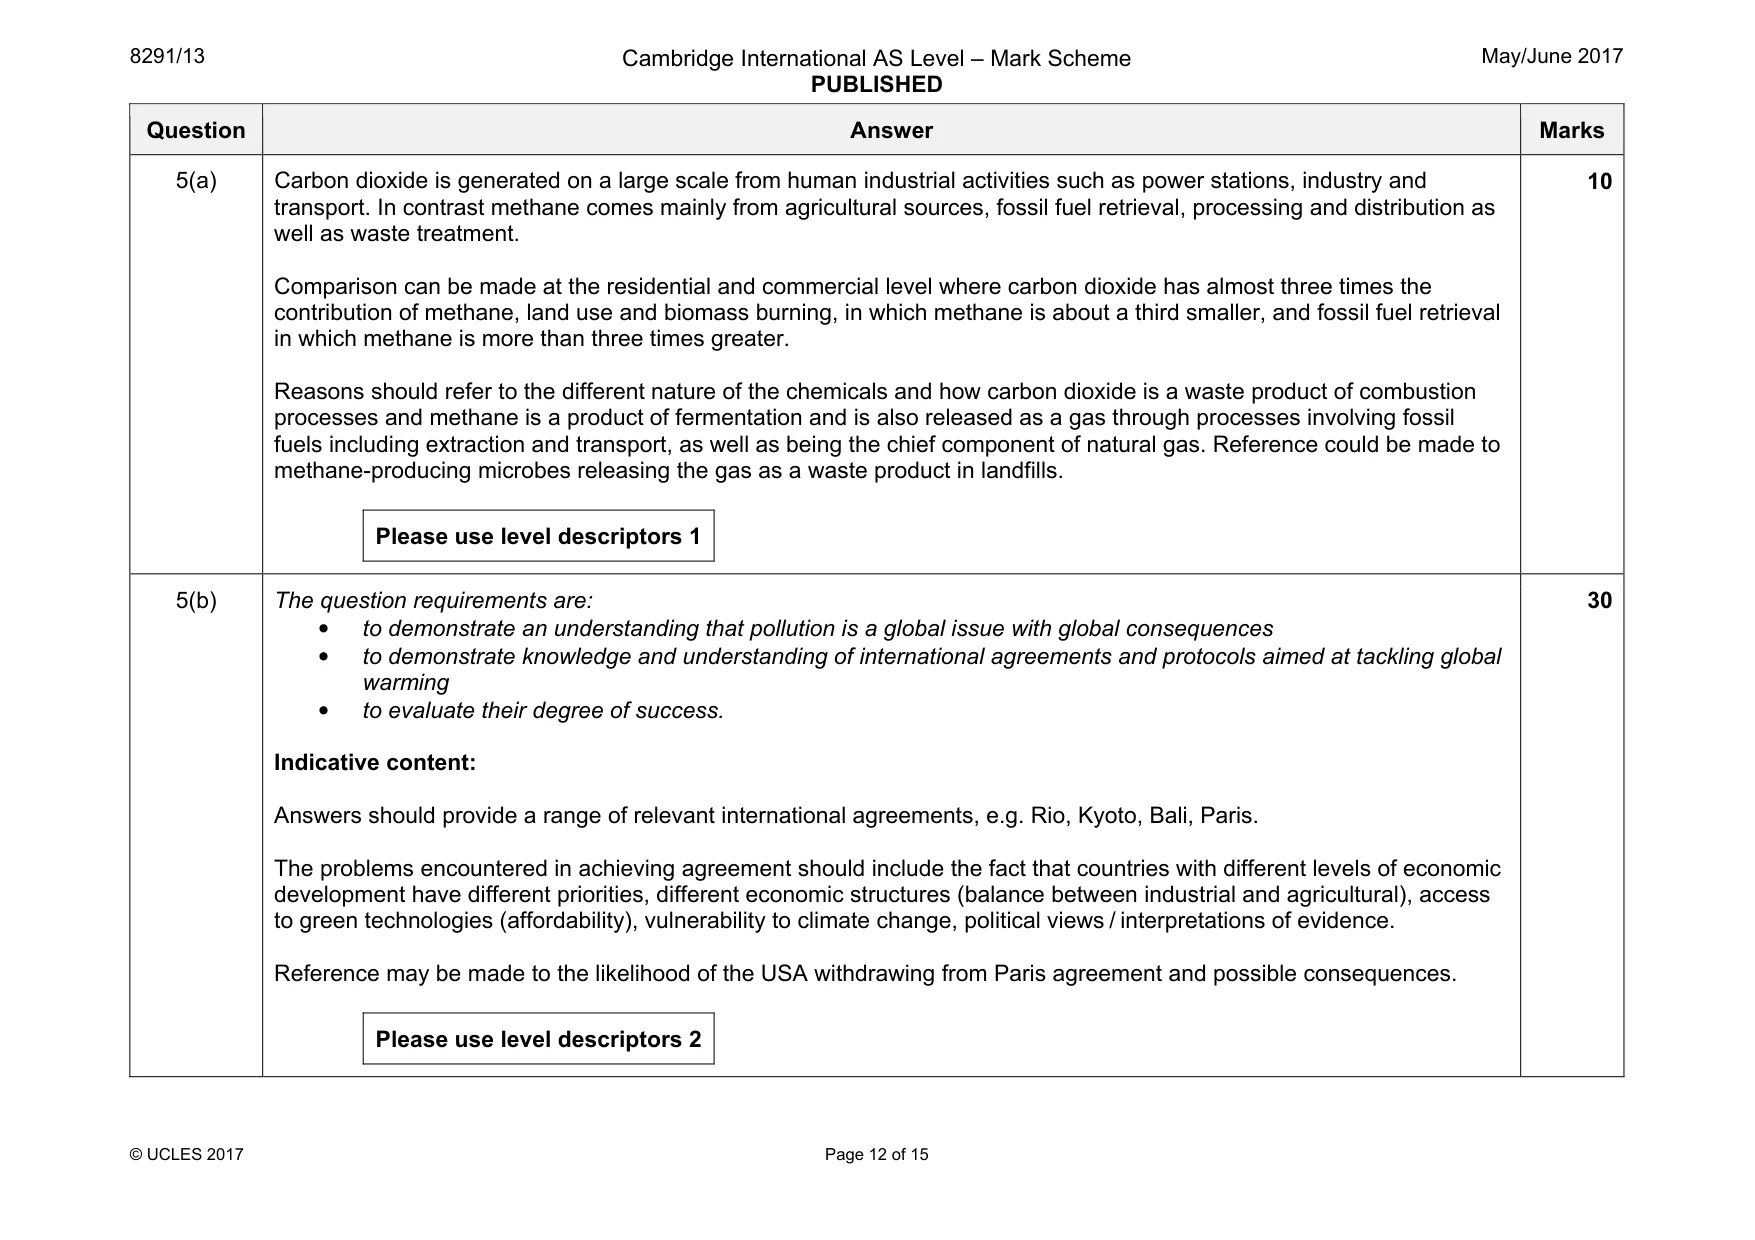
8291/13 Cambridge International AS Level – Mark Scheme PUBLISHED May/June 2017 © UCLES 2017 Page 12 of 15 Question Answer Marks 5(a) Carbon dioxide is generated on a large scale from human industrial activities such as power stations, industry and transport. In contrast methane comes mainly from agricultural sources, fossil fuel retrieval, processing and distribution as well as waste treatment. Comparison can be made at the residential and commercial level where carbon dioxide has almost three times the contribution of methane, land use and biomass burning, in which methane is about a third smaller, and fossil fuel retrieval in which methane is more than three times greater. Reasons should refer to the different nature of the chemicals and how carbon dioxide is a waste product of combustion processes and methane is a product of fermentation and is also released as a gas through processes involving fossil fuels including extraction and transport, as well as being the chief component of natural gas. Reference could be made to methane-producing microbes releasing the gas as a waste product in landfills. Please use level descriptors 1 10 5(b) The question requirements are: • to demonstrate an understanding that pollution is a global issue with global consequences • to demonstrate knowledge and understanding of international agreements and protocols aimed at tackling global warming • to evaluate their degree of success. Indicative content: Answers should provide a range of relevant international agreements, e.g. Rio, Kyoto, Bali, Paris. The problems encountered in achieving agreement should include the fact that countries with different levels of economic development have different priorities, different economic structures (balance between industrial and agricultural), access to green technologies (affordability), vulnerability to climate change, political views / interpretations of evidence. Reference may be made to the likelihood of the USA withdrawing from Paris agreement and possible consequences. Please use level descriptors 2 30
Mark scheme, page 13
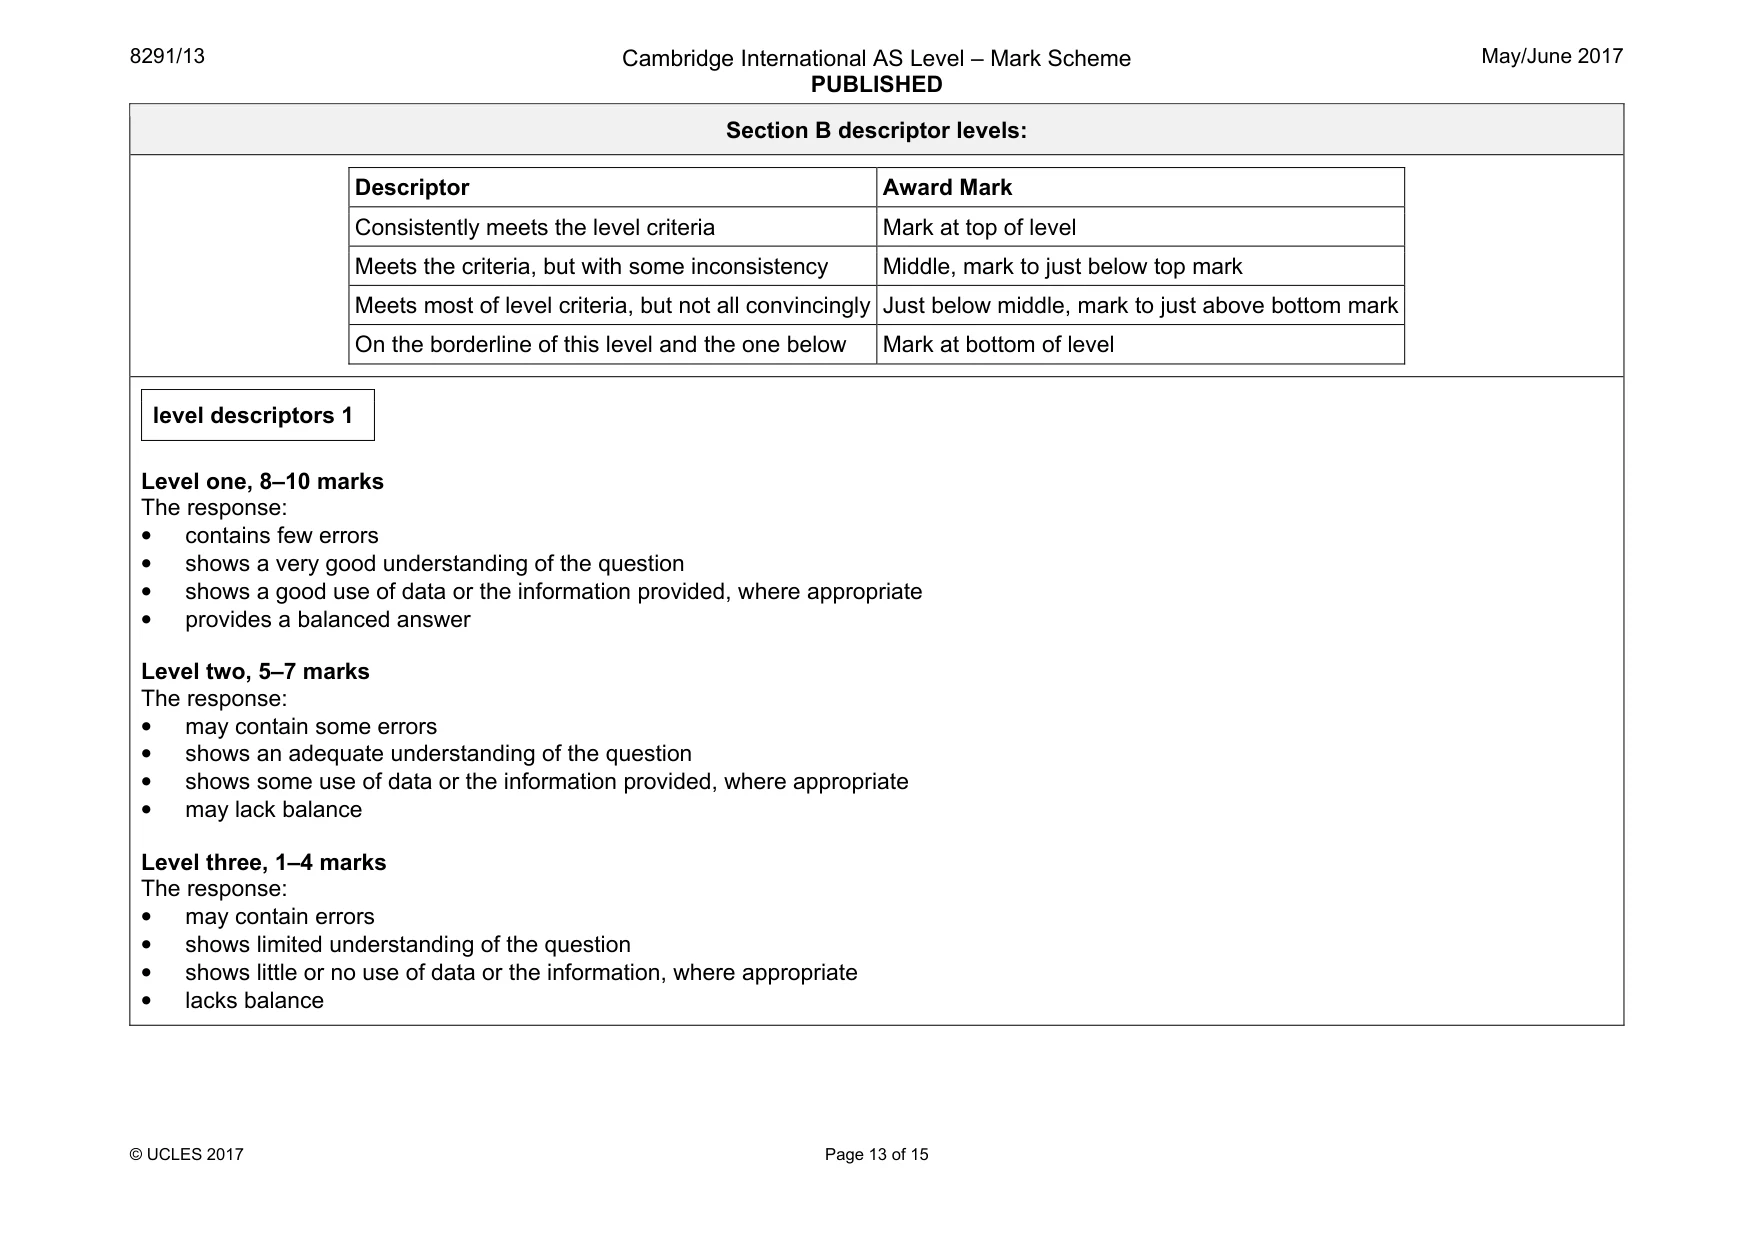
8291/13 Cambridge International AS Level – Mark Scheme PUBLISHED May/June 2017 © UCLES 2017 Page 13 of 15 Section B descriptor levels: Descriptor Award Mark Consistently meets the level criteria Mark at top of level Meets the criteria, but with some inconsistency Middle, mark to just below top mark Meets most of level criteria, but not all convincingly Just below middle, mark to just above bottom mark On the borderline of this level and the one below Mark at bottom of level level descriptors 1 Level one, 8–10 marks The response: • contains few errors • shows a very good understanding of the question • shows a good use of data or the information provided, where appropriate • provides a balanced answer Level two, 5–7 marks The response: • may contain some errors • shows an adequate understanding of the question • shows some use of data or the information provided, where appropriate • may lack balance Level three, 1–4 marks The response: • may contain errors • shows limited understanding of the question • shows little or no use of data or the information, where appropriate • lacks balance
Mark scheme, page 14
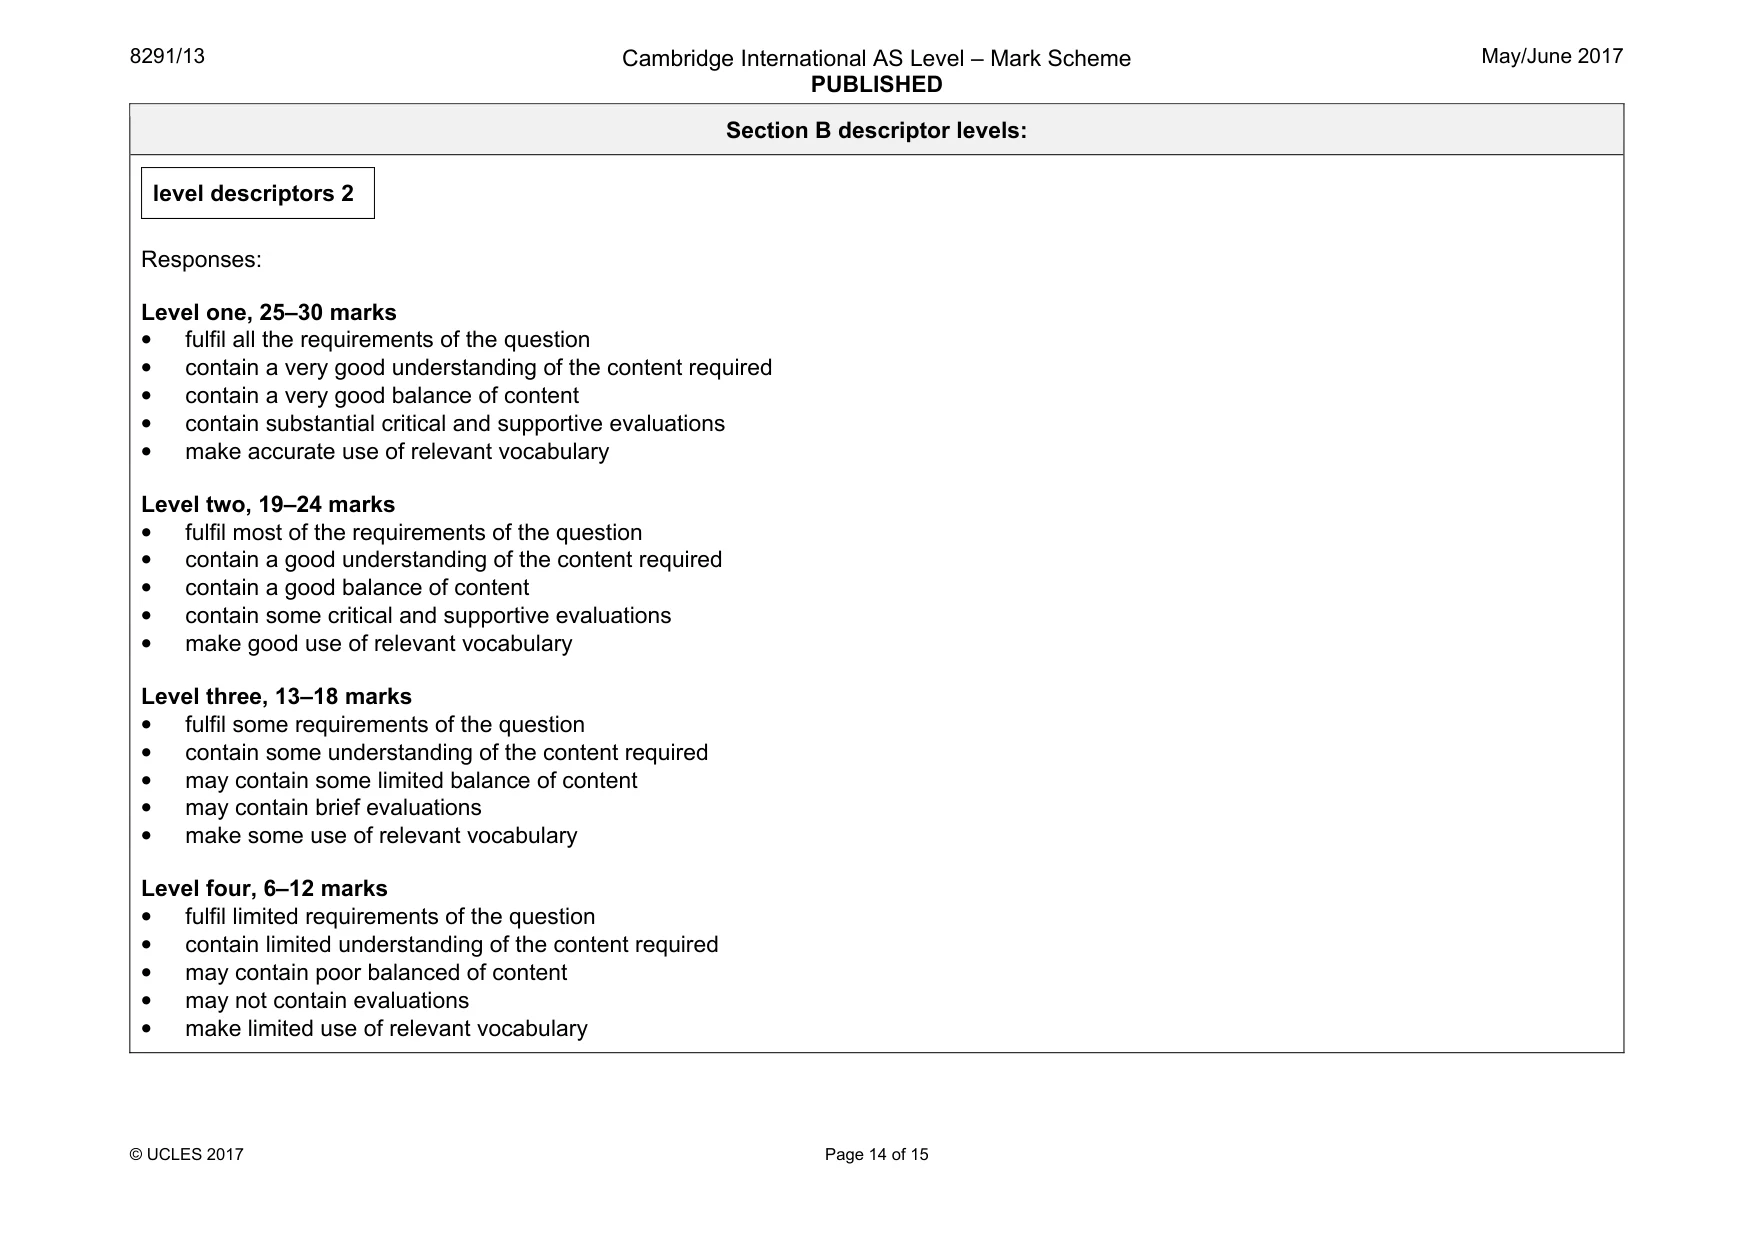
8291/13 Cambridge International AS Level – Mark Scheme PUBLISHED May/June 2017 © UCLES 2017 Page 14 of 15 Section B descriptor levels: level descriptors 2 Responses: Level one, 25–30 marks • fulfil all the requirements of the question • contain a very good understanding of the content required • contain a very good balance of content • contain substantial critical and supportive evaluations • make accurate use of relevant vocabulary Level two, 19–24 marks • fulfil most of the requirements of the question • contain a good understanding of the content required • contain a good balance of content • contain some critical and supportive evaluations • make good use of relevant vocabulary Level three, 13–18 marks • fulfil some requirements of the question • contain some understanding of the content required • may contain some limited balance of content • may contain brief evaluations • make some use of relevant vocabulary Level four, 6–12 marks • fulfil limited requirements of the question • contain limited understanding of the content required • may contain poor balanced of content • may not contain evaluations • make limited use of relevant vocabulary
Mark scheme, page 15
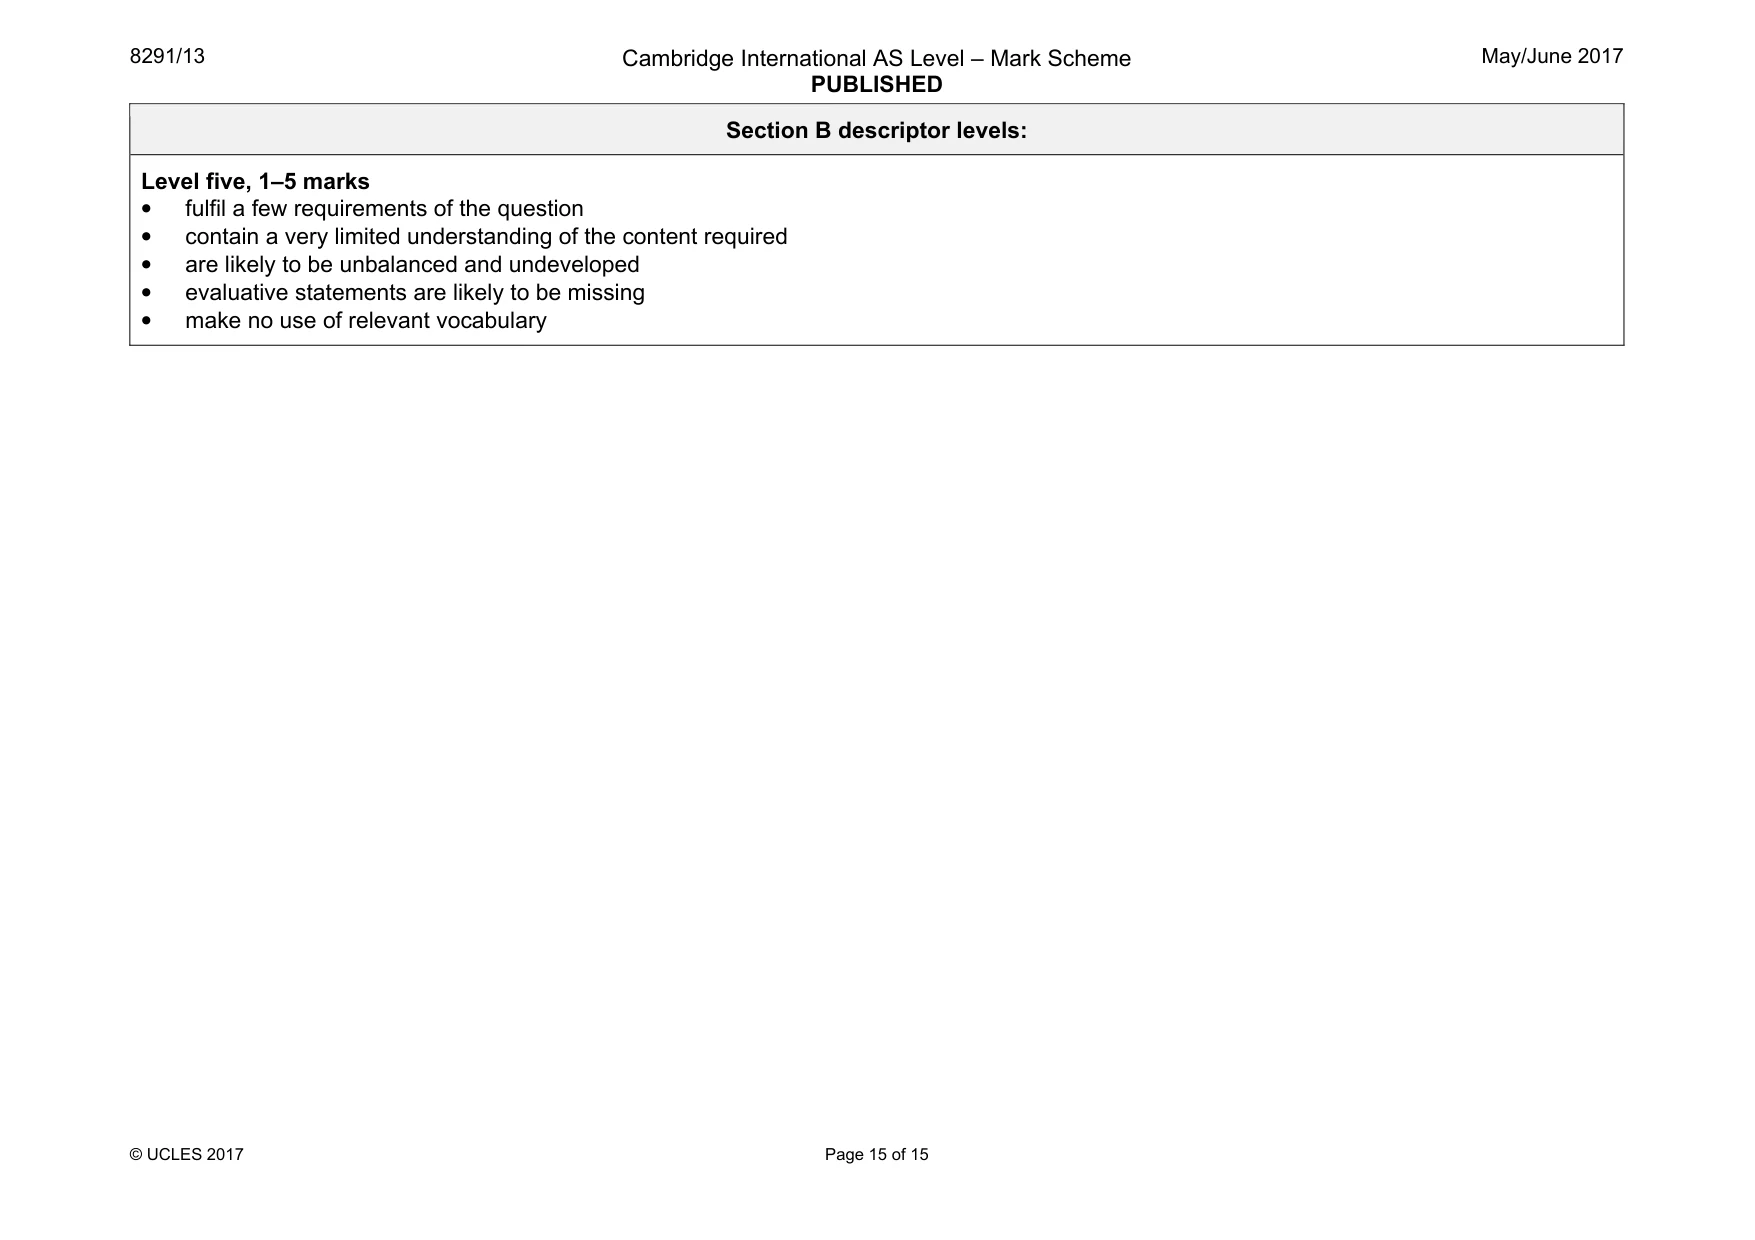
8291/13 Cambridge International AS Level – Mark Scheme PUBLISHED May/June 2017 © UCLES 2017 Page 15 of 15 Section B descriptor levels: Level five, 1–5 marks • fulfil a few requirements of the question • contain a very limited understanding of the content required • are likely to be unbalanced and undeveloped • evaluative statements are likely to be missing • make no use of relevant vocabulary
What you needed in this session
Cambridge’s own grade thresholds for 2017 May/June, Paper 1 · Variant 3. A higher threshold means an easier paper — the bar moves with how the cohort did.