Cambridge A Level Economics 9708 — 2023 Oct/Nov Paper 3 · Variant 2
9708/32/O/N/23 · 30 marks · ≈34 min
The question paper and its mark scheme, free to read here and free to download. This is Cambridge’s own paper, exactly as it was sat.
Question paper12 pages



Mark scheme3 pages
Answers below. Sit the paper first if you are practising.


Paper as text
Question paper, page 1
This document has 12 pages. Any blank pages are indicated. IB23 11_9708_32/2RP © UCLES 2023 [Turn over *2335296378* Cambridge International AS & A Level ECONOMICS 9708/32 Paper 3 A Level Multiple Choice October/November 2023 1 hour 15 minutes You must answer on the multiple choice answer sheet. You will need: Multiple choice answer sheet Soft clean eraser Soft pencil (type B or HB is recommended) INSTRUCTIONS There are thirty questions on this paper. Answer all questions. For each question there are four possible answers A, B, C and D. Choose the one you consider correct and record your choice in soft pencil on the multiple choice answer sheet. Follow the instructions on the multiple choice answer sheet. Write in soft pencil. Write your name, centre number and candidate number on the multiple choice answer sheet in the spaces provided unless this has been done for you. Do not use correction fluid. Do not write on any bar codes. You may use a calculator. INFORMATION The total mark for this paper is 30. Each correct answer will score one mark. Any rough working should be done on this question paper.
Question paper, page 2
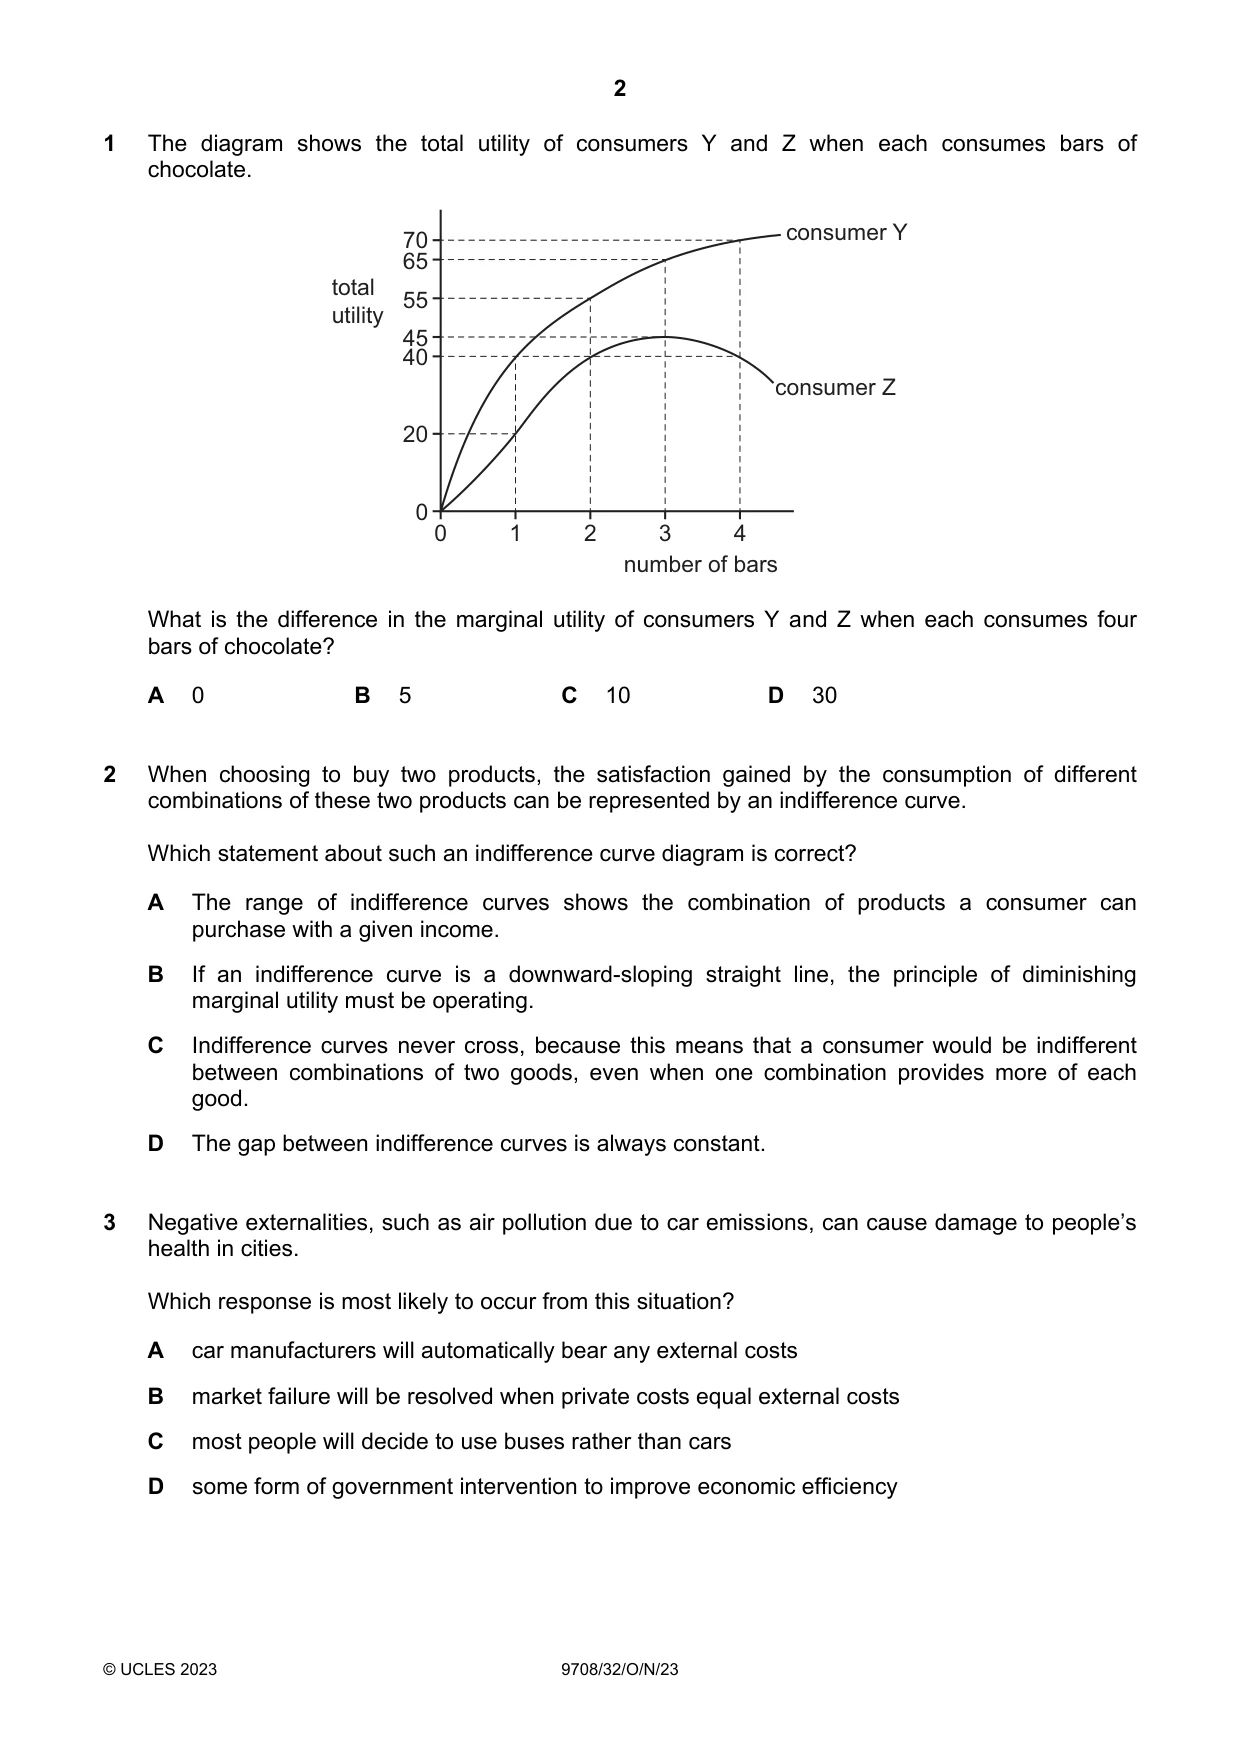
2 © UCLES 2023 9708/32/O/N/23 1 The diagram shows the total utility of consumers Y and Z when each consumes bars of chocolate. 70 65 55 45 40 20 0 0 1 2 3 4 total utility number of bars consumer Y consumer Z What is the difference in the marginal utility of consumers Y and Z when each consumes four bars of chocolate? A 0 B 5 C 10 D 30 2 When choosing to buy two products, the satisfaction gained by the consumption of different combinations of these two products can be represented by an indifference curve. Which statement about such an indifference curve diagram is correct? A The range of indifference curves shows the combination of products a consumer can purchase with a given income. B If an indifference curve is a downward-sloping straight line, the principle of diminishing marginal utility must be operating. C Indifference curves never cross, because this means that a consumer would be indifferent between combinations of two goods, even when one combination provides more of each good. D The gap between indifference curves is always constant. 3 Negative externalities, such as air pollution due to car emissions, can cause damage to people’s health in cities. Which response is most likely to occur from this situation? A car manufacturers will automatically bear any external costs B market failure will be resolved when private costs equal external costs C most people will decide to use buses rather than cars D some form of government intervention to improve economic efficiency
Question paper, page 3
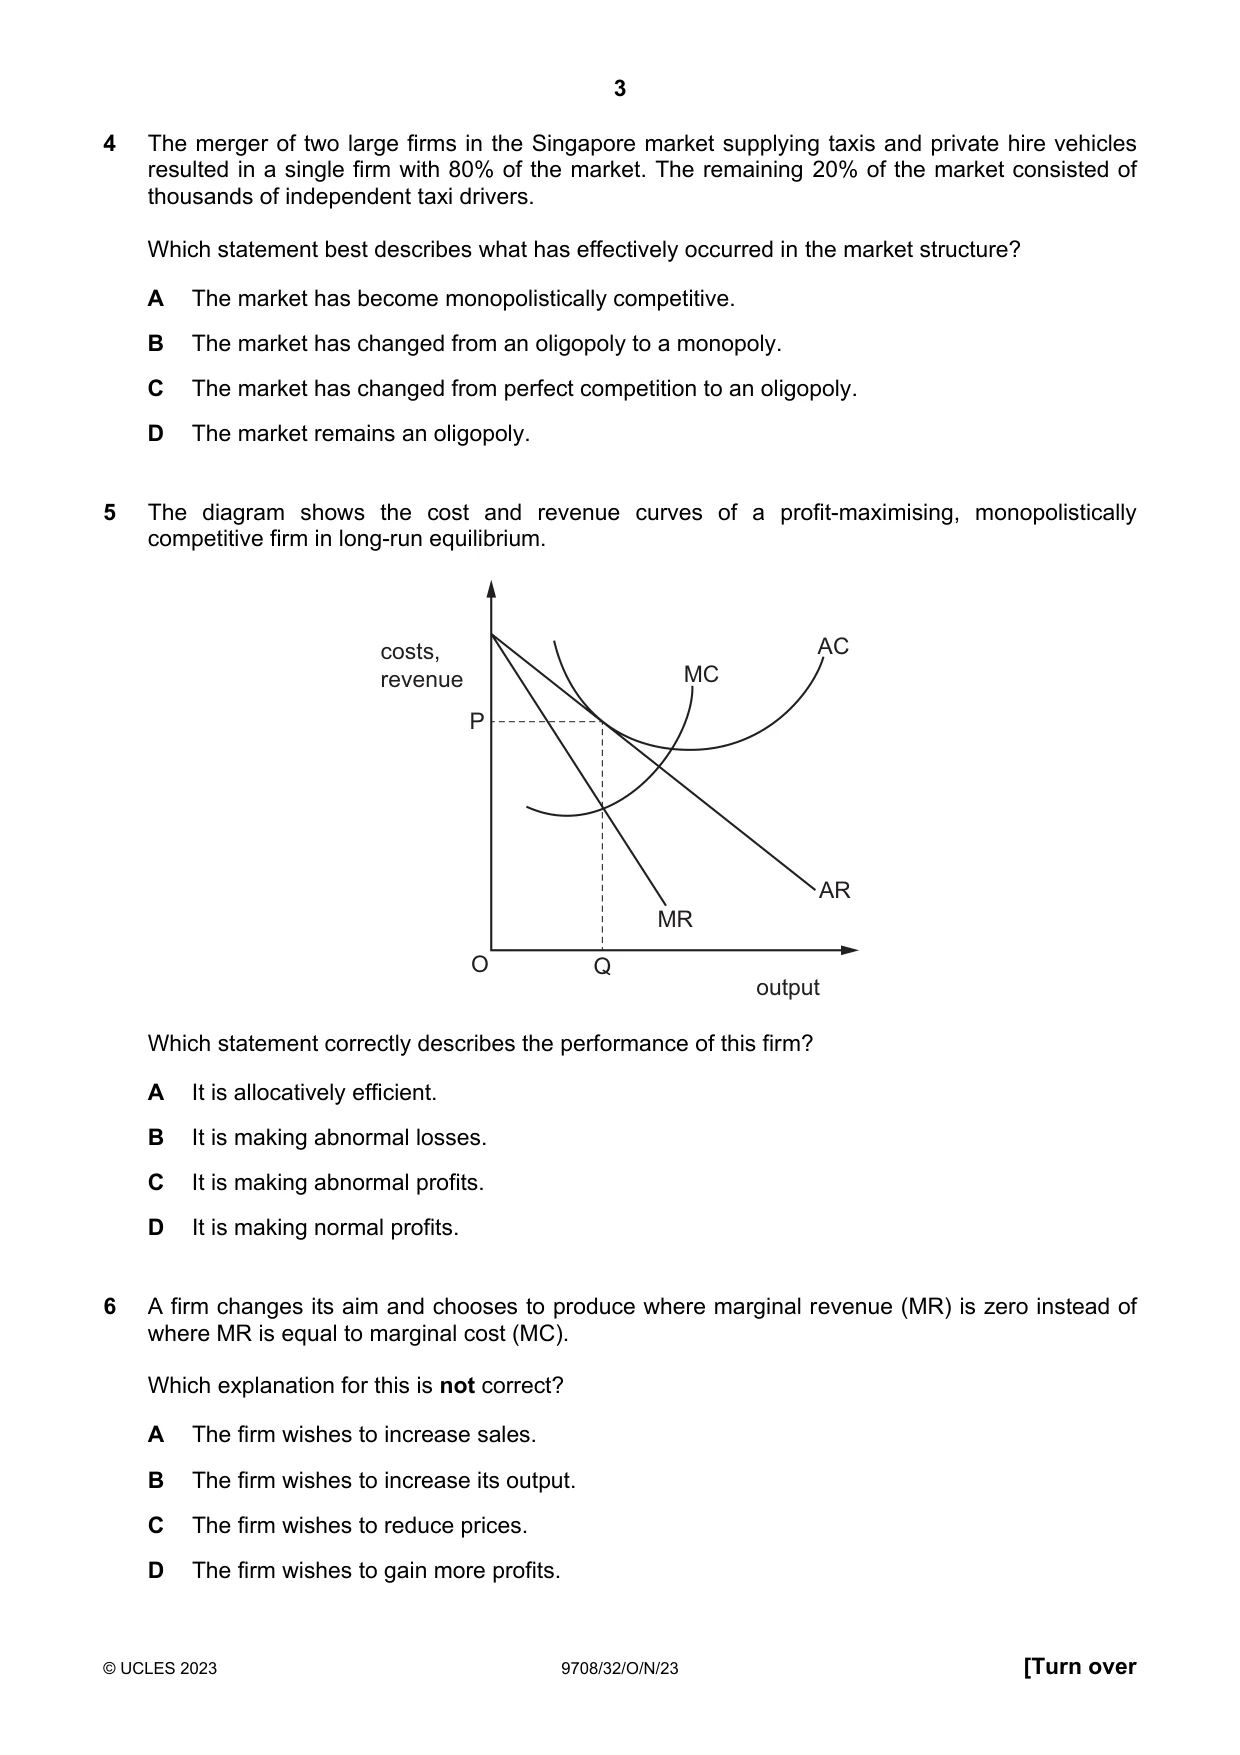
3 © UCLES 2023 9708/32/O/N/23 [Turn over 4 The merger of two large firms in the Singapore market supplying taxis and private hire vehicles resulted in a single firm with 80% of the market. The remaining 20% of the market consisted of thousands of independent taxi drivers. Which statement best describes what has effectively occurred in the market structure? A The market has become monopolistically competitive. B The market has changed from an oligopoly to a monopoly. C The market has changed from perfect competition to an oligopoly. D The market remains an oligopoly. 5 The diagram shows the cost and revenue curves of a profit-maximising, monopolistically competitive firm in long-run equilibrium. costs, revenue O output AC MC AR MR P Q Which statement correctly describes the performance of this firm? A It is allocatively efficient. B It is making abnormal losses. C It is making abnormal profits. D It is making normal profits. 6 A firm changes its aim and chooses to produce where marginal revenue (MR) is zero instead of where MR is equal to marginal cost (MC). Which explanation for this is not correct? A The firm wishes to increase sales. B The firm wishes to increase its output. C The firm wishes to reduce prices. D The firm wishes to gain more profits.
Question paper, page 4
4 © UCLES 2023 9708/32/O/N/23 7 A firm operating in the airline industry uses third degree price discrimination. Which condition is most likely to allow this to happen? A Consumers are able to buy cheaply and then sell the product at a higher price. B Price elasticity of demand is the same for all consumers in the market. C The firm faces a perfectly elastic demand curve. D The firm is able to keep the different market segments separate. 8 What is not an example of a moral hazard? A People with a higher risk of unemployment are more likely to undertake training. B People with free dental care are less likely to take care of their teeth with good oral hygiene. C People with insurance against car theft are more likely to park their car in high crime areas. D People with unemployment benefits are less likely to undertake retraining if they become unemployed. 9 In recent years, the fuel cost of operating a jet aircraft has declined. Over the same period, improved design has led to much quieter aircraft. How would this affect the marginal private cost (MPC) and the marginal external cost (MEC) of air travel? A a downward shift of both the MPC and the MEC curves B a downward shift of the MPC curve and a movement left along the MEC curve C a movement left along both the MPC and the MEC curves D a movement left along the MPC curve and a downward shift of the MEC curve 10 Firm K operates in a competitive market. Firm L is a monopsony employer. Both firms are operating at an equilibrium level of output. Trade unions are introduced with the result that wages in each firm are increased. What is the likely effect on each firm if trade unions enter the labour market? firm K firm L A employment will decrease employment will decrease B employment will decrease employment will increase C employment will increase employment will decrease D employment will increase employment will increase
Question paper, page 5
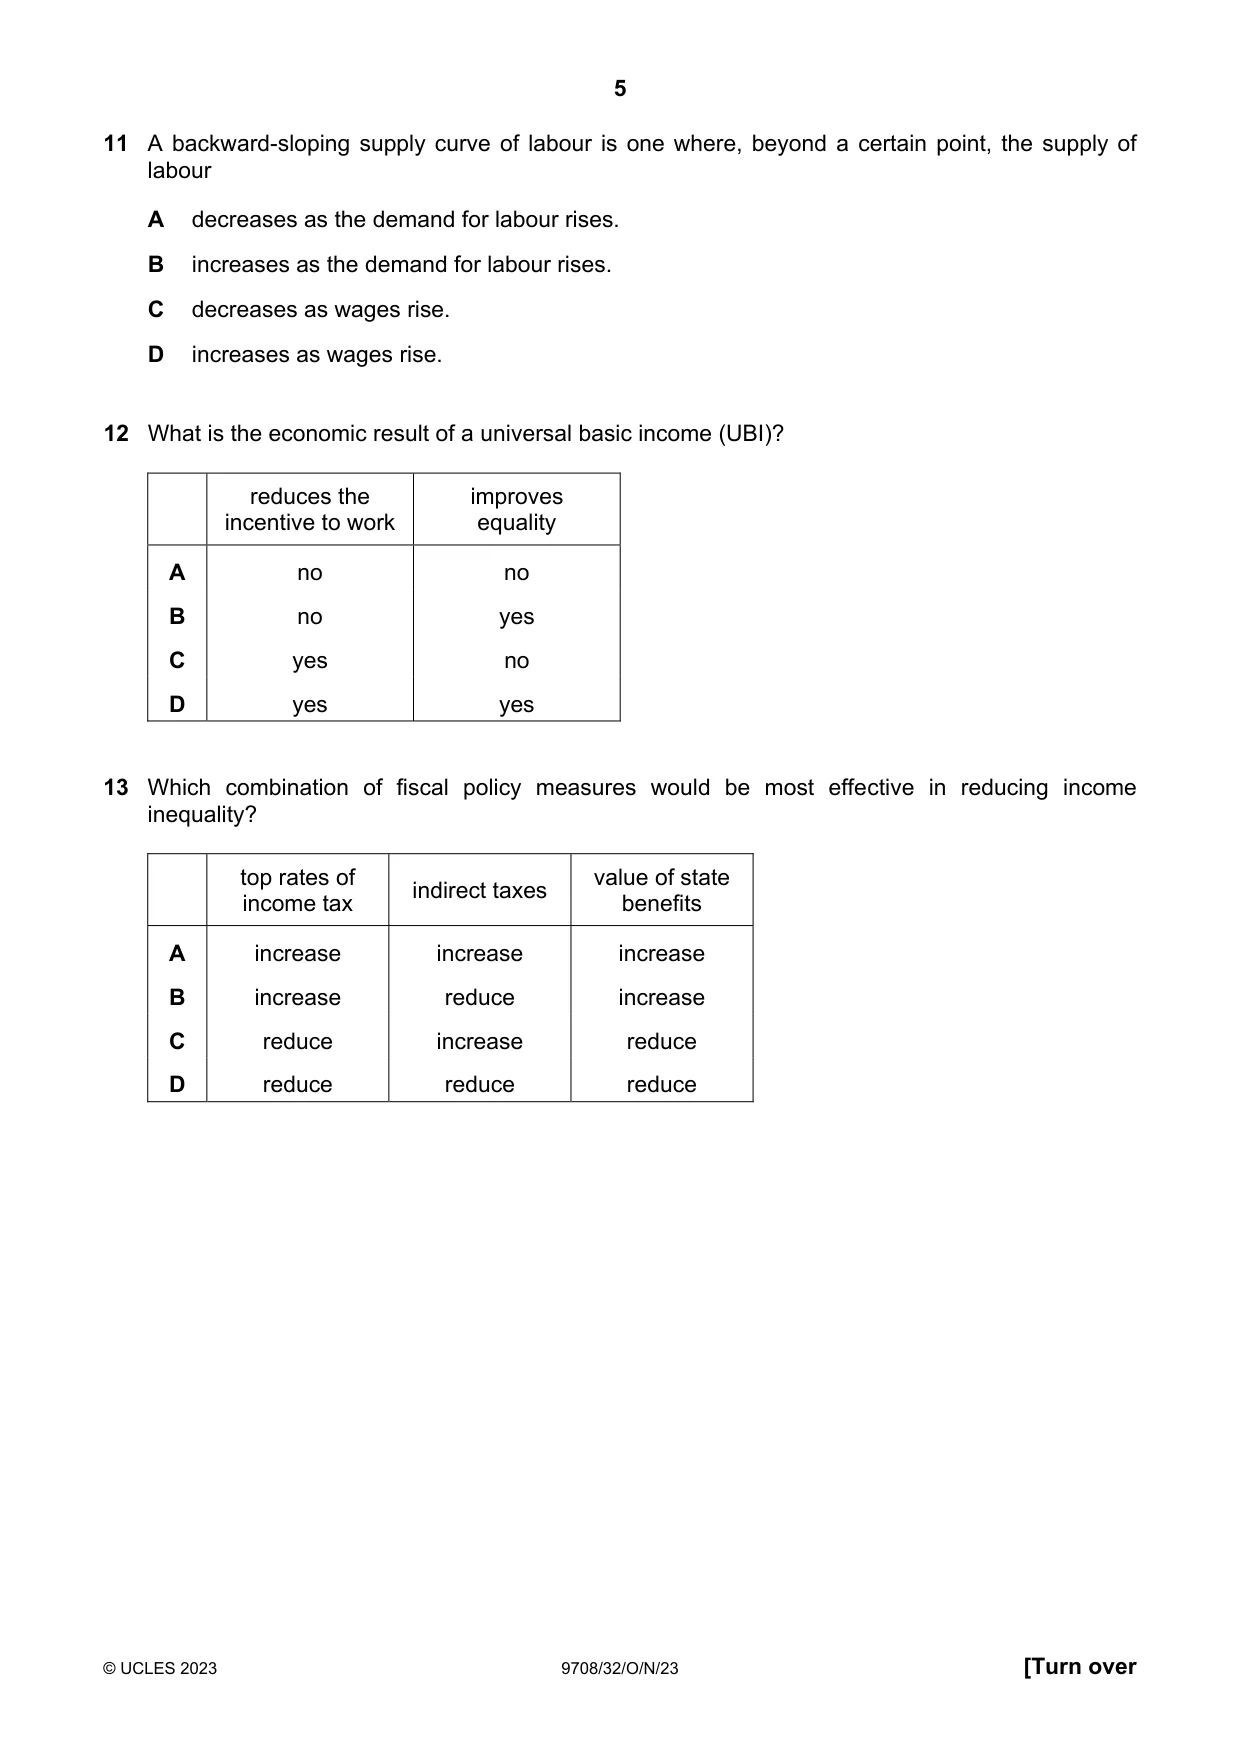
5 © UCLES 2023 9708/32/O/N/23 [Turn over 11 A backward-sloping supply curve of labour is one where, beyond a certain point, the supply of labour A decreases as the demand for labour rises. B increases as the demand for labour rises. C decreases as wages rise. D increases as wages rise. 12 What is the economic result of a universal basic income (UBI)? reduces the incentive to work improves equality A no no B no yes C yes no D yes yes 13 Which combination of fiscal policy measures would be most effective in reducing income inequality? top rates of income tax indirect taxes value of state benefits A increase increase increase B increase reduce increase C reduce increase reduce D reduce reduce reduce
Question paper, page 6
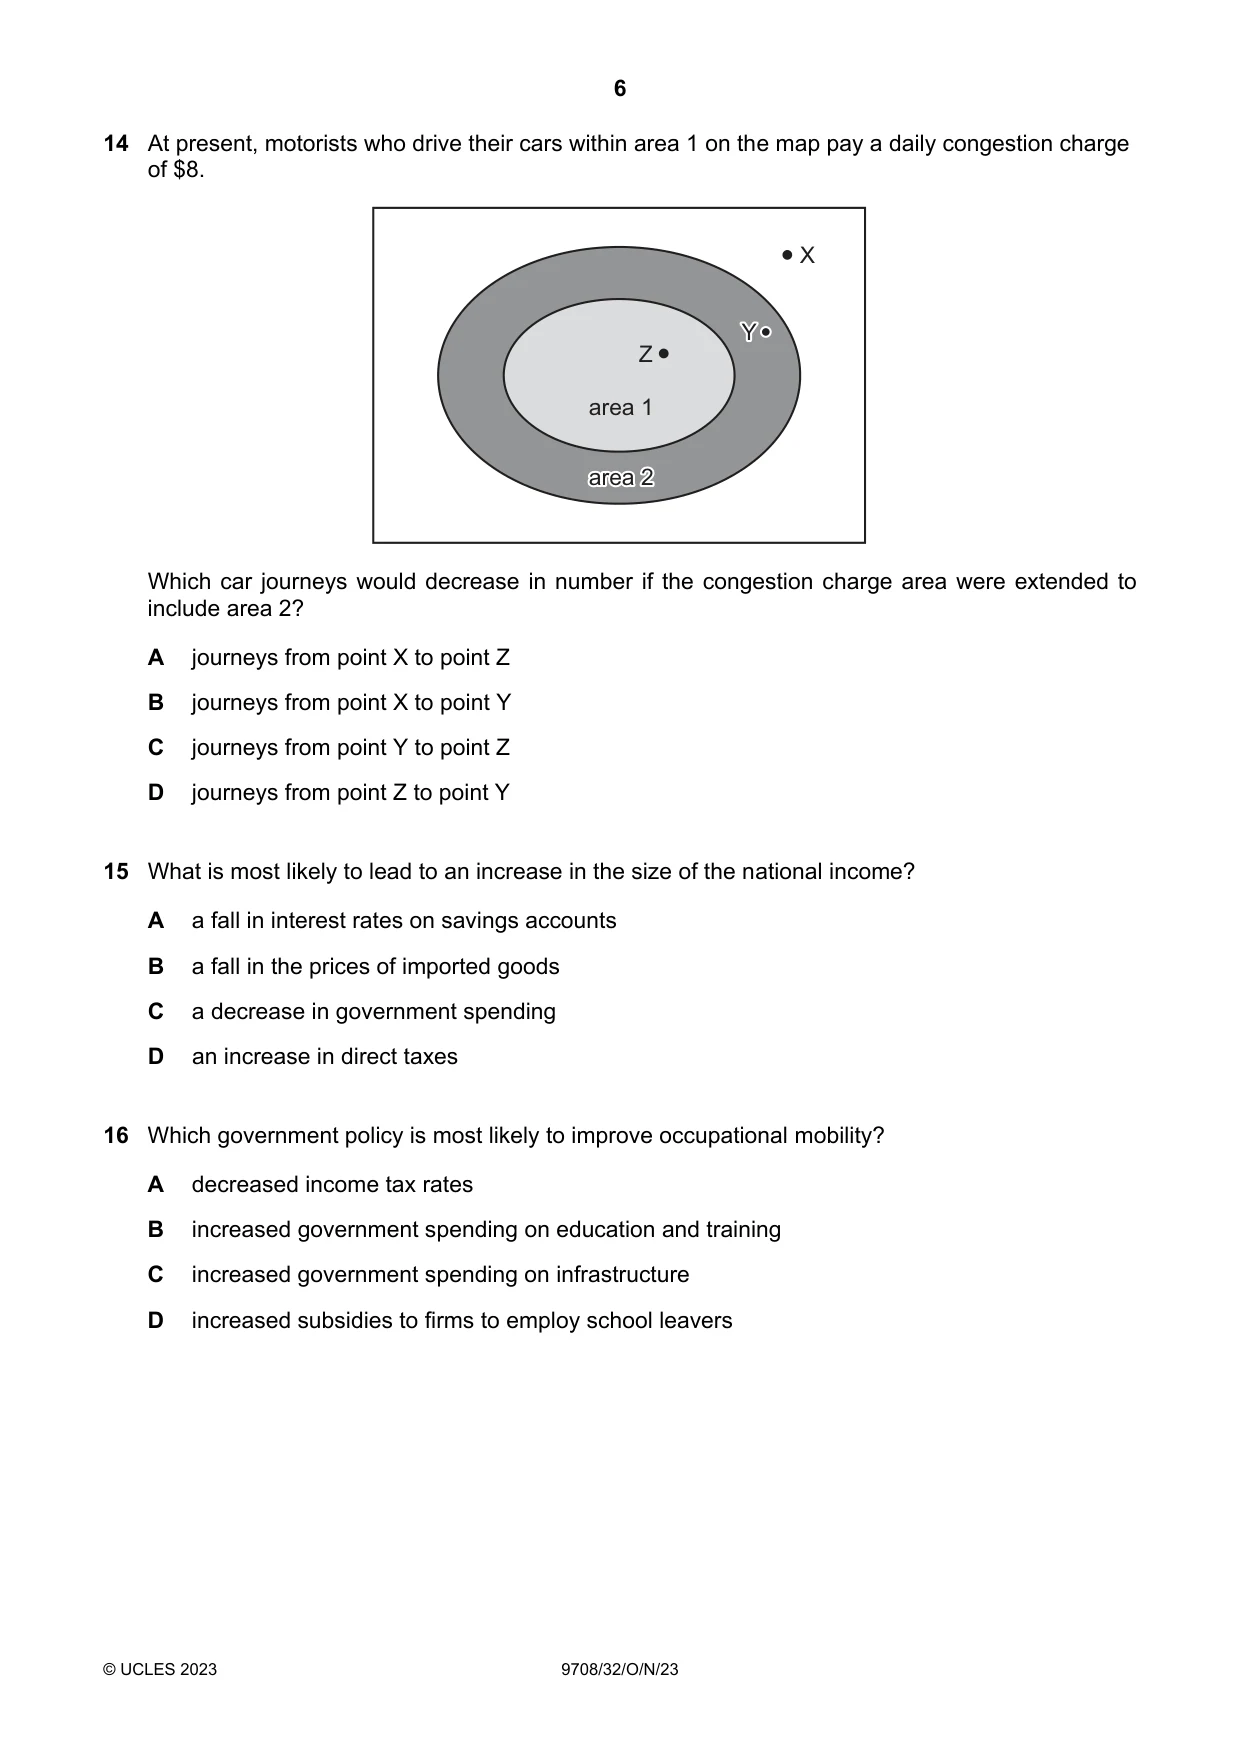
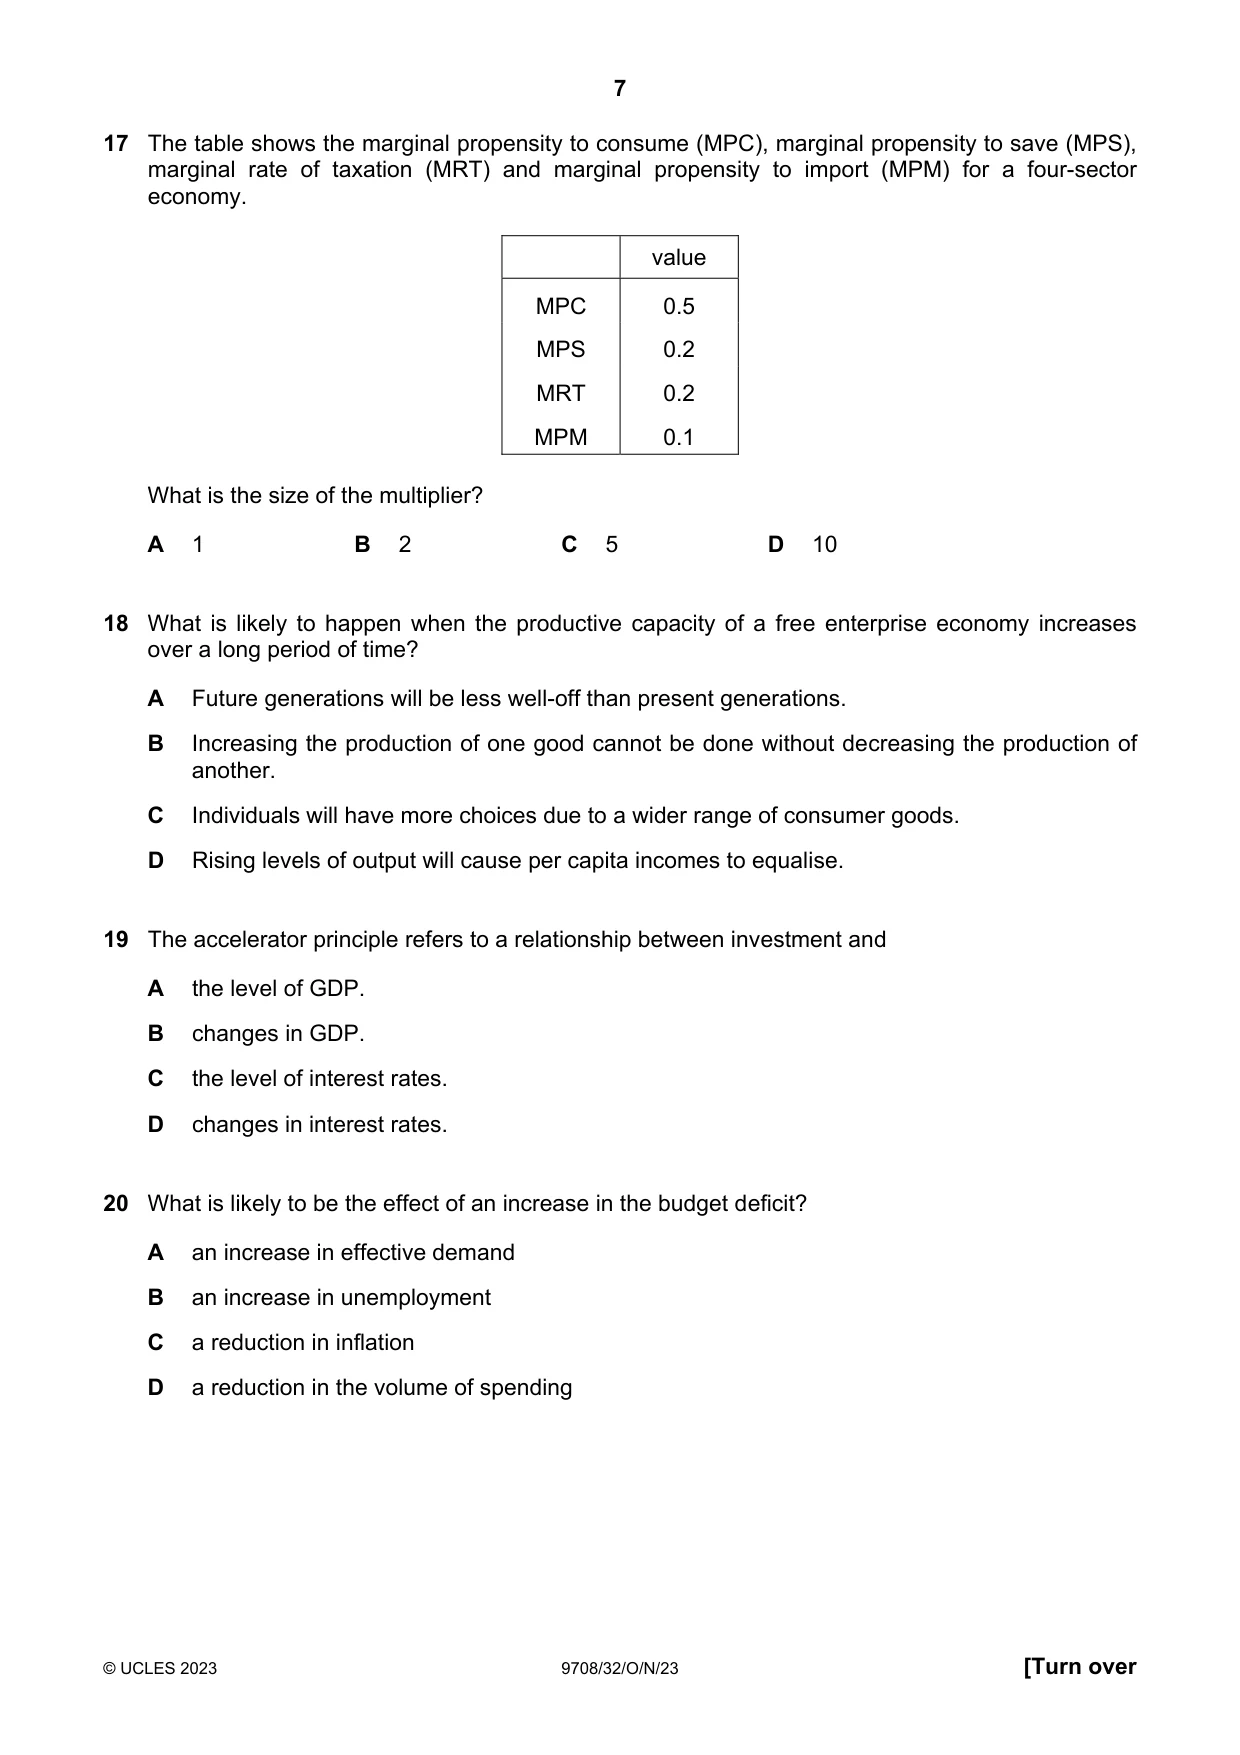
6 © UCLES 2023 9708/32/O/N/23 14 At present, motorists who drive their cars within area 1 on the map pay a daily congestion charge of $8. Z area 1 area 2 area 2 Y area 2 Y X Which car journeys would decrease in number if the congestion charge area were extended to include area 2? A journeys from point X to point Z B journeys from point X to point Y C journeys from point Y to point Z D journeys from point Z to point Y 15 What is most likely to lead to an increase in the size of the national income? A a fall in interest rates on savings accounts B a fall in the prices of imported goods C a decrease in government spending D an increase in direct taxes 16 Which government policy is most likely to improve occupational mobility? A decreased income tax rates B increased government spending on education and training C increased government spending on infrastructure D increased subsidies to firms to employ school leavers
Question paper, page 7
7 © UCLES 2023 9708/32/O/N/23 [Turn over 17 The table shows the marginal propensity to consume (MPC), marginal propensity to save (MPS), marginal rate of taxation (MRT) and marginal propensity to import (MPM) for a four-sector economy. value MPC 0.5 MPS 0.2 MRT 0.2 MPM 0.1 What is the size of the multiplier? A 1 B 2 C 5 D 10 18 What is likely to happen when the productive capacity of a free enterprise economy increases over a long period of time? A Future generations will be less well-off than present generations. B Increasing the production of one good cannot be done without decreasing the production of another. C Individuals will have more choices due to a wider range of consumer goods. D Rising levels of output will cause per capita incomes to equalise. 19 The accelerator principle refers to a relationship between investment and A the level of GDP. B changes in GDP. C the level of interest rates. D changes in interest rates. 20 What is likely to be the effect of an increase in the budget deficit? A an increase in effective demand B an increase in unemployment C a reduction in inflation D a reduction in the volume of spending
Question paper, page 8
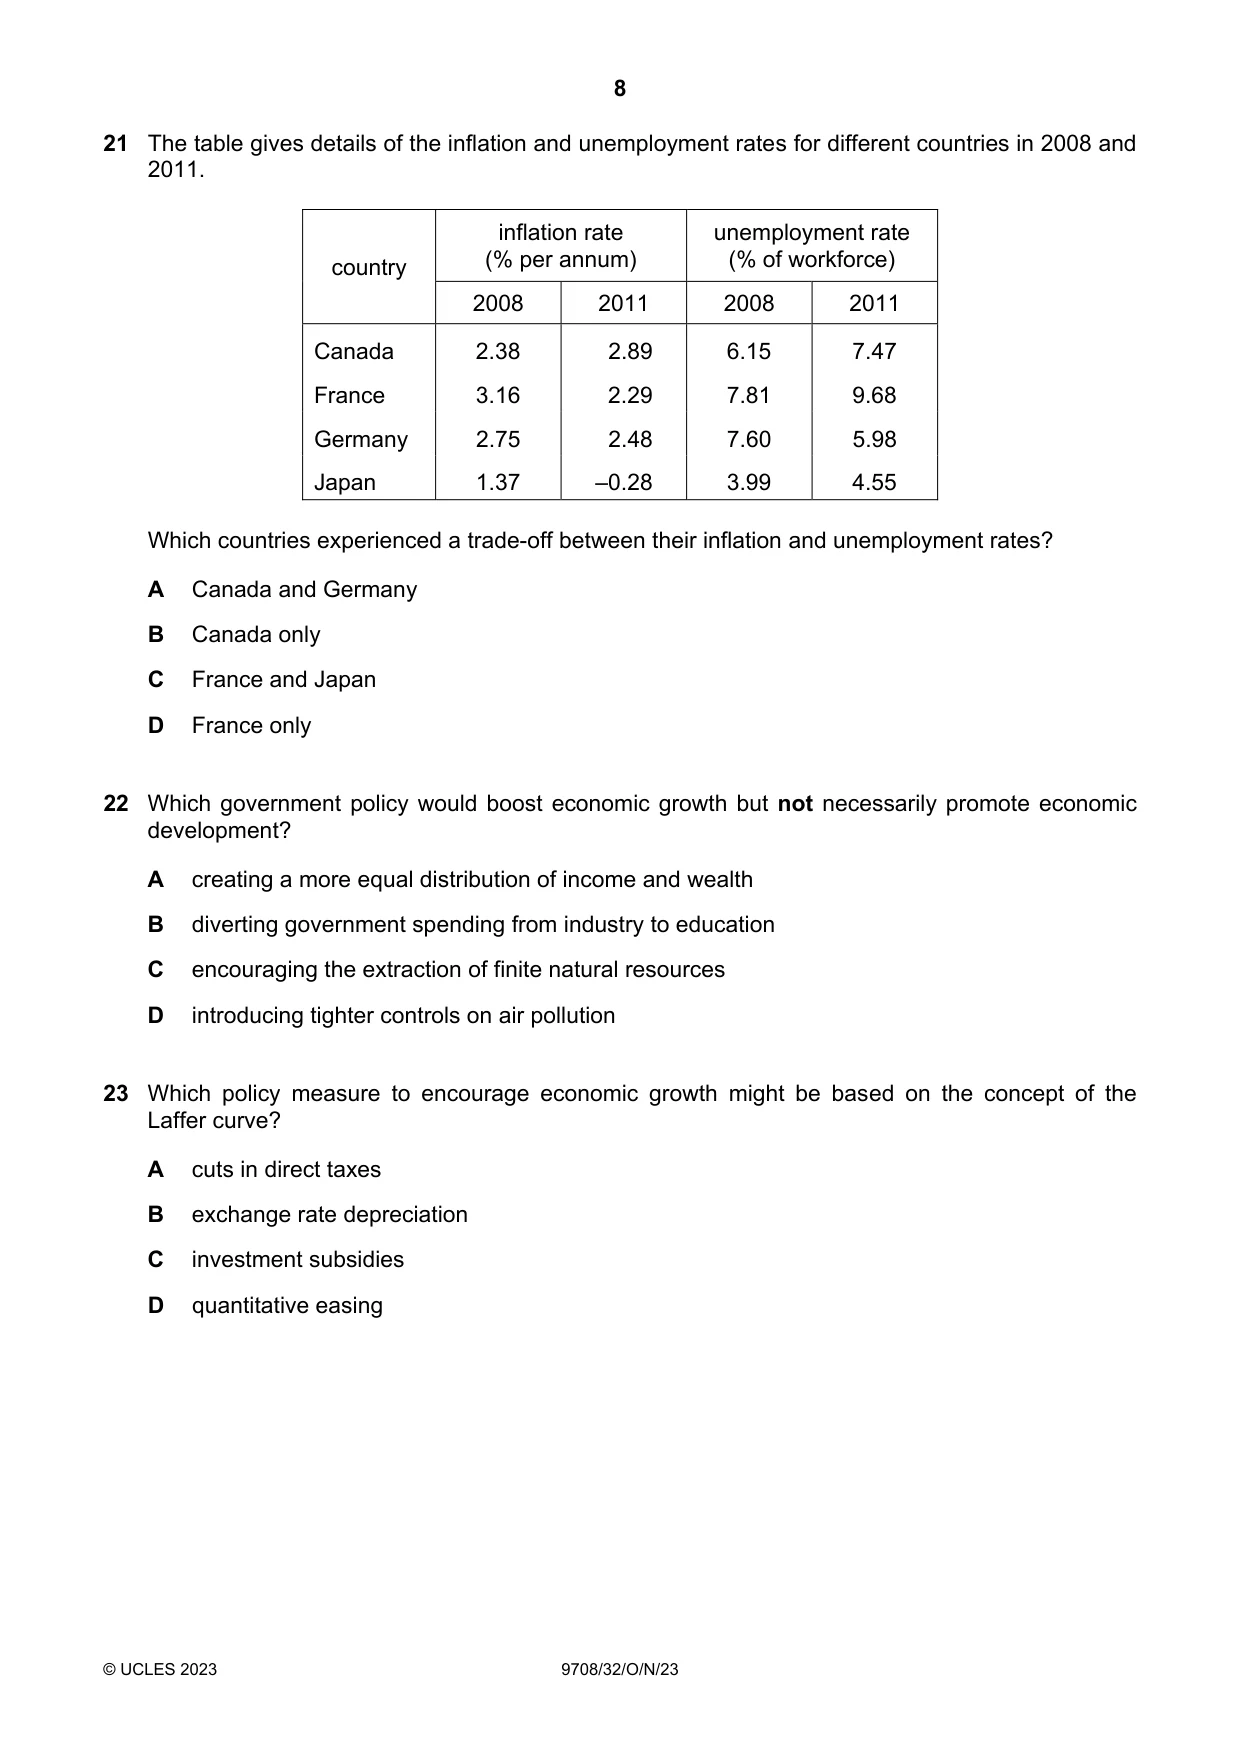
8 © UCLES 2023 9708/32/O/N/23 21 The table gives details of the inflation and unemployment rates for different countries in 2008 and 2011. country inflation rate (% per annum) unemployment rate (% of workforce) 2008 2011 2008 2011 Canada 2.38 2.89 6.15 7.47 France 3.16 2.29 7.81 9.68 Germany 2.75 2.48 7.60 5.98 Japan 1.37 –0.28 3.99 4.55 Which countries experienced a trade-off between their inflation and unemployment rates? A Canada and Germany B Canada only C France and Japan D France only 22 Which government policy would boost economic growth but not necessarily promote economic development? A creating a more equal distribution of income and wealth B diverting government spending from industry to education C encouraging the extraction of finite natural resources D introducing tighter controls on air pollution 23 Which policy measure to encourage economic growth might be based on the concept of the Laffer curve? A cuts in direct taxes B exchange rate depreciation C investment subsidies D quantitative easing
Question paper, page 9
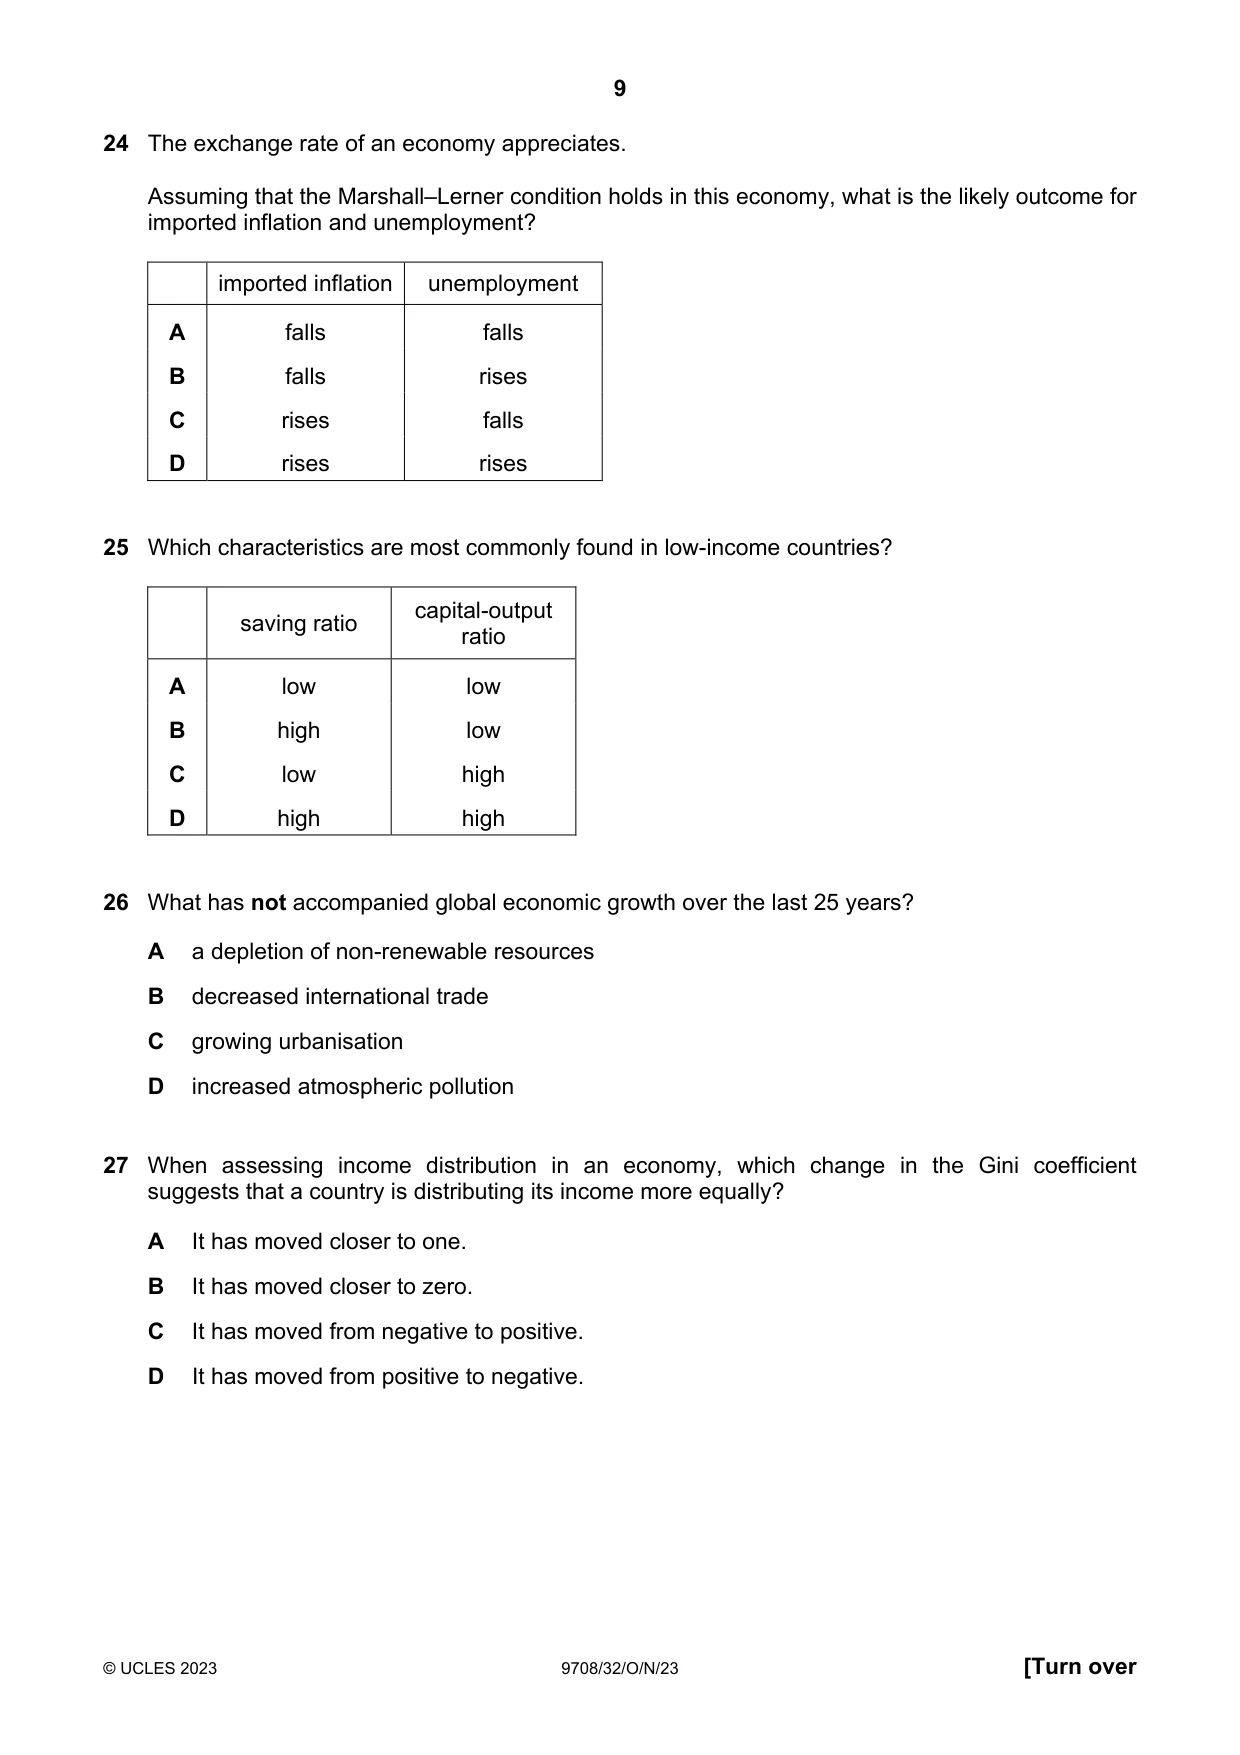
9 © UCLES 2023 9708/32/O/N/23 [Turn over 24 The exchange rate of an economy appreciates. Assuming that the Marshall–Lerner condition holds in this economy, what is the likely outcome for imported inflation and unemployment? imported inflation unemployment A falls falls B falls rises C rises falls D rises rises 25 Which characteristics are most commonly found in low-income countries? saving ratio capital-output ratio A low low B high low C low high D high high 26 What has not accompanied global economic growth over the last 25 years? A a depletion of non-renewable resources B decreased international trade C growing urbanisation D increased atmospheric pollution 27 When assessing income distribution in an economy, which change in the Gini coefficient suggests that a country is distributing its income more equally? A It has moved closer to one. B It has moved closer to zero. C It has moved from negative to positive. D It has moved from positive to negative.
Question paper, page 10
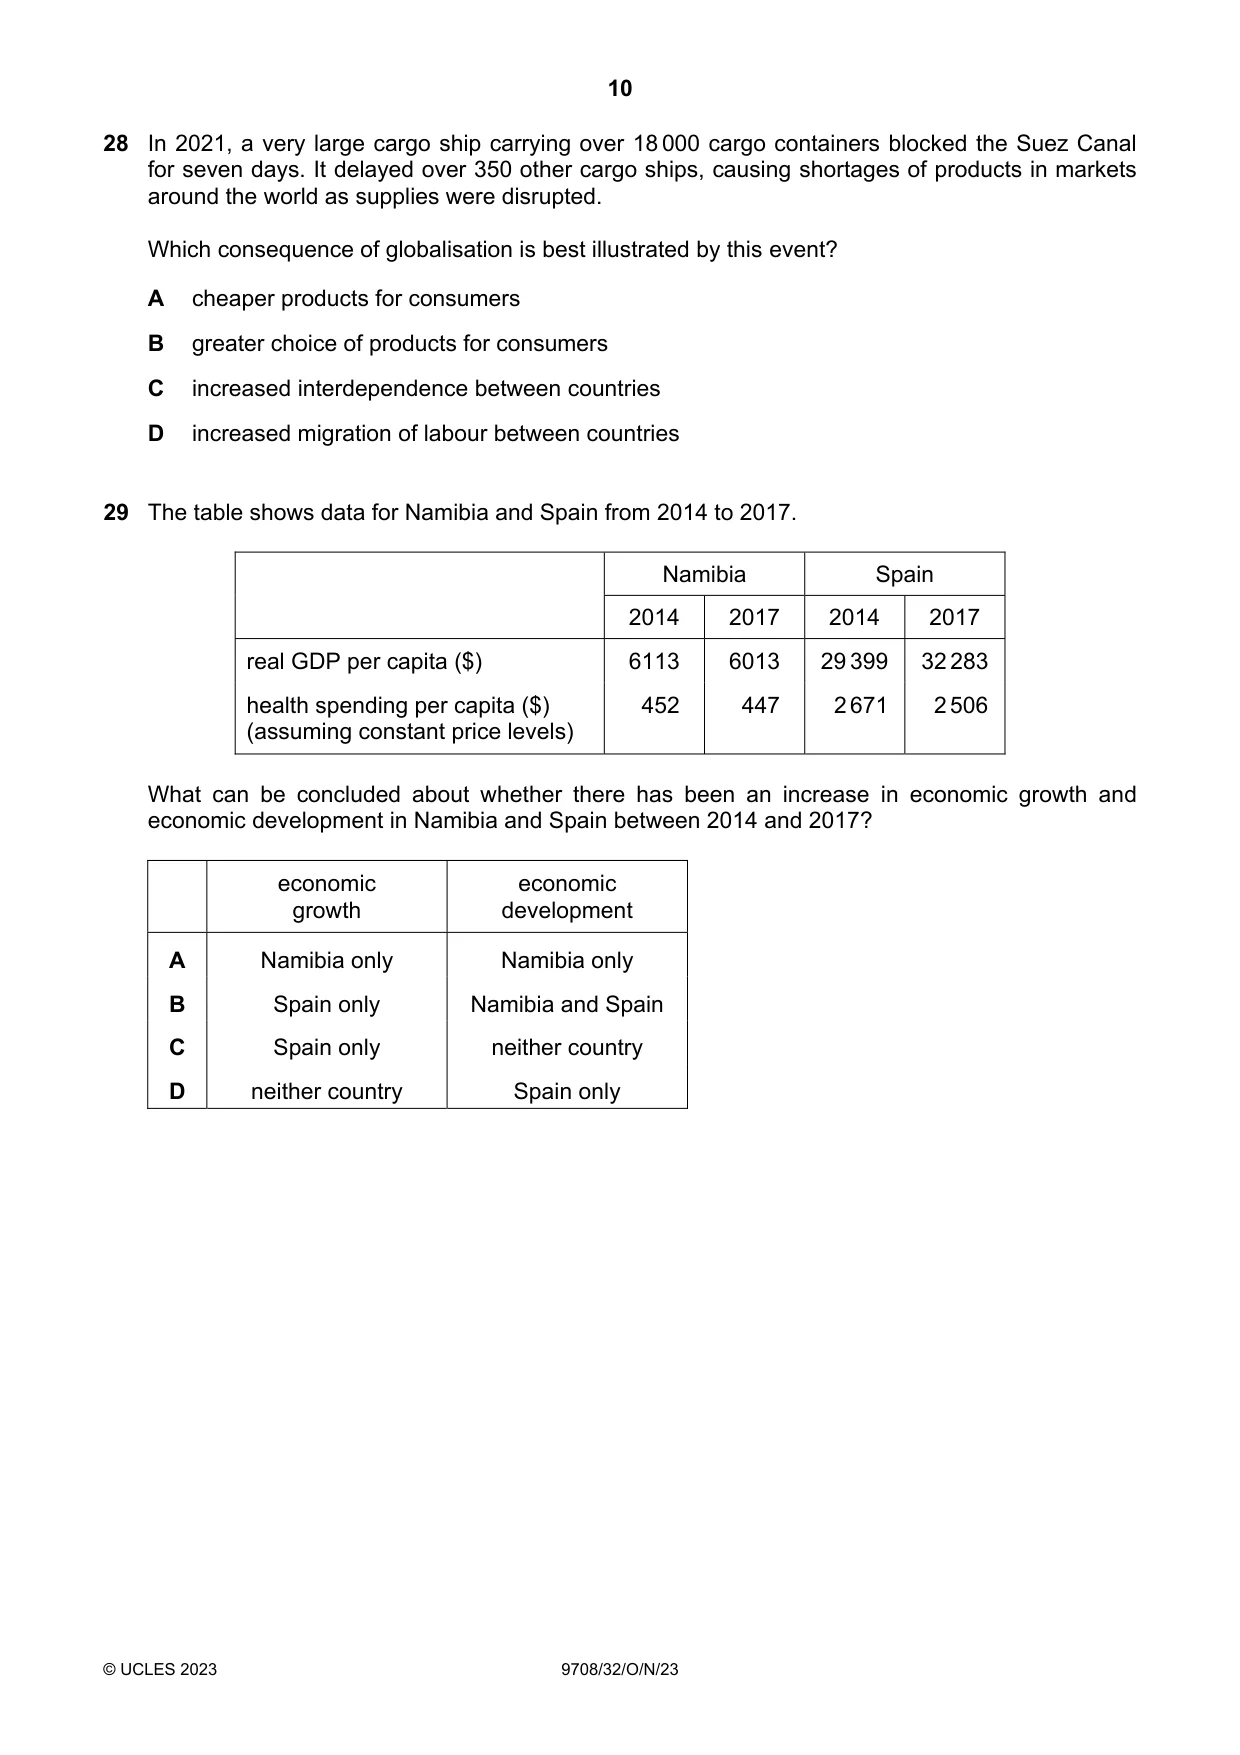
10 © UCLES 2023 9708/32/O/N/23 28 In 2021, a very large cargo ship carrying over 18 000 cargo containers blocked the Suez Canal for seven days. It delayed over 350 other cargo ships, causing shortages of products in markets around the world as supplies were disrupted. Which consequence of globalisation is best illustrated by this event? A cheaper products for consumers B greater choice of products for consumers C increased interdependence between countries D increased migration of labour between countries 29 The table shows data for Namibia and Spain from 2014 to 2017. Namibia Spain 2014 2017 2014 2017 real GDP per capita ($) 6113 6013 29 399 32 283 health spending per capita ($) (assuming constant price levels) 452 447 2 671 2 506 What can be concluded about whether there has been an increase in economic growth and economic development in Namibia and Spain between 2014 and 2017? economic growth economic development A Namibia only Namibia only B Spain only Namibia and Spain C Spain only neither country D neither country Spain only
Question paper, page 11
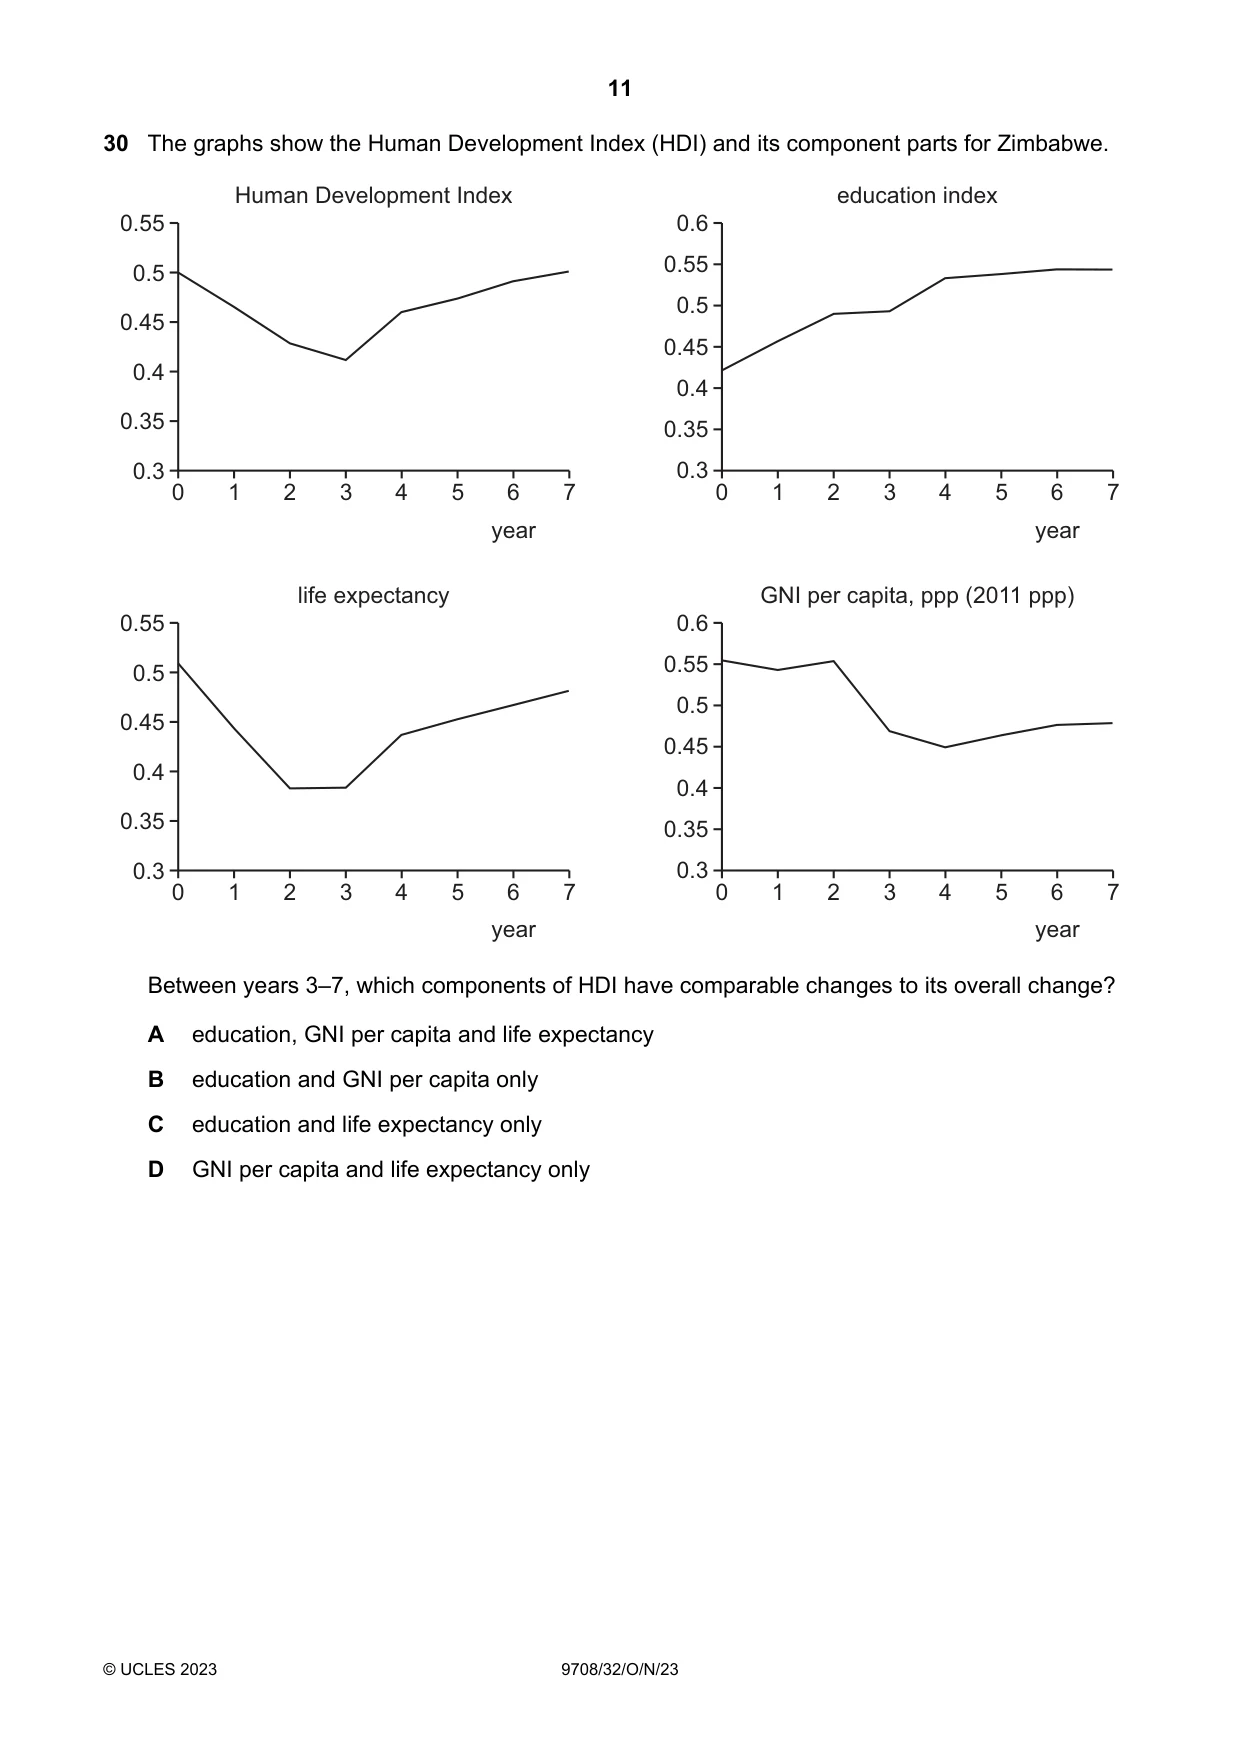
11 © UCLES 2023 9708/32/O/N/23 30 The graphs show the Human Development Index (HDI) and its component parts for Zimbabwe. 0.6 0.55 0.5 0.45 0.4 0.35 0.3 education index 0.55 0.5 0.45 0.4 0.35 0.3 0 2 4 6 1 3 5 7 Human Development Index 0.6 0.55 0.5 0.45 0.4 0.35 0.3 GNI per capita, ppp (2011 ppp) 0.55 0.5 0.45 0.4 0.35 0.3 life expectancy year 0 2 4 6 1 3 5 7 year 0 2 4 6 1 3 5 7 year 0 2 4 6 1 3 5 7 year Between years 3–7, which components of HDI have comparable changes to its overall change? A education, GNI per capita and life expectancy B education and GNI per capita only C education and life expectancy only D GNI per capita and life expectancy only
Question paper, page 12
12 Permission to reproduce items where third-party owned material protected by copyright is included has been sought and cleared where possible. Every reasonable effort has been made by the publisher (UCLES) to trace copyright holders, but if any items requiring clearance have unwittingly been included, the publisher will be pleased to make amends at the earliest possible opportunity. To avoid the issue of disclosure of answer-related information to candidates, all copyright acknowledgements are reproduced online in the Cambridge Assessment International Education Copyright Acknowledgements Booklet. This is produced for each series of examinations and is freely available to download at www.cambridgeinternational.org after the live examination series. Cambridge Assessment International Education is part of Cambridge Assessment. Cambridge Assessment is the brand name of the University of Cambridge Local Examinations Syndicate (UCLES), which is a department of the University of Cambridge. © UCLES 2023 9708/32/O/N/23 BLANK PAGE
Mark scheme, page 1
This document consists of 3 printed pages. © UCLES 2023 [Turn over Cambridge International AS & A Level ECONOMICS 9708/32 Paper 3 Multiple Choice October/November 2023 MARK SCHEME Maximum Mark: 30 Published This mark scheme is published as an aid to teachers and candidates, to indicate the requirements of the examination. Mark schemes should be read in conjunction with the question paper and the Principal Examiner Report for Teachers. Cambridge International will not enter into discussions about these mark schemes. Cambridge International is publishing the mark schemes for the October/November 2023 series for most Cambridge IGCSE, Cambridge International A and AS Level components, and some Cambridge O Level components.
Mark scheme, page 2
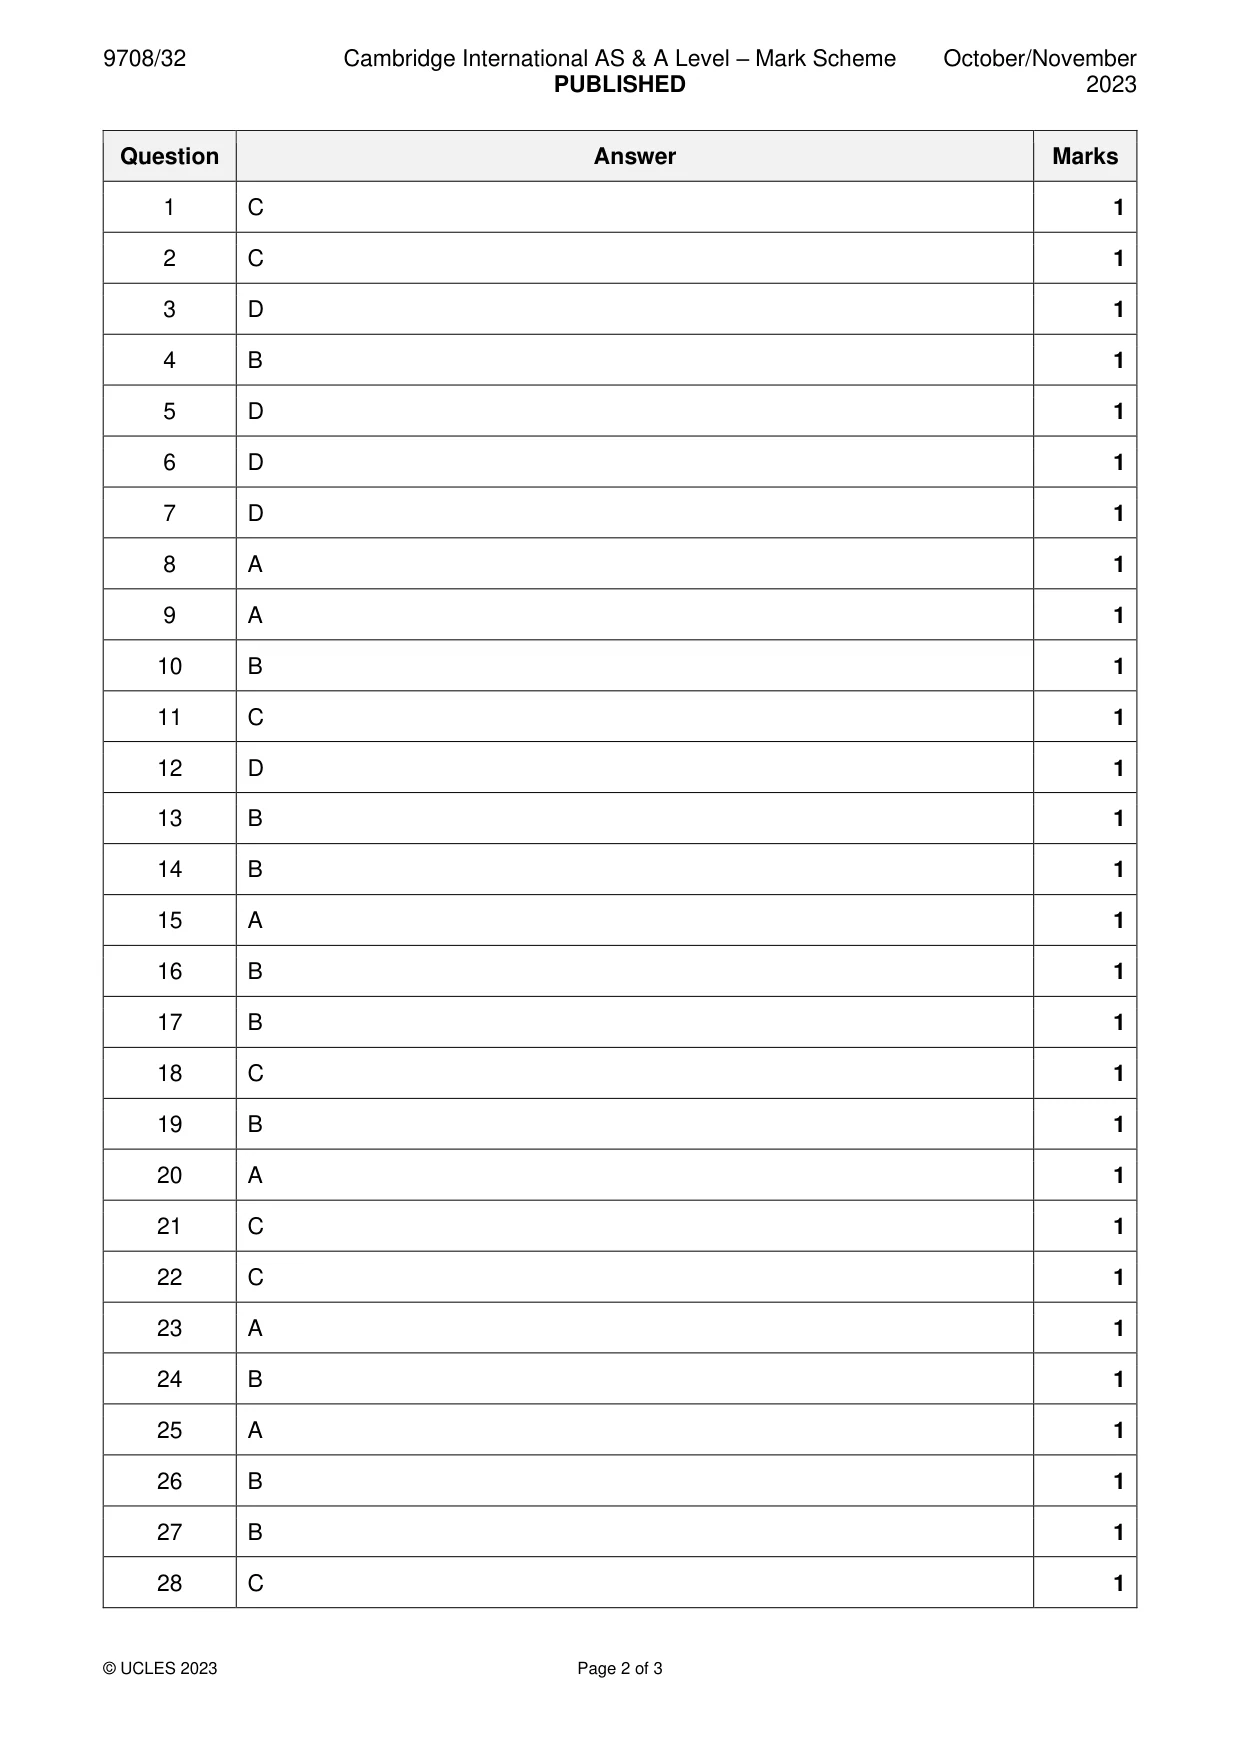
9708/32 Cambridge International AS & A Level – Mark Scheme PUBLISHED October/November 2023 © UCLES 2023 Page 2 of 3 Question Answer Marks 1 C 1 2 C 1 3 D 1 4 B 1 5 D 1 6 D 1 7 D 1 8 A 1 9 A 1 10 B 1 11 C 1 12 D 1 13 B 1 14 B 1 15 A 1 16 B 1 17 B 1 18 C 1 19 B 1 20 A 1 21 C 1 22 C 1 23 A 1 24 B 1 25 A 1 26 B 1 27 B 1 28 C 1
Mark scheme, page 3
9708/32 Cambridge International AS & A Level – Mark Scheme PUBLISHED October/November 2023 © UCLES 2023 Page 3 of 3 Question Answer Marks 29 C 1 30 C 1
What you needed in this session
Cambridge’s own grade thresholds for 2023 Oct/Nov, Paper 3 · Variant 2. A higher threshold means an easier paper — the bar moves with how the cohort did.