Cambridge A Level Economics 9708 — 2022 Feb/March Paper 3 · Variant 2
9708/32/F/M/22 · 30 marks · ≈34 min
The question paper and its mark scheme, free to read here and free to download. This is Cambridge’s own paper, exactly as it was sat.
Question paper12 pages

Mark scheme3 pages
Answers below. Sit the paper first if you are practising.

Paper as text
Question paper, page 1
This document has 12 pages. IB22 03_9708_32/2RP © UCLES 2022 [Turn over *4191877893* Cambridge International AS & A Level ECONOMICS 9708/32 Paper 3 Multiple Choice February/March 2022 1 hour 15 minutes You must answer on the multiple choice answer sheet. You will need: Multiple choice answer sheet Soft clean eraser Soft pencil (type B or HB is recommended) INSTRUCTIONS There are thirty questions on this paper. Answer all questions. For each question there are four possible answers A, B, C and D. Choose the one you consider correct and record your choice in soft pencil on the multiple choice answer sheet. Follow the instructions on the multiple choice answer sheet. Write in soft pencil. Write your name, centre number and candidate number on the multiple choice answer sheet in the spaces provided unless this has been done for you. Do not use correction fluid. Do not write on any bar codes. You may use a calculator. INFORMATION The total mark for this paper is 30. Each correct answer will score one mark. Any rough working should be done on this question paper.
Question paper, page 2
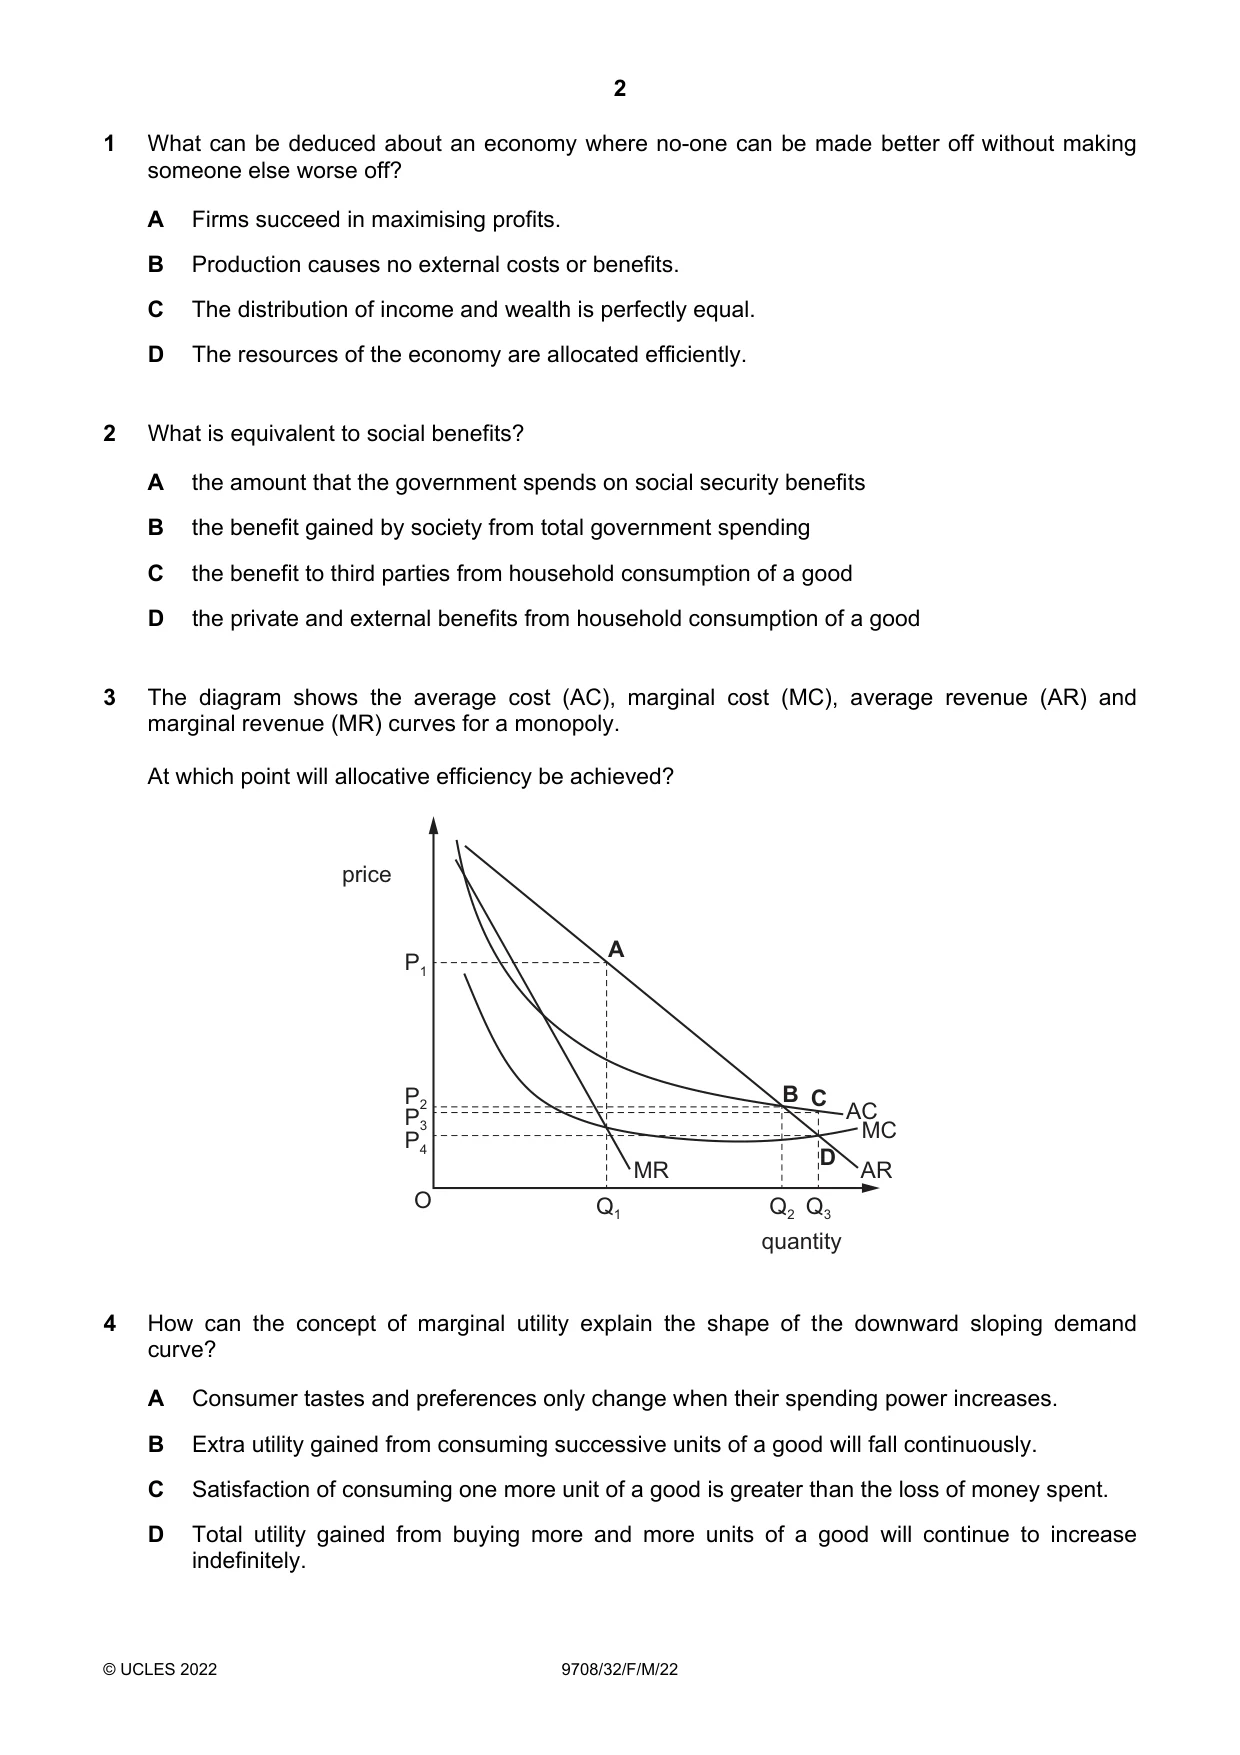
2 © UCLES 2022 9708/32/F/M/22 1 What can be deduced about an economy where no-one can be made better off without making someone else worse off? A Firms succeed in maximising profits. B Production causes no external costs or benefits. C The distribution of income and wealth is perfectly equal. D The resources of the economy are allocated efficiently. 2 What is equivalent to social benefits? A the amount that the government spends on social security benefits B the benefit gained by society from total government spending C the benefit to third parties from household consumption of a good D the private and external benefits from household consumption of a good 3 The diagram shows the average cost (AC), marginal cost (MC), average revenue (AR) and marginal revenue (MR) curves for a monopoly. At which point will allocative efficiency be achieved? MR AR MC AC P1 P4 Q1 Q2 Q3 P3 P2 price O quantity A B C D 4 How can the concept of marginal utility explain the shape of the downward sloping demand curve? A Consumer tastes and preferences only change when their spending power increases. B Extra utility gained from consuming successive units of a good will fall continuously. C Satisfaction of consuming one more unit of a good is greater than the loss of money spent. D Total utility gained from buying more and more units of a good will continue to increase indefinitely.
Question paper, page 3
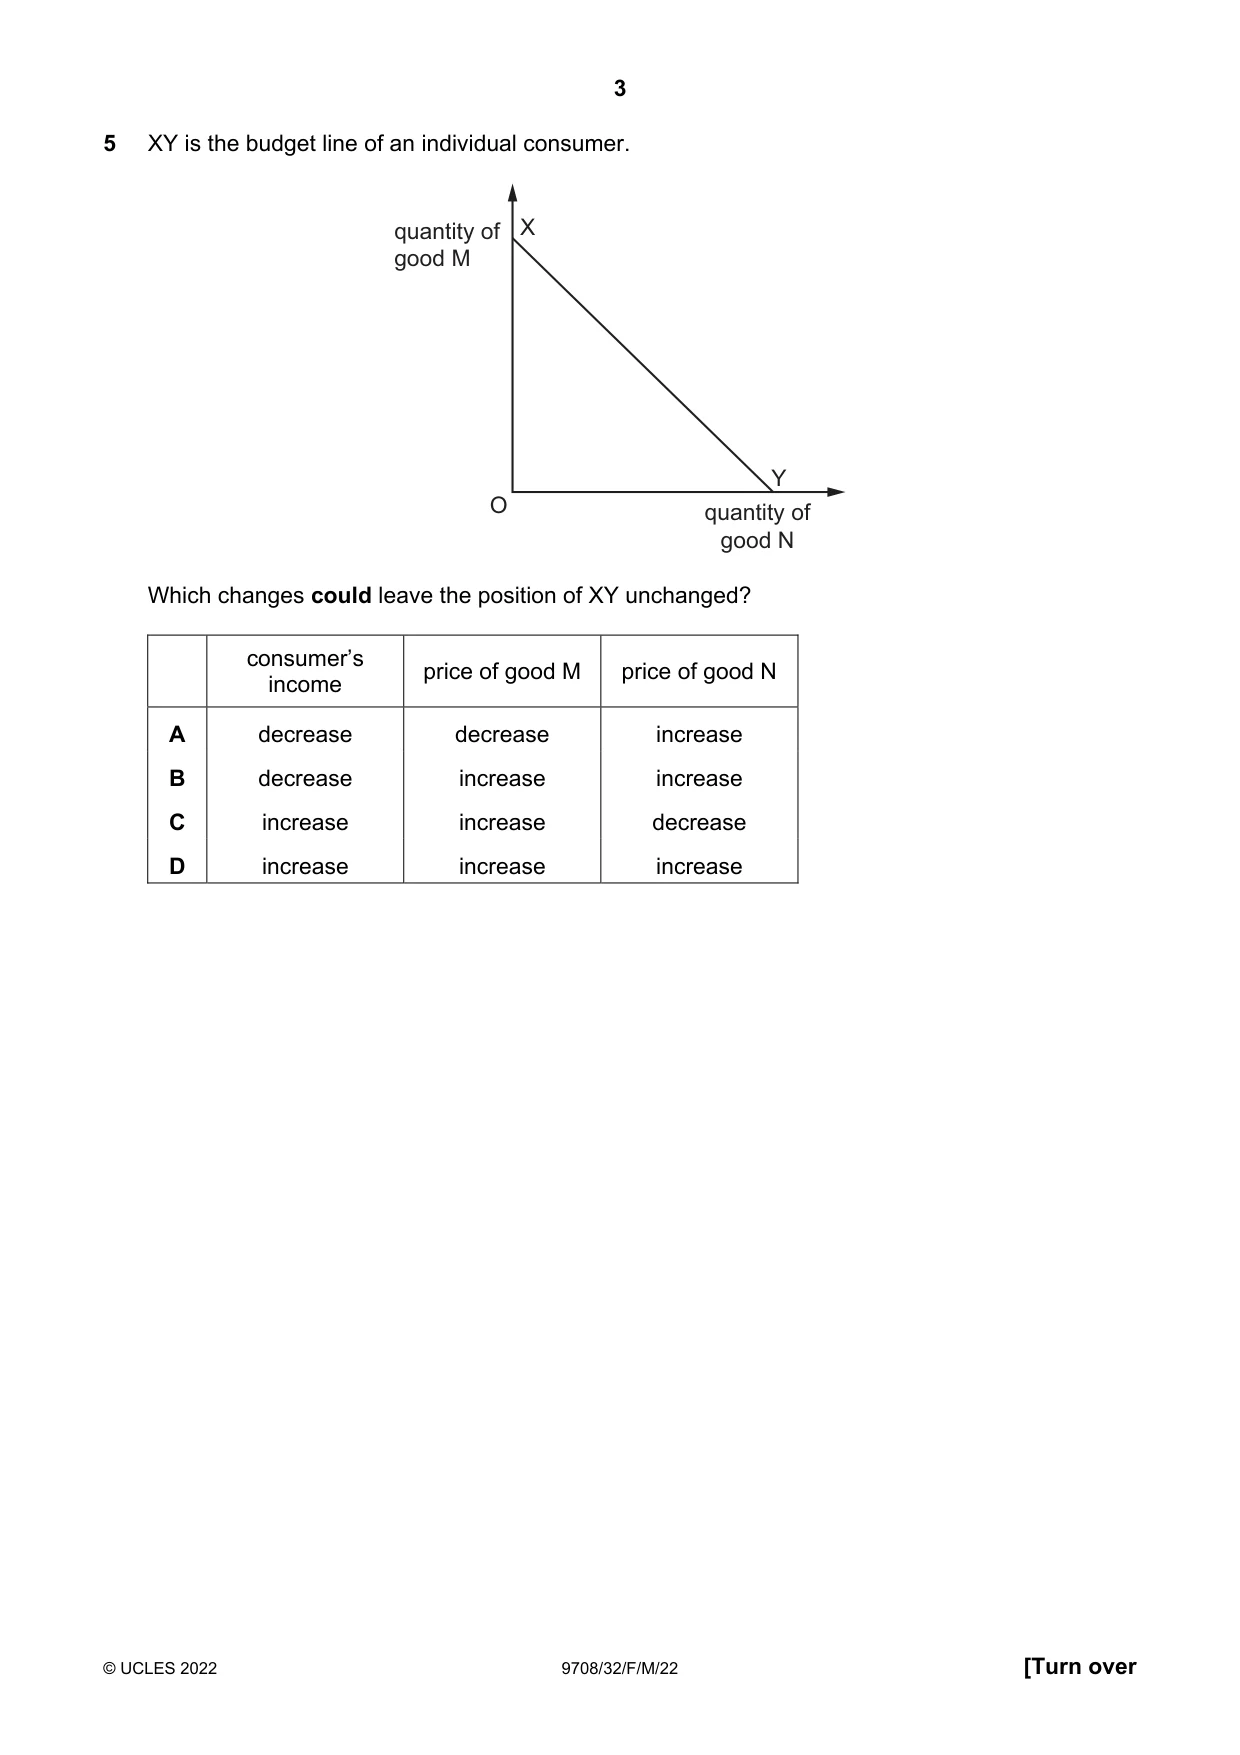
3 © UCLES 2022 9708/32/F/M/22 [Turn over 5 XY is the budget line of an individual consumer. O quantity of good M quantity of good N X Y Which changes could leave the position of XY unchanged? consumer’s income price of good M price of good N A decrease decrease increase B decrease increase increase C increase increase decrease D increase increase increase
Question paper, page 4
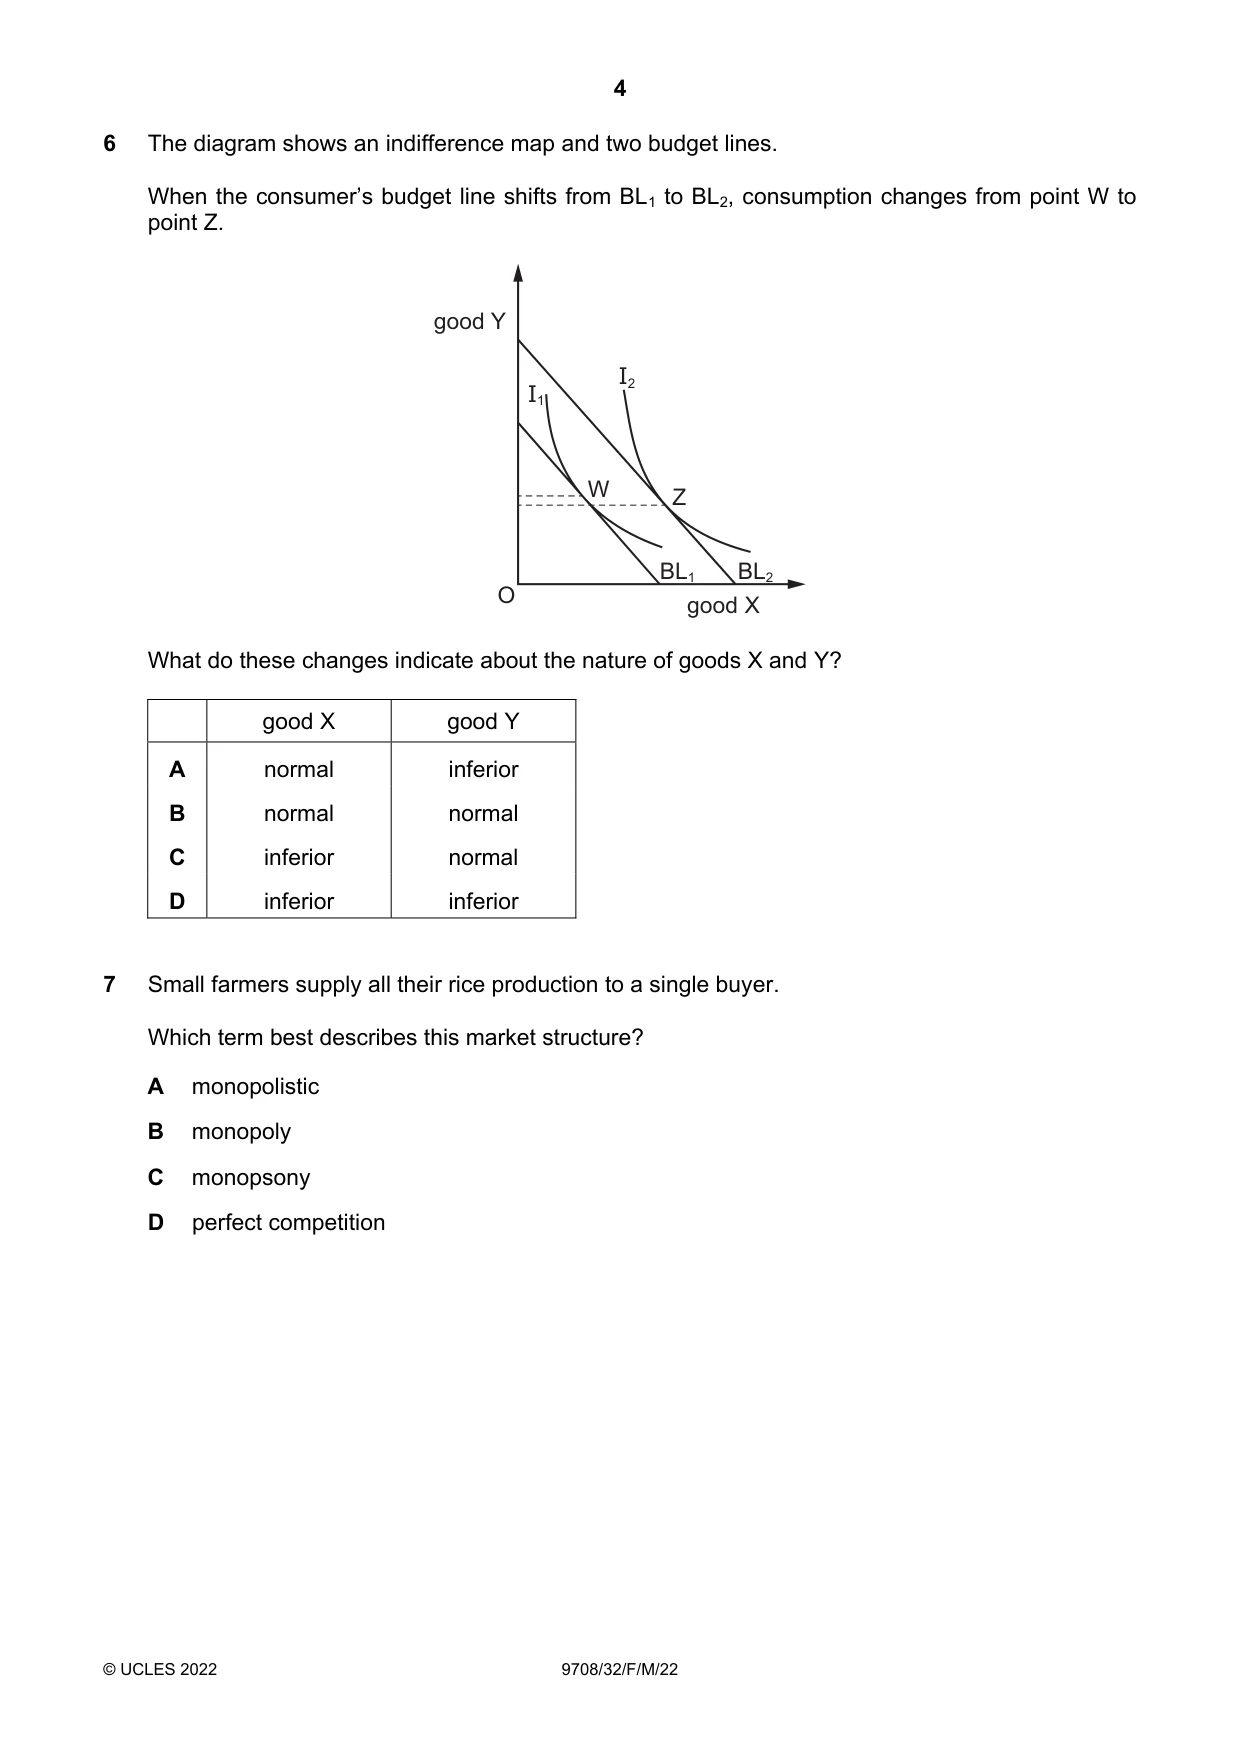
4 © UCLES 2022 9708/32/F/M/22 6 The diagram shows an indifference map and two budget lines. When the consumer’s budget line shifts from BL1 to BL2, consumption changes from point W to point Z. good Y O good X I1 I2 W Z BL1 BL2 What do these changes indicate about the nature of goods X and Y? good X good Y A normal inferior B normal normal C inferior normal D inferior inferior 7 Small farmers supply all their rice production to a single buyer. Which term best describes this market structure? A monopolistic B monopoly C monopsony D perfect competition
Question paper, page 5
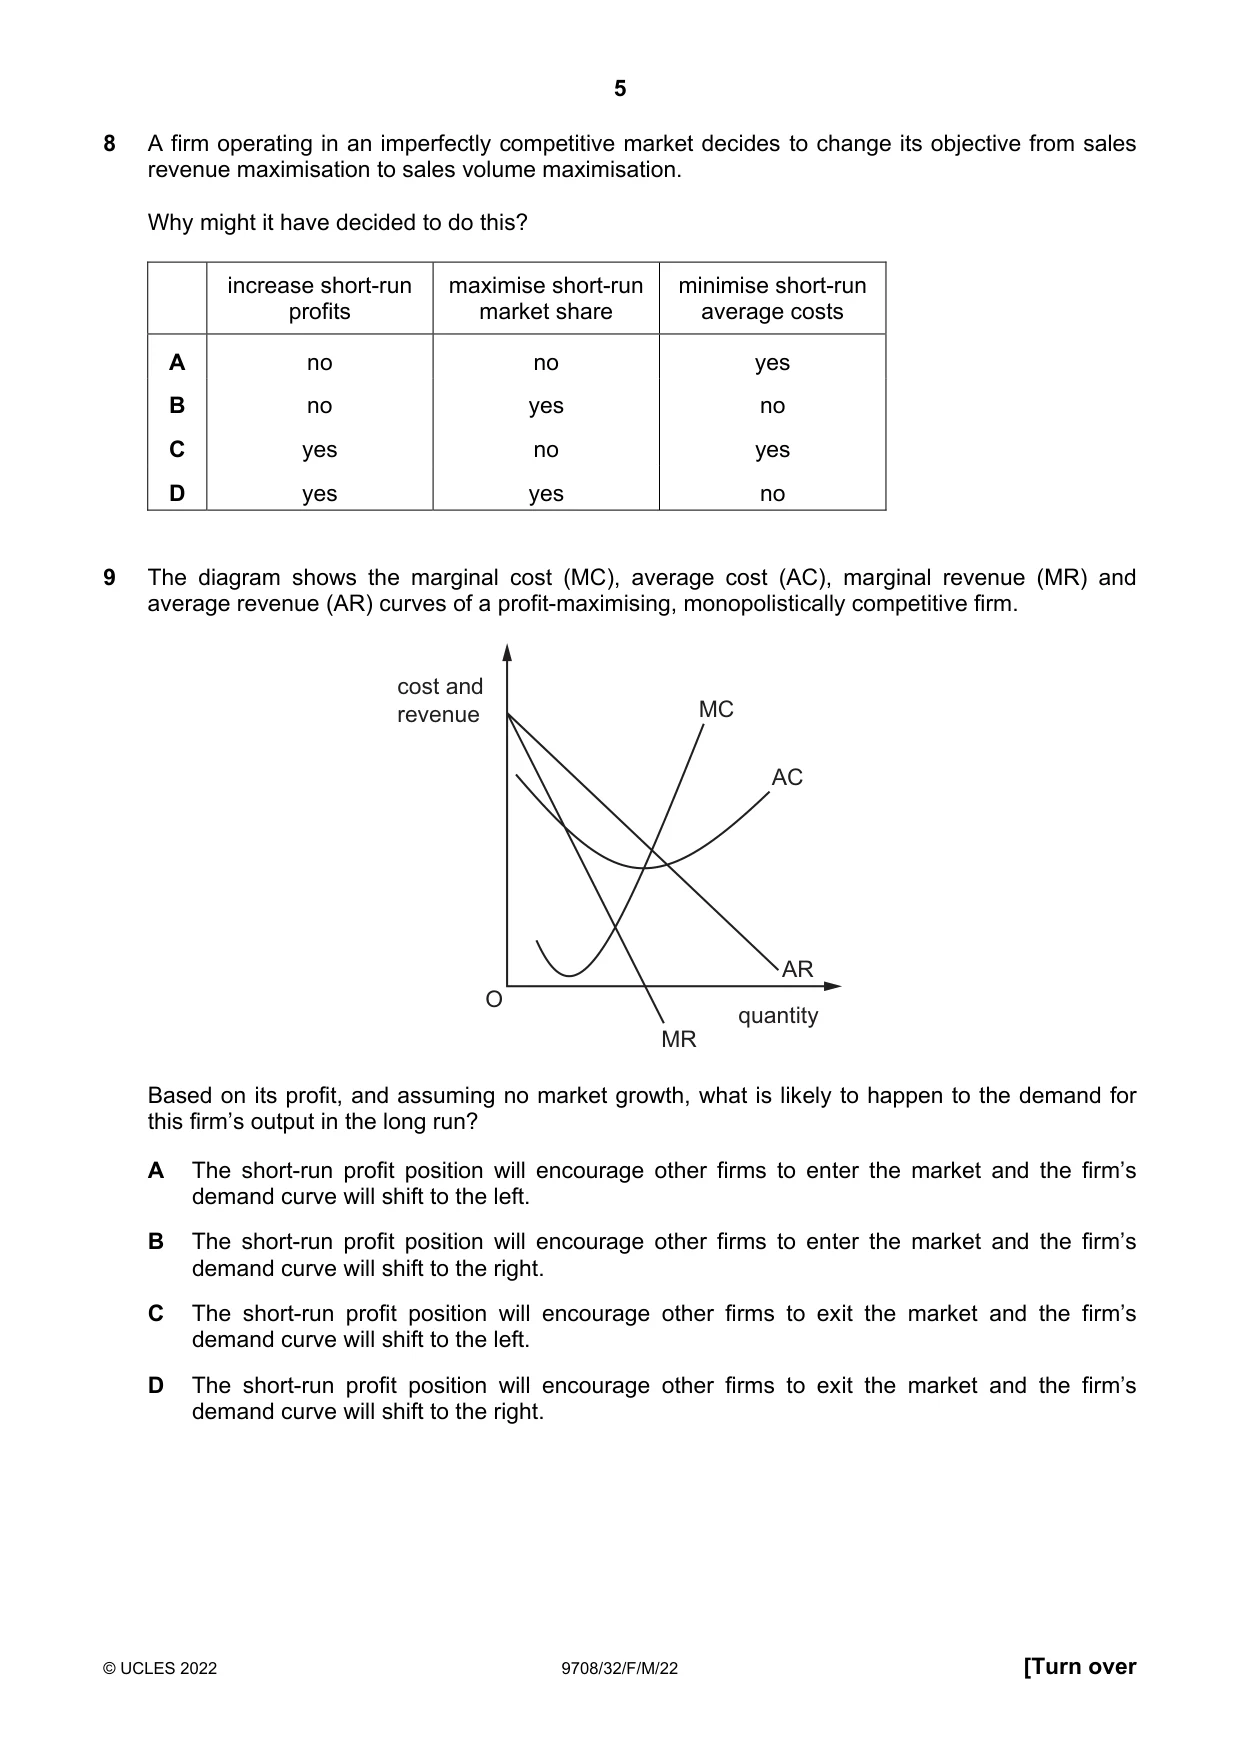
5 © UCLES 2022 9708/32/F/M/22 [Turn over 8 A firm operating in an imperfectly competitive market decides to change its objective from sales revenue maximisation to sales volume maximisation. Why might it have decided to do this? increase short-run profits maximise short-run market share minimise short-run average costs A no no yes B no yes no C yes no yes D yes yes no 9 The diagram shows the marginal cost (MC), average cost (AC), marginal revenue (MR) and average revenue (AR) curves of a profit-maximising, monopolistically competitive firm. O cost and revenue quantity MR AR AC MC Based on its profit, and assuming no market growth, what is likely to happen to the demand for this firm’s output in the long run? A The short-run profit position will encourage other firms to enter the market and the firm’s demand curve will shift to the left. B The short-run profit position will encourage other firms to enter the market and the firm’s demand curve will shift to the right. C The short-run profit position will encourage other firms to exit the market and the firm’s demand curve will shift to the left. D The short-run profit position will encourage other firms to exit the market and the firm’s demand curve will shift to the right.
Question paper, page 6
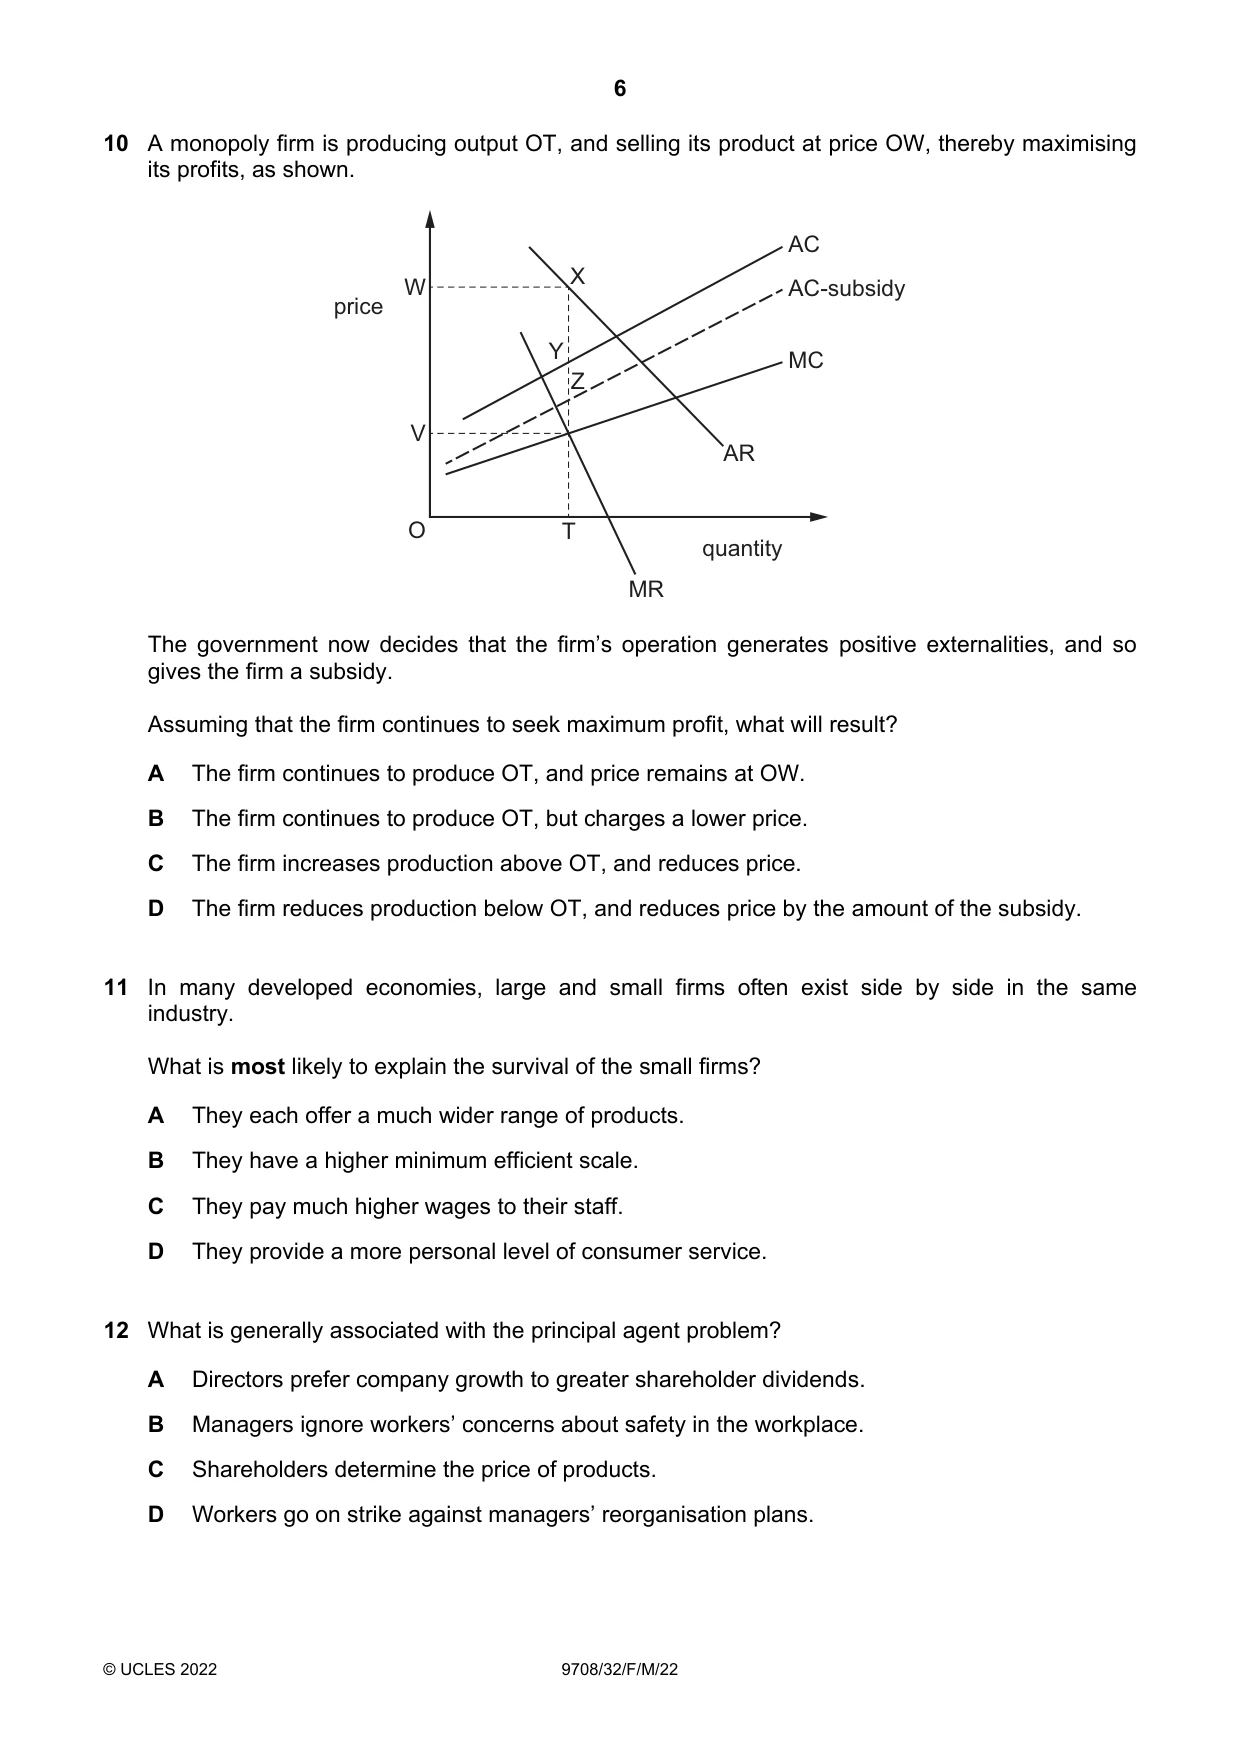
6 © UCLES 2022 9708/32/F/M/22 10 A monopoly firm is producing output OT, and selling its product at price OW, thereby maximising its profits, as shown. O price quantity AC AC-subsidy AR MC MR W V T Y Z X The government now decides that the firm’s operation generates positive externalities, and so gives the firm a subsidy. Assuming that the firm continues to seek maximum profit, what will result? A The firm continues to produce OT, and price remains at OW. B The firm continues to produce OT, but charges a lower price. C The firm increases production above OT, and reduces price. D The firm reduces production below OT, and reduces price by the amount of the subsidy. 11 In many developed economies, large and small firms often exist side by side in the same industry. What is most likely to explain the survival of the small firms? A They each offer a much wider range of products. B They have a higher minimum efficient scale. C They pay much higher wages to their staff. D They provide a more personal level of consumer service. 12 What is generally associated with the principal agent problem? A Directors prefer company growth to greater shareholder dividends. B Managers ignore workers’ concerns about safety in the workplace. C Shareholders determine the price of products. D Workers go on strike against managers’ reorganisation plans.
Question paper, page 7
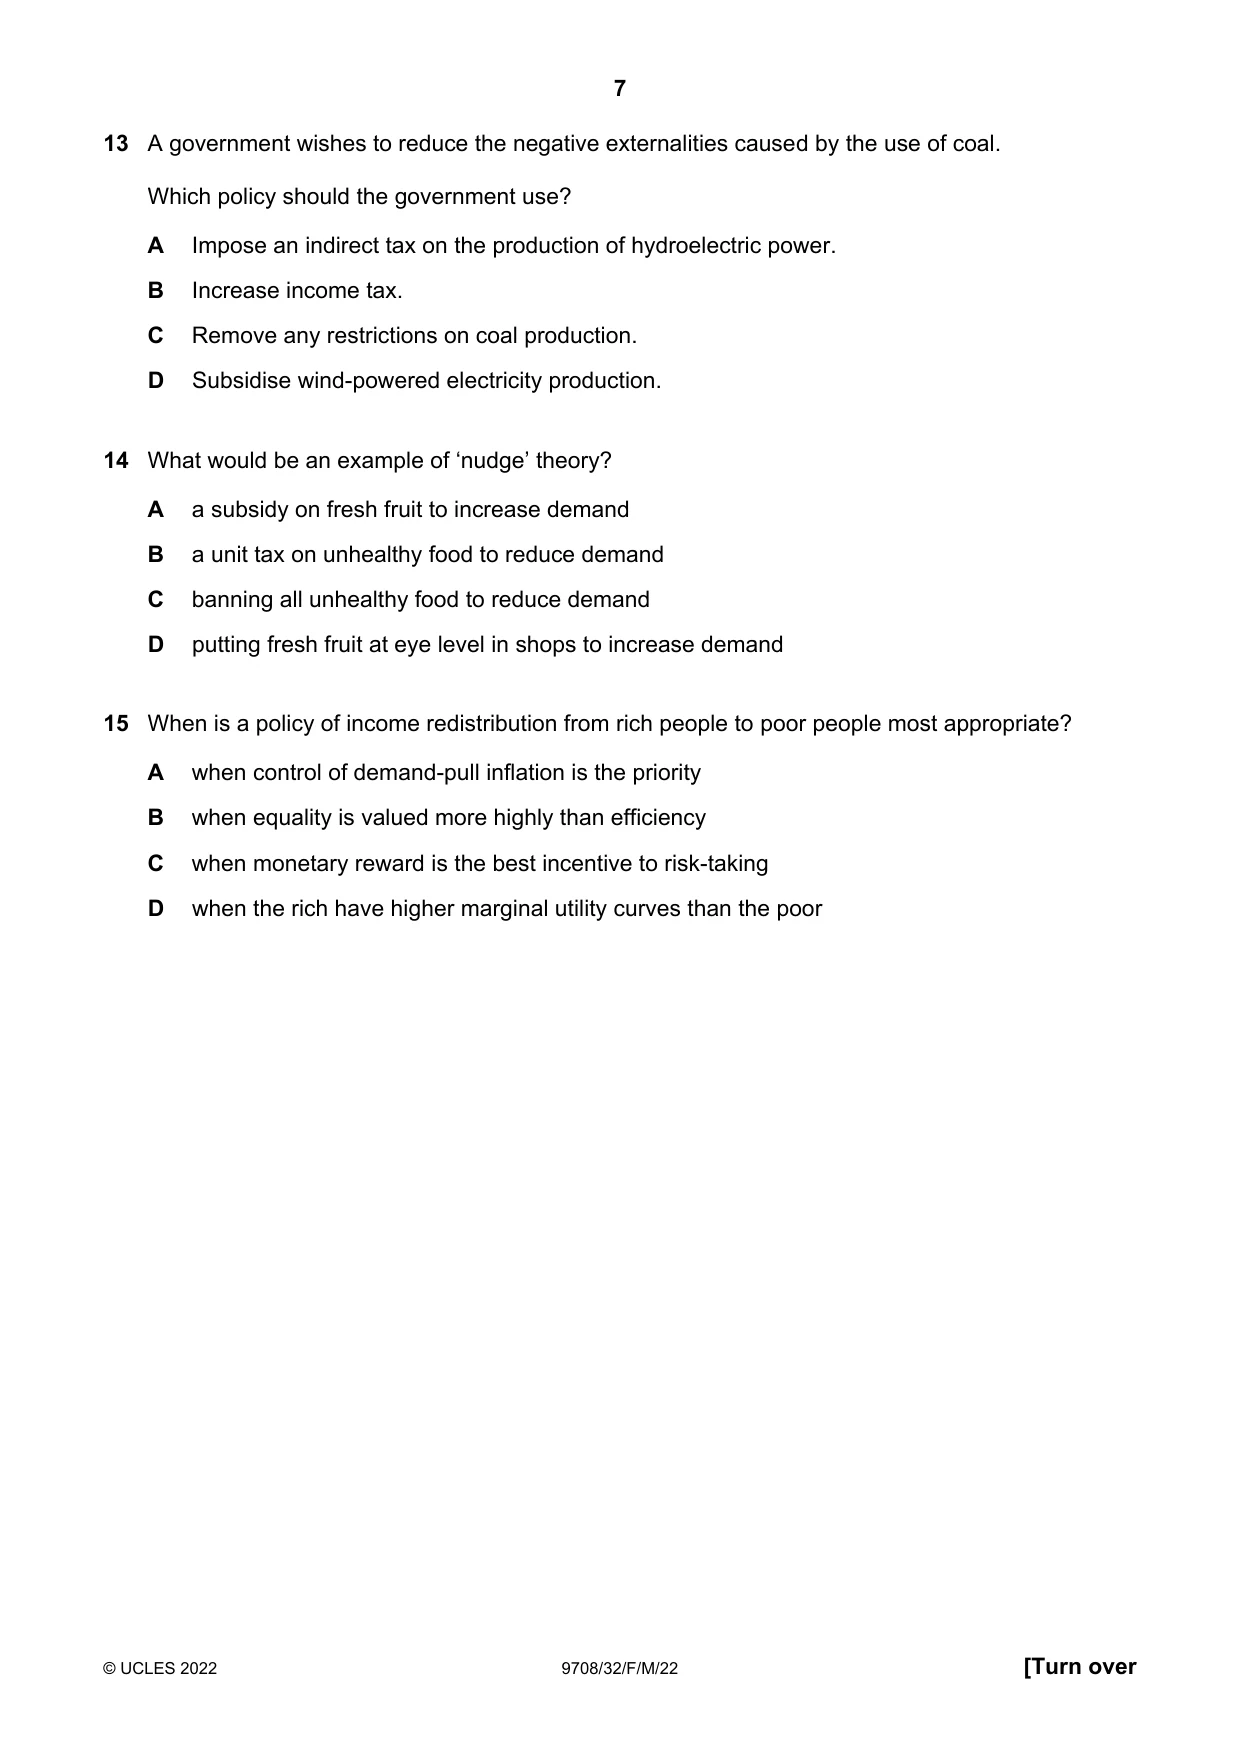
7 © UCLES 2022 9708/32/F/M/22 [Turn over 13 A government wishes to reduce the negative externalities caused by the use of coal. Which policy should the government use? A Impose an indirect tax on the production of hydroelectric power. B Increase income tax. C Remove any restrictions on coal production. D Subsidise wind-powered electricity production. 14 What would be an example of ‘nudge’ theory? A a subsidy on fresh fruit to increase demand B a unit tax on unhealthy food to reduce demand C banning all unhealthy food to reduce demand D putting fresh fruit at eye level in shops to increase demand 15 When is a policy of income redistribution from rich people to poor people most appropriate? A when control of demand-pull inflation is the priority B when equality is valued more highly than efficiency C when monetary reward is the best incentive to risk-taking D when the rich have higher marginal utility curves than the poor
Question paper, page 8
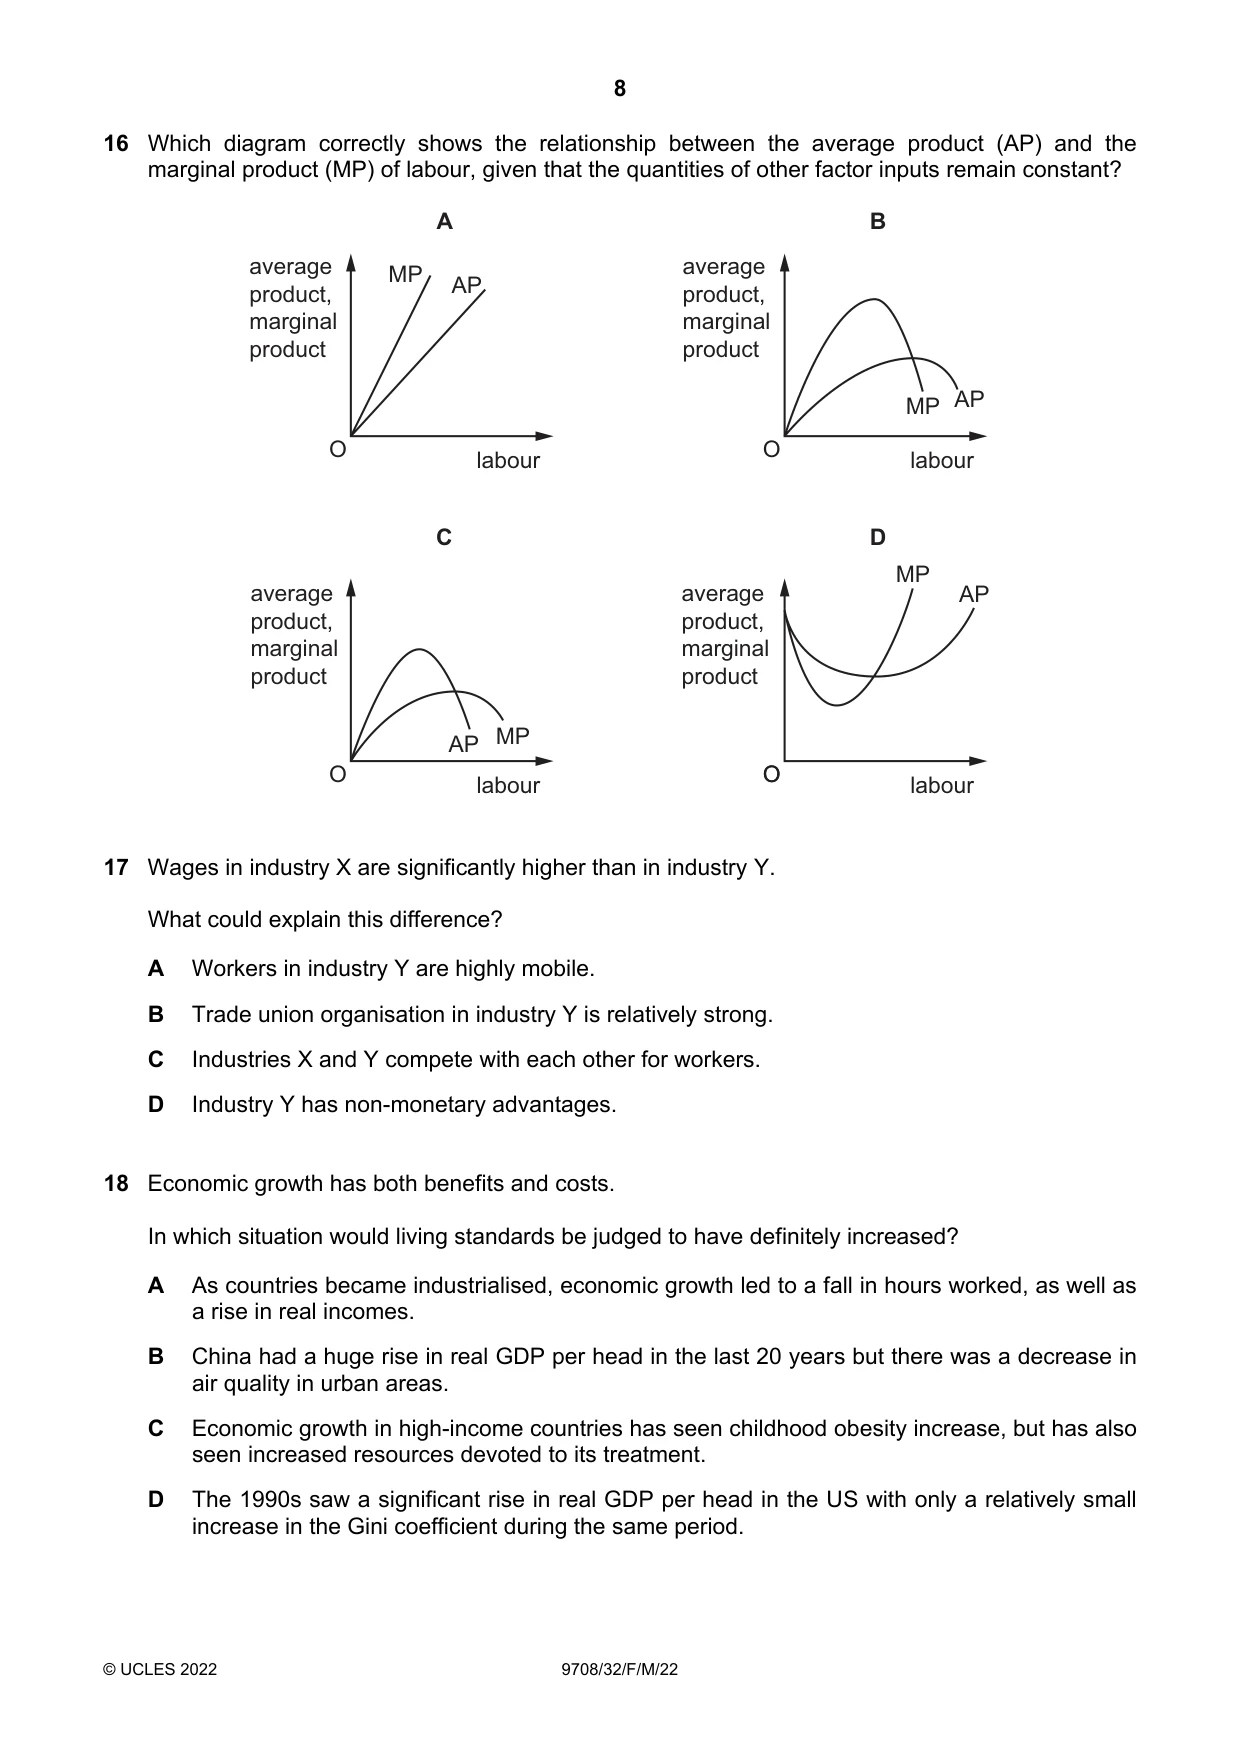
8 © UCLES 2022 9708/32/F/M/22 16 Which diagram correctly shows the relationship between the average product (AP) and the marginal product (MP) of labour, given that the quantities of other factor inputs remain constant? O O labour MP AP B O labour MP AP D O labour MP AP C average product, marginal product O labour MP AP A average product, marginal product average product, marginal product average product, marginal product 17 Wages in industry X are significantly higher than in industry Y. What could explain this difference? A Workers in industry Y are highly mobile. B Trade union organisation in industry Y is relatively strong. C Industries X and Y compete with each other for workers. D Industry Y has non-monetary advantages. 18 Economic growth has both benefits and costs. In which situation would living standards be judged to have definitely increased? A As countries became industrialised, economic growth led to a fall in hours worked, as well as a rise in real incomes. B China had a huge rise in real GDP per head in the last 20 years but there was a decrease in air quality in urban areas. C Economic growth in high-income countries has seen childhood obesity increase, but has also seen increased resources devoted to its treatment. D The 1990s saw a significant rise in real GDP per head in the US with only a relatively small increase in the Gini coefficient during the same period.
Question paper, page 9
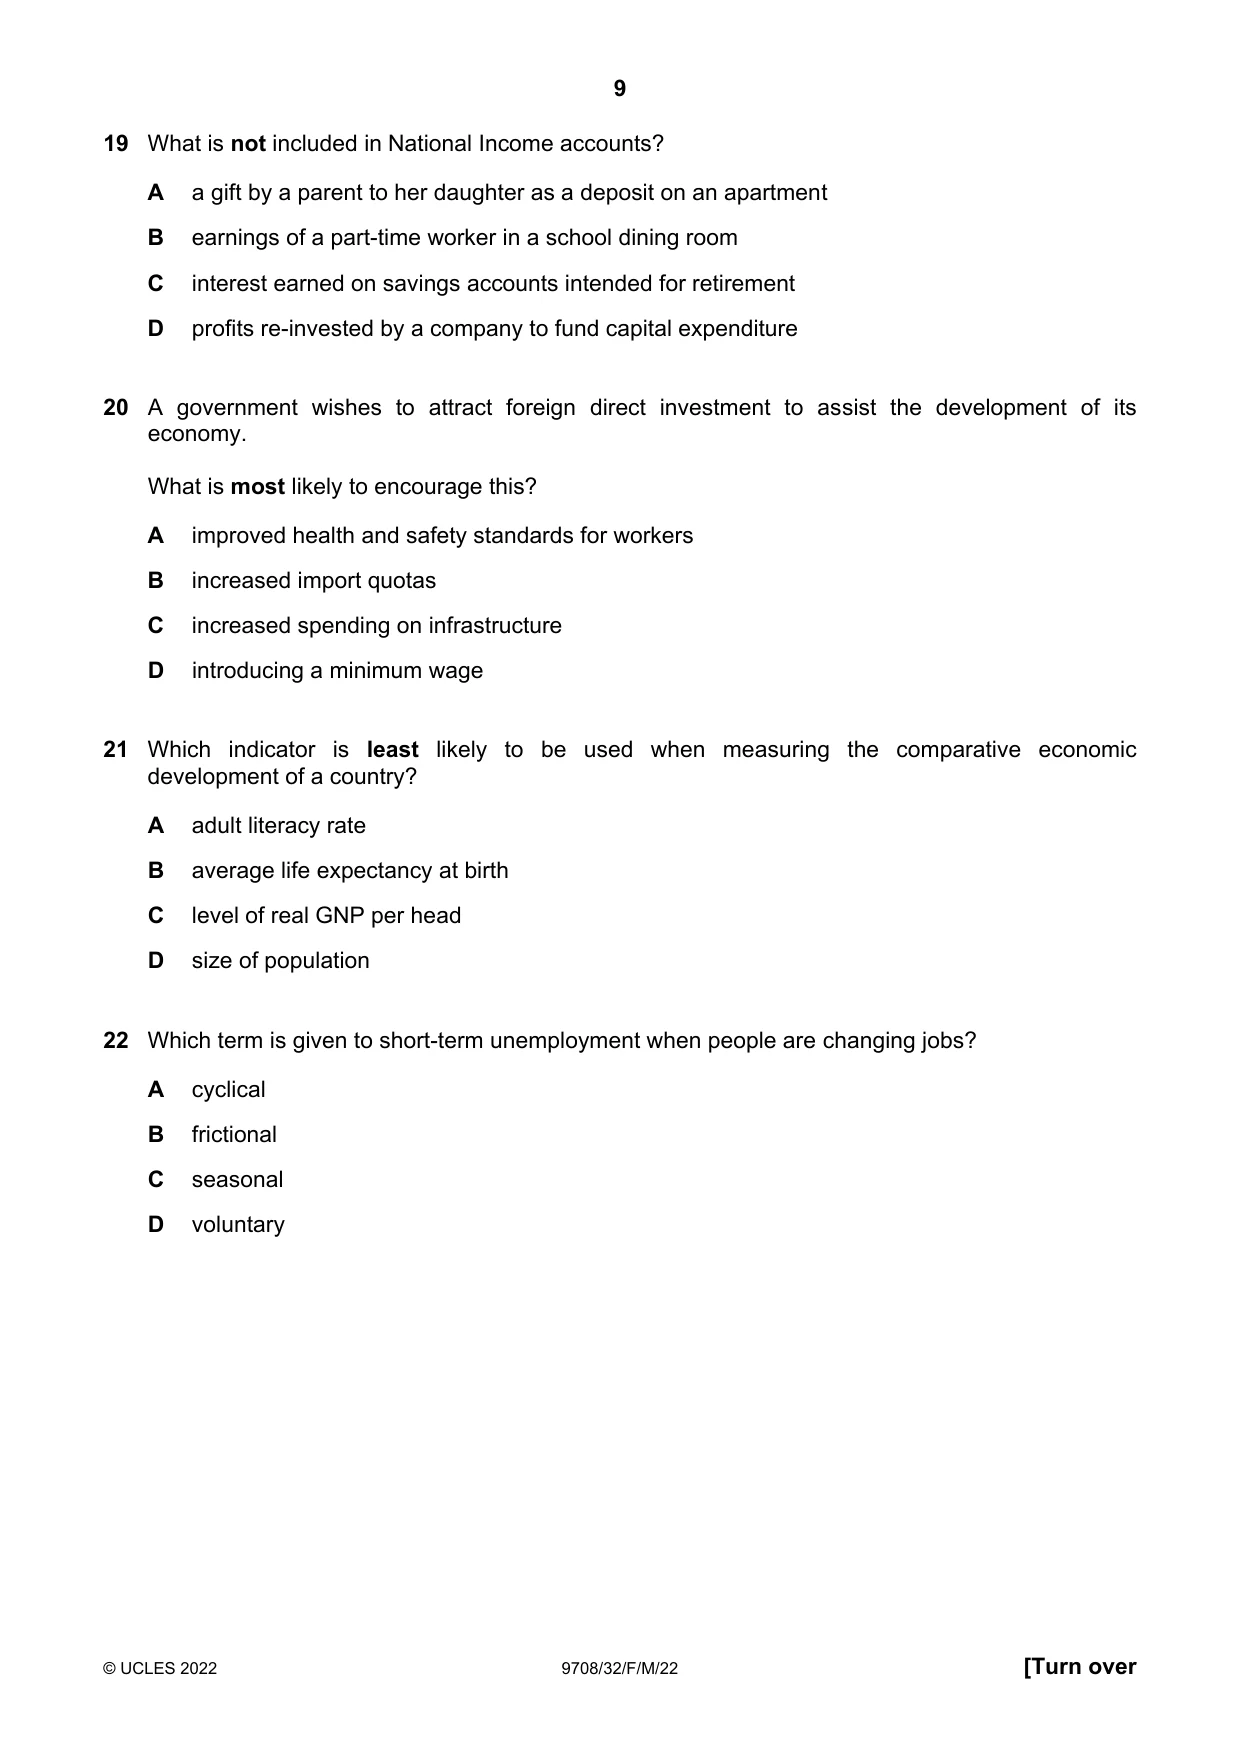
9 © UCLES 2022 9708/32/F/M/22 [Turn over 19 What is not included in National Income accounts? A a gift by a parent to her daughter as a deposit on an apartment B earnings of a part-time worker in a school dining room C interest earned on savings accounts intended for retirement D profits re-invested by a company to fund capital expenditure 20 A government wishes to attract foreign direct investment to assist the development of its economy. What is most likely to encourage this? A improved health and safety standards for workers B increased import quotas C increased spending on infrastructure D introducing a minimum wage 21 Which indicator is least likely to be used when measuring the comparative economic development of a country? A adult literacy rate B average life expectancy at birth C level of real GNP per head D size of population 22 Which term is given to short-term unemployment when people are changing jobs? A cyclical B frictional C seasonal D voluntary
Question paper, page 10
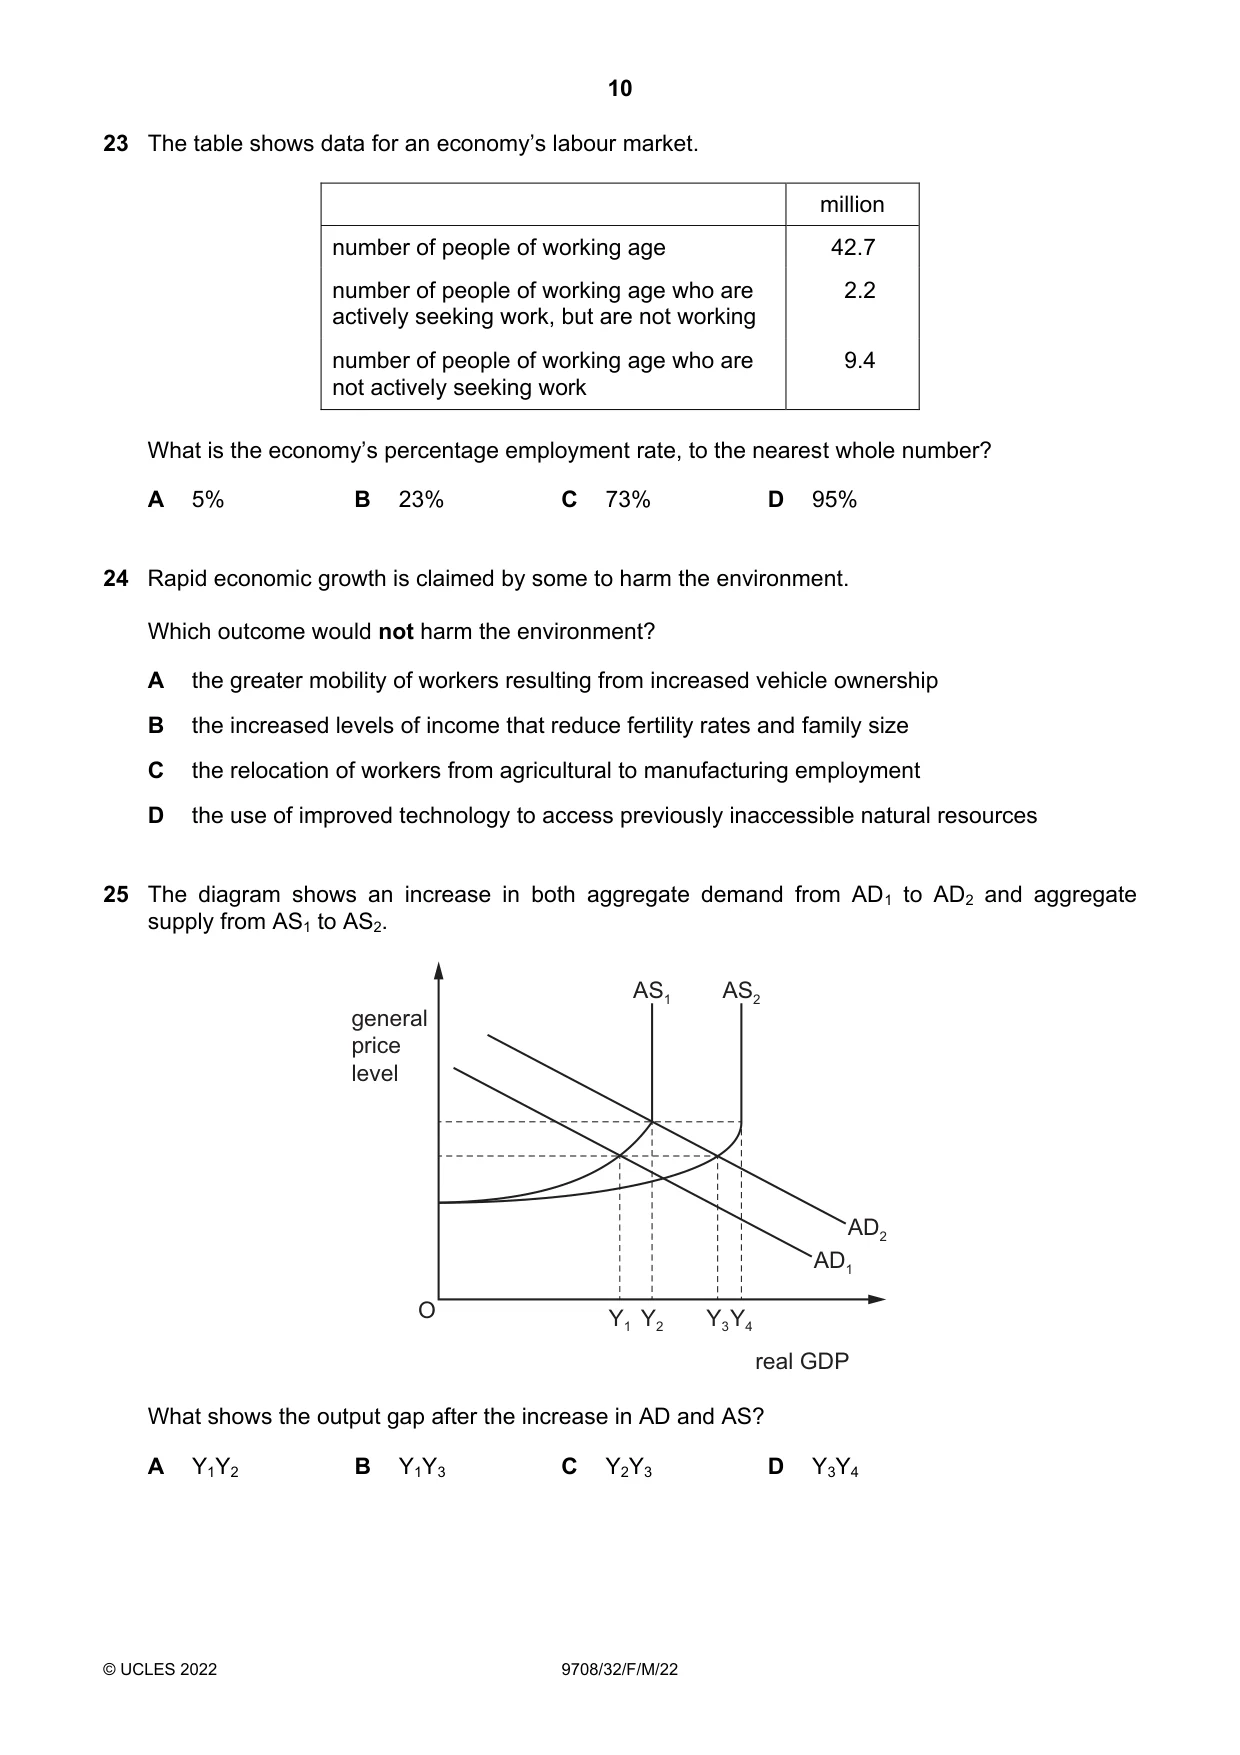
10 © UCLES 2022 9708/32/F/M/22 23 The table shows data for an economy’s labour market. million number of people of working age 42.7 number of people of working age who are actively seeking work, but are not working 2.2 number of people of working age who are not actively seeking work 9.4 What is the economy’s percentage employment rate, to the nearest whole number? A 5% B 23% C 73% D 95% 24 Rapid economic growth is claimed by some to harm the environment. Which outcome would not harm the environment? A the greater mobility of workers resulting from increased vehicle ownership B the increased levels of income that reduce fertility rates and family size C the relocation of workers from agricultural to manufacturing employment D the use of improved technology to access previously inaccessible natural resources 25 The diagram shows an increase in both aggregate demand from AD1 to AD2 and aggregate supply from AS1 to AS2. general price level AD1 Y1 Y2 Y3Y4 AD2 AS1 AS2 O real GDP What shows the output gap after the increase in AD and AS? A Y1Y2 B Y1Y3 C Y2Y3 D Y3Y4
Question paper, page 11
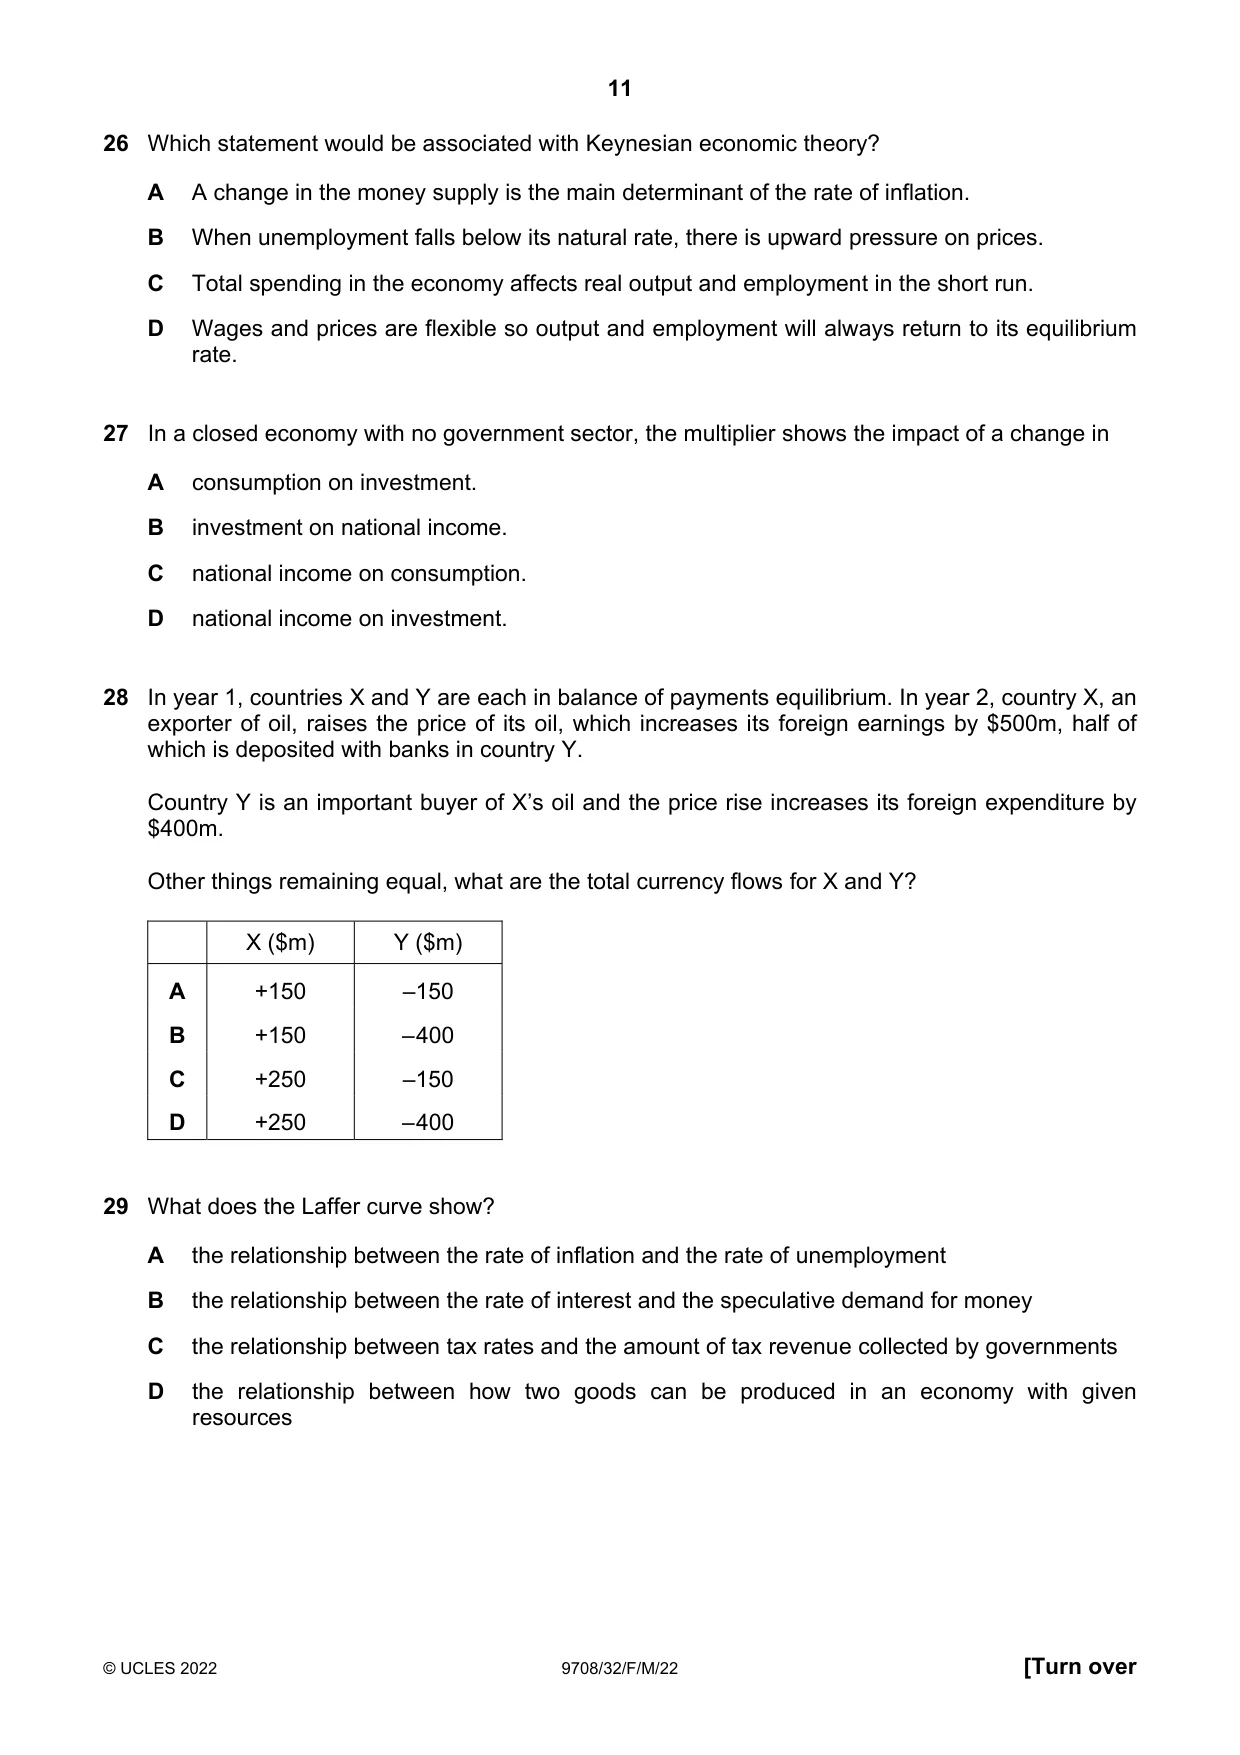
11 © UCLES 2022 9708/32/F/M/22 [Turn over 26 Which statement would be associated with Keynesian economic theory? A A change in the money supply is the main determinant of the rate of inflation. B When unemployment falls below its natural rate, there is upward pressure on prices. C Total spending in the economy affects real output and employment in the short run. D Wages and prices are flexible so output and employment will always return to its equilibrium rate. 27 In a closed economy with no government sector, the multiplier shows the impact of a change in A consumption on investment. B investment on national income. C national income on consumption. D national income on investment. 28 In year 1, countries X and Y are each in balance of payments equilibrium. In year 2, country X, an exporter of oil, raises the price of its oil, which increases its foreign earnings by $500m, half of which is deposited with banks in country Y. Country Y is an important buyer of X’s oil and the price rise increases its foreign expenditure by $400m. Other things remaining equal, what are the total currency flows for X and Y? X ($m) Y ($m) A +150 –150 B +150 – 400 C +250 –150 D +250 – 400 29 What does the Laffer curve show? A the relationship between the rate of inflation and the rate of unemployment B the relationship between the rate of interest and the speculative demand for money C the relationship between tax rates and the amount of tax revenue collected by governments D the relationship between how two goods can be produced in an economy with given resources
Question paper, page 12
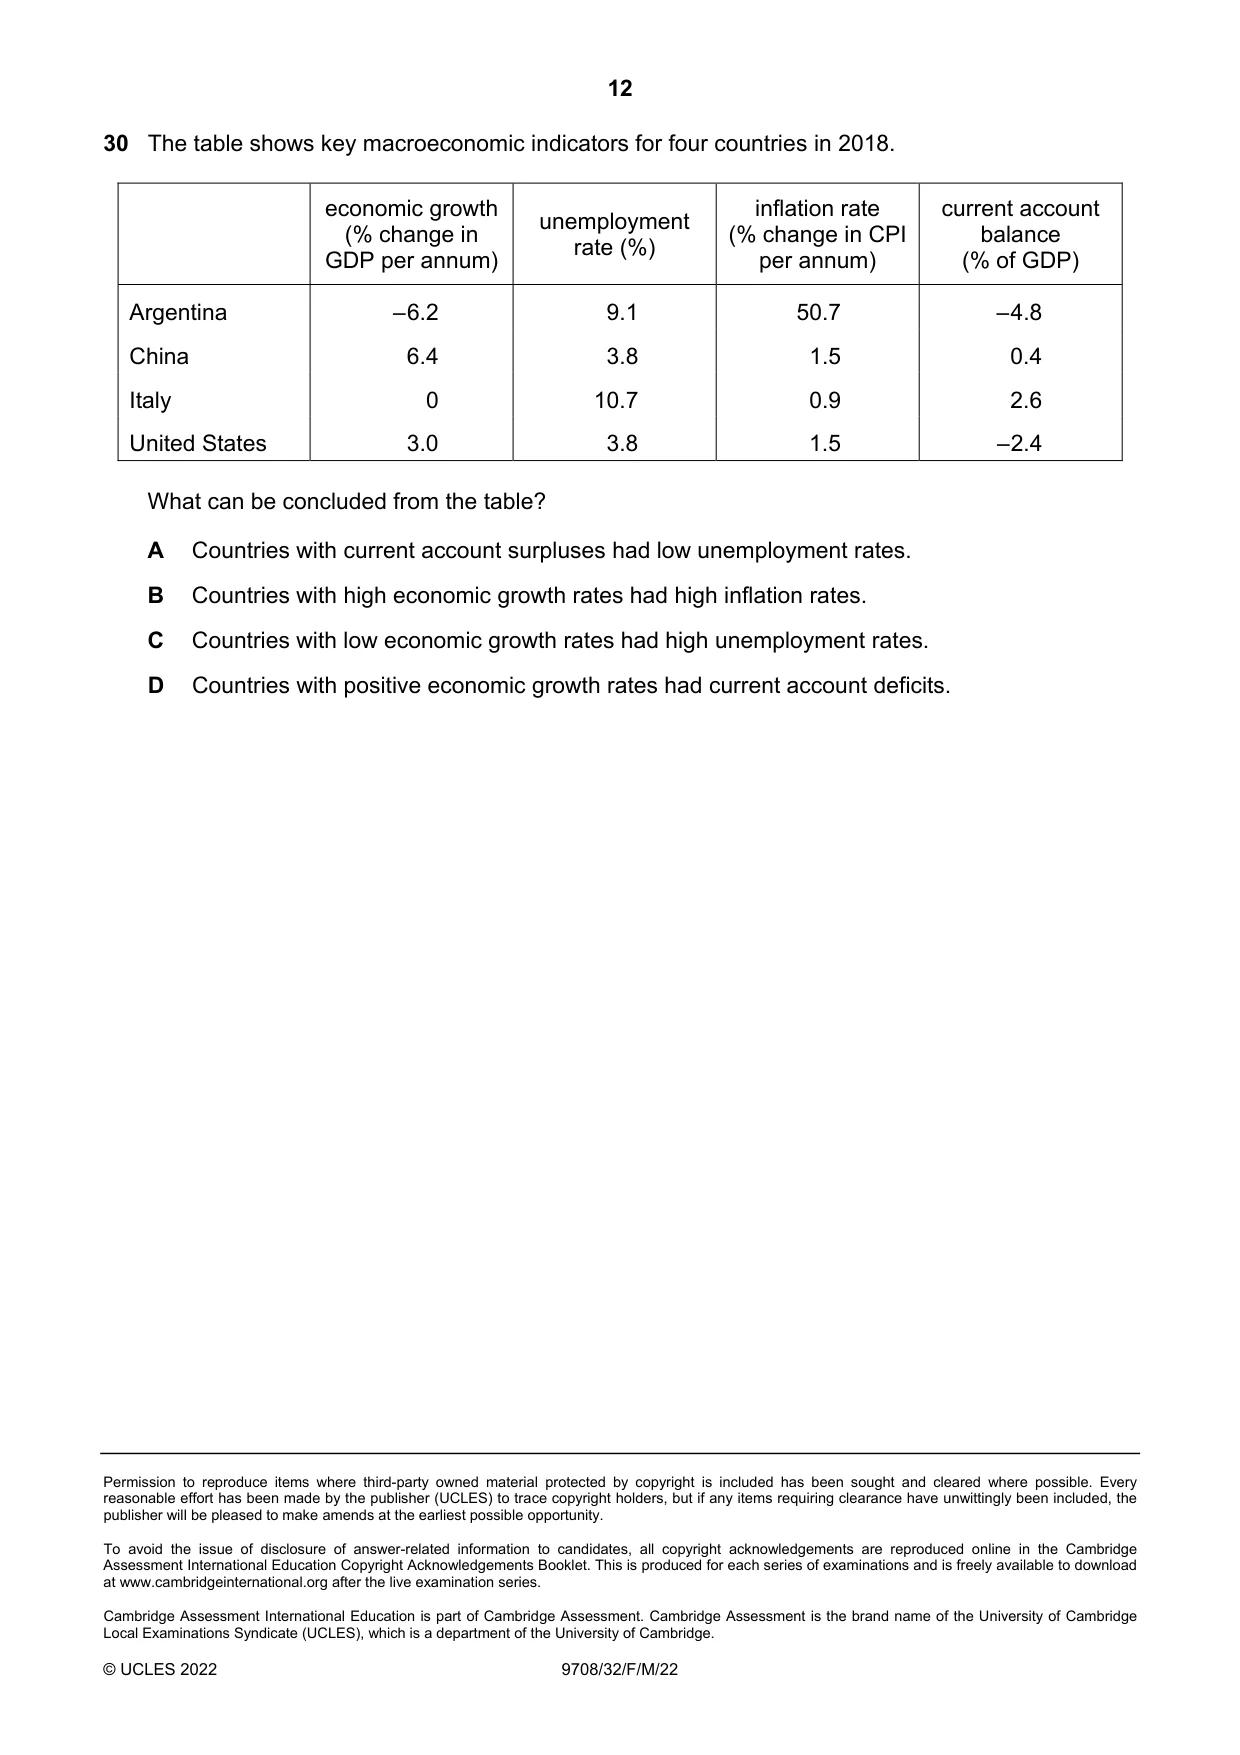
12 Permission to reproduce items where third-party owned material protected by copyright is included has been sought and cleared where possible. Every reasonable effort has been made by the publisher (UCLES) to trace copyright holders, but if any items requiring clearance have unwittingly been included, the publisher will be pleased to make amends at the earliest possible opportunity. To avoid the issue of disclosure of answer-related information to candidates, all copyright acknowledgements are reproduced online in the Cambridge Assessment International Education Copyright Acknowledgements Booklet. This is produced for each series of examinations and is freely available to download at www.cambridgeinternational.org after the live examination series. Cambridge Assessment International Education is part of Cambridge Assessment. Cambridge Assessment is the brand name of the University of Cambridge Local Examinations Syndicate (UCLES), which is a department of the University of Cambridge. © UCLES 2022 9708/32/F/M/22 30 The table shows key macroeconomic indicators for four countries in 2018. economic growth (% change in GDP per annum) unemployment rate (%) inflation rate (% change in CPI per annum) current account balance (% of GDP) Argentina – 6.2 9.1 50.7 – 4.8 China 6.4 3.8 1.5 0.4 Italy 0 10.7 0.9 2.6 United States 3.0 3.8 1.5 – 2.4 What can be concluded from the table? A Countries with current account surpluses had low unemployment rates. B Countries with high economic growth rates had high inflation rates. C Countries with low economic growth rates had high unemployment rates. D Countries with positive economic growth rates had current account deficits.
Mark scheme, page 1
This document consists of 3 printed pages. © UCLES 2022 [Turn over Cambridge International AS & A Level ECONOMICS 9708/32 Paper 3 Multiple Choice February/March 2022 MARK SCHEME Maximum Mark: 30 Published This mark scheme is published as an aid to teachers and candidates, to indicate the requirements of the examination. Mark schemes should be read in conjunction with the question paper and the Principal Examiner Report for Teachers. Cambridge International will not enter into discussions about these mark schemes. Cambridge International is publishing the mark schemes for the February/March 2022 series for most Cambridge IGCSE™, Cambridge International A and AS Level components and some Cambridge O Level components.
Mark scheme, page 2
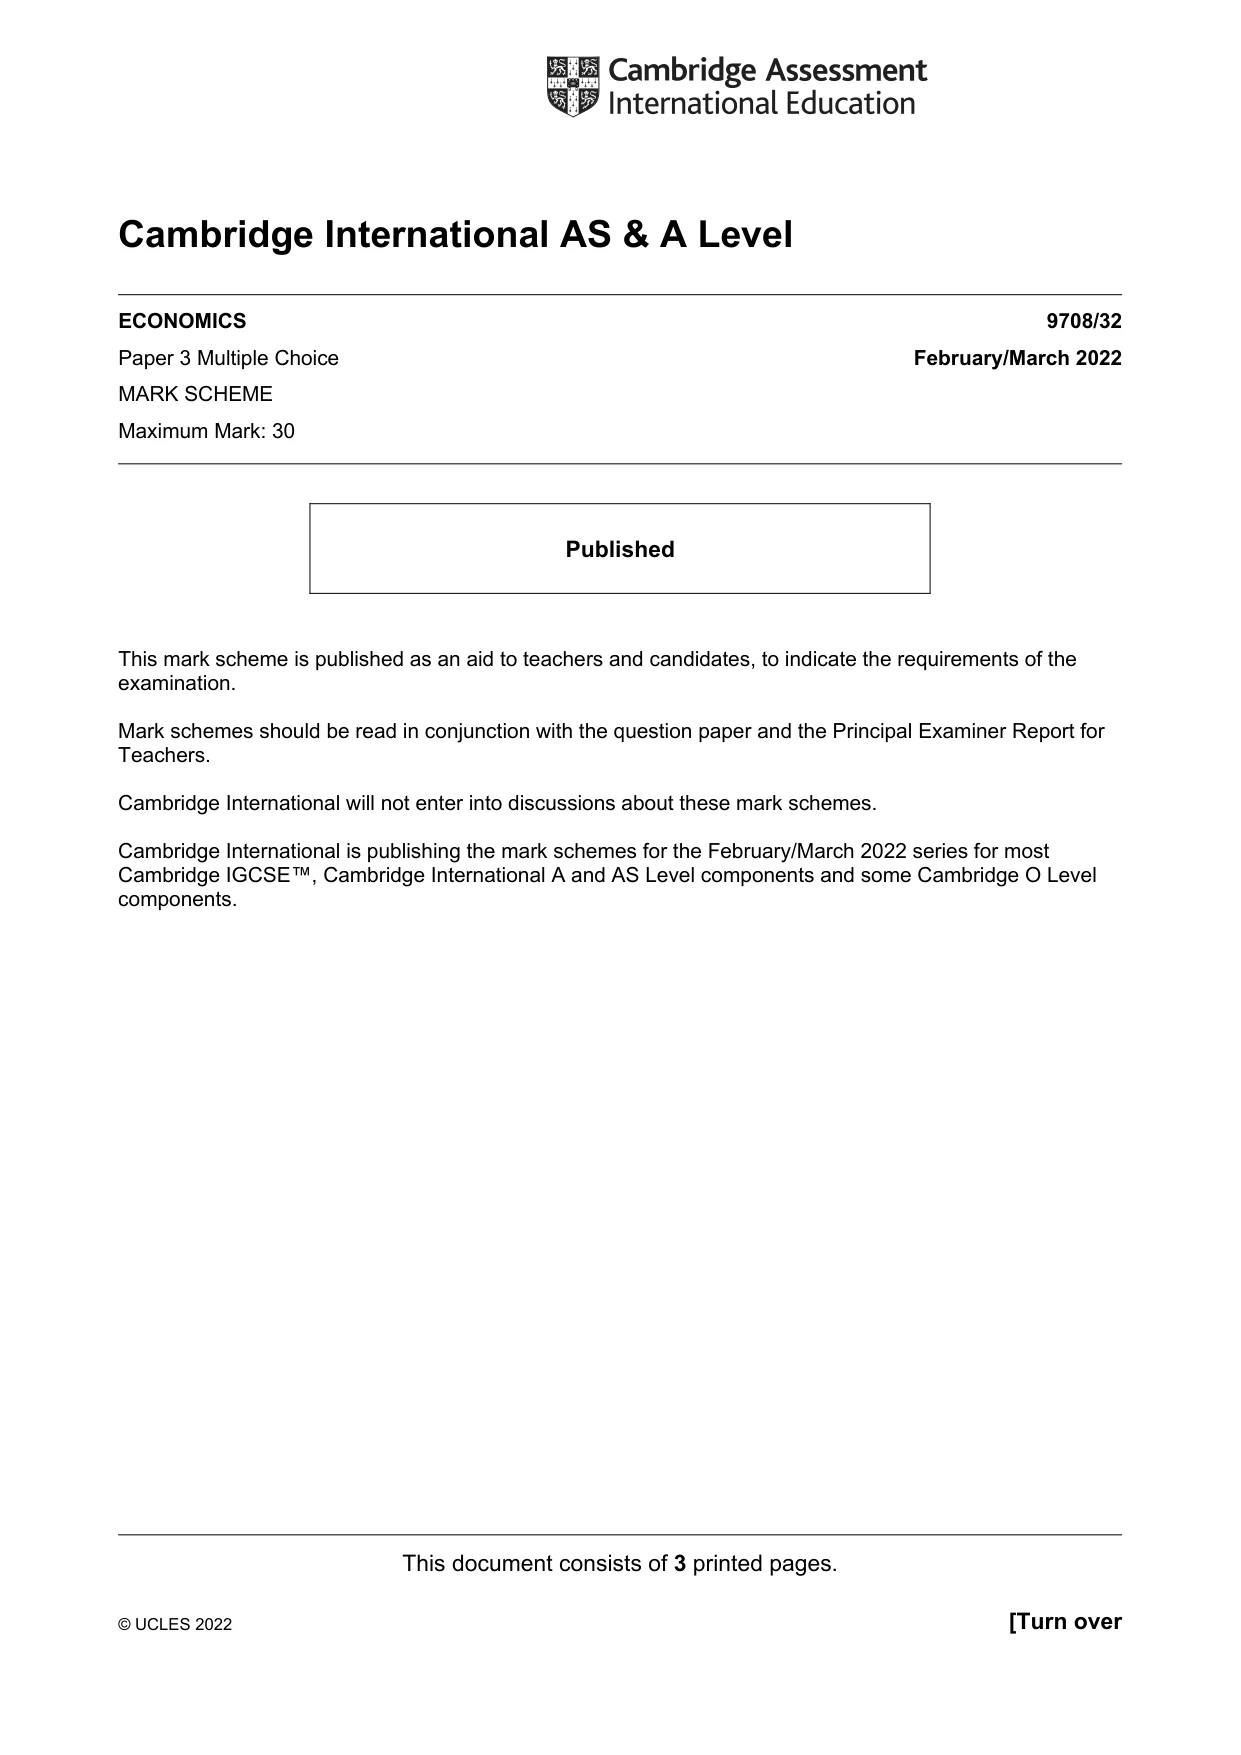
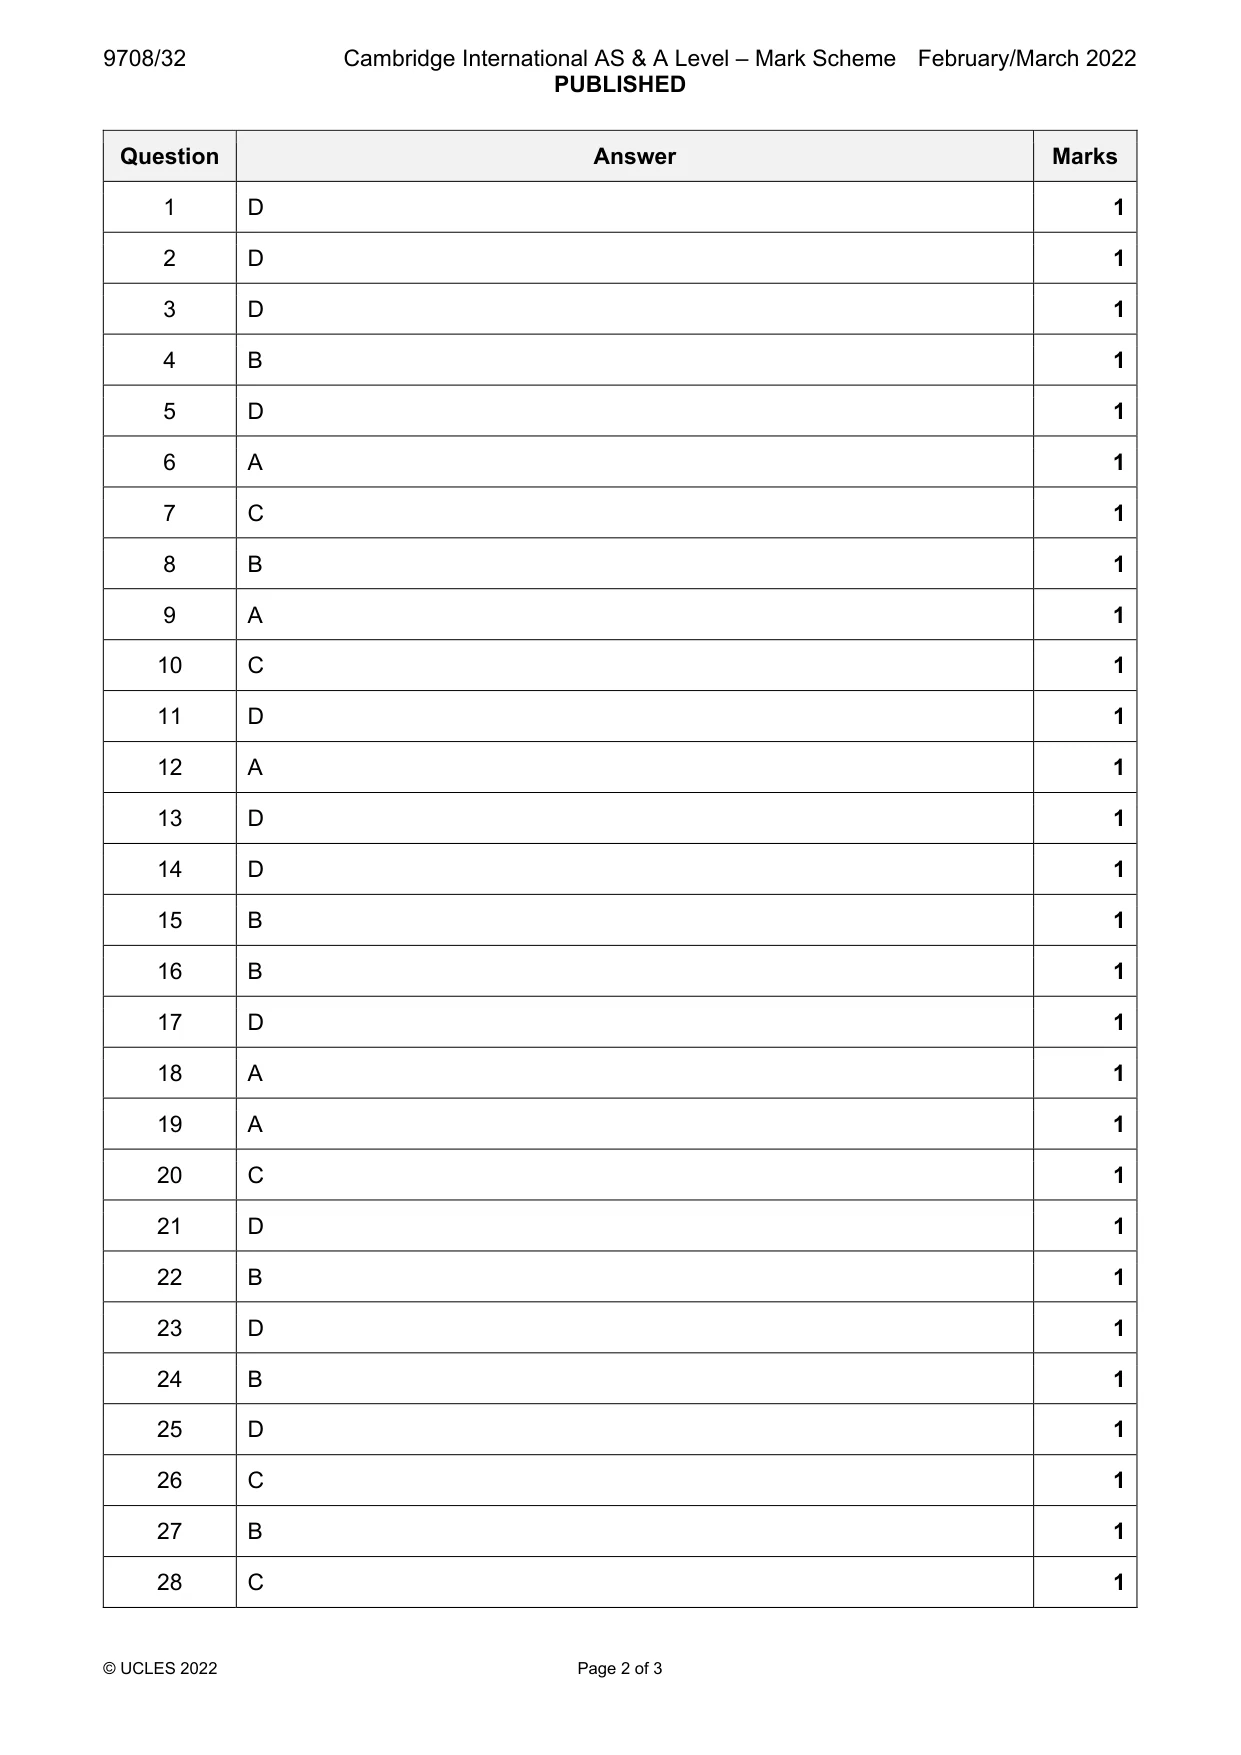
9708/32 Cambridge International AS & A Level – Mark Scheme PUBLISHED February/March 2022 © UCLES 2022 Page 2 of 3 Question Answer Marks 1 D 1 2 D 1 3 D 1 4 B 1 5 D 1 6 A 1 7 C 1 8 B 1 9 A 1 10 C 1 11 D 1 12 A 1 13 D 1 14 D 1 15 B 1 16 B 1 17 D 1 18 A 1 19 A 1 20 C 1 21 D 1 22 B 1 23 D 1 24 B 1 25 D 1 26 C 1 27 B 1 28 C 1
Mark scheme, page 3
9708/32 Cambridge International AS & A Level – Mark Scheme PUBLISHED February/March 2022 © UCLES 2022 Page 3 of 3 Question Answer Marks 29 C 1 30 C 1
What you needed in this session
Cambridge’s own grade thresholds for 2022 Feb/March, Paper 3 · Variant 2. A higher threshold means an easier paper — the bar moves with how the cohort did.