Cambridge A Level Economics 9708 — 2020 May/June Paper 3 · Variant 2
9708/32/M/J/20
The question paper and its mark scheme, free to read here and free to download. This is Cambridge’s own paper, exactly as it was sat.
Question paper12 pages







Mark scheme3 pages
Answers below. Sit the paper first if you are practising.


Paper as text
Question paper, page 1
This document has 12 pages. Blank pages are indicated. IB20 06_9708_32/3RP © UCLES 2020 [Turn over *9757189366* Cambridge International AS & A Level ECONOMICS 9708/32 Paper 3 Multiple Choice May/June 2020 1 hour 15 minutes You must answer on the multiple choice answer sheet. You will need: Multiple choice answer sheet Soft clean eraser Soft pencil (type B or HB is recommended) INSTRUCTIONS • There are thirty questions on this paper. Answer all questions. • For each question there are four possible answers A, B, C and D. Choose the one you consider correct and record your choice in soft pencil on the multiple choice answer sheet. • Follow the instructions on the multiple choice answer sheet. • Write in soft pencil. • Write your name, centre number and candidate number on the multiple choice answer sheet in the spaces provided unless this has been done for you. • Do not use correction fluid. • Do not write on any bar codes. • You may use a calculator. INFORMATION • The total mark for this paper is 30. • Each correct answer will score one mark. A mark will not be deducted for a wrong answer. • Any rough working should be done on this question paper.
Question paper, page 2
2 © UCLES 2020 9708/32/M/J/20 1 What is an example of a negative externality? A Lower profit due to increased competition from new firms entering the market. B Reduced government funding for a museum. C The increase in noise levels from aircraft due to the expansion of a large city airport. D The increase in production costs due to an increase in the cost of importing raw materials. 2 The diagram shows a firm operating in monopolistic competition. At which point is the firm allocatively efficient? O revenue / costs output AR MR AC MC A B C D 3 The amount of training undertaken in a mixed economy is not socially optimal. What could explain this? A Experienced educators are a scarce resource. B In a mixed economy training is a public good. C The individual’s benefit from training is less than the benefit to society. D Training is a large variable cost for firms. 4 Four bus companies control more than two-thirds of the market in a country. Critics claim that these companies fix prices on some routes to maximise revenue whilst lowering prices on other routes to stop smaller competitors entering the market. Which anti-competitive practices are these companies accused of? A collusion and limit pricing B collusion and price leadership C limit pricing and price discrimination D price leadership and x-inefficiency
Question paper, page 3
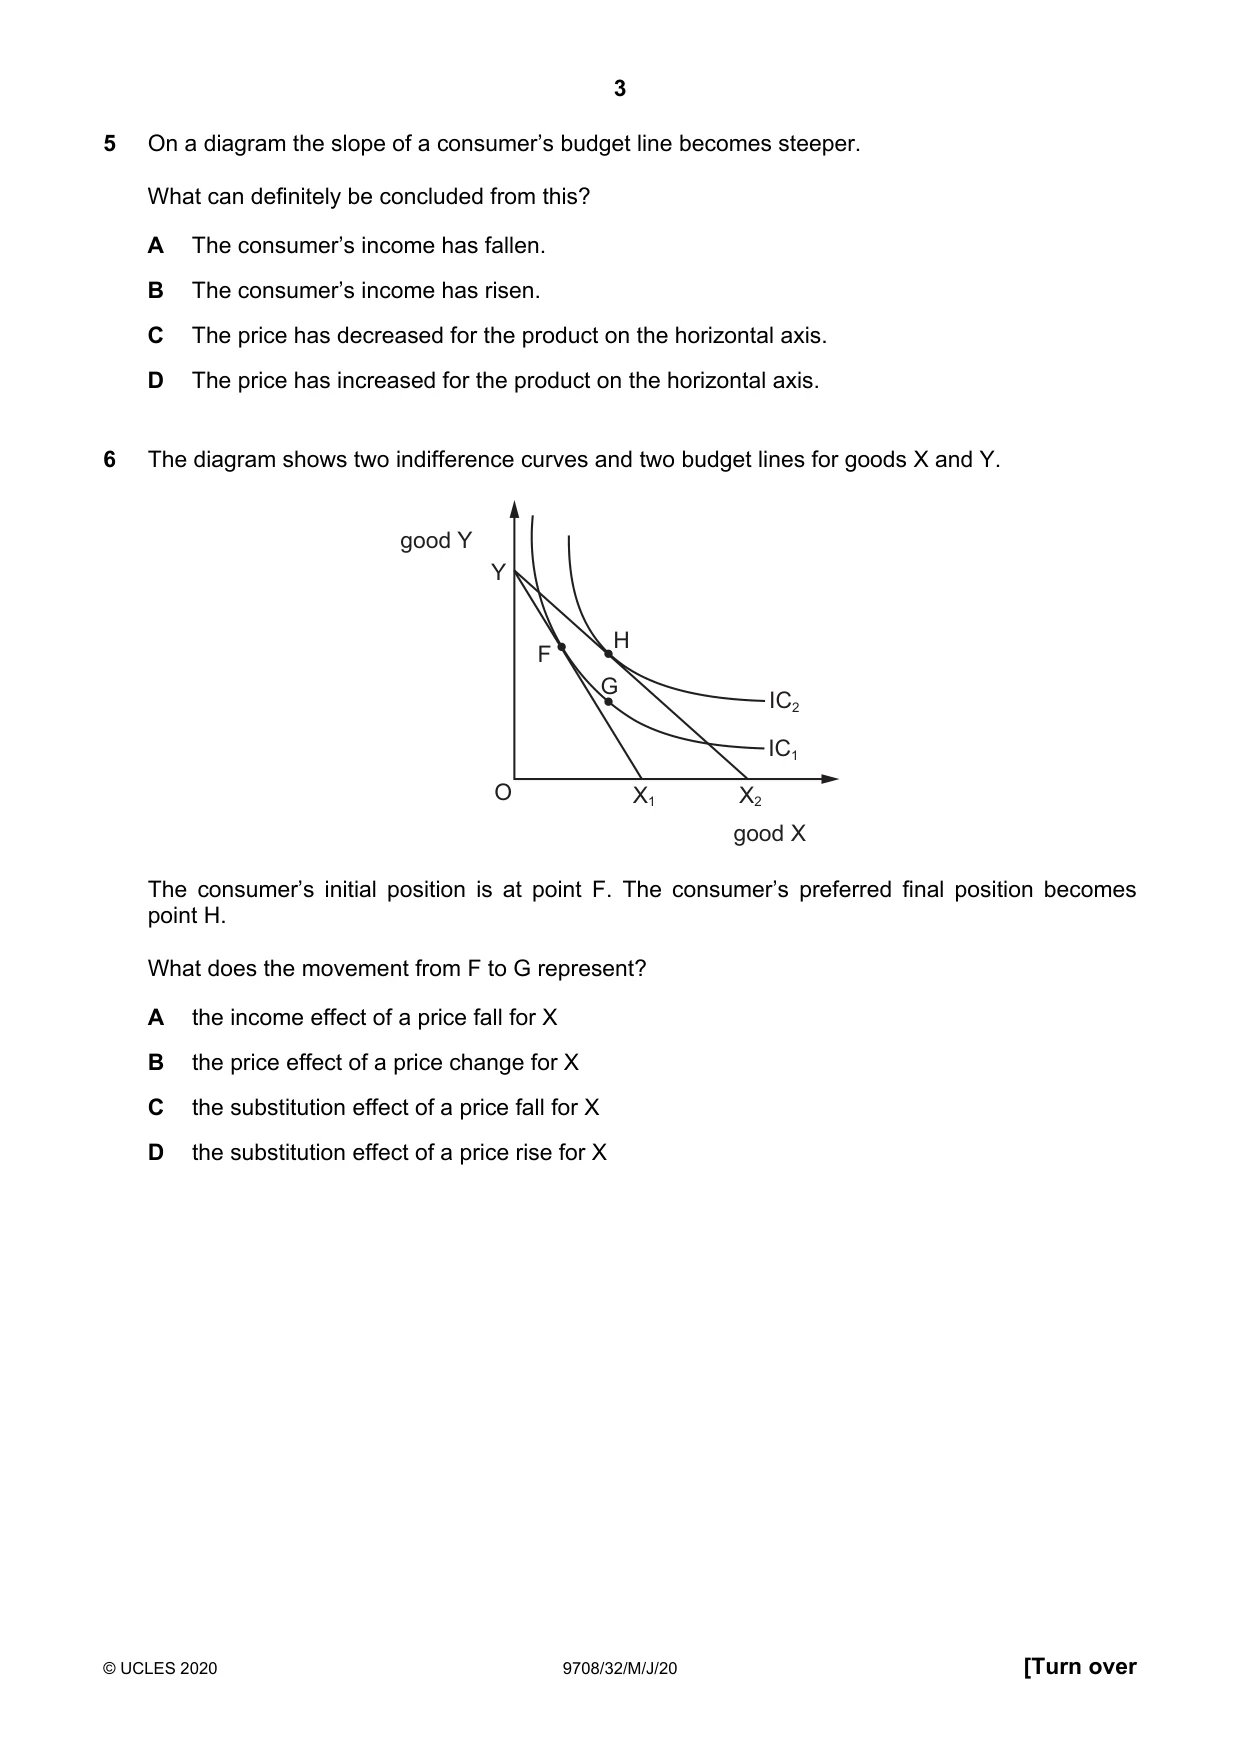
3 © UCLES 2020 9708/32/M/J/20 [Turn over 5 On a diagram the slope of a consumer’s budget line becomes steeper. What can definitely be concluded from this? A The consumer’s income has fallen. B The consumer’s income has risen. C The price has decreased for the product on the horizontal axis. D The price has increased for the product on the horizontal axis. 6 The diagram shows two indifference curves and two budget lines for goods X and Y. O Y X1 X2 F H G IC2 IC1 good Y good X The consumer’s initial position is at point F. The consumer’s preferred final position becomes point H. What does the movement from F to G represent? A the income effect of a price fall for X B the price effect of a price change for X C the substitution effect of a price fall for X D the substitution effect of a price rise for X
Question paper, page 4
4 © UCLES 2020 9708/32/M/J/20 7 The table shows the total costs at different levels of output for a firm producing chairs. output (chairs) total cost ($) 0 50 1 60 2 64 3 77 4 94 5 114 What is the average variable cost when output is 4 chairs? A $11 B $17 C $44 D $23.50 8 At which level of output will a firm achieve the aim of sales maximisation? A where AC = AR B where AC = MC C where MC = AR D where MR = zero 9 In market economies firms can operate under monopolistic competition. Which feature is not typical of this type of market? A non-price competition through advertising B price leadership with few large firms C promotion of differentiated products D unrestricted entry results in long-run normal profit 10 When will the ‘principal-agent’ problem occur? A when managers are not allowed to become shareholders B when members of a cartel collude to gain higher profit C when one firm dominates the market D when owners have different objectives to managers
Question paper, page 5
5 © UCLES 2020 9708/32/M/J/20 [Turn over 11 Which feature of oligopoly is being assumed when the demand curve for an individual firm is as shown? quantity price D D O A price discrimination B price leadership by the dominant firm C interdependence between firms D collusion between firms 12 The table provides data on the number and value of mergers in Europe and North America between 2014 and 2017. year Europe North America number value (euro) number value (US dollar) 2014 17 000 980 billion 14 000 2289 billion 2015 15 500 1161 billion 14 500 2533 billion 2016 18 100 1003 billion 15 100 1858 billion 2017 18 000 980 billion 18 500 1822 billion What can be deduced from the table? A The average value of a merger in Europe was higher in 2017 than 2014. B The difference in the number of mergers in Europe and North America was the same in 2014 and 2016. C The value of mergers each year in US dollars was always lower in Europe. D The number of mergers each year was always higher in Europe.
Question paper, page 6
6 © UCLES 2020 9708/32/M/J/20 13 Charities distribute plastic bags to households that householders can fill with clothes they no longer want. The charities then collect them and sell the clothes to raise funds. Only one charity leaves a note thanking the householder for the donation. What best describes this charity’s approach? A game theory B monopoly behaviour C non-price competition D nudge theory 14 What could prevent a market failure? A barriers to entry B building regulations C growth of firms D persuasive advertising 15 When will a society have achieved an equitable distribution of income? A when all individuals have equal job opportunities B when all workers are paid the same wages C when the incomes within the society are equally distributed D when the society believes that the distribution of income is fair 16 ‘The addition to revenue which results from employing one additional unit of a factor of production, while the quantities of all other factors of production remain constant’. What does this define? A marginal factor cost B marginal revenue C marginal revenue product D the law of diminishing returns
Question paper, page 7
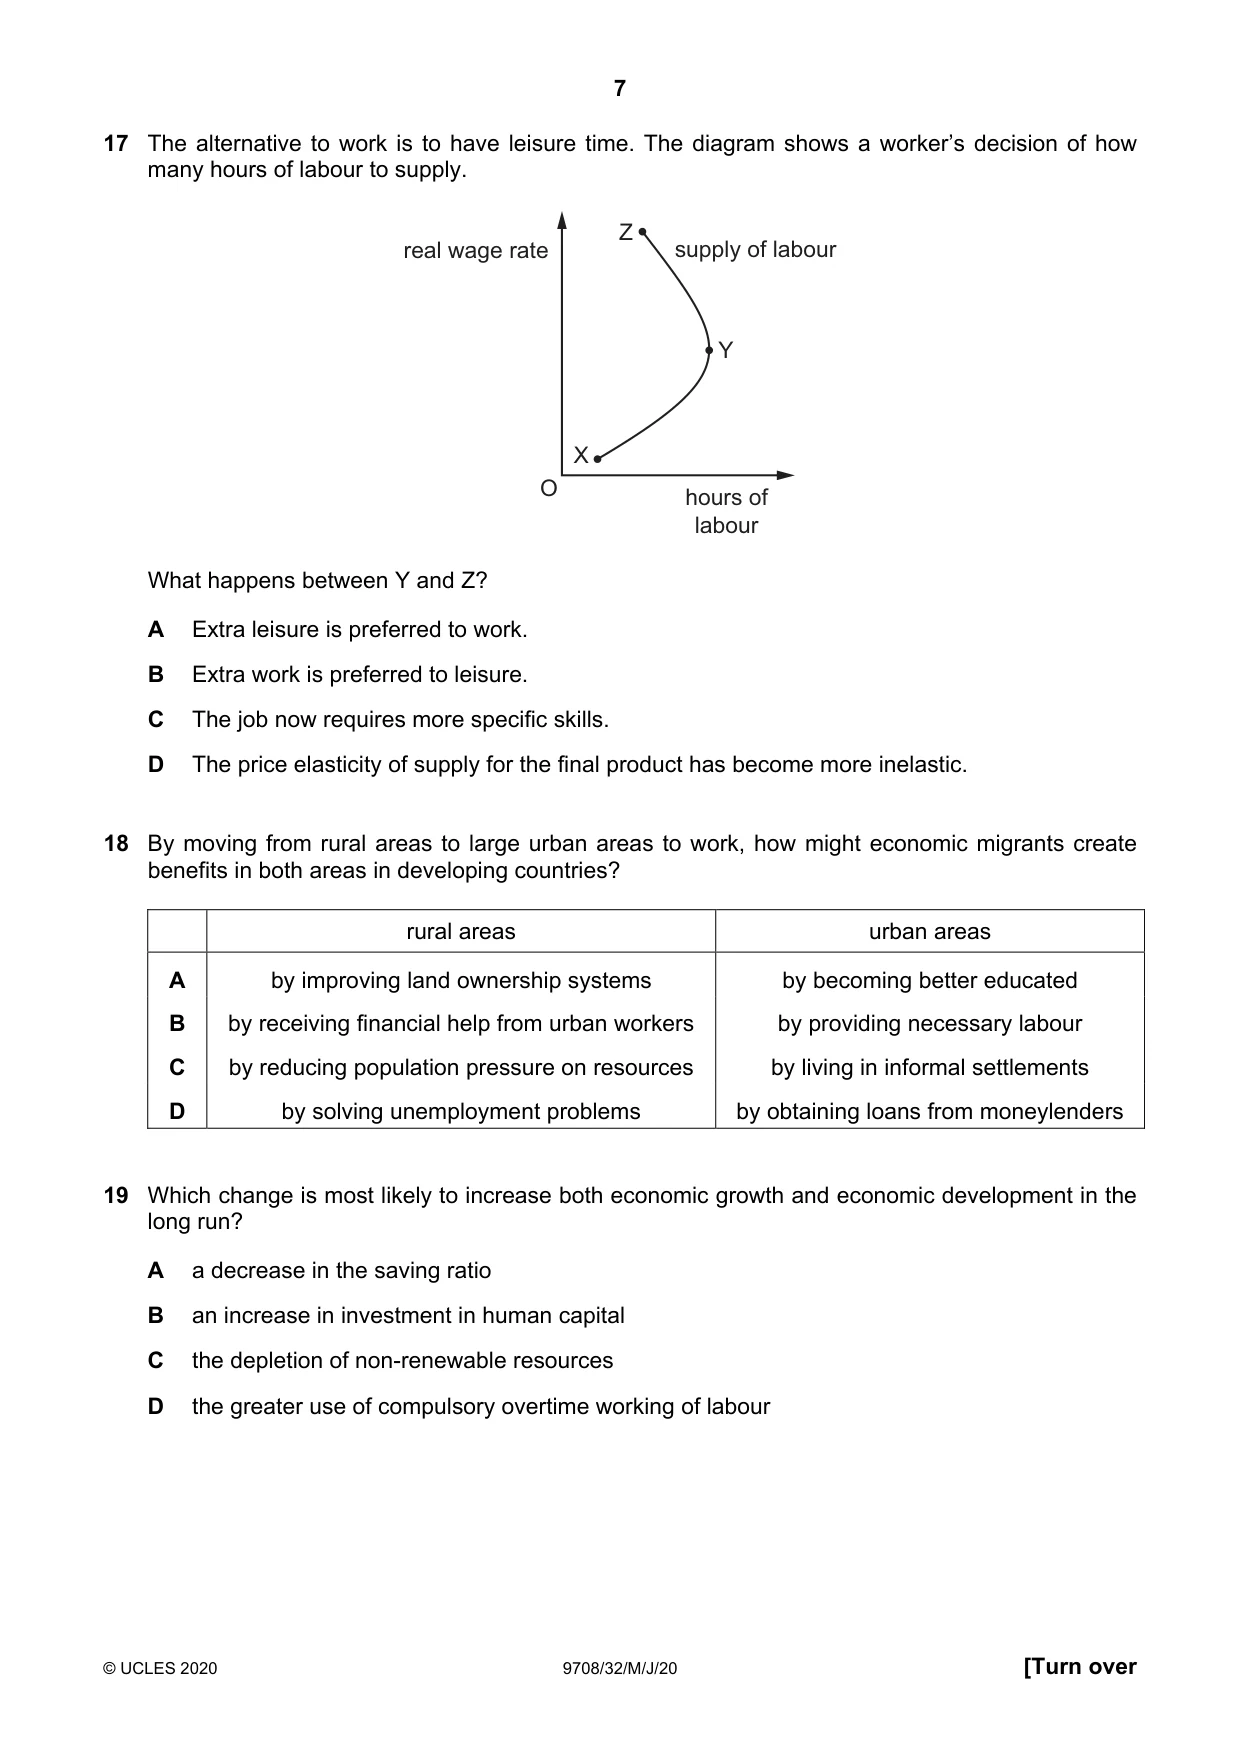
7 © UCLES 2020 9708/32/M/J/20 [Turn over 17 The alternative to work is to have leisure time. The diagram shows a worker’s decision of how many hours of labour to supply. hours of labour real wage rate O X Y Z supply of labour What happens between Y and Z? A Extra leisure is preferred to work. B Extra work is preferred to leisure. C The job now requires more specific skills. D The price elasticity of supply for the final product has become more inelastic. 18 By moving from rural areas to large urban areas to work, how might economic migrants create benefits in both areas in developing countries? rural areas urban areas A by improving land ownership systems by becoming better educated B by receiving financial help from urban workers by providing necessary labour C by reducing population pressure on resources by living in informal settlements D by solving unemployment problems by obtaining loans from moneylenders 19 Which change is most likely to increase both economic growth and economic development in the long run? A a decrease in the saving ratio B an increase in investment in human capital C the depletion of non-renewable resources D the greater use of compulsory overtime working of labour
Question paper, page 8
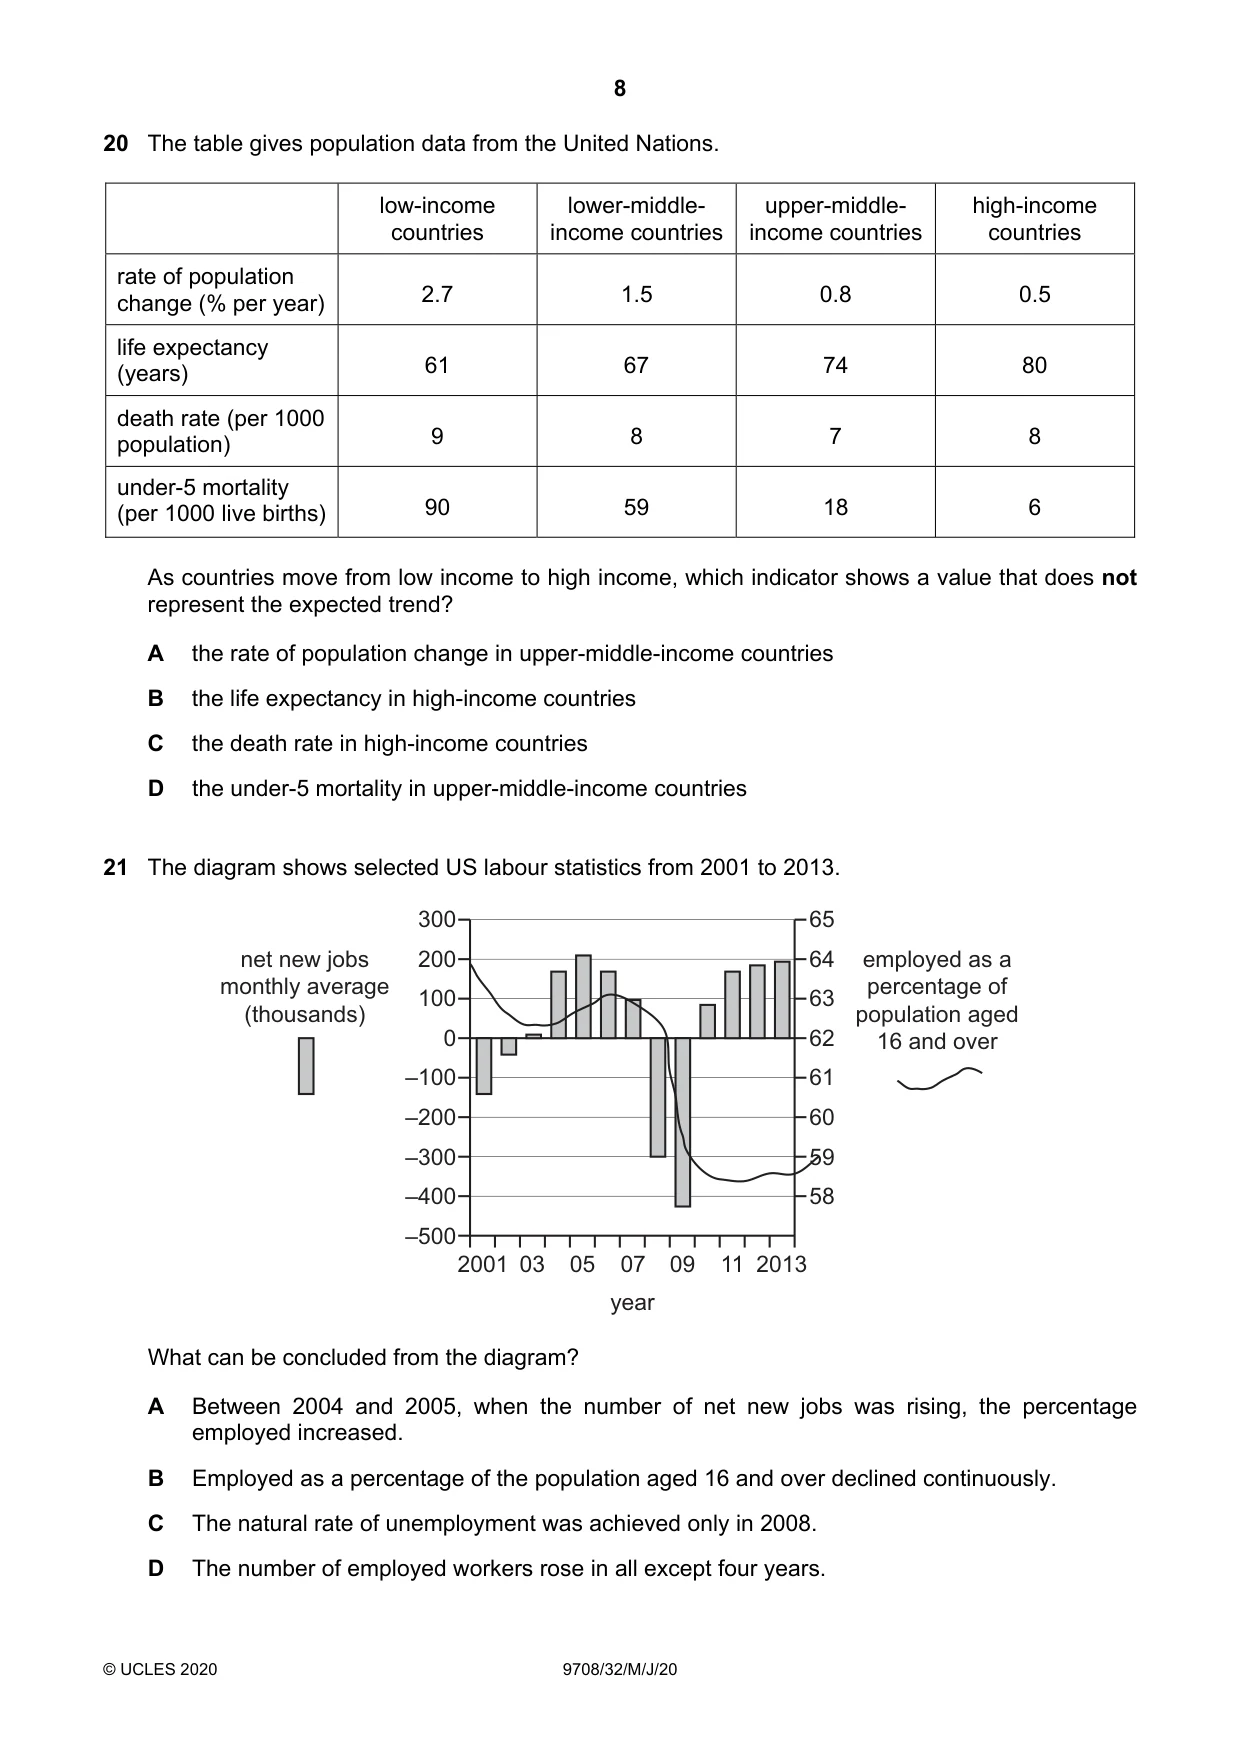
8 © UCLES 2020 9708/32/M/J/20 20 The table gives population data from the United Nations. low-income countries lower-middle- income countries upper-middle- income countries high-income countries rate of population change (% per year) 2.7 1.5 0.8 0.5 life expectancy (years) 61 67 74 80 death rate (per 1000 population) 9 8 7 8 under-5 mortality (per 1000 live births) 90 59 18 6 As countries move from low income to high income, which indicator shows a value that does not represent the expected trend? A the rate of population change in upper-middle-income countries B the life expectancy in high-income countries C the death rate in high-income countries D the under-5 mortality in upper-middle-income countries 21 The diagram shows selected US labour statistics from 2001 to 2013. 300 200 100 0 –100 –200 –300 –400 –500 65 64 63 62 61 60 59 58 2001 05 07 09 11 03 year employed as a percentage of population aged 16 and over net new jobs monthly average (thousands) 2013 What can be concluded from the diagram? A Between 2004 and 2005, when the number of net new jobs was rising, the percentage employed increased. B Employed as a percentage of the population aged 16 and over declined continuously. C The natural rate of unemployment was achieved only in 2008. D The number of employed workers rose in all except four years.
Question paper, page 9
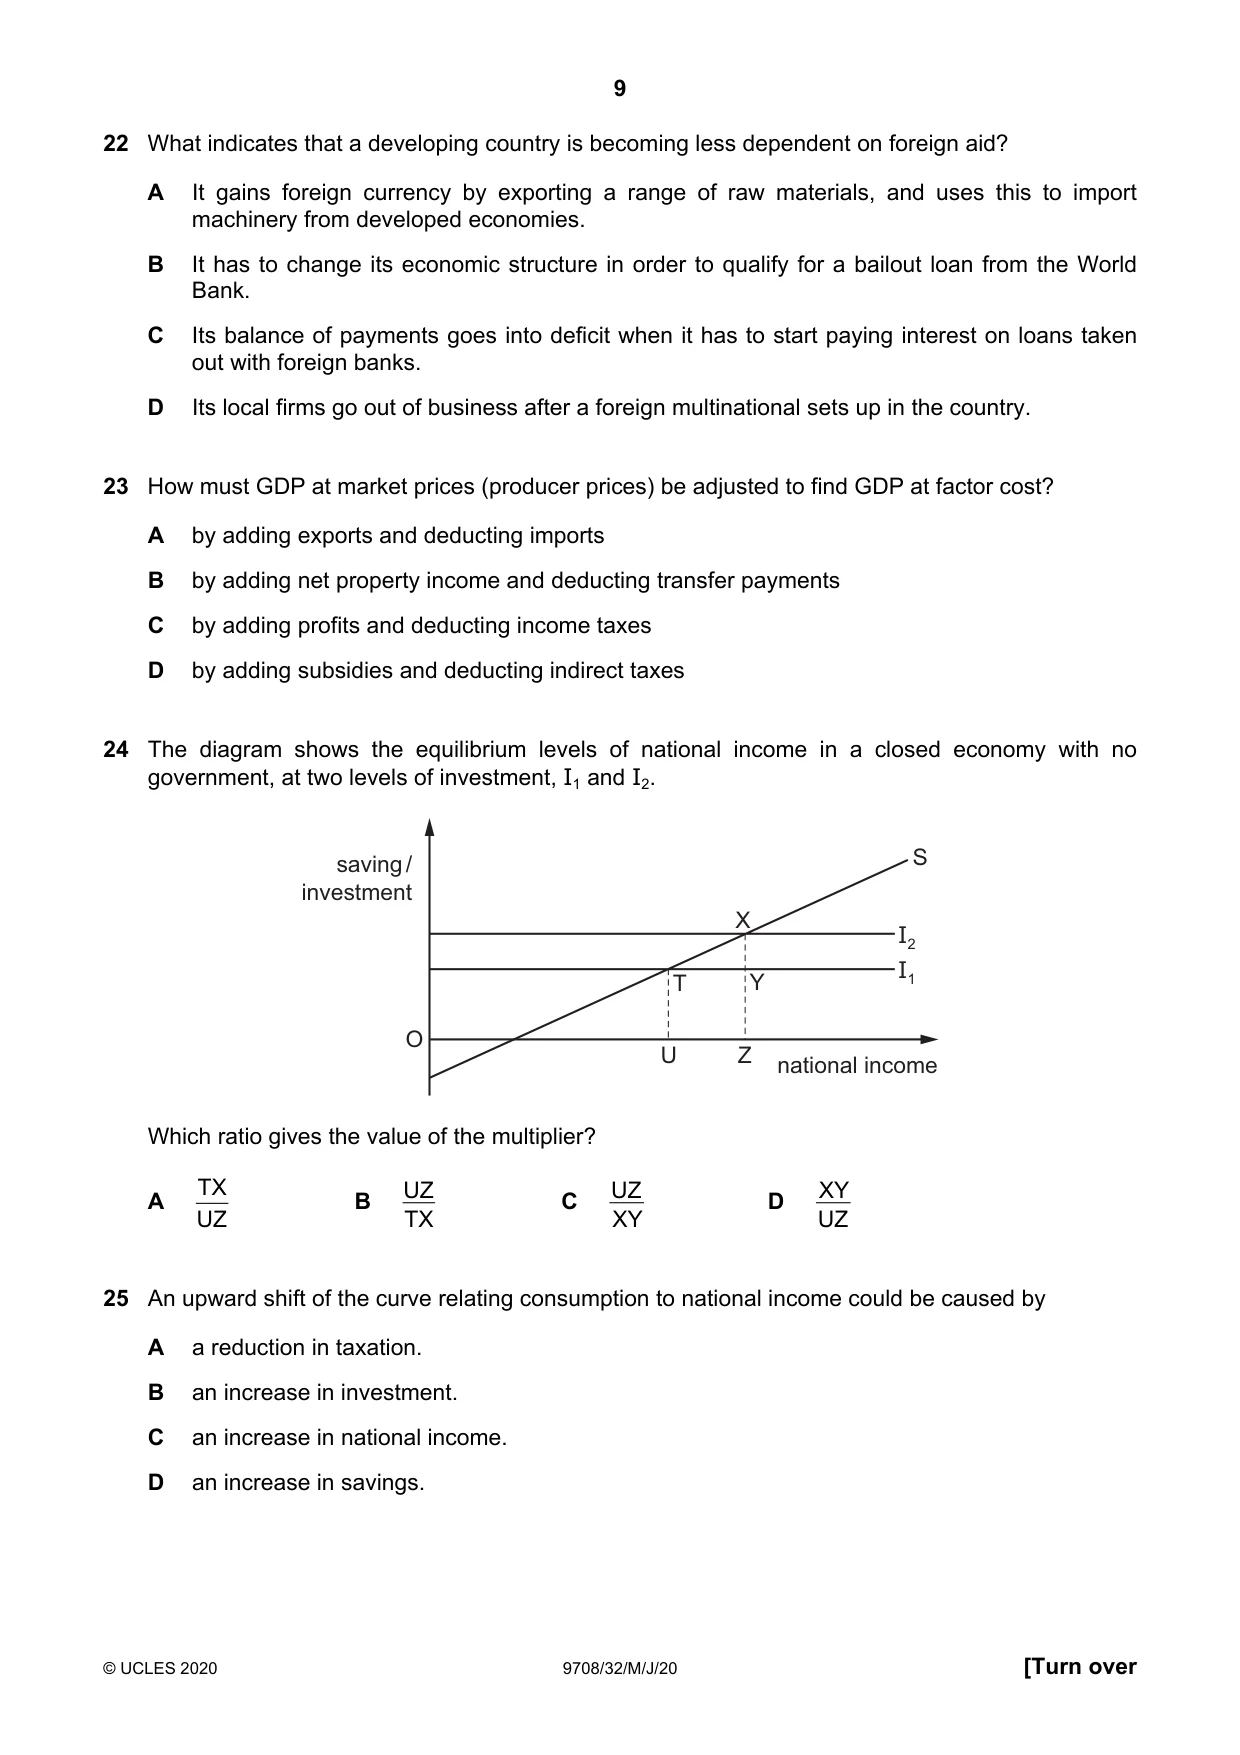
9 © UCLES 2020 9708/32/M/J/20 [Turn over 22 What indicates that a developing country is becoming less dependent on foreign aid? A It gains foreign currency by exporting a range of raw materials, and uses this to import machinery from developed economies. B It has to change its economic structure in order to qualify for a bailout loan from the World Bank. C Its balance of payments goes into deficit when it has to start paying interest on loans taken out with foreign banks. D Its local firms go out of business after a foreign multinational sets up in the country. 23 How must GDP at market prices (producer prices) be adjusted to find GDP at factor cost? A by adding exports and deducting imports B by adding net property income and deducting transfer payments C by adding profits and deducting income taxes D by adding subsidies and deducting indirect taxes 24 The diagram shows the equilibrium levels of national income in a closed economy with no government, at two levels of investment, I1 and I2. saving / investment national income O U Z T Y X I2 I1 S Which ratio gives the value of the multiplier? A UZ TX B TX UZ C XY UZ D UZ XY 25 An upward shift of the curve relating consumption to national income could be caused by A a reduction in taxation. B an increase in investment. C an increase in national income. D an increase in savings.
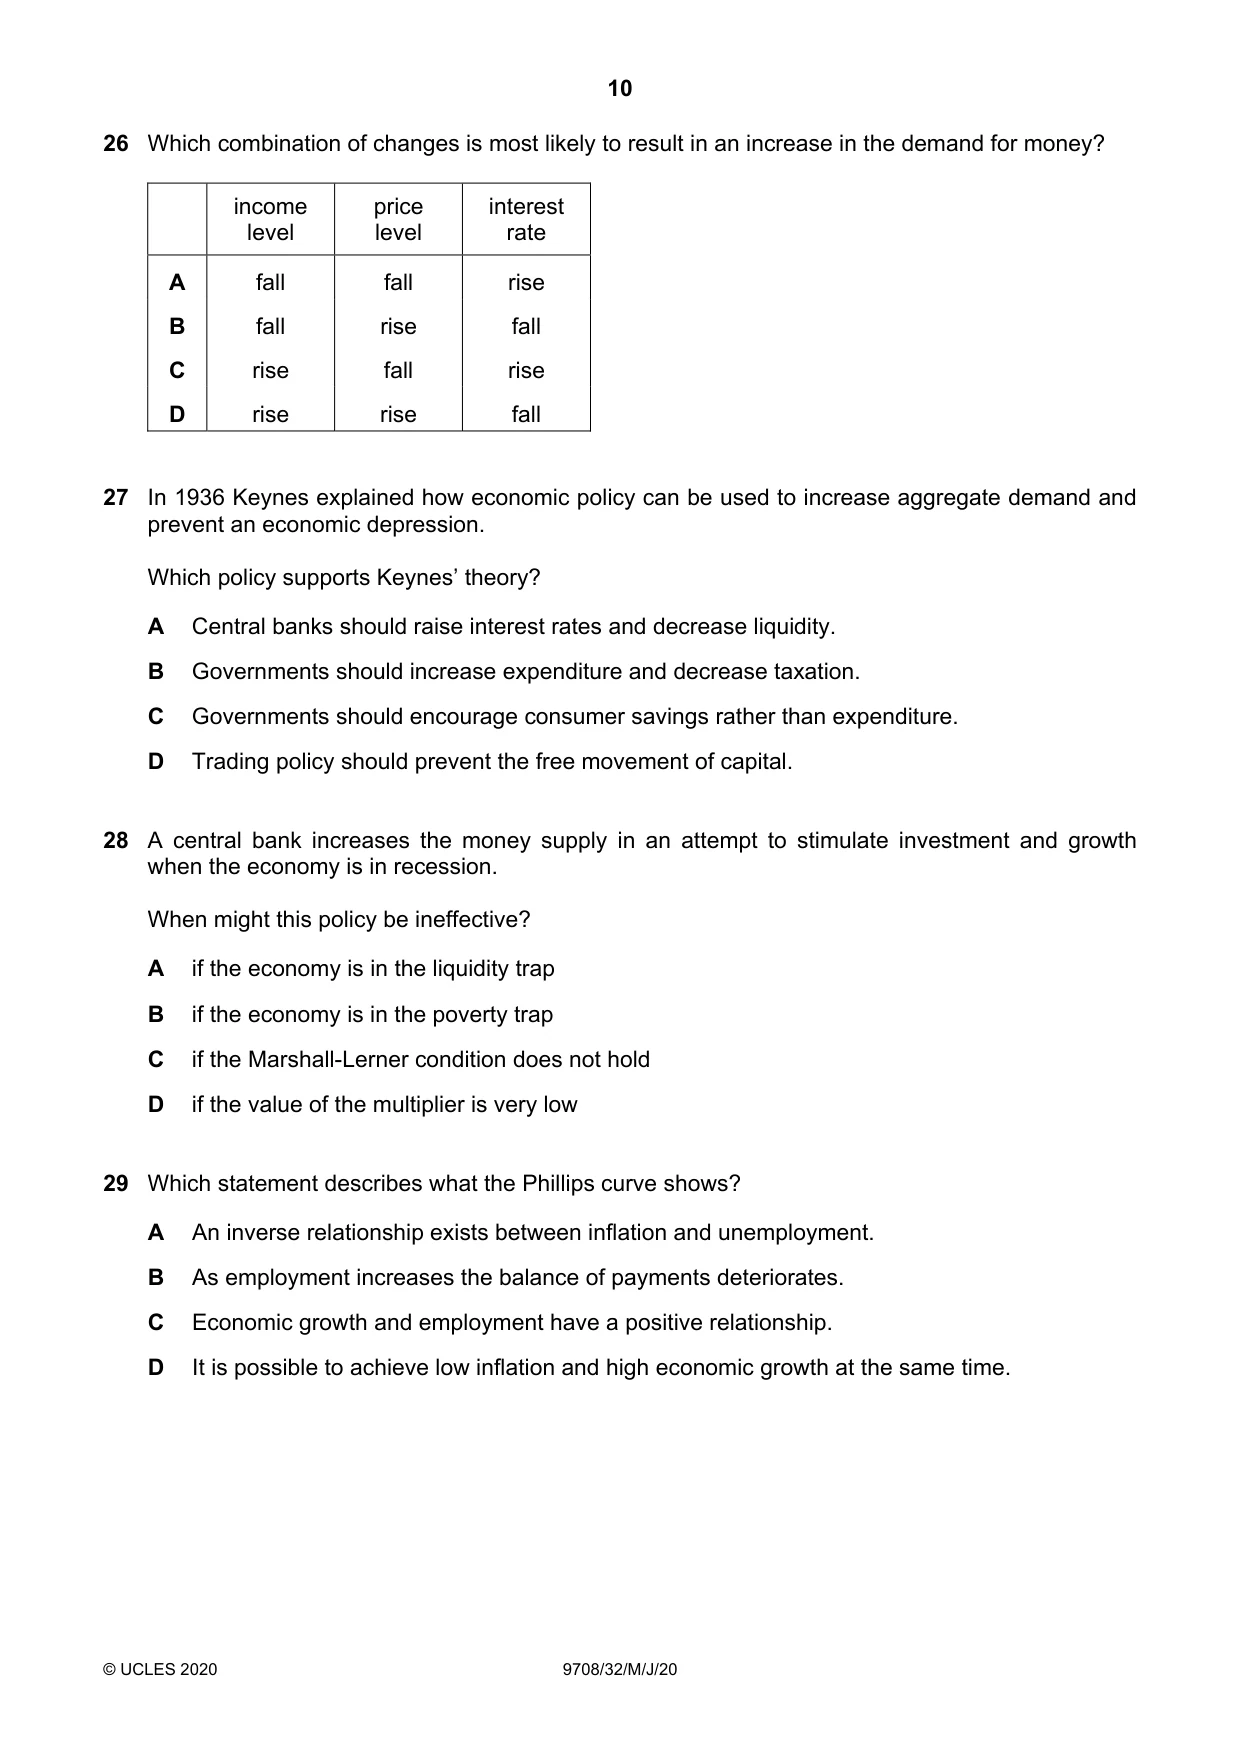
Question paper, page 10
10 © UCLES 2020 9708/32/M/J/20 26 Which combination of changes is most likely to result in an increase in the demand for money? income level price level interest rate A fall fall rise B fall rise fall C rise fall rise D rise rise fall 27 In 1936 Keynes explained how economic policy can be used to increase aggregate demand and prevent an economic depression. Which policy supports Keynes’ theory? A Central banks should raise interest rates and decrease liquidity. B Governments should increase expenditure and decrease taxation. C Governments should encourage consumer savings rather than expenditure. D Trading policy should prevent the free movement of capital. 28 A central bank increases the money supply in an attempt to stimulate investment and growth when the economy is in recession. When might this policy be ineffective? A if the economy is in the liquidity trap B if the economy is in the poverty trap C if the Marshall-Lerner condition does not hold D if the value of the multiplier is very low 29 Which statement describes what the Phillips curve shows? A An inverse relationship exists between inflation and unemployment. B As employment increases the balance of payments deteriorates. C Economic growth and employment have a positive relationship. D It is possible to achieve low inflation and high economic growth at the same time.
Question paper, page 11
11 © UCLES 2020 9708/32/M/J/20 30 To stimulate economic growth the government increases the size of its budget deficit and funds this by increasing the money supply. What is most likely to reduce the effectiveness of these measures in achieving their aim? A a floating exchange rate B a high marginal propensity to import C a low marginal propensity to save D an interest-inelastic demand for money
Question paper, page 12
12 Permission to reproduce items where third-party owned material protected by copyright is included has been sought and cleared where possible. Every reasonable effort has been made by the publisher (UCLES) to trace copyright holders, but if any items requiring clearance have unwittingly been included, the publisher will be pleased to make amends at the earliest possible opportunity. To avoid the issue of disclosure of answer-related information to candidates, all copyright acknowledgements are reproduced online in the Cambridge Assessment International Education Copyright Acknowledgements Booklet. This is produced for each series of examinations and is freely available to download at www.cambridgeinternational.org after the live examination series. Cambridge Assessment International Education is part of the Cambridge Assessment Group. Cambridge Assessment is the brand name of the University of Cambridge Local Examinations Syndicate (UCLES), which itself is a department of the University of Cambridge. © UCLES 2020 9708/32/M/J/20 BLANK PAGE
Mark scheme, page 1
This document consists of 3 printed pages. © UCLES 2020 [Turn over Cambridge International AS & A Level ECONOMICS 9708/32 Paper 3 Multiple Choice May/June 2020 MARK SCHEME Maximum Mark: 30 Published Students did not sit exam papers in the June 2020 series due to the Covid-19 global pandemic. This mark scheme is published to support teachers and students and should be read together with the question paper. It shows the requirements of the exam. Mark schemes should usually be read together with the Principal Examiner Report for Teachers. However, because students did not sit exam papers, there is no Principal Examiner Report for Teachers for the June 2020 series. Cambridge International will not enter into discussions about these mark schemes. Cambridge International is publishing the mark schemes for the June 2020 series for most Cambridge IGCSE™ and Cambridge International A & AS Level components, and some Cambridge O Level components.
Mark scheme, page 2
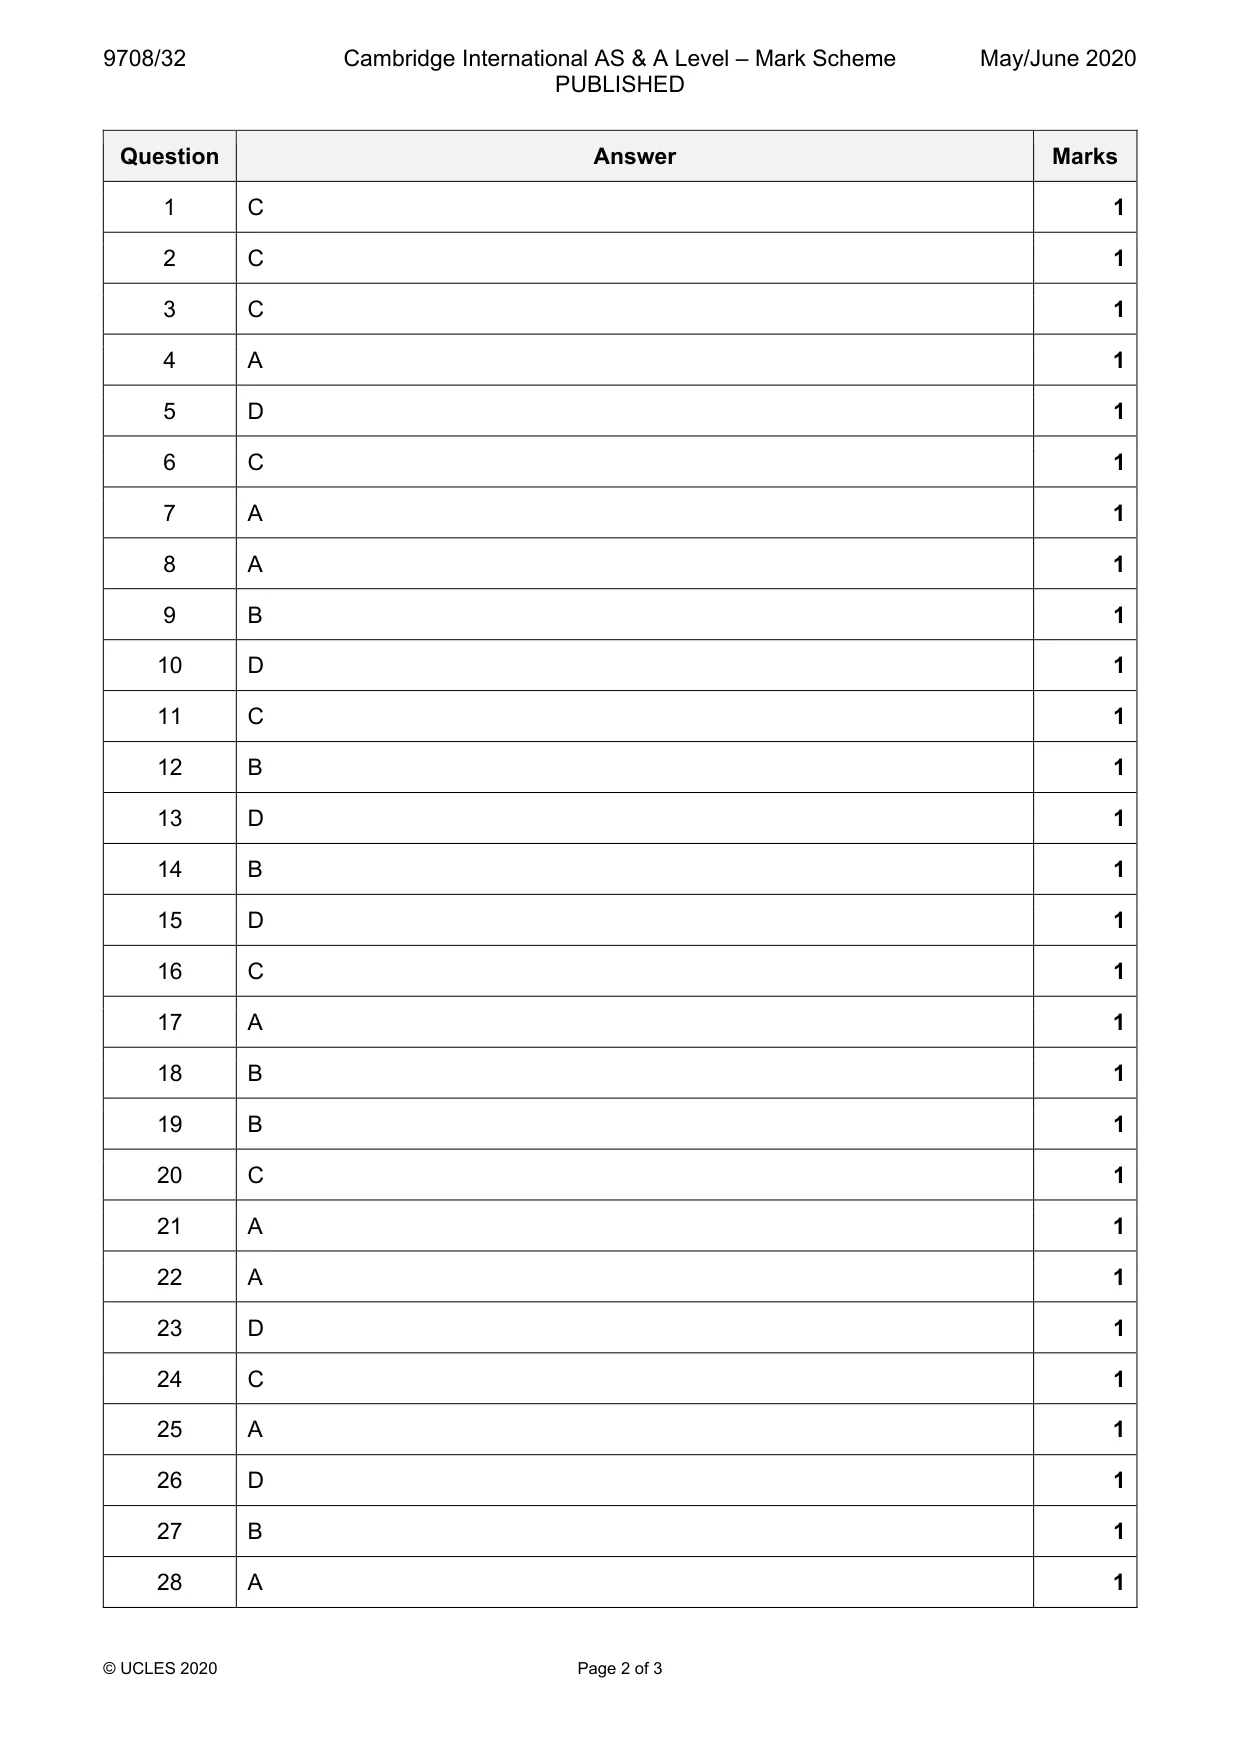
9708/32 Cambridge International AS & A Level – Mark Scheme PUBLISHED May/June 2020 © UCLES 2020 Page 2 of 3 Question Answer Marks 1 C 1 2 C 1 3 C 1 4 A 1 5 D 1 6 C 1 7 A 1 8 A 1 9 B 1 10 D 1 11 C 1 12 B 1 13 D 1 14 B 1 15 D 1 16 C 1 17 A 1 18 B 1 19 B 1 20 C 1 21 A 1 22 A 1 23 D 1 24 C 1 25 A 1 26 D 1 27 B 1 28 A 1
Mark scheme, page 3
9708/32 Cambridge International AS & A Level – Mark Scheme PUBLISHED May/June 2020 © UCLES 2020 Page 3 of 3 Question Answer Marks 29 A 1 30 B 1