Cambridge A Level Chemistry 9701 — 2018 May/June Paper 3 · Variant 4
9701/34/M/J/18 · 2 questions · 40 marks · ≈45 min
The question paper and its mark scheme, free to read here and free to download. This is Cambridge’s own paper, exactly as it was sat.
Question paper12 pages

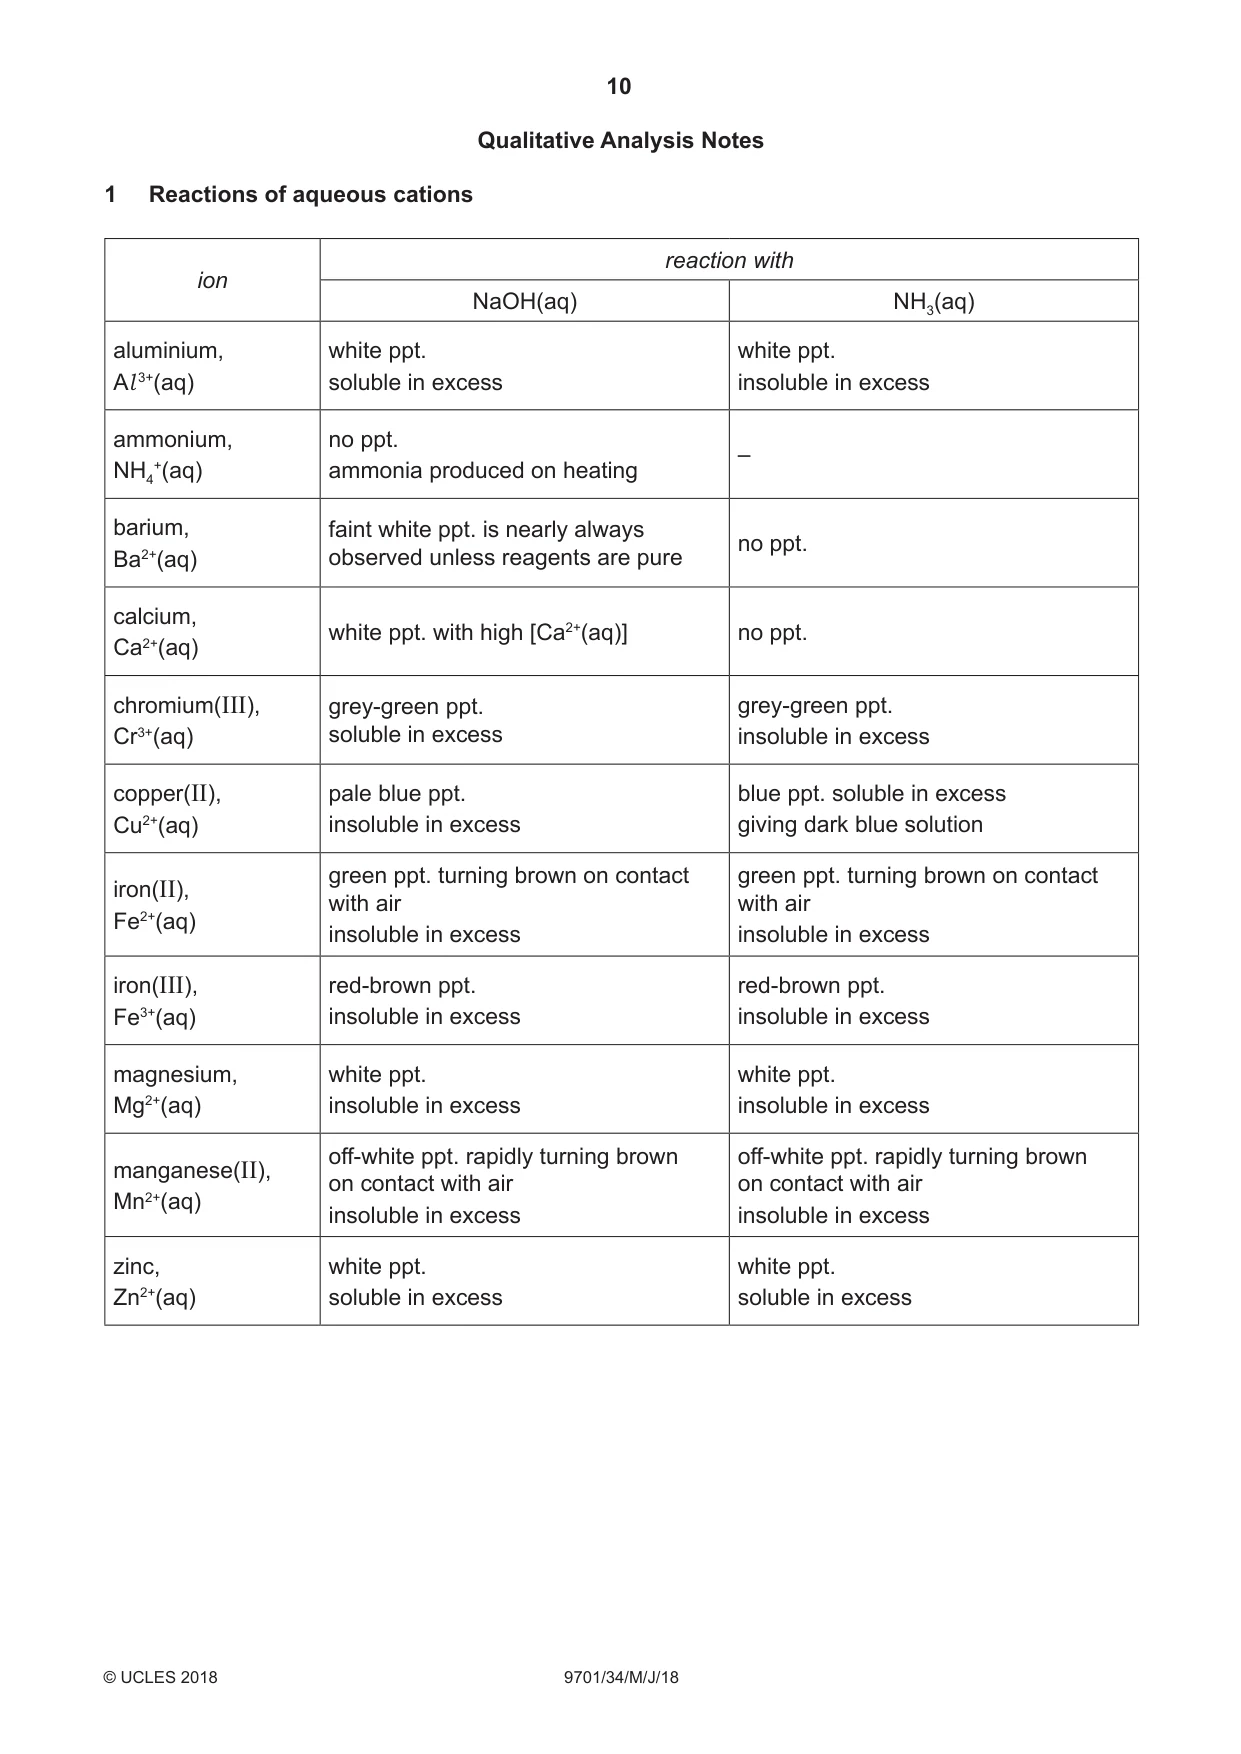
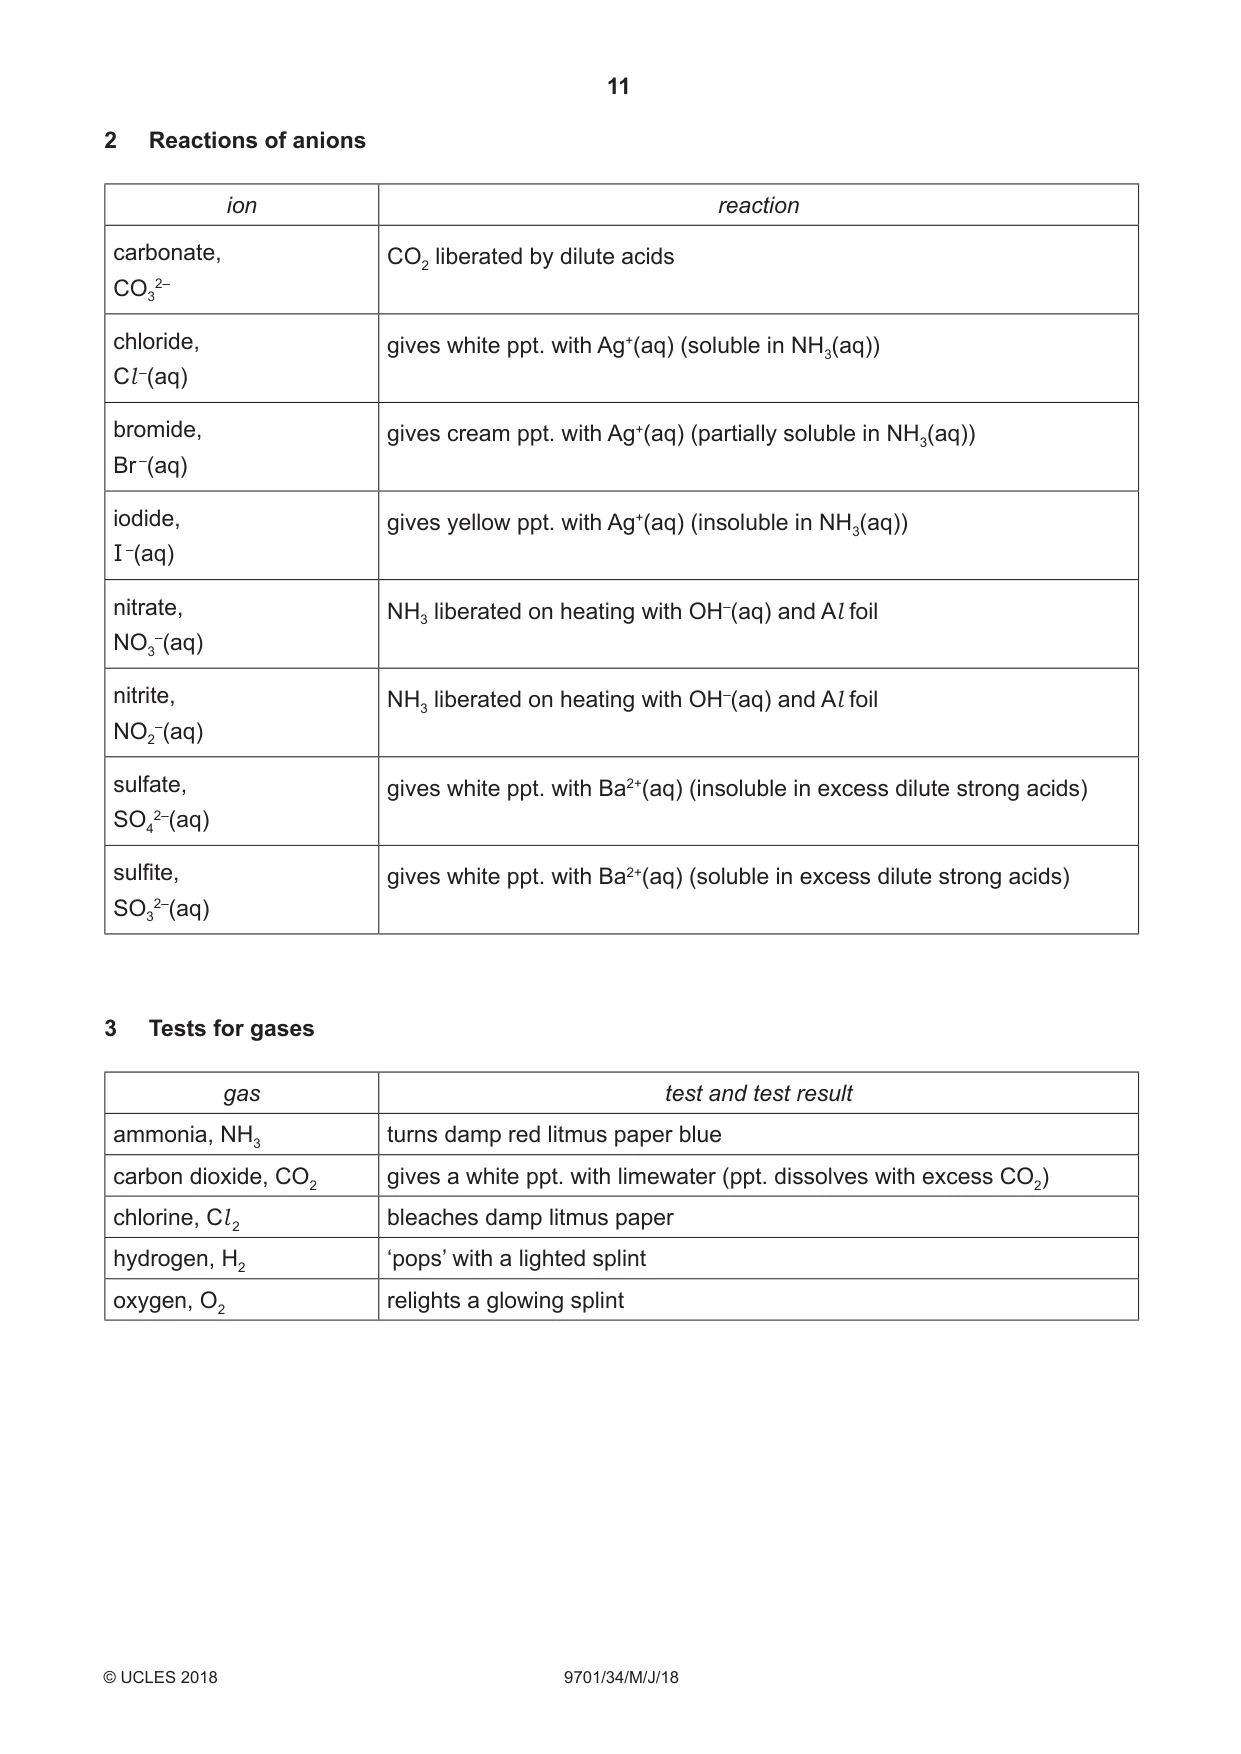
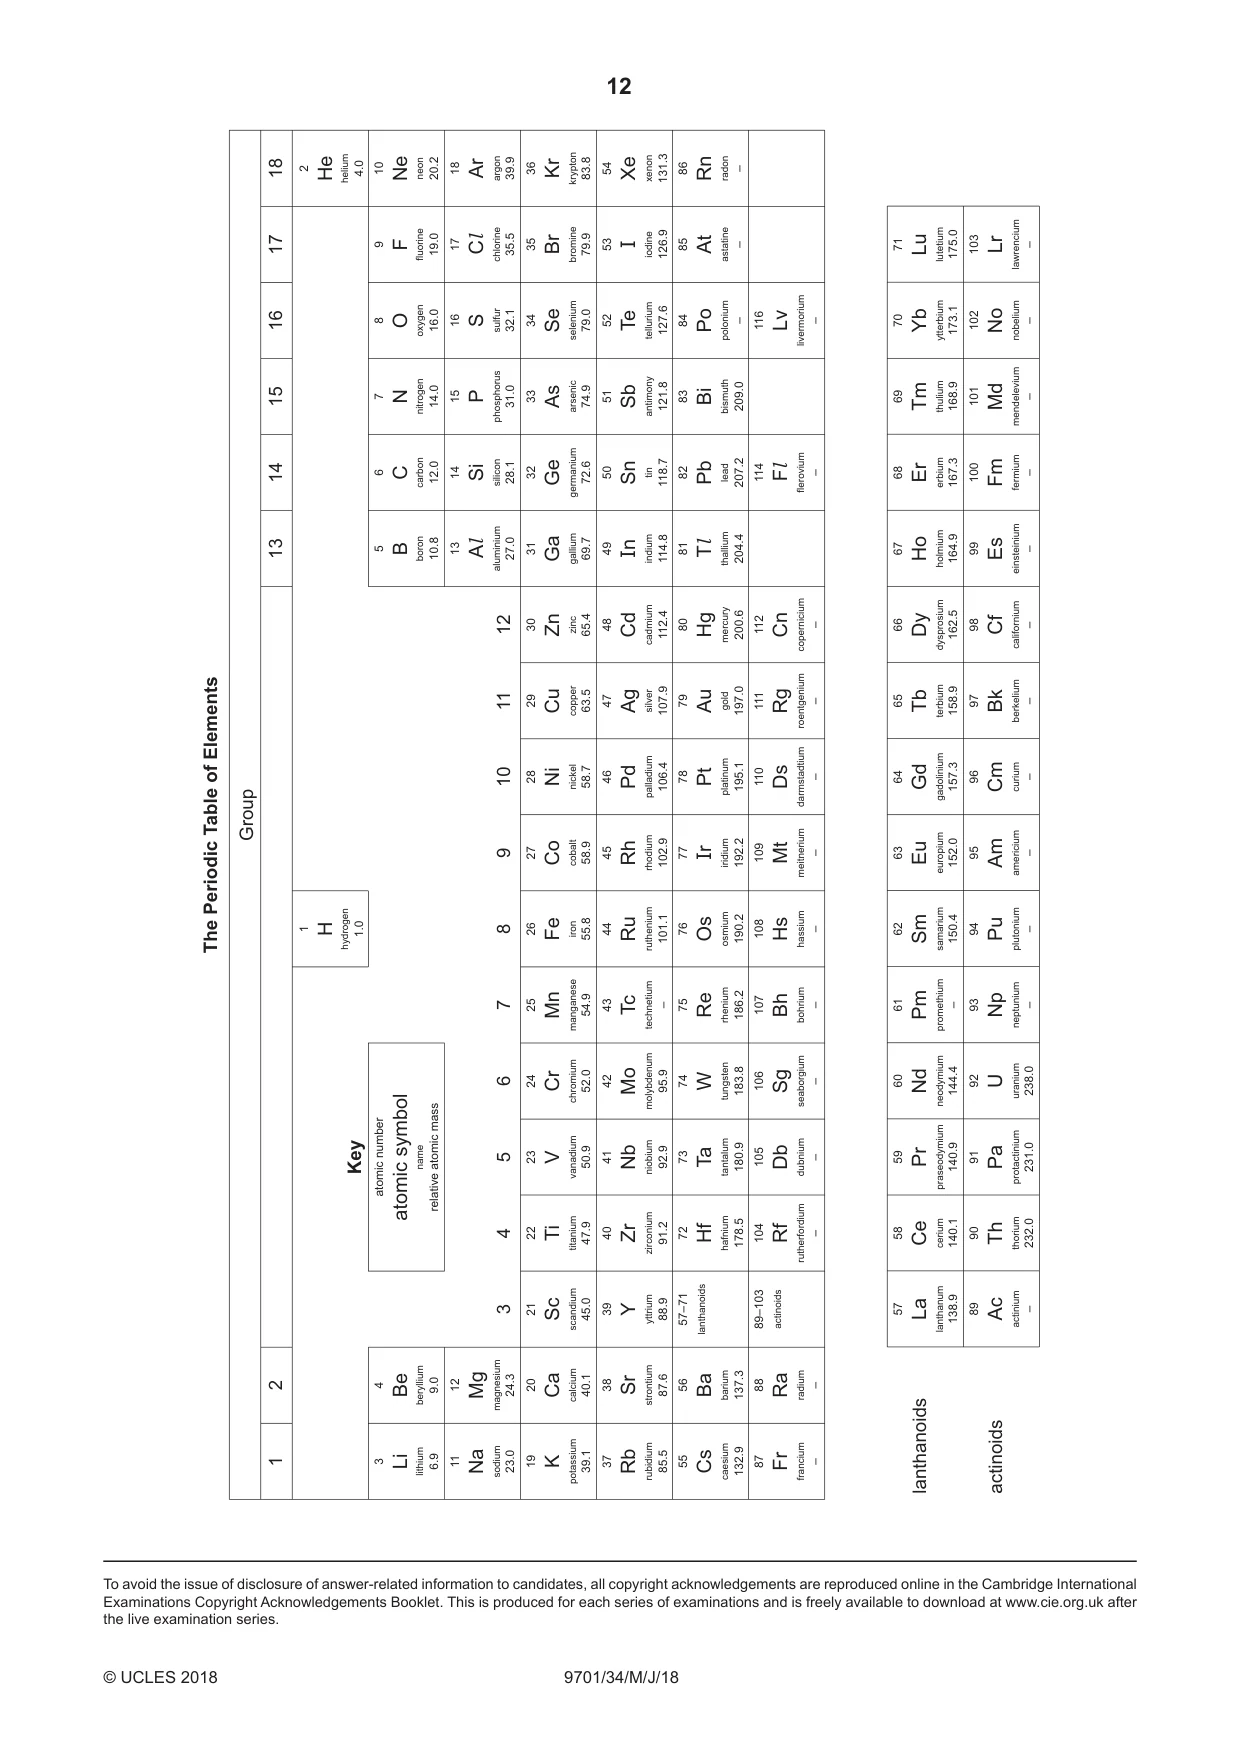
Mark scheme10 pages
Answers below. Sit the paper first if you are practising.
Questions as text
Q1 · Glucose, C6H12O6, is a sugar that can act as a reducing agent
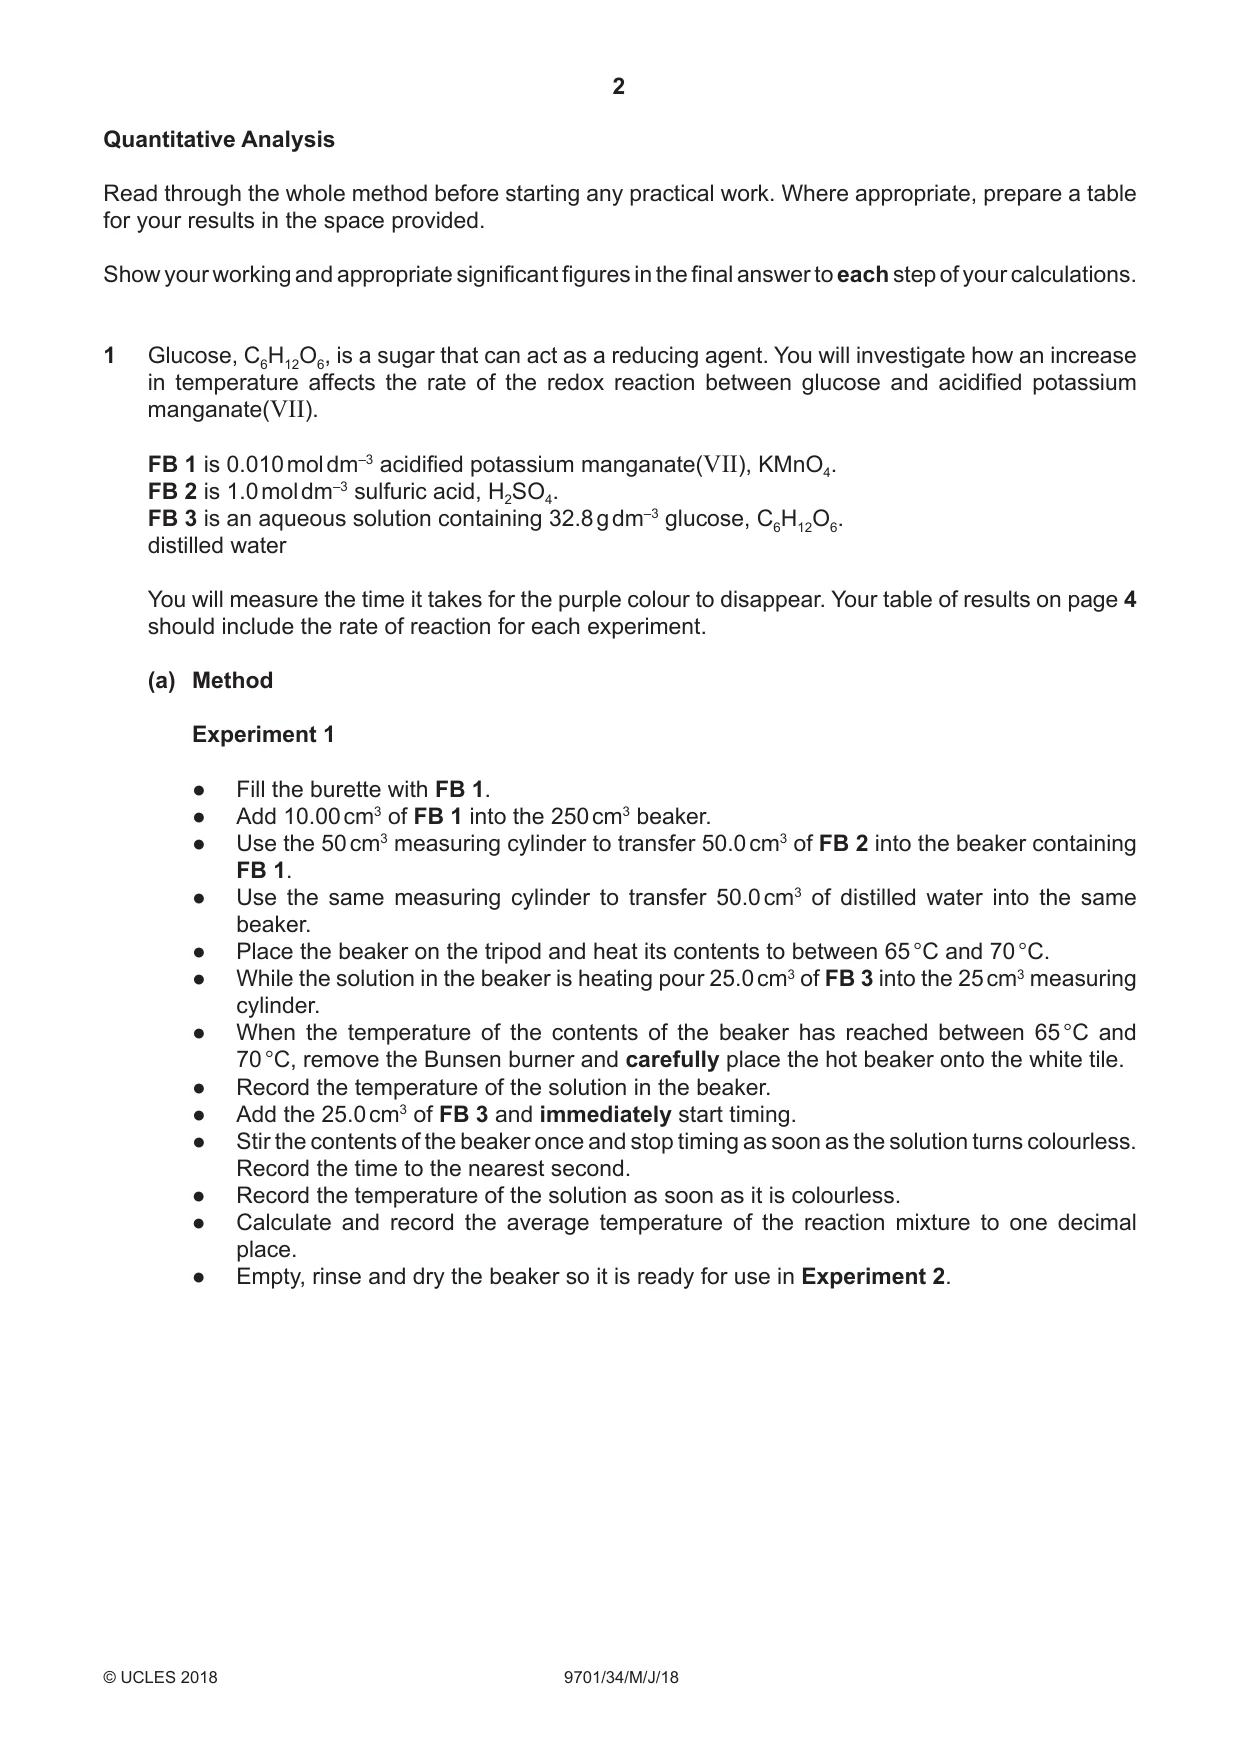
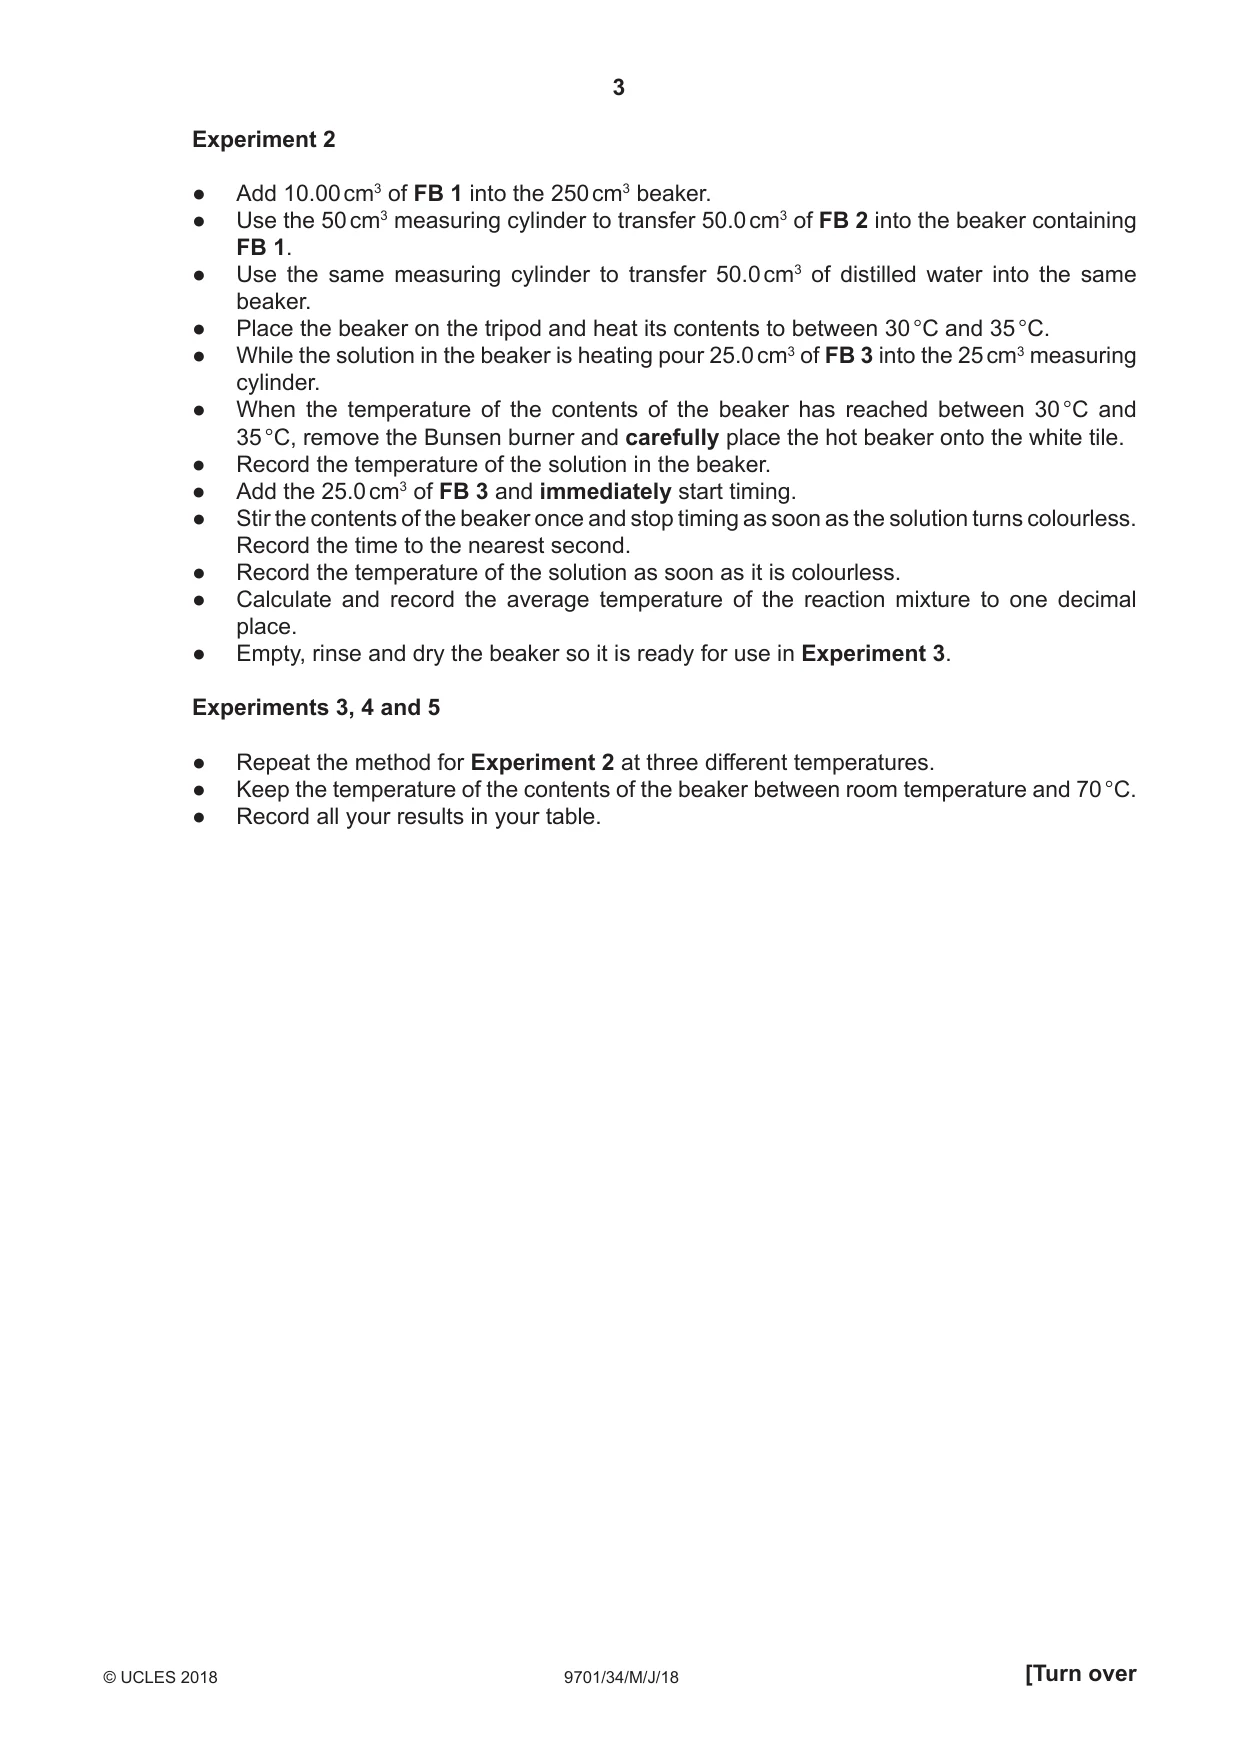
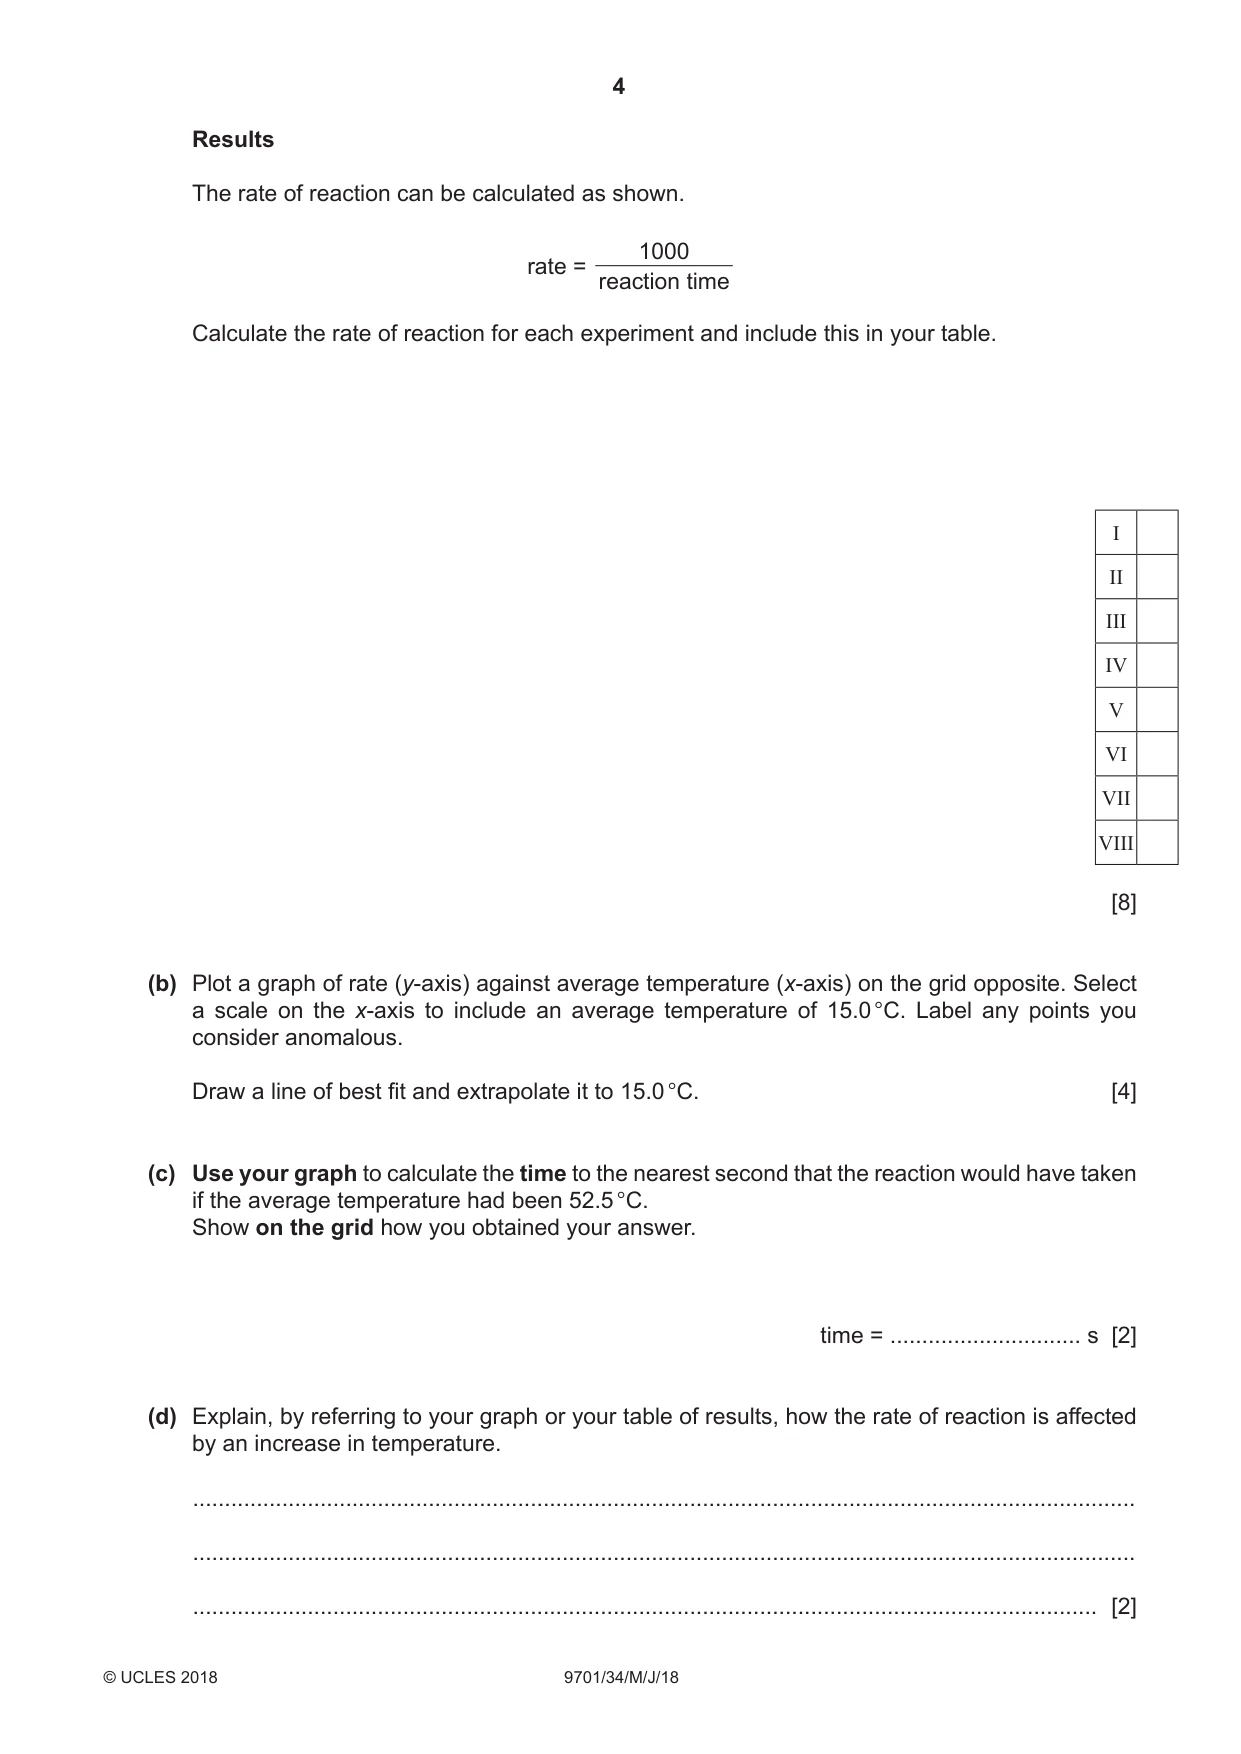
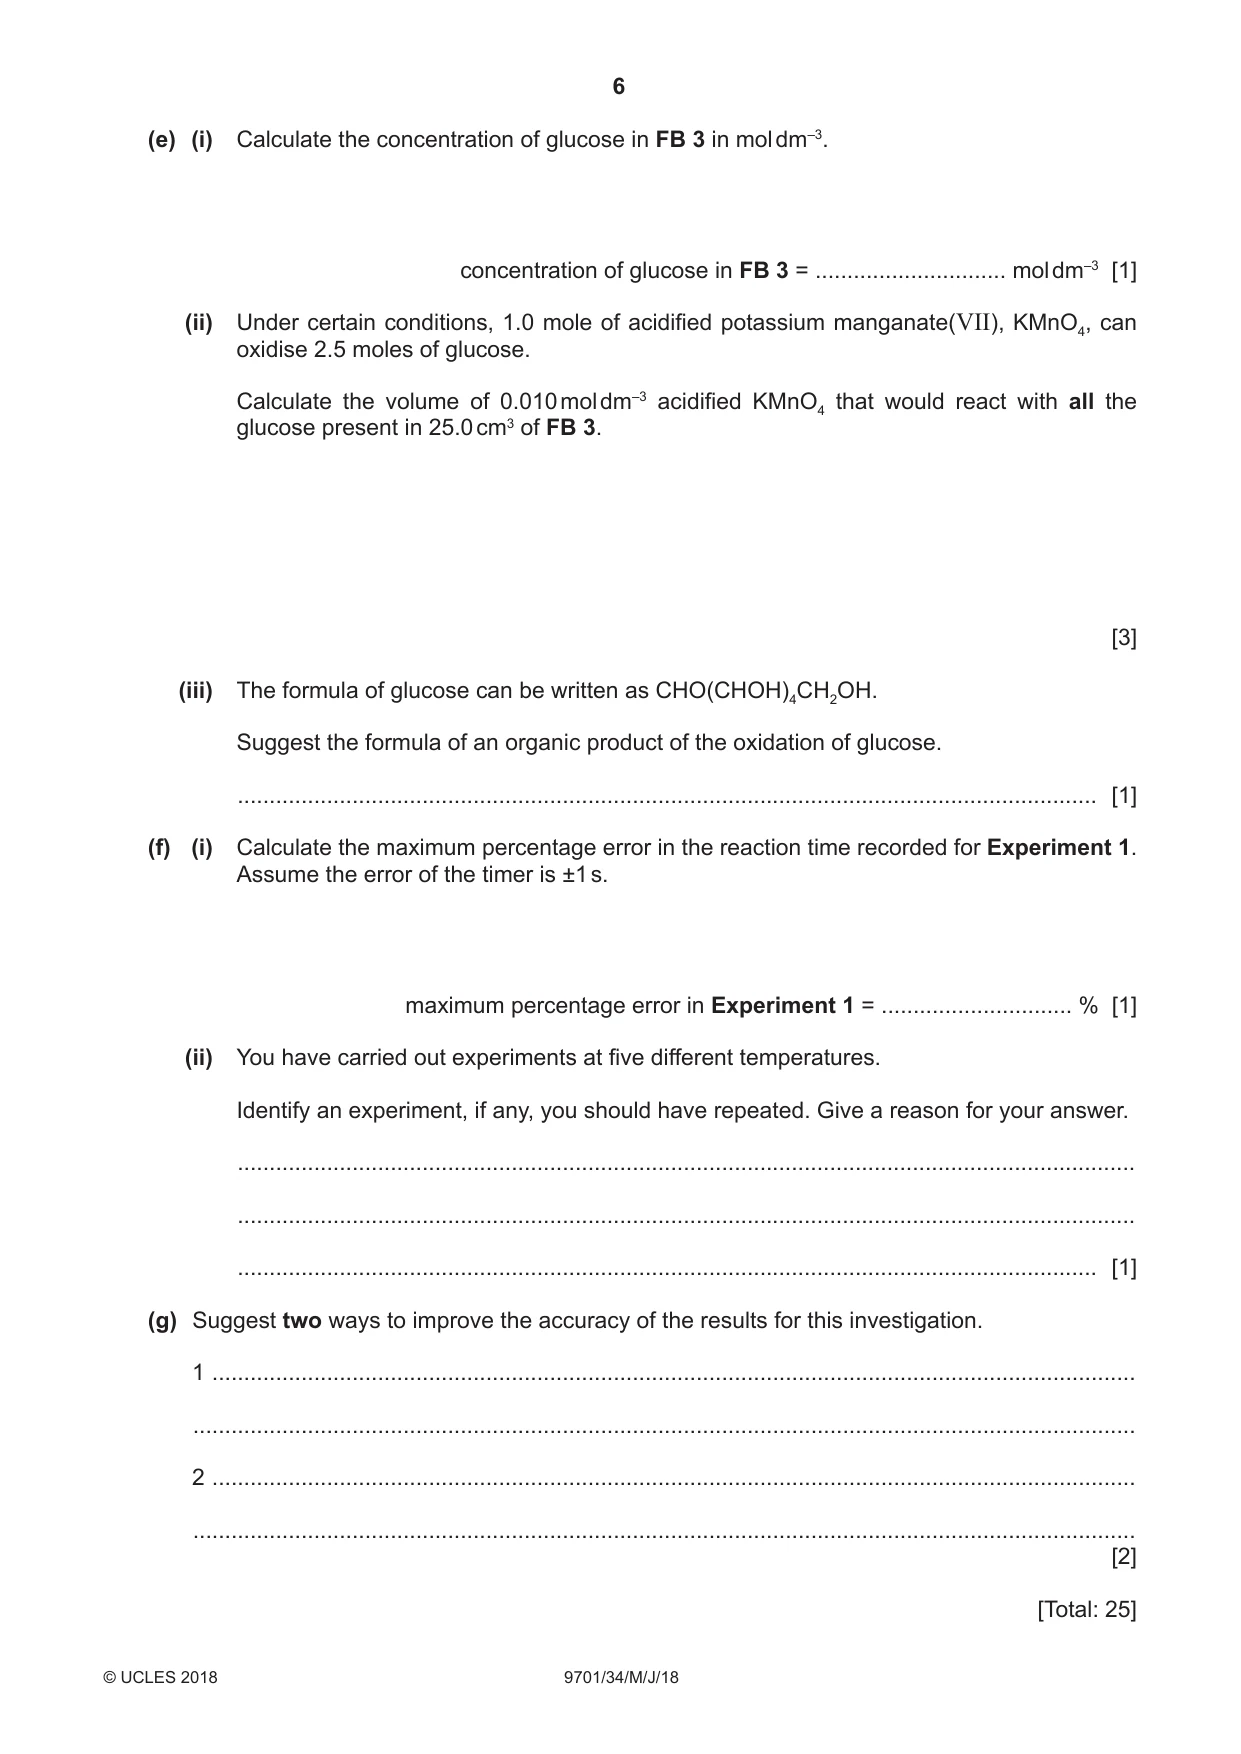
1 Glucose, C6H12O6, is a sugar that can act as a reducing agent. You will investigate how an increase in temperature affects the rate of the redox reaction between glucose and acidified potassium manganate(VII). FB 1 is 0.010 mol dm–3 acidified potassium manganate(VII), KMnO4. FB 2 is 1.0 mol dm–3 sulfuric acid, H2SO4. FB 3 is an aqueous solution containing 32.8 g dm–3 glucose, C6H12O6. distilled water You will measure the time it takes for the purple colour to disappear. Your table of results on page 4 should include the rate of reaction for each experiment. (a) Method Experiment 1 ● Fill the burette with FB 1. ● Add 10.00 cm3 of FB 1 into the 250 cm3 beaker. ● Use the 50 cm3 measuring cylinder to transfer 50.0 cm3 of FB 2 into the beaker containing FB 1. ● Use the same measuring cylinder to transfer 50.0 cm3 of distilled water into the same beaker. ● Place the beaker on the tripod and heat its contents to between 65 °C and 70 °C. ● While the solution in the beaker is heating pour 25.0 cm3 of FB 3 into the 25 cm3 measuring cylinder. ● When the temperature of the contents of the beaker has reached between 65 °C and 70 °C, remove the Bunsen burner and carefully place the hot beaker onto the white tile. ● Record the temperature of the solution in the beaker. ● Add the 25.0 cm3 of FB 3 and immediately start timing. ● Stir the contents of the beaker once and stop timing as soon as the solution turns colourless. Record the time to the nearest second. ● Record the temperature of the solution as soon as it is colourless. ● Calculate and record the average temperature of the reaction mixture to one decimal place. ● Empty, rinse and dry the beaker so it is ready for use in Experiment 2. Experiment 2 ● Add 10.00 cm3 of FB 1 into the 250 cm3 beaker. ● Use the 50 cm3 measuring cylinder to transfer 50.0 cm3 of FB 2 into the beaker containing FB 1. ● Use the same measuring cylinder to transfer 50.0 cm3 of distilled water into the same beaker. ● Place the beaker on the tripod and heat its contents to between 30 °C and 35 °C. ● While the solution in the beaker is heating pour 25.0 cm3 of FB 3 into the 25 cm3 measuring cylinder. ● When the temperature of the contents of the beaker has reached between 30 °C and 35 °C, remove the Bunsen burner and carefully place the hot beaker onto the white tile. ● Record the temperature of the solution in the beaker. ● Add the 25.0 cm3 of FB 3 and immediately start timing. ● Stir the contents of the beaker once and stop timing as soon as the solution turns colourless. Record the time to the nearest second. ● Record the temperature of the solution as soon as it is colourless. ● Calculate and record the average temperature of the reaction mixture to one decimal place. ● Empty, rinse and dry the beaker so it is ready for use in Experiment 3. Experiments 3, 4 and 5 ● Repeat the method for Experiment 2 at three different temperatures. ● Keep the temperature of the contents of the beaker between room temperature and 70 °C. ● Record all your results in your table. Results The rate of reaction can be calculated as shown. 1000 rate = reaction time Calculate the rate of reaction for each experiment and include this in your table. I II III IV V VI VII VIII [8] (b) Plot a graph of rate (y-axis) against average temperature (x-axis) on the grid opposite. Select a scale on the x-axis to include an average temperature of 15.0 °C. Label any points you consider anomalous. Draw a line of best fit and extrapolate it to 15.0 °C. [4] (c) Use your graph to calculate the time to the nearest second that the reaction would have taken if the average temperature had been 52.5 °C. Show on the grid how you obtained your answer. time = .............................. s [2] (d) Explain, by referring to your graph or your table of results, how the rate of reaction is affected by an increase in temperature. .................................................................................................................................................... .................................................................................................................................................... .............................................................................................................................................. [2] (e) (i) Calculate the concentration of glucose in FB 3 in mol dm–3. concentration of glucose in FB 3 = .............................. mol dm–3 [1] (ii) Under certain conditions, 1.0 mole of acidified potassium manganate(VII), KMnO4, can oxidise 2.5 moles of glucose. Calculate the volume of 0.010 mol dm–3 acidified KMnO4 that would react with all the glucose present in 25.0 cm3 of FB 3. [3] (iii) The formula of glucose can be written as CHO(CHOH)4CH2OH. Suggest the formula of an organic product of the oxidation of glucose. ....................................................................................................................................... [1] (f) (i) Calculate the maximum percentage error in the reaction time recorded for Experiment 1. Assume the error of the timer is ±1 s. maximum percentage error in Experiment 1 = .............................. % [1] (ii) You have carried out experiments at five different temperatures. Identify an experiment, if any, you should have repeated. Give a reason for your answer. ............................................................................................................................................. ............................................................................................................................................. ....................................................................................................................................... [1] (g) Suggest two ways to improve the accuracy of the results for this investigation. 1 ................................................................................................................................................. .................................................................................................................................................... 2 ................................................................................................................................................. .................................................................................................................................................... [2] [Total: 25] Qualitative Analysis Where reagents are selected for use in a test, the name or correct formula of the element or compound must be given. At each stage of any test you are to record details of the following: ● colour changes seen; ● the formation of any precipitate and its solubility in an excess of the reagent added; ● the formation of any gas and its identification by a suitable test. You should indicate clearly at what stage in a test a change occurs. If any solution is warmed, a boiling tube must be used. Rinse and reuse test-tubes and boiling tubes where possible. No additional tests for ions present should be attempted.
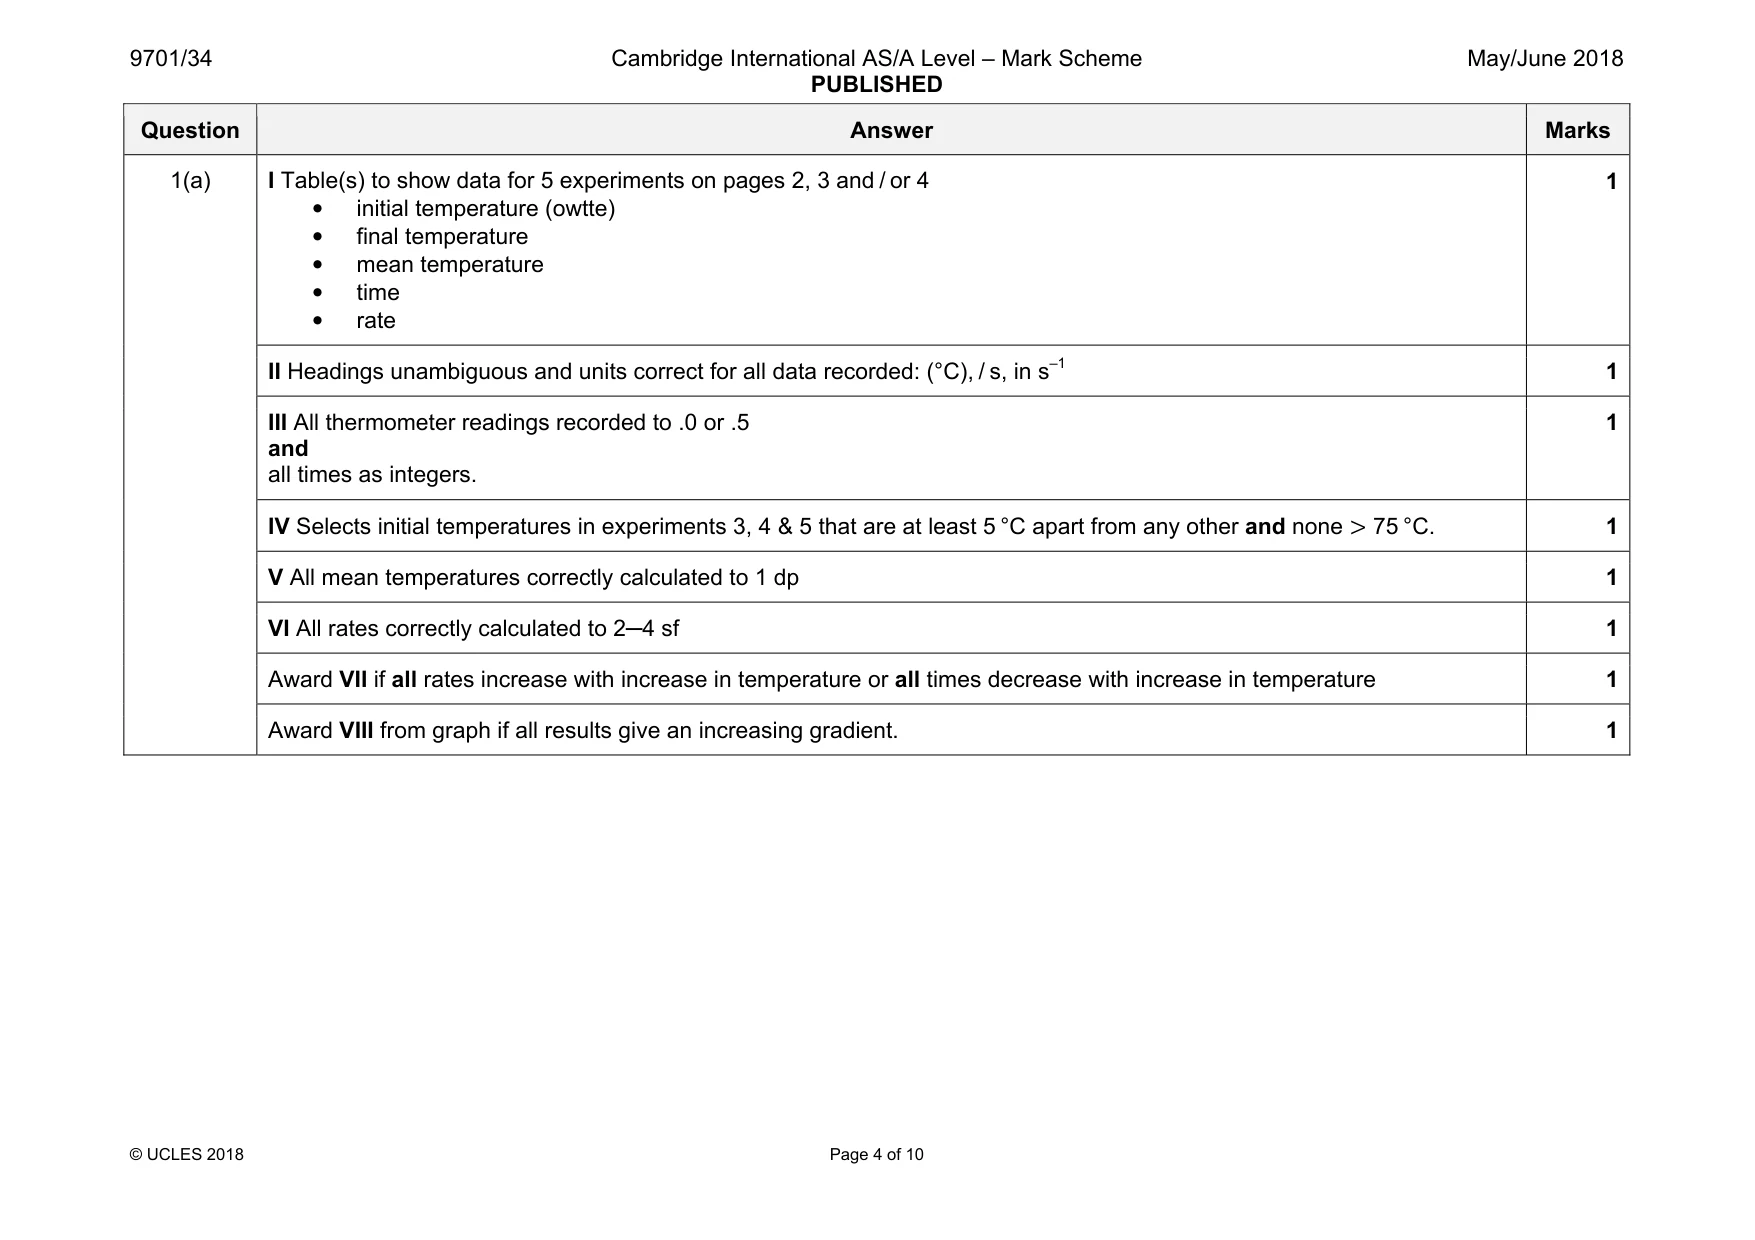
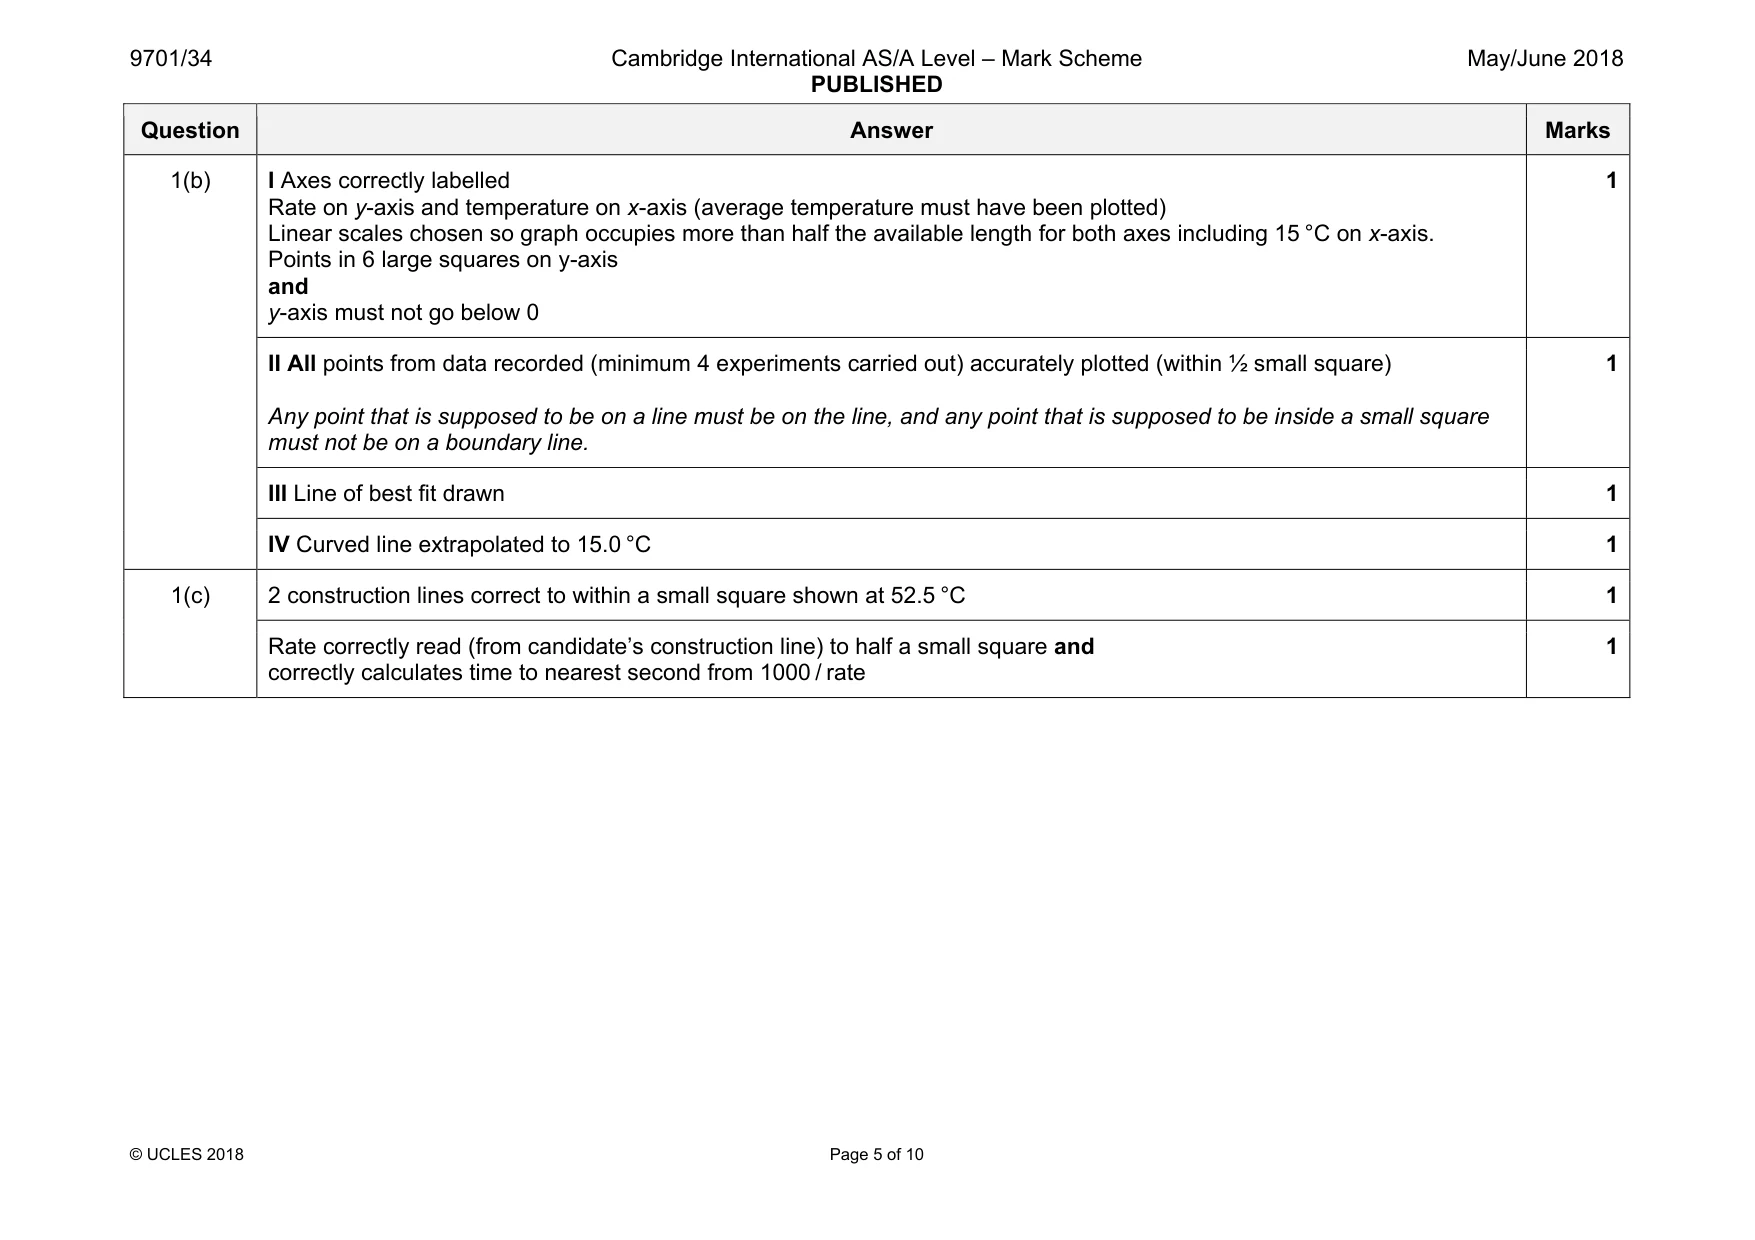
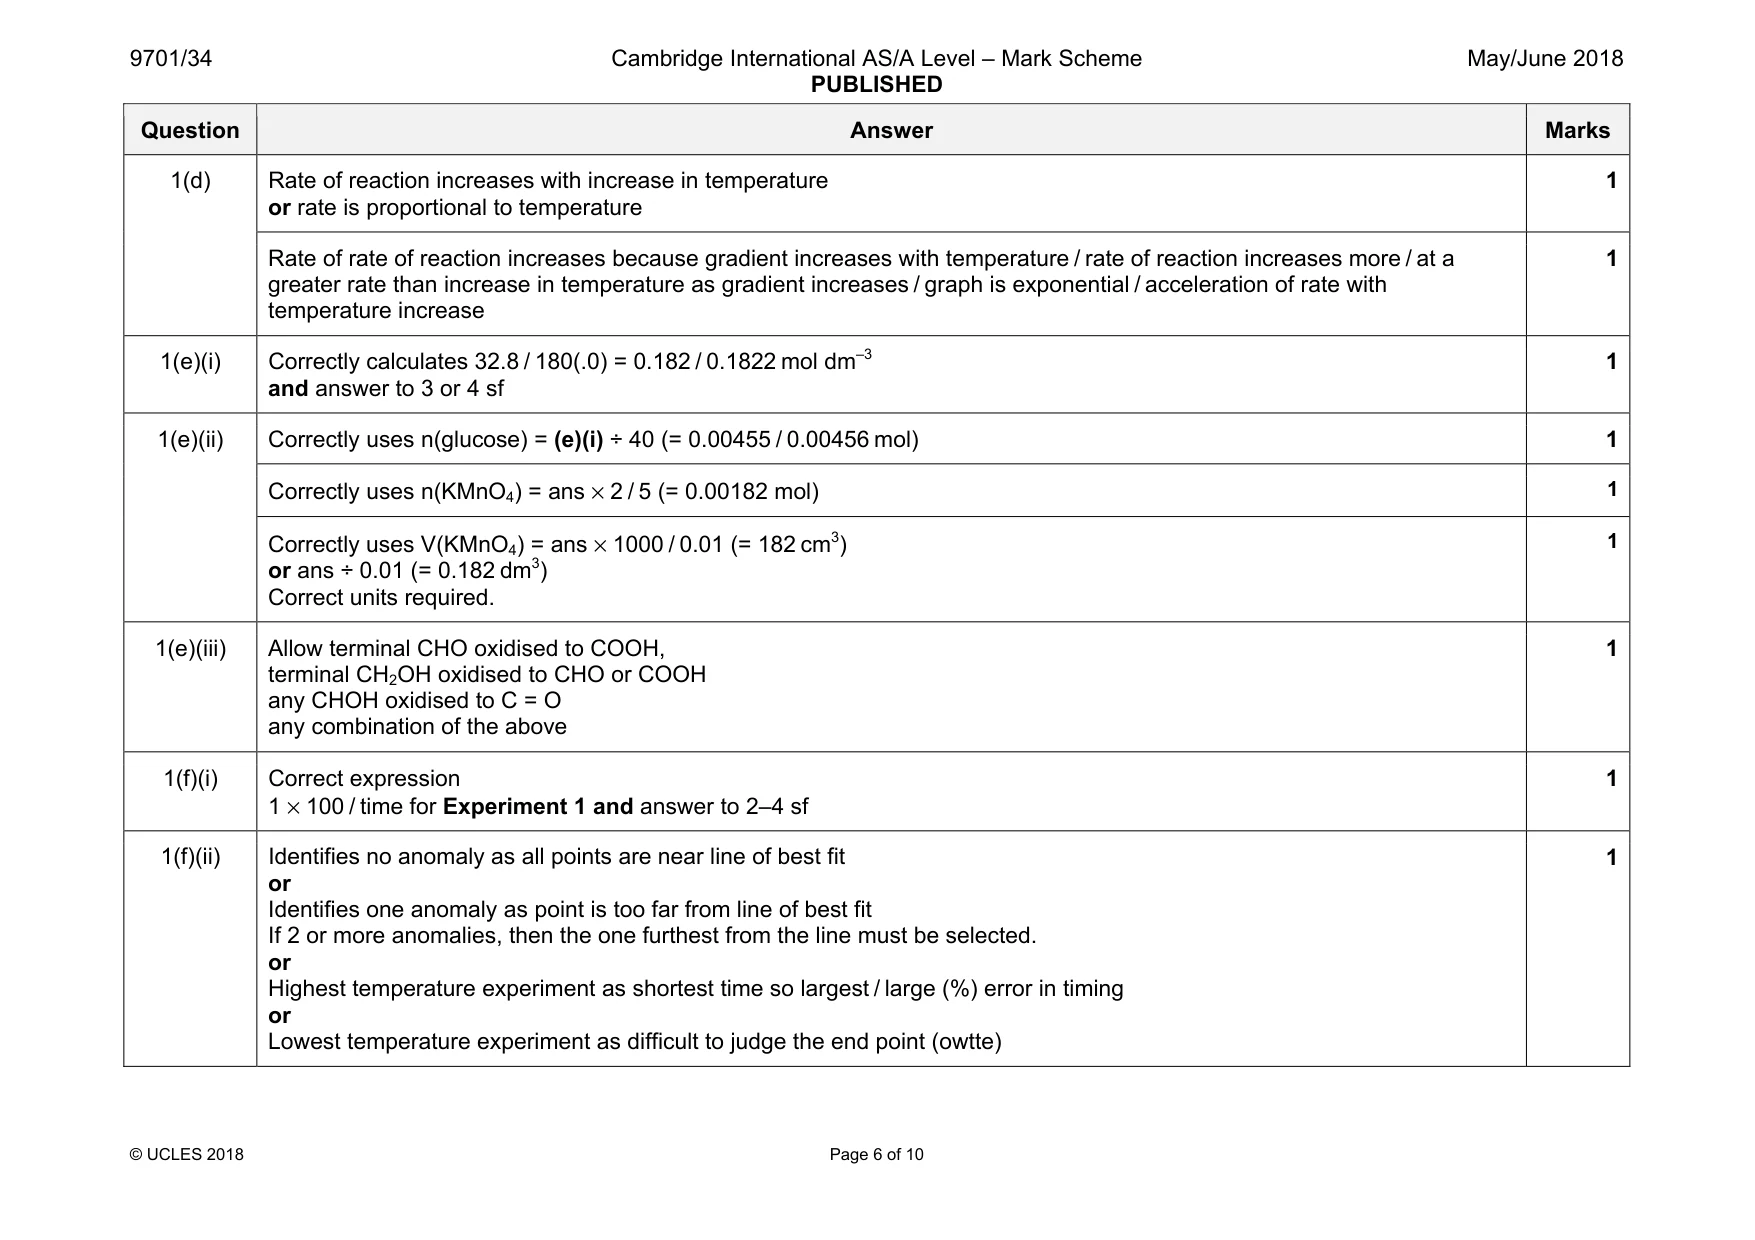
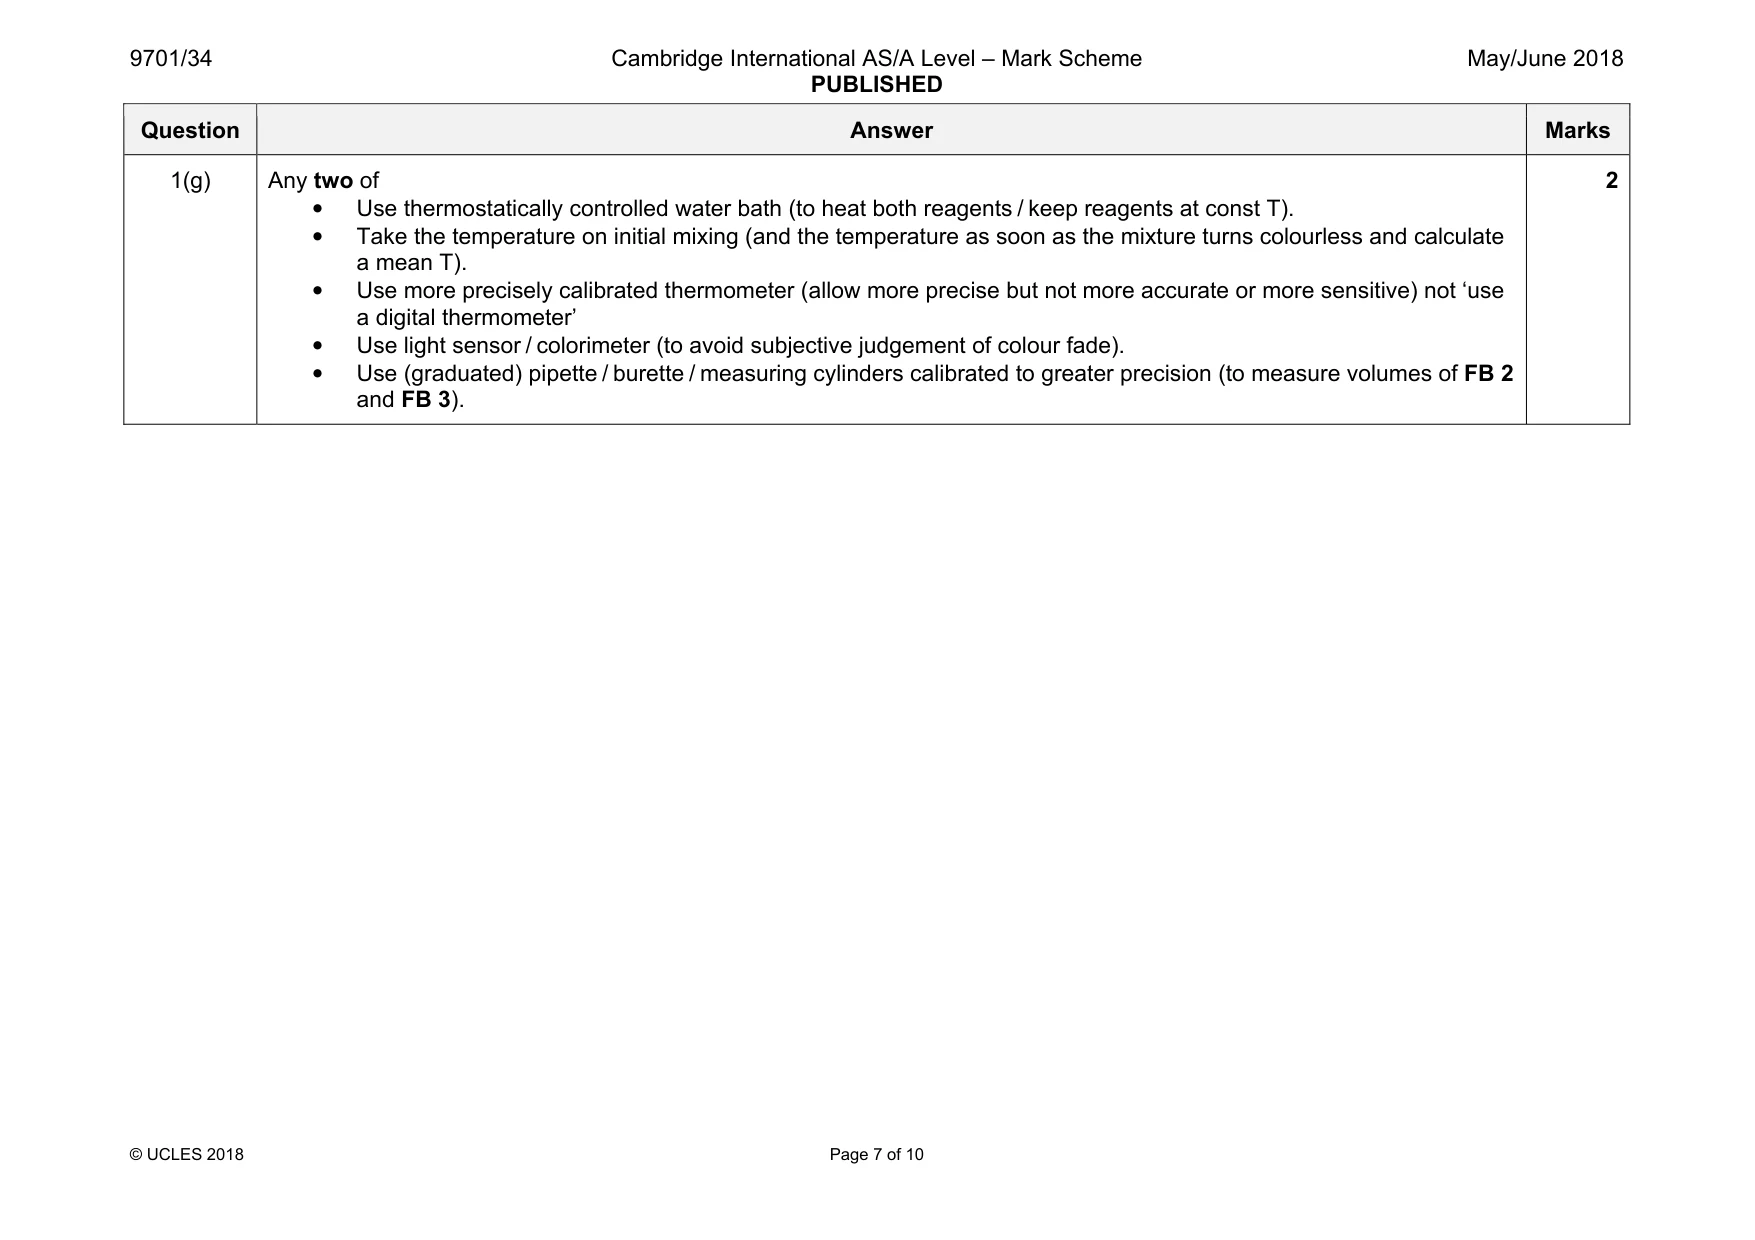
Mark scheme: 1(a) I Table(s) to show data for 5 experiments on pages 2, 3 and / or 4 • initial temperature (owtte) • final temperature • mean temperature • time • rate 1 II Headings unambiguous and units correct for all data recorded: (°C), / s, in s–1 1 III All thermometer readings recorded to .0 or .5 and all times as integers. 1 IV Selects initial temperatures in experiments 3, 4 & 5 that are at least 5 °C apart from any other and none > 75 °C. 1 V All mean temperatures correctly calculated to 1 dp 1 VI All rates correctly calculated to 2─4 sf 1 Award VII if all rates increase with increase in temperature or all times decrease with increase in temperature 1 Award VIII from graph if all results give an increasing gradient. 1 Question Answer Marks 1(b) I Axes correctly labelled Rate on y-axis and temperature on x-axis (average temperature must have been plotted) Linear scales chosen so graph occupies more than half the available length for both axes including 15 °C on x-axis. Points in 6 large squares on y-axis and y-axis must not go below 0 1 II All points from data recorded (minimum 4 experiments carried out) accurately plotted (within ½ small square) Any point that is supposed to be on a line must be on the line, and any point that is supposed to be inside a small square must not be on a boundary line. 1 III Line of best fit drawn 1 IV Curved line extrapolated to 15.0 °C 1 1(c) 2 construction lines correct to within a small square shown at 52.5 °C 1 Rate correctly read (from candidate’s construction line) to half a small square and correctly calculates time to nearest second from 1000 / rate 1 Question Answer Marks 1(d) Rate of reaction increases with increase in temperature or rate is proportional to temperature 1 Rate of rate of reaction increases because gradient increases with temperature / rate of reaction increases more / at a greater rate than increase in temperature as gradient increases / graph is exponential / acceleration of rate with temperature increase 1 1(e)(i) Correctly calculates 32.8 / 180(.0) = 0.182 / 0.1822 mol dm–3 and answer to 3 or 4 sf 1 1(e)(ii) Correctly uses n(glucose) = (e)(i) ÷ 40 (= 0.00455 / 0.00456 mol) 1 Correctly uses n(KMnO4) = ans × 2 / 5 (= 0.00182 mol) 1 Correctly uses V(KMnO4) = ans × 1000 / 0.01 (= 182 cm3) or ans ÷ 0.01 (= 0.182 dm3) Correct units required. 1 1(e)(iii) Allow terminal CHO oxidised to COOH, terminal CH2OH oxidised to CHO or COOH any CHOH oxidised to C = O any combination of the above 1 1(f)(i) Correct expression 1 × 100 / time for Experiment 1 and answer to 2–4 sf 1 1(f)(ii) Identifies no anomaly as all points are near line of best fit or Identifies one anomaly as point is too far from line of best fit If 2 or more anomalies, then the one furthest from the line must be selected. or Highest temperature experiment as shortest time so largest / large (%) error in timing or Lowest temperature experiment as difficult to judge the end point (owtte) 1 Question Answer Marks 1(g) Any two of • Use thermostatically controlled water bath (to heat both reagents / keep reagents at const T). • Take the temperature on initial mixing (and the temperature as soon as the mixture turns colourless and calculate a mean T). • Use more precisely calibrated thermometer (allow more precise but not more accurate or more sensitive) not ‘use a digital thermometer’ • Use light sensor / colorimeter (to avoid subjective judgement of colour fade). • Use (graduated) pipette / burette / measuring cylinders calibrated to greater precision (to measure volumes of FB 2 and FB 3). 2
Q2 · Sandell’s solution reacts in a similar way to Fehling’s reagent
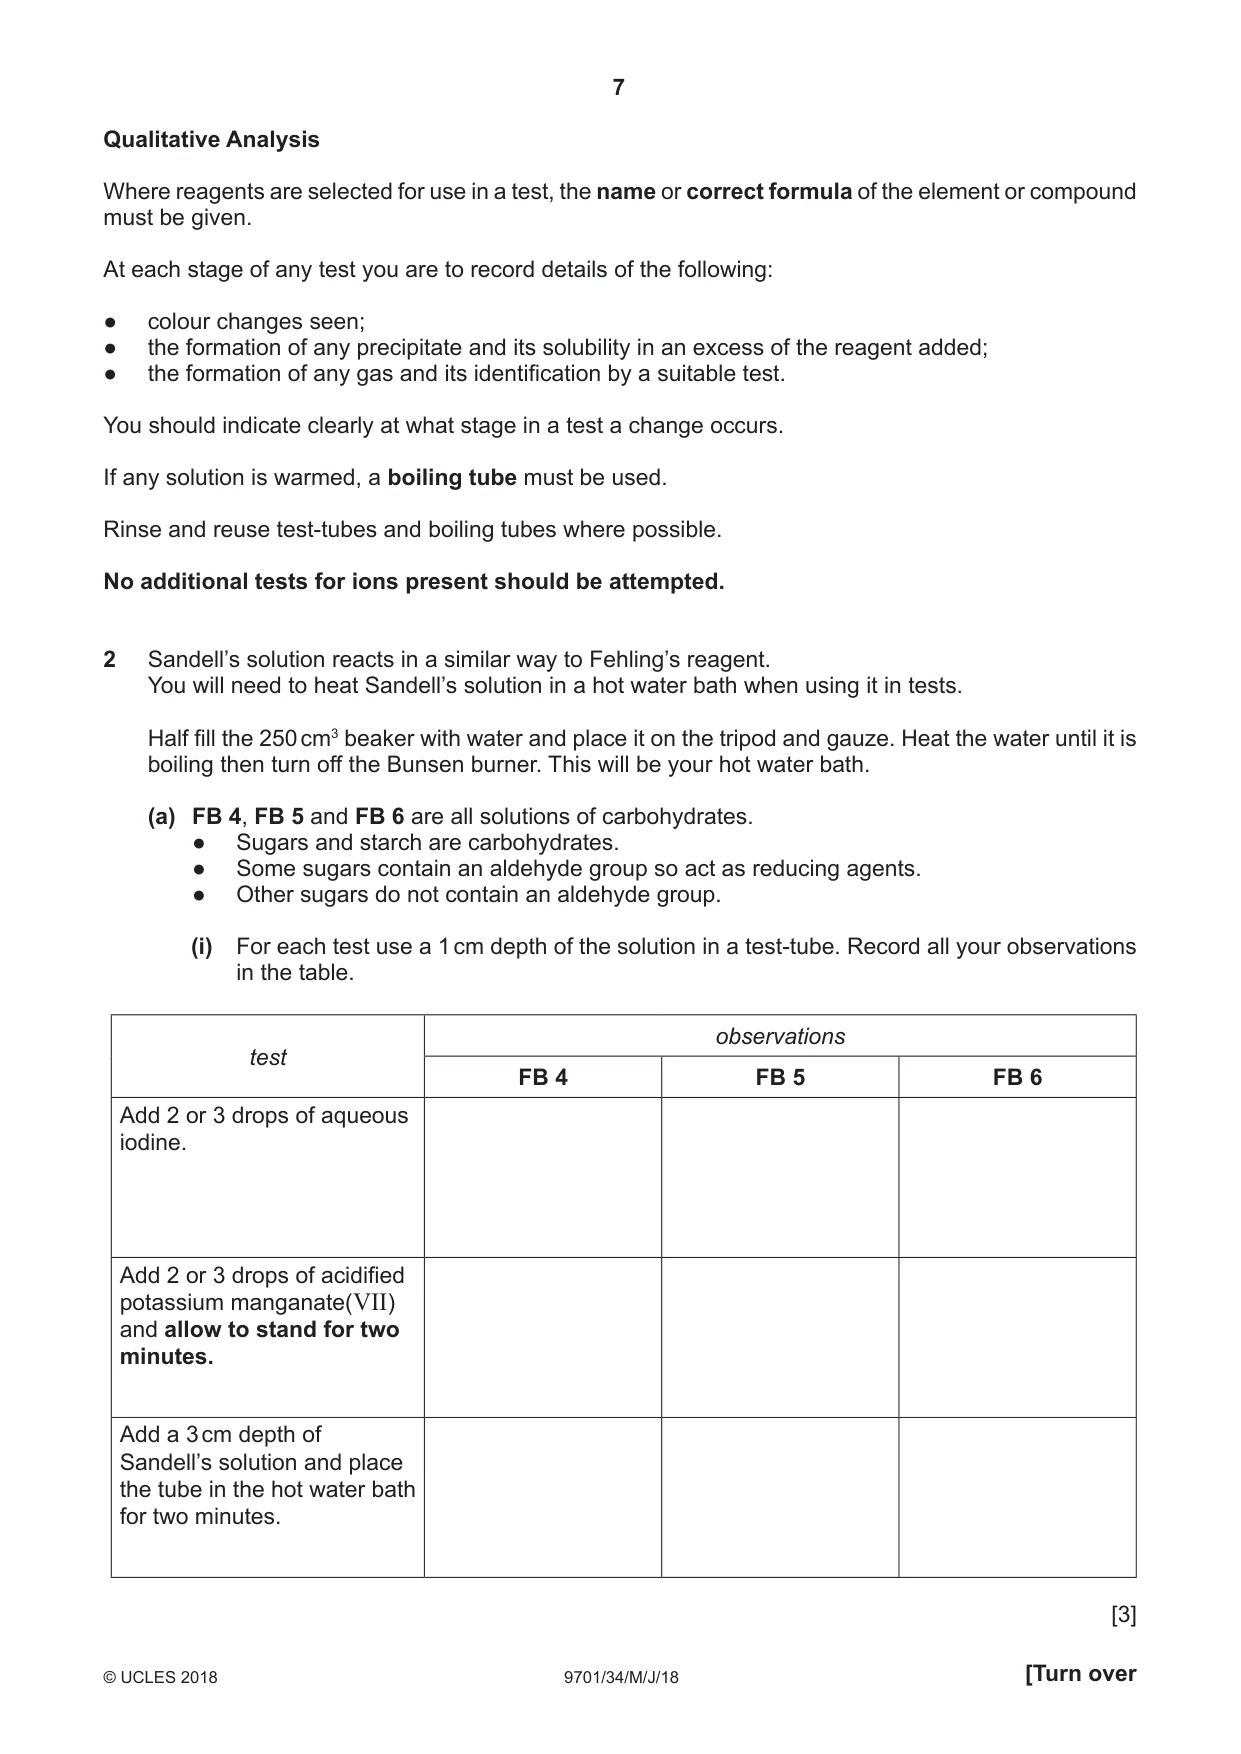
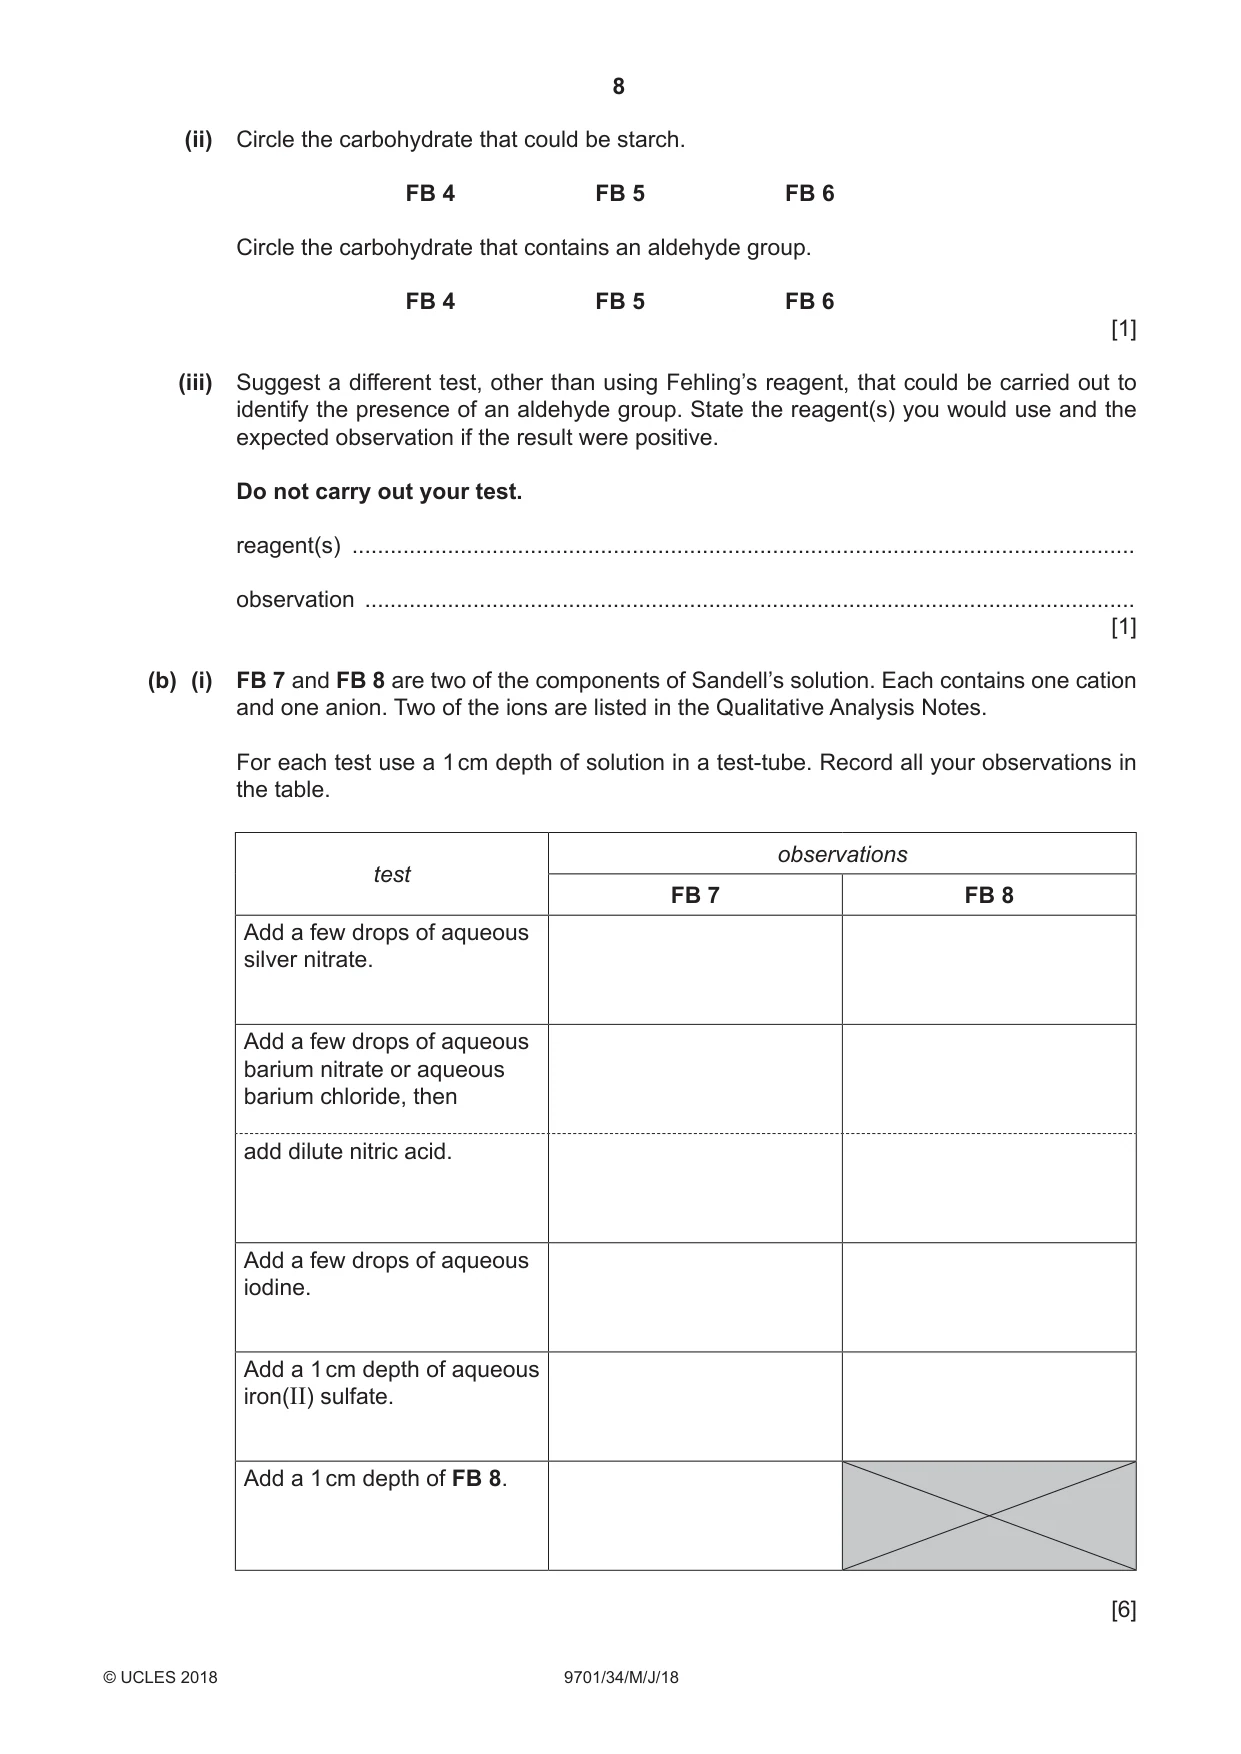
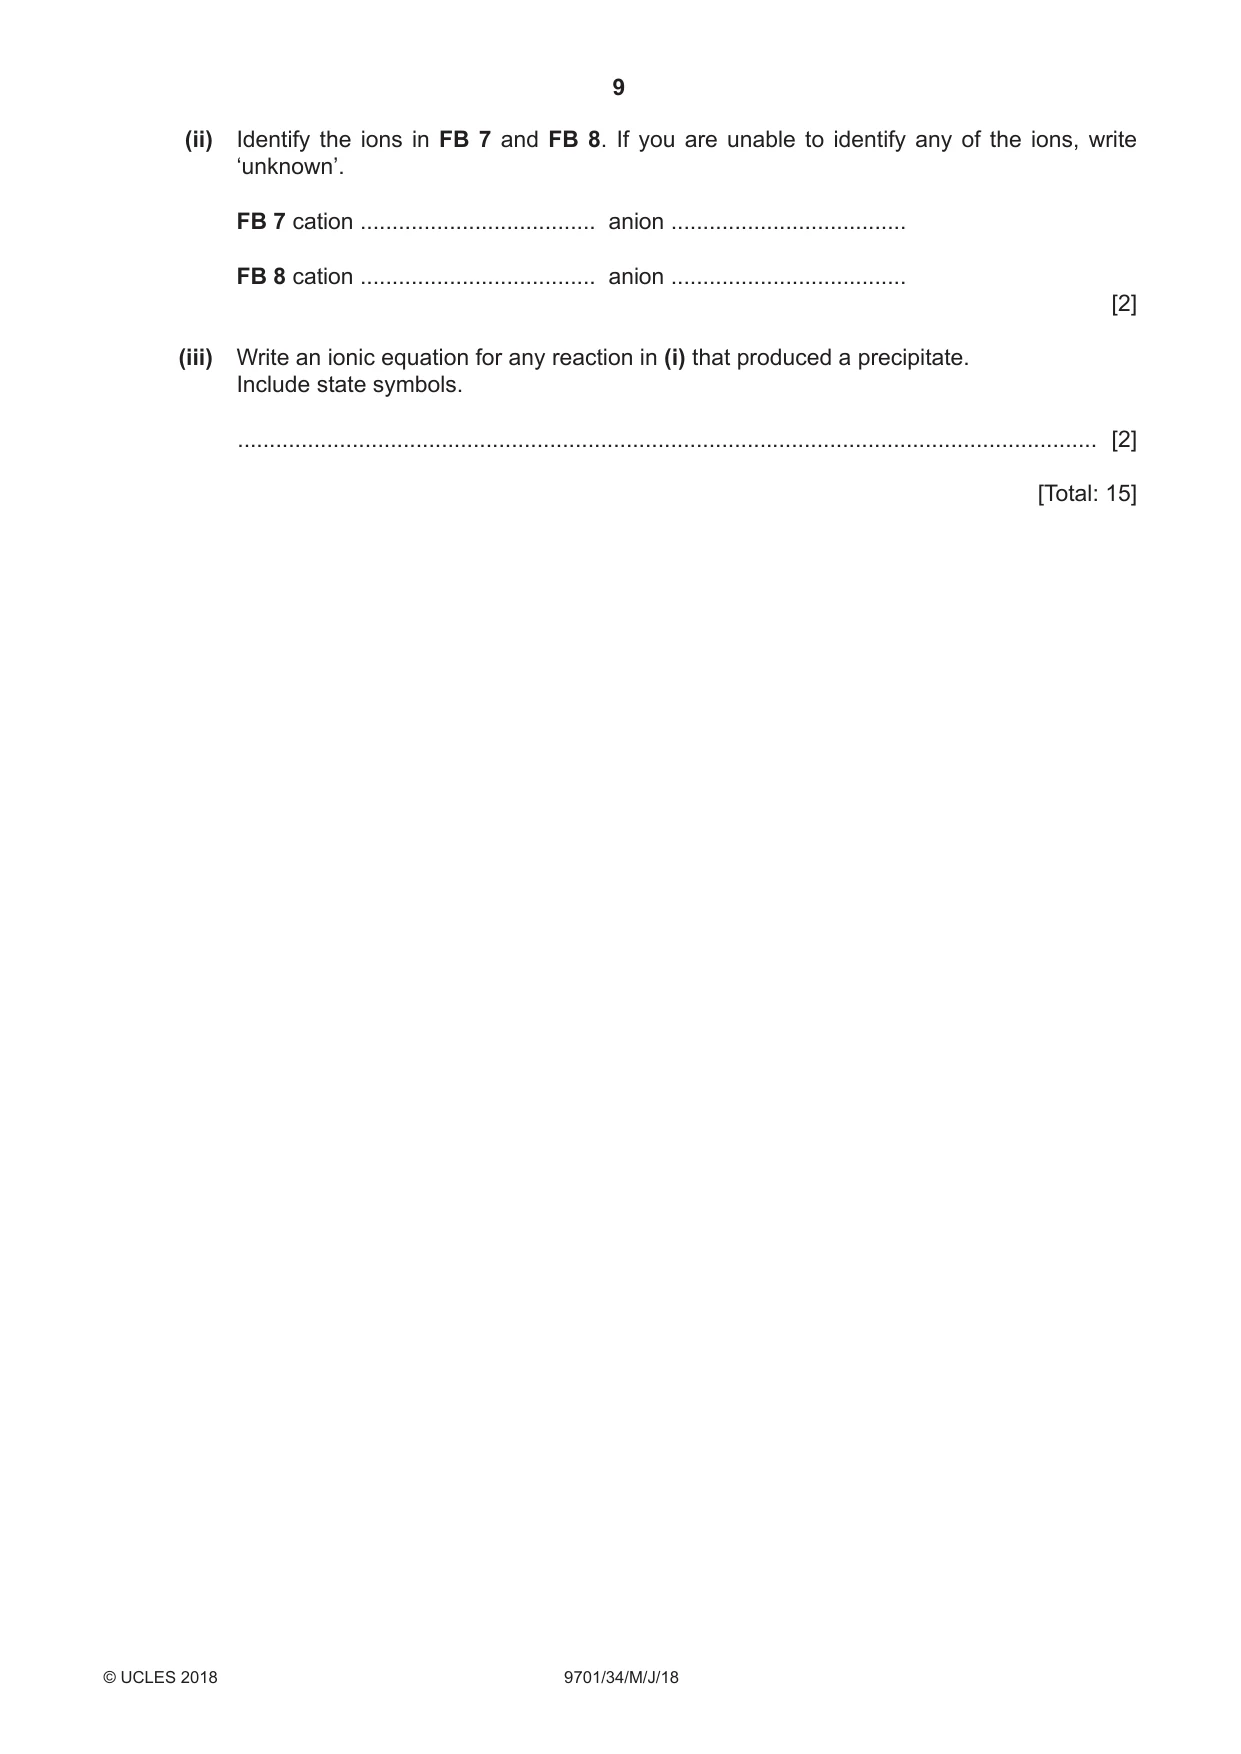
2 Sandell’s solution reacts in a similar way to Fehling’s reagent. You will need to heat Sandell’s solution in a hot water bath when using it in tests. Half fill the 250 cm3 beaker with water and place it on the tripod and gauze. Heat the water until it is boiling then turn off the Bunsen burner. This will be your hot water bath. (a) FB 4, FB 5 and FB 6 are all solutions of carbohydrates. ● Sugars and starch are carbohydrates. ● Some sugars contain an aldehyde group so act as reducing agents. ● Other sugars do not contain an aldehyde group. (i) For each test use a 1 cm depth of the solution in a test-tube. Record all your observations in the table. observations test FB 4 FB 5 FB 6 Add 2 or 3 drops of aqueous iodine. Add 2 or 3 drops of acidified potassium manganate(VII) and allow to stand for two minutes. Add a 3 cm depth of Sandell’s solution and place the tube in the hot water bath for two minutes. [3] (ii) Circle the carbohydrate that could be starch. FB 4 FB 5 FB 6 Circle the carbohydrate that contains an aldehyde group. FB 4 FB 5 FB 6 [1] (iii) Suggest a different test, other than using Fehling’s reagent, that could be carried out to identify the presence of an aldehyde group. State the reagent(s) you would use and the expected observation if the result were positive. Do not carry out your test. reagent(s) ............................................................................................................................ observation .......................................................................................................................... [1] (b) (i) FB 7 and FB 8 are two of the components of Sandell’s solution. Each contains one cation and one anion. Two of the ions are listed in the Qualitative Analysis Notes. For each test use a 1 cm depth of solution in a test-tube. Record all your observations in the table. observations test FB 7 FB 8 Add a few drops of aqueous silver nitrate. Add a few drops of aqueous barium nitrate or aqueous barium chloride, then add dilute nitric acid. Add a few drops of aqueous iodine. Add a 1 cm depth of aqueous iron(II) sulfate. Add a 1 cm depth of FB 8. [6] (ii) Identify the ions in FB 7 and FB 8. If you are unable to identify any of the ions, write ‘unknown’. FB 7 cation ..................................... anion ..................................... FB 8 cation ..................................... anion ..................................... [2] (iii) Write an ionic equation for any reaction in (i) that produced a precipitate. Include state symbols. ....................................................................................................................................... [2] [Total: 15]
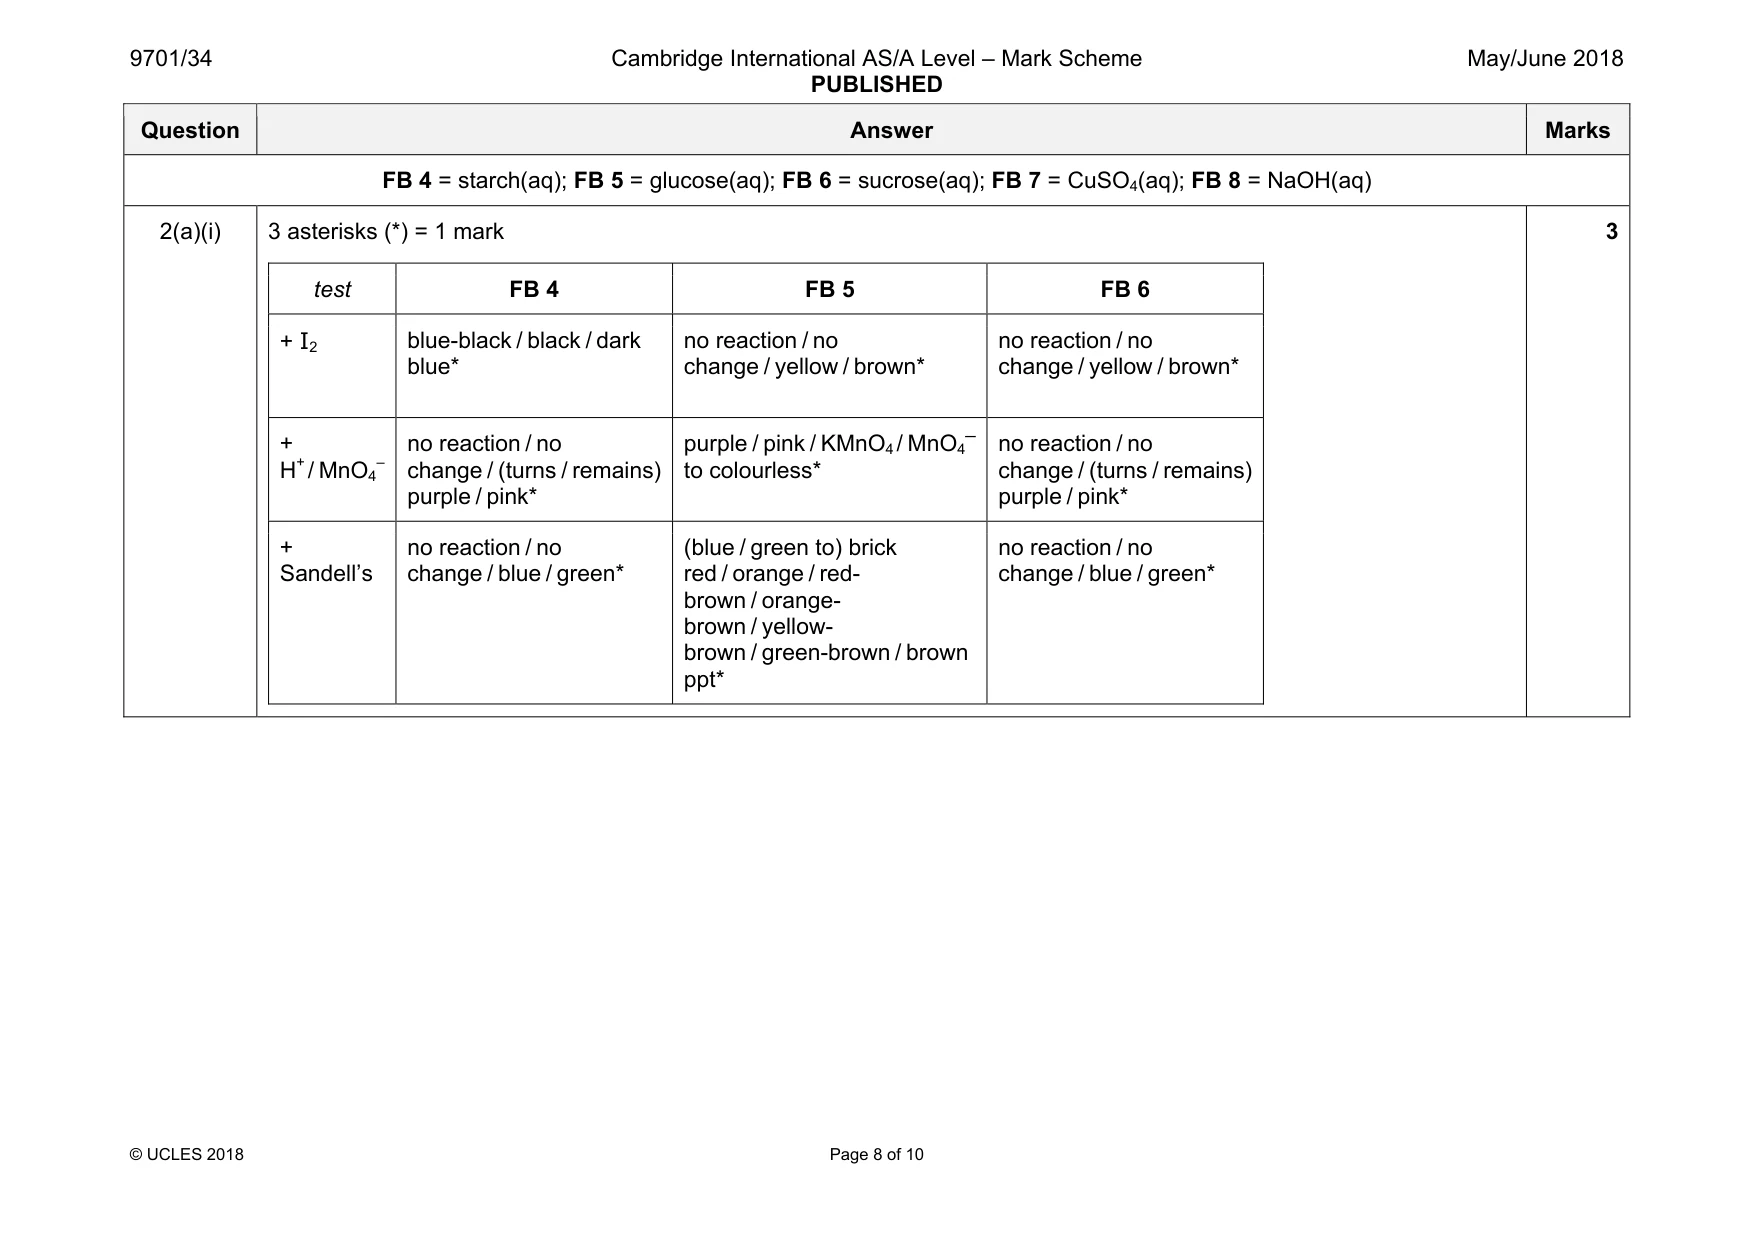
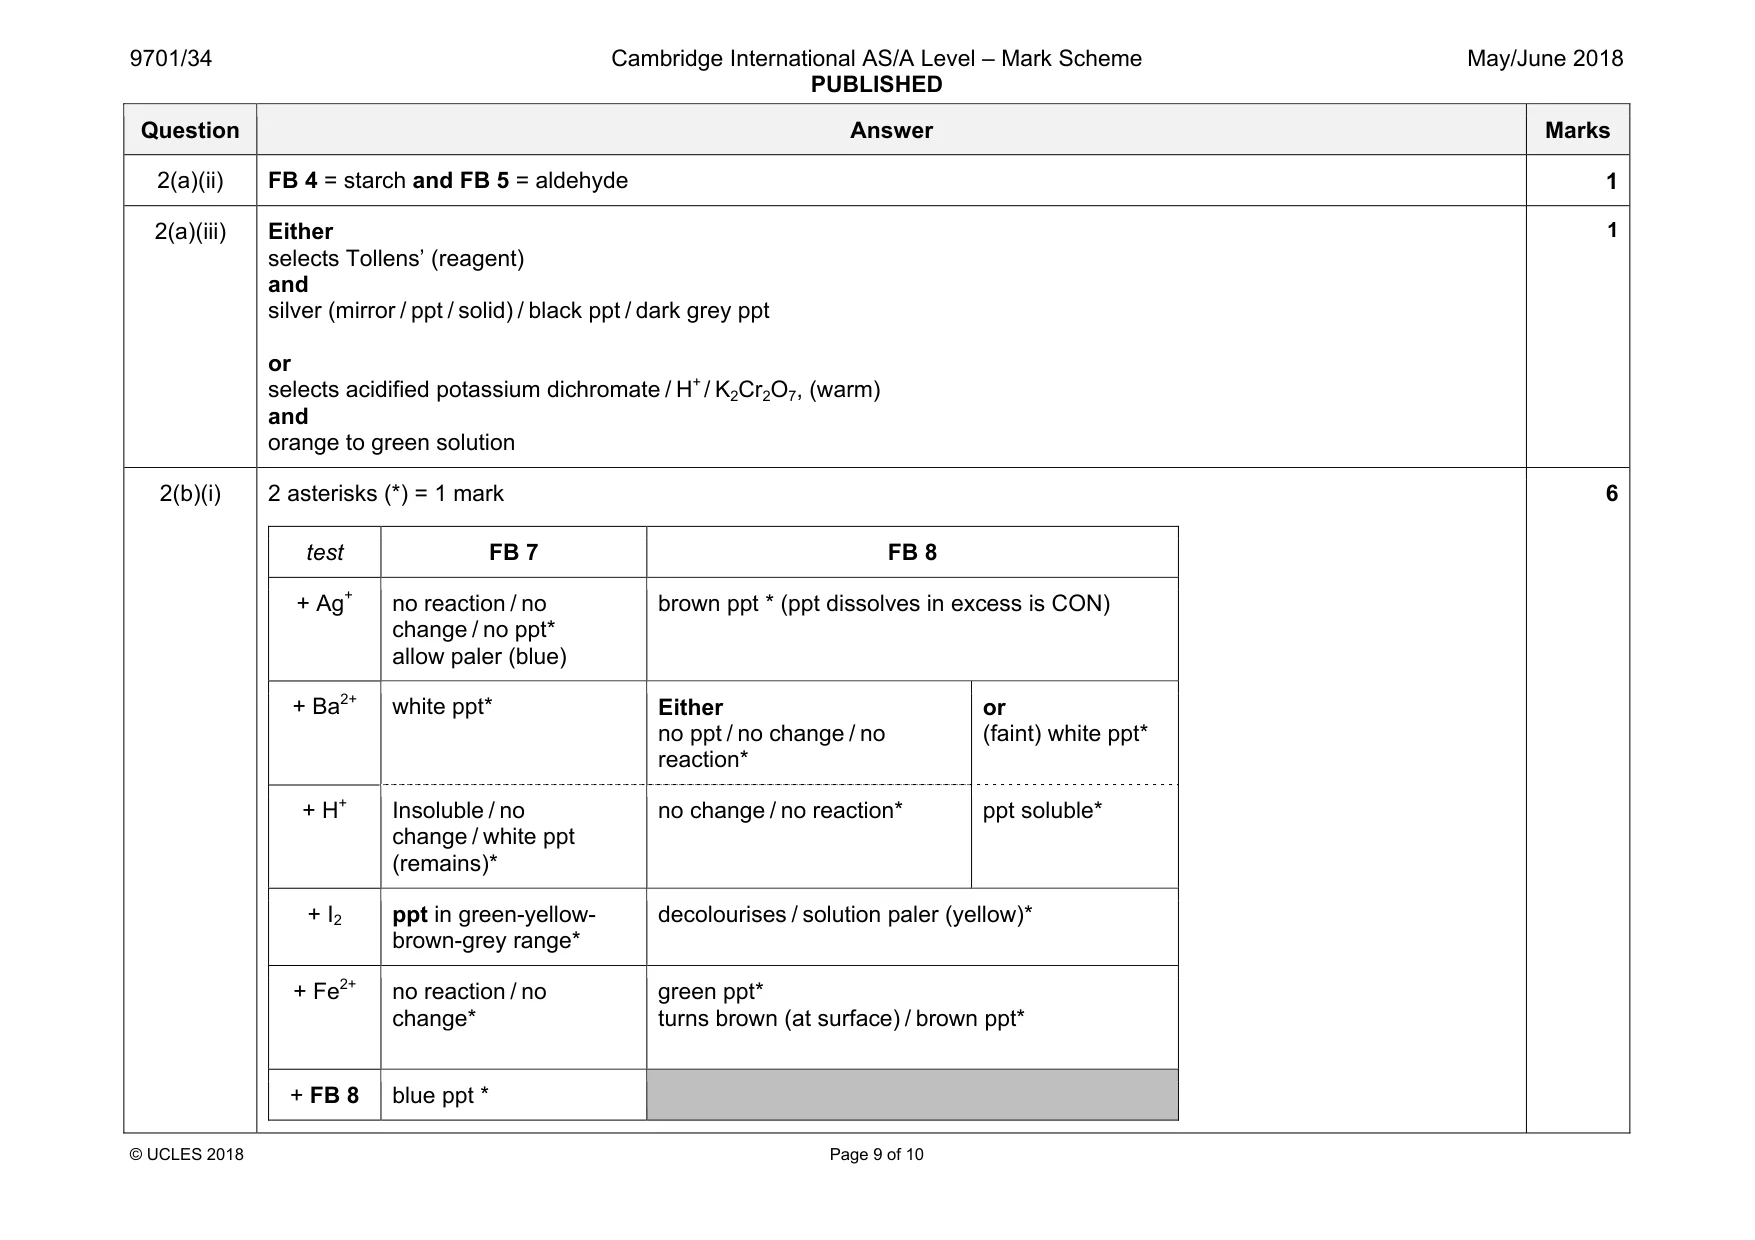
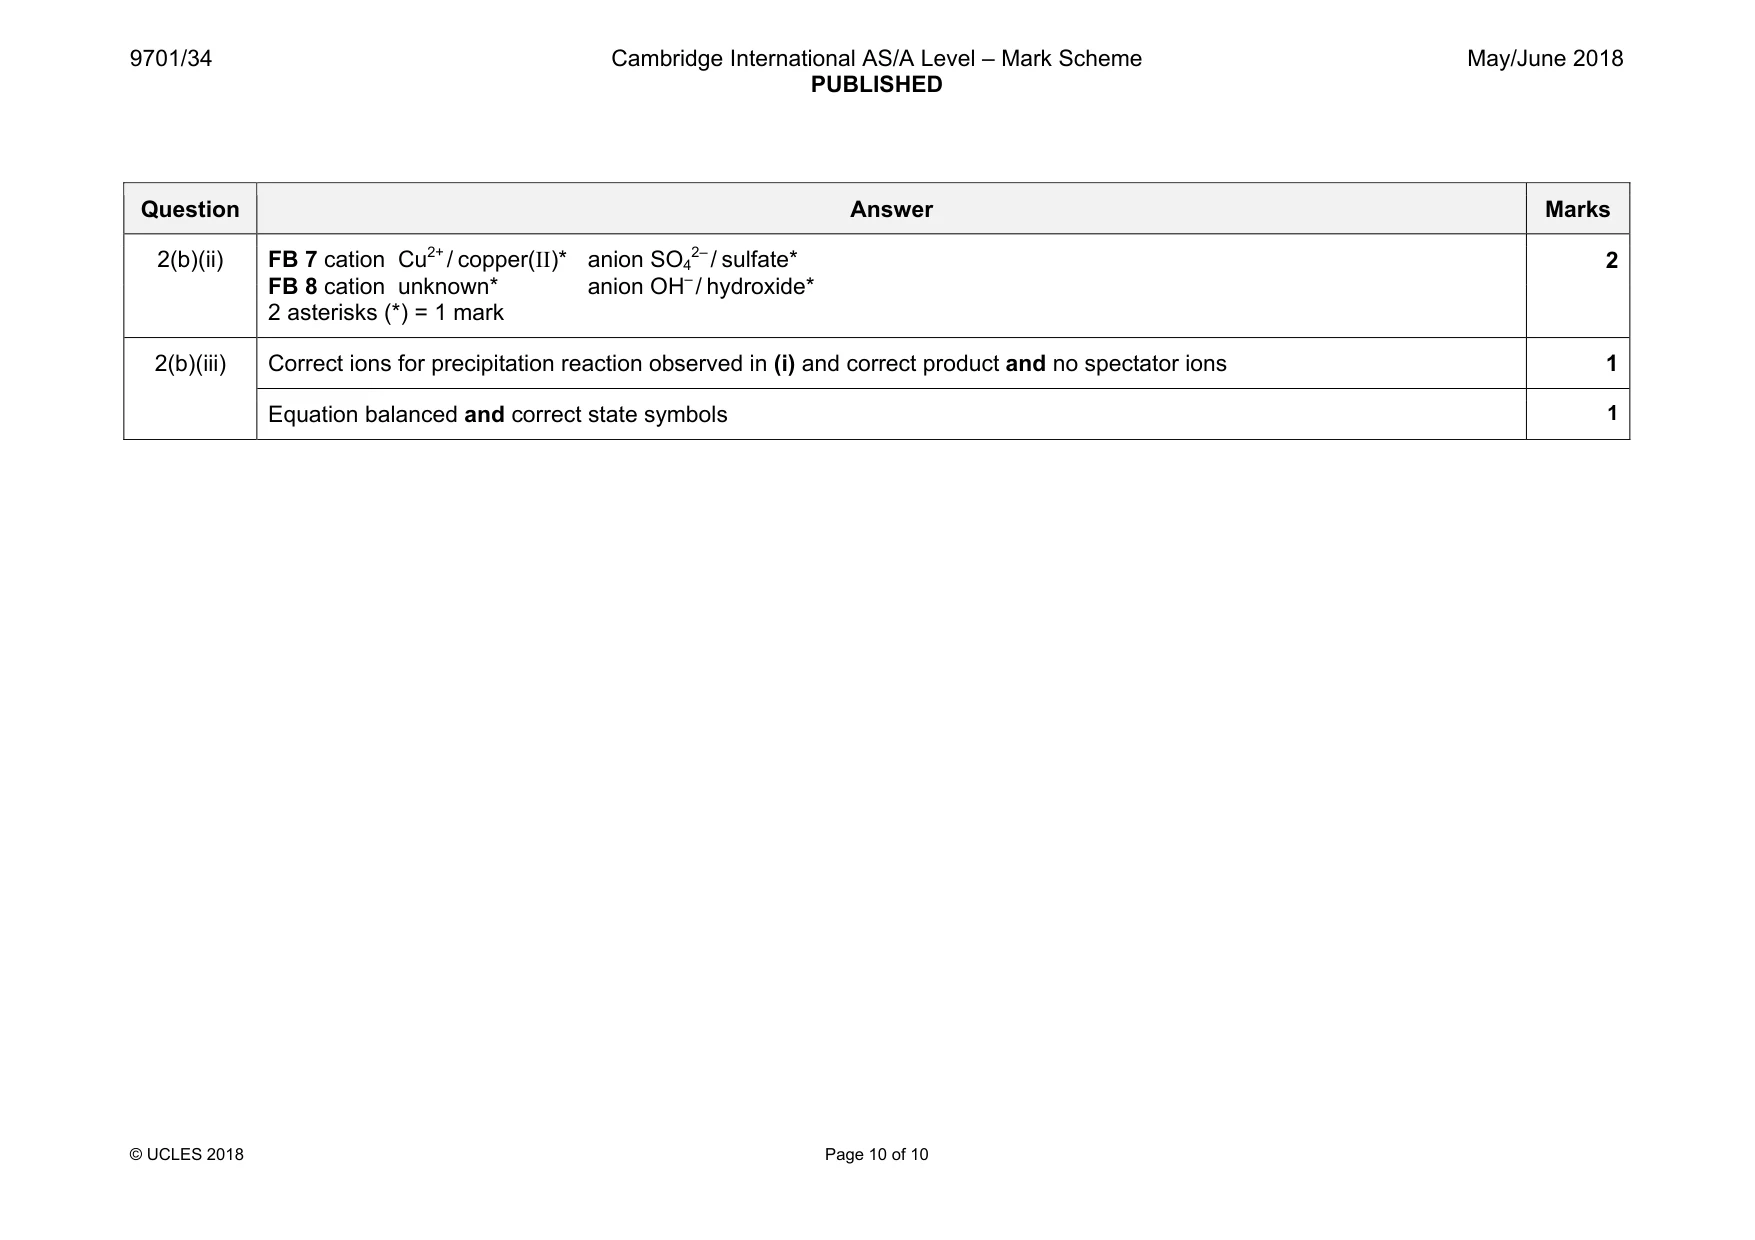
Mark scheme: 2(a)(i) 3 asterisks (*) = 1 mark test FB 4 FB 5 FB 6 + I2 blue-black / black / dark blue* no reaction / no change / yellow / brown* no reaction / no change / yellow / brown* + H+ / MnO4 – no reaction / no change / (turns / remains) purple / pink* purple / pink / KMnO4 / MnO4 ─ to colourless* no reaction / no change / (turns / remains) purple / pink* + Sandell’s no reaction / no change / blue / green* (blue / green to) brick red / orange / red- brown / orange- brown / yellow- brown / green-brown / brown ppt* no reaction / no change / blue / green* 3 Question Answer Marks 2(a)(ii) FB 4 = starch and FB 5 = aldehyde 1 2(a)(iii) Either selects Tollens’ (reagent) and silver (mirror / ppt / solid) / black ppt / dark grey ppt or selects acidified potassium dichromate / H+ / K2Cr2O7, (warm) and orange to green solution 1 2(b)(i) 2 asterisks (*) = 1 mark test FB 7 FB 8 + Ag+ no reaction / no change / no ppt* allow paler (blue) brown ppt * (ppt dissolves in excess is CON) + Ba2+ white ppt* Either no ppt / no change / no reaction* or (faint) white ppt* + H+ Insoluble / no change / white ppt (remains)* no change / no reaction* ppt soluble* + I2 ppt in green-yellow- brown-grey range* decolourises / solution paler (yellow)* + Fe2+ no reaction / no change* green ppt* turns brown (at surface) / brown ppt* + FB 8 blue ppt * 6 Question Answer Marks 2(b)(ii) FB 7 cation Cu2+ / copper(II)* anion SO4 2–/ sulfate* FB 8 cation unknown* anion OH– / hydroxide* 2 asterisks (*) = 1 mark 2 2(b)(iii) Correct ions for precipitation reaction observed in (i) and correct product and no spectator ions 1 Equation balanced and correct state symbols 1
What was in this paper
The subtopics covered by these 2 questions, and how many questions each got. Open one in a new tab to see every Cambridge question on it.
What you needed in this session
Cambridge’s own grade thresholds for 2018 May/June, Paper 3 · Variant 4. A higher threshold means an easier paper — the bar moves with how the cohort did.