Cambridge A Level Chemistry 9701 — 2009 May/June Paper 5 · Variant 1
9701/51/M/J/09 · 30 marks · ≈34 min
The question paper and its mark scheme, free to read here and free to download. This is Cambridge’s own paper, exactly as it was sat.
Question paper12 pages
Mark scheme5 pages
Answers below. Sit the paper first if you are practising.
Paper as text
Question paper, page 1
This document consists of 11 printed pages and 1 blank page. SJF4889/CG T79228/2 © UCLES 2009 [Turn over UNIVERSITY OF CAMBRIDGE INTERNATIONAL EXAMINATIONS General Certificate of Education Advanced Subsidiary Level and Advanced Level READ THESE INSTRUCTIONS FIRST Write your Centre number, candidate number and name on all the work you hand in. Write in dark blue or black pen. You may use a soft pencil for any diagrams, graphs or rough working. Do not use staples, paper clips, highlighters, glue or correction fluid. DO NOT WRITE IN ANY BARCODES. Answer all questions. You are advised to show all working in calculations. Use of a Data Booklet is unnecessary. At the end of the examination, fasten all your work securely together. The number of marks is given in brackets [ ] at the end of each question or part question. * 7 0 6 1 8 3 4 1 5 7 * CHEMISTRY 9701/05 Paper 5 Planning, analysis and evaluation May/June 2009 1 hour 15 minutes Candidates answer on the Question Paper. No Additional Materials are required. For Examiner’s Use 1 2 Total
Question paper, page 2
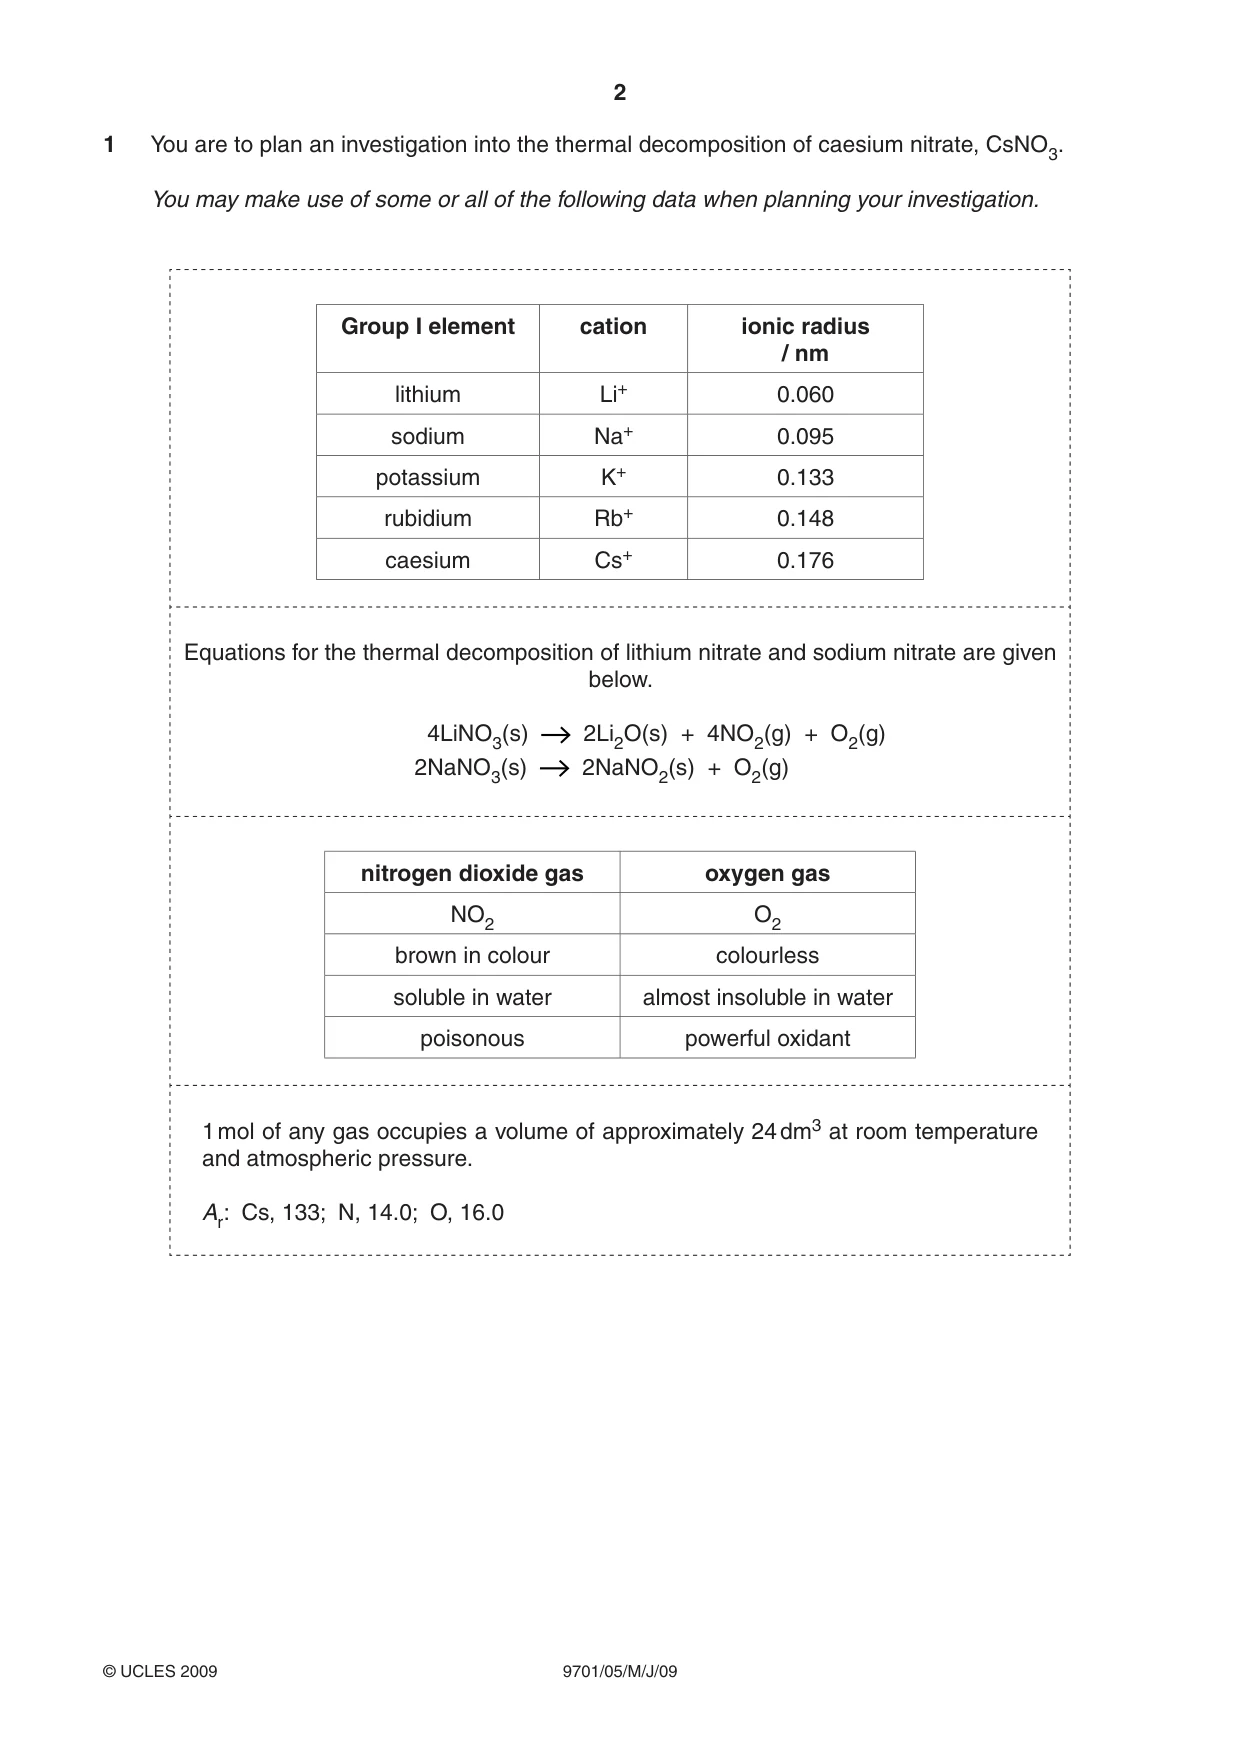
2 9701/05/M/J/09 © UCLES 2009 1 You are to plan an investigation into the thermal decomposition of caesium nitrate, CsNO3. You may make use of some or all of the following data when planning your investigation. Group I element cation ionic radius / nm lithium Li+ 0.060 sodium Na+ 0.095 potassium K+ 0.133 rubidium Rb+ 0.148 caesium Cs+ 0.176 Equations for the thermal decomposition of lithium nitrate and sodium nitrate are given below. 4LiNO3(s) 2Li2O(s) + 4NO2(g) + O2(g) 2NaNO3(s) 2NaNO2(s) + O2(g) nitrogen dioxide gas oxygen gas NO2 O2 brown in colour colourless soluble in water almost insoluble in water poisonous powerful oxidant 1 mol of any gas occupies a volume of approximately 24 dm3 at room temperature and atmospheric pressure. Ar: Cs, 133; N, 14.0; O, 16.0
Question paper, page 3
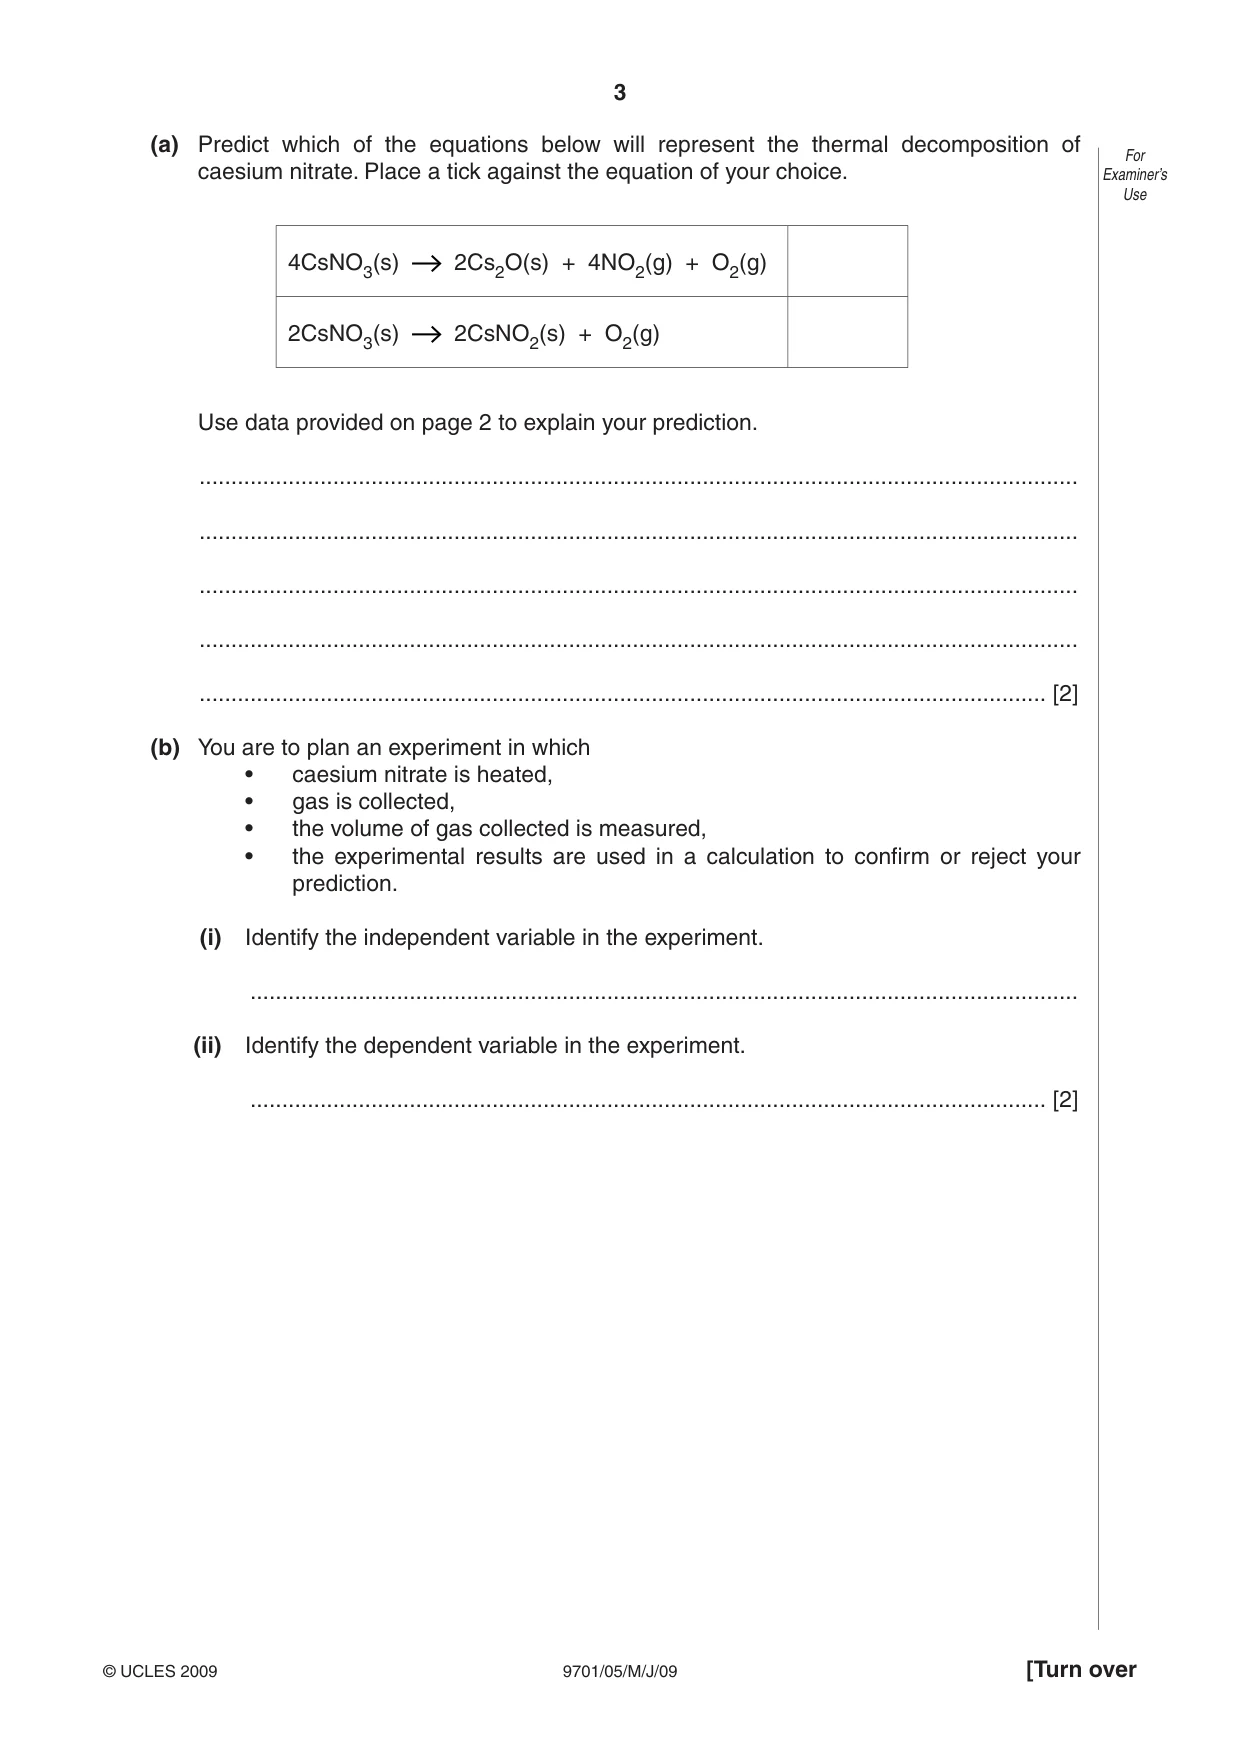
3 9701/05/M/J/09 © UCLES 2009 [Turn over For Examiner’s Use (a) Predict which of the equations below will represent the thermal decomposition of caesium nitrate. Place a tick against the equation of your choice. 4CsNO3(s) 2Cs2O(s) + 4NO2(g) + O2(g) 2CsNO3(s) 2CsNO2(s) + O2(g) Use data provided on page 2 to explain your prediction. … … … … … [2] (b) You are to plan an experiment in which • caesium nitrate is heated, • gas is collected, • the volume of gas collected is measured, • the experimental results are used in a calculation to confirm or reject your prediction. (i) Identify the independent variable in the experiment. … (ii) Identify the dependent variable in the experiment. … [2]
Question paper, page 4
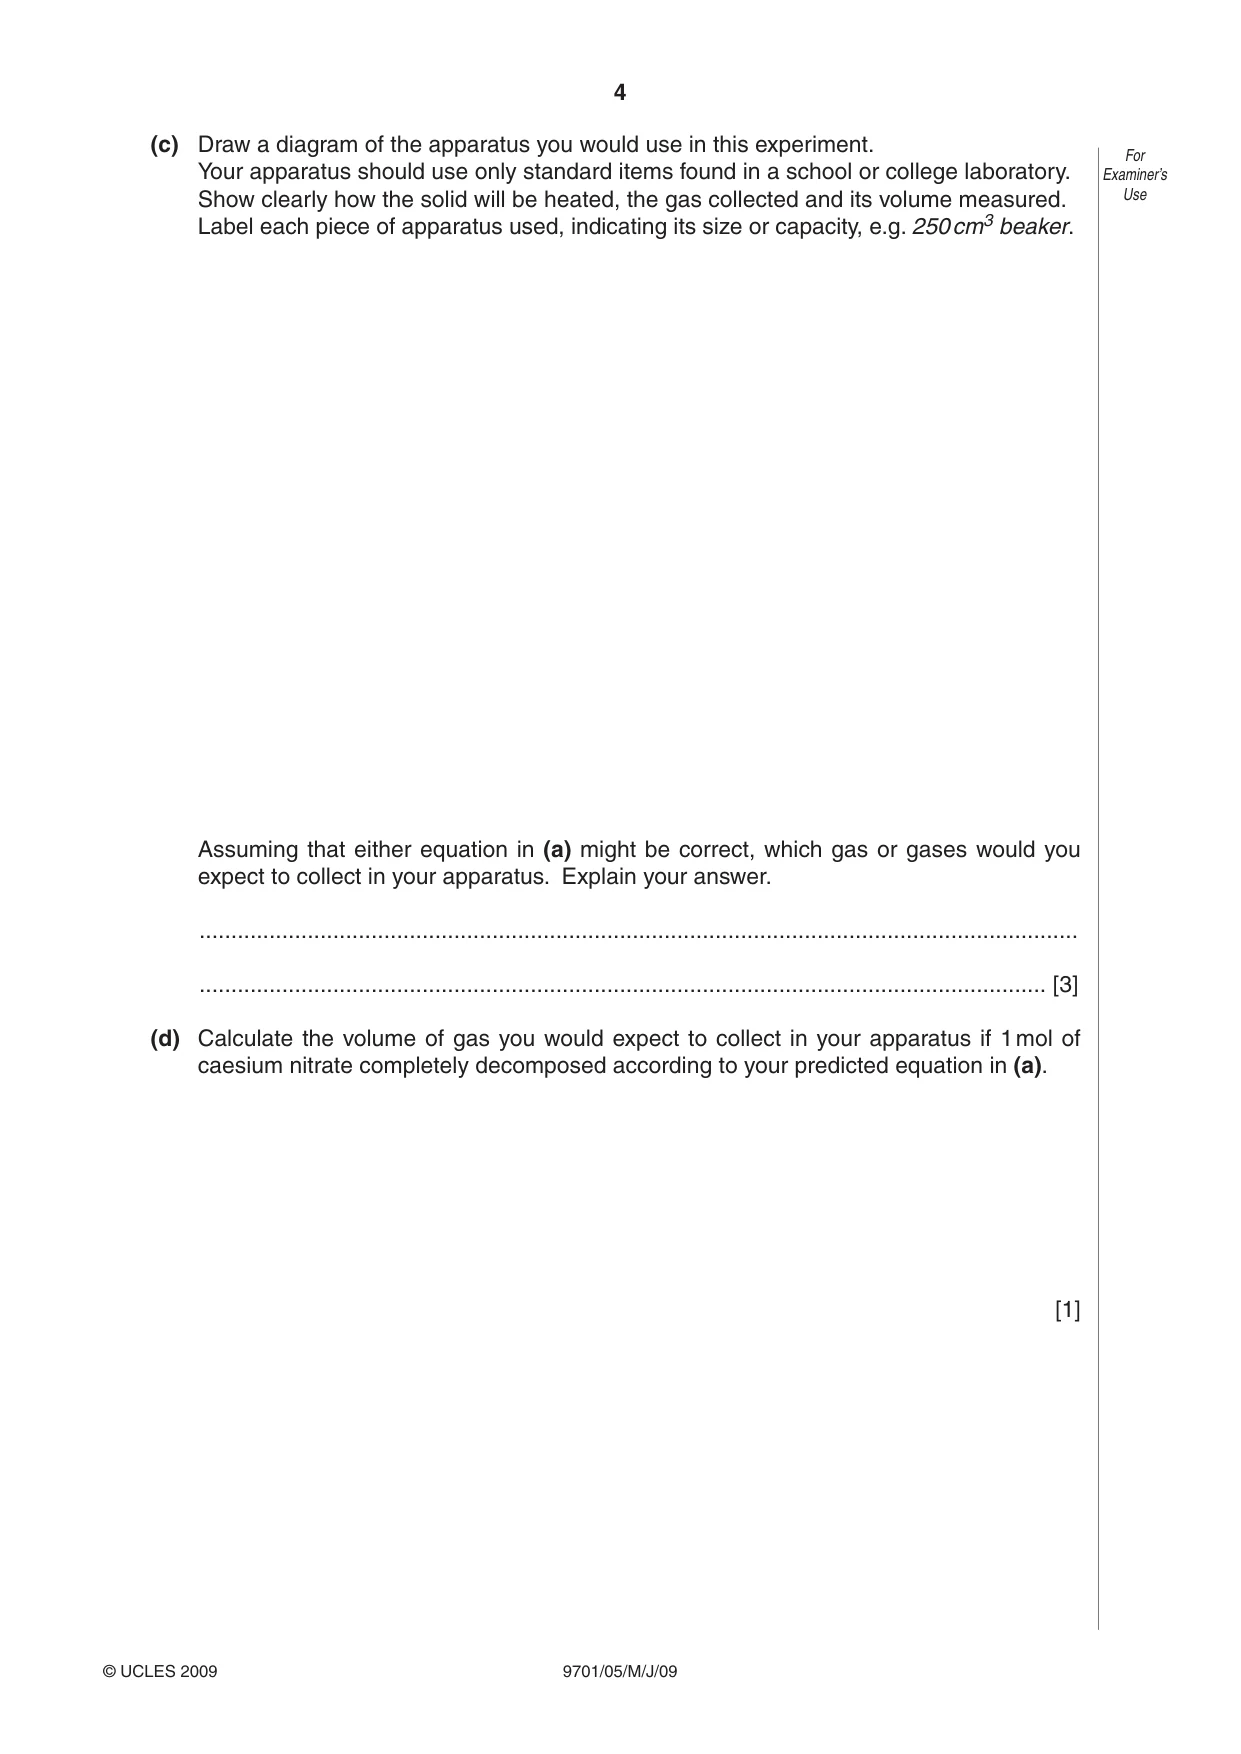
4 9701/05/M/J/09 © UCLES 2009 For Examiner’s Use (c) Draw a diagram of the apparatus you would use in this experiment. Your apparatus should use only standard items found in a school or college laboratory. Show clearly how the solid will be heated, the gas collected and its volume measured. Label each piece of apparatus used, indicating its size or capacity, e.g. 250 cm3 beaker. Assuming that either equation in (a) might be correct, which gas or gases would you expect to collect in your apparatus. Explain your answer. … … [3] (d) Calculate the volume of gas you would expect to collect in your apparatus if 1 mol of caesium nitrate completely decomposed according to your predicted equation in (a). [1]
Question paper, page 5
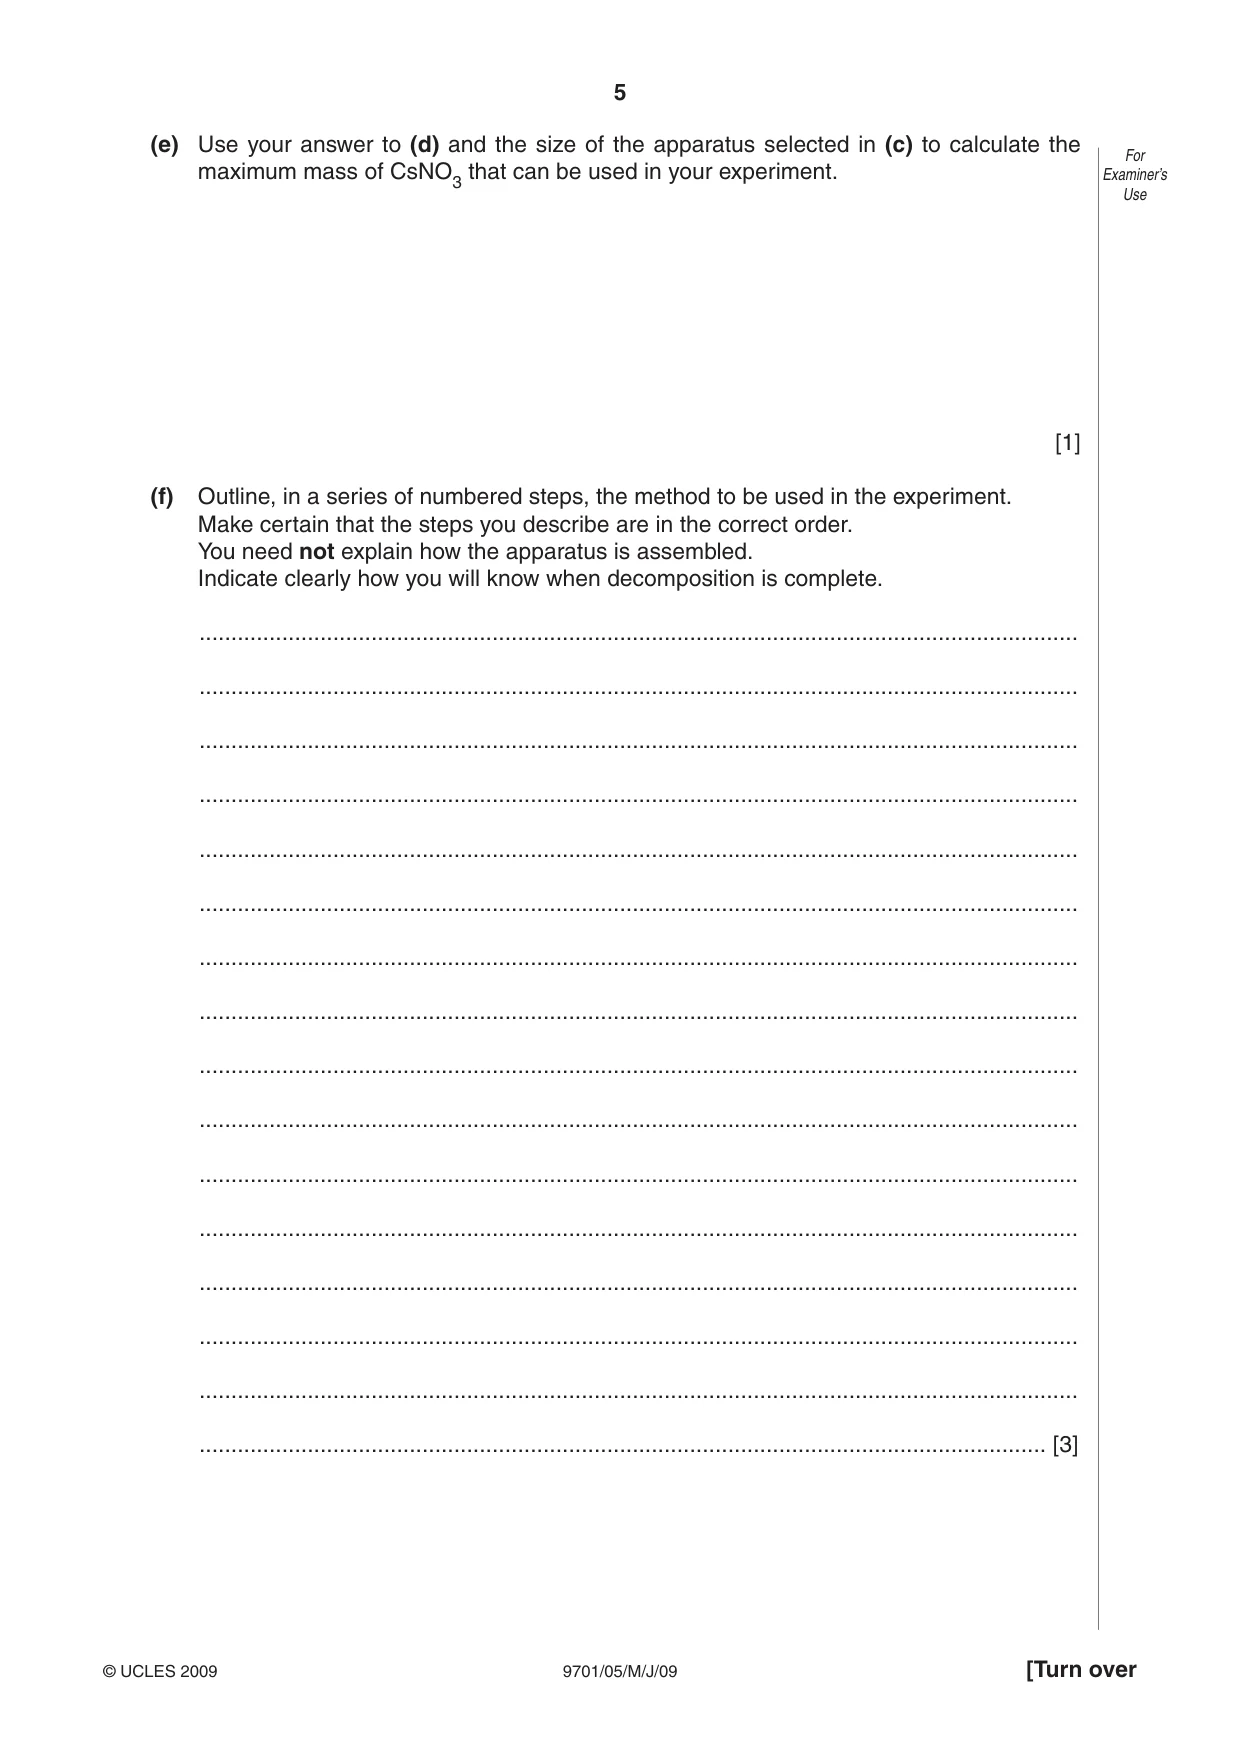
5 9701/05/M/J/09 © UCLES 2009 [Turn over For Examiner’s Use (e) Use your answer to (d) and the size of the apparatus selected in (c) to calculate the maximum mass of CsNO3 that can be used in your experiment. [1] (f) Outline, in a series of numbered steps, the method to be used in the experiment. Make certain that the steps you describe are in the correct order. You need not explain how the apparatus is assembled. Indicate clearly how you will know when decomposition is complete. … … … … … … … … … … … … … … … … [3]
Question paper, page 6
6 9701/05/M/J/09 © UCLES 2009 For Examiner’s Use (g) What should be done when decomposition is complete to ensure that the volume of gas measured in the apparatus is the “correct” volume? … … [1] (h) Identify a risk present in the method you have described. … … … Describe how you would minimise this risk. … … … [2] [Total: 15]
Question paper, page 7
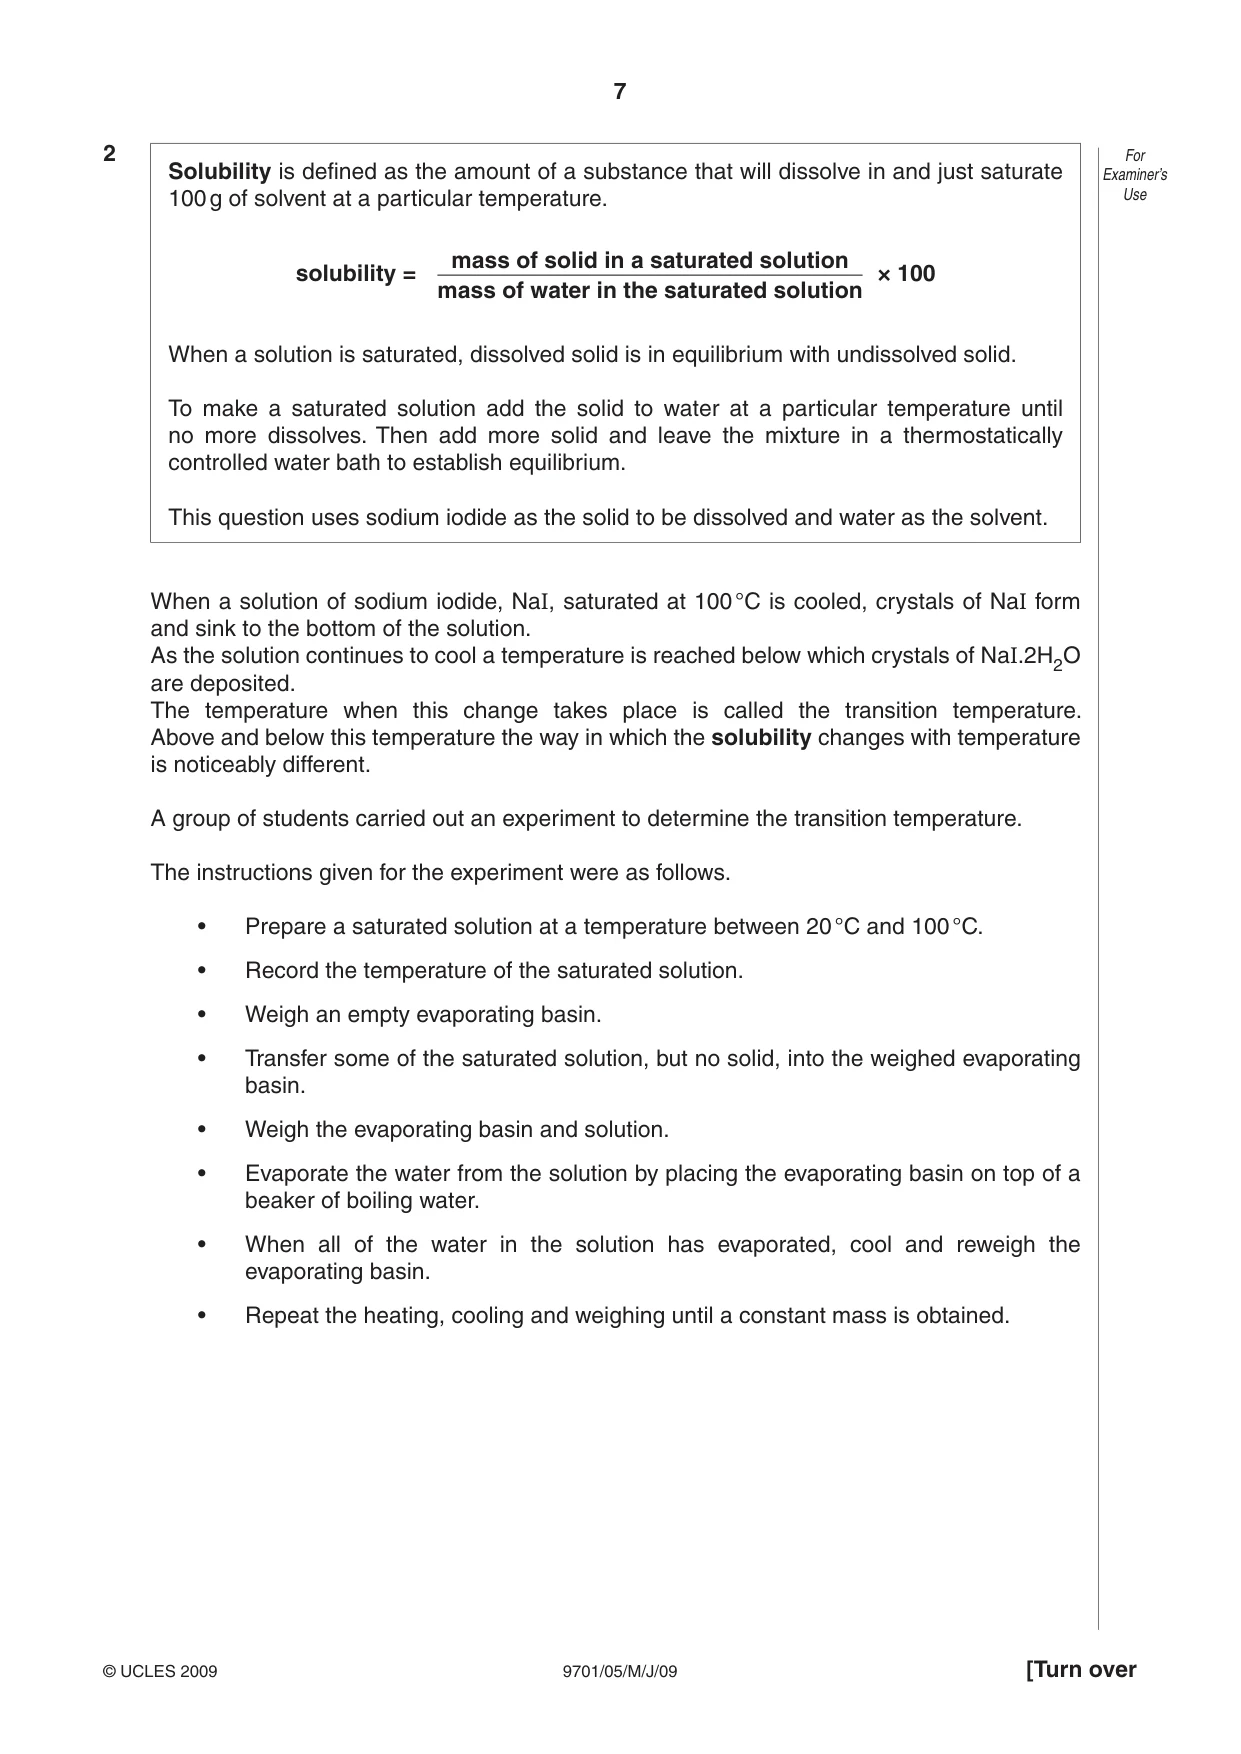
7 9701/05/M/J/09 © UCLES 2009 [Turn over For Examiner’s Use 2 Solubility is defined as the amount of a substance that will dissolve in and just saturate 100 g of solvent at a particular temperature. solubility = mass of solid in a saturated solution mass of water in the saturated solution × 100 When a solution is saturated, dissolved solid is in equilibrium with undissolved solid. To make a saturated solution add the solid to water at a particular temperature until no more dissolves. Then add more solid and leave the mixture in a thermostatically controlled water bath to establish equilibrium. This question uses sodium iodide as the solid to be dissolved and water as the solvent. When a solution of sodium iodide, NaI, saturated at 100 °C is cooled, crystals of NaI form and sink to the bottom of the solution. As the solution continues to cool a temperature is reached below which crystals of NaI.2H2O are deposited. The temperature when this change takes place is called the transition temperature. Above and below this temperature the way in which the solubility changes with temperature is noticeably different. A group of students carried out an experiment to determine the transition temperature. The instructions given for the experiment were as follows. • Prepare a saturated solution at a temperature between 20 °C and 100 °C. • Record the temperature of the saturated solution. • Weigh an empty evaporating basin. • Transfer some of the saturated solution, but no solid, into the weighed evaporating basin. • Weigh the evaporating basin and solution. • Evaporate the water from the solution by placing the evaporating basin on top of a beaker of boiling water. • When all of the water in the solution has evaporated, cool and reweigh the evaporating basin. • Repeat the heating, cooling and weighing until a constant mass is obtained.
Question paper, page 8
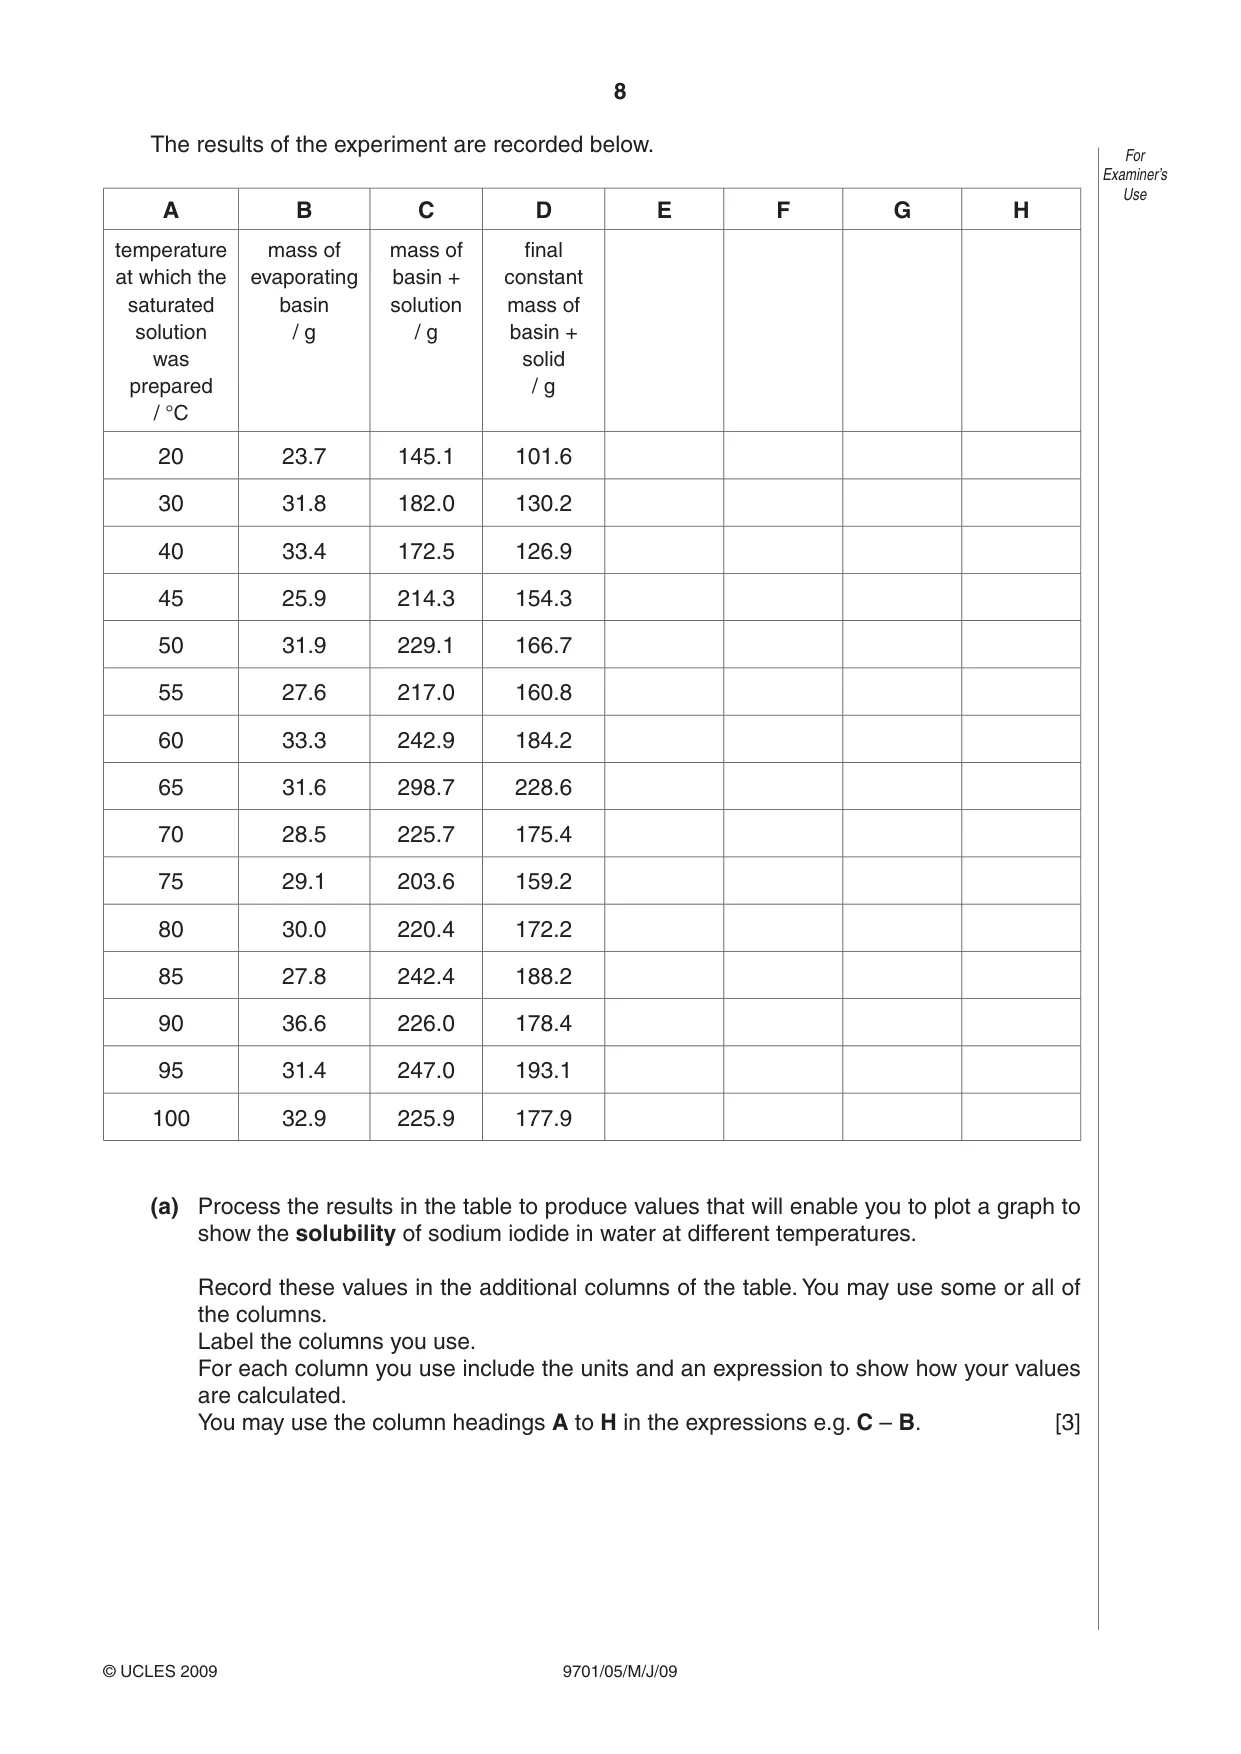
8 9701/05/M/J/09 © UCLES 2009 For Examiner’s Use The results of the experiment are recorded below. A B C D E F G H temperature at which the saturated solution was prepared / °C mass of evaporating basin / g mass of basin + solution / g final constant mass of basin + solid / g 20 23.7 145.1 101.6 30 31.8 182.0 130.2 40 33.4 172.5 126.9 45 25.9 214.3 154.3 50 31.9 229.1 166.7 55 27.6 217.0 160.8 60 33.3 242.9 184.2 65 31.6 298.7 228.6 70 28.5 225.7 175.4 75 29.1 203.6 159.2 80 30.0 220.4 172.2 85 27.8 242.4 188.2 90 36.6 226.0 178.4 95 31.4 247.0 193.1 100 32.9 225.9 177.9 (a) Process the results in the table to produce values that will enable you to plot a graph to show the solubility of sodium iodide in water at different temperatures. Record these values in the additional columns of the table. You may use some or all of the columns. Label the columns you use. For each column you use include the units and an expression to show how your values are calculated. You may use the column headings A to H in the expressions e.g. C – B. [3]
Question paper, page 9
9 9701/05/M/J/09 © UCLES 2009 [Turn over For Examiner’s Use (b) Present the values calculated in (a) in graphical form. Draw two separate lines and extrapolate them to a point of intersection. The line at higher temperatures represents the solubility of NaI. The line at lower temperatures represents the solubility of NaI.2H2O. Do not start either scale at zero. [4]
Question paper, page 10
10 9701/05/M/J/09 © UCLES 2009 For Examiner’s Use (c) Read from the graph the temperature where the two lines intersect. This is the transition temperature. The transition temperature is ……………… °C. [1] (d) Circle, on the graph, any point(s) you consider to be anomalous. For any point circled on the graph suggest an error in the conduct of the experiment that might have led to the anomalous result. … … … … … … … … … … [4] (e) Suggest additional measurements that could be made to enable a more precise value of the transition temperature to be determined. … … … … … [1]
Question paper, page 11
11 9701/05/M/J/09 © UCLES 2009 For Examiner’s Use (f) Describe the difference in the variation of solubility with temperature above the transition temperature, … … below the transition temperature. … … The solubility curve represents equilibrium conditions between solid sodium iodide and dissolved sodium iodide. The position of equilibrium can be influenced by temperature change and whether a change is exothermic or endothermic. From the shape of your graph, comment on the likely enthalpy change for solid sodium iodide dissolving under equilibrium conditions. Explain your answer. … … … … … [2] [Total: 15]
Question paper, page 12
12 9701/05/M/J/09 BLANK PAGE Permission to reproduce items where third-party owned material protected by copyright is included has been sought and cleared where possible. Every reasonable effort has been made by the publisher (UCLES) to trace copyright holders, but if any items requiring clearance have unwittingly been included, the publisher will be pleased to make amends at the earliest possible opportunity. University of Cambridge International Examinations is part of the Cambridge Assessment Group. Cambridge Assessment is the brand name of University of Cambridge Local Examinations Syndicate (UCLES), which is itself a department of the University of Cambridge.
Mark scheme, page 1
UNIVERSITY OF CAMBRIDGE INTERNATIONAL EXAMINATIONS GCE Advanced Subsidiary Level and GCE Advanced Level MARK SCHEME for the May/June 2009 question paper for the guidance of teachers 9701 CHEMISTRY 9701/05 Paper 5 (Planning, Analysis and Evaluation), maximum raw mark 30 This mark scheme is published as an aid to teachers and candidates, to indicate the requirements of the examination. It shows the basis on which Examiners were instructed to award marks. It does not indicate the details of the discussions that took place at an Examiners’ meeting before marking began, which would have considered the acceptability of alternative answers. Mark schemes must be read in conjunction with the question papers and the report on the examination. • CIE will not enter into discussions or correspondence in connection with these mark schemes. CIE is publishing the mark schemes for the May/June 2009 question papers for most IGCSE, GCE Advanced Level and Advanced Subsidiary Level syllabuses and some Ordinary Level syllabuses.
Mark scheme, page 2
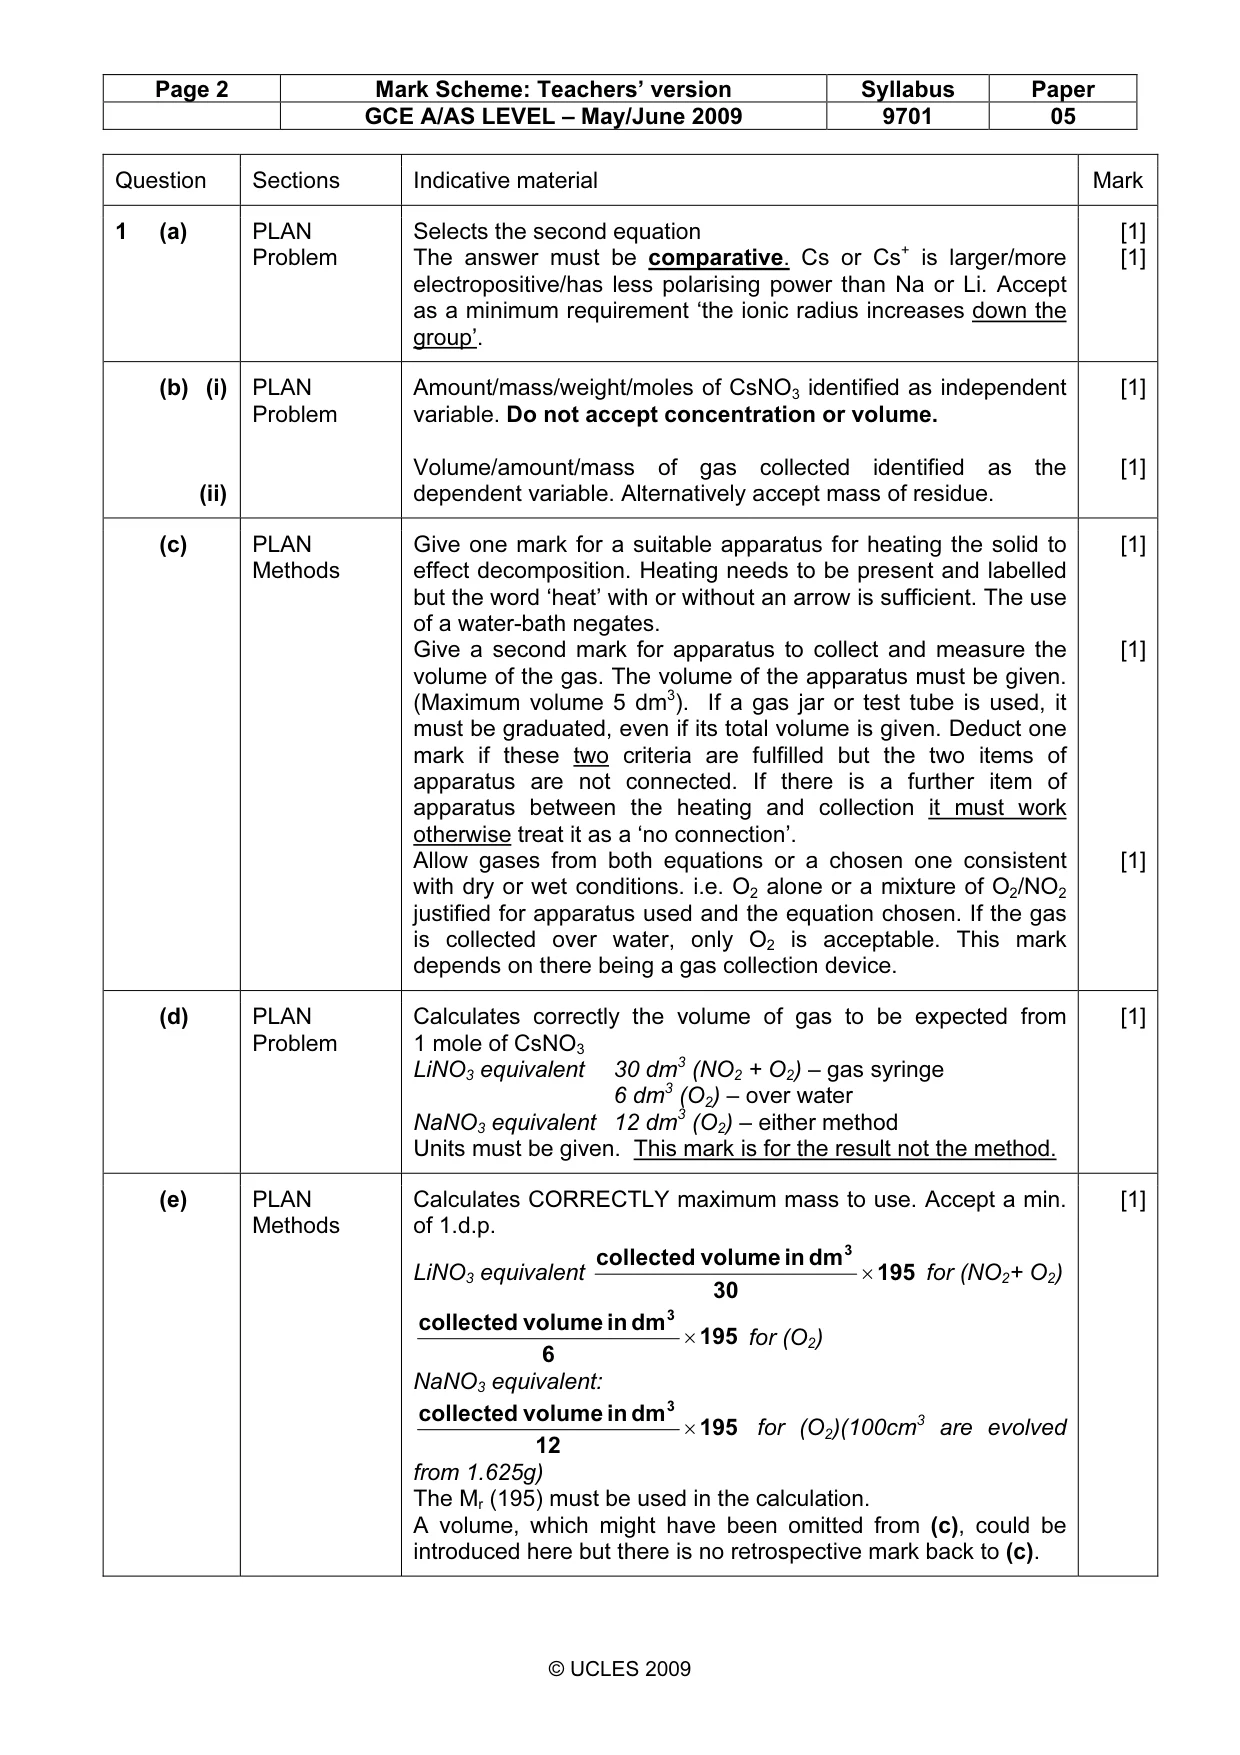
Page 2 Mark Scheme: Teachers’ version Syllabus Paper GCE A/AS LEVEL – May/June 2009 9701 05 © UCLES 2009 Question Sections Indicative material Mark 1 (a) PLAN Problem Selects the second equation The answer must be comparative. Cs or Cs+ is larger/more electropositive/has less polarising power than Na or Li. Accept as a minimum requirement ‘the ionic radius increases down the group’. [1] [1] (b) (i) (ii) PLAN Problem Amount/mass/weight/moles of CsNO3 identified as independent variable. Do not accept concentration or volume. Volume/amount/mass of gas collected identified as the dependent variable. Alternatively accept mass of residue. [1] [1] (c) PLAN Methods Give one mark for a suitable apparatus for heating the solid to effect decomposition. Heating needs to be present and labelled but the word ‘heat’ with or without an arrow is sufficient. The use of a water-bath negates. Give a second mark for apparatus to collect and measure the volume of the gas. The volume of the apparatus must be given. (Maximum volume 5 dm3). If a gas jar or test tube is used, it must be graduated, even if its total volume is given. Deduct one mark if these two criteria are fulfilled but the two items of apparatus are not connected. If there is a further item of apparatus between the heating and collection it must work otherwise treat it as a ‘no connection’. Allow gases from both equations or a chosen one consistent with dry or wet conditions. i.e. O2 alone or a mixture of O2/NO2 justified for apparatus used and the equation chosen. If the gas is collected over water, only O2 is acceptable. This mark depends on there being a gas collection device. [1] [1] [1] (d) PLAN Problem Calculates correctly the volume of gas to be expected from 1 mole of CsNO3 LiNO3 equivalent 30 dm3 (NO2 + O2) – gas syringe 6 dm3 (O2) – over water NaNO3 equivalent 12 dm3 (O2) – either method Units must be given. This mark is for the result not the method. [1] (e) PLAN Methods Calculates CORRECTLY maximum mass to use. Accept a min. of 1.d.p. LiNO3 equivalent 195 30 dm in volume collected 3 × for (NO2+ O2) 195 6 dm in volume collected 3 × for (O2) NaNO3 equivalent: 195 12 dm in volume collected 3 × for (O2)(100cm3 are evolved from 1.625g) The Mr (195) must be used in the calculation. A volume, which might have been omitted from (c), could be introduced here but there is no retrospective mark back to (c). [1]
Mark scheme, page 3
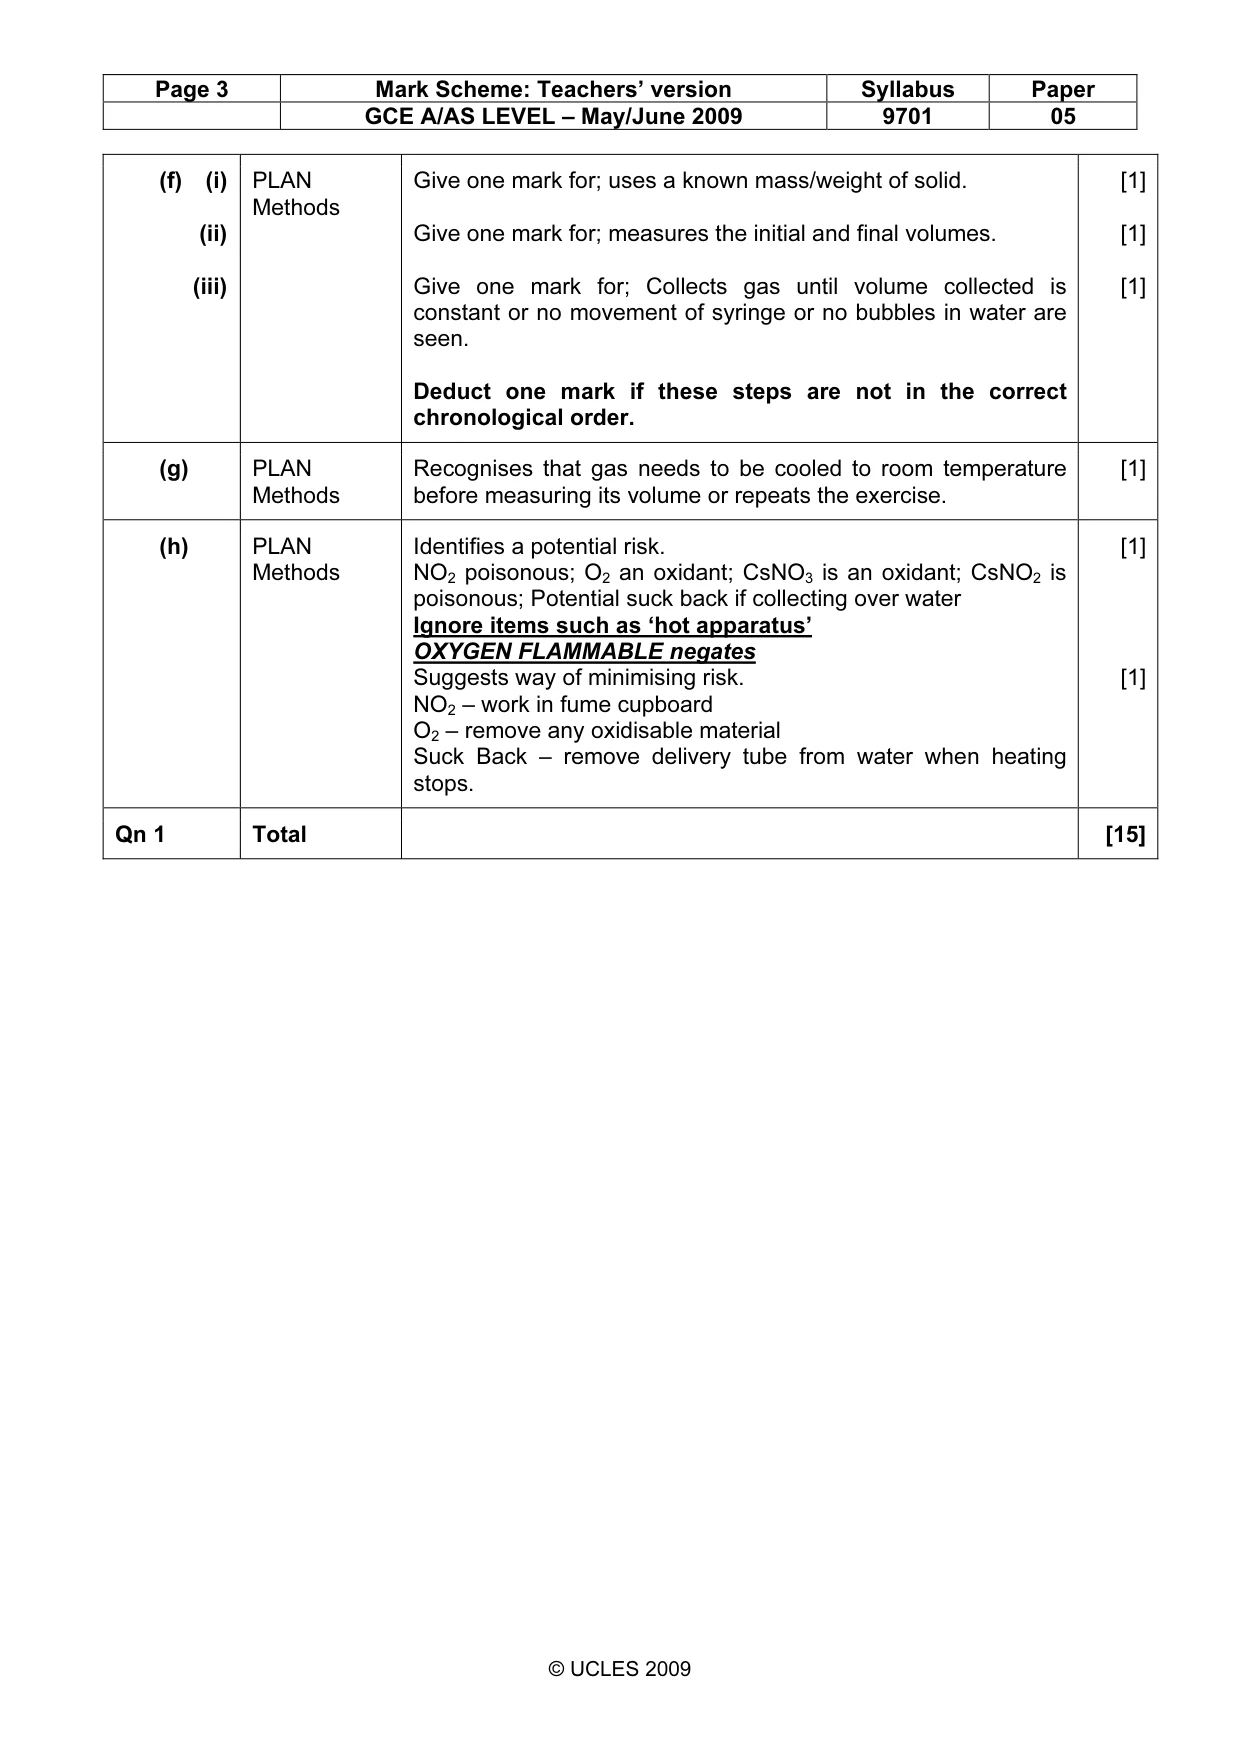
Page 3 Mark Scheme: Teachers’ version Syllabus Paper GCE A/AS LEVEL – May/June 2009 9701 05 © UCLES 2009 (f) (i) (ii) (iii) PLAN Methods Give one mark for; uses a known mass/weight of solid. Give one mark for; measures the initial and final volumes. Give one mark for; Collects gas until volume collected is constant or no movement of syringe or no bubbles in water are seen. Deduct one mark if these steps are not in the correct chronological order. [1] [1] [1] (g) PLAN Methods Recognises that gas needs to be cooled to room temperature before measuring its volume or repeats the exercise. [1] (h) PLAN Methods Identifies a potential risk. NO2 poisonous; O2 an oxidant; CsNO3 is an oxidant; CsNO2 is poisonous; Potential suck back if collecting over water Ignore items such as ‘hot apparatus’ OXYGEN FLAMMABLE negates Suggests way of minimising risk. NO2 – work in fume cupboard O2 – remove any oxidisable material Suck Back – remove delivery tube from water when heating stops. [1] [1] Qn 1 Total [15]
Mark scheme, page 4
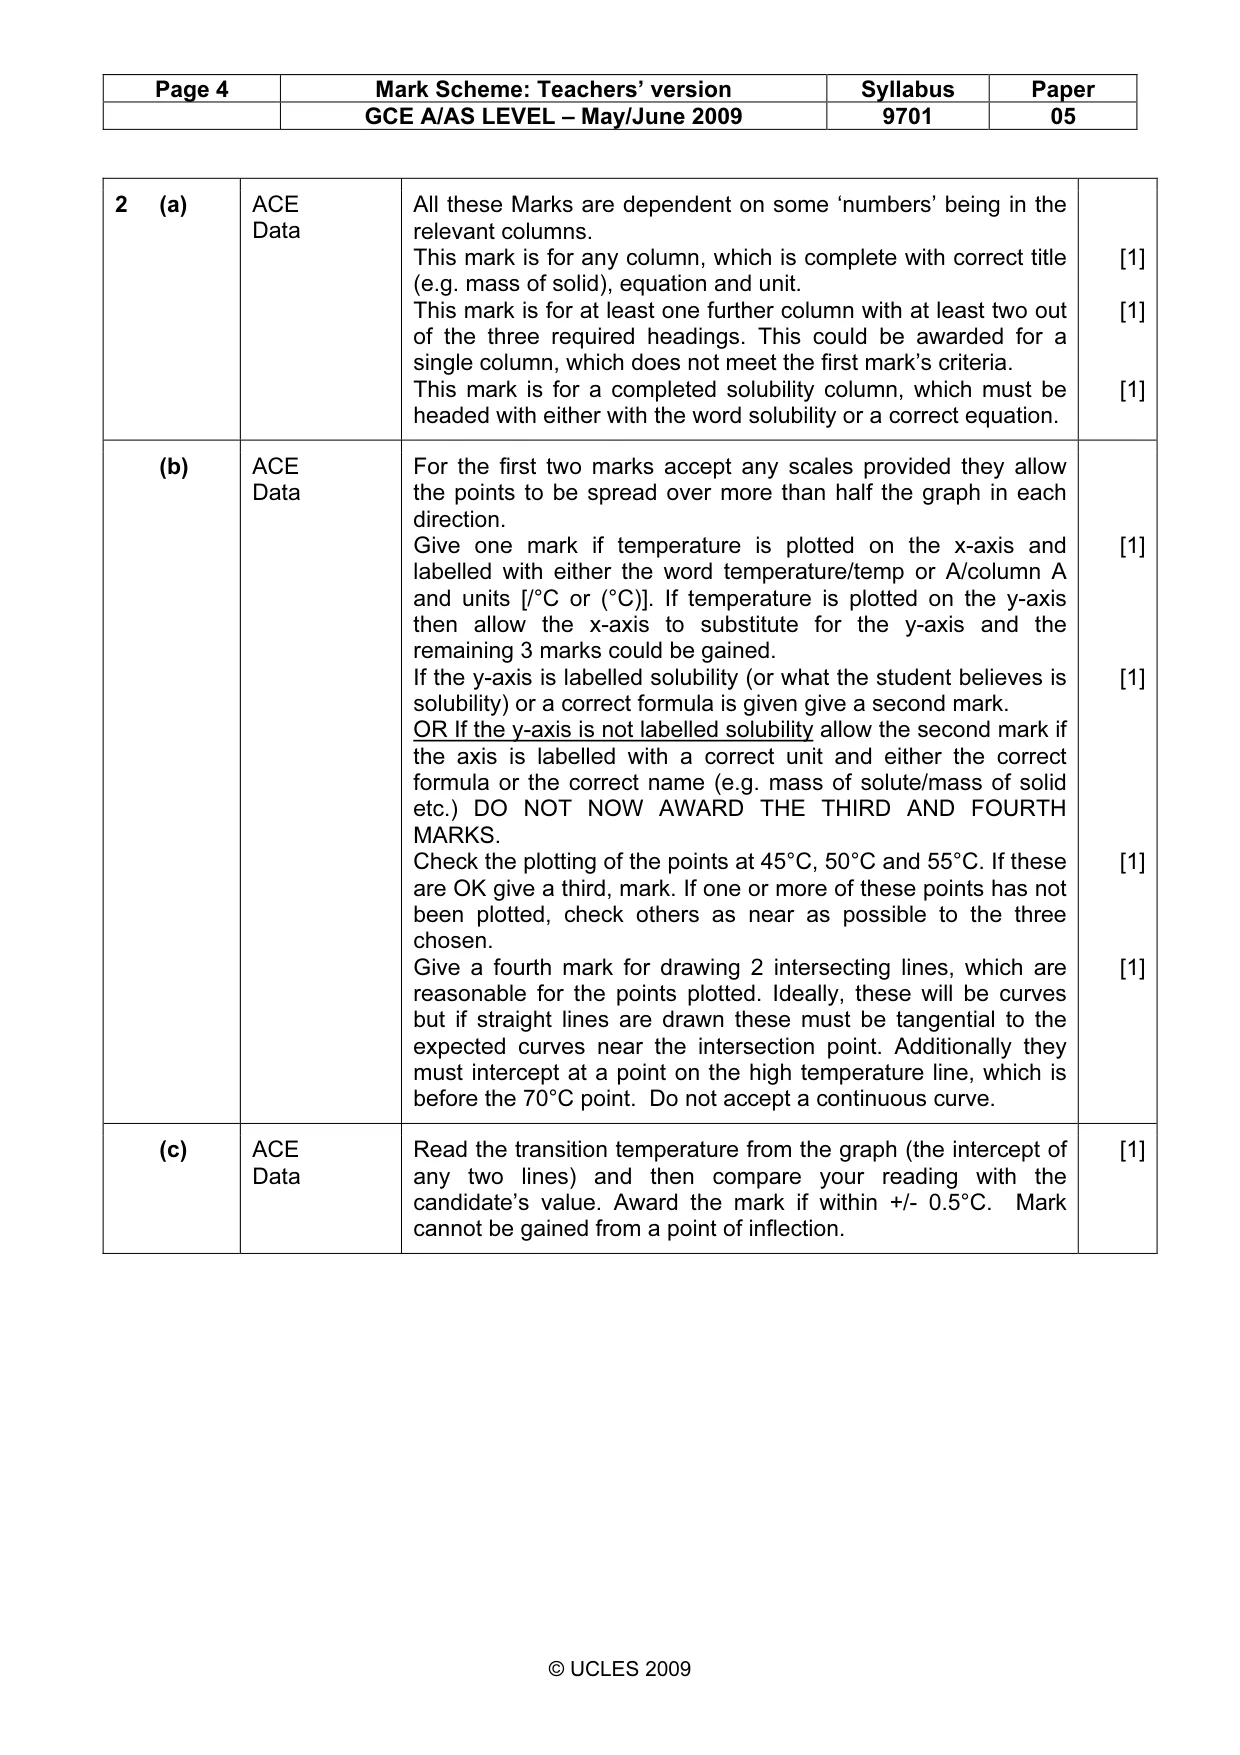
Page 4 Mark Scheme: Teachers’ version Syllabus Paper GCE A/AS LEVEL – May/June 2009 9701 05 © UCLES 2009 2 (a) ACE Data All these Marks are dependent on some ‘numbers’ being in the relevant columns. This mark is for any column, which is complete with correct title (e.g. mass of solid), equation and unit. This mark is for at least one further column with at least two out of the three required headings. This could be awarded for a single column, which does not meet the first mark’s criteria. This mark is for a completed solubility column, which must be headed with either with the word solubility or a correct equation. [1] [1] [1] (b) ACE Data For the first two marks accept any scales provided they allow the points to be spread over more than half the graph in each direction. Give one mark if temperature is plotted on the x-axis and labelled with either the word temperature/temp or A/column A and units [/°C or (°C)]. If temperature is plotted on the y-axis then allow the x-axis to substitute for the y-axis and the remaining 3 marks could be gained. If the y-axis is labelled solubility (or what the student believes is solubility) or a correct formula is given give a second mark. OR If the y-axis is not labelled solubility allow the second mark if the axis is labelled with a correct unit and either the correct formula or the correct name (e.g. mass of solute/mass of solid etc.) DO NOT NOW AWARD THE THIRD AND FOURTH MARKS. Check the plotting of the points at 45°C, 50°C and 55°C. If these are OK give a third, mark. If one or more of these points has not been plotted, check others as near as possible to the three chosen. Give a fourth mark for drawing 2 intersecting lines, which are reasonable for the points plotted. Ideally, these will be curves but if straight lines are drawn these must be tangential to the expected curves near the intersection point. Additionally they must intercept at a point on the high temperature line, which is before the 70°C point. Do not accept a continuous curve. [1] [1] [1] [1] (c) ACE Data Read the transition temperature from the graph (the intercept of any two lines) and then compare your reading with the candidate’s value. Award the mark if within +/- 0.5°C. Mark cannot be gained from a point of inflection. [1]
Mark scheme, page 5
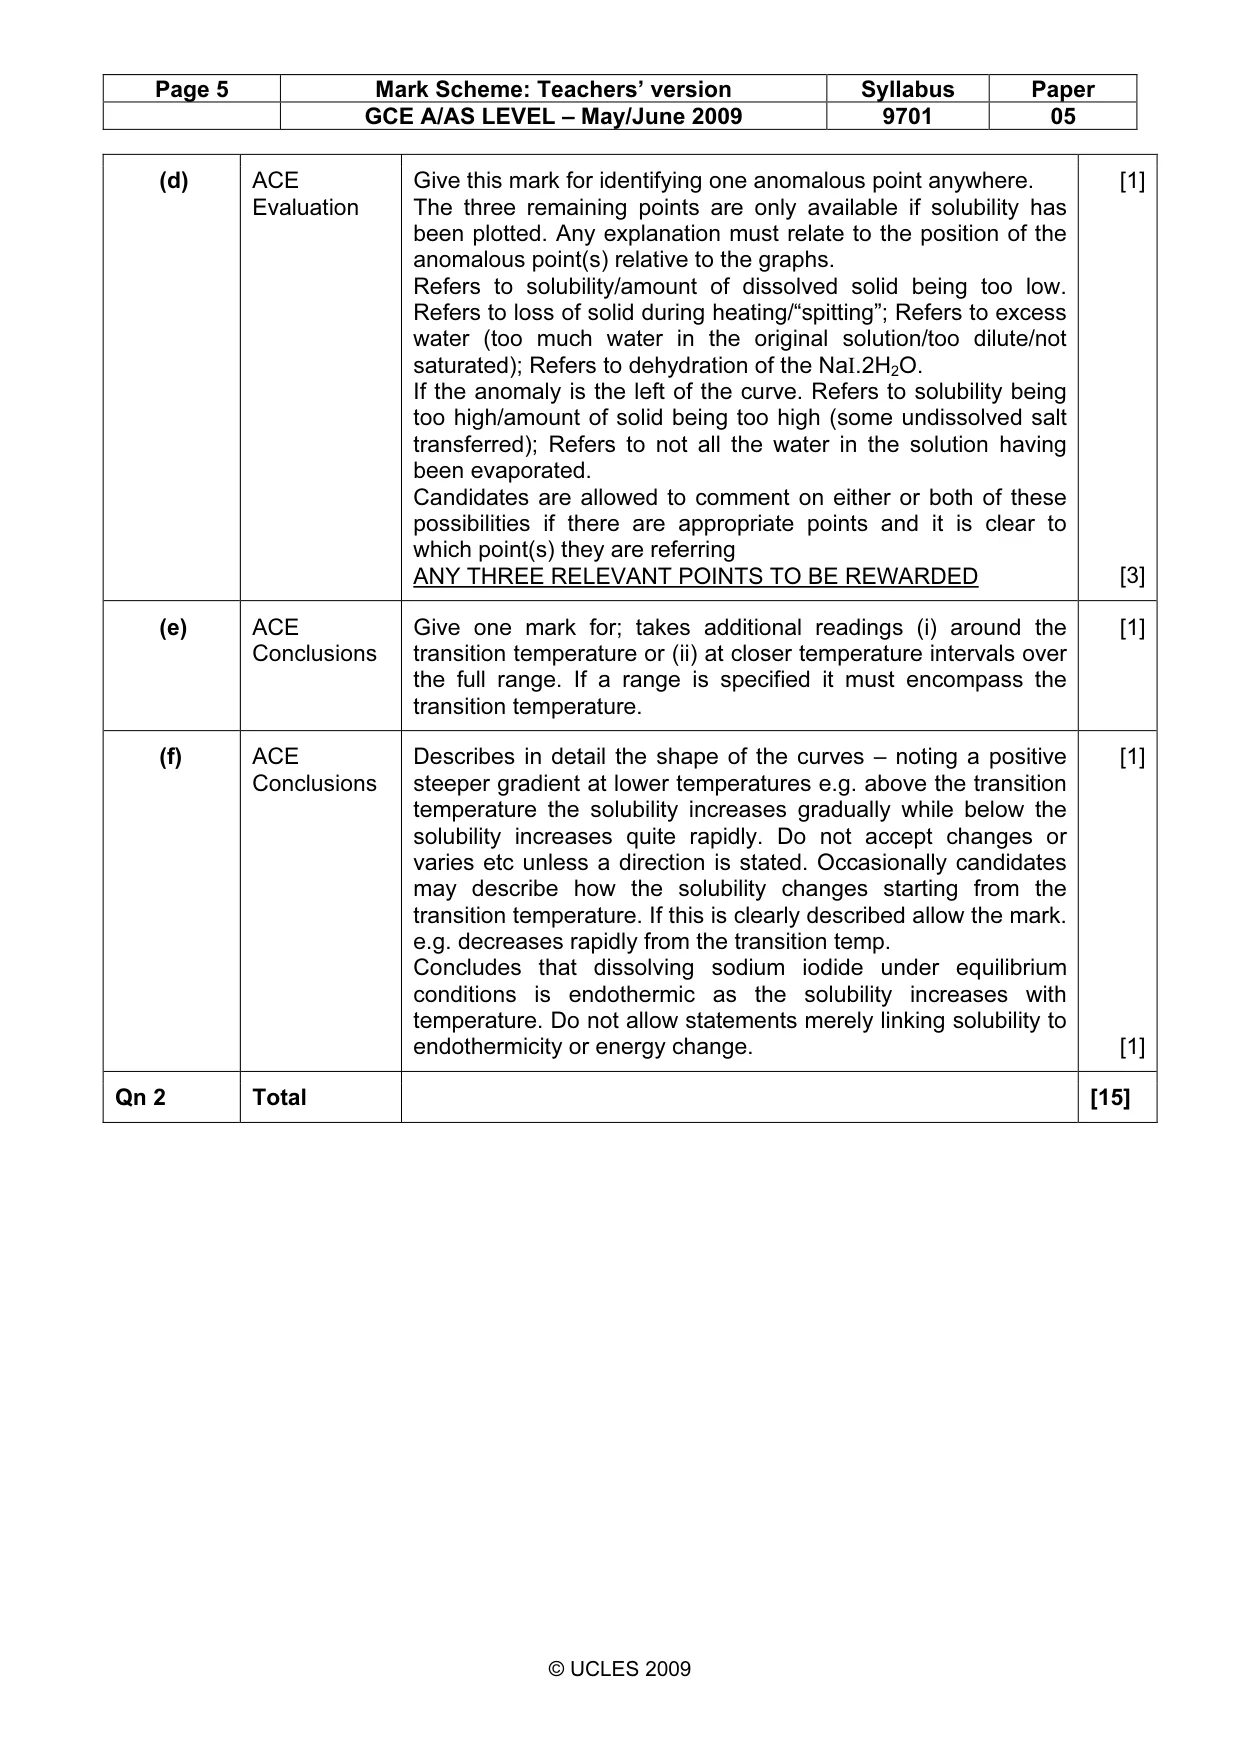
Page 5 Mark Scheme: Teachers’ version Syllabus Paper GCE A/AS LEVEL – May/June 2009 9701 05 © UCLES 2009 (d) ACE Evaluation Give this mark for identifying one anomalous point anywhere. The three remaining points are only available if solubility has been plotted. Any explanation must relate to the position of the anomalous point(s) relative to the graphs. Refers to solubility/amount of dissolved solid being too low. Refers to loss of solid during heating/“spitting”; Refers to excess water (too much water in the original solution/too dilute/not saturated); Refers to dehydration of the NaI.2H2O. If the anomaly is the left of the curve. Refers to solubility being too high/amount of solid being too high (some undissolved salt transferred); Refers to not all the water in the solution having been evaporated. Candidates are allowed to comment on either or both of these possibilities if there are appropriate points and it is clear to which point(s) they are referring ANY THREE RELEVANT POINTS TO BE REWARDED [1] [3] (e) ACE Conclusions Give one mark for; takes additional readings (i) around the transition temperature or (ii) at closer temperature intervals over the full range. If a range is specified it must encompass the transition temperature. [1] (f) ACE Conclusions Describes in detail the shape of the curves – noting a positive steeper gradient at lower temperatures e.g. above the transition temperature the solubility increases gradually while below the solubility increases quite rapidly. Do not accept changes or varies etc unless a direction is stated. Occasionally candidates may describe how the solubility changes starting from the transition temperature. If this is clearly described allow the mark. e.g. decreases rapidly from the transition temp. Concludes that dissolving sodium iodide under equilibrium conditions is endothermic as the solubility increases with temperature. Do not allow statements merely linking solubility to endothermicity or energy change. [1] [1] Qn 2 Total [15]
What you needed in this session
Cambridge’s own grade thresholds for 2009 May/June, Paper 5 · Variant 1. A higher threshold means an easier paper — the bar moves with how the cohort did.