Cambridge A Level Chemistry 9701 — 2008 Oct/Nov Paper 5 · Variant 1
9701/51/O/N/08 · 30 marks · ≈34 min
The question paper and its mark scheme, free to read here and free to download. This is Cambridge’s own paper, exactly as it was sat.
Question paper12 pages
Mark scheme8 pages
Answers below. Sit the paper first if you are practising.
Paper as text
Question paper, page 1
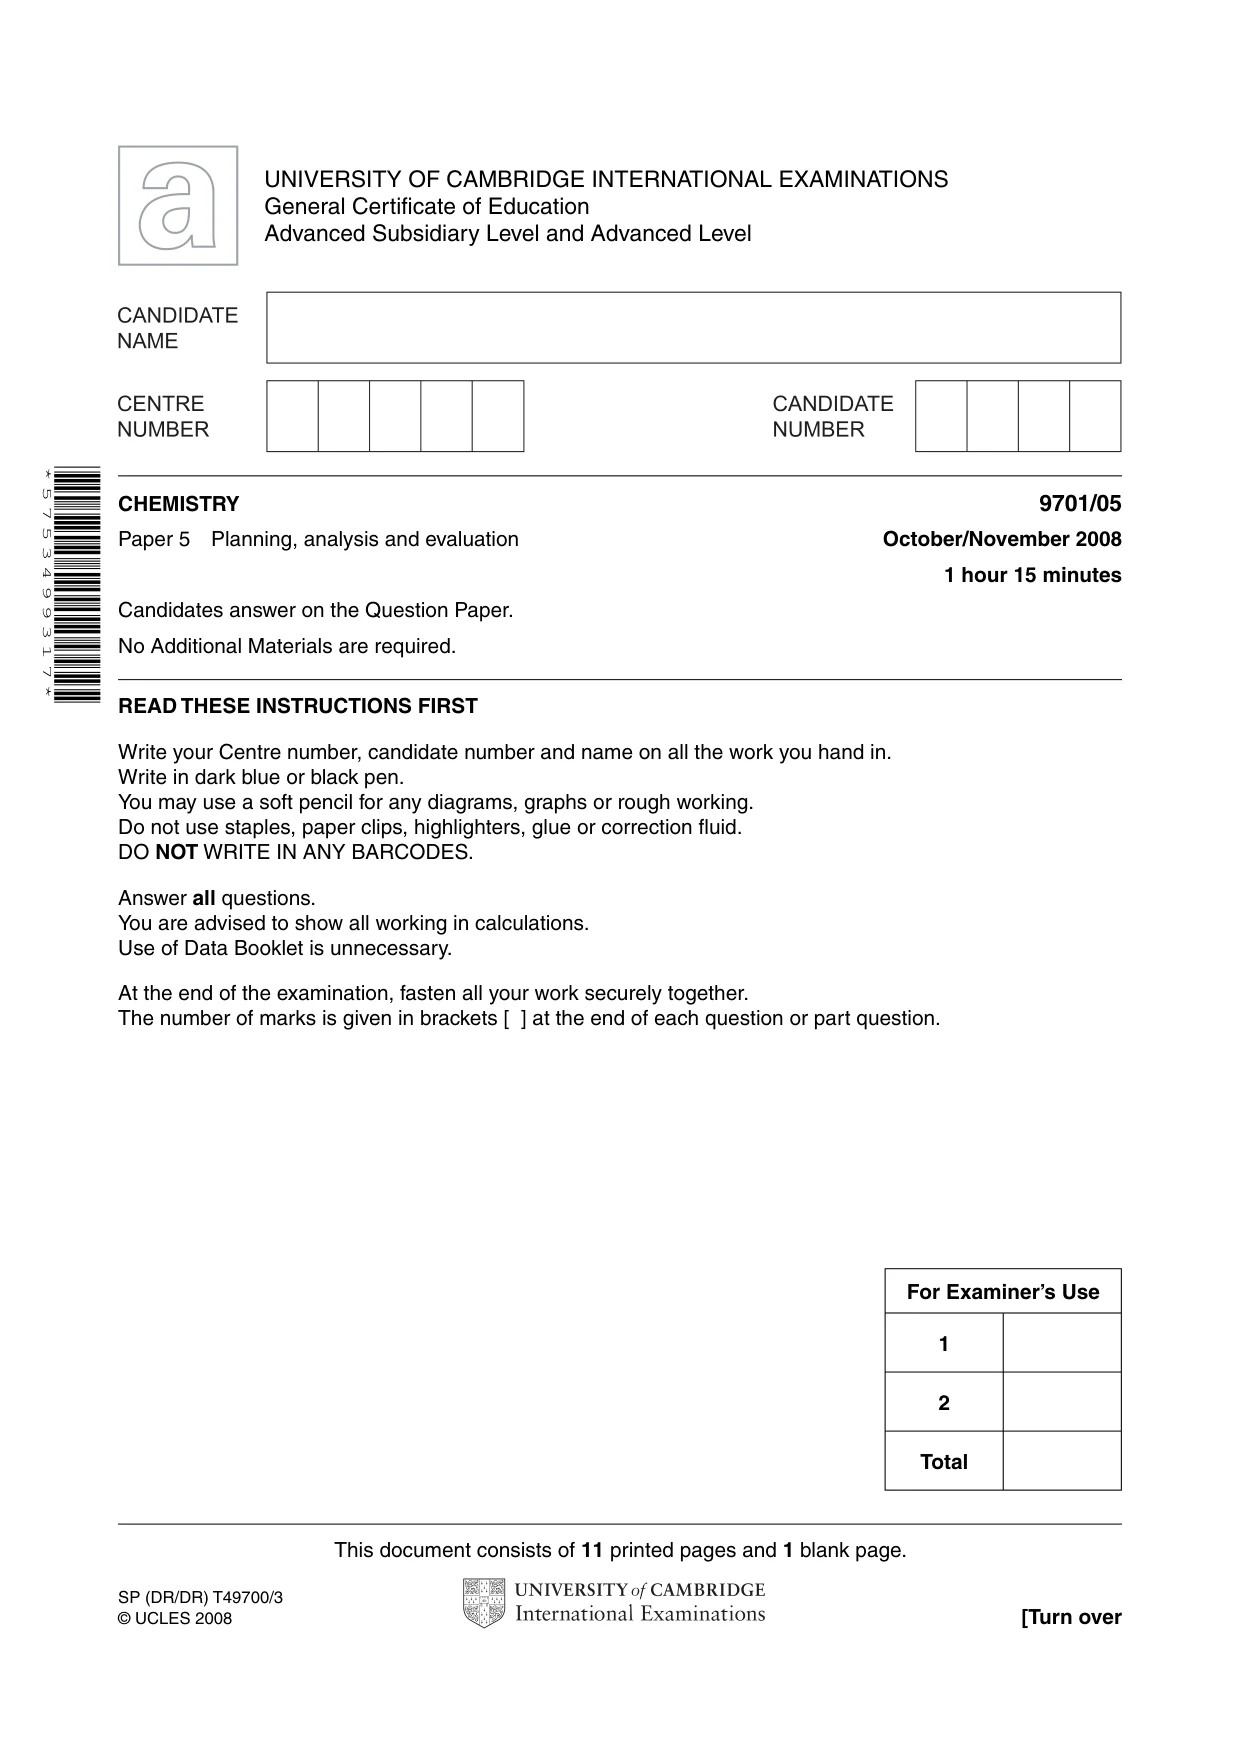
This document consists of 11 printed pages and 1 blank page. SP (DR/DR) T49700/3 © UCLES 2008 [Turn over UNIVERSITY OF CAMBRIDGE INTERNATIONAL EXAMINATIONS General Certificate of Education Advanced Subsidiary Level and Advanced Level READ THESE INSTRUCTIONS FIRST Write your Centre number, candidate number and name on all the work you hand in. Write in dark blue or black pen. You may use a soft pencil for any diagrams, graphs or rough working. Do not use staples, paper clips, highlighters, glue or correction fluid. DO NOT WRITE IN ANY BARCODES. Answer all questions. You are advised to show all working in calculations. Use of Data Booklet is unnecessary. At the end of the examination, fasten all your work securely together. The number of marks is given in brackets [ ] at the end of each question or part question. * 5 7 5 3 4 9 9 3 1 7 * CHEMISTRY 9701/05 Paper 5 Planning, analysis and evaluation October/November 2008 1 hour 15 minutes Candidates answer on the Question Paper. No Additional Materials are required. For Examiner’s Use 1 2 Total
Question paper, page 2
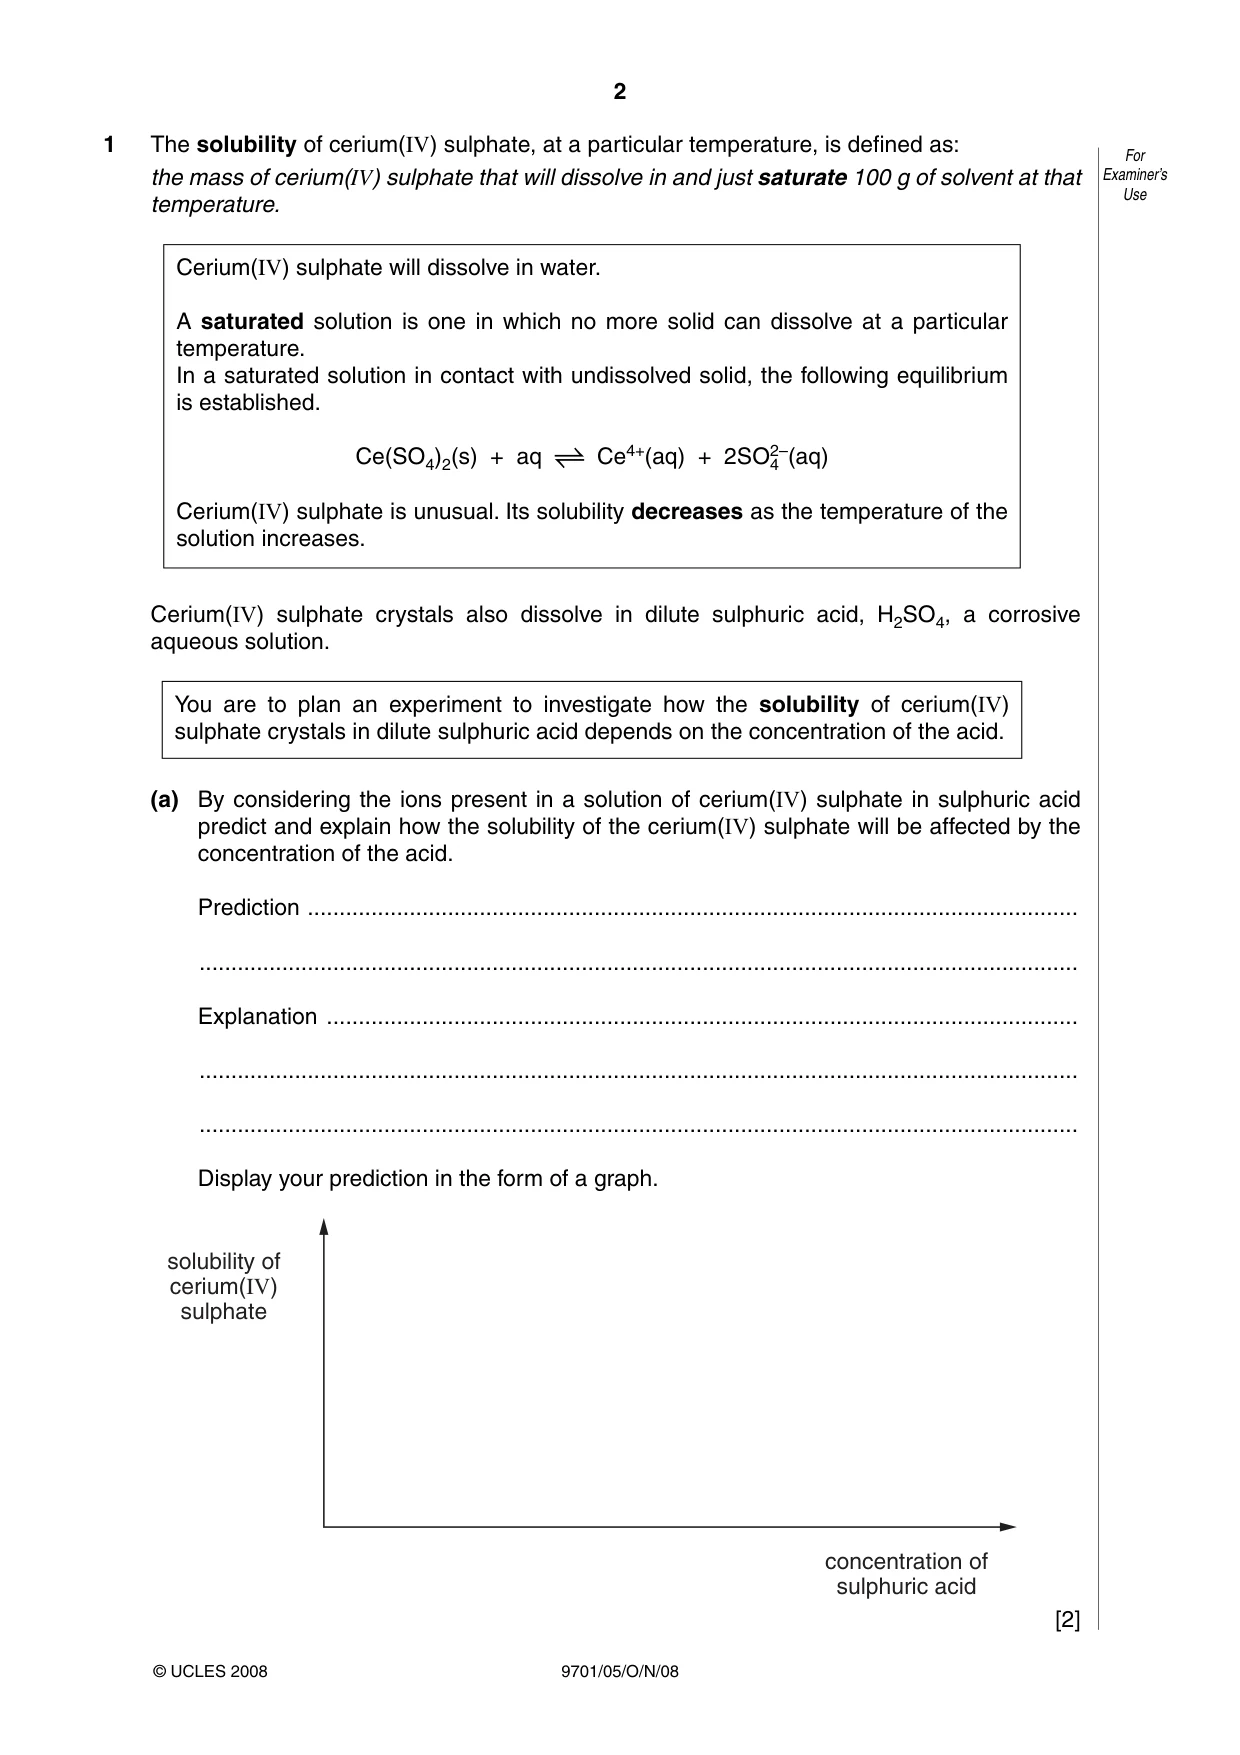
2 9701/05/O/N/08 For Examiner’s Use © UCLES 2008 1 The solubility of cerium(IV) sulphate, at a particular temperature, is defined as: the mass of cerium(IV) sulphate that will dissolve in and just saturate 100 g of solvent at that temperature. Cerium(IV) sulphate will dissolve in water. A saturated solution is one in which no more solid can dissolve at a particular temperature. In a saturated solution in contact with undissolved solid, the following equilibrium is established. Ce(SO4)2(s) + aq Ce4+(aq) + 2SO4 2–(aq) Cerium(IV) sulphate is unusual. Its solubility decreases as the temperature of the solution increases. Cerium(IV) sulphate crystals also dissolve in dilute sulphuric acid, H2SO4, a corrosive aqueous solution. You are to plan an experiment to investigate how the solubility of cerium(IV) sulphate crystals in dilute sulphuric acid depends on the concentration of the acid. (a) By considering the ions present in a solution of cerium(IV) sulphate in sulphuric acid predict and explain how the solubility of the cerium(IV) sulphate will be affected by the concentration of the acid. Prediction … … Explanation … … … Display your prediction in the form of a graph. solubility of cerium(IV) sulphate concentration of sulphuric acid [2]
Question paper, page 3
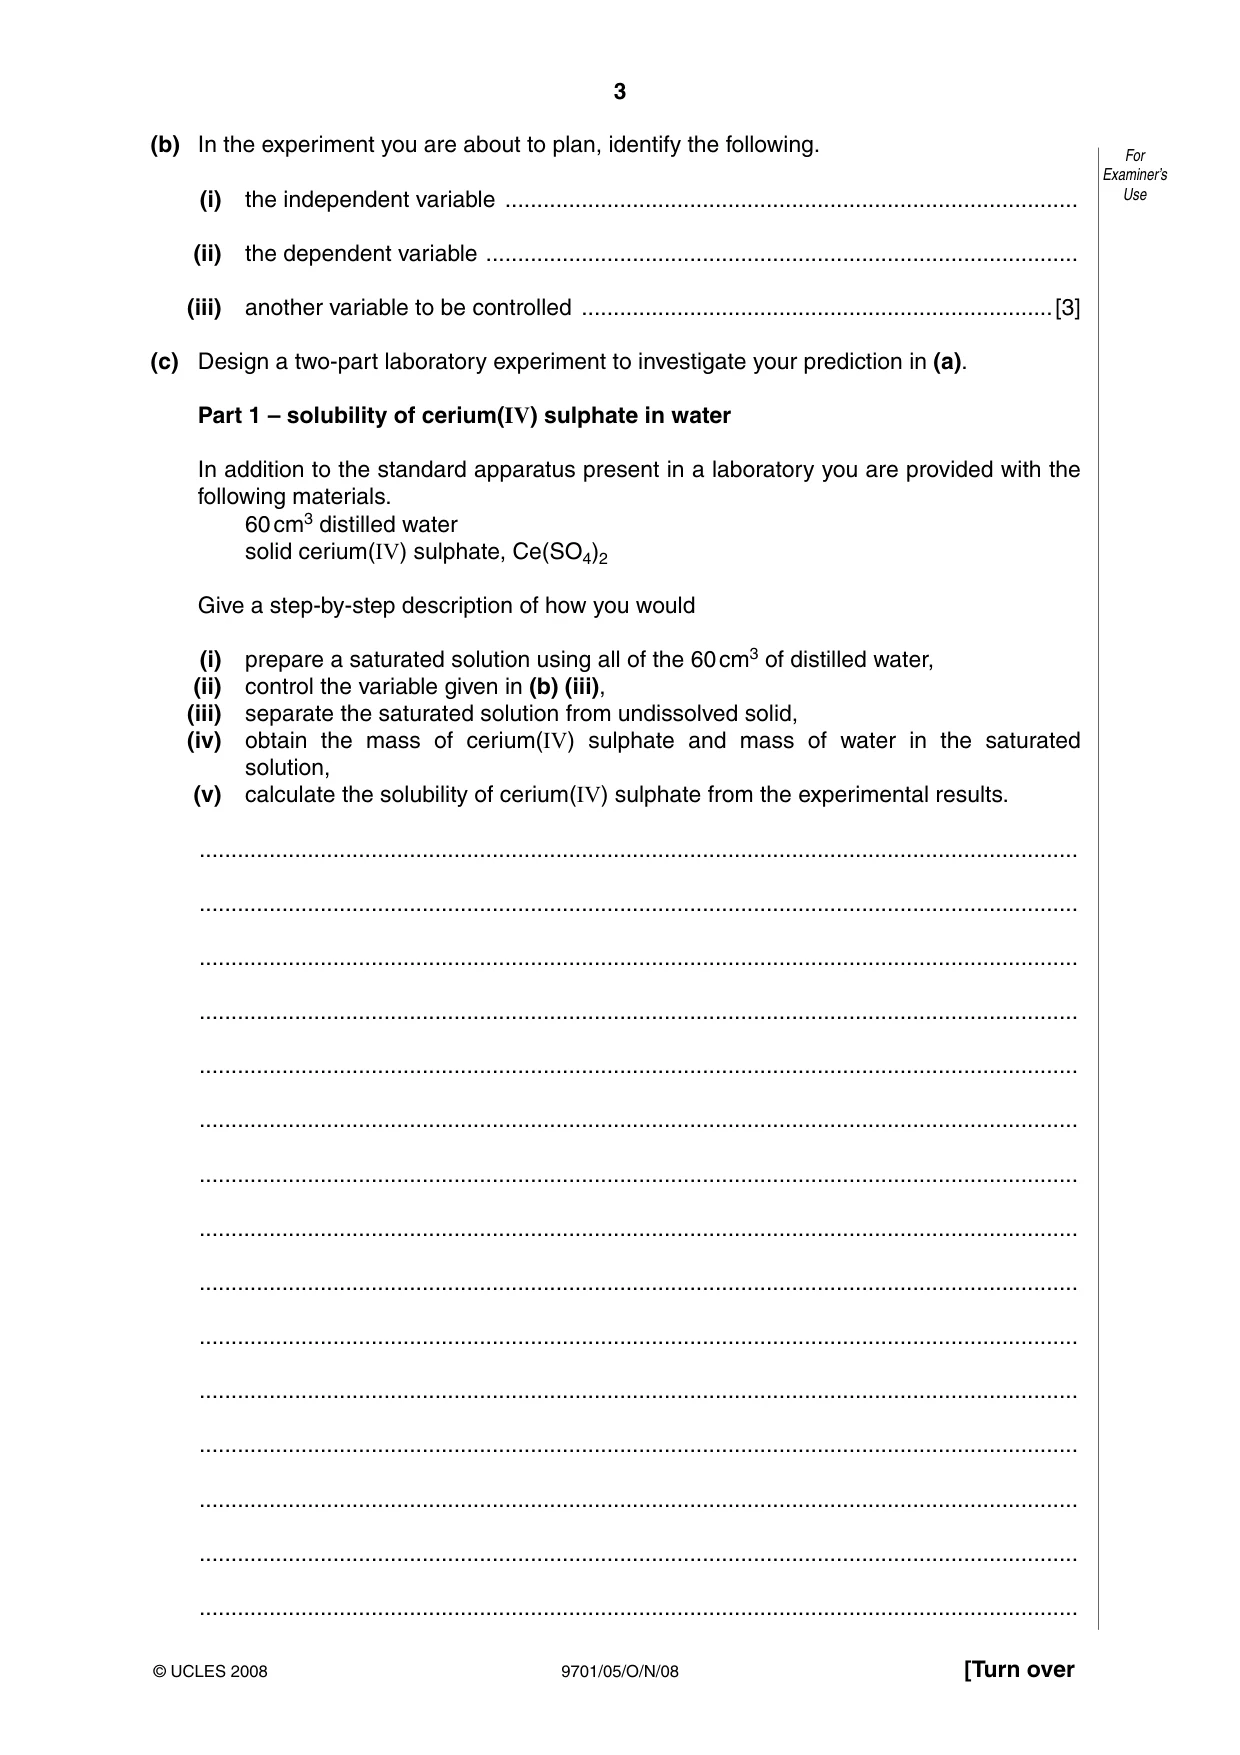
3 9701/05/O/N/08 [Turn over For Examiner’s Use © UCLES 2008 (b) In the experiment you are about to plan, identify the following. (i) the independent variable … (ii) the dependent variable … (iii) another variable to be controlled …[3] (c) Design a two-part laboratory experiment to investigate your prediction in (a). Part 1 – solubility of cerium(IV) sulphate in water In addition to the standard apparatus present in a laboratory you are provided with the following materials. 60 cm3 distilled water solid cerium(IV) sulphate, Ce(SO4)2 Give a step-by-step description of how you would (i) prepare a saturated solution using all of the 60 cm3 of distilled water, (ii) control the variable given in (b) (iii), (iii) separate the saturated solution from undissolved solid, (iv) obtain the mass of cerium(IV) sulphate and mass of water in the saturated solution, (v) calculate the solubility of cerium(IV) sulphate from the experimental results. … … … … … … … … … … … … … … …
Question paper, page 4
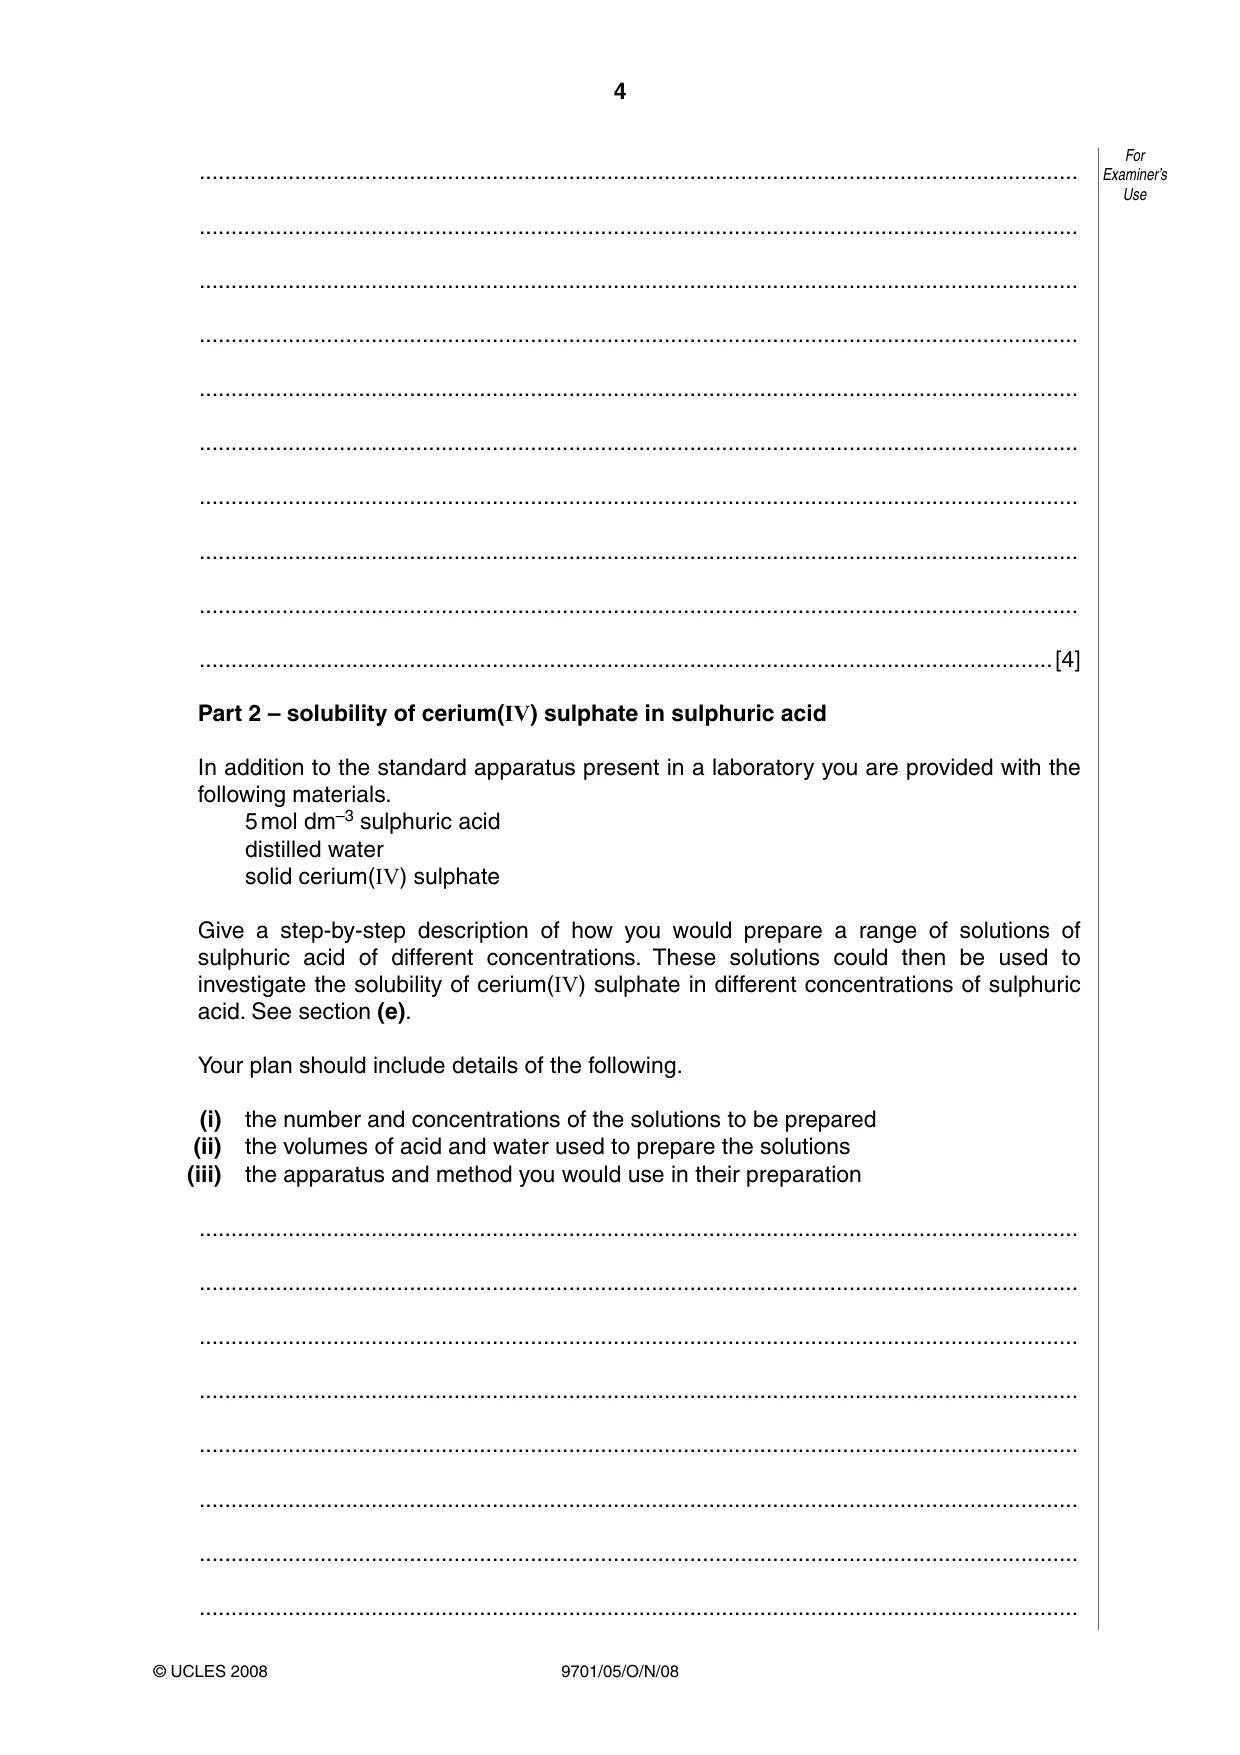
4 9701/05/O/N/08 For Examiner’s Use © UCLES 2008 … … … … … … … … … …[4] Part 2 – solubility of cerium(IV) sulphate in sulphuric acid In addition to the standard apparatus present in a laboratory you are provided with the following materials. 5 mol dm–3 sulphuric acid distilled water solid cerium(IV) sulphate Give a step-by-step description of how you would prepare a range of solutions of sulphuric acid of different concentrations. These solutions could then be used to investigate the solubility of cerium(IV) sulphate in different concentrations of sulphuric acid. See section (e). Your plan should include details of the following. (i) the number and concentrations of the solutions to be prepared (ii) the volumes of acid and water used to prepare the solutions (iii) the apparatus and method you would use in their preparation … … … … … … … …
Question paper, page 5
5 9701/05/O/N/08 [Turn over For Examiner’s Use © UCLES 2008 … … … … … … … … … … … … … … … … … … … … … … …[4] (d) State a risk that must be taken into consideration when planning the experiment. … … …[1]
Question paper, page 6
6 9701/05/O/N/08 For Examiner’s Use © UCLES 2008 (e) Draw up a table with appropriate headings to show the data you would record when investigating the solubility of cerium(IV) sulphate in the solutions of sulphuric acid planned in (c), Part 2. [1] [Total: 15]
Question paper, page 7
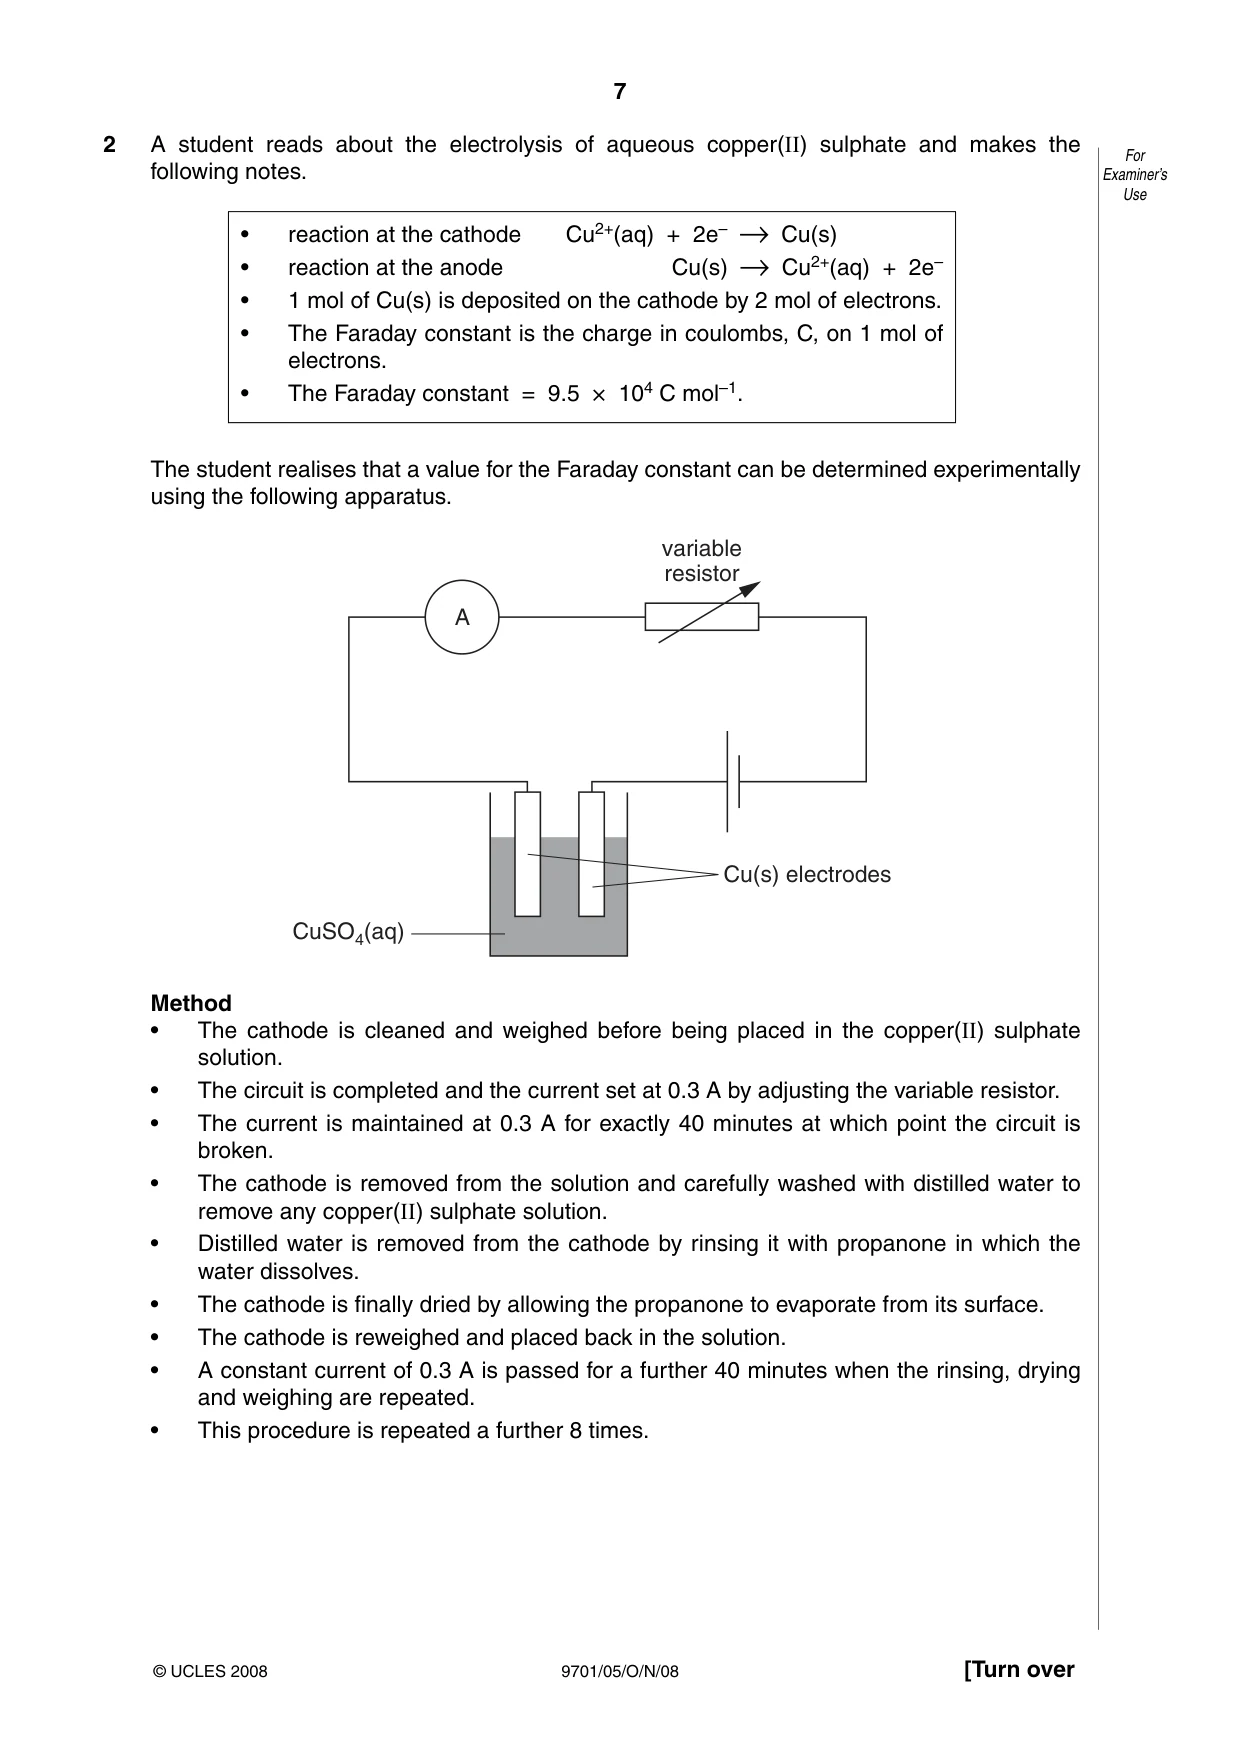
7 9701/05/O/N/08 [Turn over For Examiner’s Use © UCLES 2008 2 A student reads about the electrolysis of aqueous copper(II) sulphate and makes the following notes. • reaction at the cathode Cu2+(aq) + 2e– Cu(s) • reaction at the anode Cu(s) Cu2+(aq) + 2e– • 1 mol of Cu(s) is deposited on the cathode by 2 mol of electrons. • The Faraday constant is the charge in coulombs, C, on 1 mol of electrons. • The Faraday constant = 9.5 × 10⁴ C mol–1. The student realises that a value for the Faraday constant can be determined experimentally using the following apparatus. A variable resistor Cu(s) electrodes CuSO4(aq) Method • The cathode is cleaned and weighed before being placed in the copper(II) sulphate solution. • The circuit is completed and the current set at 0.3 A by adjusting the variable resistor. • The current is maintained at 0.3 A for exactly 40 minutes at which point the circuit is broken. • The cathode is removed from the solution and carefully washed with distilled water to remove any copper(II) sulphate solution. • Distilled water is removed from the cathode by rinsing it with propanone in which the water dissolves. • The cathode is finally dried by allowing the propanone to evaporate from its surface. • The cathode is reweighed and placed back in the solution. • A constant current of 0.3 A is passed for a further 40 minutes when the rinsing, drying and weighing are repeated. • This procedure is repeated a further 8 times.
Question paper, page 8
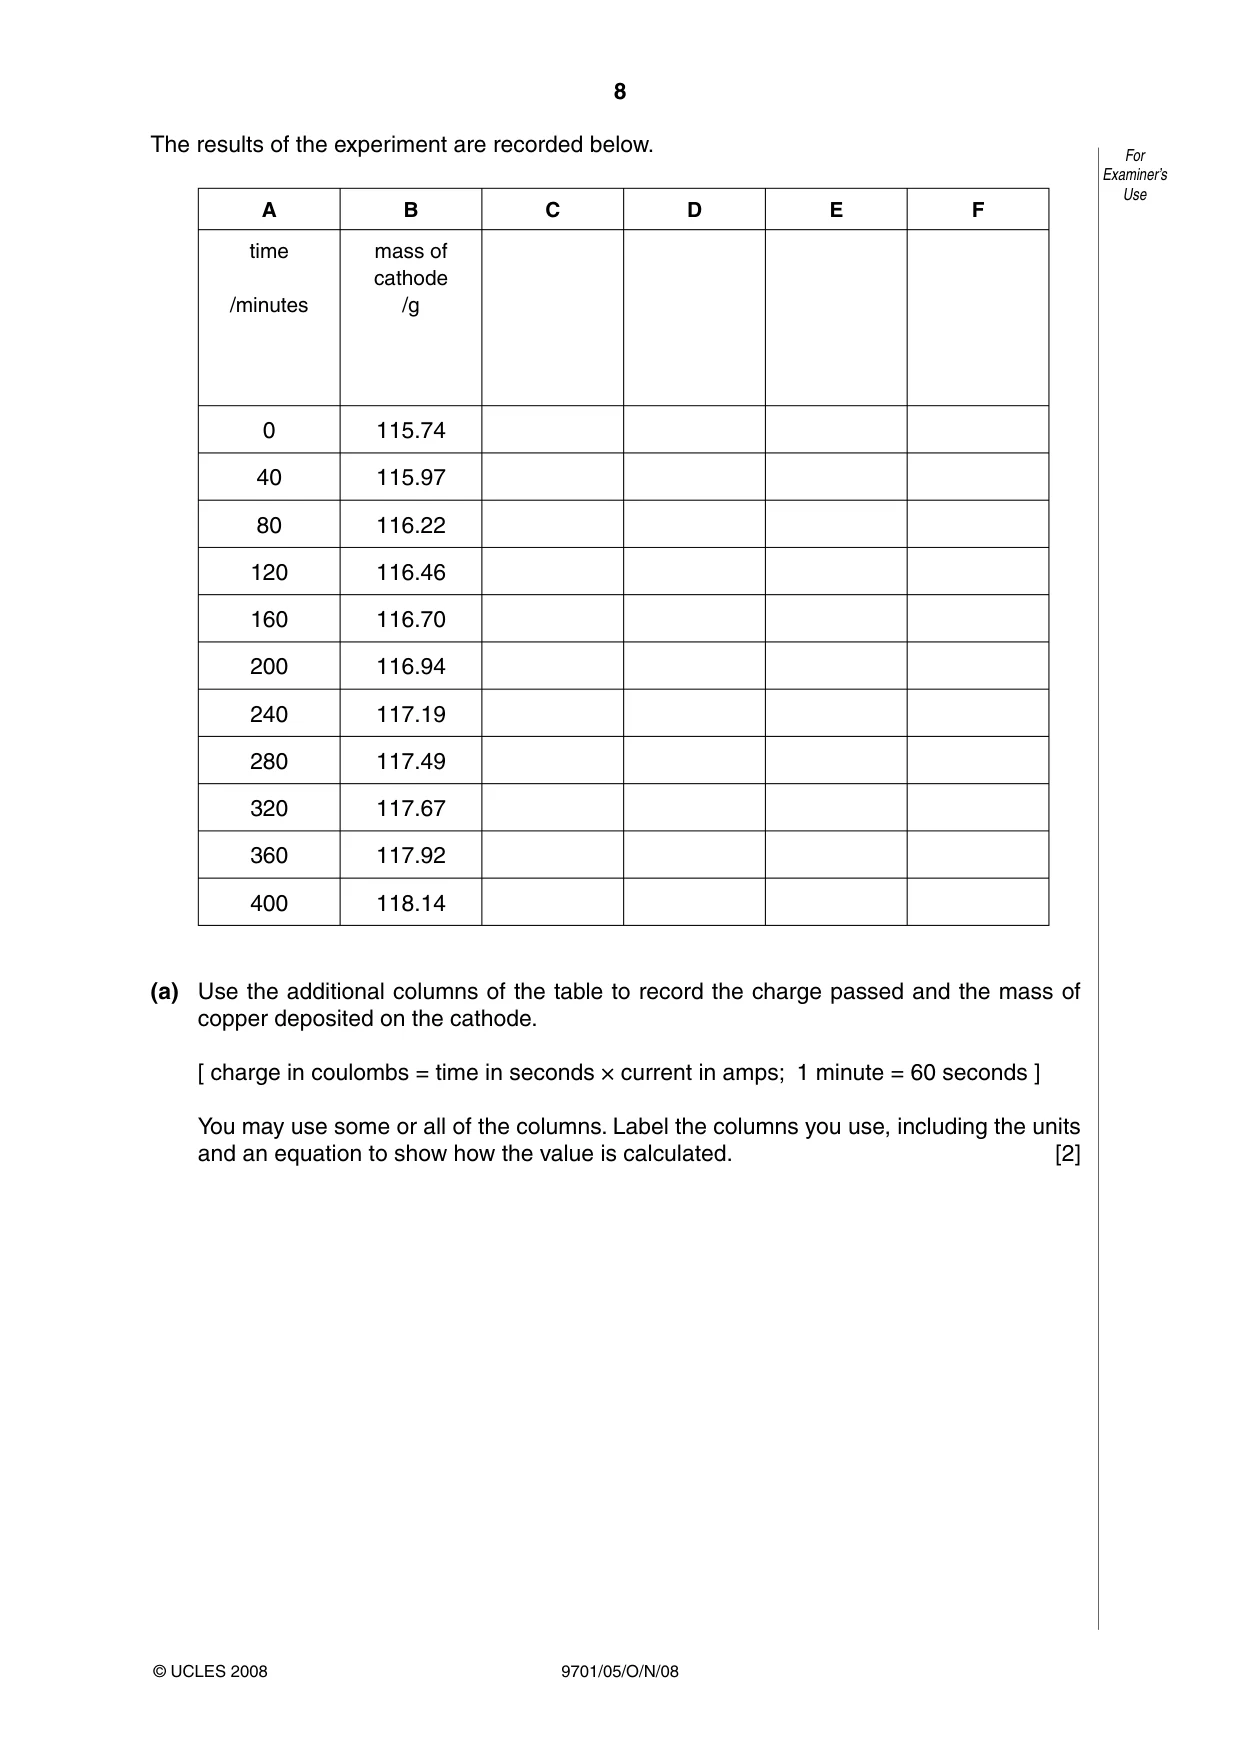
8 9701/05/O/N/08 For Examiner’s Use © UCLES 2008 The results of the experiment are recorded below. A B C D E F time /minutes mass of cathode /g 0 115.74 40 115.97 80 116.22 120 116.46 160 116.70 200 116.94 240 117.19 280 117.49 320 117.67 360 117.92 400 118.14 (a) Use the additional columns of the table to record the charge passed and the mass of copper deposited on the cathode. [ charge in coulombs = time in seconds × current in amps; 1 minute = 60 seconds ] You may use some or all of the columns. Label the columns you use, including the units and an equation to show how the value is calculated. [2]
Question paper, page 9
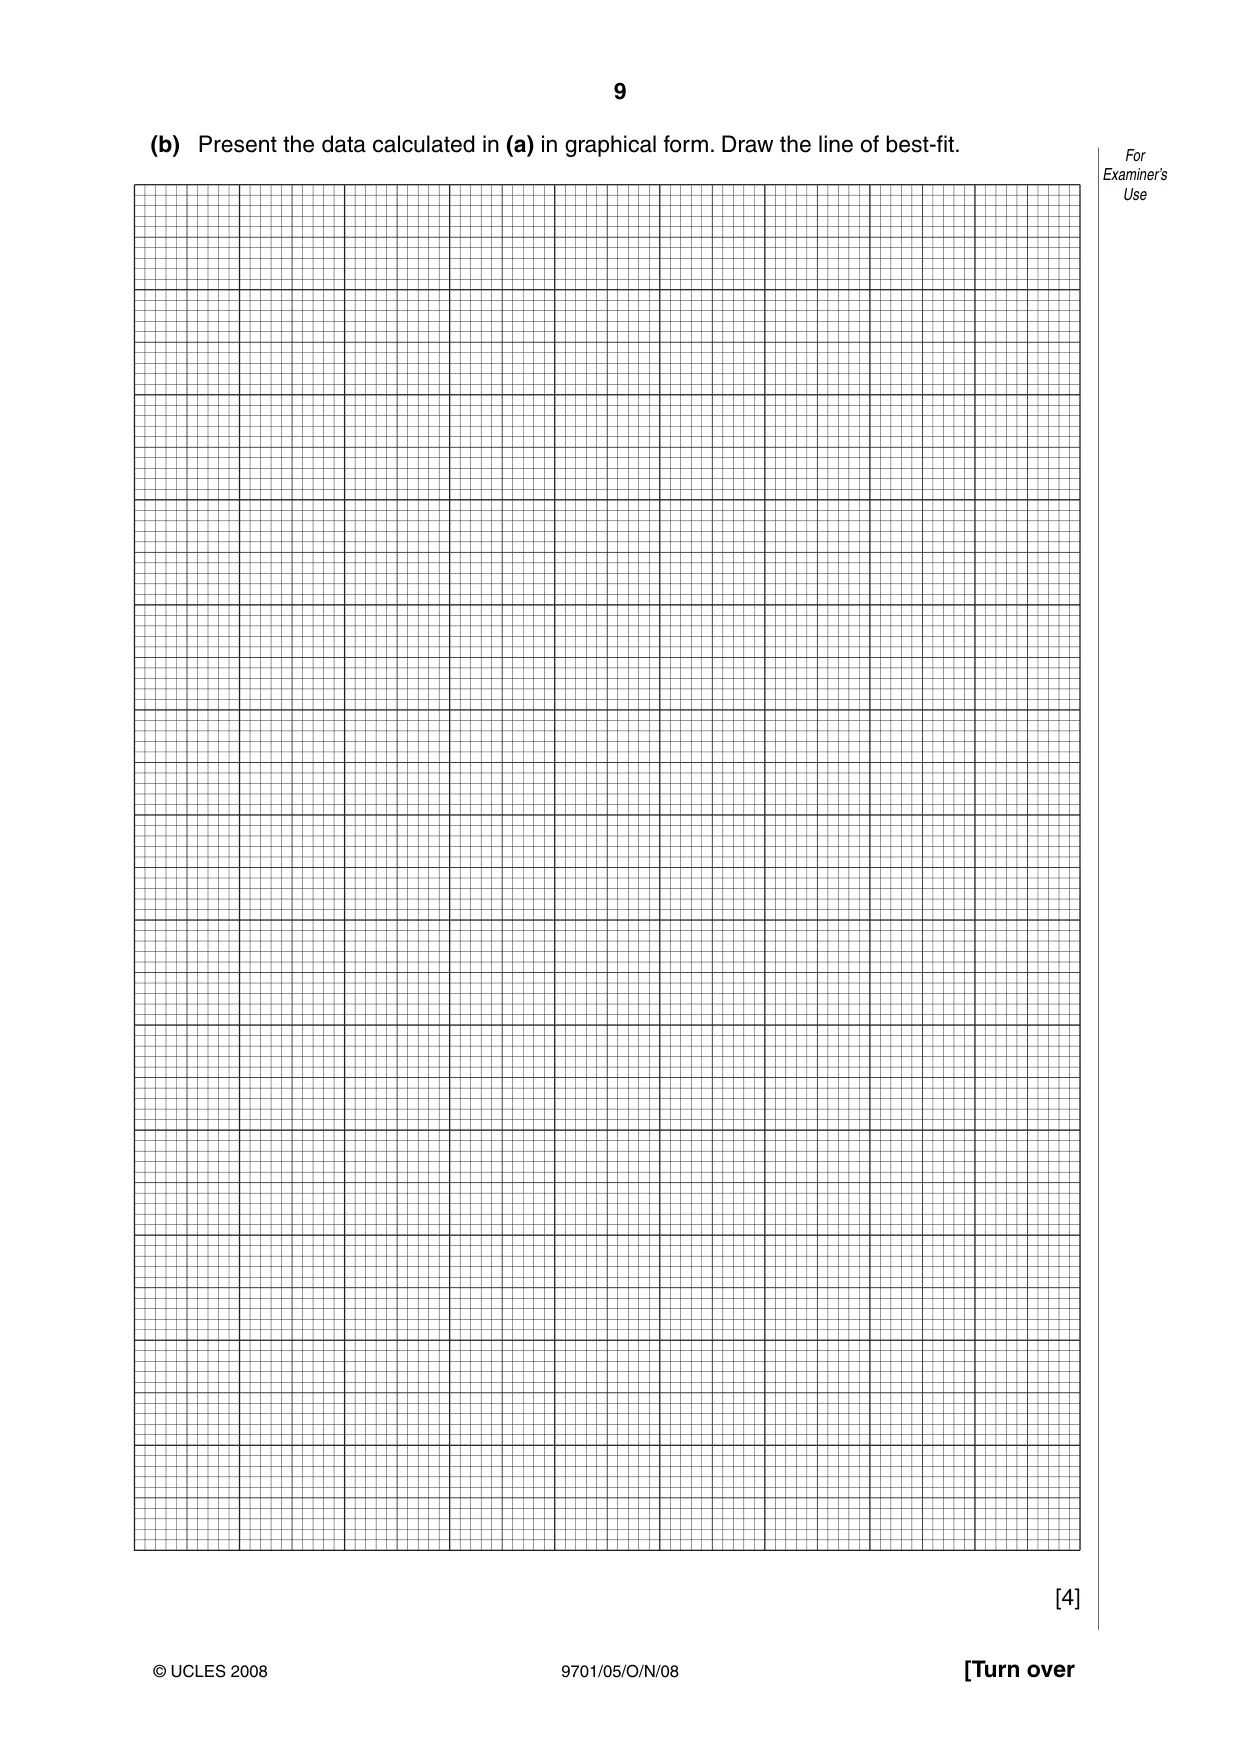
9 9701/05/O/N/08 [Turn over For Examiner’s Use © UCLES 2008 (b) Present the data calculated in (a) in graphical form. Draw the line of best-fit. [4]
Question paper, page 10
10 9701/05/O/N/08 For Examiner’s Use © UCLES 2008 (c) Indicate clearly one anomalous point on the graph that you did not use when drawing the line of best-fit. By reference to the instructions for the experiment suggest an explanation for the anomaly. … … … … …[2] (d) The balance used by the student weighed to 2 decimal places. By reference to the results of the experiment explain why it would have been more appropriate to use an analytical balance weighing to 4 decimal places. … … … … …[1] (e) Draw construction lines on the graph to derive relevant values and use them to calculate a numerical value for the Faraday constant. reaction at the cathode Cu2+(aq) + 2e– Cu(s) [Ar: Cu; 63.5] The value of the Faraday constant determined in this experiment is … C mol–1. [2]
Question paper, page 11
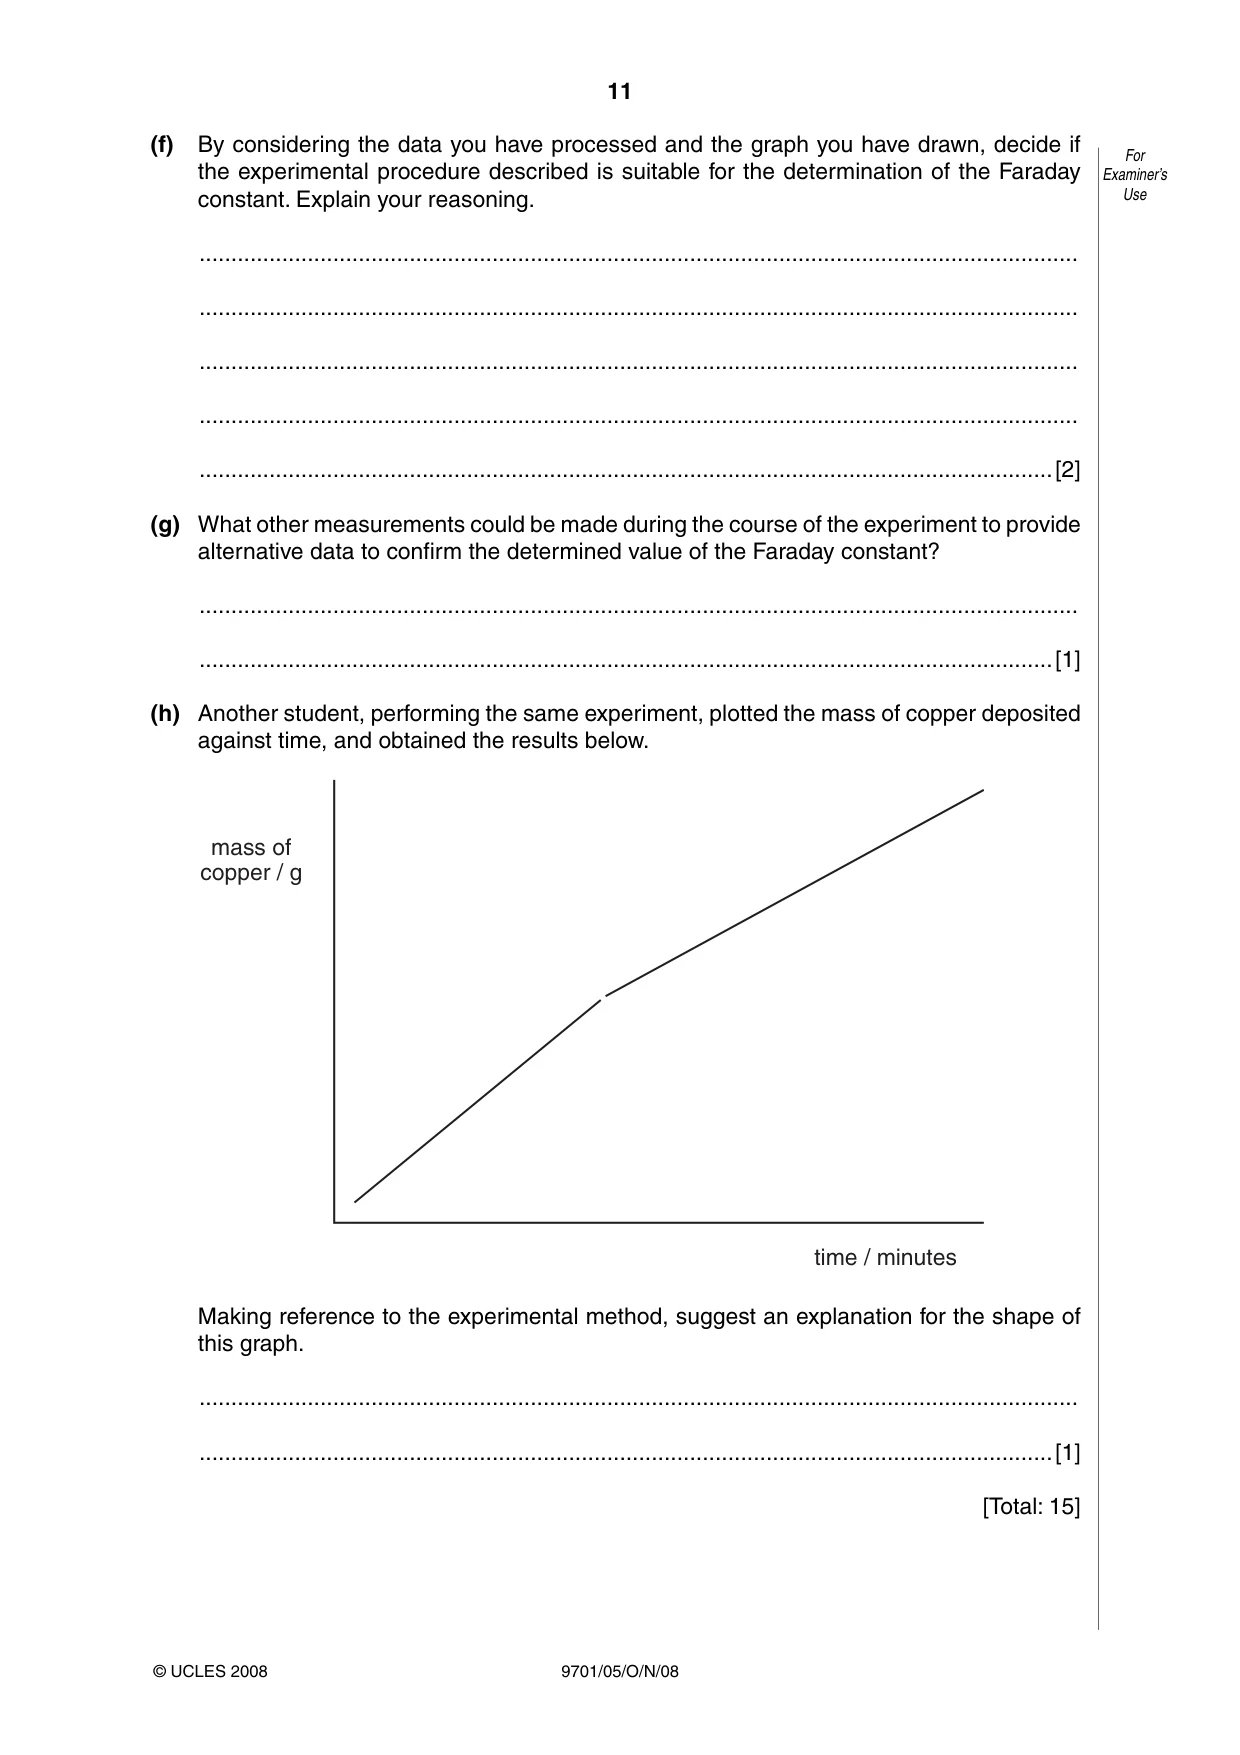
11 9701/05/O/N/08 For Examiner’s Use © UCLES 2008 (f) By considering the data you have processed and the graph you have drawn, decide if the experimental procedure described is suitable for the determination of the Faraday constant. Explain your reasoning. … … … … …[2] (g) What other measurements could be made during the course of the experiment to provide alternative data to confirm the determined value of the Faraday constant? … …[1] (h) Another student, performing the same experiment, plotted the mass of copper deposited against time, and obtained the results below. mass of copper / g time / minutes Making reference to the experimental method, suggest an explanation for the shape of this graph. … …[1] [Total: 15]
Question paper, page 12
12 9701/05/O/N/08 BLANK PAGE Permission to reproduce items where third-party owned material protected by copyright is included has been sought and cleared where possible. Every reasonable effort has been made by the publisher (UCLES) to trace copyright holders, but if any items requiring clearance have unwittingly been included, the publisher will be pleased to make amends at the earliest possible opportunity. University of Cambridge International Examinations is part of the Cambridge Assessment Group. Cambridge Assessment is the brand name of University of Cambridge Local Examinations Syndicate (UCLES), which is itself a department of the University of Cambridge.
Mark scheme, page 1
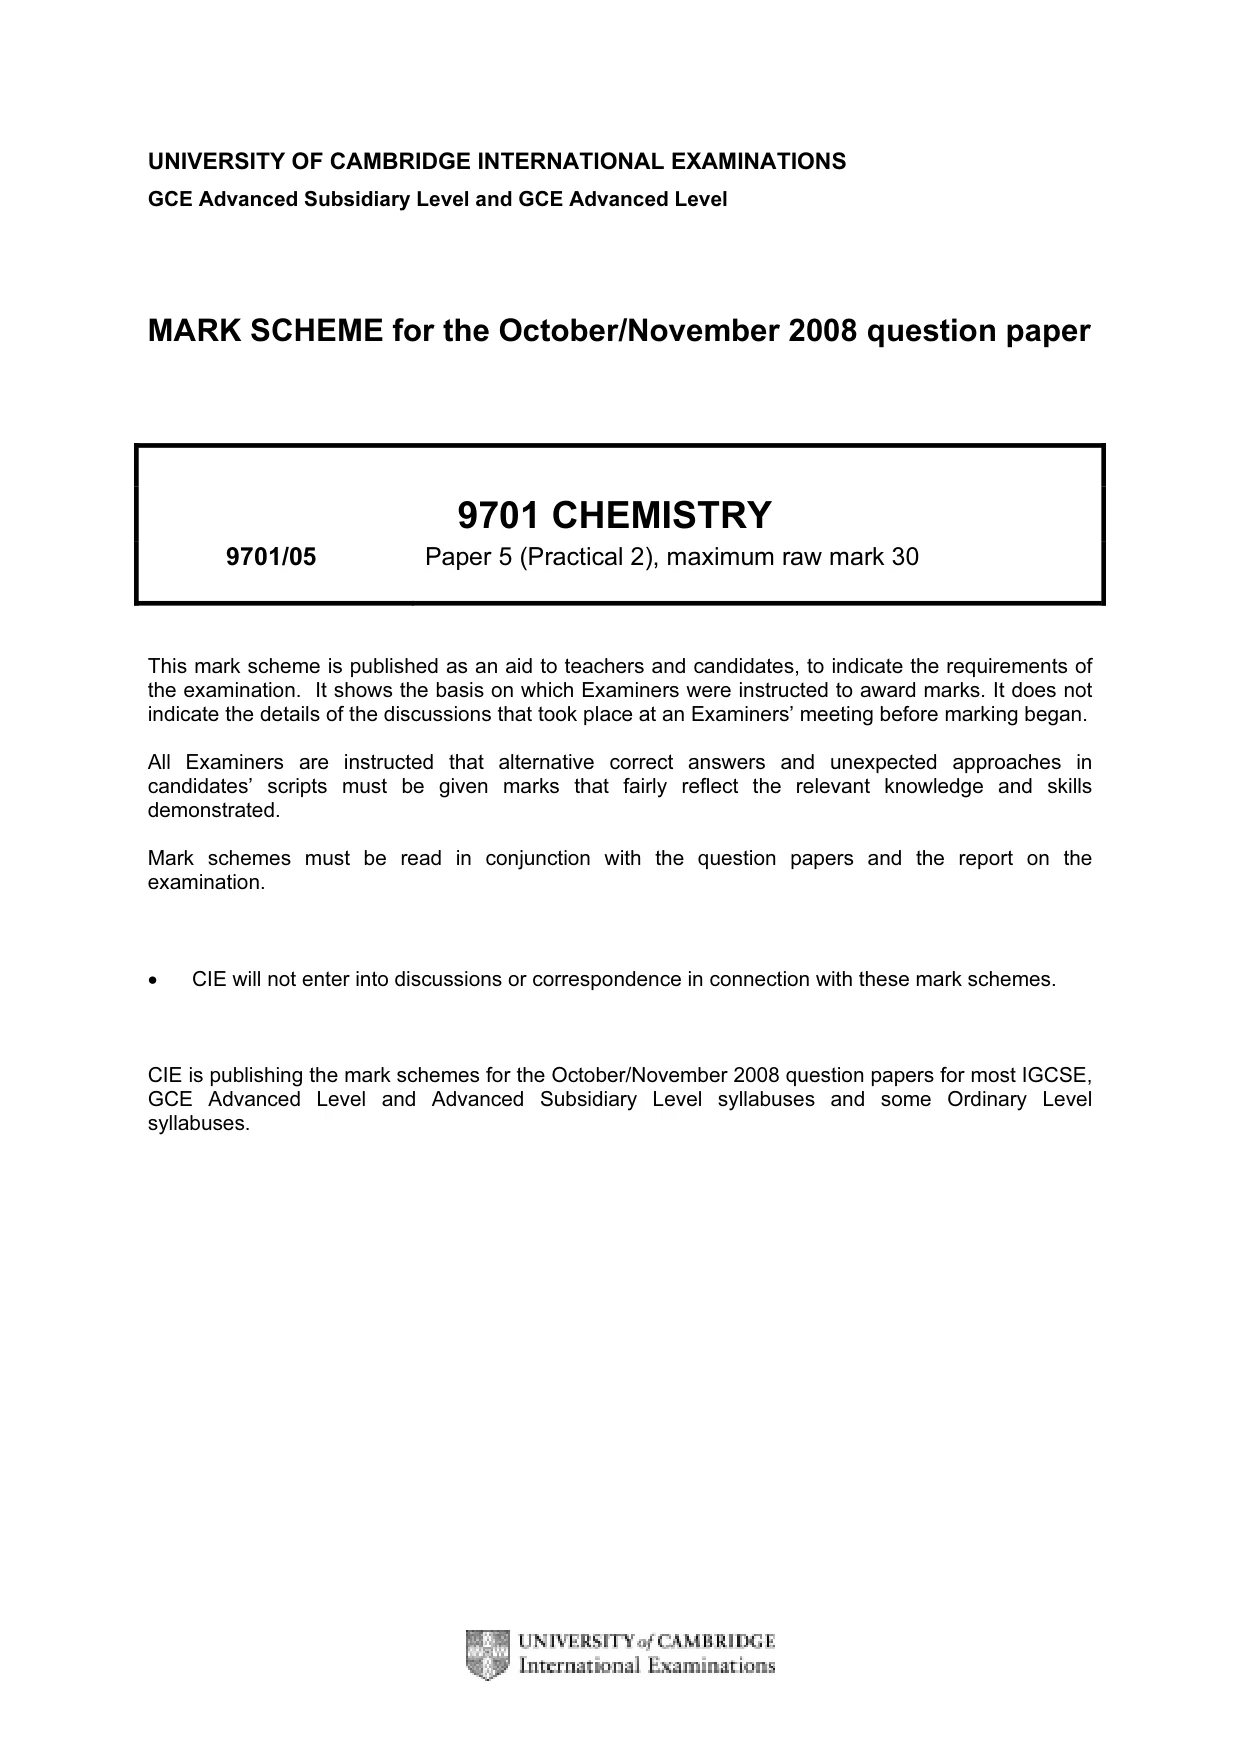
UNIVERSITY OF CAMBRIDGE INTERNATIONAL EXAMINATIONS GCE Advanced Subsidiary Level and GCE Advanced Level MARK SCHEME for the October/November 2008 question paper 9701 CHEMISTRY 9701/05 Paper 5 (Practical 2), maximum raw mark 30 This mark scheme is published as an aid to teachers and candidates, to indicate the requirements of the examination. It shows the basis on which Examiners were instructed to award marks. It does not indicate the details of the discussions that took place at an Examiners’ meeting before marking began. All Examiners are instructed that alternative correct answers and unexpected approaches in candidates’ scripts must be given marks that fairly reflect the relevant knowledge and skills demonstrated. Mark schemes must be read in conjunction with the question papers and the report on the examination. • CIE will not enter into discussions or correspondence in connection with these mark schemes. CIE is publishing the mark schemes for the October/November 2008 question papers for most IGCSE, GCE Advanced Level and Advanced Subsidiary Level syllabuses and some Ordinary Level syllabuses.
Mark scheme, page 2
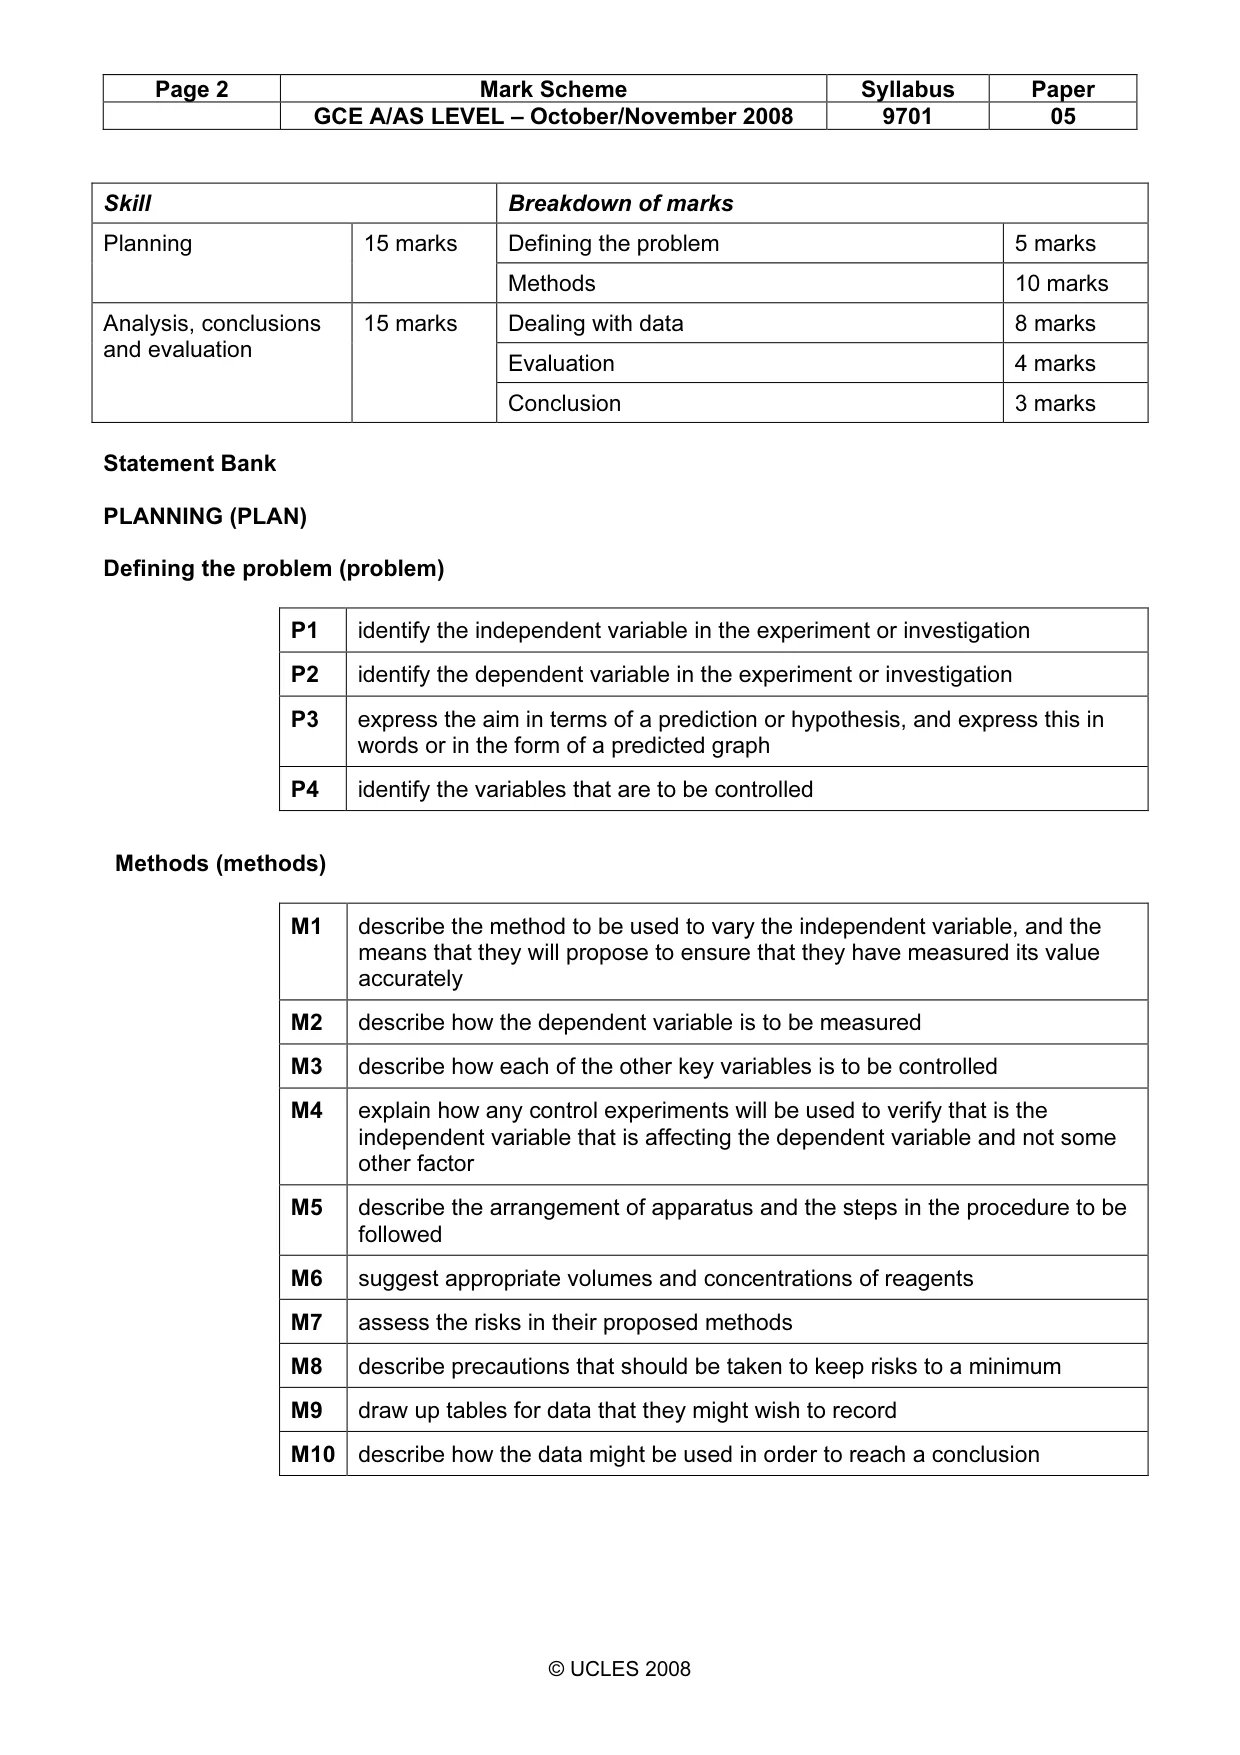
Page 2 Mark Scheme Syllabus Paper GCE A/AS LEVEL – October/November 2008 9701 05 © UCLES 2008 Skill Breakdown of marks Defining the problem 5 marks Planning 15 marks Methods 10 marks Dealing with data 8 marks Evaluation 4 marks Analysis, conclusions and evaluation 15 marks Conclusion 3 marks Statement Bank PLANNING (PLAN) Defining the problem (problem) P1 identify the independent variable in the experiment or investigation P2 identify the dependent variable in the experiment or investigation P3 express the aim in terms of a prediction or hypothesis, and express this in words or in the form of a predicted graph P4 identify the variables that are to be controlled Methods (methods) M1 describe the method to be used to vary the independent variable, and the means that they will propose to ensure that they have measured its value accurately M2 describe how the dependent variable is to be measured M3 describe how each of the other key variables is to be controlled M4 explain how any control experiments will be used to verify that is the independent variable that is affecting the dependent variable and not some other factor M5 describe the arrangement of apparatus and the steps in the procedure to be followed M6 suggest appropriate volumes and concentrations of reagents M7 assess the risks in their proposed methods M8 describe precautions that should be taken to keep risks to a minimum M9 draw up tables for data that they might wish to record M10 describe how the data might be used in order to reach a conclusion
Mark scheme, page 3
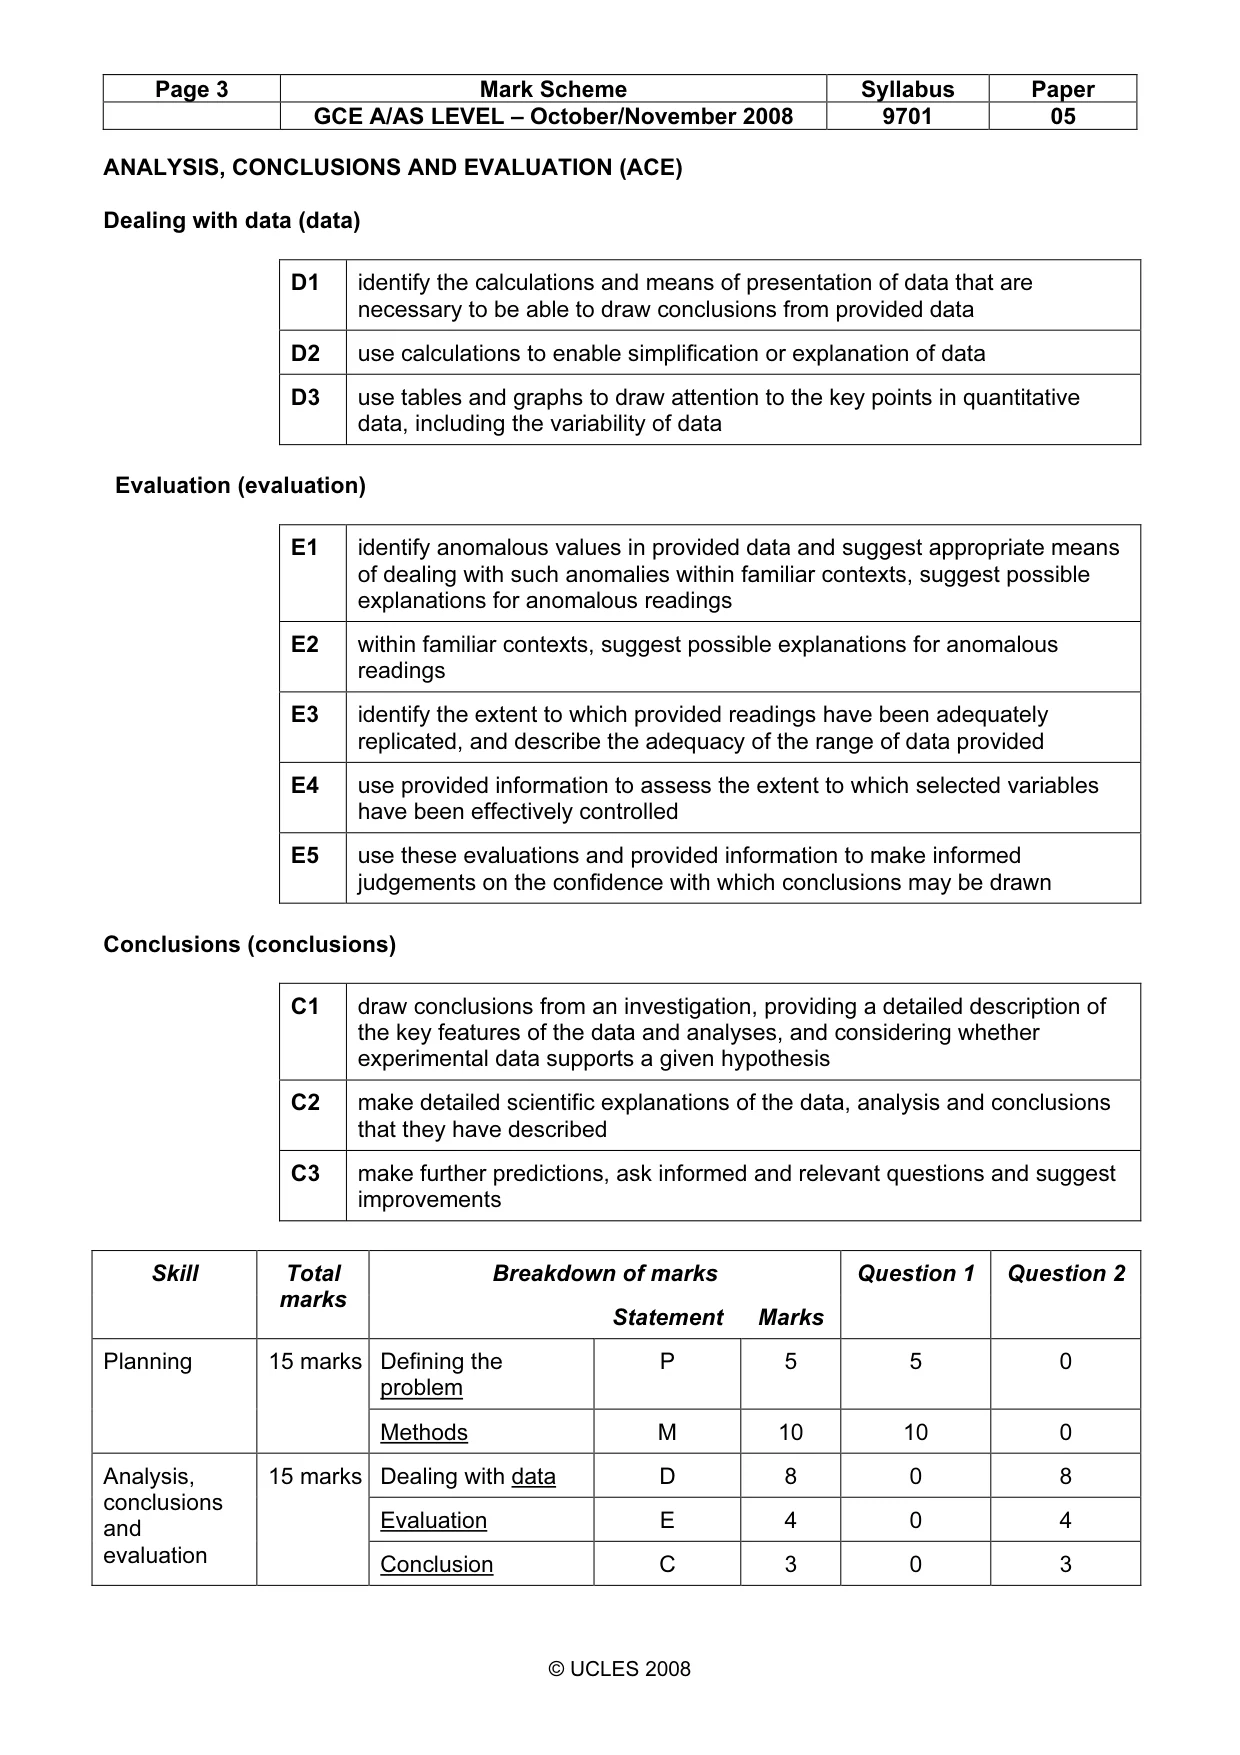
Page 3 Mark Scheme Syllabus Paper GCE A/AS LEVEL – October/November 2008 9701 05 © UCLES 2008 ANALYSIS, CONCLUSIONS AND EVALUATION (ACE) Dealing with data (data) D1 identify the calculations and means of presentation of data that are necessary to be able to draw conclusions from provided data D2 use calculations to enable simplification or explanation of data D3 use tables and graphs to draw attention to the key points in quantitative data, including the variability of data Evaluation (evaluation) E1 identify anomalous values in provided data and suggest appropriate means of dealing with such anomalies within familiar contexts, suggest possible explanations for anomalous readings E2 within familiar contexts, suggest possible explanations for anomalous readings E3 identify the extent to which provided readings have been adequately replicated, and describe the adequacy of the range of data provided E4 use provided information to assess the extent to which selected variables have been effectively controlled E5 use these evaluations and provided information to make informed judgements on the confidence with which conclusions may be drawn Conclusions (conclusions) C1 draw conclusions from an investigation, providing a detailed description of the key features of the data and analyses, and considering whether experimental data supports a given hypothesis C2 make detailed scientific explanations of the data, analysis and conclusions that they have described C3 make further predictions, ask informed and relevant questions and suggest improvements Breakdown of marks Question 1 Question 2 Skill Total marks Statement Marks Defining the problem P 5 5 0 Planning 15 marks Methods M 10 10 0 Dealing with data D 8 0 8 Evaluation E 4 0 4 Analysis, conclusions and evaluation 15 marks Conclusion C 3 0 3
Mark scheme, page 4
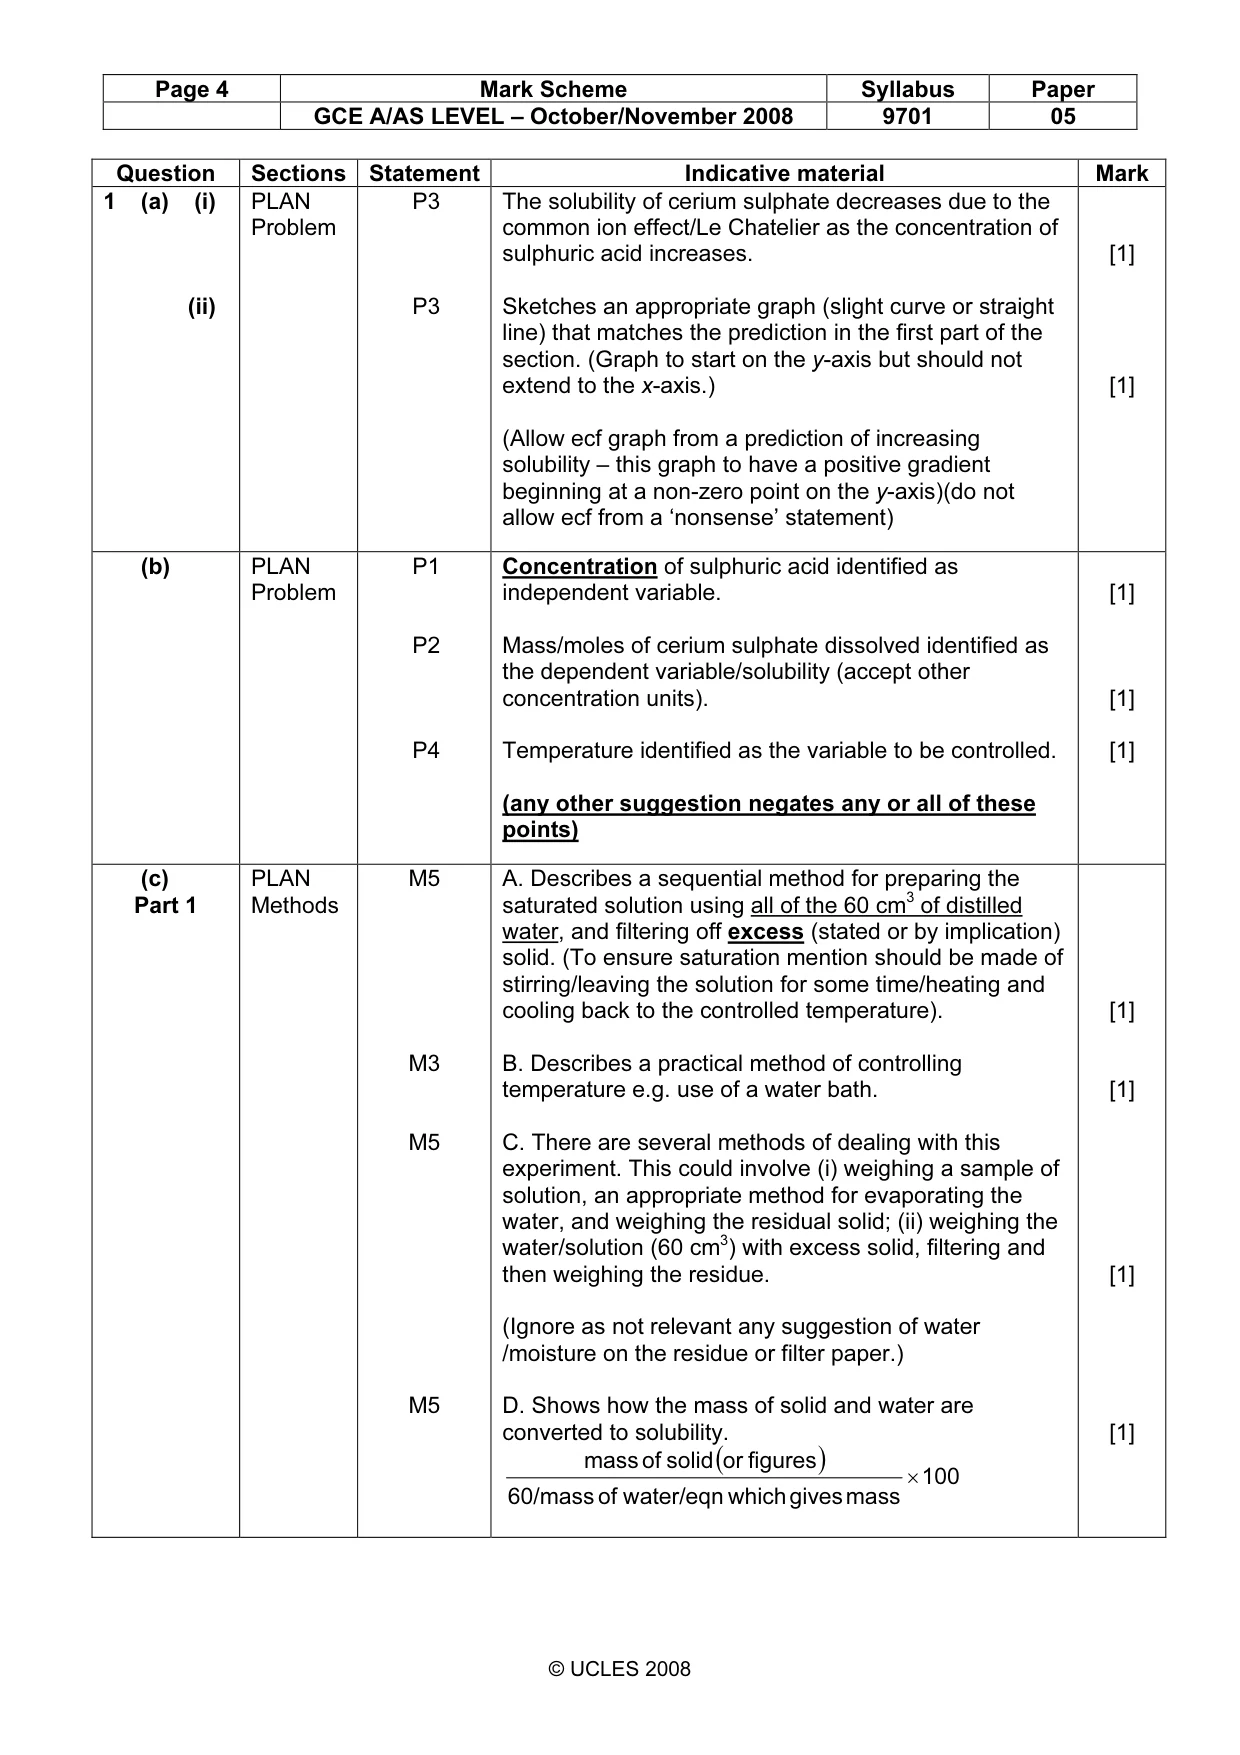
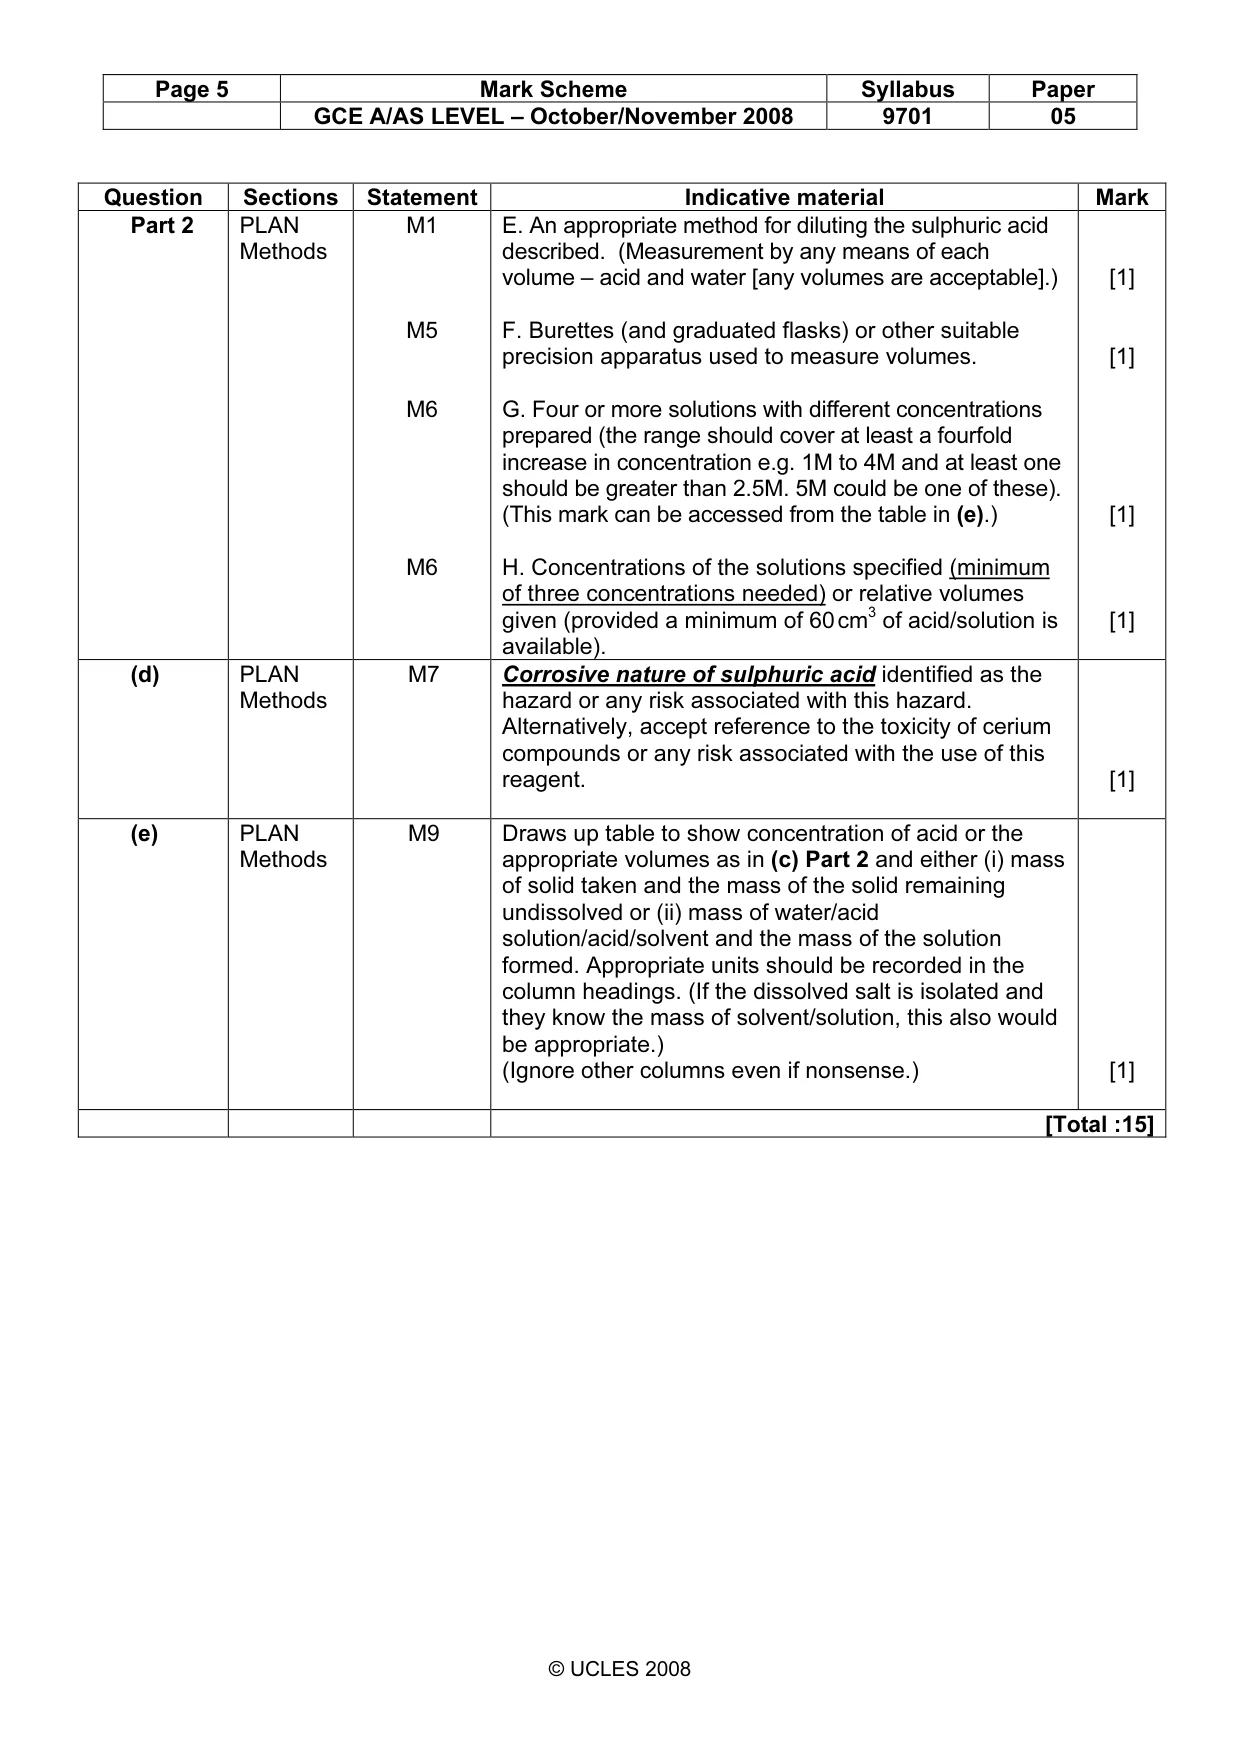
Page 4 Mark Scheme Syllabus Paper GCE A/AS LEVEL – October/November 2008 9701 05 © UCLES 2008 Question Sections Statement Indicative material Mark 1 (a) (i) (ii) PLAN Problem P3 P3 The solubility of cerium sulphate decreases due to the common ion effect/Le Chatelier as the concentration of sulphuric acid increases. Sketches an appropriate graph (slight curve or straight line) that matches the prediction in the first part of the section. (Graph to start on the y-axis but should not extend to the x-axis.) (Allow ecf graph from a prediction of increasing solubility – this graph to have a positive gradient beginning at a non-zero point on the y-axis)(do not allow ecf from a ‘nonsense’ statement) [1] [1] (b) PLAN Problem P1 P2 P4 Concentration of sulphuric acid identified as independent variable. Mass/moles of cerium sulphate dissolved identified as the dependent variable/solubility (accept other concentration units). Temperature identified as the variable to be controlled. (any other suggestion negates any or all of these points) [1] [1] [1] (c) Part 1 PLAN Methods M5 M3 M5 M5 A. Describes a sequential method for preparing the saturated solution using all of the 60 cm3 of distilled water, and filtering off excess (stated or by implication) solid. (To ensure saturation mention should be made of stirring/leaving the solution for some time/heating and cooling back to the controlled temperature). B. Describes a practical method of controlling temperature e.g. use of a water bath. C. There are several methods of dealing with this experiment. This could involve (i) weighing a sample of solution, an appropriate method for evaporating the water, and weighing the residual solid; (ii) weighing the water/solution (60 cm3) with excess solid, filtering and then weighing the residue. (Ignore as not relevant any suggestion of water /moisture on the residue or filter paper.) D. Shows how the mass of solid and water are converted to solubility. ( ) 100 mass gives which water/eqn of 60/mass figures or solid of mass × [1] [1] [1] [1]
Mark scheme, page 5
Page 5 Mark Scheme Syllabus Paper GCE A/AS LEVEL – October/November 2008 9701 05 © UCLES 2008 Question Sections Statement Indicative material Mark Part 2 PLAN Methods M1 M5 M6 M6 E. An appropriate method for diluting the sulphuric acid described. (Measurement by any means of each volume – acid and water [any volumes are acceptable].) F. Burettes (and graduated flasks) or other suitable precision apparatus used to measure volumes. G. Four or more solutions with different concentrations prepared (the range should cover at least a fourfold increase in concentration e.g. 1M to 4M and at least one should be greater than 2.5M. 5M could be one of these). (This mark can be accessed from the table in (e).) H. Concentrations of the solutions specified (minimum of three concentrations needed) or relative volumes given (provided a minimum of 60 cm3 of acid/solution is available). [1] [1] [1] [1] (d) PLAN Methods M7 Corrosive nature of sulphuric acid identified as the hazard or any risk associated with this hazard. Alternatively, accept reference to the toxicity of cerium compounds or any risk associated with the use of this reagent. [1] (e) PLAN Methods M9 Draws up table to show concentration of acid or the appropriate volumes as in (c) Part 2 and either (i) mass of solid taken and the mass of the solid remaining undissolved or (ii) mass of water/acid solution/acid/solvent and the mass of the solution formed. Appropriate units should be recorded in the column headings. (If the dissolved salt is isolated and they know the mass of solvent/solution, this also would be appropriate.) (Ignore other columns even if nonsense.) [1] [Total :15]
Mark scheme, page 6
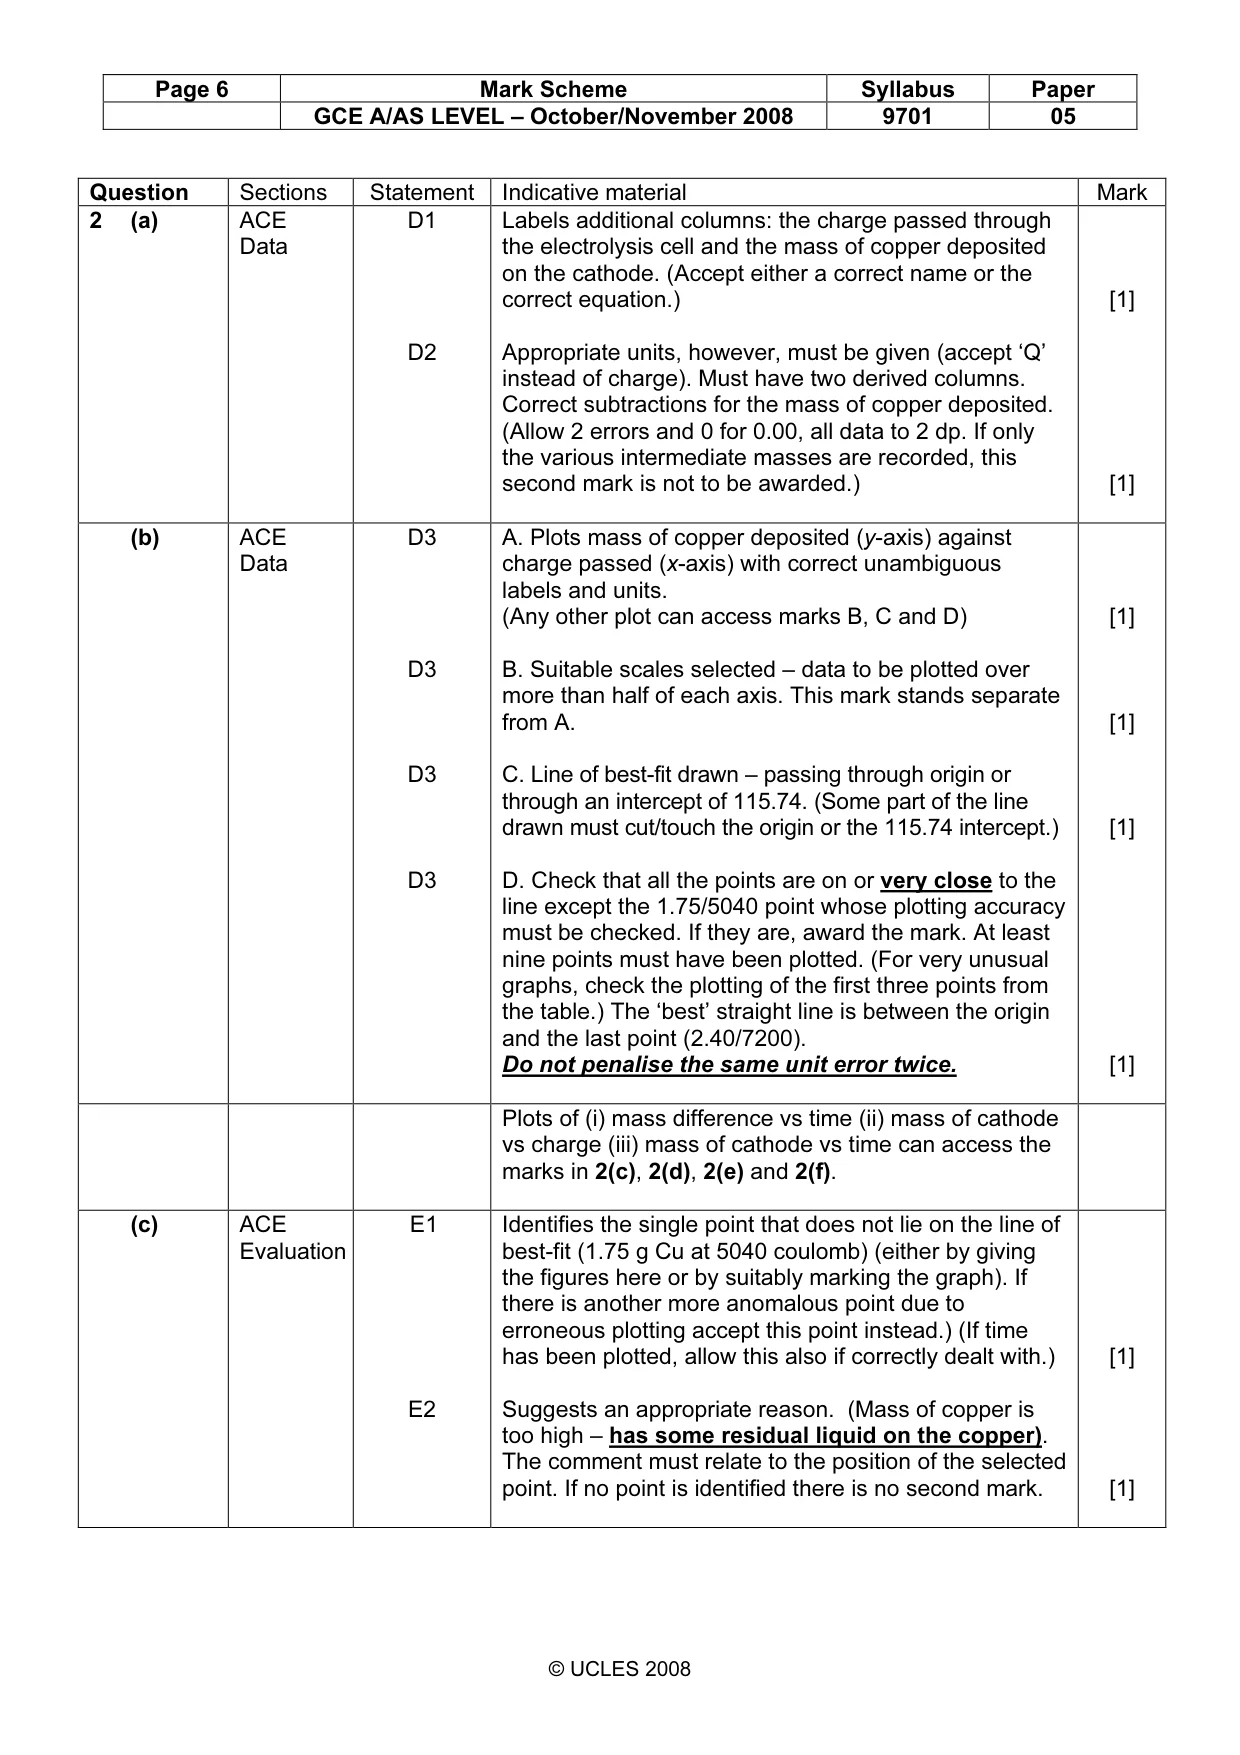
Page 6 Mark Scheme Syllabus Paper GCE A/AS LEVEL – October/November 2008 9701 05 © UCLES 2008 Question Sections Statement Indicative material Mark 2 (a) ACE Data D1 D2 Labels additional columns: the charge passed through the electrolysis cell and the mass of copper deposited on the cathode. (Accept either a correct name or the correct equation.) Appropriate units, however, must be given (accept ‘Q’ instead of charge). Must have two derived columns. Correct subtractions for the mass of copper deposited. (Allow 2 errors and 0 for 0.00, all data to 2 dp. If only the various intermediate masses are recorded, this second mark is not to be awarded.) [1] [1] (b) ACE Data D3 D3 D3 D3 A. Plots mass of copper deposited (y-axis) against charge passed (x-axis) with correct unambiguous labels and units. (Any other plot can access marks B, C and D) B. Suitable scales selected – data to be plotted over more than half of each axis. This mark stands separate from A. C. Line of best-fit drawn – passing through origin or through an intercept of 115.74. (Some part of the line drawn must cut/touch the origin or the 115.74 intercept.) D. Check that all the points are on or very close to the line except the 1.75/5040 point whose plotting accuracy must be checked. If they are, award the mark. At least nine points must have been plotted. (For very unusual graphs, check the plotting of the first three points from the table.) The ‘best’ straight line is between the origin and the last point (2.40/7200). Do not penalise the same unit error twice. [1] [1] [1] [1] Plots of (i) mass difference vs time (ii) mass of cathode vs charge (iii) mass of cathode vs time can access the marks in 2(c), 2(d), 2(e) and 2(f). (c) ACE Evaluation E1 E2 Identifies the single point that does not lie on the line of best-fit (1.75 g Cu at 5040 coulomb) (either by giving the figures here or by suitably marking the graph). If there is another more anomalous point due to erroneous plotting accept this point instead.) (If time has been plotted, allow this also if correctly dealt with.) Suggests an appropriate reason. (Mass of copper is too high – has some residual liquid on the copper). The comment must relate to the position of the selected point. If no point is identified there is no second mark. [1] [1]
Mark scheme, page 7
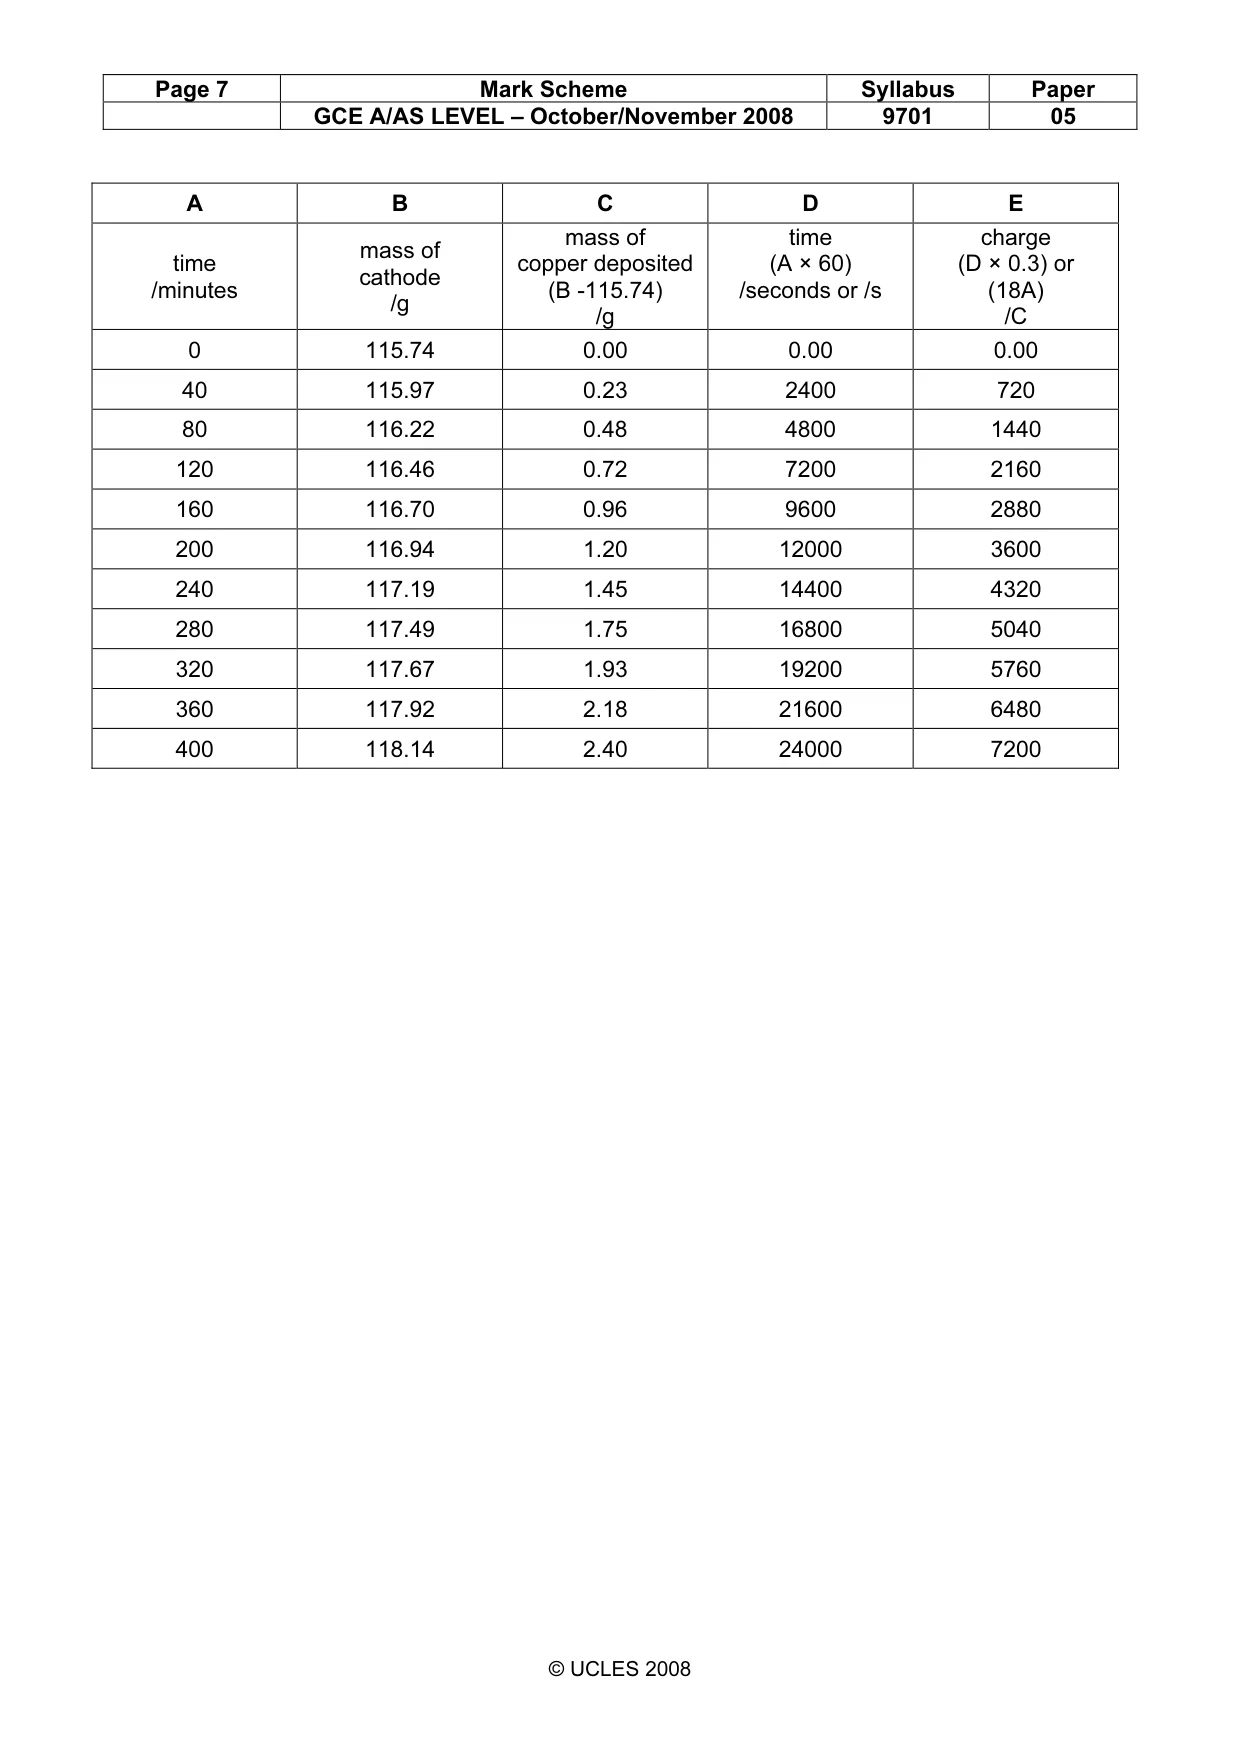
Page 7 Mark Scheme Syllabus Paper GCE A/AS LEVEL – October/November 2008 9701 05 © UCLES 2008 A B C D E time /minutes mass of cathode /g mass of copper deposited (B -115.74) /g time (A × 60) /seconds or /s charge (D × 0.3) or (18A) /C 0 115.74 0.00 0.00 0.00 40 115.97 0.23 2400 720 80 116.22 0.48 4800 1440 120 116.46 0.72 7200 2160 160 116.70 0.96 9600 2880 200 116.94 1.20 12000 3600 240 117.19 1.45 14400 4320 280 117.49 1.75 16800 5040 320 117.67 1.93 19200 5760 360 117.92 2.18 21600 6480 400 118.14 2.40 24000 7200
Mark scheme, page 8
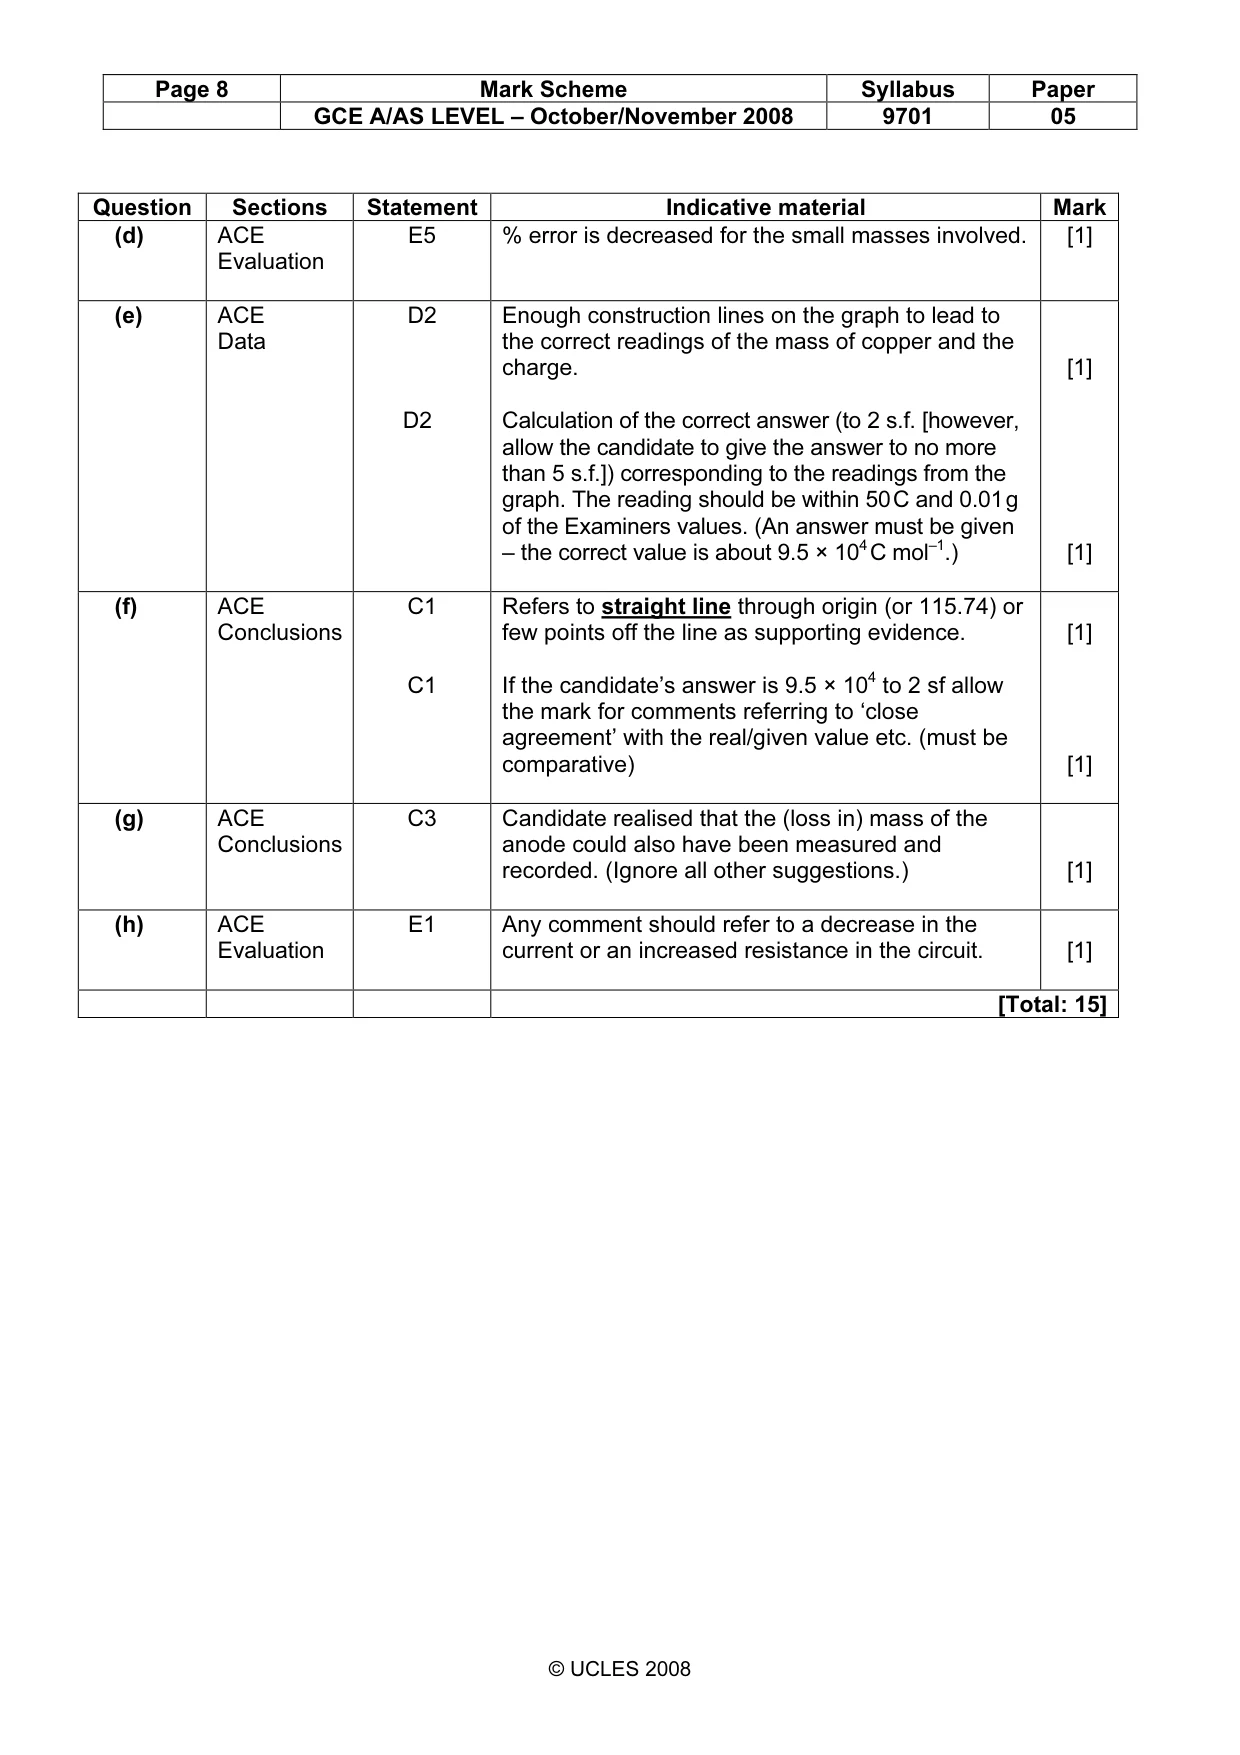
Page 8 Mark Scheme Syllabus Paper GCE A/AS LEVEL – October/November 2008 9701 05 © UCLES 2008 Question Sections Statement Indicative material Mark (d) ACE Evaluation E5 % error is decreased for the small masses involved. [1] (e) ACE Data D2 D2 Enough construction lines on the graph to lead to the correct readings of the mass of copper and the charge. Calculation of the correct answer (to 2 s.f. [however, allow the candidate to give the answer to no more than 5 s.f.]) corresponding to the readings from the graph. The reading should be within 50 C and 0.01 g of the Examiners values. (An answer must be given – the correct value is about 9.5 × 10⁴ C mol–1.) [1] [1] (f) ACE Conclusions C1 C1 Refers to straight line through origin (or 115.74) or few points off the line as supporting evidence. If the candidate’s answer is 9.5 × 10⁴ to 2 sf allow the mark for comments referring to ‘close agreement’ with the real/given value etc. (must be comparative) [1] [1] (g) ACE Conclusions C3 Candidate realised that the (loss in) mass of the anode could also have been measured and recorded. (Ignore all other suggestions.) [1] (h) ACE Evaluation E1 Any comment should refer to a decrease in the current or an increased resistance in the circuit. [1] [Total: 15]
What you needed in this session
Cambridge’s own grade thresholds for 2008 Oct/Nov, Paper 5 · Variant 1. A higher threshold means an easier paper — the bar moves with how the cohort did.