Cambridge A Level Chemistry 9701 — 2007 May/June Paper 5 · Variant 1
9701/51/M/J/07 · 30 marks · ≈34 min
The question paper and its mark scheme, free to read here and free to download. This is Cambridge’s own paper, exactly as it was sat.
Question paper12 pages


Mark scheme7 pages
Answers below. Sit the paper first if you are practising.
Paper as text
Question paper, page 1
For Examiner’s Use 1 2 Total This document consists of 9 printed pages and 3 blank pages. SP (SM) T40400/4 © UCLES 2007 [Turn over UNIVERSITY OF CAMBRIDGE INTERNATIONAL EXAMINATIONS General Certificate of Education Advanced Subsidiary Level and Advanced Level READ THESE INSTRUCTIONS FIRST Write your Centre number, candidate number and name on all the work you hand in. Write in dark blue or black pen. You may use a soft pencil for any diagrams, graphs or rough working. Do not use staples, paper clips, highlighters, glue or correction fluid. Answer all questions. You are advised to show all working in calculations. Use of Data Booklet is unnecessary. At the end of the examination, fasten all your work securely together. The number of marks is given in brackets [ ] at the end of each question or part question. * 0 8 9 9 9 3 2 7 6 8 * CHEMISTRY 9701/05 Paper 5 Planning, analysis and evaluation May/June 2007 1 hour 15 minutes Candidates answer on the Question Paper. No Additional Materials are required.
Question paper, page 2
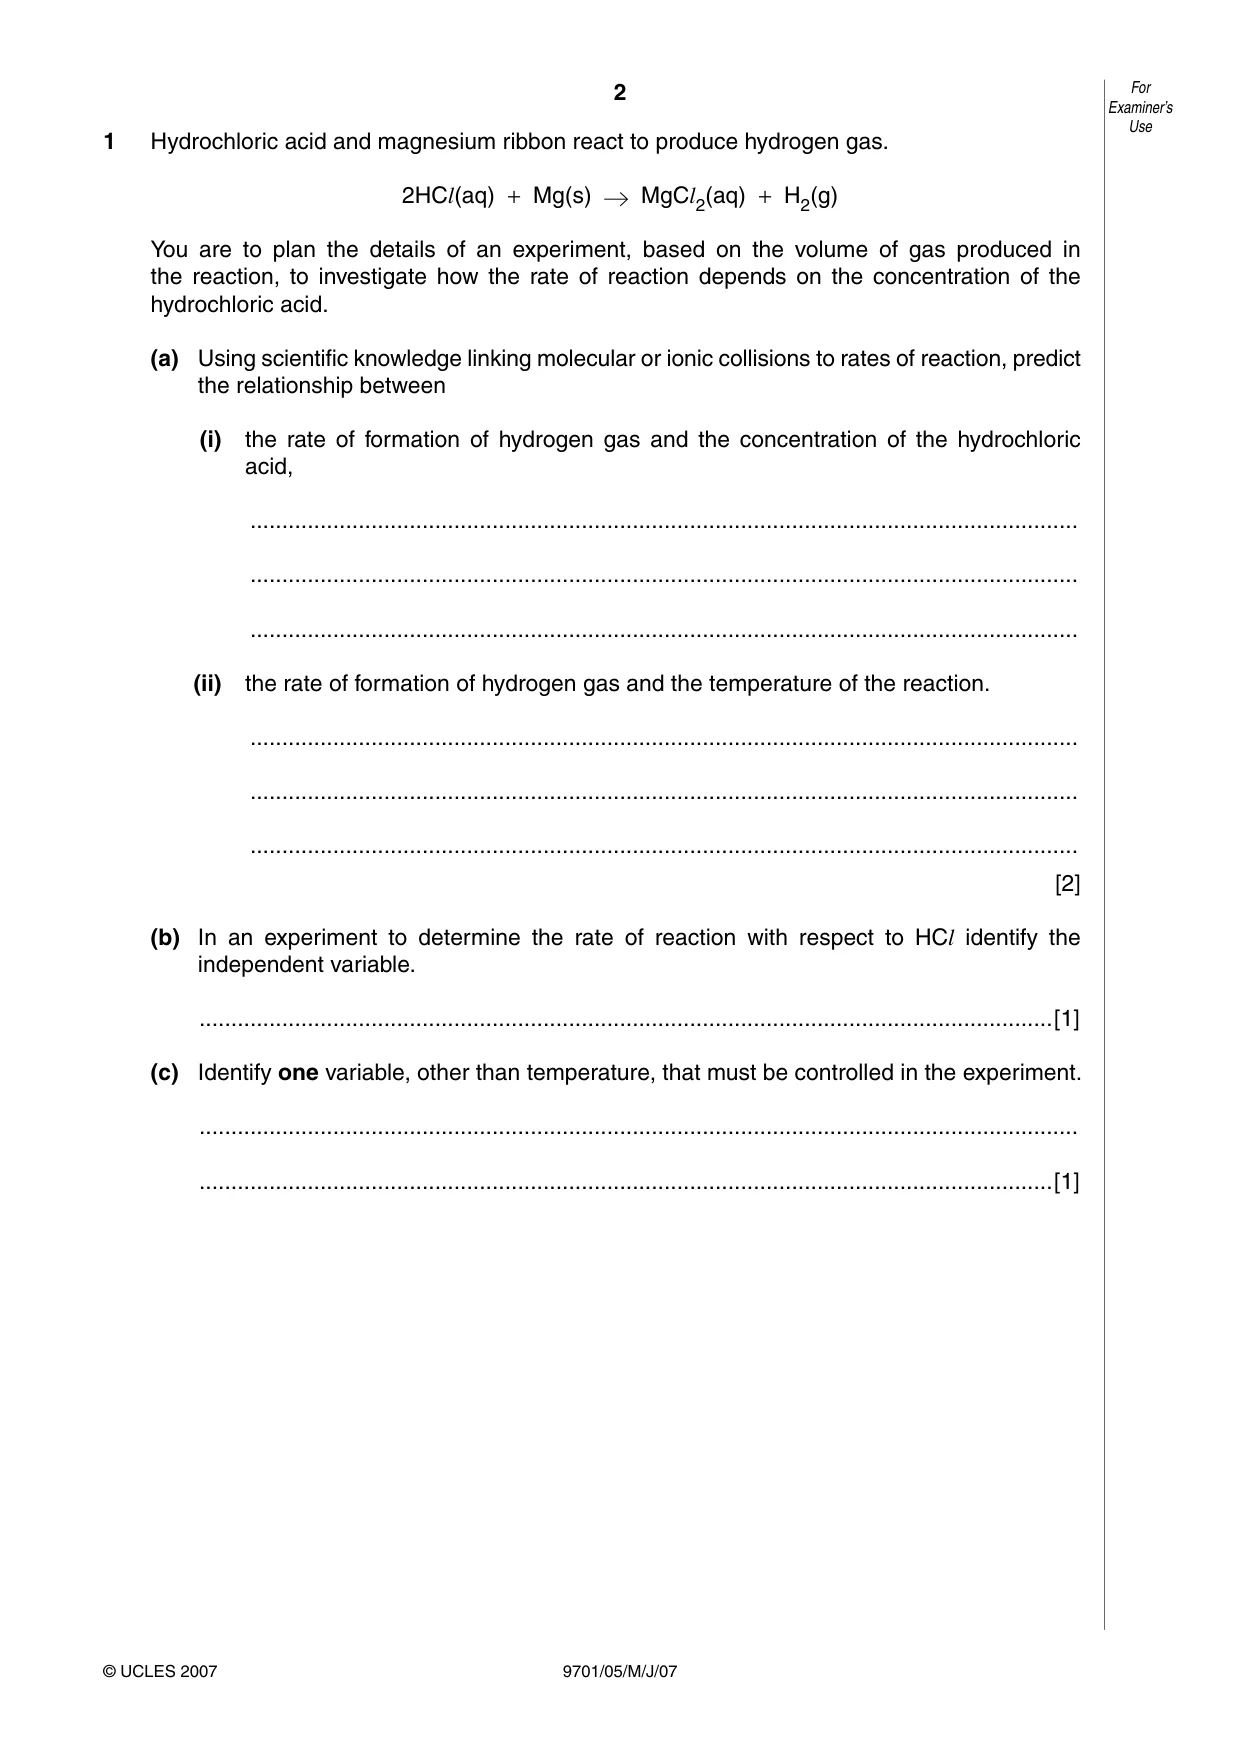
2 9701/05/M/J/07 For Examiner’s Use © UCLES 2007 1 Hydrochloric acid and magnesium ribbon react to produce hydrogen gas. 2HCl(aq) + Mg(s) MgCl2(aq) + H2(g) You are to plan the details of an experiment, based on the volume of gas produced in the reaction, to investigate how the rate of reaction depends on the concentration of the hydrochloric acid. (a) Using scientific knowledge linking molecular or ionic collisions to rates of reaction, predict the relationship between (i) the rate of formation of hydrogen gas and the concentration of the hydrochloric acid, … … … (ii) the rate of formation of hydrogen gas and the temperature of the reaction. … … … [2] (b) In an experiment to determine the rate of reaction with respect to HCl identify the independent variable. …[1] (c) Identify one variable, other than temperature, that must be controlled in the experiment. … …[1]
Question paper, page 3
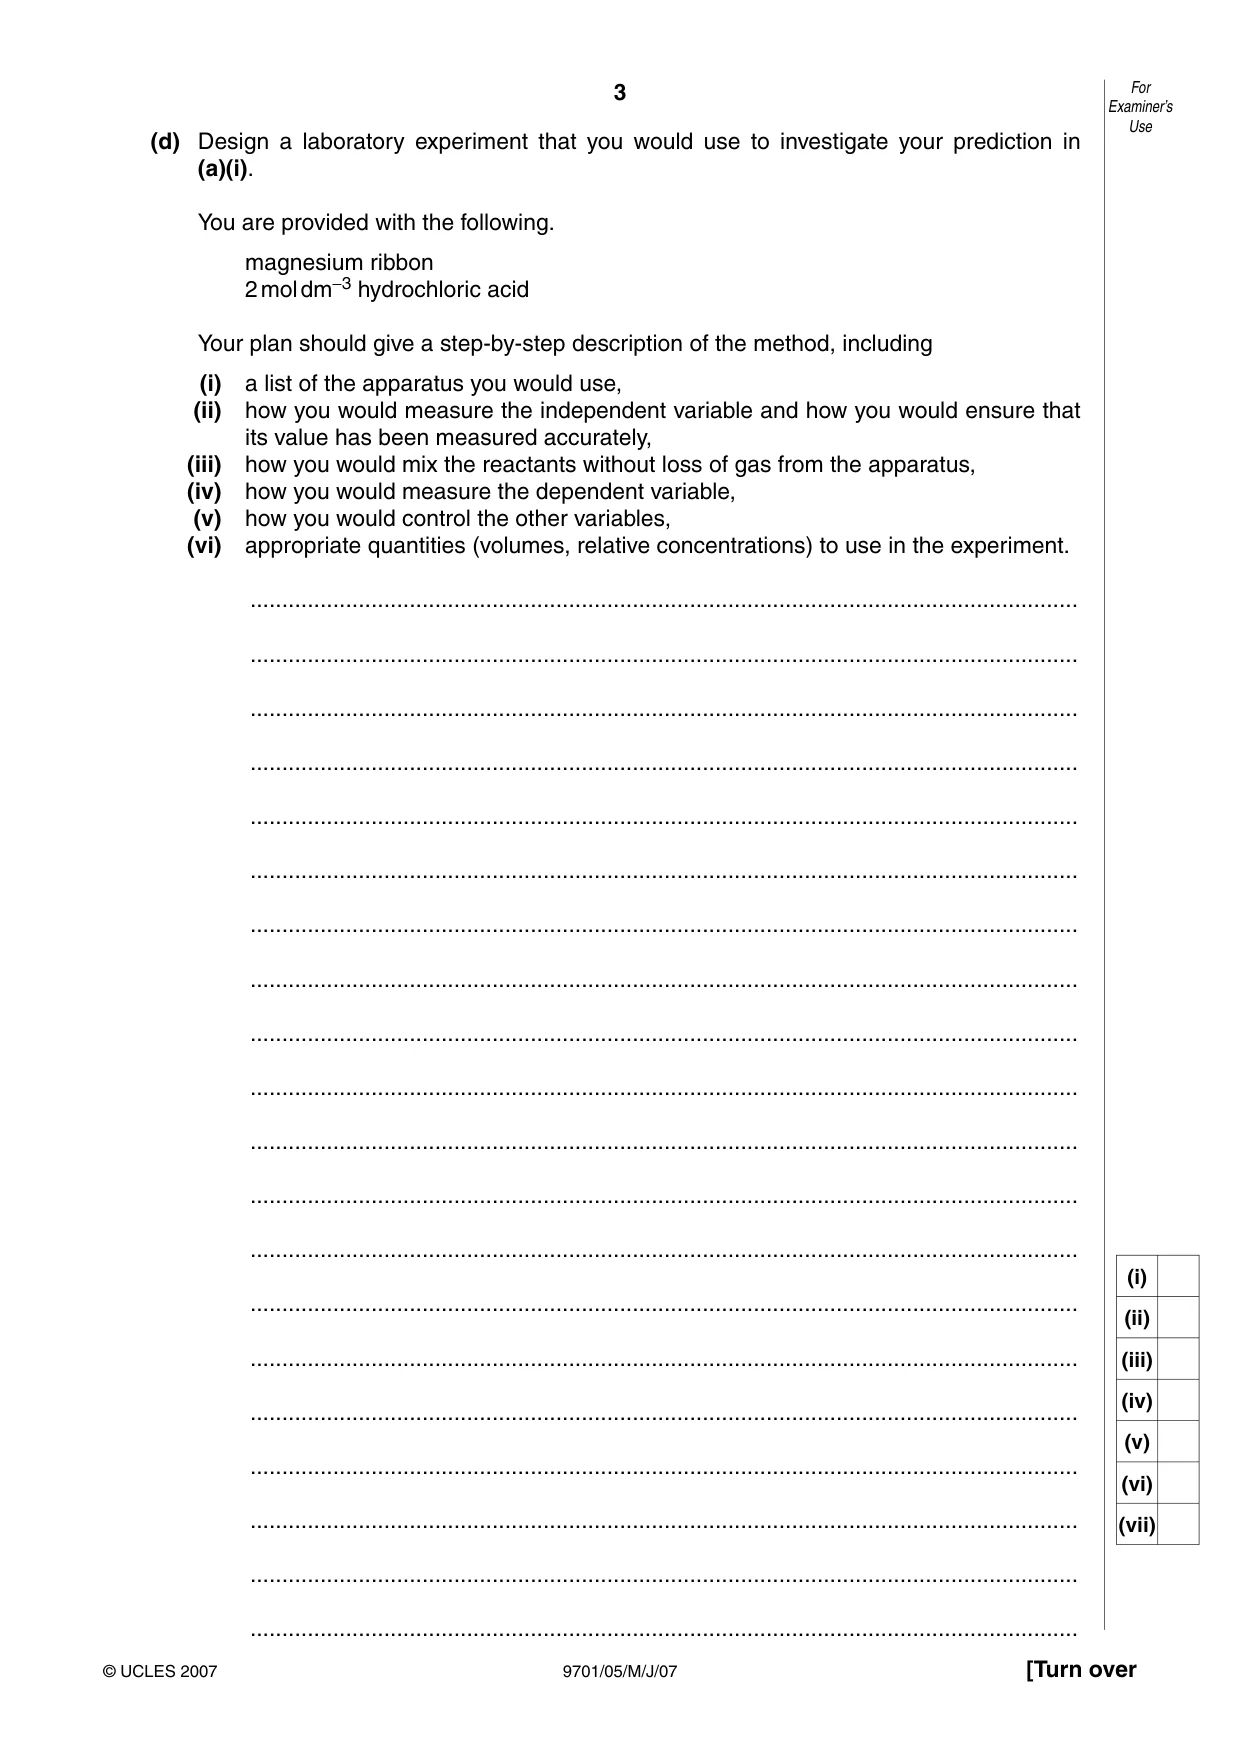
3 9701/05/M/J/07 [Turn over © UCLES 2007 (d) Design a laboratory experiment that you would use to investigate your prediction in (a)(i). You are provided with the following. magnesium ribbon 2 mol dm−3 hydrochloric acid Your plan should give a step-by-step description of the method, including (i) a list of the apparatus you would use, (ii) how you would measure the independent variable and how you would ensure that its value has been measured accurately, (iii) how you would mix the reactants without loss of gas from the apparatus, (iv) how you would measure the dependent variable, (v) how you would control the other variables, (vi) appropriate quantities (volumes, relative concentrations) to use in the experiment. … … … … … … … … … … … … … … … … … … … … (i) (ii) (iii) (iv) (v) (vi) (vii) For Examiner’s Use
Question paper, page 4
4 9701/05/M/J/07 For Examiner’s Use © UCLES 2007 … … … … … … … … … … … … … … … … … … … … … … … … … … … …[7]
Question paper, page 5
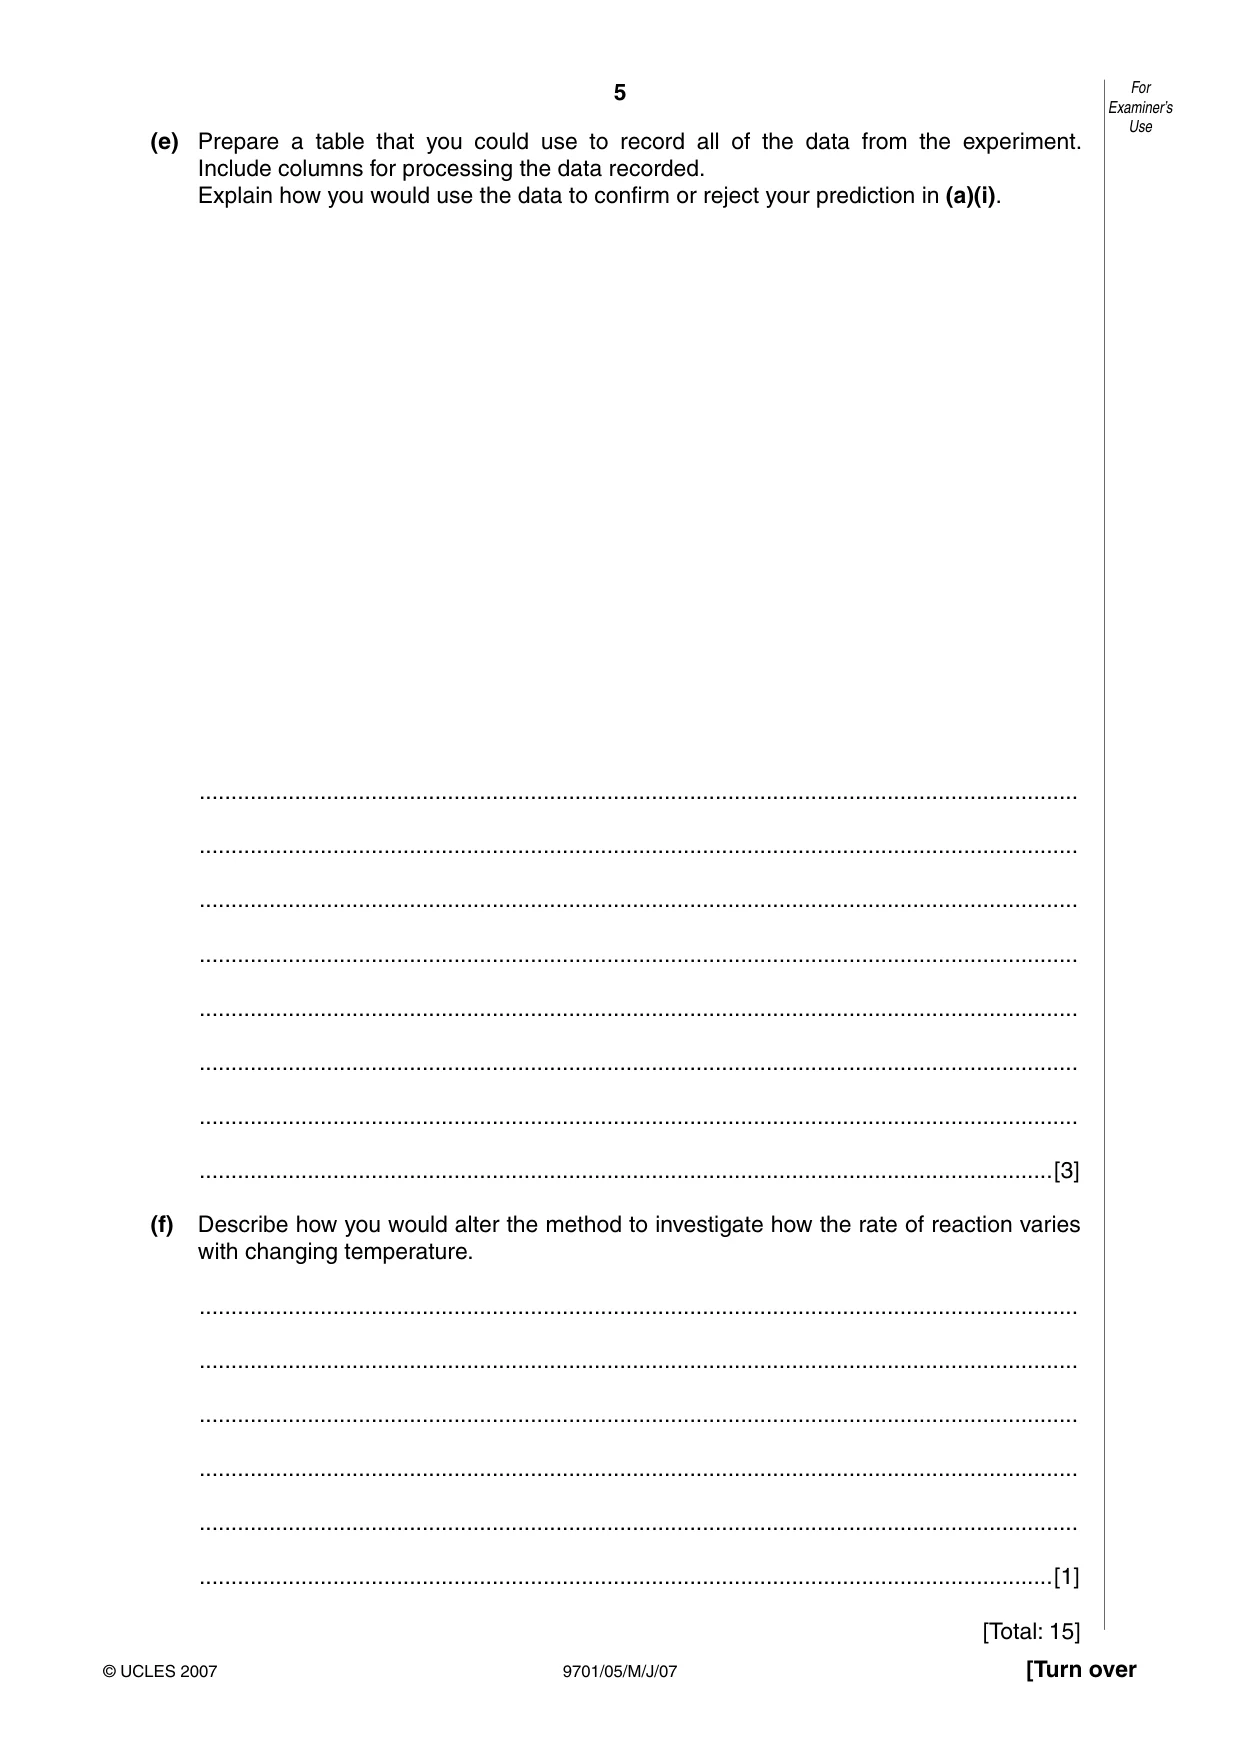
5 9701/05/M/J/07 [Turn over For Examiner’s Use © UCLES 2007 (e) Prepare a table that you could use to record all of the data from the experiment. Include columns for processing the data recorded. Explain how you would use the data to confirm or reject your prediction in (a)(i). … … … … … … … …[3] (f) Describe how you would alter the method to investigate how the rate of reaction varies with changing temperature. … … … … … …[1] [Total: 15]
Question paper, page 6
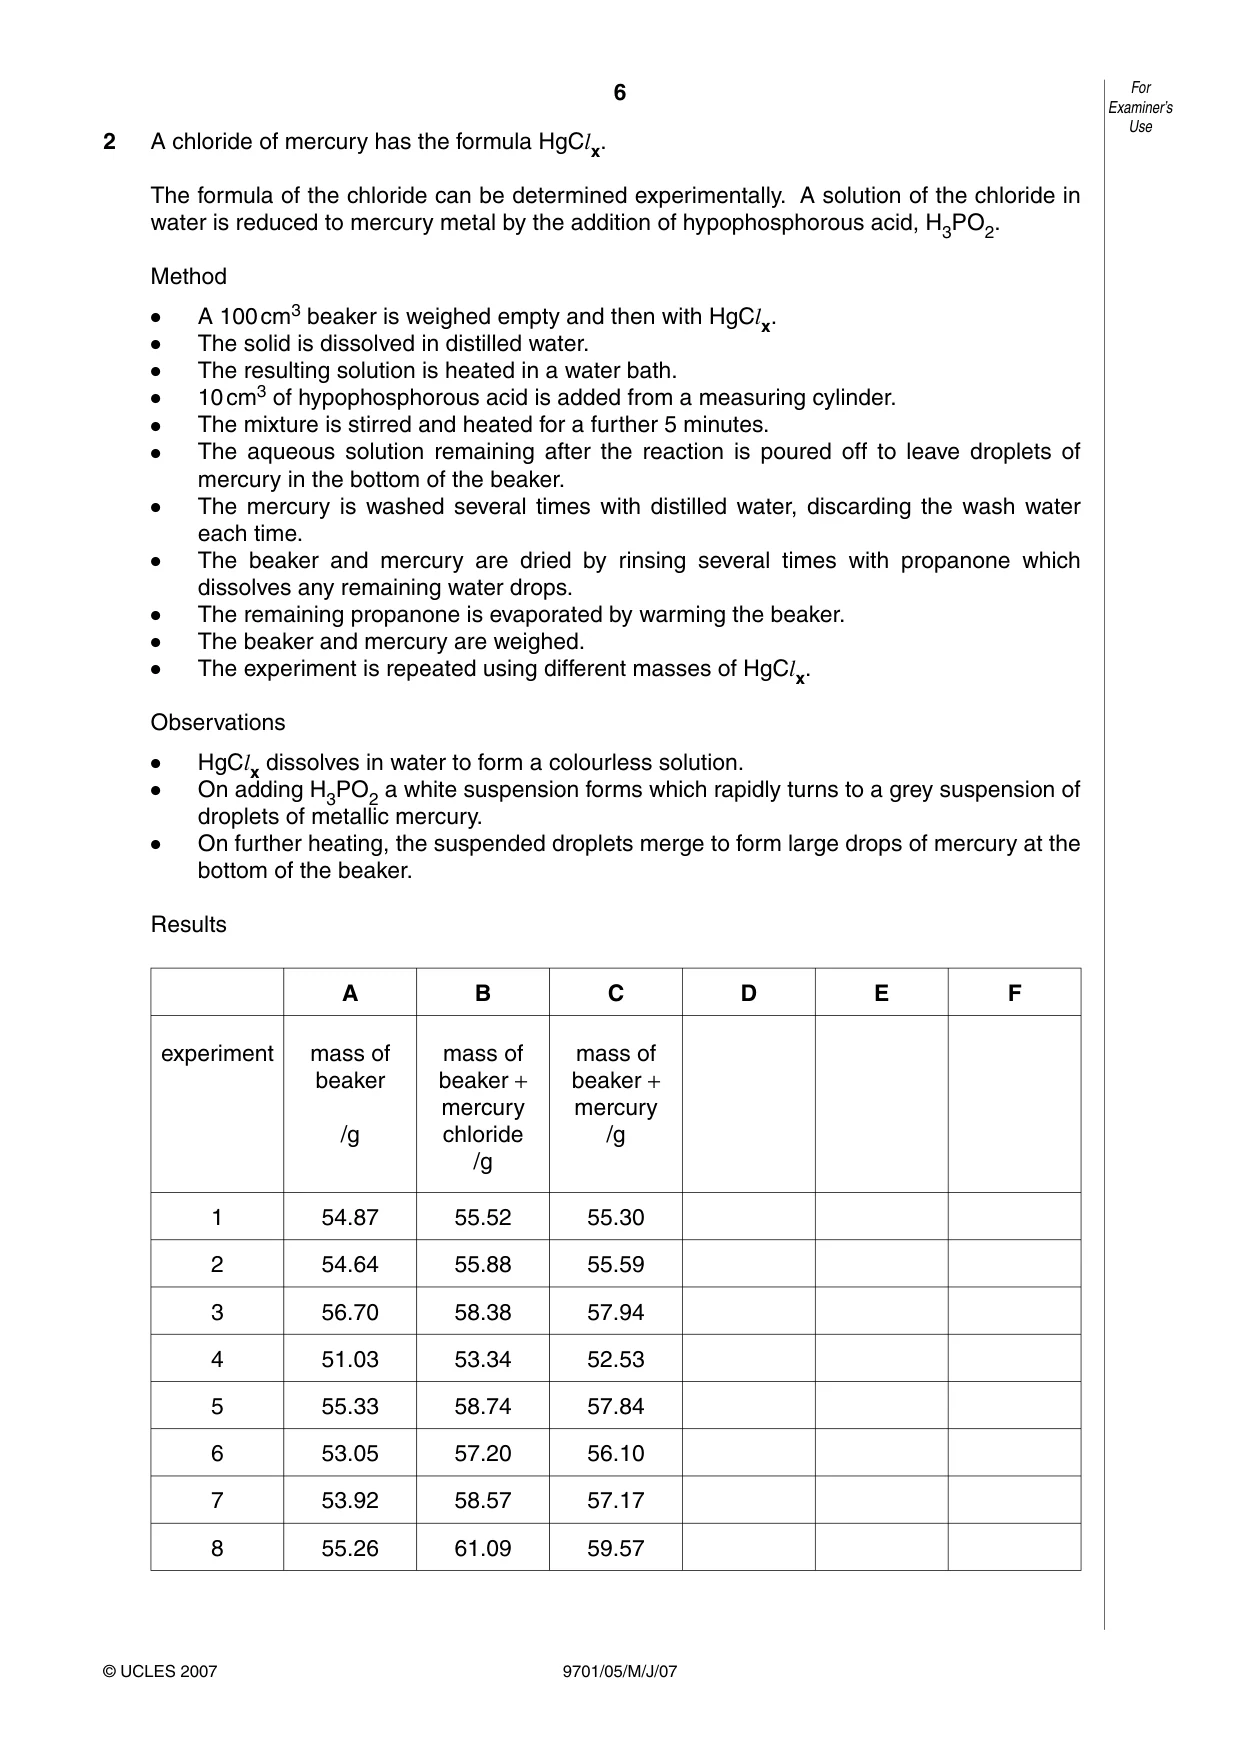
6 9701/05/M/J/07 For Examiner’s Use © UCLES 2007 2 A chloride of mercury has the formula HgClx. The formula of the chloride can be determined experimentally. A solution of the chloride in water is reduced to mercury metal by the addition of hypophosphorous acid, H3PO2. Method • A 100 cm3 beaker is weighed empty and then with HgClx. • The solid is dissolved in distilled water. • The resulting solution is heated in a water bath. • 10 cm3 of hypophosphorous acid is added from a measuring cylinder. • The mixture is stirred and heated for a further 5 minutes. • The aqueous solution remaining after the reaction is poured off to leave droplets of mercury in the bottom of the beaker. • The mercury is washed several times with distilled water, discarding the wash water each time. • The beaker and mercury are dried by rinsing several times with propanone which dissolves any remaining water drops. • The remaining propanone is evaporated by warming the beaker. • The beaker and mercury are weighed. • The experiment is repeated using different masses of HgClx. Observations • HgClx dissolves in water to form a colourless solution. • On adding H3PO2 a white suspension forms which rapidly turns to a grey suspension of droplets of metallic mercury. • On further heating, the suspended droplets merge to form large drops of mercury at the bottom of the beaker. Results A B C D E F experiment mass of beaker /g mass of beaker + mercury chloride /g mass of beaker + mercury /g 1 54.87 55.52 55.30 2 54.64 55.88 55.59 3 56.70 58.38 57.94 4 51.03 53.34 52.53 5 55.33 58.74 57.84 6 53.05 57.20 56.10 7 53.92 58.57 57.17 8 55.26 61.09 59.57
Question paper, page 7
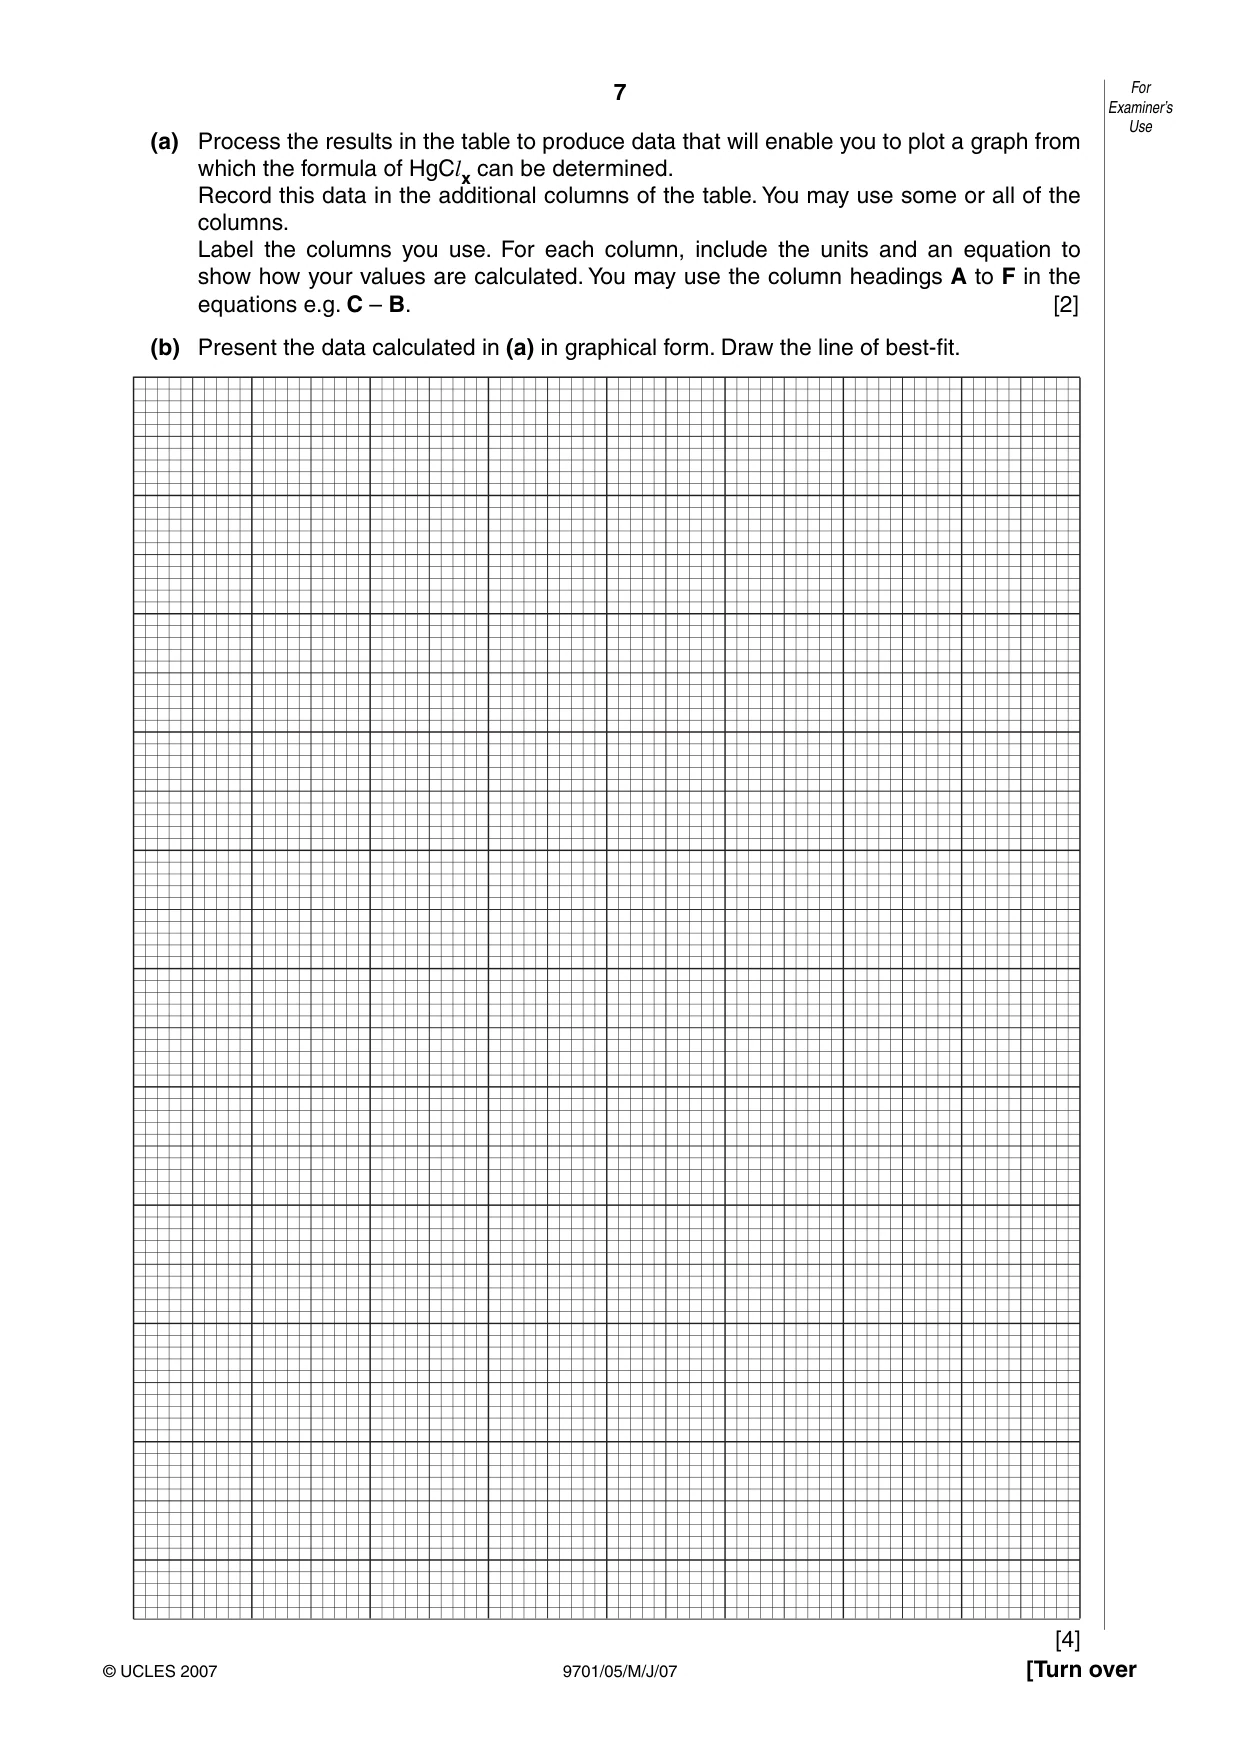
7 9701/05/M/J/07 [Turn over For Examiner’s Use © UCLES 2007 (a) Process the results in the table to produce data that will enable you to plot a graph from which the formula of HgClx can be determined. Record this data in the additional columns of the table. You may use some or all of the columns. Label the columns you use. For each column, include the units and an equation to show how your values are calculated. You may use the column headings A to F in the equations e.g. C – B. [2] (b) Present the data calculated in (a) in graphical form. Draw the line of best-fit. [4]
Question paper, page 8
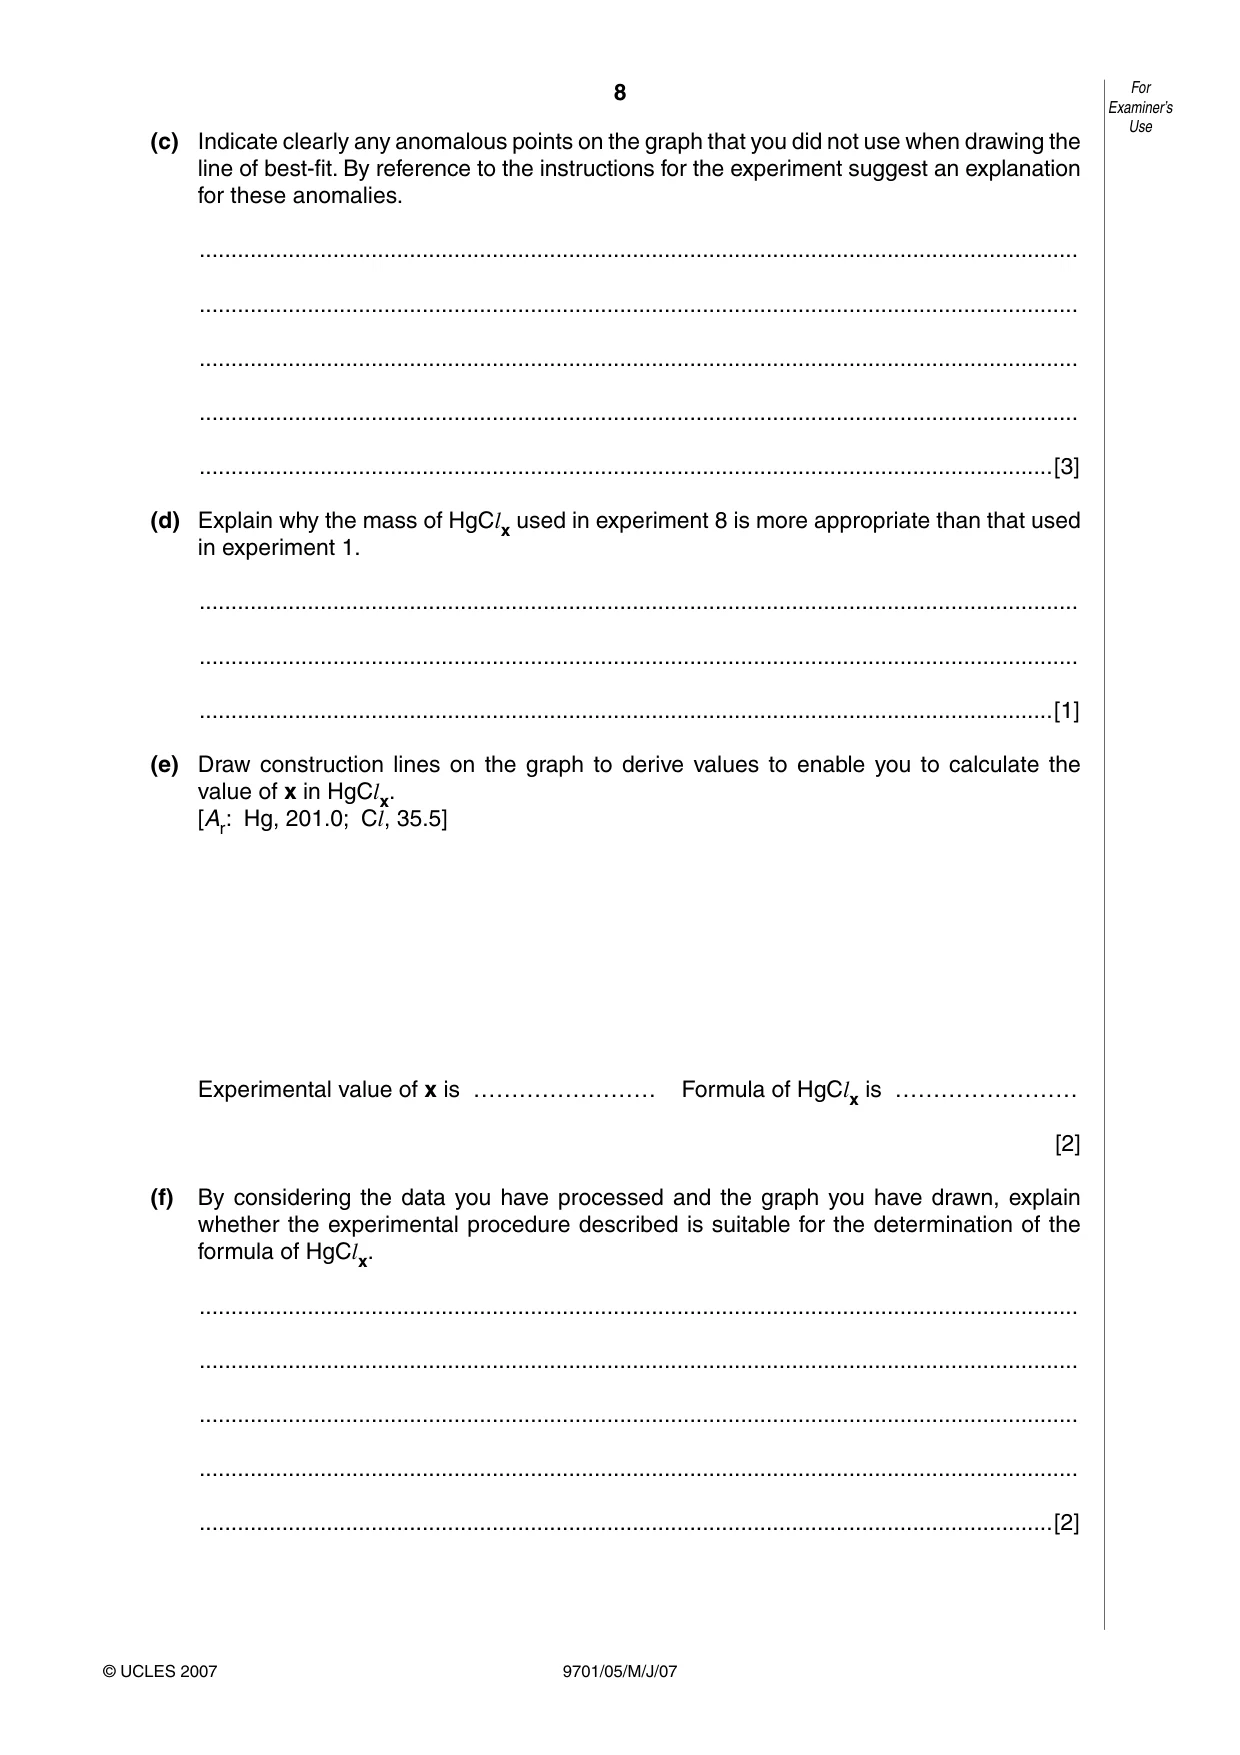
8 9701/05/M/J/07 For Examiner’s Use © UCLES 2007 (c) Indicate clearly any anomalous points on the graph that you did not use when drawing the line of best-fit. By reference to the instructions for the experiment suggest an explanation for these anomalies. … … … … …[3] (d) Explain why the mass of HgClx used in experiment 8 is more appropriate than that used in experiment 1. … … …[1] (e) Draw construction lines on the graph to derive values to enable you to calculate the value of x in HgClx. [Ar: Hg, 201.0; Cl, 35.5] Experimental value of x is …………………… Formula of HgClx is …………………… [2] (f) By considering the data you have processed and the graph you have drawn, explain whether the experimental procedure described is suitable for the determination of the formula of HgClx. … … … … …[2]
Question paper, page 9
9 9701/05/M/J/07 For Examiner’s Use © UCLES 2007 (g) The mass of chlorine in HgClx can also be determined by precipitation of an insoluble chloride. Use your knowledge of halogen chemistry to suggest a suitable reagent for this reaction. … …[1] [Total: 15]
Question paper, page 12
12 9701/05/M/J/07 BLANK PAGE Permission to reproduce items where third-party owned material protected by copyright is included has been sought and cleared where possible. Every reasonable effort has been made by the publisher (UCLES) to trace copyright holders, but if any items requiring clearance have unwittingly been included, the publisher will be pleased to make amends at the earliest possible opportunity. University of Cambridge International Examinations is part of the Cambridge Assessment Group. Cambridge Assessment is the brand name of University of Cambridge Local Examinations Syndicate (UCLES), which is itself a department of the University of Cambridge.
Mark scheme, page 1
UNIVERSITY OF CAMBRIDGE INTERNATIONAL EXAMINATIONS GCE Advanced Subsidiary Level and GCE Advanced Level MARK SCHEME for the May/June 2007 question paper 9701 CHEMISTRY 9701/05 Paper 5 (Planning, Analysis and Evaluation), maximum raw mark 30 This mark scheme is published as an aid to teachers and candidates, to indicate the requirements of the examination. It shows the basis on which Examiners were instructed to award marks. It does not indicate the details of the discussions that took place at an Examiners’ meeting before marking began. All Examiners are instructed that alternative correct answers and unexpected approaches in candidates’ scripts must be given marks that fairly reflect the relevant knowledge and skills demonstrated. Mark schemes must be read in conjunction with the question papers and the report on the examination. • CIE will not enter into discussions or correspondence in connection with these mark schemes. CIE is publishing the mark schemes for the May/June 2007 question papers for most IGCSE, GCE Advanced Level and Advanced Subsidiary Level syllabuses and some Ordinary Level syllabuses.
Mark scheme, page 2
Page 2 Mark Scheme Syllabus Paper GCE A/AS LEVEL – May/June 2007 9701 05 © UCLES 2007 Question Sections Indicative material Mark 1 (a) (i) (ii) PLAN Problem Uses collision theory to predict that the rate of formation of H2(g) increases as the concentration of HCl increases Uses collision theory to explain how rate of reaction increases with increasing temperature [1] [1] [2] (b) PLAN Problem Concentration of HCl identified as independent variable [HCl] is acceptable [1] [1] (c) PLAN Problem States that the (total) volume of solution must be kept constant, or States that the amount/size/length/mass/surface area of the magnesium ribbon must be kept constant [1] [1] (d) (i) (ii) (iii) (iv) (v) PLAN Methods Lists apparatus for the reaction of Mg/acid, collection and measurement of gas and timing gas collection Connecting tube does not need to be listed gas could be measured by full test-tube etc. A diagram is acceptable if a timing device is mentioned in the text Dilutes a range of volumes of HCl sufficient for the experiment A minimum of 5 different concentration solutions is required Total volume does not have to be constant Prepares diluted solutions using measuring cylinder, pipette or burette Describes how collection of a stated volume of H2 will be timed in each experiment, or Volume of H2 collected in a stated time is described, or Volume of H2 collected recorded at fixed intervals to enable graph to be plotted Reference to the way in which total volume being kept constant, or temperature kept constant, or way in which other variable from (c) is controlled [1] [1] [1] [1] [1]
Mark scheme, page 3
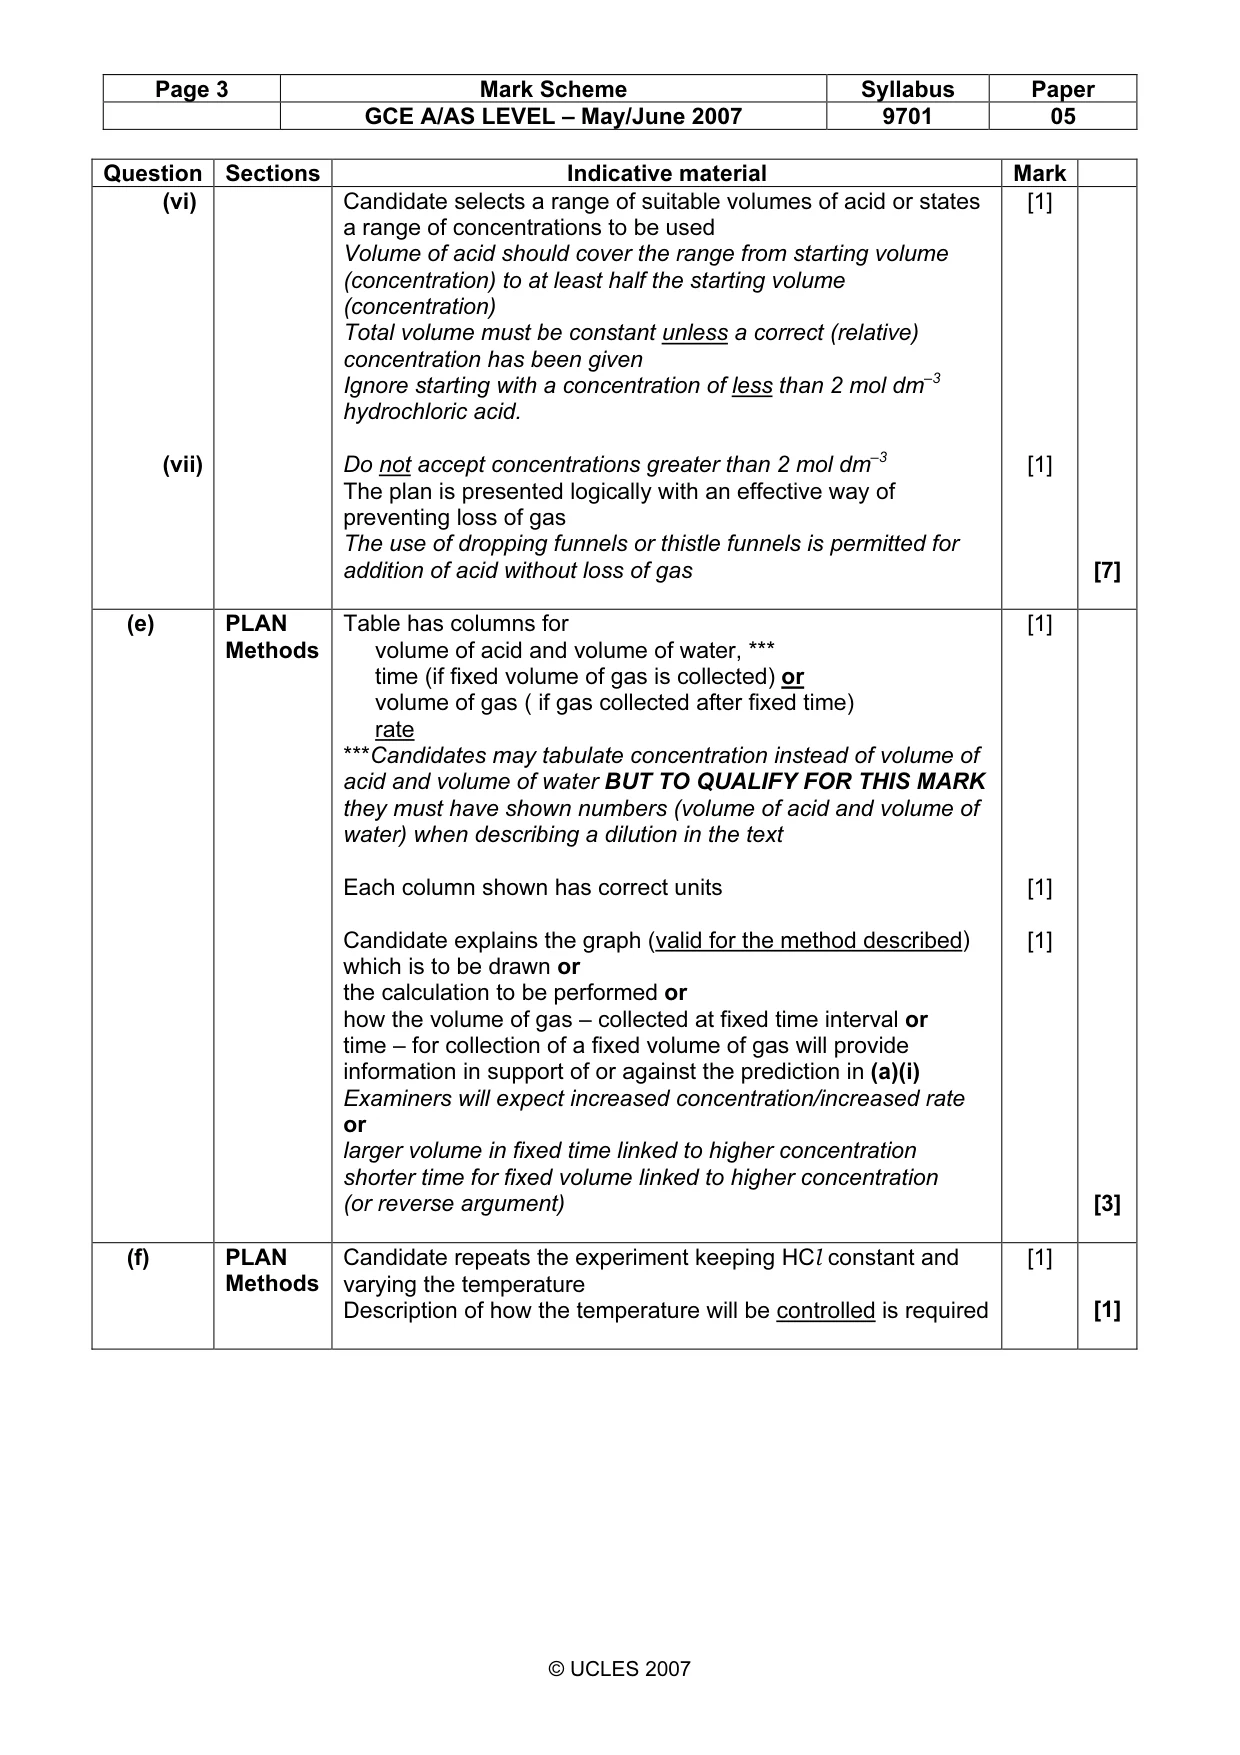
Page 3 Mark Scheme Syllabus Paper GCE A/AS LEVEL – May/June 2007 9701 05 © UCLES 2007 Question Sections Indicative material Mark (vi) (vii) Candidate selects a range of suitable volumes of acid or states a range of concentrations to be used Volume of acid should cover the range from starting volume (concentration) to at least half the starting volume (concentration) Total volume must be constant unless a correct (relative) concentration has been given Ignore starting with a concentration of less than 2 mol dm–3 hydrochloric acid. Do not accept concentrations greater than 2 mol dm–3 The plan is presented logically with an effective way of preventing loss of gas The use of dropping funnels or thistle funnels is permitted for addition of acid without loss of gas [1] [1] [7] (e) PLAN Methods Table has columns for volume of acid and volume of water, *** time (if fixed volume of gas is collected) or volume of gas ( if gas collected after fixed time) rate ***Candidates may tabulate concentration instead of volume of acid and volume of water BUT TO QUALIFY FOR THIS MARK they must have shown numbers (volume of acid and volume of water) when describing a dilution in the text Each column shown has correct units Candidate explains the graph (valid for the method described) which is to be drawn or the calculation to be performed or how the volume of gas – collected at fixed time interval or time – for collection of a fixed volume of gas will provide information in support of or against the prediction in (a)(i) Examiners will expect increased concentration/increased rate or larger volume in fixed time linked to higher concentration shorter time for fixed volume linked to higher concentration (or reverse argument) [1] [1] [1] [3] (f) PLAN Methods Candidate repeats the experiment keeping HCl constant and varying the temperature Description of how the temperature will be controlled is required [1] [1]
Mark scheme, page 4
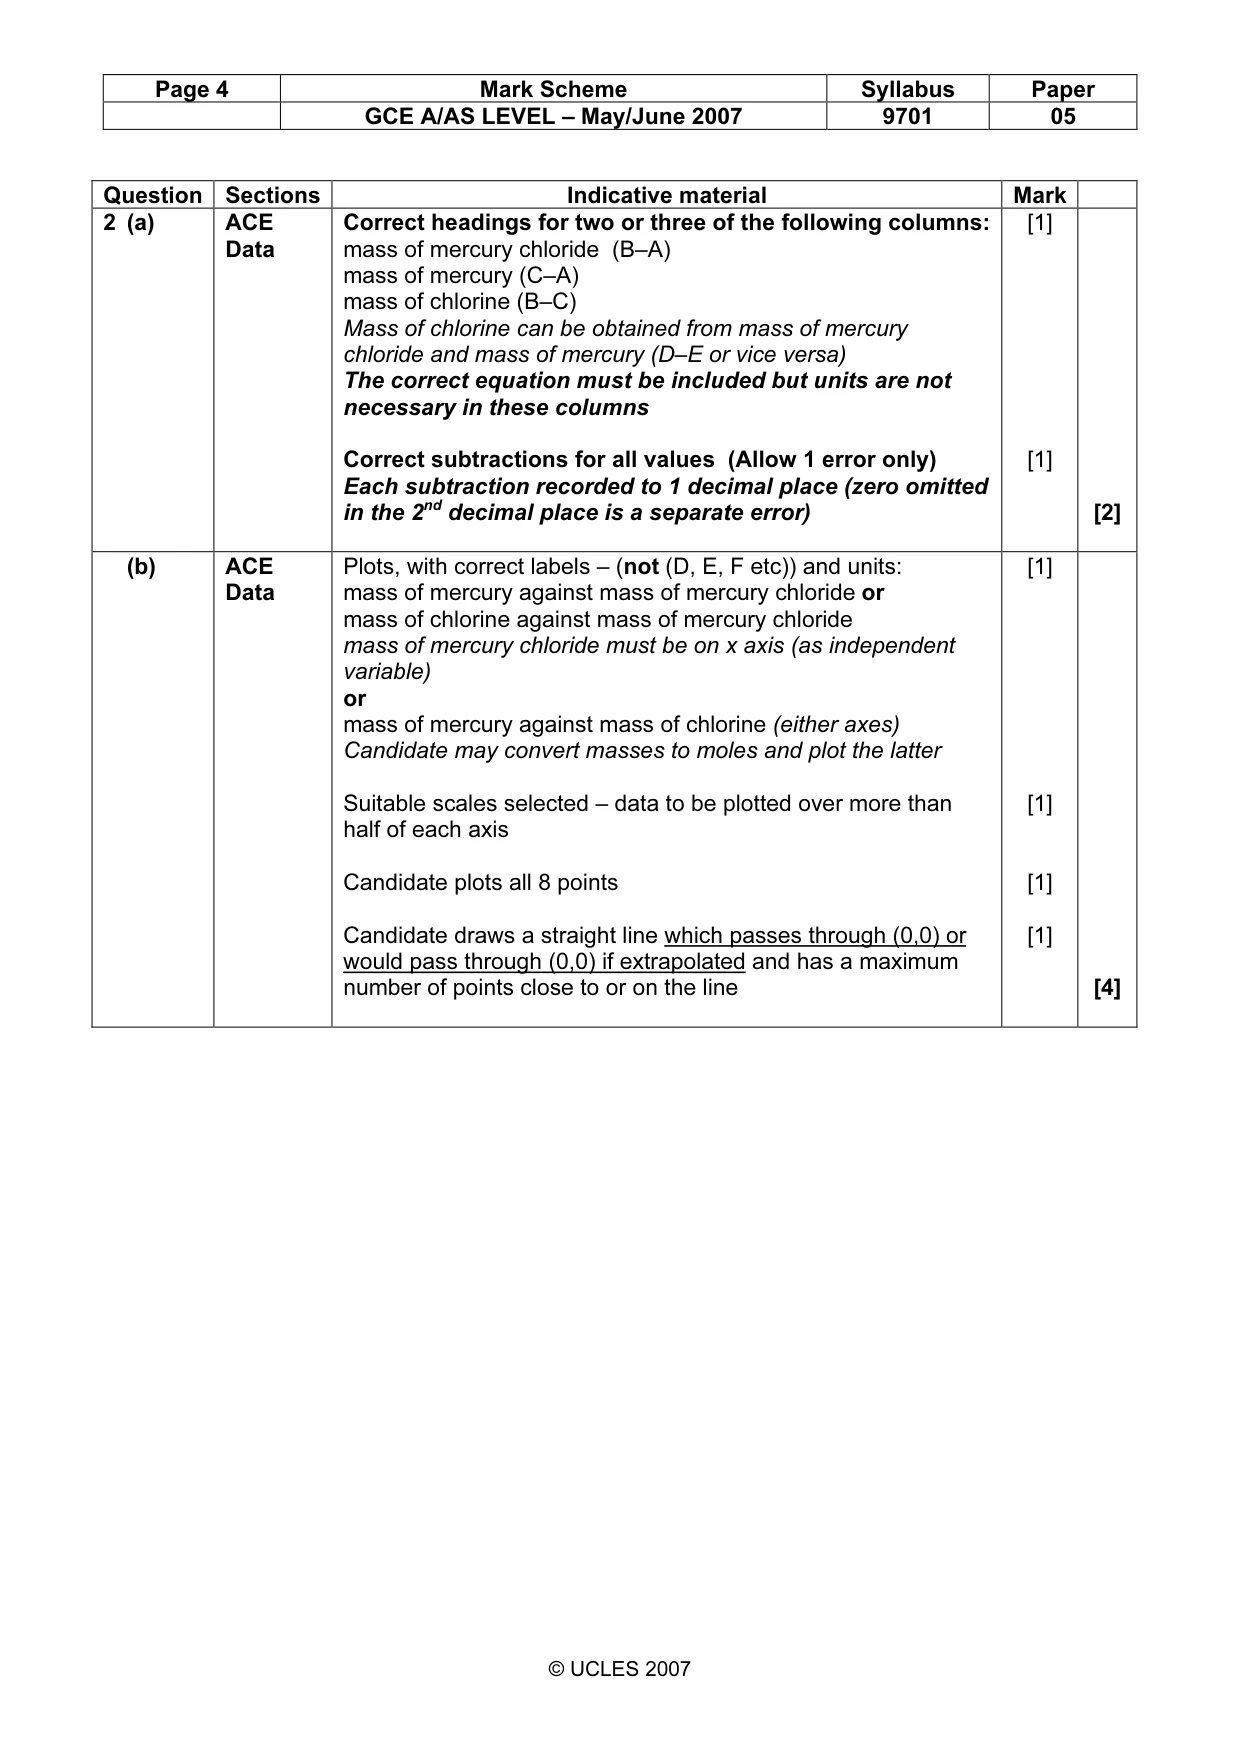
Page 4 Mark Scheme Syllabus Paper GCE A/AS LEVEL – May/June 2007 9701 05 © UCLES 2007 Question Sections Indicative material Mark 2 (a) ACE Data Correct headings for two or three of the following columns: mass of mercury chloride (B–A) mass of mercury (C–A) mass of chlorine (B–C) Mass of chlorine can be obtained from mass of mercury chloride and mass of mercury (D–E or vice versa) The correct equation must be included but units are not necessary in these columns Correct subtractions for all values (Allow 1 error only) Each subtraction recorded to 1 decimal place (zero omitted in the 2nd decimal place is a separate error) [1] [1] [2] (b) ACE Data Plots, with correct labels – (not (D, E, F etc)) and units: mass of mercury against mass of mercury chloride or mass of chlorine against mass of mercury chloride mass of mercury chloride must be on x axis (as independent variable) or mass of mercury against mass of chlorine (either axes) Candidate may convert masses to moles and plot the latter Suitable scales selected – data to be plotted over more than half of each axis Candidate plots all 8 points Candidate draws a straight line which passes through (0,0) or would pass through (0,0) if extrapolated and has a maximum number of points close to or on the line [1] [1] [1] [1] [4]
Mark scheme, page 5
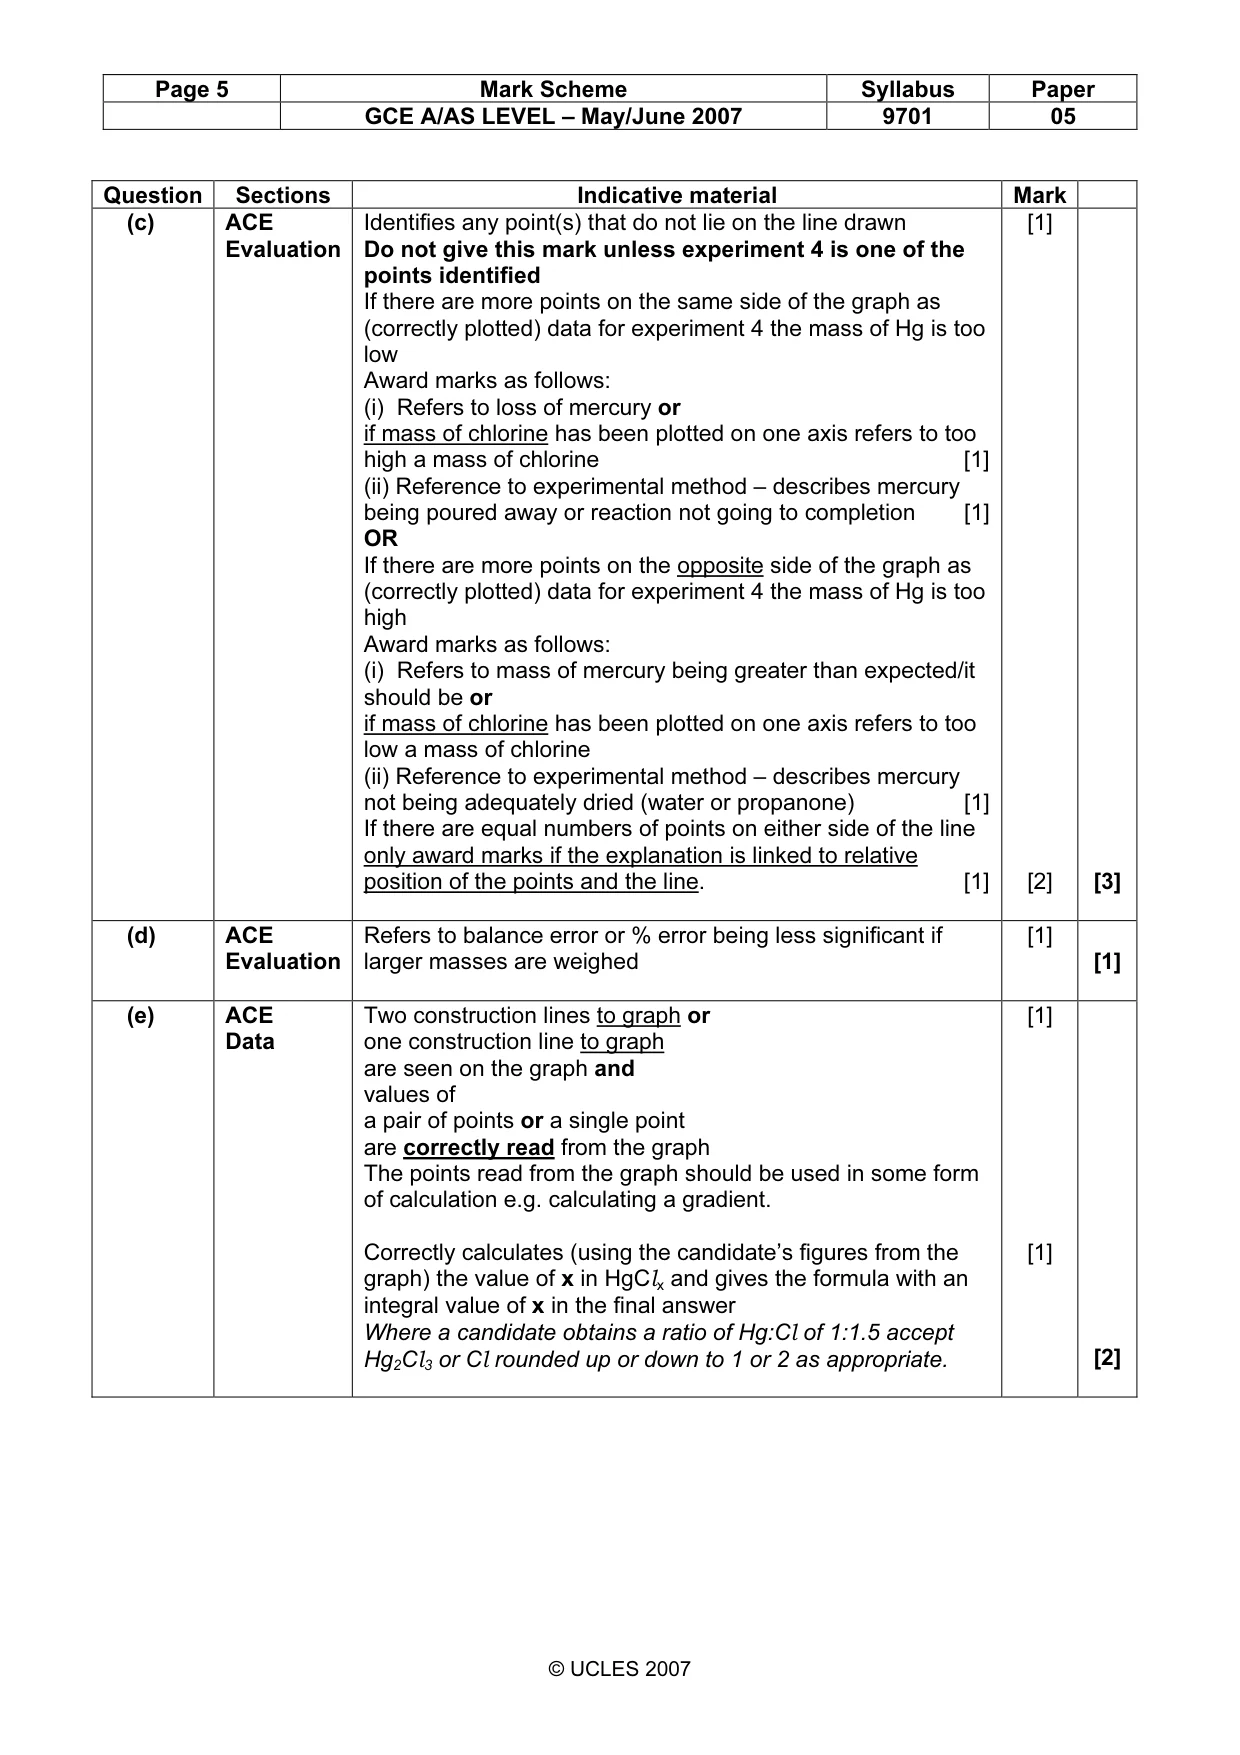
Page 5 Mark Scheme Syllabus Paper GCE A/AS LEVEL – May/June 2007 9701 05 © UCLES 2007 Question Sections Indicative material Mark (c) ACE Evaluation Identifies any point(s) that do not lie on the line drawn Do not give this mark unless experiment 4 is one of the points identified If there are more points on the same side of the graph as (correctly plotted) data for experiment 4 the mass of Hg is too low Award marks as follows: (i) Refers to loss of mercury or if mass of chlorine has been plotted on one axis refers to too high a mass of chlorine [1] (ii) Reference to experimental method – describes mercury being poured away or reaction not going to completion [1] OR If there are more points on the opposite side of the graph as (correctly plotted) data for experiment 4 the mass of Hg is too high Award marks as follows: (i) Refers to mass of mercury being greater than expected/it should be or if mass of chlorine has been plotted on one axis refers to too low a mass of chlorine (ii) Reference to experimental method – describes mercury not being adequately dried (water or propanone) [1] If there are equal numbers of points on either side of the line only award marks if the explanation is linked to relative position of the points and the line. [1] [1] [2] [3] (d) ACE Evaluation Refers to balance error or % error being less significant if larger masses are weighed [1] [1] (e) ACE Data Two construction lines to graph or one construction line to graph are seen on the graph and values of a pair of points or a single point are correctly read from the graph The points read from the graph should be used in some form of calculation e.g. calculating a gradient. Correctly calculates (using the candidate’s figures from the graph) the value of x in HgClx and gives the formula with an integral value of x in the final answer Where a candidate obtains a ratio of Hg:Cl of 1:1.5 accept Hg2Cl3 or Cl rounded up or down to 1 or 2 as appropriate. [1] [1] [2]
Mark scheme, page 6
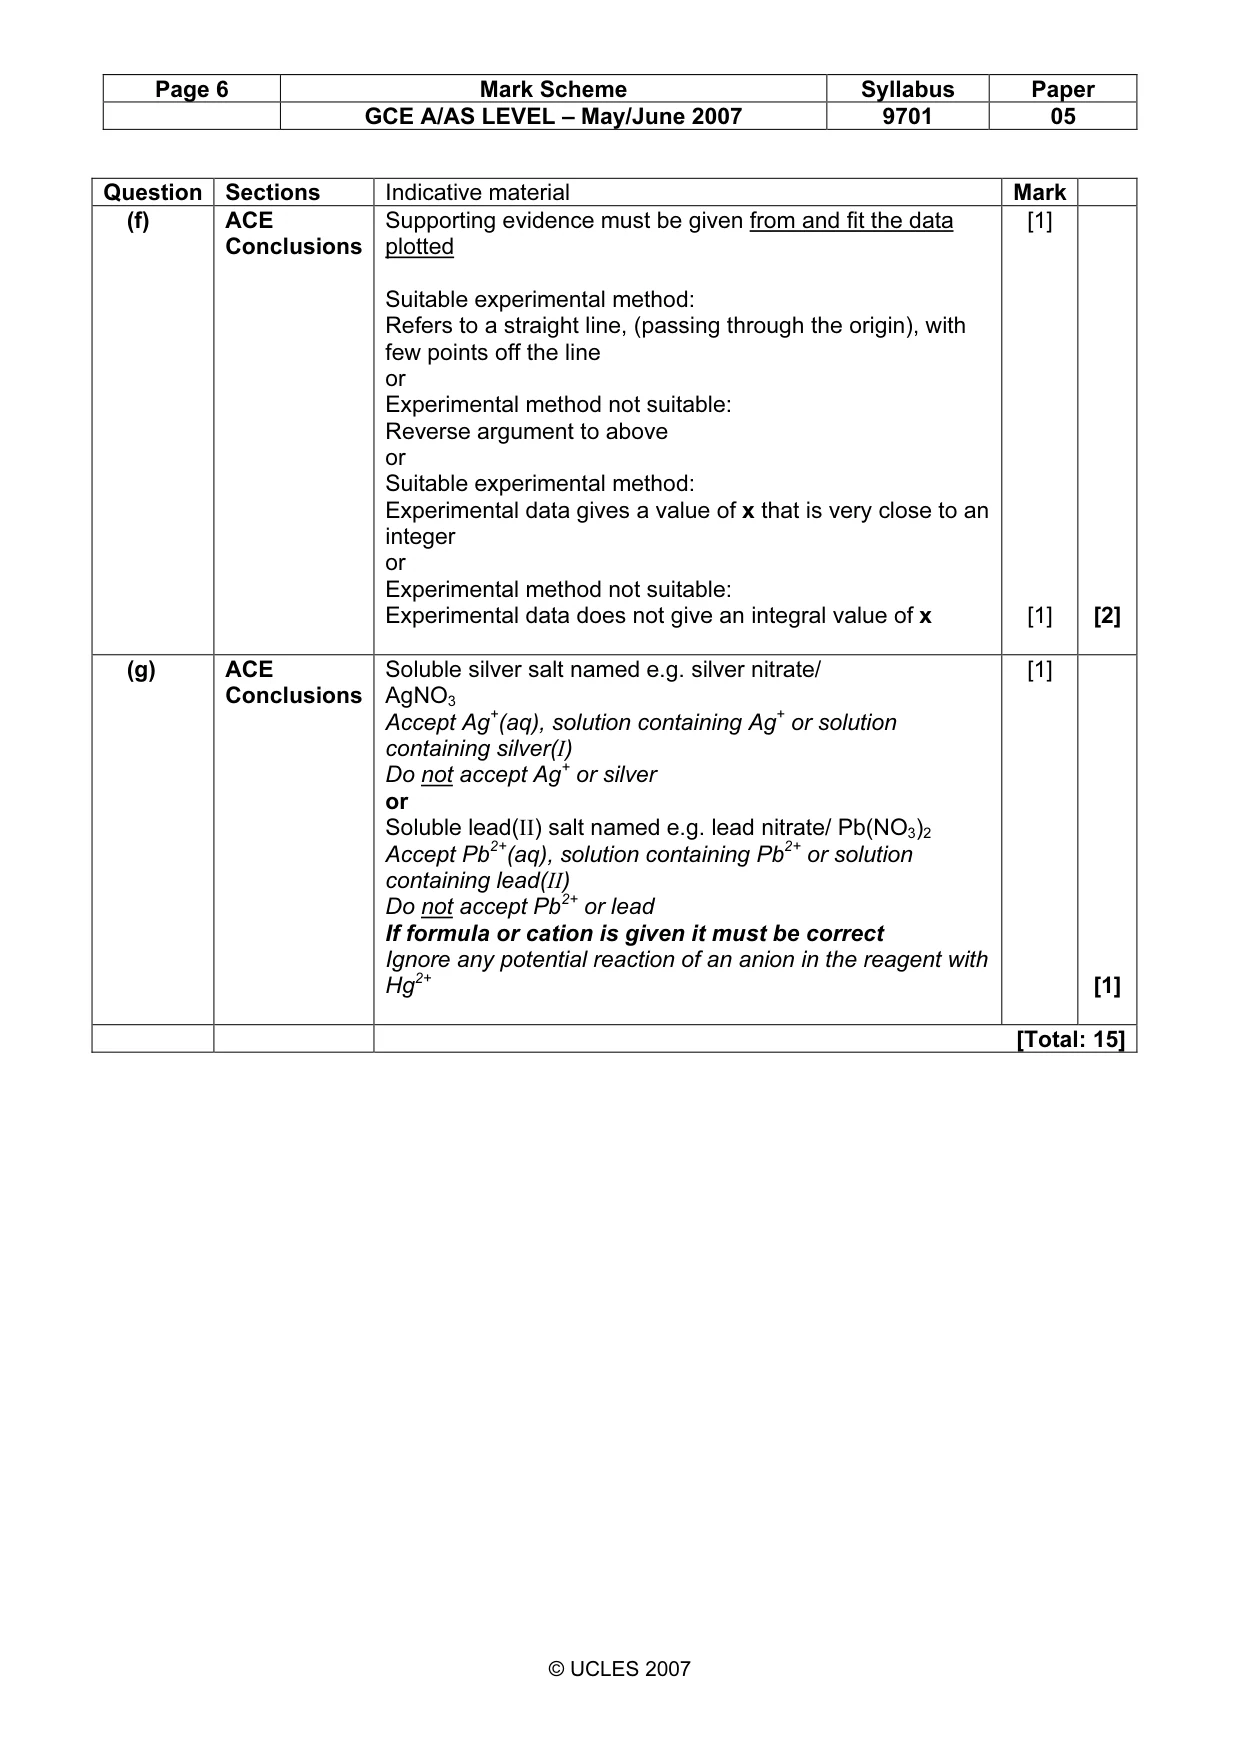
Page 6 Mark Scheme Syllabus Paper GCE A/AS LEVEL – May/June 2007 9701 05 © UCLES 2007 Question Sections Indicative material Mark (f) ACE Conclusions Supporting evidence must be given from and fit the data plotted Suitable experimental method: Refers to a straight line, (passing through the origin), with few points off the line or Experimental method not suitable: Reverse argument to above or Suitable experimental method: Experimental data gives a value of x that is very close to an integer or Experimental method not suitable: Experimental data does not give an integral value of x [1] [1] [2] (g) ACE Conclusions Soluble silver salt named e.g. silver nitrate/ AgNO3 Accept Ag+(aq), solution containing Ag+ or solution containing silver(I) Do not accept Ag+ or silver or Soluble lead(II) salt named e.g. lead nitrate/ Pb(NO3)2 Accept Pb2+(aq), solution containing Pb2+ or solution containing lead(II) Do not accept Pb2+ or lead If formula or cation is given it must be correct Ignore any potential reaction of an anion in the reagent with Hg2+ [1] [1] [Total: 15]
Mark scheme, page 7
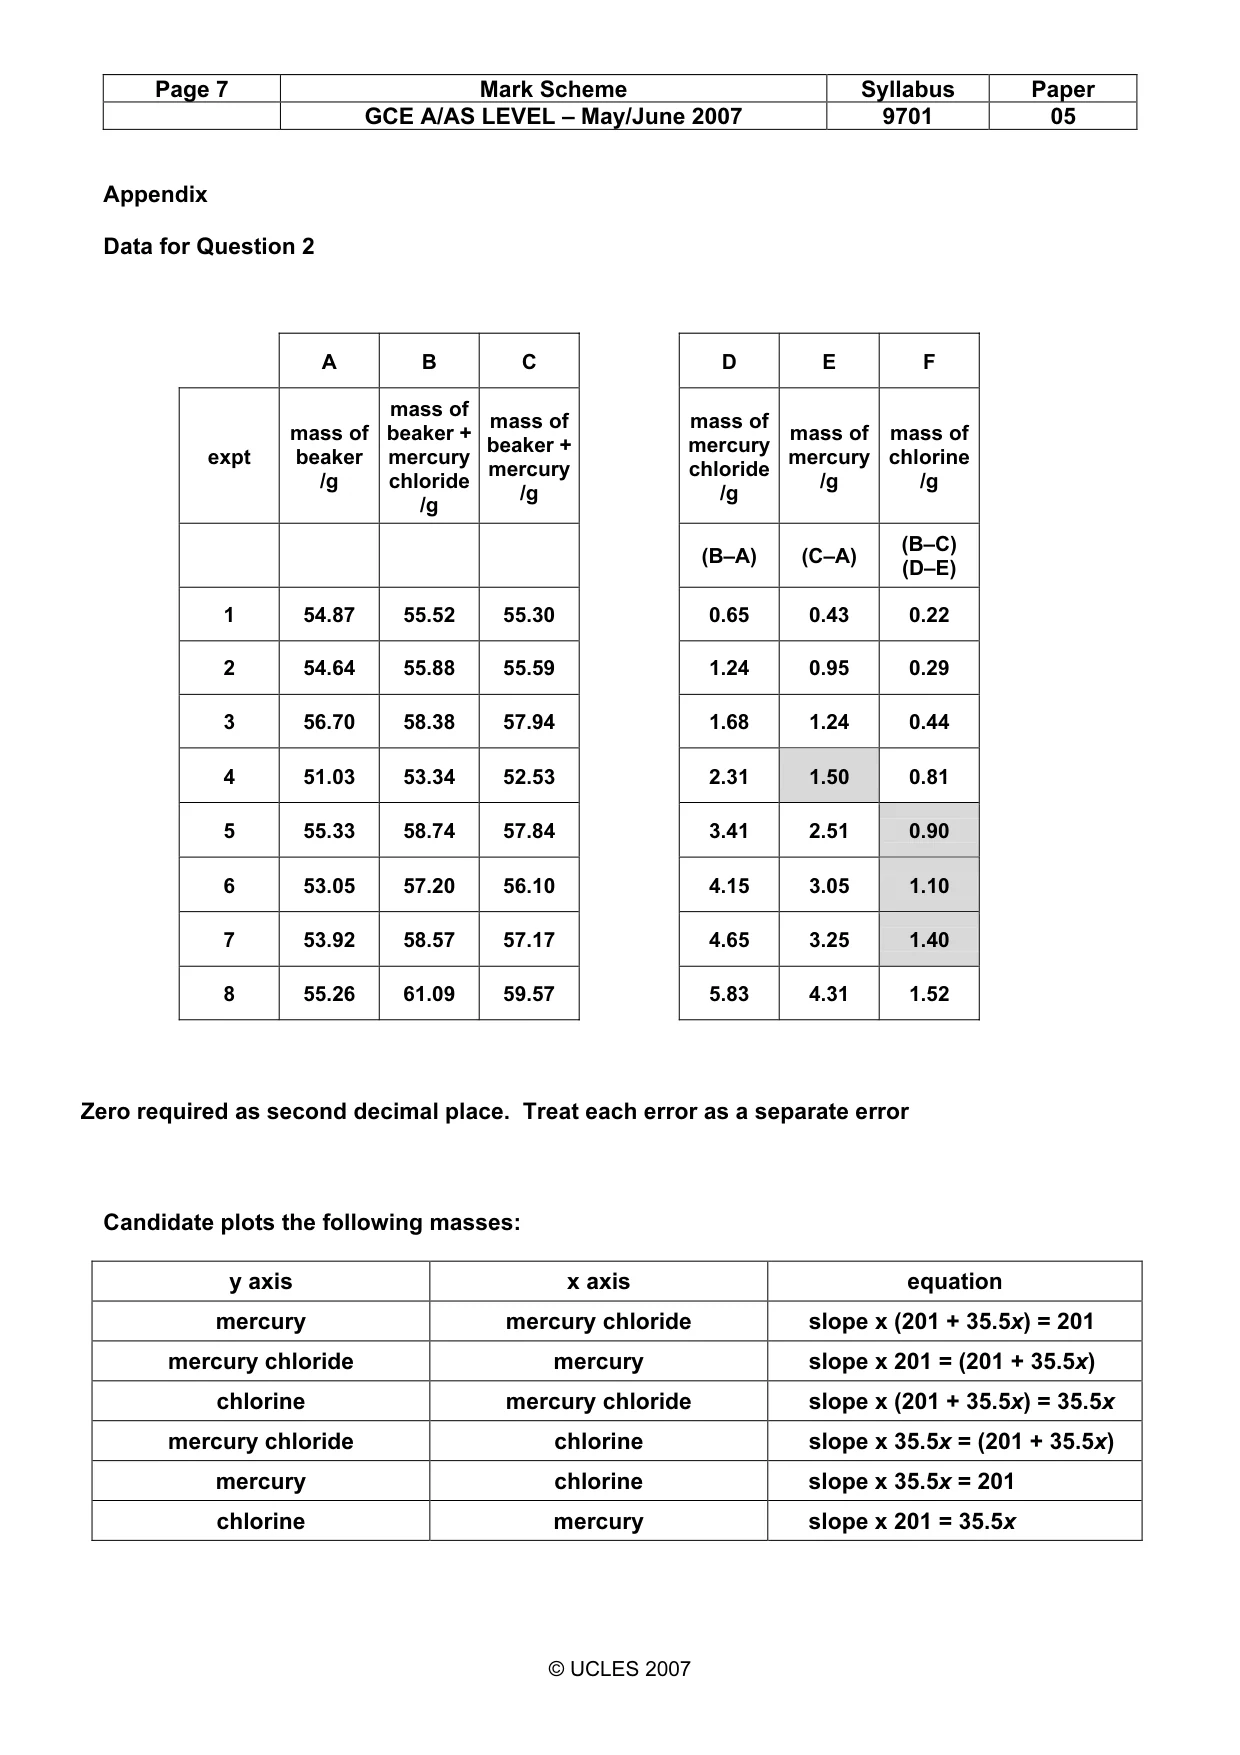
Page 7 Mark Scheme Syllabus Paper GCE A/AS LEVEL – May/June 2007 9701 05 © UCLES 2007 Appendix Data for Question 2 Candidate plots the following masses: y axis x axis equation mercury mercury chloride slope x (201 + 35.5x) = 201 mercury chloride mercury slope x 201 = (201 + 35.5x) chlorine mercury chloride slope x (201 + 35.5x) = 35.5x mercury chloride chlorine slope x 35.5x = (201 + 35.5x) mercury chlorine slope x 35.5x = 201 chlorine mercury slope x 201 = 35.5x A B C D E F expt mass of beaker /g mass of beaker + mercury chloride /g mass of beaker + mercury /g mass of mercury chloride /g mass of mercury /g mass of chlorine /g (B–A) (C–A) (B–C) (D–E) 1 54.87 55.52 55.30 0.65 0.43 0.22 2 54.64 55.88 55.59 1.24 0.95 0.29 3 56.70 58.38 57.94 1.68 1.24 0.44 4 51.03 53.34 52.53 2.31 1.50 0.81 5 55.33 58.74 57.84 3.41 2.51 0.90 6 53.05 57.20 56.10 4.15 3.05 1.10 7 53.92 58.57 57.17 4.65 3.25 1.40 8 55.26 61.09 59.57 5.83 4.31 1.52 Zero required as second decimal place. Treat each error as a separate error
What you needed in this session
Cambridge’s own grade thresholds for 2007 May/June, Paper 5 · Variant 1. A higher threshold means an easier paper — the bar moves with how the cohort did.