Cambridge A Level Chemistry 9701 — 2004 Oct/Nov Paper 5 · Variant 1
9701/51/O/N/04
The question paper and its mark scheme, free to read here and free to download. This is Cambridge’s own paper, exactly as it was sat.
Question paper8 pages
Mark scheme11 pages
Answers below. Sit the paper first if you are practising.
Paper as text
Question paper, page 1
FOR EXAMINER’S USE 1 2 TOTAL This document consists of 7 printed pages and 1 blank page. SP (SC) S63113/4 © UCLES 2004 [Turn over UNIVERSITY OF CAMBRIDGE INTERNATIONAL EXAMINATIONS General Certificate of Education Advanced Subsidiary Level and Advanced Level CHEMISTRY 9701/05 Paper 5 Practical Test October/November 2004 1 hour 30 minutes Candidates answer on the Question Paper. Additional materials: As listed in Instructions to Supervisors READ THESE INSTRUCTIONS FIRST Write your details, including practical session and laboratory where appropriate, in the boxes provided. Write in dark blue or black pen in the spaces provided on the Question Paper. You may use a soft pencil for any diagrams, graphs, or rough working. Do not use staples, paper clips, highlighters, glue or correction fluid. Answer all questions. The number of marks is given in brackets [ ] at the end of each question or part question. You are advised to show all working in calculations. You may use a calculator. Use of a Data Booklet is unnecessary. Centre Number Candidate Number Name If you have been given a label, look at the details. If any details are incorrect or missing, please fill in your correct details in the space given at the top of this page. Stick your personal label here, if provided. SESSION LABORATORY
Question paper, page 2
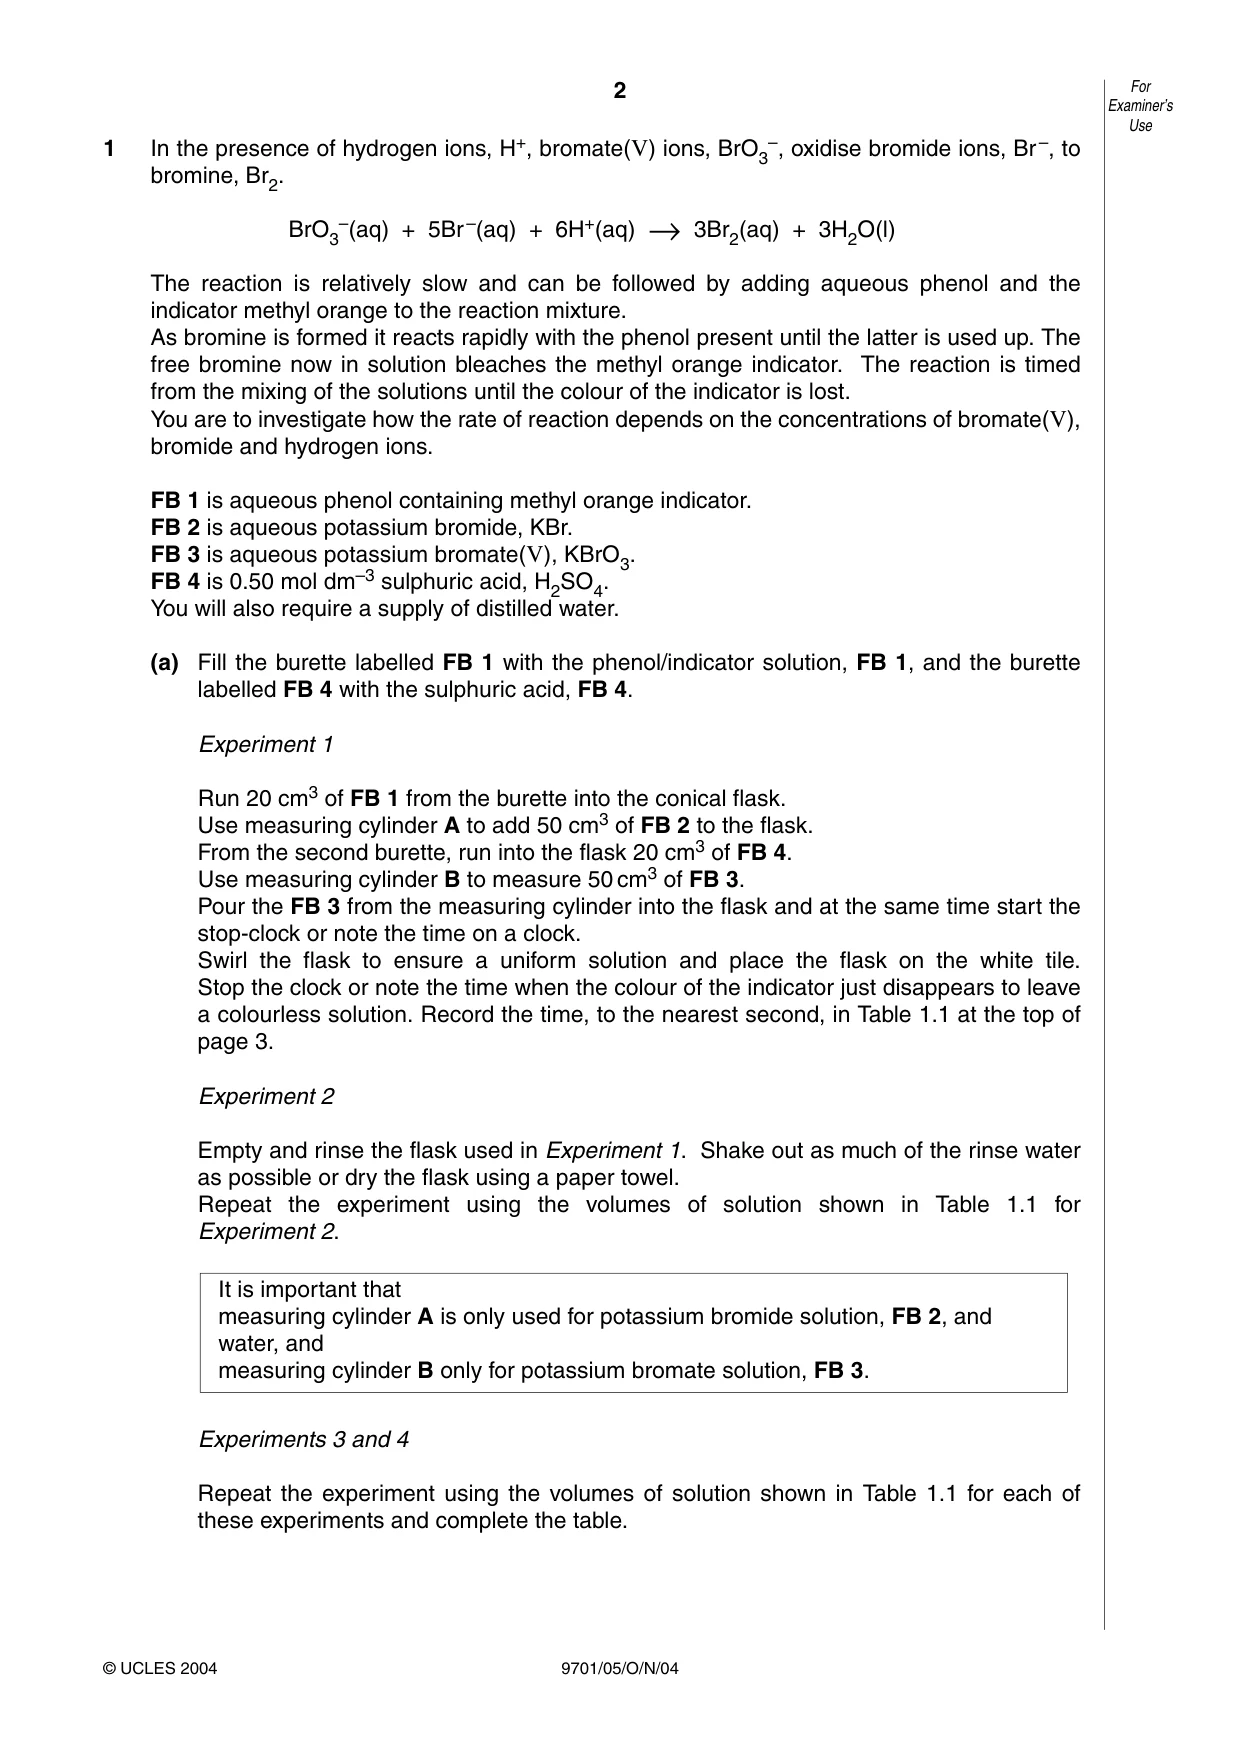
2 9701/05/O/N/04 1 In the presence of hydrogen ions, H+, bromate(V) ions, BrO3 –, oxidise bromide ions, Br–, to bromine, Br2. BrO3 –(aq) + 5Br–(aq) + 6H+(aq) →3Br2(aq) + 3H2O(l) The reaction is relatively slow and can be followed by adding aqueous phenol and the indicator methyl orange to the reaction mixture. As bromine is formed it reacts rapidly with the phenol present until the latter is used up. The free bromine now in solution bleaches the methyl orange indicator. The reaction is timed from the mixing of the solutions until the colour of the indicator is lost. You are to investigate how the rate of reaction depends on the concentrations of bromate(V), bromide and hydrogen ions. FB 1 is aqueous phenol containing methyl orange indicator. FB 2 is aqueous potassium bromide, KBr. FB 3 is aqueous potassium bromate(V), KBrO3. FB 4 is 0.50 mol dm–3 sulphuric acid, H2SO4. You will also require a supply of distilled water. (a) Fill the burette labelled FB 1 with the phenol/indicator solution, FB 1, and the burette labelled FB 4 with the sulphuric acid, FB 4. Experiment 1 Run 20 cm3 of FB 1 from the burette into the conical flask. Use measuring cylinder A to add 50 cm3 of FB 2 to the flask. From the second burette, run into the flask 20 cm3 of FB 4. Use measuring cylinder B to measure 50 cm3 of FB 3. Pour the FB 3 from the measuring cylinder into the flask and at the same time start the stop-clock or note the time on a clock. Swirl the flask to ensure a uniform solution and place the flask on the white tile. Stop the clock or note the time when the colour of the indicator just disappears to leave a colourless solution. Record the time, to the nearest second, in Table 1.1 at the top of page 3. Experiment 2 Empty and rinse the flask used in Experiment 1. Shake out as much of the rinse water as possible or dry the flask using a paper towel. Repeat the experiment using the volumes of solution shown in Table 1.1 for Experiment 2. Experiments 3 and 4 Repeat the experiment using the volumes of solution shown in Table 1.1 for each of these experiments and complete the table. It is important that measuring cylinder A is only used for potassium bromide solution, FB 2, and water, and measuring cylinder B only for potassium bromate solution, FB 3. For Examiner’s Use © UCLES 2004
Question paper, page 3
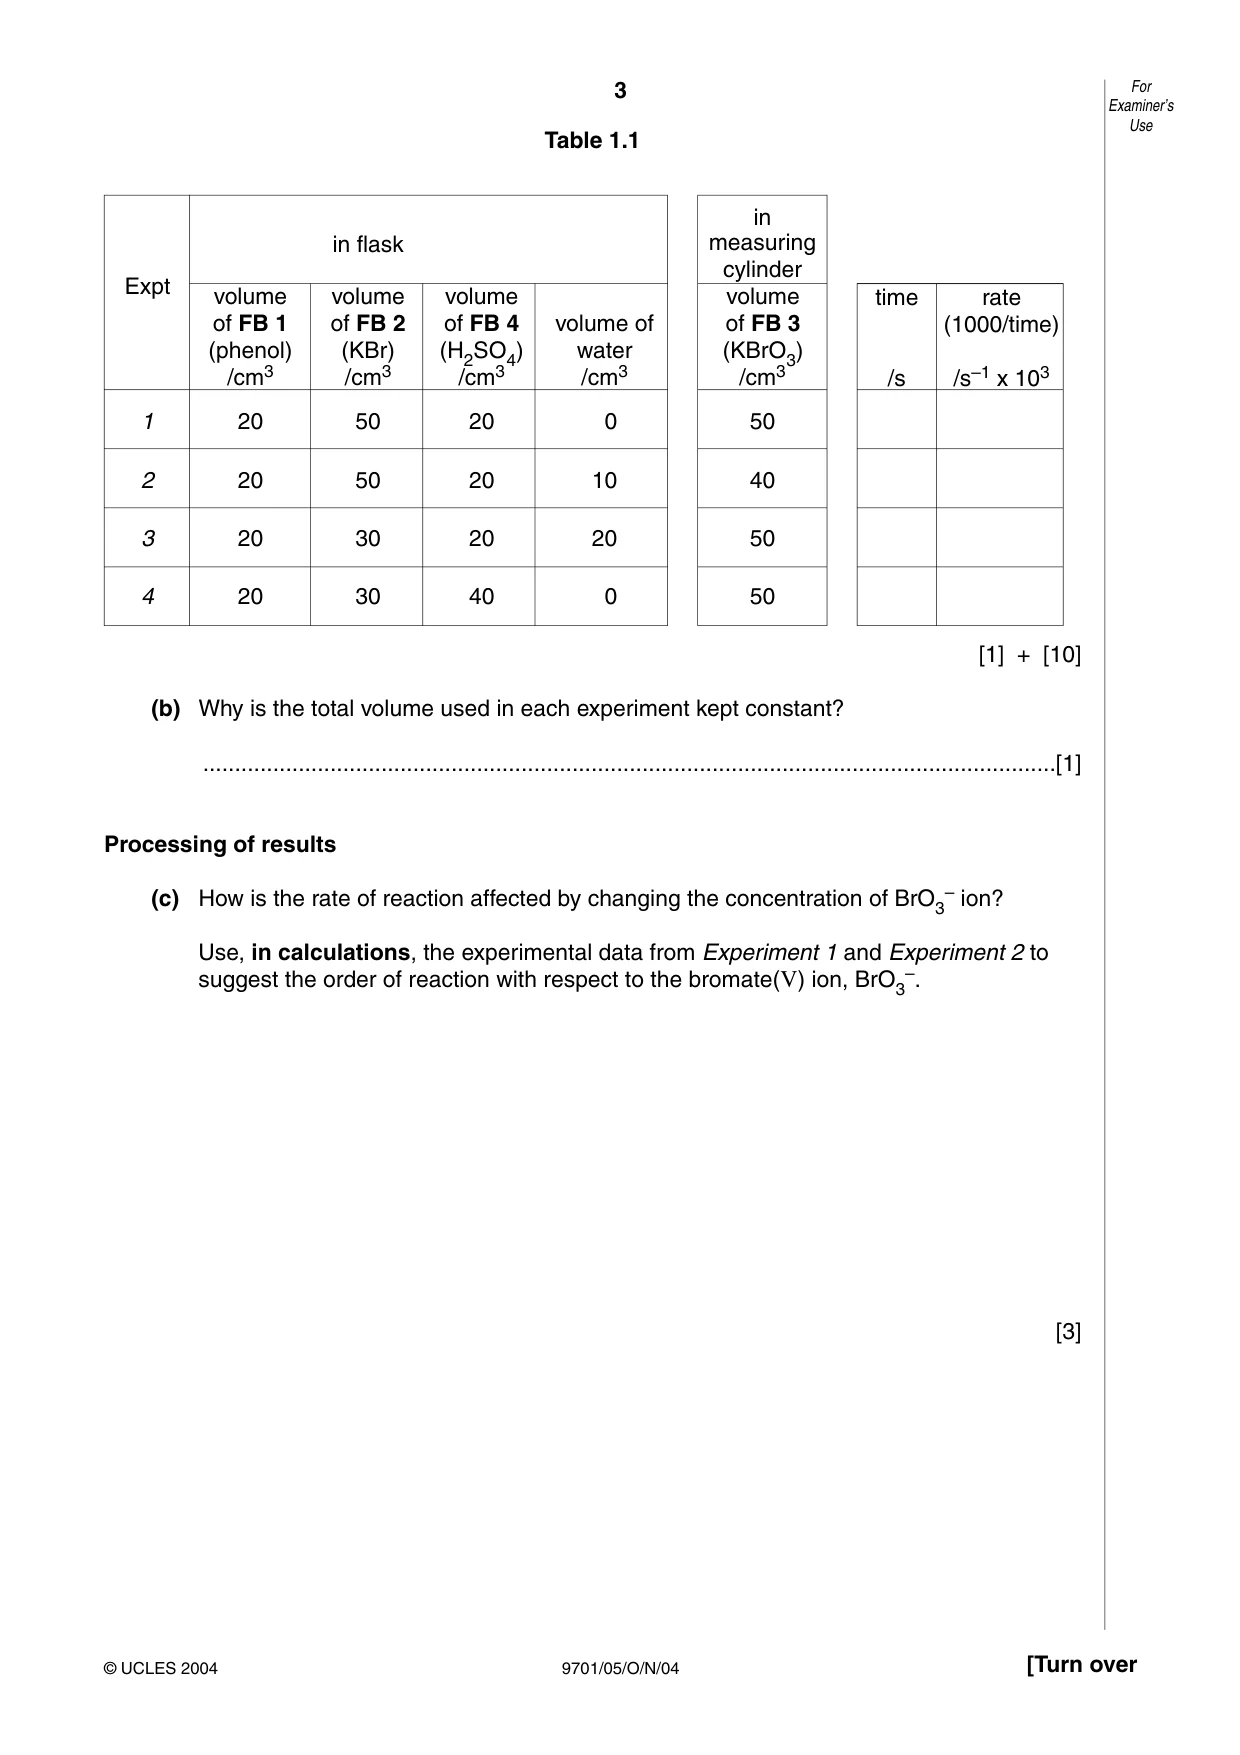
3 9701/05/O/N/04 [Turn over Table 1.1 [1] + [10] (b) Why is the total volume used in each experiment kept constant? …[1] Processing of results (c) How is the rate of reaction affected by changing the concentration of BrO3 – ion? Use, in calculations, the experimental data from Experiment 1 and Experiment 2 to suggest the order of reaction with respect to the bromate(V) ion, BrO3 –. [3] For Examiner’s Use © UCLES 2004 in flask Expt volume volume volume of FB 1 of FB 2 of FB 4 volume of (phenol) (KBr) (H2SO4) water /cm3 /cm3 /cm3 /cm3 1 20 50 20 0 2 20 50 20 10 3 20 30 20 20 4 20 30 40 0 in measuring cylinder volume of FB 3 (KBrO3) /cm3 50 40 50 50 time rate (1000/time) /s /s–1 x 103
Question paper, page 4
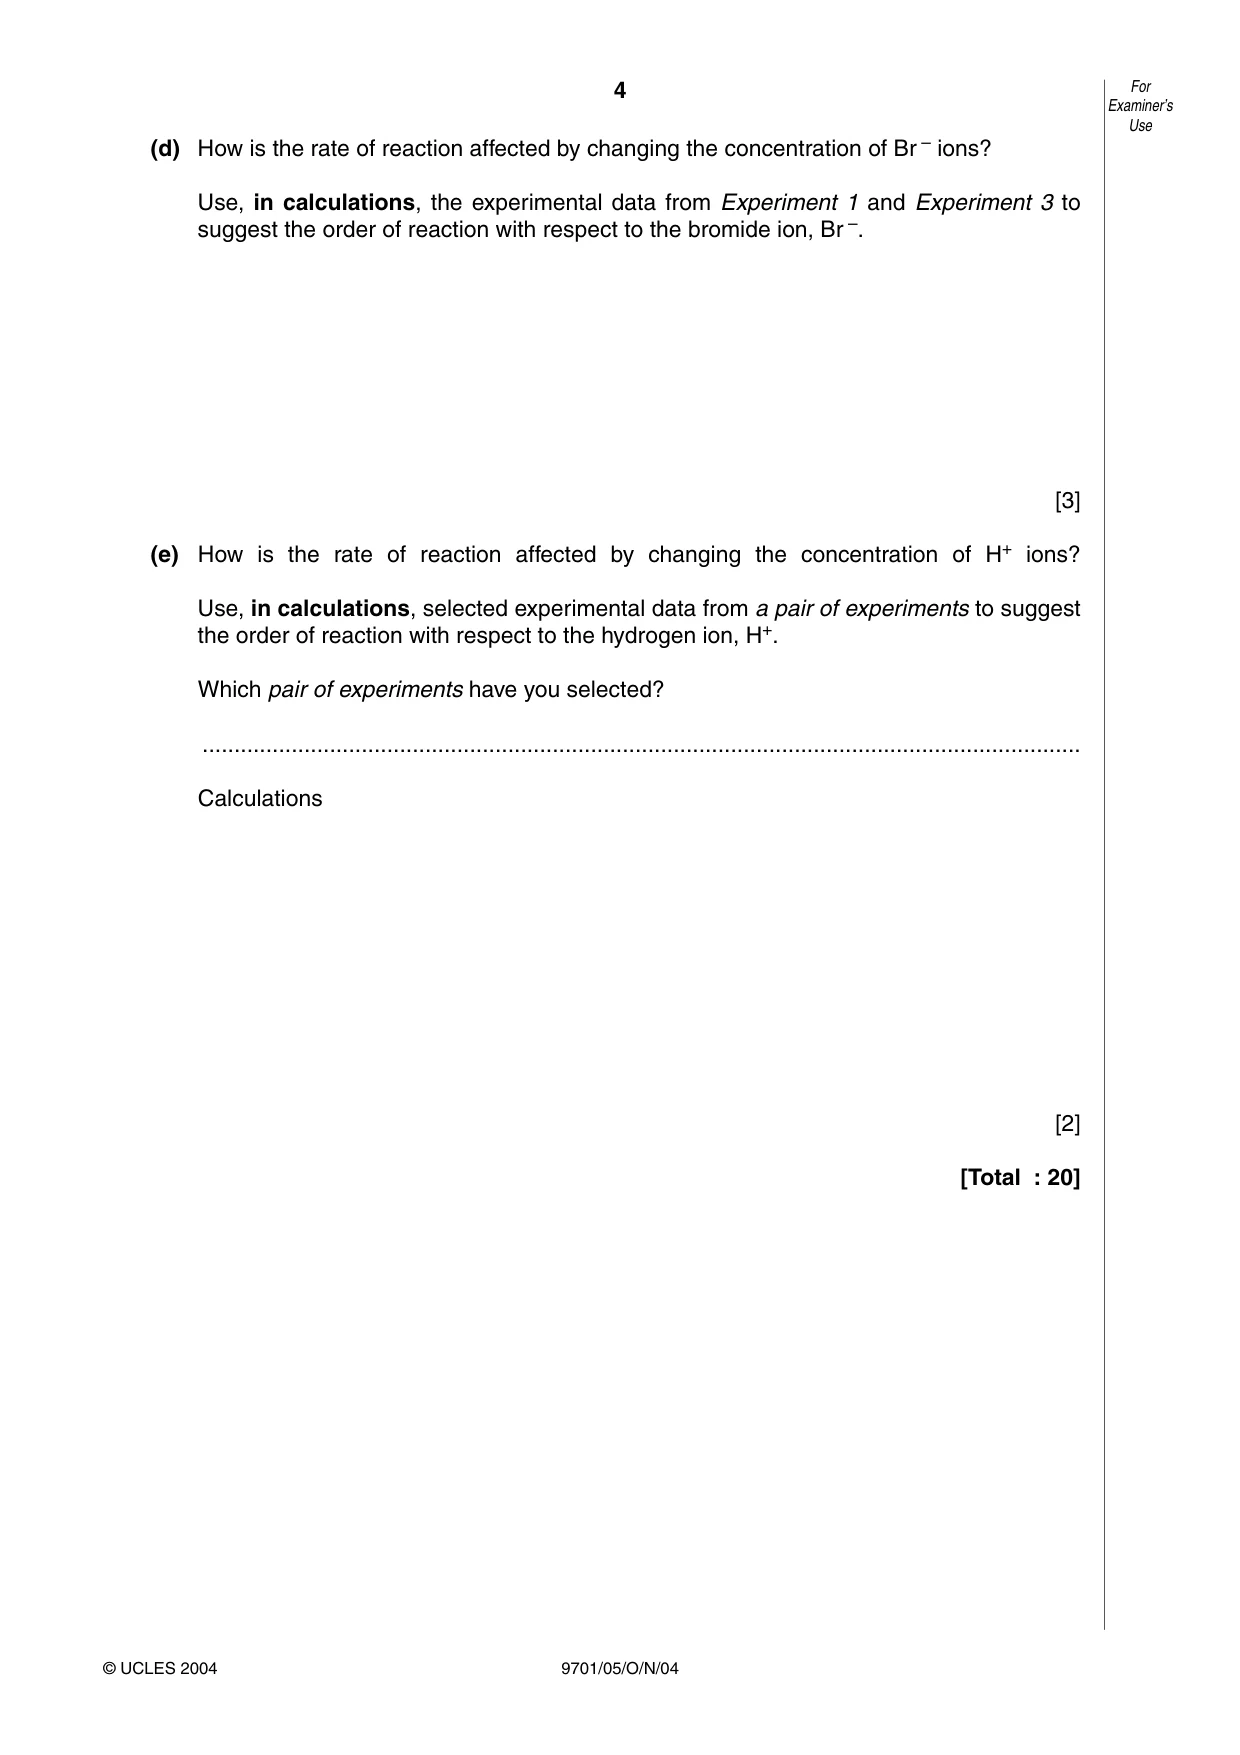
4 9701/05/O/N/04 (d) How is the rate of reaction affected by changing the concentration of Br – ions? Use, in calculations, the experimental data from Experiment 1 and Experiment 3 to suggest the order of reaction with respect to the bromide ion, Br –. [3] (e) How is the rate of reaction affected by changing the concentration of H+ ions? Use, in calculations, selected experimental data from a pair of experiments to suggest the order of reaction with respect to the hydrogen ion, H+. Which pair of experiments have you selected? … Calculations [2] [Total : 20] For Examiner’s Use © UCLES 2004
Question paper, page 5
5 9701/05/O/N/04 [Turn over Question 2 continues overleaf.
Question paper, page 6
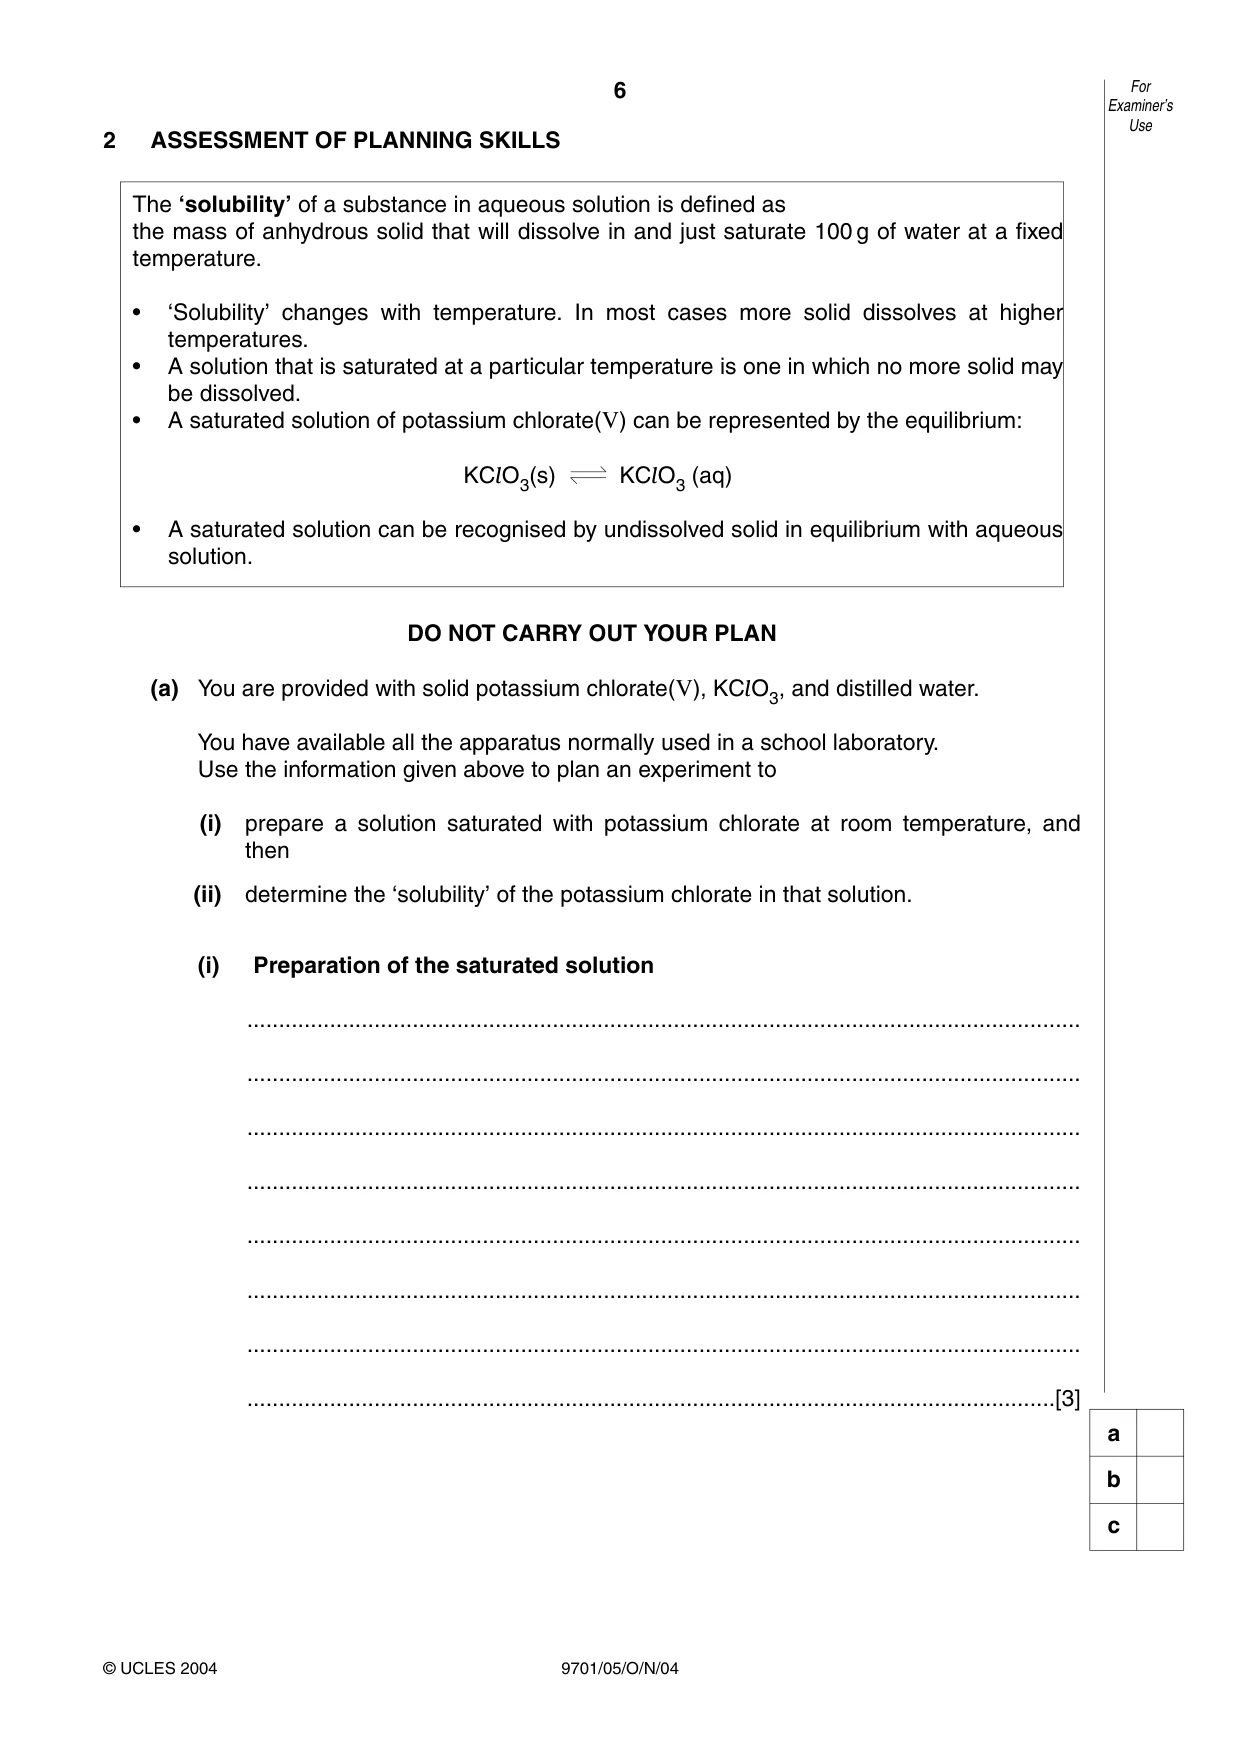
6 9701/05/O/N/04 2 ASSESSMENT OF PLANNING SKILLS DO NOT CARRY OUT YOUR PLAN (a) You are provided with solid potassium chlorate(V), KClO3, and distilled water. You have available all the apparatus normally used in a school laboratory. Use the information given above to plan an experiment to (i) prepare a solution saturated with potassium chlorate at room temperature, and then (ii) determine the ‘solubility’ of the potassium chlorate in that solution. (i) Preparation of the saturated solution … … … … … … … …[3] The ‘solubility’ of a substance in aqueous solution is defined as the mass of anhydrous solid that will dissolve in and just saturate 100 g of water at a fixed temperature. • ‘Solubility’ changes with temperature. In most cases more solid dissolves at higher temperatures. • A solution that is saturated at a particular temperature is one in which no more solid may be dissolved. • A saturated solution of potassium chlorate(V) can be represented by the equilibrium: KClO3(s) KClO3 (aq) • A saturated solution can be recognised by undissolved solid in equilibrium with aqueous solution. For Examiner’s Use © UCLES 2004 a b c
Question paper, page 7
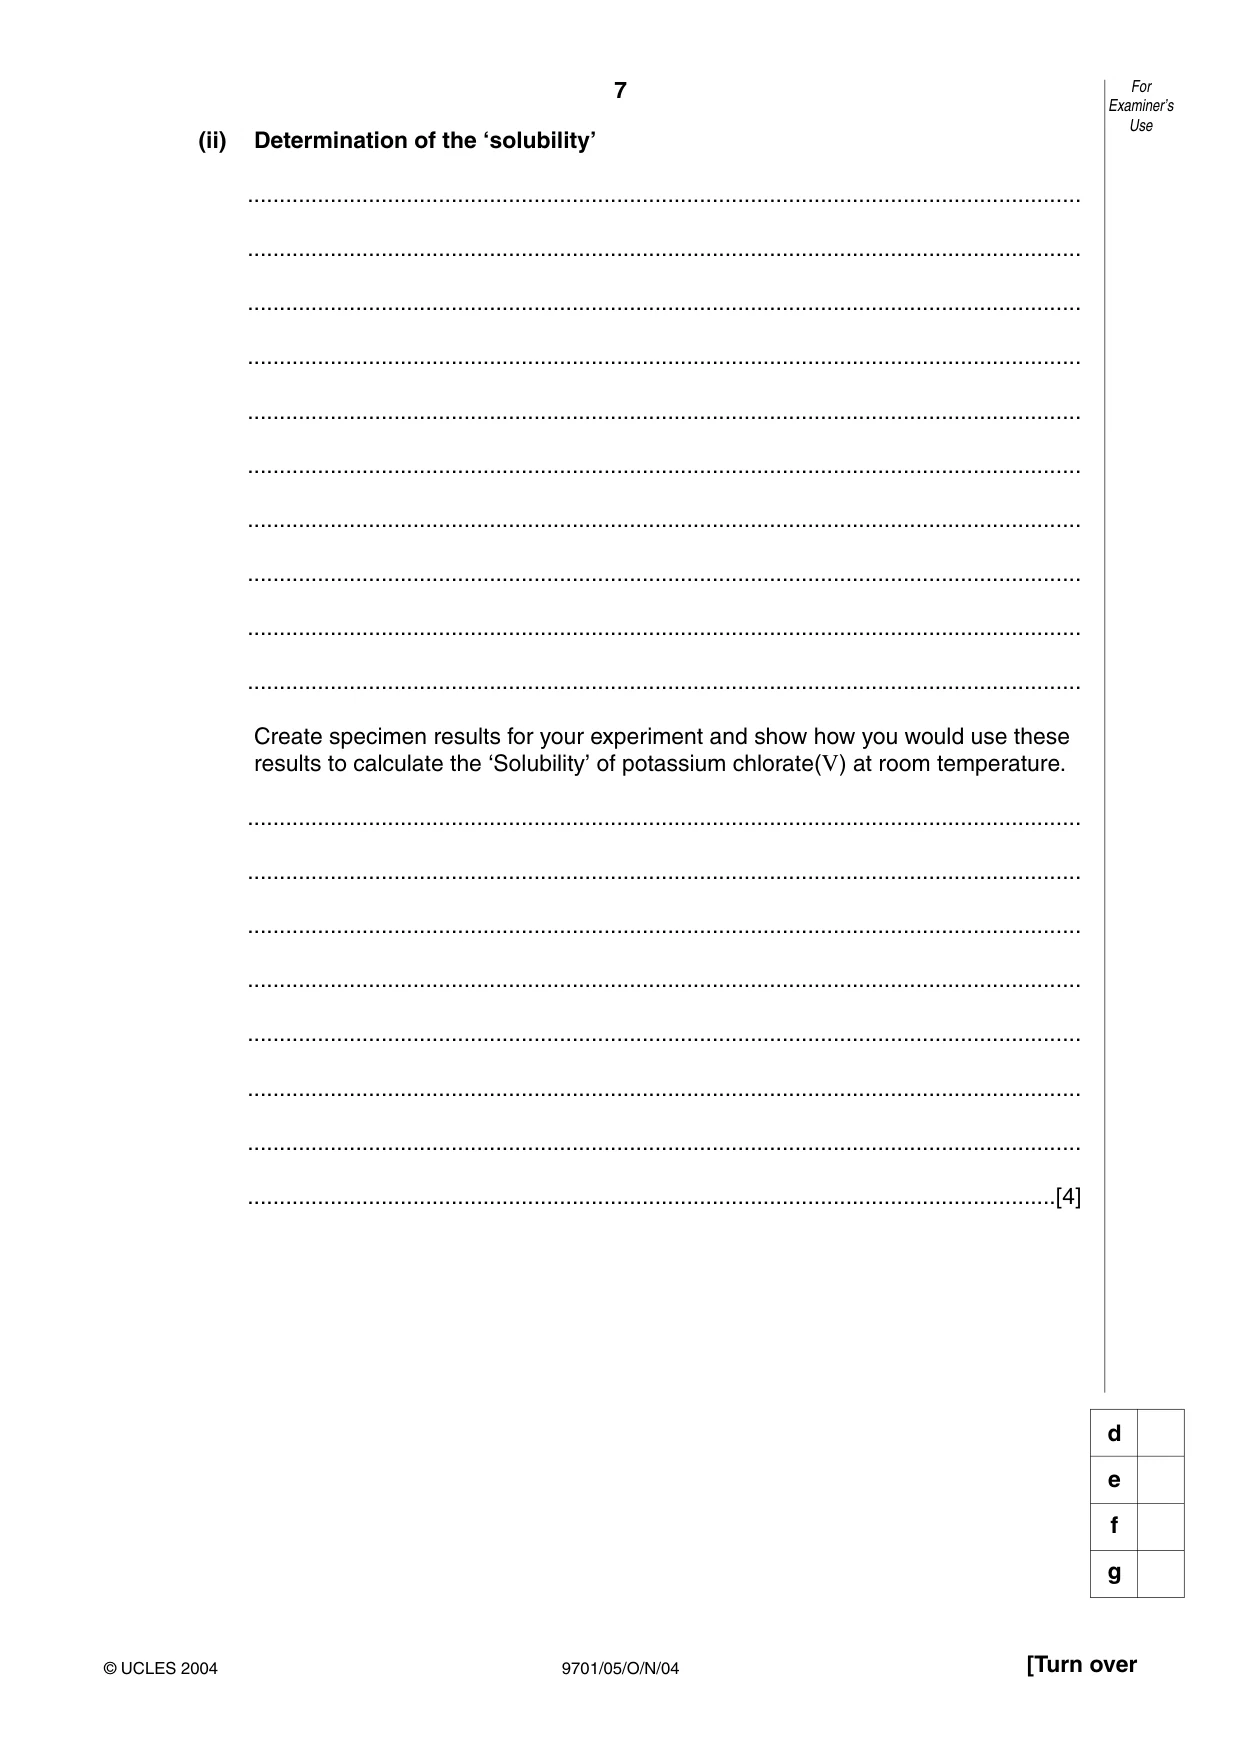
7 9701/05/O/N/04 (ii) Determination of the ‘solubility’ … … … … … … … … … … Create specimen results for your experiment and show how you would use these results to calculate the ‘Solubility’ of potassium chlorate(V) at room temperature. … … … … … … … …[4] For Examiner’s Use © UCLES 2004 [Turn over d e f g
Question paper, page 8
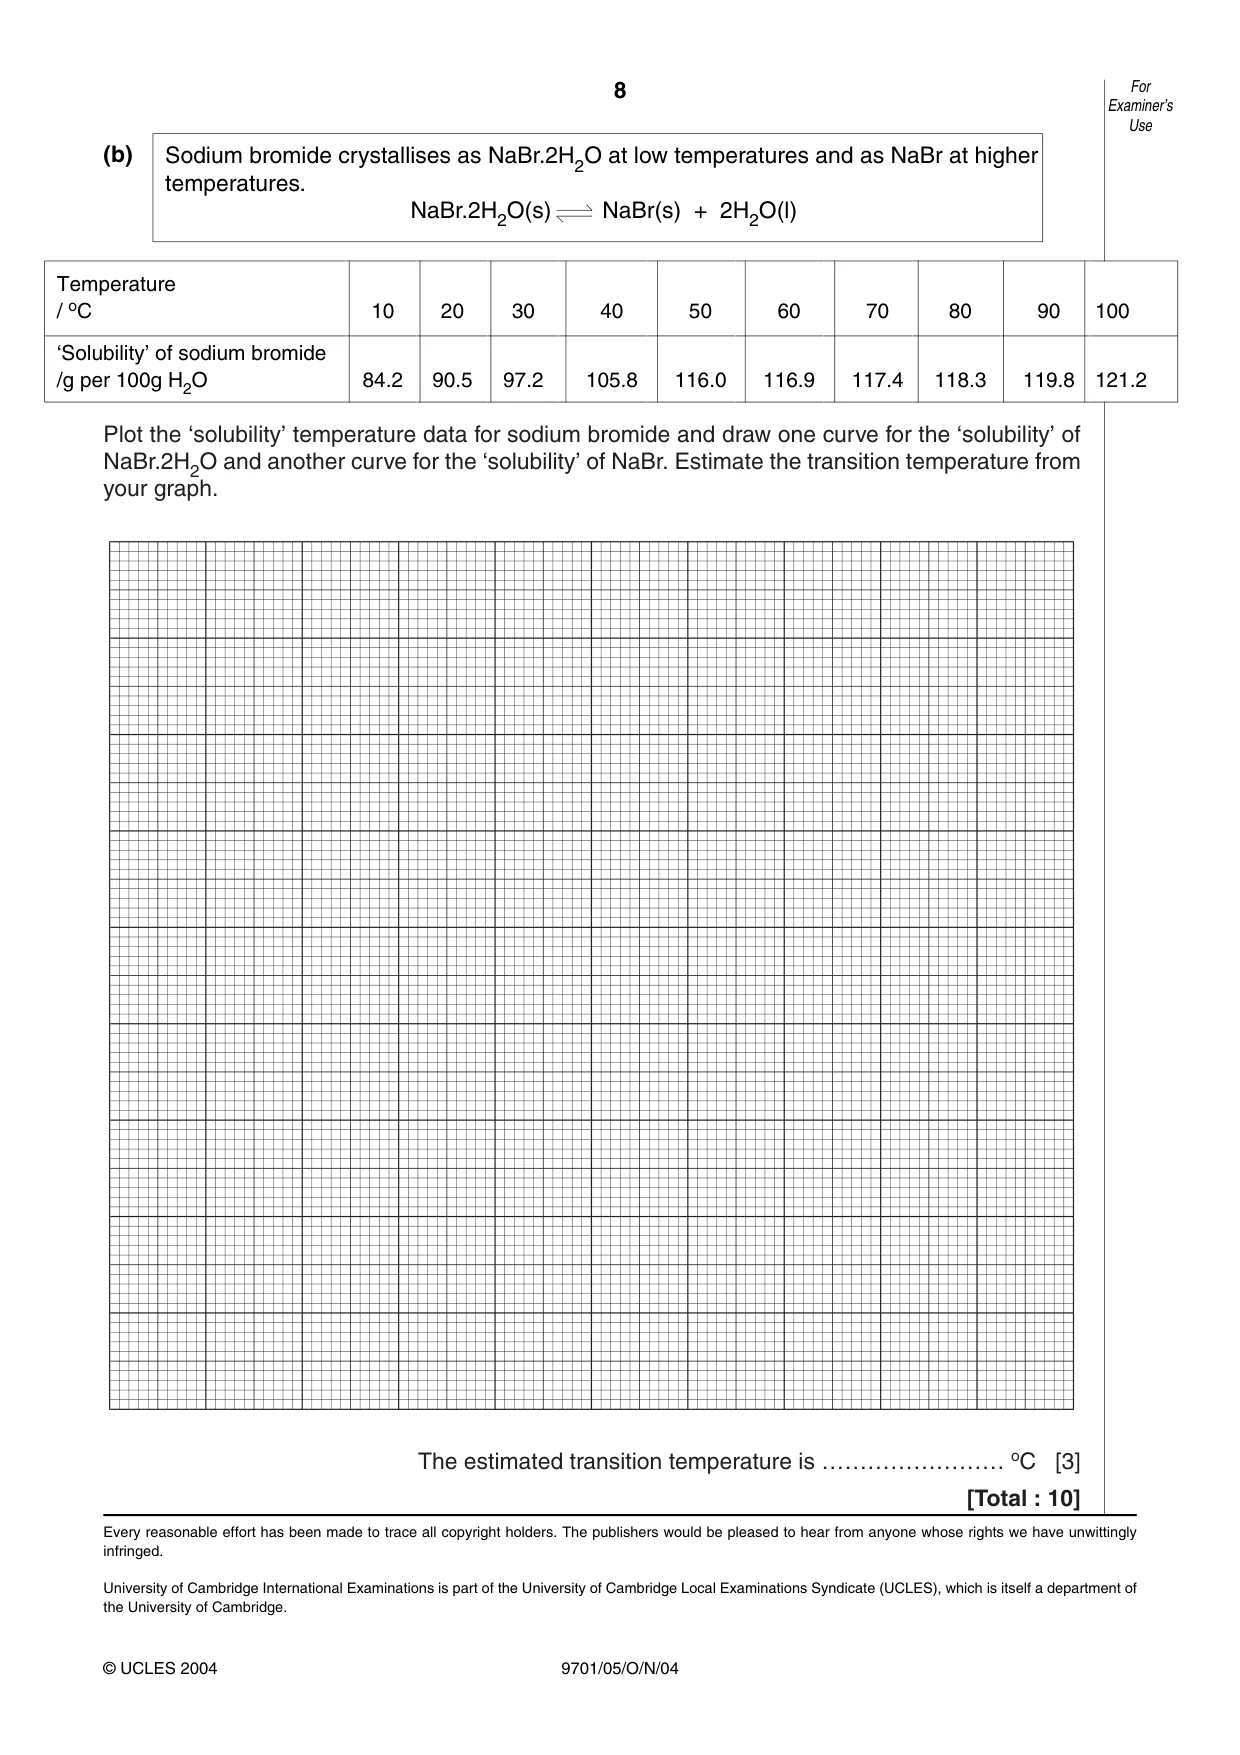
Plot the ‘solubility’ temperature data for sodium bromide and draw one curve for the ‘solubility’ of NaBr.2H2O and another curve for the ‘solubility’ of NaBr. Estimate the transition temperature from your graph. The estimated transition temperature is …………………… oC [3] [Total : 10] Sodium bromide crystallises as NaBr.2H2O at low temperatures and as NaBr at higher temperatures. NaBr.2H2O(s) NaBr(s) + 2H2O(l) 8 For Examiner’s Use Temperature / oC 10 20 30 40 50 60 70 80 90 100 ‘Solubility’ of sodium bromide /g per 100g H2O 84.2 90.5 97.2 105.8 116.0 116.9 117.4 118.3 119.8 121.2 9701/05/O/N/04 © UCLES 2004 (b) Every reasonable effort has been made to trace all copyright holders. The publishers would be pleased to hear from anyone whose rights we have unwittingly infringed. University of Cambridge International Examinations is part of the University of Cambridge Local Examinations Syndicate (UCLES), which is itself a department of the University of Cambridge.
Mark scheme, page 1
UNIVERSITY OF CAMBRIDGE INTERNATIONAL EXAMINATIONS GCE Advanced Level MARK SCHEME for the November 2004 question paper 9701 CHEMISTRY 9701/05 Paper 5 (Practical Test), maximum raw mark 30 This mark scheme is published as an aid to teachers and students, to indicate the requirements of the examination. It shows the basis on which Examiners were initially instructed to award marks. It does not indicate the details of the discussions that took place at an Examiners’ meeting before marking began. Any substantial changes to the mark scheme that arose from these discussions will be recorded in the published Report on the Examination. All Examiners are instructed that alternative correct answers and unexpected approaches in candidates’ scripts must be given marks that fairly reflect the relevant knowledge and skills demonstrated. Mark schemes must be read in conjunction with the question papers and the Report on the Examination. • CIE will not enter into discussion or correspondence in connection with these mark schemes. CIE is publishing the mark schemes for the November 2004 question papers for most IGCSE and GCE Advanced Level syllabuses.
Mark scheme, page 2
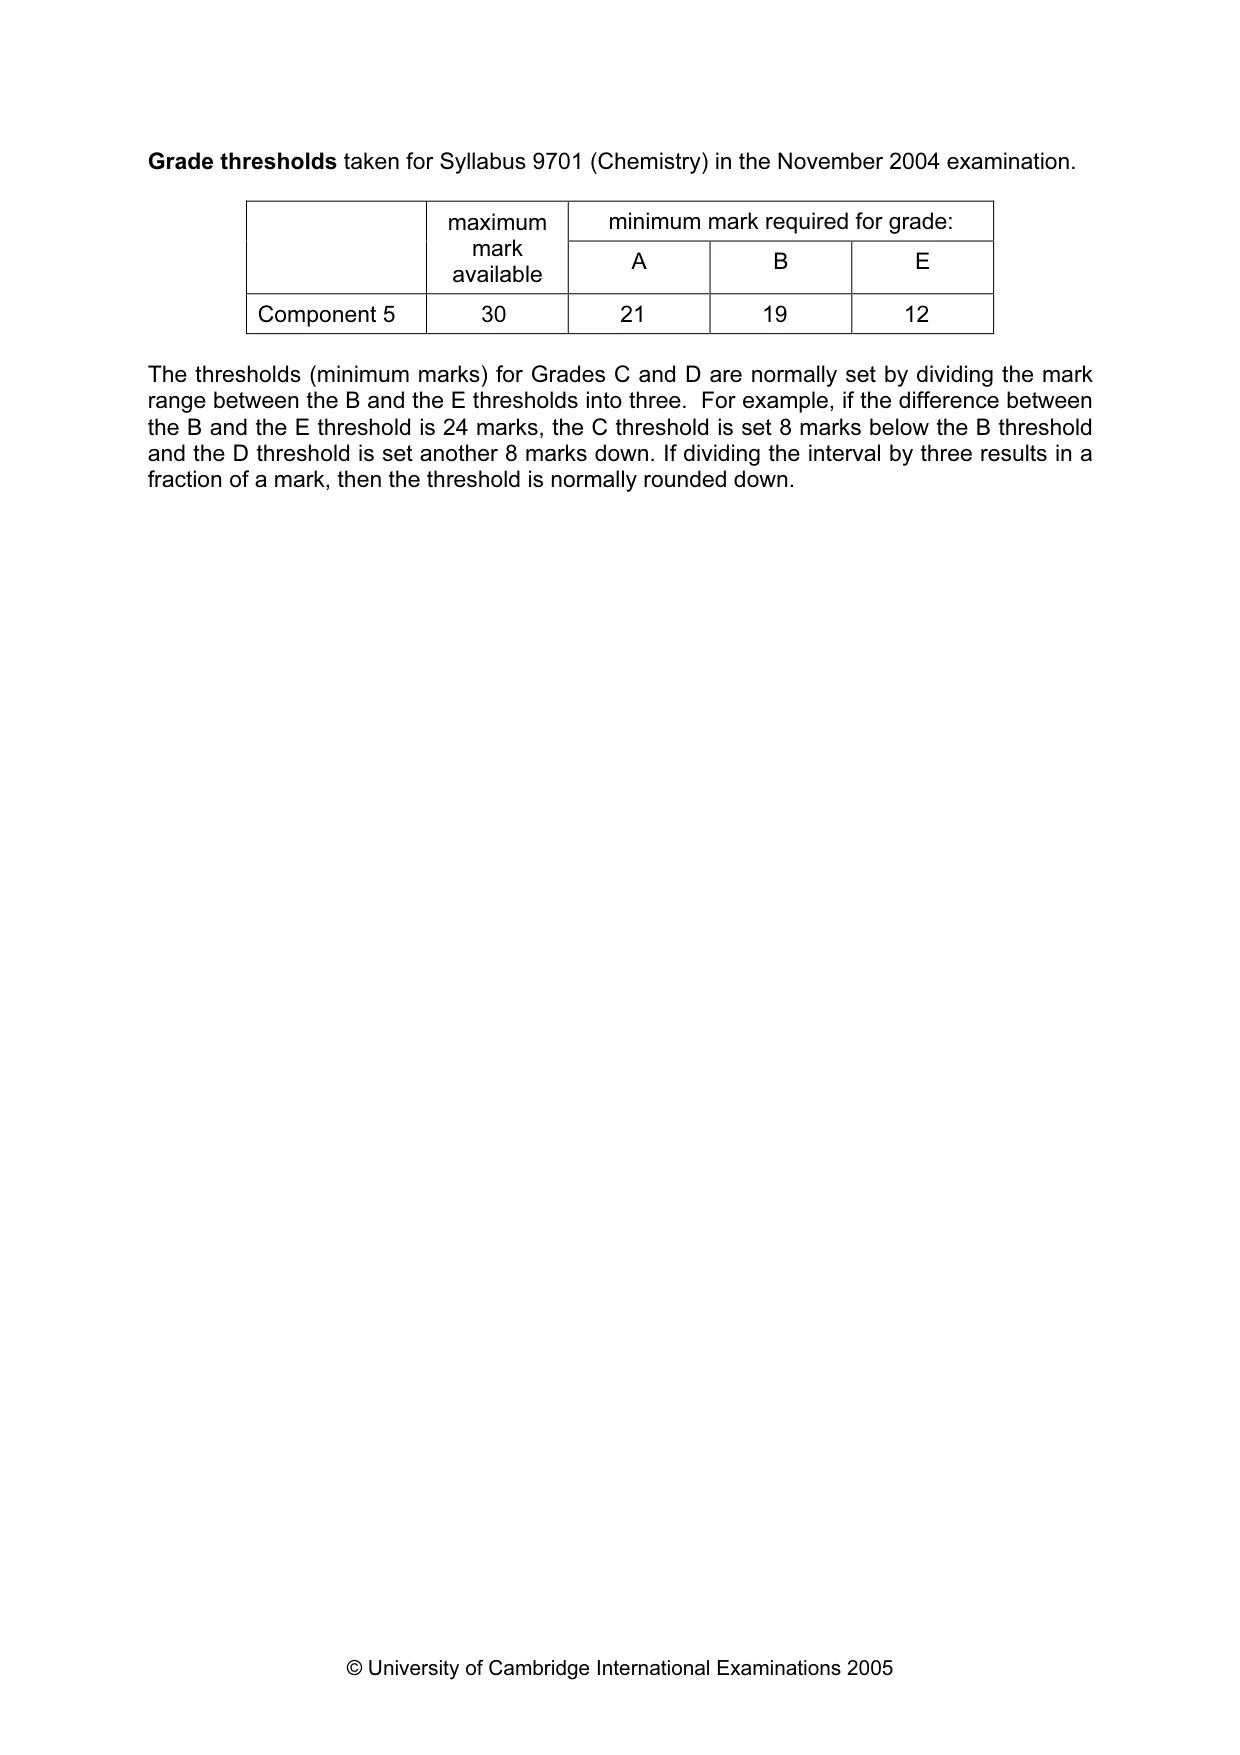
© University of Cambridge International Examinations 2005 Grade thresholds taken for Syllabus 9701 (Chemistry) in the November 2004 examination. minimum mark required for grade: maximum mark available A B E Component 5 30 21 19 12 The thresholds (minimum marks) for Grades C and D are normally set by dividing the mark range between the B and the E thresholds into three. For example, if the difference between the B and the E threshold is 24 marks, the C threshold is set 8 marks below the B threshold and the D threshold is set another 8 marks down. If dividing the interval by three results in a fraction of a mark, then the threshold is normally rounded down.
Mark scheme, page 3
© University of Cambridge International Examinations 2005 November 2004 GCE A LEVEL MARK SCHEME MAXIMUM MARK: 30 SYLLABUS/COMPONENT: 9701/05 CHEMISTRY Paper 5 (Practical Test)
Mark scheme, page 4
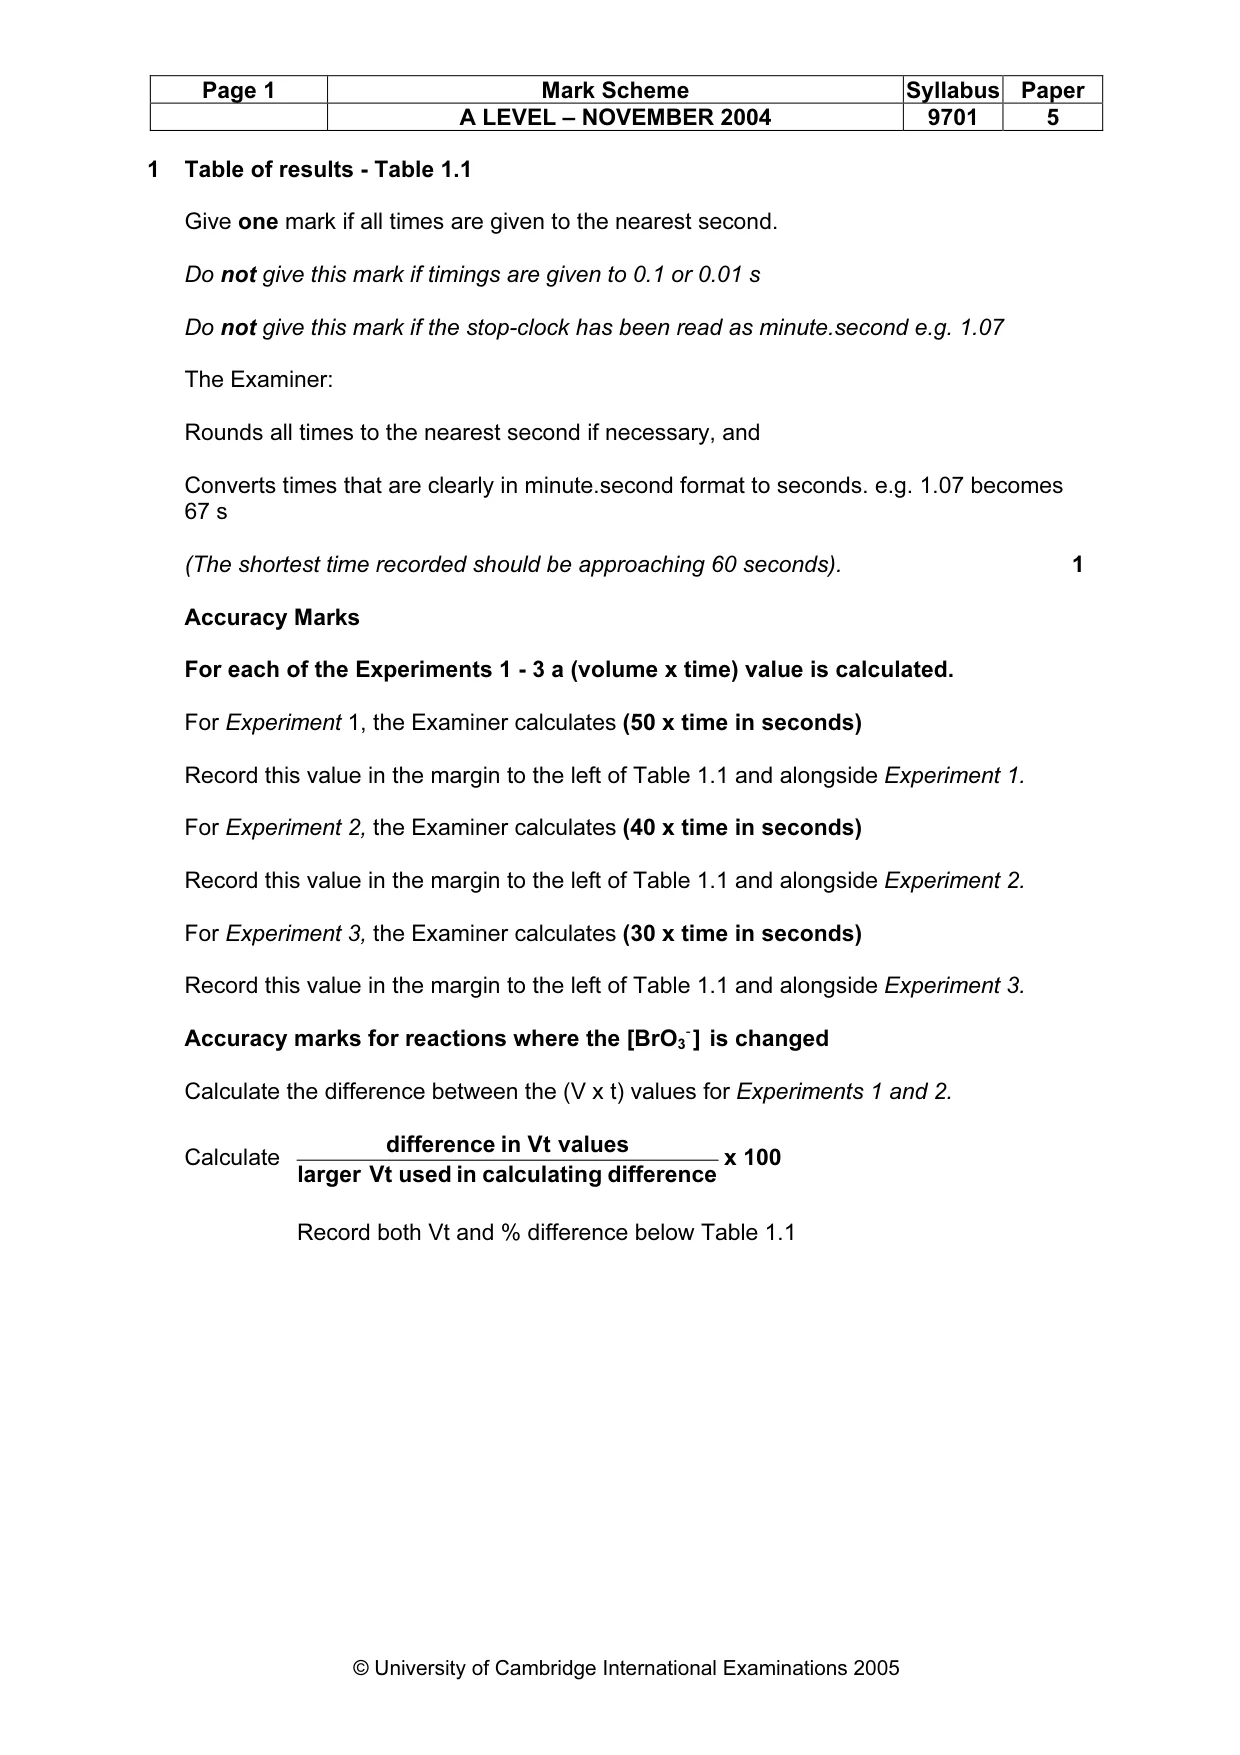
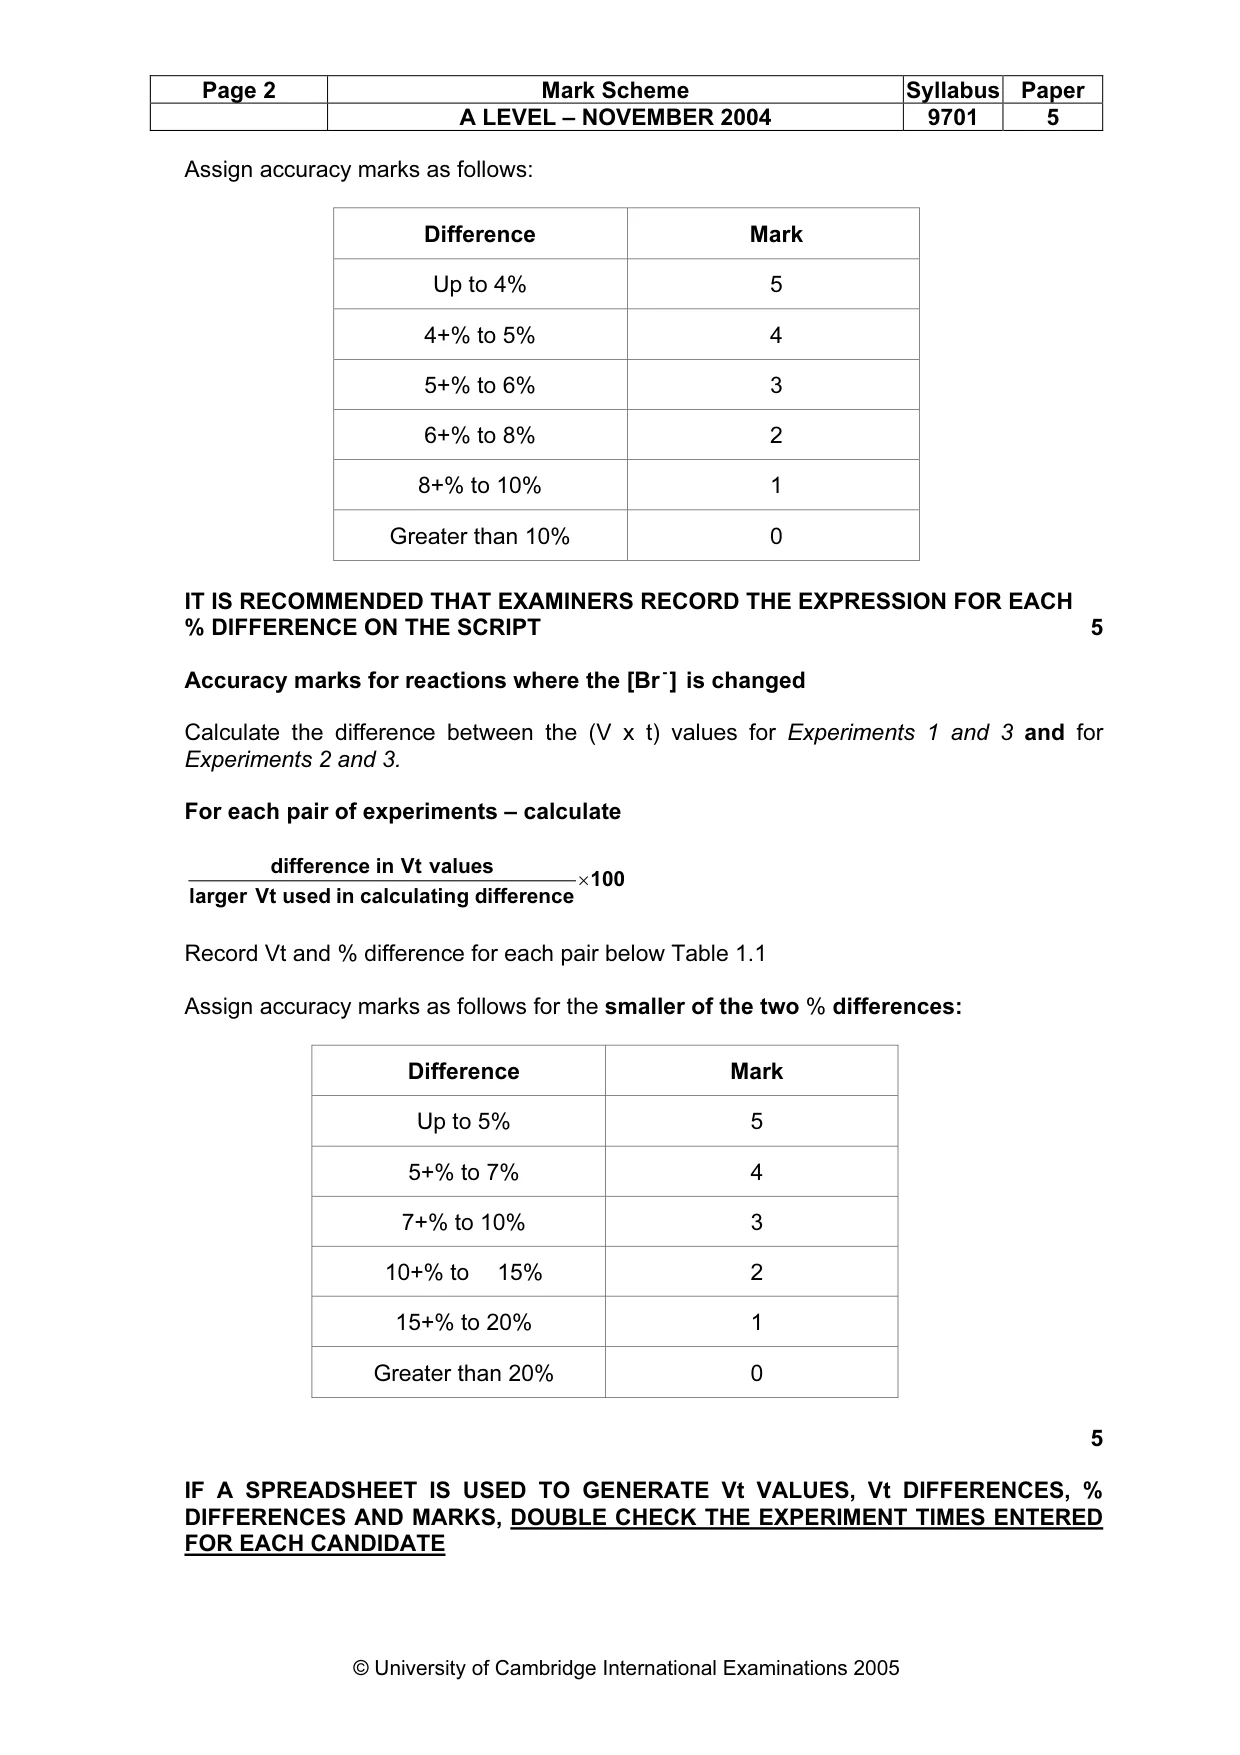
Page 1 Mark Scheme Syllabus Paper A LEVEL – NOVEMBER 2004 9701 5 © University of Cambridge International Examinations 2005 1 Table of results - Table 1.1 Give one mark if all times are given to the nearest second. Do not give this mark if timings are given to 0.1 or 0.01 s Do not give this mark if the stop-clock has been read as minute.second e.g. 1.07 The Examiner: Rounds all times to the nearest second if necessary, and Converts times that are clearly in minute.second format to seconds. e.g. 1.07 becomes 67 s (The shortest time recorded should be approaching 60 seconds). 1 Accuracy Marks For each of the Experiments 1 - 3 a (volume x time) value is calculated. For Experiment 1, the Examiner calculates (50 x time in seconds) Record this value in the margin to the left of Table 1.1 and alongside Experiment 1. For Experiment 2, the Examiner calculates (40 x time in seconds) Record this value in the margin to the left of Table 1.1 and alongside Experiment 2. For Experiment 3, the Examiner calculates (30 x time in seconds) Record this value in the margin to the left of Table 1.1 and alongside Experiment 3. Accuracy marks for reactions where the [BrO3 -] is changed Calculate the difference between the (V x t) values for Experiments 1 and 2. Calculate difference g calculatin in used Vt larger values Vt in difference x 100 Record both Vt and % difference below Table 1.1
Mark scheme, page 5
Page 2 Mark Scheme Syllabus Paper A LEVEL – NOVEMBER 2004 9701 5 © University of Cambridge International Examinations 2005 Assign accuracy marks as follows: Difference Mark Up to 4% 5 4+% to 5% 4 5+% to 6% 3 6+% to 8% 2 8+% to 10% 1 Greater than 10% 0 IT IS RECOMMENDED THAT EXAMINERS RECORD THE EXPRESSION FOR EACH % DIFFERENCE ON THE SCRIPT 5 Accuracy marks for reactions where the [Br -] is changed Calculate the difference between the (V x t) values for Experiments 1 and 3 and for Experiments 2 and 3. For each pair of experiments – calculate 100 difference g calculatin in used Vt larger values Vt in difference × Record Vt and % difference for each pair below Table 1.1 Assign accuracy marks as follows for the smaller of the two % differences: Difference Mark Up to 5% 5 5+% to 7% 4 7+% to 10% 3 10+% to 15% 2 15+% to 20% 1 Greater than 20% 0 5 IF A SPREADSHEET IS USED TO GENERATE Vt VALUES, Vt DIFFERENCES, % DIFFERENCES AND MARKS, DOUBLE CHECK THE EXPERIMENT TIMES ENTERED FOR EACH CANDIDATE
Mark scheme, page 6
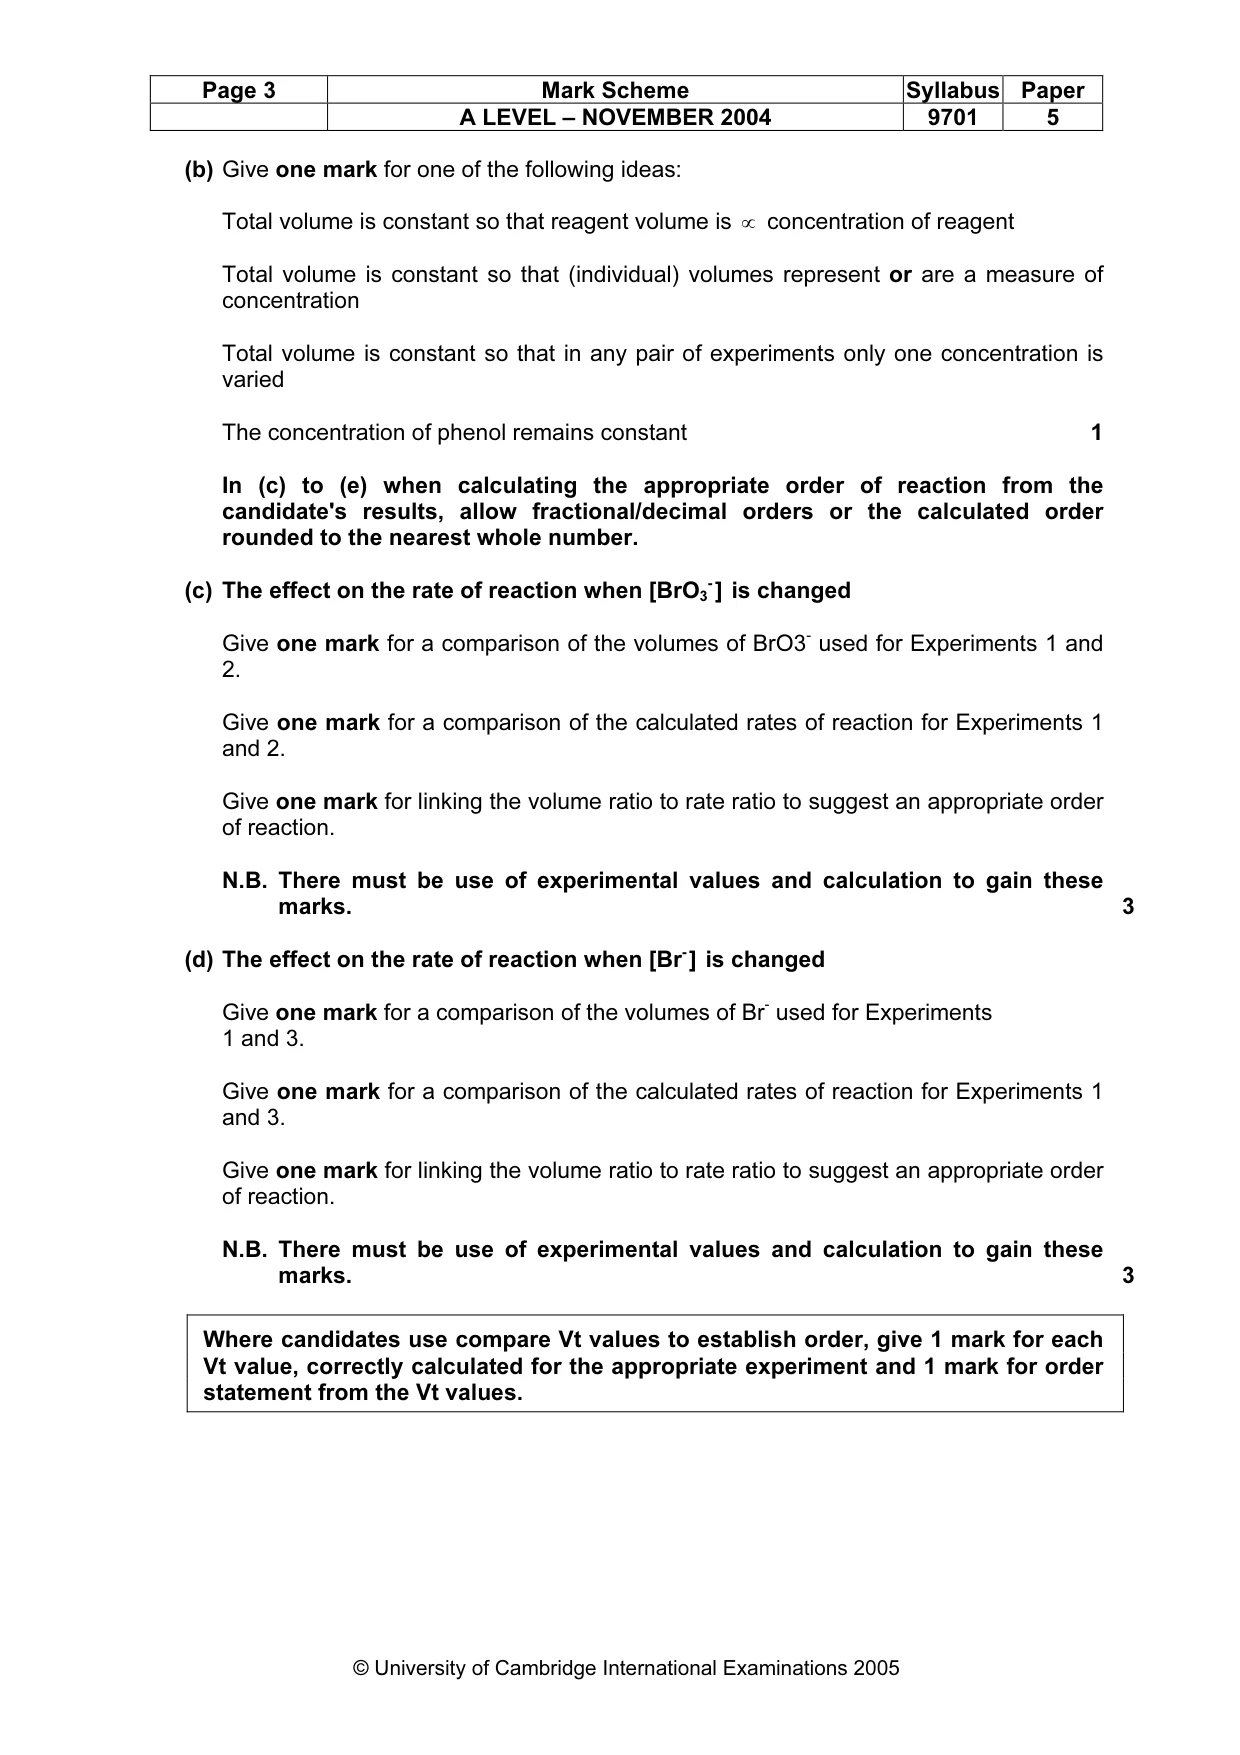
Page 3 Mark Scheme Syllabus Paper A LEVEL – NOVEMBER 2004 9701 5 © University of Cambridge International Examinations 2005 (b) Give one mark for one of the following ideas: Total volume is constant so that reagent volume is ∝ concentration of reagent Total volume is constant so that (individual) volumes represent or are a measure of concentration Total volume is constant so that in any pair of experiments only one concentration is varied The concentration of phenol remains constant 1 In (c) to (e) when calculating the appropriate order of reaction from the candidate's results, allow fractional/decimal orders or the calculated order rounded to the nearest whole number. (c) The effect on the rate of reaction when [BrO3 -] is changed Give one mark for a comparison of the volumes of BrO3- used for Experiments 1 and 2. Give one mark for a comparison of the calculated rates of reaction for Experiments 1 and 2. Give one mark for linking the volume ratio to rate ratio to suggest an appropriate order of reaction. N.B. There must be use of experimental values and calculation to gain these marks. 3 (d) The effect on the rate of reaction when [Br-] is changed Give one mark for a comparison of the volumes of Br- used for Experiments 1 and 3. Give one mark for a comparison of the calculated rates of reaction for Experiments 1 and 3. Give one mark for linking the volume ratio to rate ratio to suggest an appropriate order of reaction. N.B. There must be use of experimental values and calculation to gain these marks. 3 Where candidates use compare Vt values to establish order, give 1 mark for each Vt value, correctly calculated for the appropriate experiment and 1 mark for order statement from the Vt values.
Mark scheme, page 7
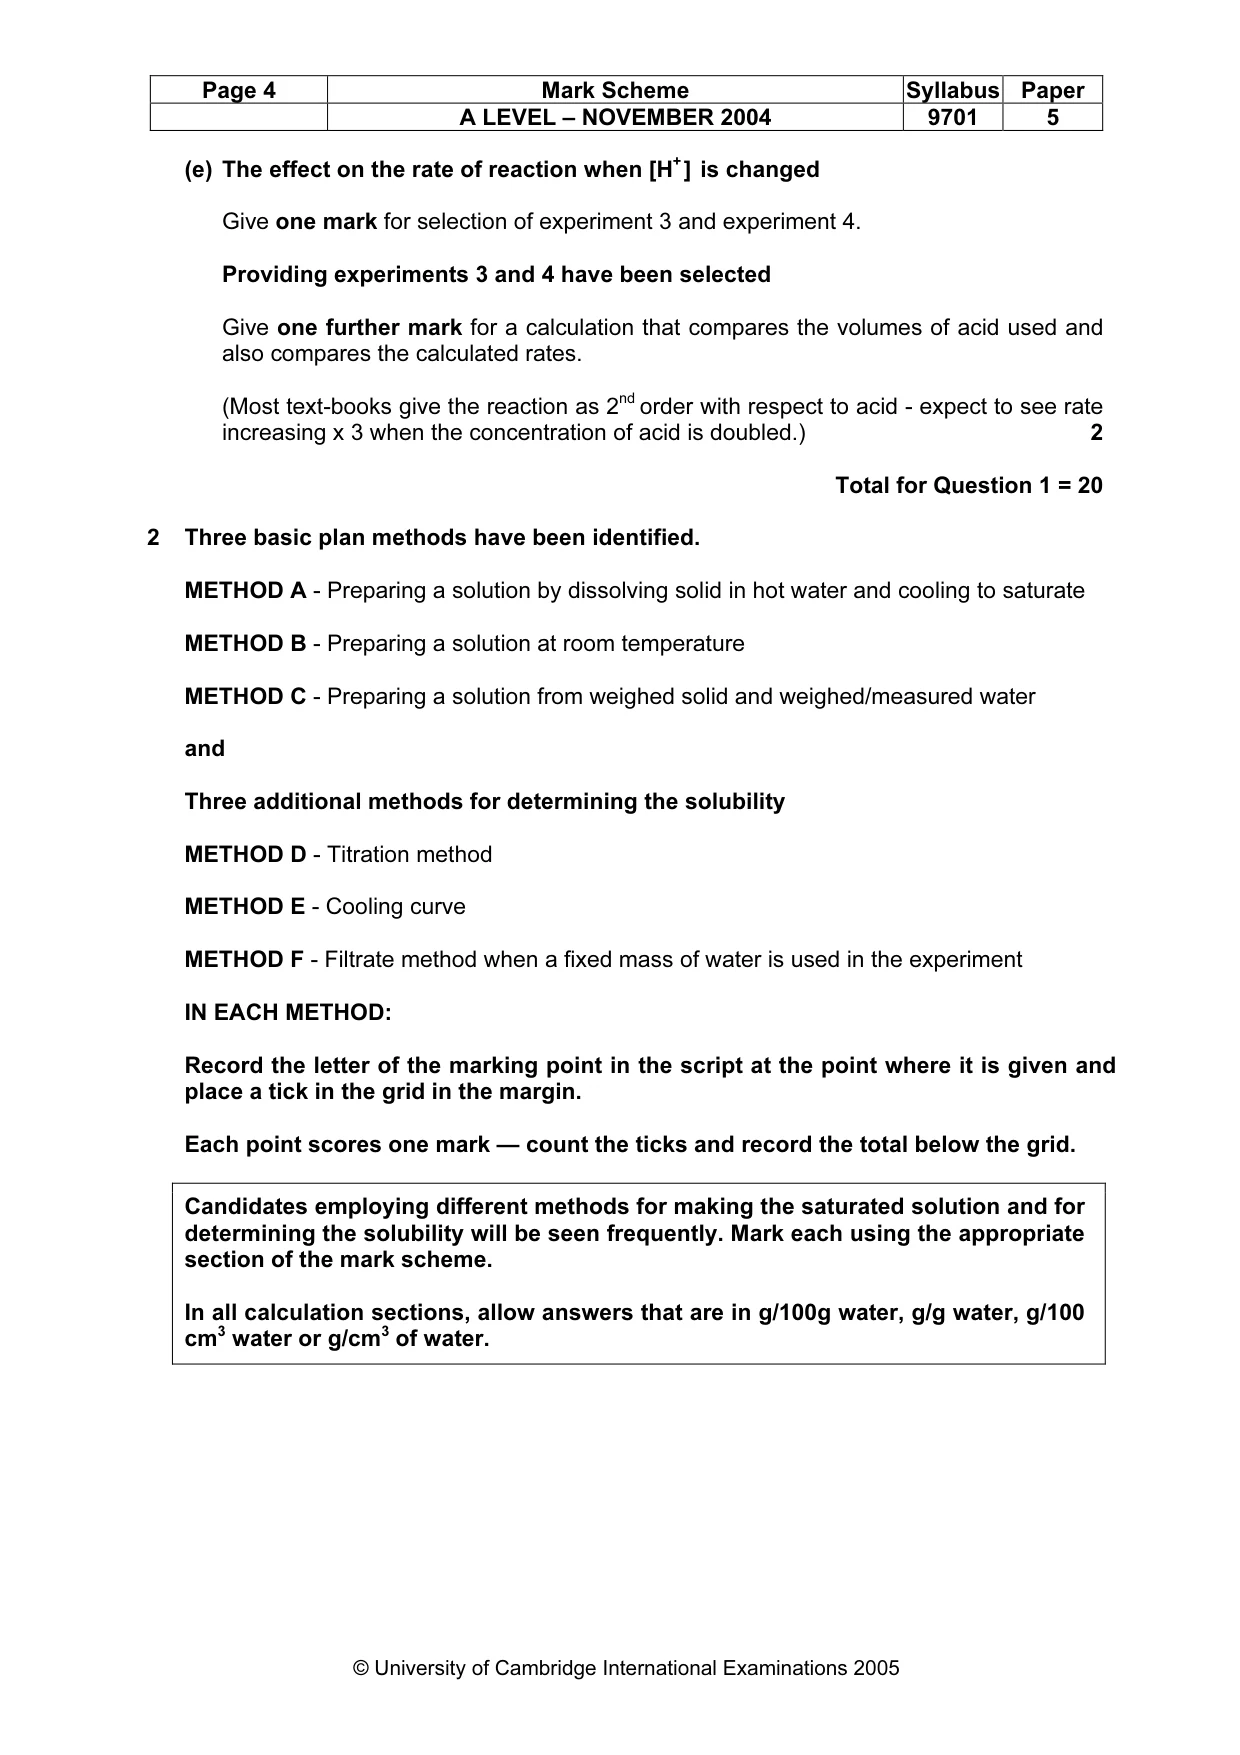
Page 4 Mark Scheme Syllabus Paper A LEVEL – NOVEMBER 2004 9701 5 © University of Cambridge International Examinations 2005 (e) The effect on the rate of reaction when [H+] is changed Give one mark for selection of experiment 3 and experiment 4. Providing experiments 3 and 4 have been selected Give one further mark for a calculation that compares the volumes of acid used and also compares the calculated rates. (Most text-books give the reaction as 2nd order with respect to acid - expect to see rate increasing x 3 when the concentration of acid is doubled.) 2 Total for Question 1 = 20 2 Three basic plan methods have been identified. METHOD A - Preparing a solution by dissolving solid in hot water and cooling to saturate METHOD B - Preparing a solution at room temperature METHOD C - Preparing a solution from weighed solid and weighed/measured water and Three additional methods for determining the solubility METHOD D - Titration method METHOD E - Cooling curve METHOD F - Filtrate method when a fixed mass of water is used in the experiment IN EACH METHOD: Record the letter of the marking point in the script at the point where it is given and place a tick in the grid in the margin. Each point scores one mark — count the ticks and record the total below the grid. Candidates employing different methods for making the saturated solution and for determining the solubility will be seen frequently. Mark each using the appropriate section of the mark scheme. In all calculation sections, allow answers that are in g/100g water, g/g water, g/100 cm3 water or g/cm3 of water.
Mark scheme, page 8
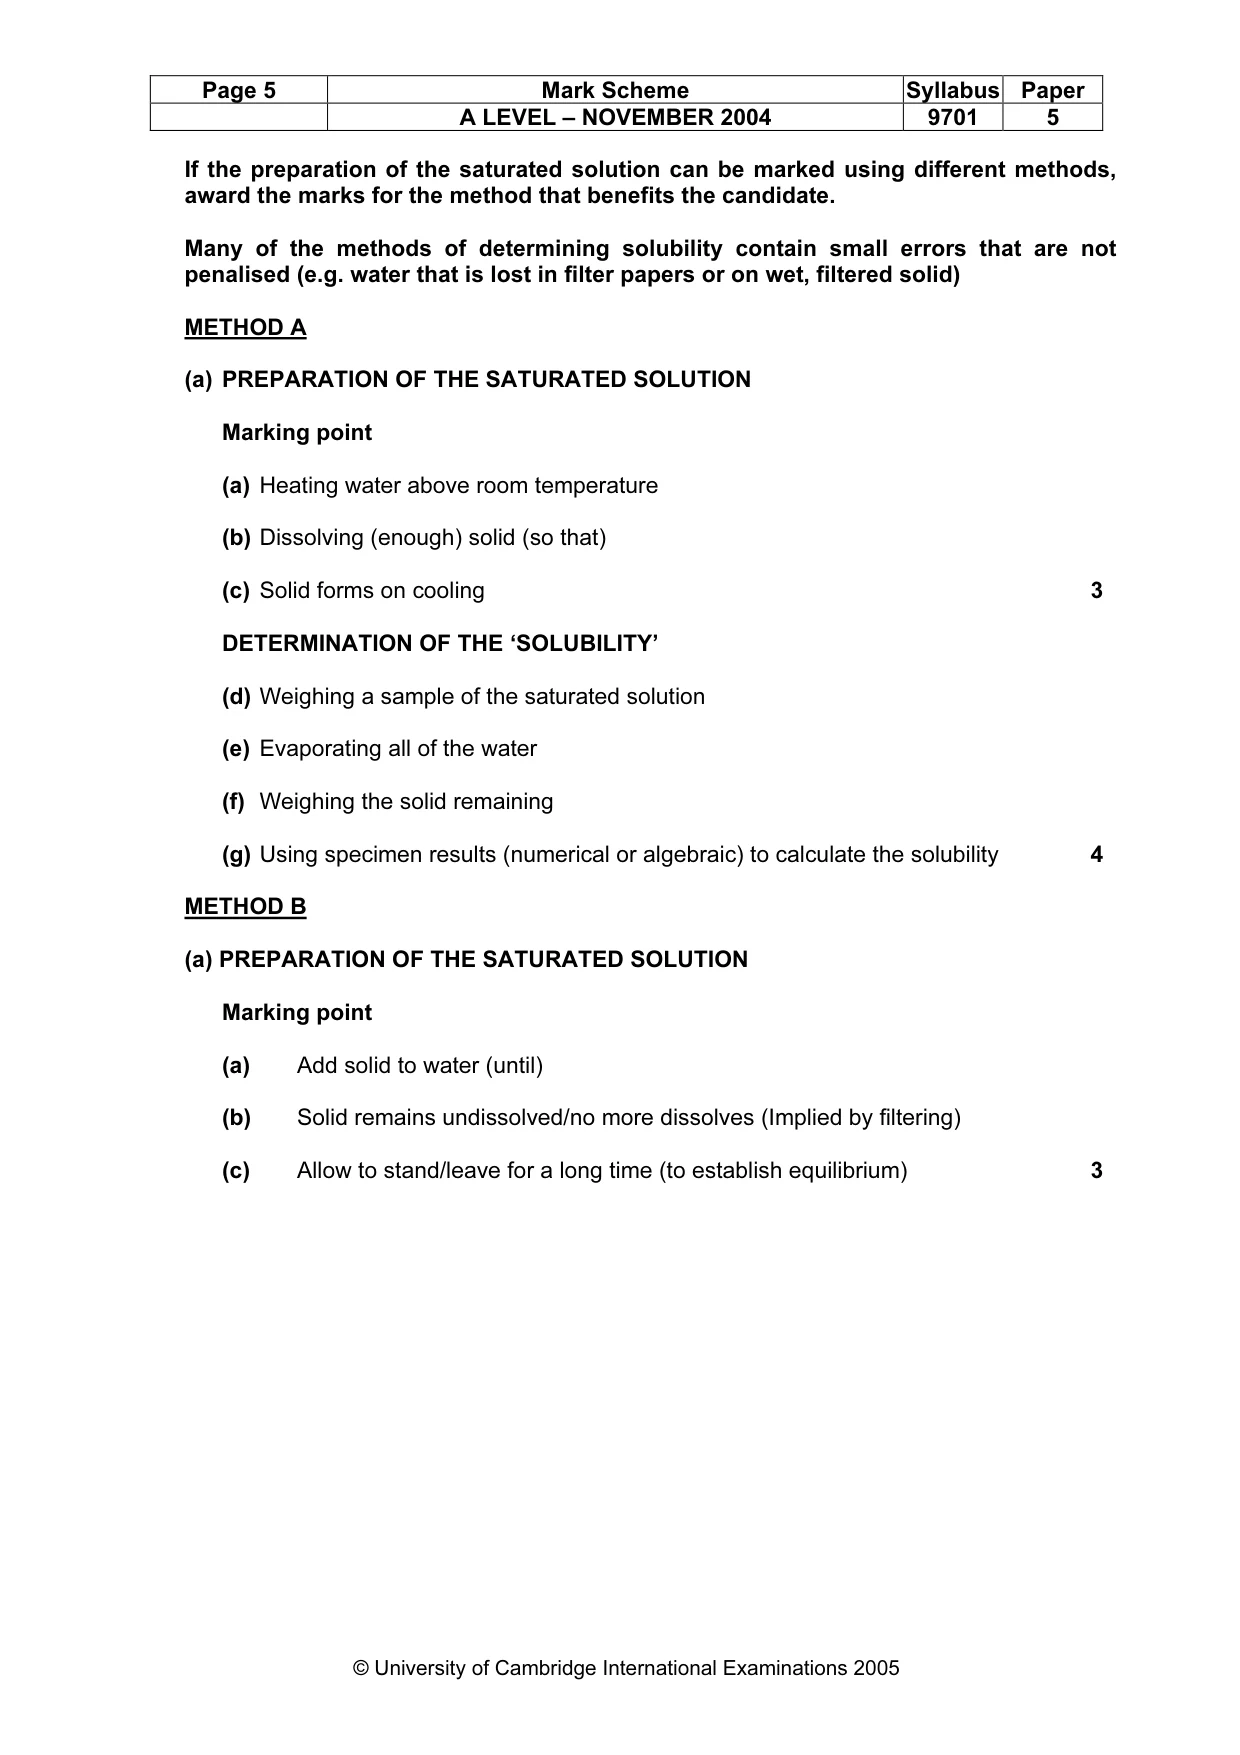
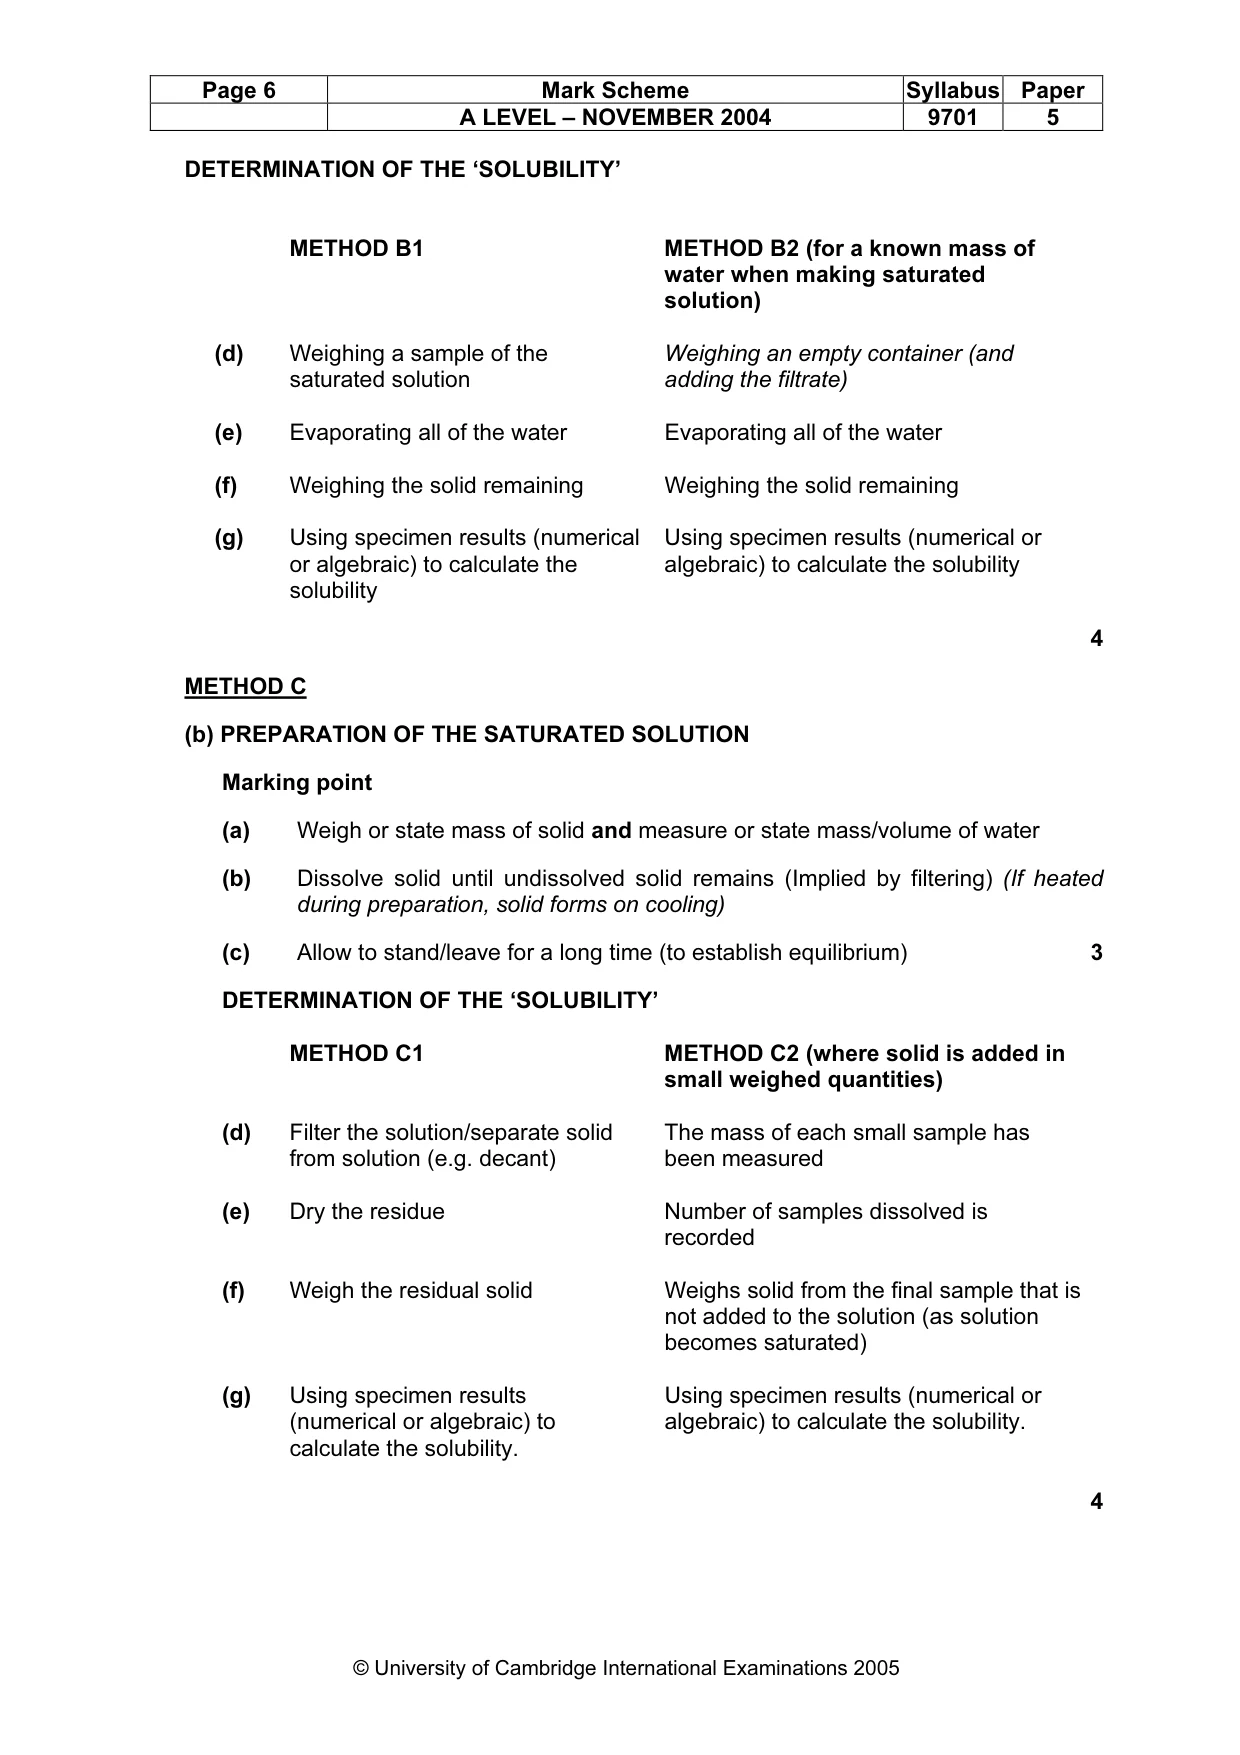
Page 5 Mark Scheme Syllabus Paper A LEVEL – NOVEMBER 2004 9701 5 © University of Cambridge International Examinations 2005 If the preparation of the saturated solution can be marked using different methods, award the marks for the method that benefits the candidate. Many of the methods of determining solubility contain small errors that are not penalised (e.g. water that is lost in filter papers or on wet, filtered solid) METHOD A (a) PREPARATION OF THE SATURATED SOLUTION Marking point (a) Heating water above room temperature (b) Dissolving (enough) solid (so that) (c) Solid forms on cooling 3 DETERMINATION OF THE ‘SOLUBILITY’ (d) Weighing a sample of the saturated solution (e) Evaporating all of the water (f) Weighing the solid remaining (g) Using specimen results (numerical or algebraic) to calculate the solubility 4 METHOD B (a) PREPARATION OF THE SATURATED SOLUTION Marking point (a) Add solid to water (until) (b) Solid remains undissolved/no more dissolves (Implied by filtering) (c) Allow to stand/leave for a long time (to establish equilibrium) 3
Mark scheme, page 9
Page 6 Mark Scheme Syllabus Paper A LEVEL – NOVEMBER 2004 9701 5 © University of Cambridge International Examinations 2005 DETERMINATION OF THE ‘SOLUBILITY’ METHOD B1 METHOD B2 (for a known mass of water when making saturated solution) (d) Weighing a sample of the saturated solution Weighing an empty container (and adding the filtrate) (e) Evaporating all of the water Evaporating all of the water (f) Weighing the solid remaining Weighing the solid remaining (g) Using specimen results (numerical or algebraic) to calculate the solubility Using specimen results (numerical or algebraic) to calculate the solubility 4 METHOD C (b) PREPARATION OF THE SATURATED SOLUTION Marking point (a) Weigh or state mass of solid and measure or state mass/volume of water (b) Dissolve solid until undissolved solid remains (Implied by filtering) (If heated during preparation, solid forms on cooling) (c) Allow to stand/leave for a long time (to establish equilibrium) 3 DETERMINATION OF THE ‘SOLUBILITY’ METHOD C1 METHOD C2 (where solid is added in small weighed quantities) (d) Filter the solution/separate solid from solution (e.g. decant) The mass of each small sample has been measured (e) Dry the residue Number of samples dissolved is recorded (f) Weigh the residual solid Weighs solid from the final sample that is not added to the solution (as solution becomes saturated) (g) Using specimen results (numerical or algebraic) to calculate the solubility. Using specimen results (numerical or algebraic) to calculate the solubility. 4
Mark scheme, page 10
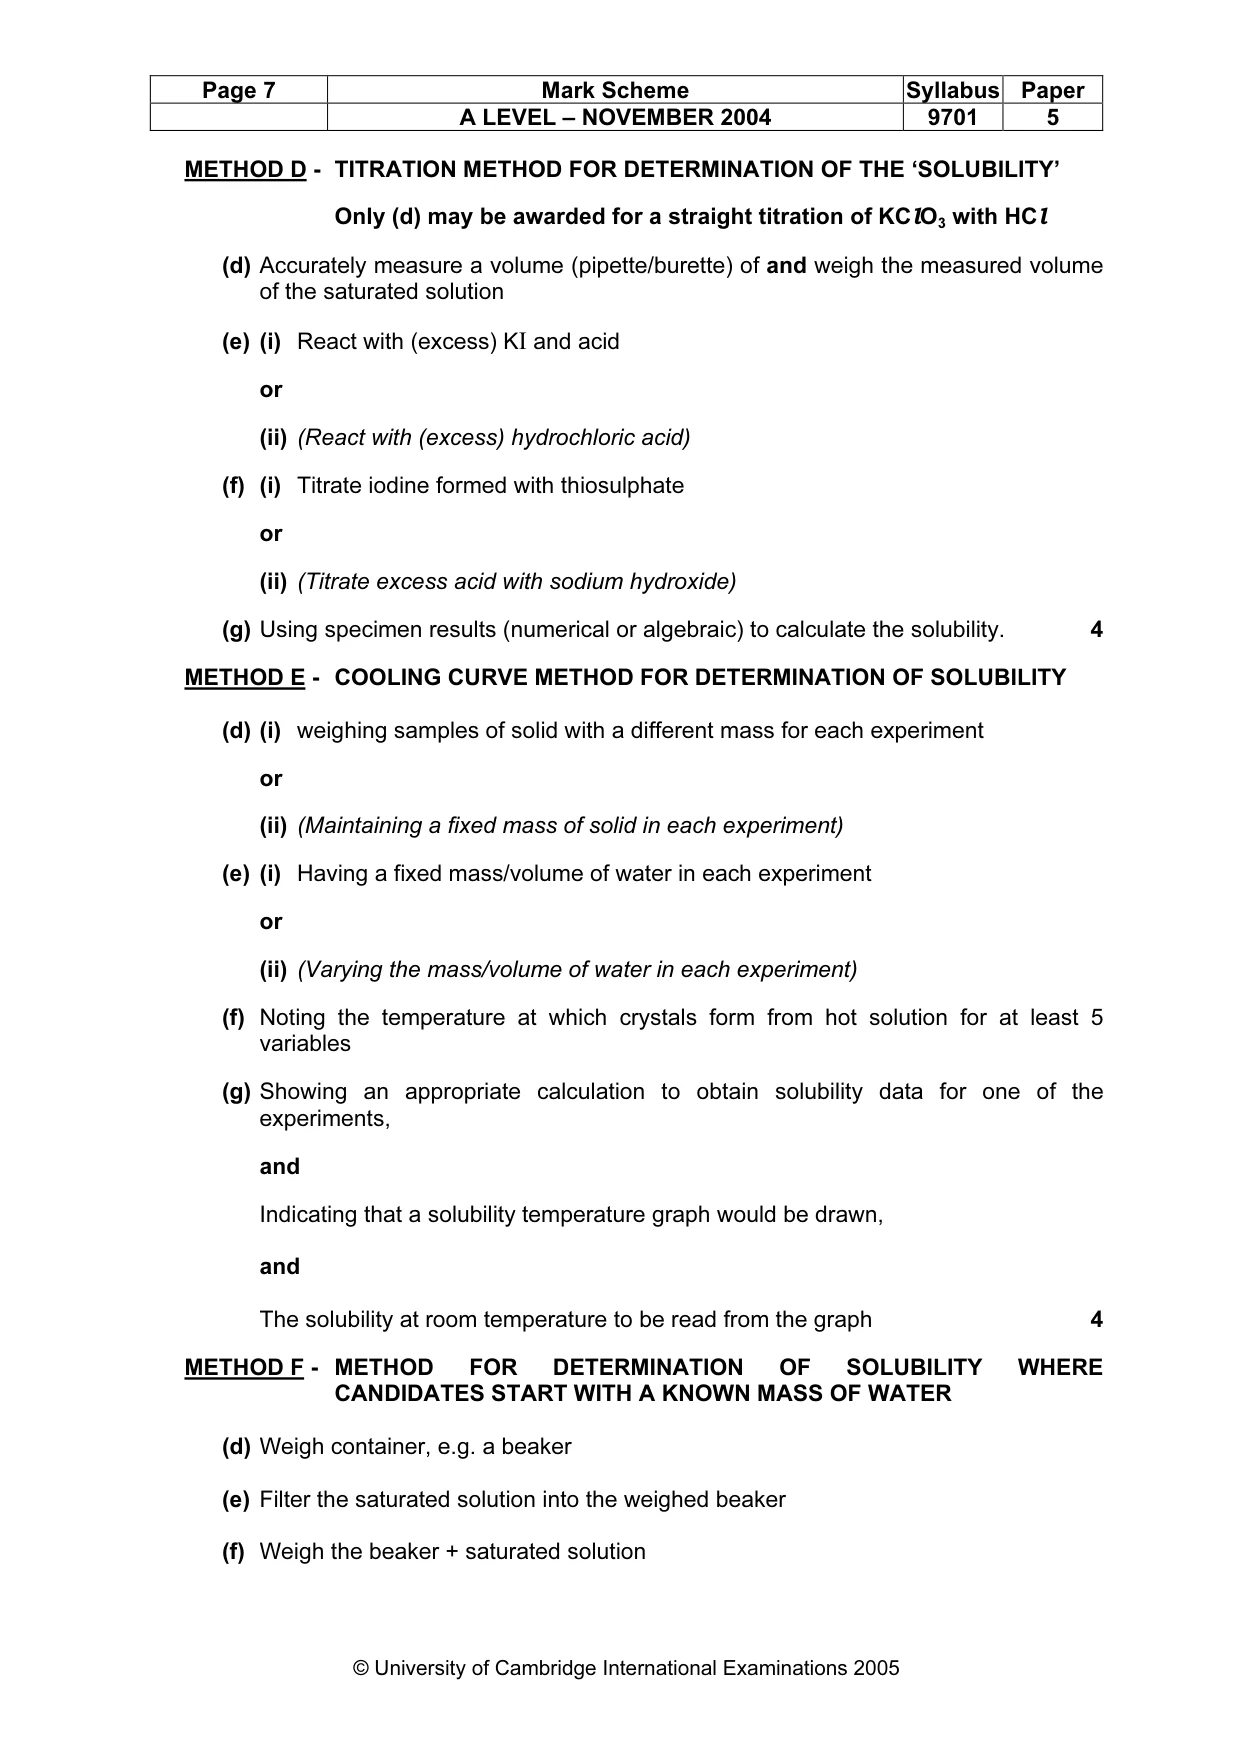
Page 7 Mark Scheme Syllabus Paper A LEVEL – NOVEMBER 2004 9701 5 © University of Cambridge International Examinations 2005 METHOD D - TITRATION METHOD FOR DETERMINATION OF THE ‘SOLUBILITY’ Only (d) may be awarded for a straight titration of KClO3 with HCl (d) Accurately measure a volume (pipette/burette) of and weigh the measured volume of the saturated solution (e) (i) React with (excess) KI and acid or (ii) (React with (excess) hydrochloric acid) (f) (i) Titrate iodine formed with thiosulphate or (ii) (Titrate excess acid with sodium hydroxide) (g) Using specimen results (numerical or algebraic) to calculate the solubility. 4 METHOD E - COOLING CURVE METHOD FOR DETERMINATION OF SOLUBILITY (d) (i) weighing samples of solid with a different mass for each experiment or (ii) (Maintaining a fixed mass of solid in each experiment) (e) (i) Having a fixed mass/volume of water in each experiment or (ii) (Varying the mass/volume of water in each experiment) (f) Noting the temperature at which crystals form from hot solution for at least 5 variables (g) Showing an appropriate calculation to obtain solubility data for one of the experiments, and Indicating that a solubility temperature graph would be drawn, and The solubility at room temperature to be read from the graph 4 METHOD F - METHOD FOR DETERMINATION OF SOLUBILITY WHERE CANDIDATES START WITH A KNOWN MASS OF WATER (d) Weigh container, e.g. a beaker (e) Filter the saturated solution into the weighed beaker (f) Weigh the beaker + saturated solution
Mark scheme, page 11
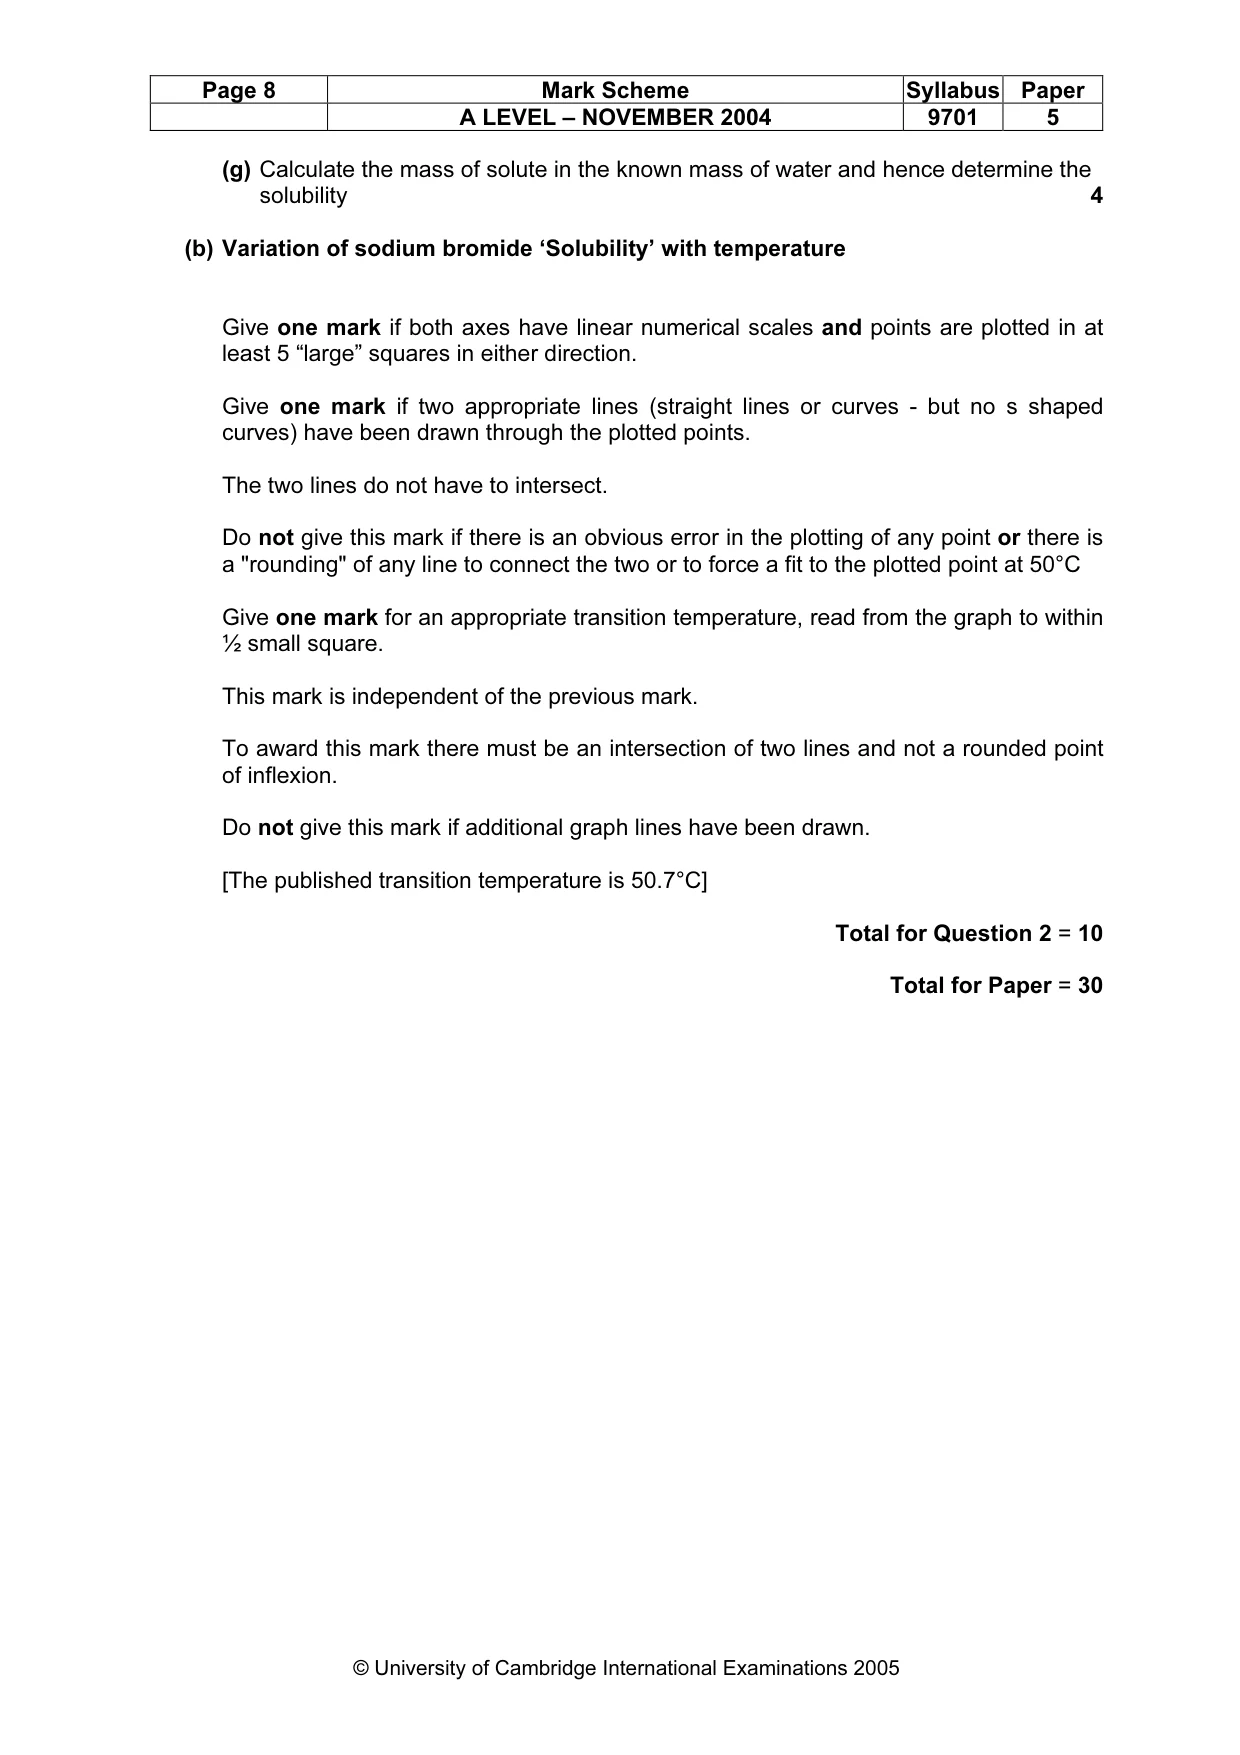
Page 8 Mark Scheme Syllabus Paper A LEVEL – NOVEMBER 2004 9701 5 © University of Cambridge International Examinations 2005 (g) Calculate the mass of solute in the known mass of water and hence determine the solubility 4 (b) Variation of sodium bromide ‘Solubility’ with temperature Give one mark if both axes have linear numerical scales and points are plotted in at least 5 “large” squares in either direction. Give one mark if two appropriate lines (straight lines or curves - but no s shaped curves) have been drawn through the plotted points. The two lines do not have to intersect. Do not give this mark if there is an obvious error in the plotting of any point or there is a "rounding" of any line to connect the two or to force a fit to the plotted point at 50°C Give one mark for an appropriate transition temperature, read from the graph to within ½ small square. This mark is independent of the previous mark. To award this mark there must be an intersection of two lines and not a rounded point of inflexion. Do not give this mark if additional graph lines have been drawn. [The published transition temperature is 50.7°C] Total for Question 2 = 10 Total for Paper = 30