Cambridge A Level Biology 9700 — 2025 May/June Paper 3 · Variant 7
9700/37/M/J/25 · 2 questions · 40 marks · 120 min
The question paper and its mark scheme, free to read here and free to download. This is Cambridge’s own paper, exactly as it was sat.
Question paper16 pages
Mark scheme10 pages
Answers below. Sit the paper first if you are practising.
Questions as text
Q1 · When plant tissue is placed into a solution of sodium chloride, water moves between the…
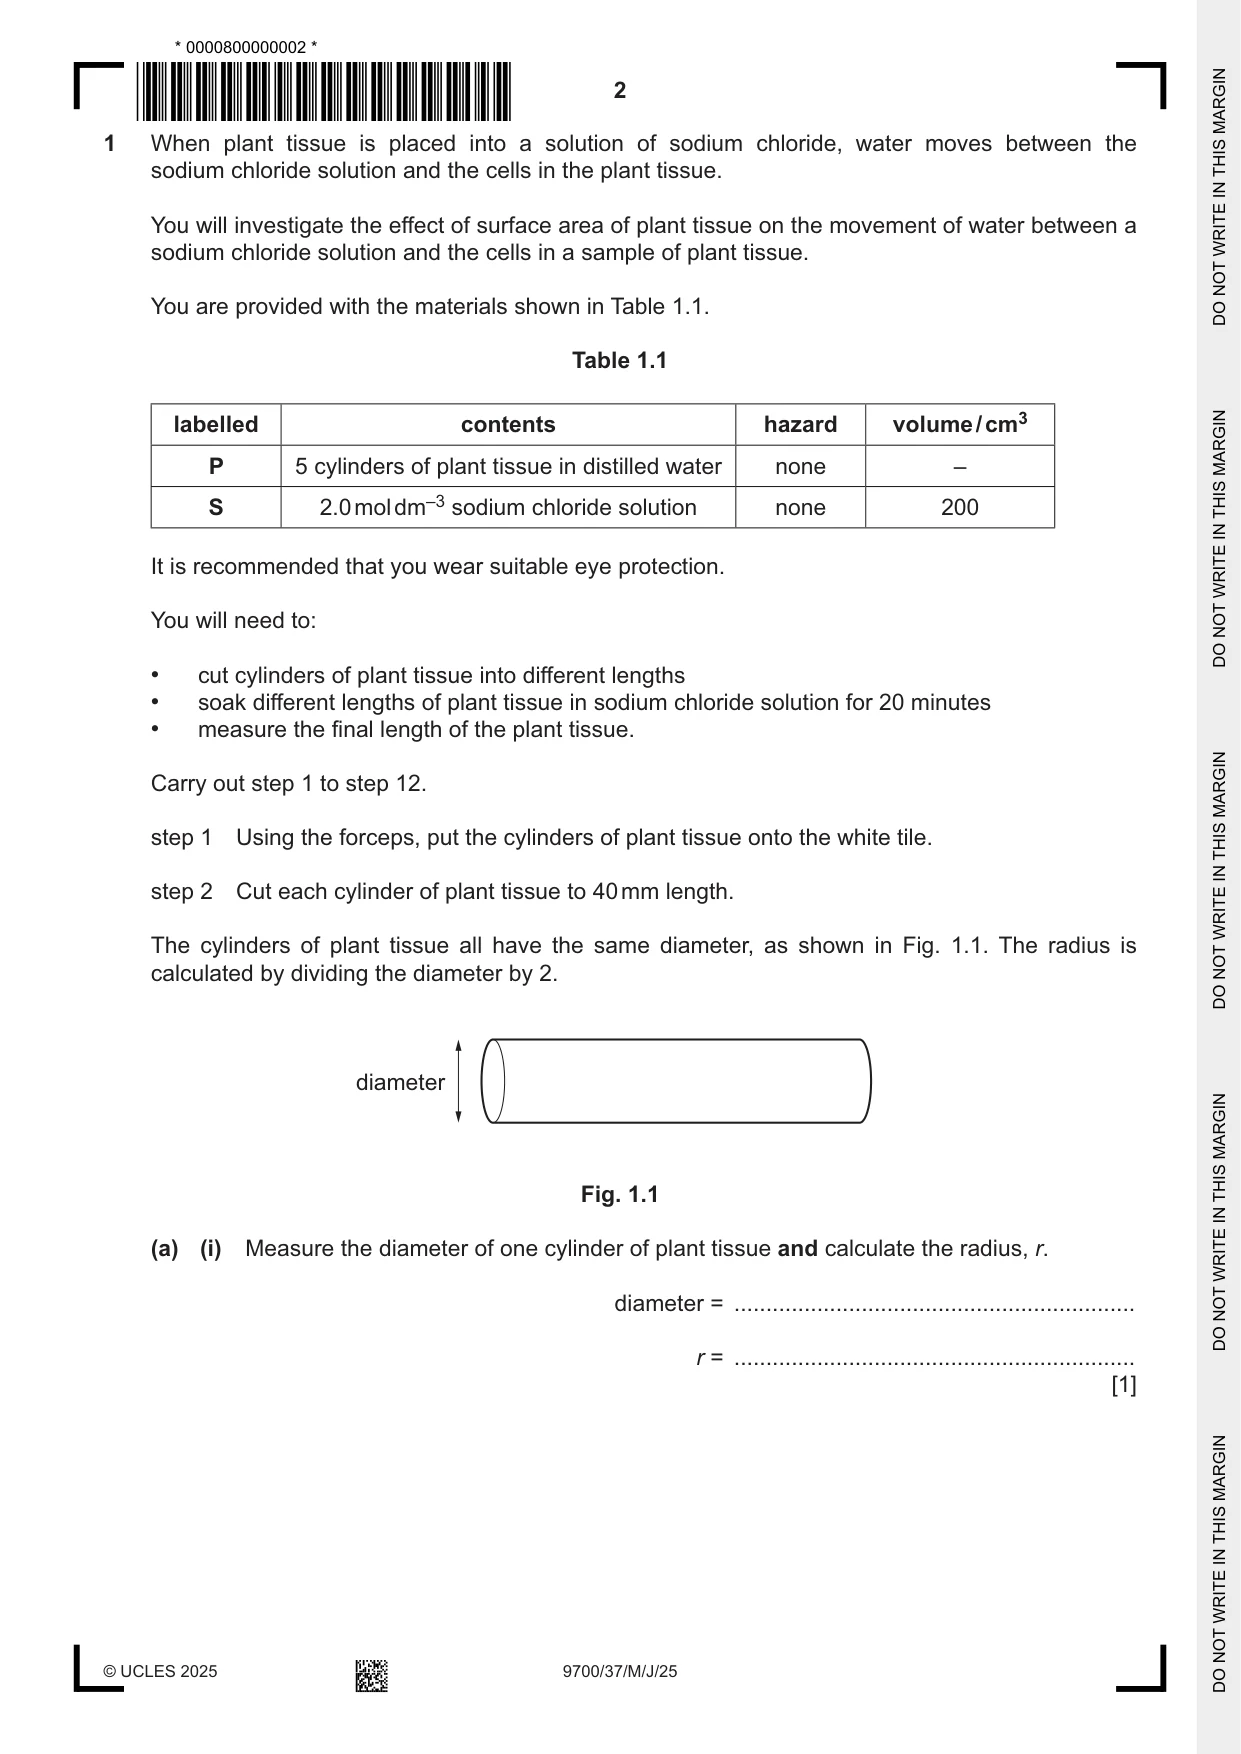
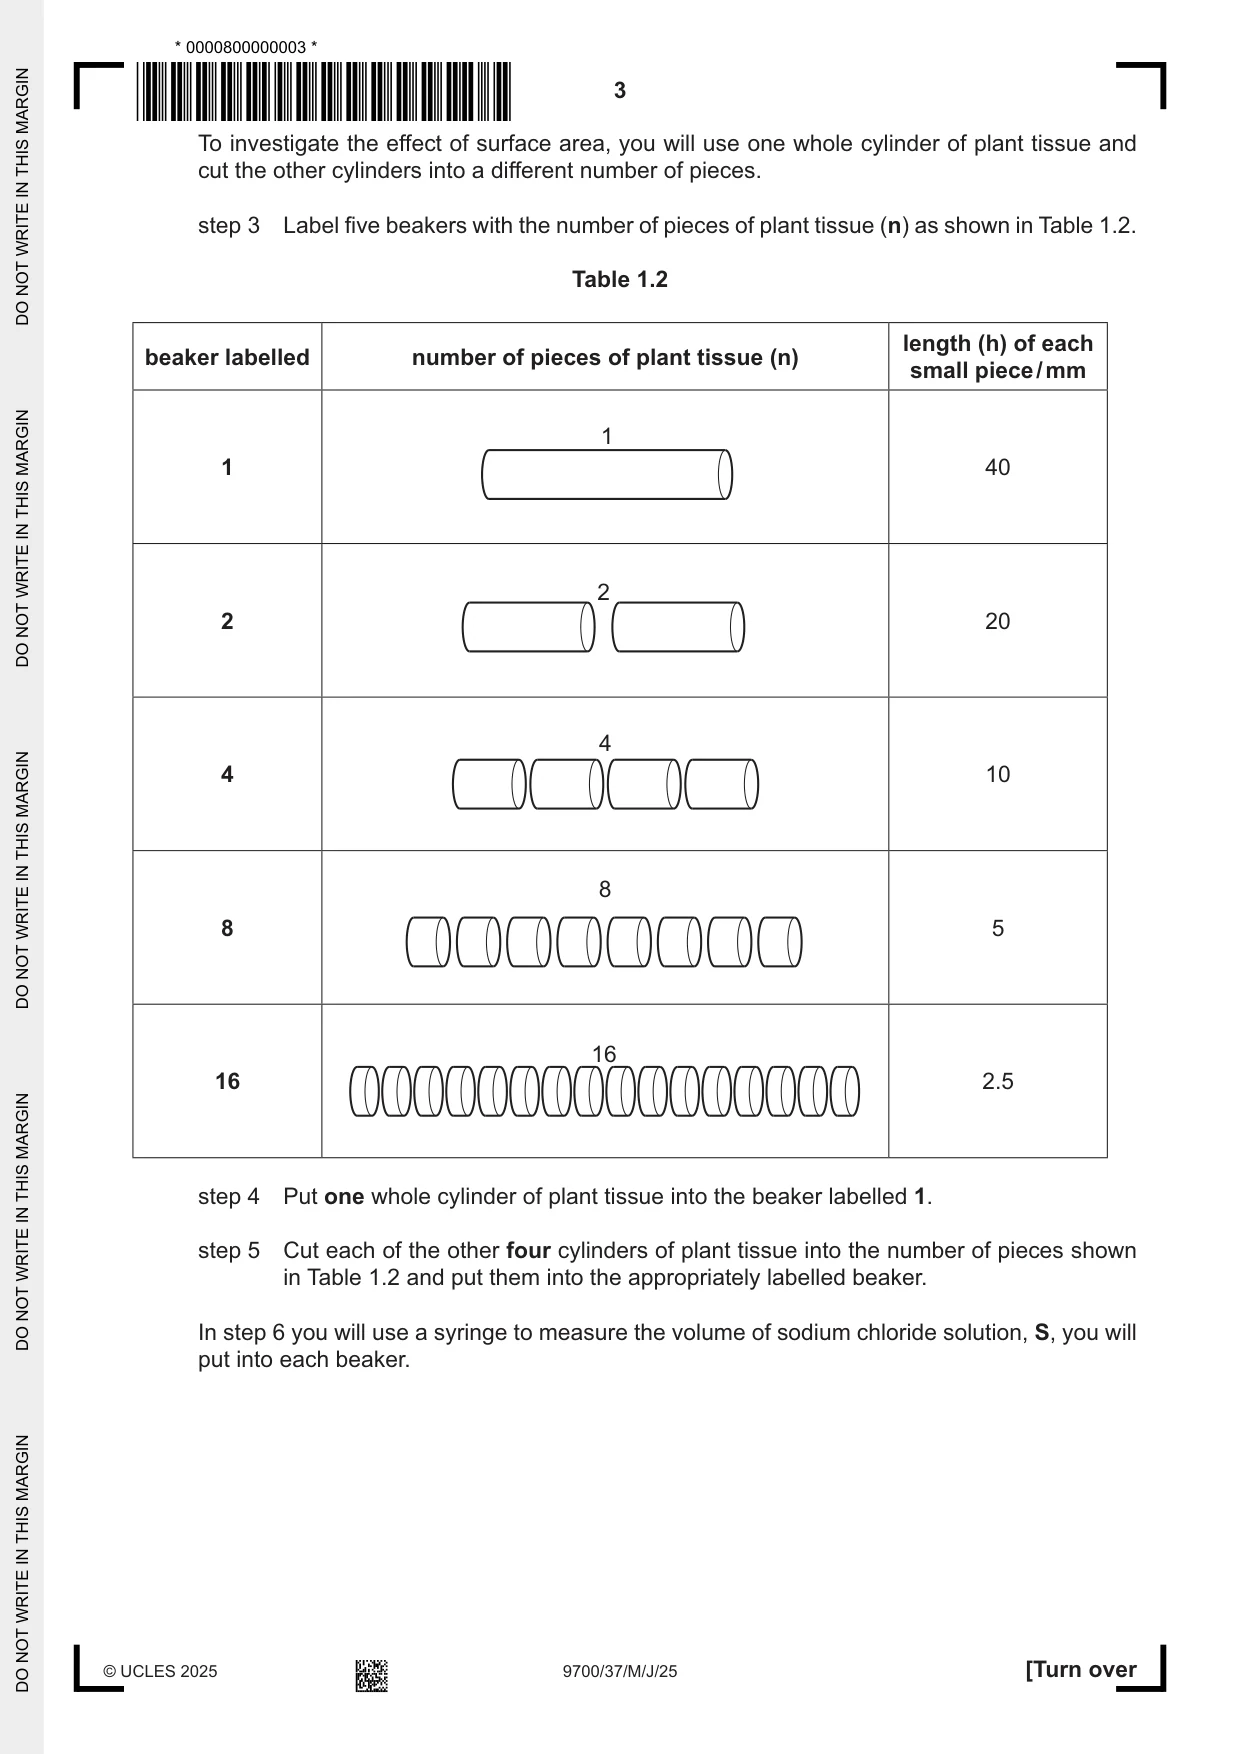
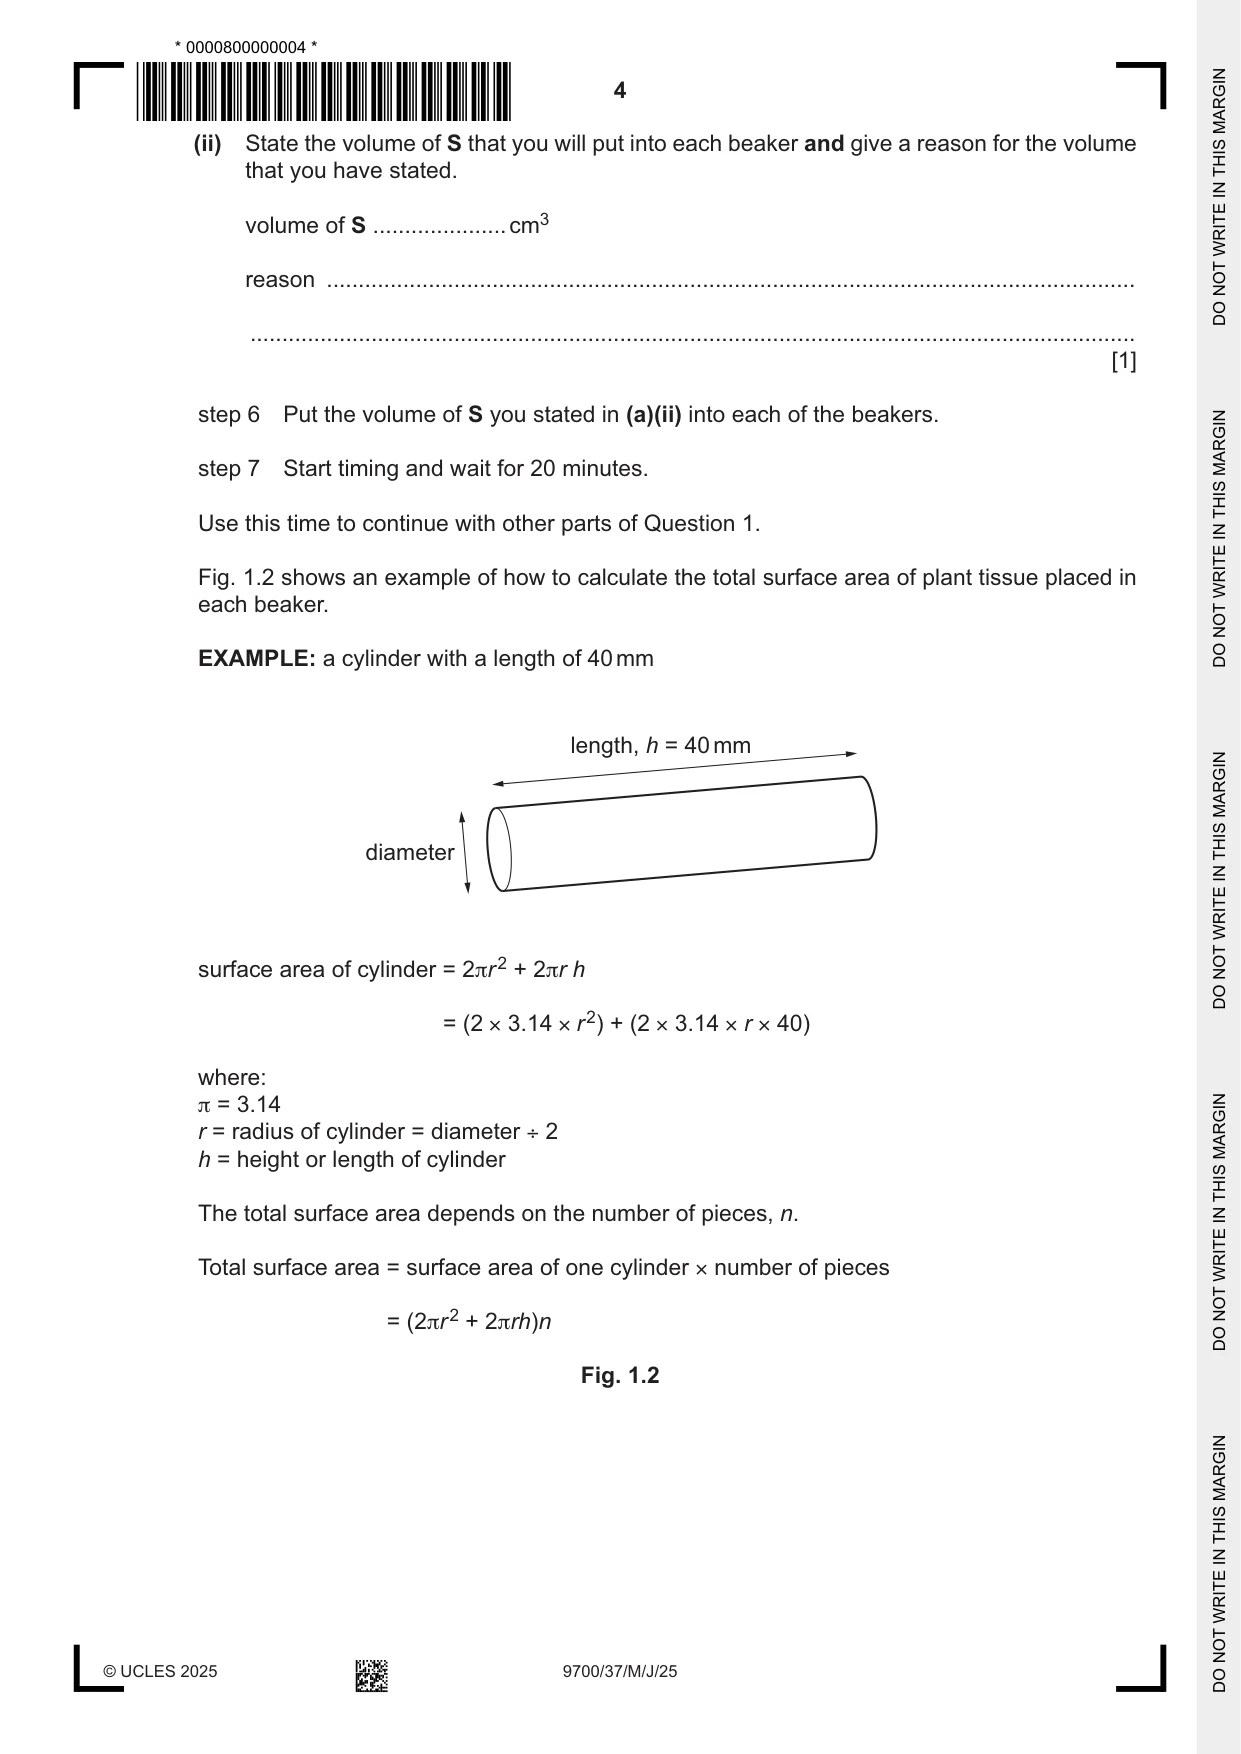
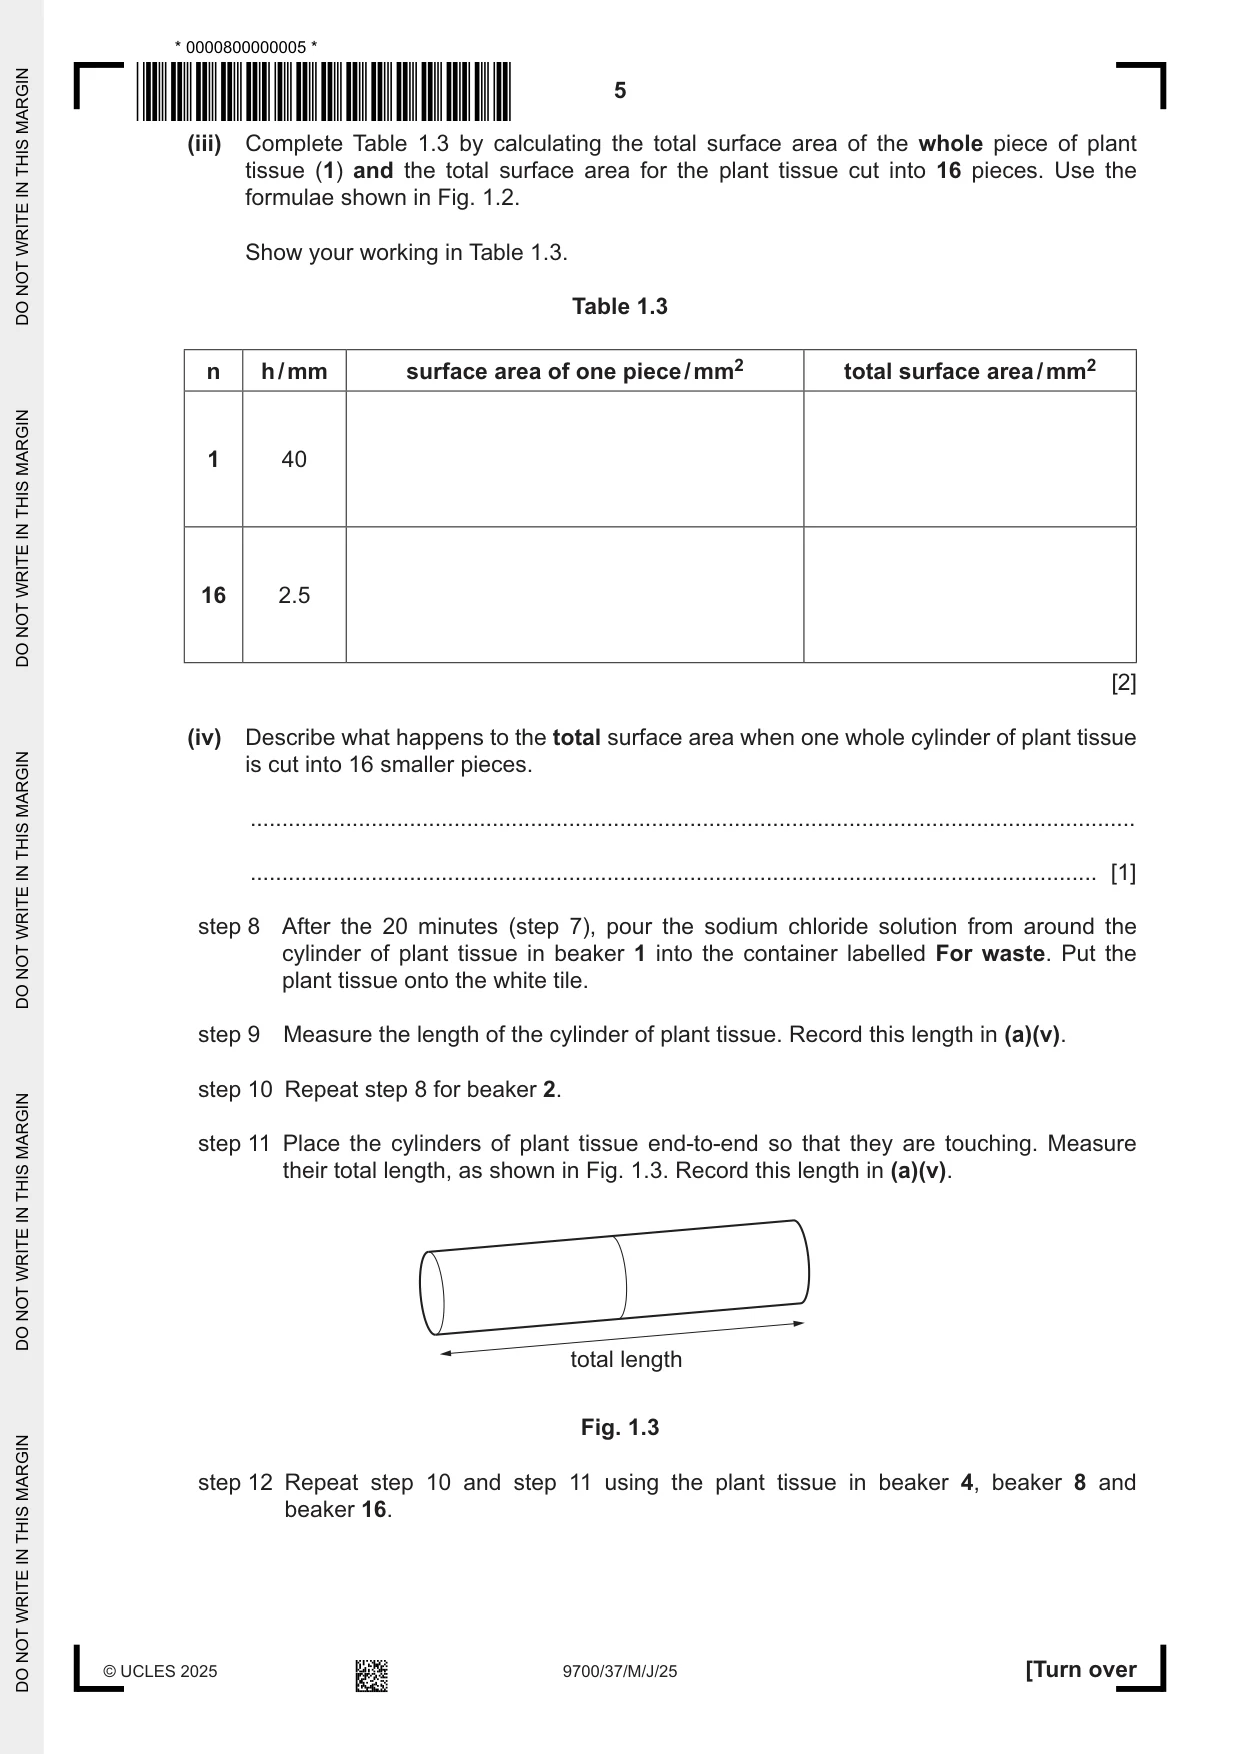
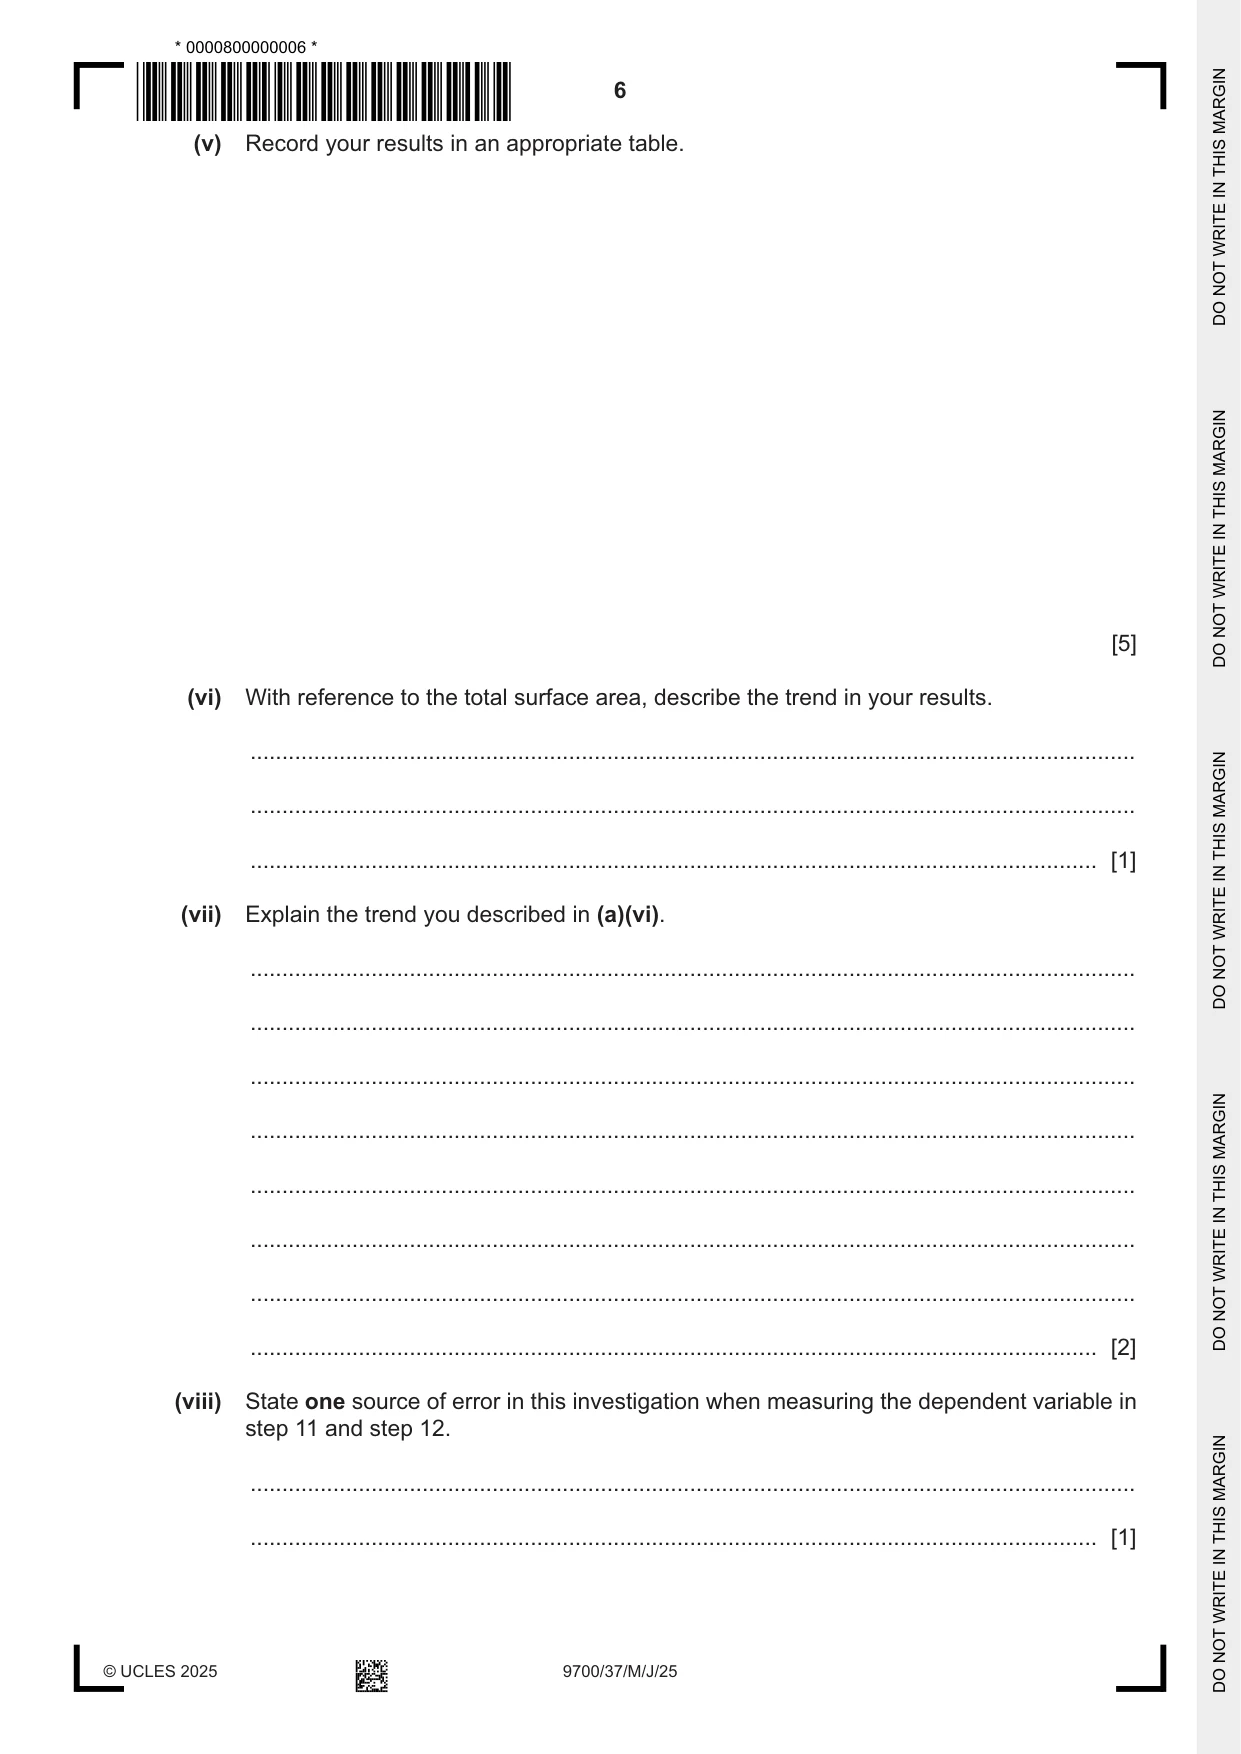
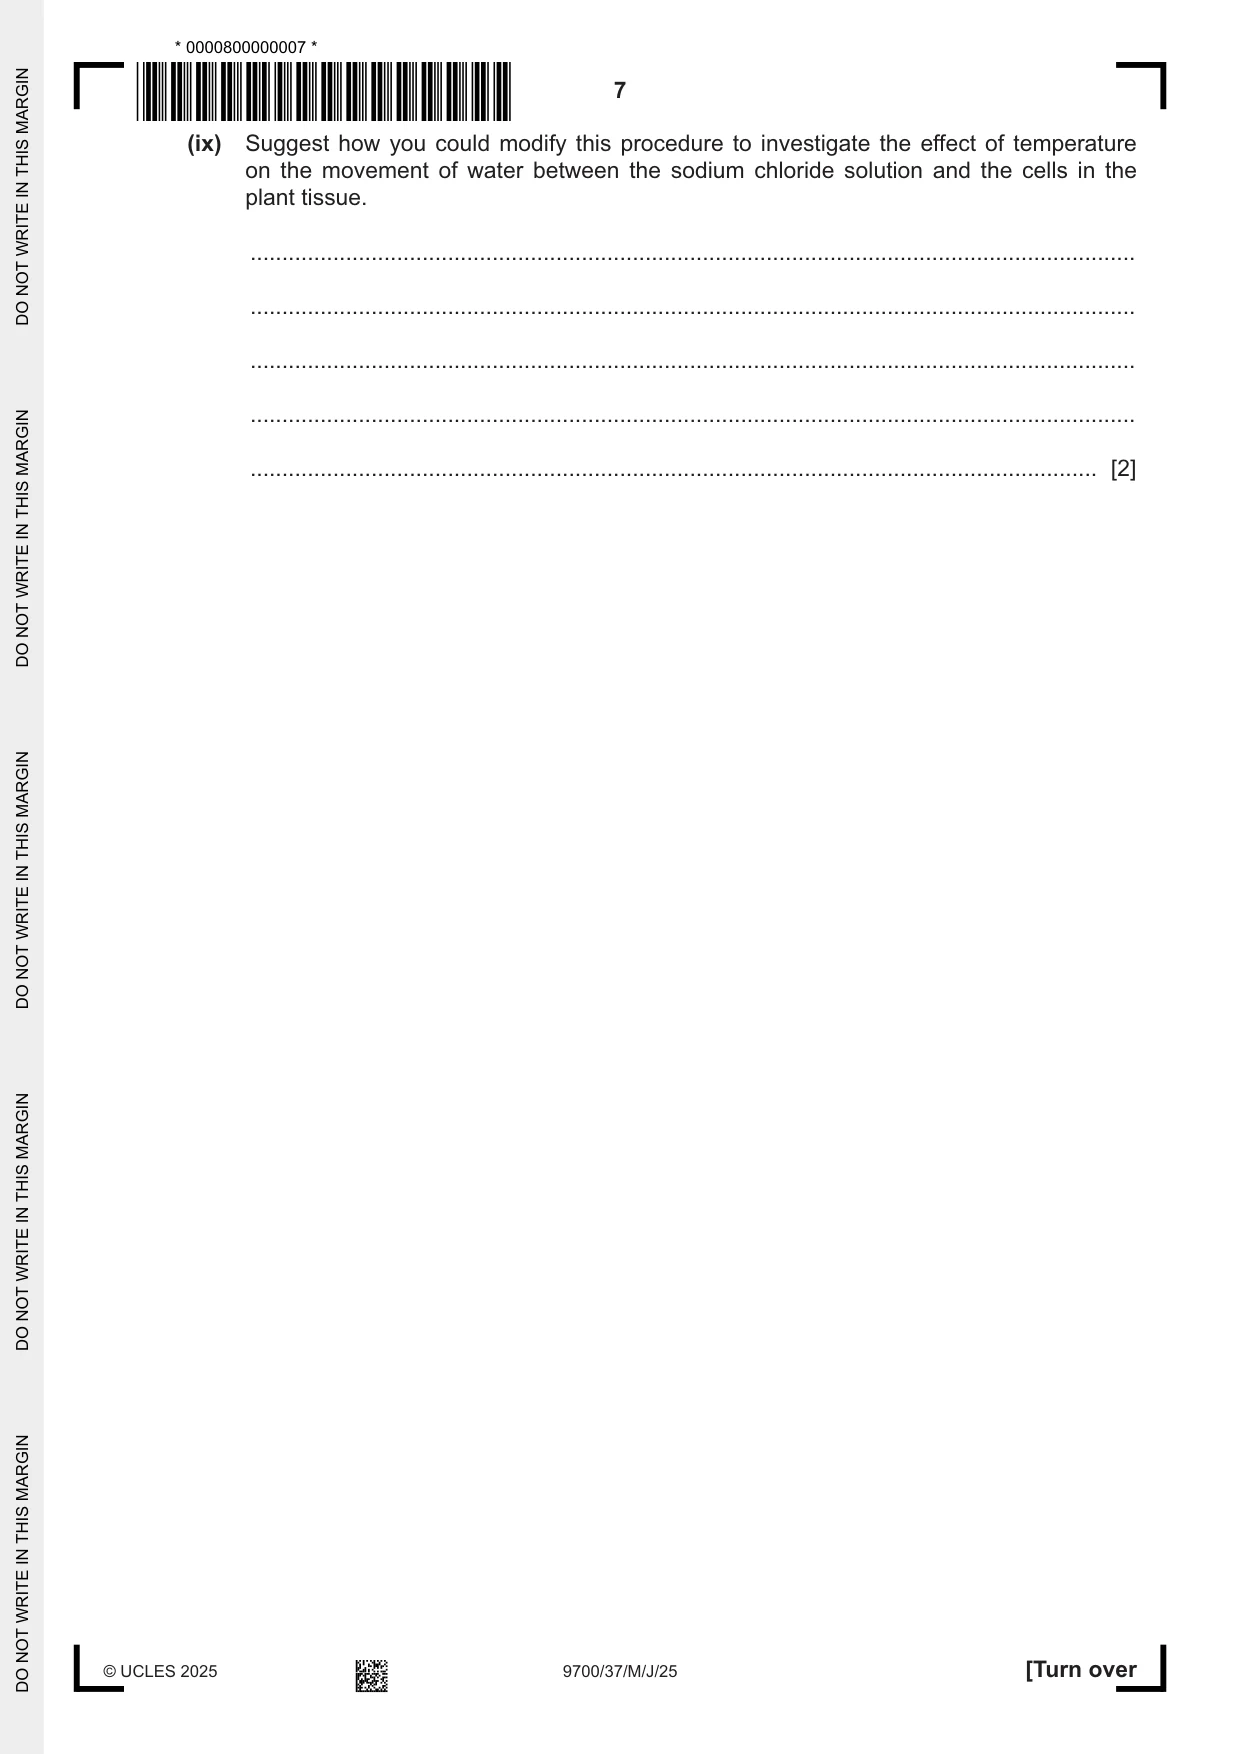
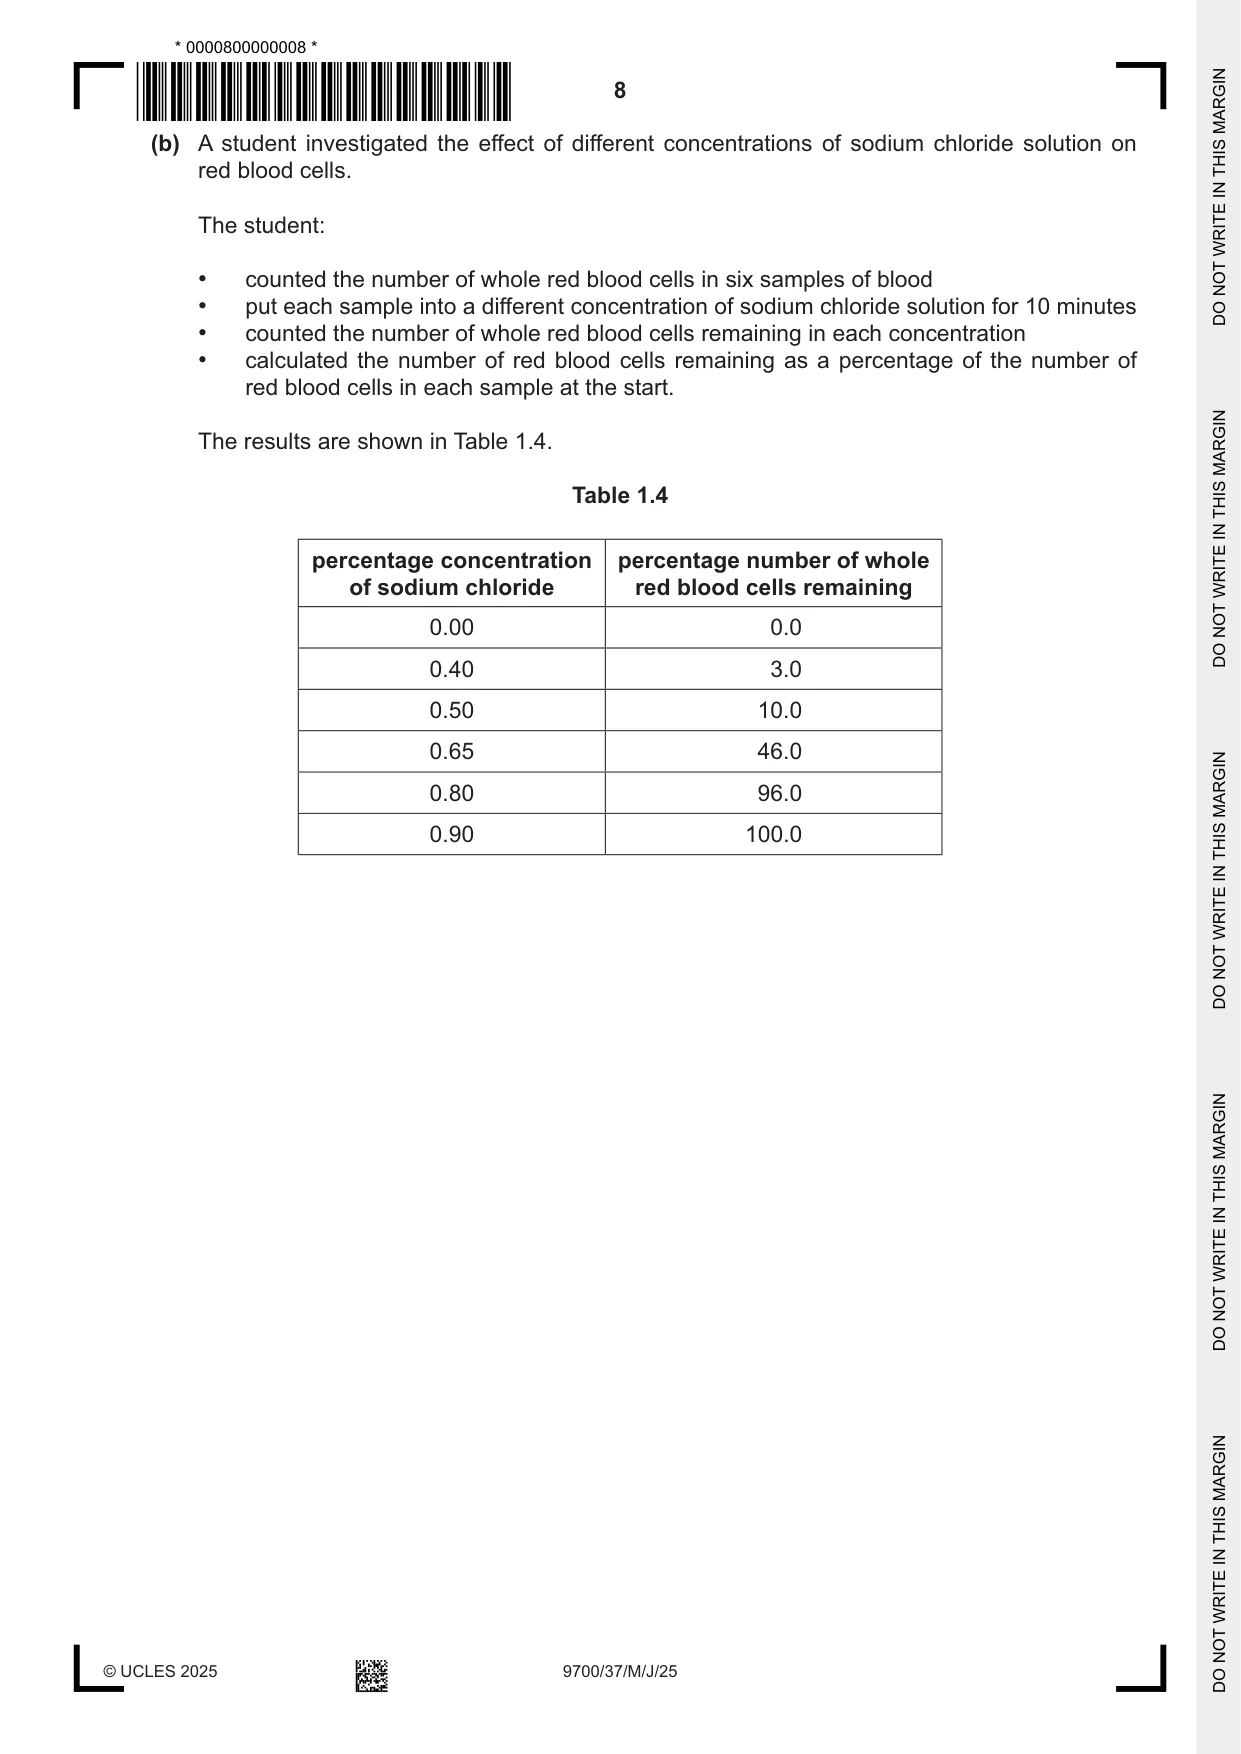
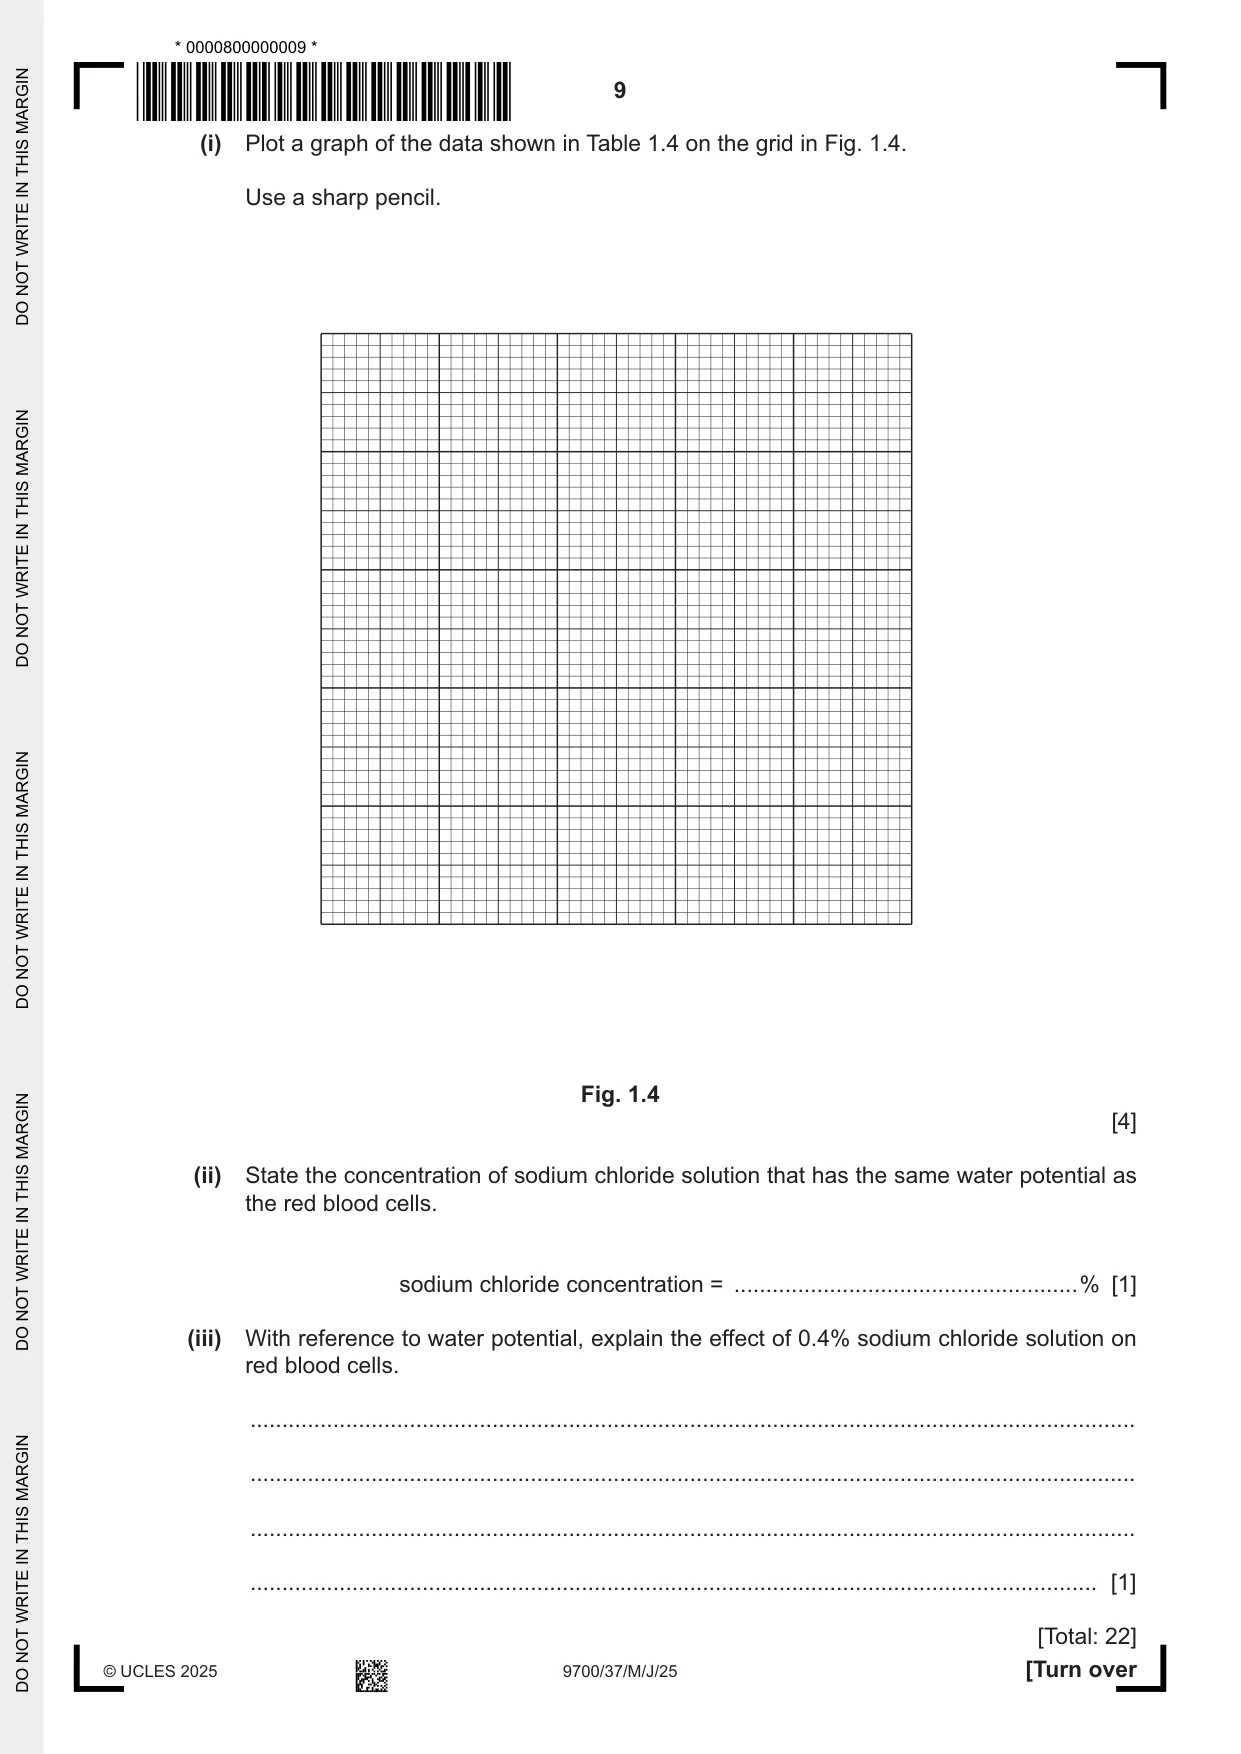
1 When plant tissue is placed into a solution of sodium chloride, water moves between the sodium chloride solution and the cells in the plant tissue. You will investigate the effect of surface area of plant tissue on the movement of water between a sodium chloride solution and the cells in a sample of plant tissue. You are provided with the materials shown in Table 1.1. Table 1.1 labelled contents hazard volume / cm3 P 5 cylinders of plant tissue in distilled water none – S 2.0 mol dm–3 sodium chloride solution none 200 It is recommended that you wear suitable eye protection. You will need to: • cut cylinders of plant tissue into different lengths • soak different lengths of plant tissue in sodium chloride solution for 20 minutes • measure the final length of the plant tissue. Carry out step 1 to step 12. step 1 Using the forceps, put the cylinders of plant tissue onto the white tile. step 2 Cut each cylinder of plant tissue to 40 mm length. The cylinders of plant tissue all have the same diameter, as shown in Fig. 1.1. The radius is calculated by dividing the diameter by 2. diameter Fig. 1.1 (a) (i) Measure the diameter of one cylinder of plant tissue and calculate the radius, r. diameter = ............................................................... r = ............................................................... [1] To investigate the effect of surface area, you will use one whole cylinder of plant tissue and cut the other cylinders into a different number of pieces. step 3 Label five beakers with the number of pieces of plant tissue (n) as shown in Table 1.2. Table 1.2 length (h) of each beaker labelled number of pieces of plant tissue (n) small piece / mm 1 1 40 2 2 20 4 4 10 8 8 5 16 16 2.5 step 4 Put one whole cylinder of plant tissue into the beaker labelled 1. step 5 Cut each of the other four cylinders of plant tissue into the number of pieces shown in Table 1.2 and put them into the appropriately labelled beaker. In step 6 you will use a syringe to measure the volume of sodium chloride solution, S, you will put into each beaker. (ii) State the volume of S that you will put into each beaker and give a reason for the volume that you have stated. volume of S ..................... cm3 reason ............................................................................................................................... ........................................................................................................................................... [1] step 6 Put the volume of S you stated in (a)(ii) into each of the beakers. step 7 Start timing and wait for 20 minutes. Use this time to continue with other parts of Question 1. Fig. 1.2 shows an example of how to calculate the total surface area of plant tissue placed in each beaker. EXAMPLE: a cylinder with a length of 40 mm length, h = 40 mm diameter surface area of cylinder = 2πr2 + 2πr h = (2 × 3.14 × r2) + (2 × 3.14 × r × 40) where: π = 3.14 r = radius of cylinder = diameter ÷ 2 h = height or length of cylinder The total surface area depends on the number of pieces, n. Total surface area = surface area of one cylinder × number of pieces = (2πr2 + 2πrh)n Fig. 1.2 (iii) Complete Table 1.3 by calculating the total surface area of the whole piece of plant tissue (1) and the total surface area for the plant tissue cut into 16 pieces. Use the formulae shown in Fig. 1.2. Show your working in Table 1.3. Table 1.3 n h / mm surface area of one piece / mm2 total surface area / mm2 1 40 16 2.5 [2] (iv) Describe what happens to the total surface area when one whole cylinder of plant tissue is cut into 16 smaller pieces. ........................................................................................................................................... ..................................................................................................................................... [1] step 8 After the 20 minutes (step 7), pour the sodium chloride solution from around the cylinder of plant tissue in beaker 1 into the container labelled For waste. Put the plant tissue onto the white tile. step 9 Measure the length of the cylinder of plant tissue. Record this length in (a)(v). step 10 Repeat step 8 for beaker 2. step 11 Place the cylinders of plant tissue end‑to‑end so that they are touching. Measure their total length, as shown in Fig. 1.3. Record this length in (a)(v). total length Fig. 1.3 step 12 Repeat step 10 and step 11 using the plant tissue in beaker 4, beaker 8 and beaker 16. (v) Record your results in an appropriate table. [5] (vi) With reference to the total surface area, describe the trend in your results. ........................................................................................................................................... ........................................................................................................................................... ..................................................................................................................................... [1] (vii) Explain the trend you described in (a)(vi). ........................................................................................................................................... ........................................................................................................................................... ........................................................................................................................................... ........................................................................................................................................... ........................................................................................................................................... ........................................................................................................................................... ........................................................................................................................................... ..................................................................................................................................... [2] (viii) State one source of error in this investigation when measuring the dependent variable in step 11 and step 12. ........................................................................................................................................... ..................................................................................................................................... [1] (ix) Suggest how you could modify this procedure to investigate the effect of temperature on the movement of water between the sodium chloride solution and the cells in the plant tissue. ........................................................................................................................................... ........................................................................................................................................... ........................................................................................................................................... ........................................................................................................................................... ..................................................................................................................................... [2] (b) A student investigated the effect of different concentrations of sodium chloride solution on red blood cells. The student: • counted the number of whole red blood cells in six samples of blood • put each sample into a different concentration of sodium chloride solution for 10 minutes • counted the number of whole red blood cells remaining in each concentration • calculated the number of red blood cells remaining as a percentage of the number of red blood cells in each sample at the start. The results are shown in Table 1.4. Table 1.4 percentage concentration percentage number of whole of sodium chloride red blood cells remaining 0.00 0.0 0.40 3.0 0.50 10.0 0.65 46.0 0.80 96.0 0.90 100.0 (i) Plot a graph of the data shown in Table 1.4 on the grid in Fig. 1.4. Use a sharp pencil. Fig. 1.4 [4] (ii) State the concentration of sodium chloride solution that has the same water potential as the red blood cells. sodium chloride concentration = ......................................................% [1] (iii) With reference to water potential, explain the effect of 0.4% sodium chloride solution on red blood cells. ........................................................................................................................................... ........................................................................................................................................... ........................................................................................................................................... ..................................................................................................................................... [1] [Total: 22]
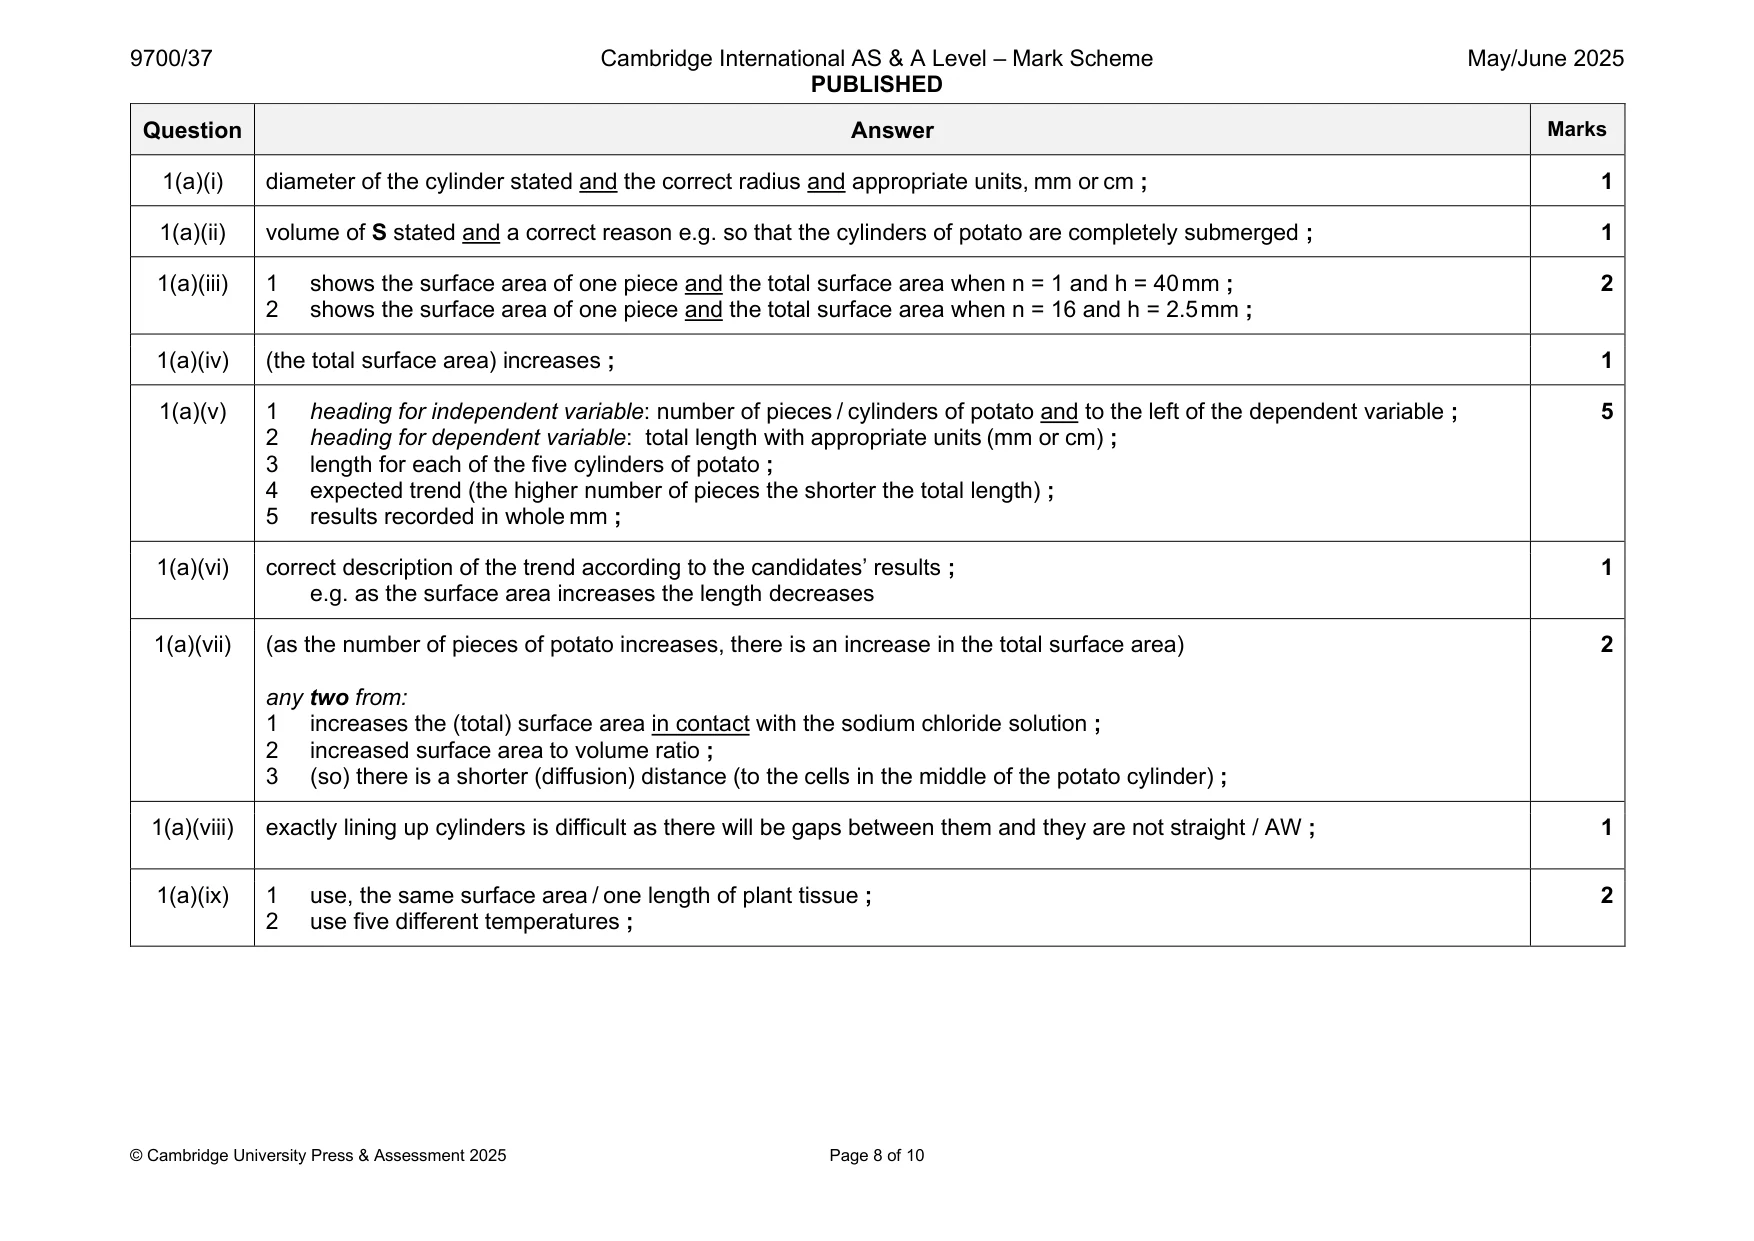
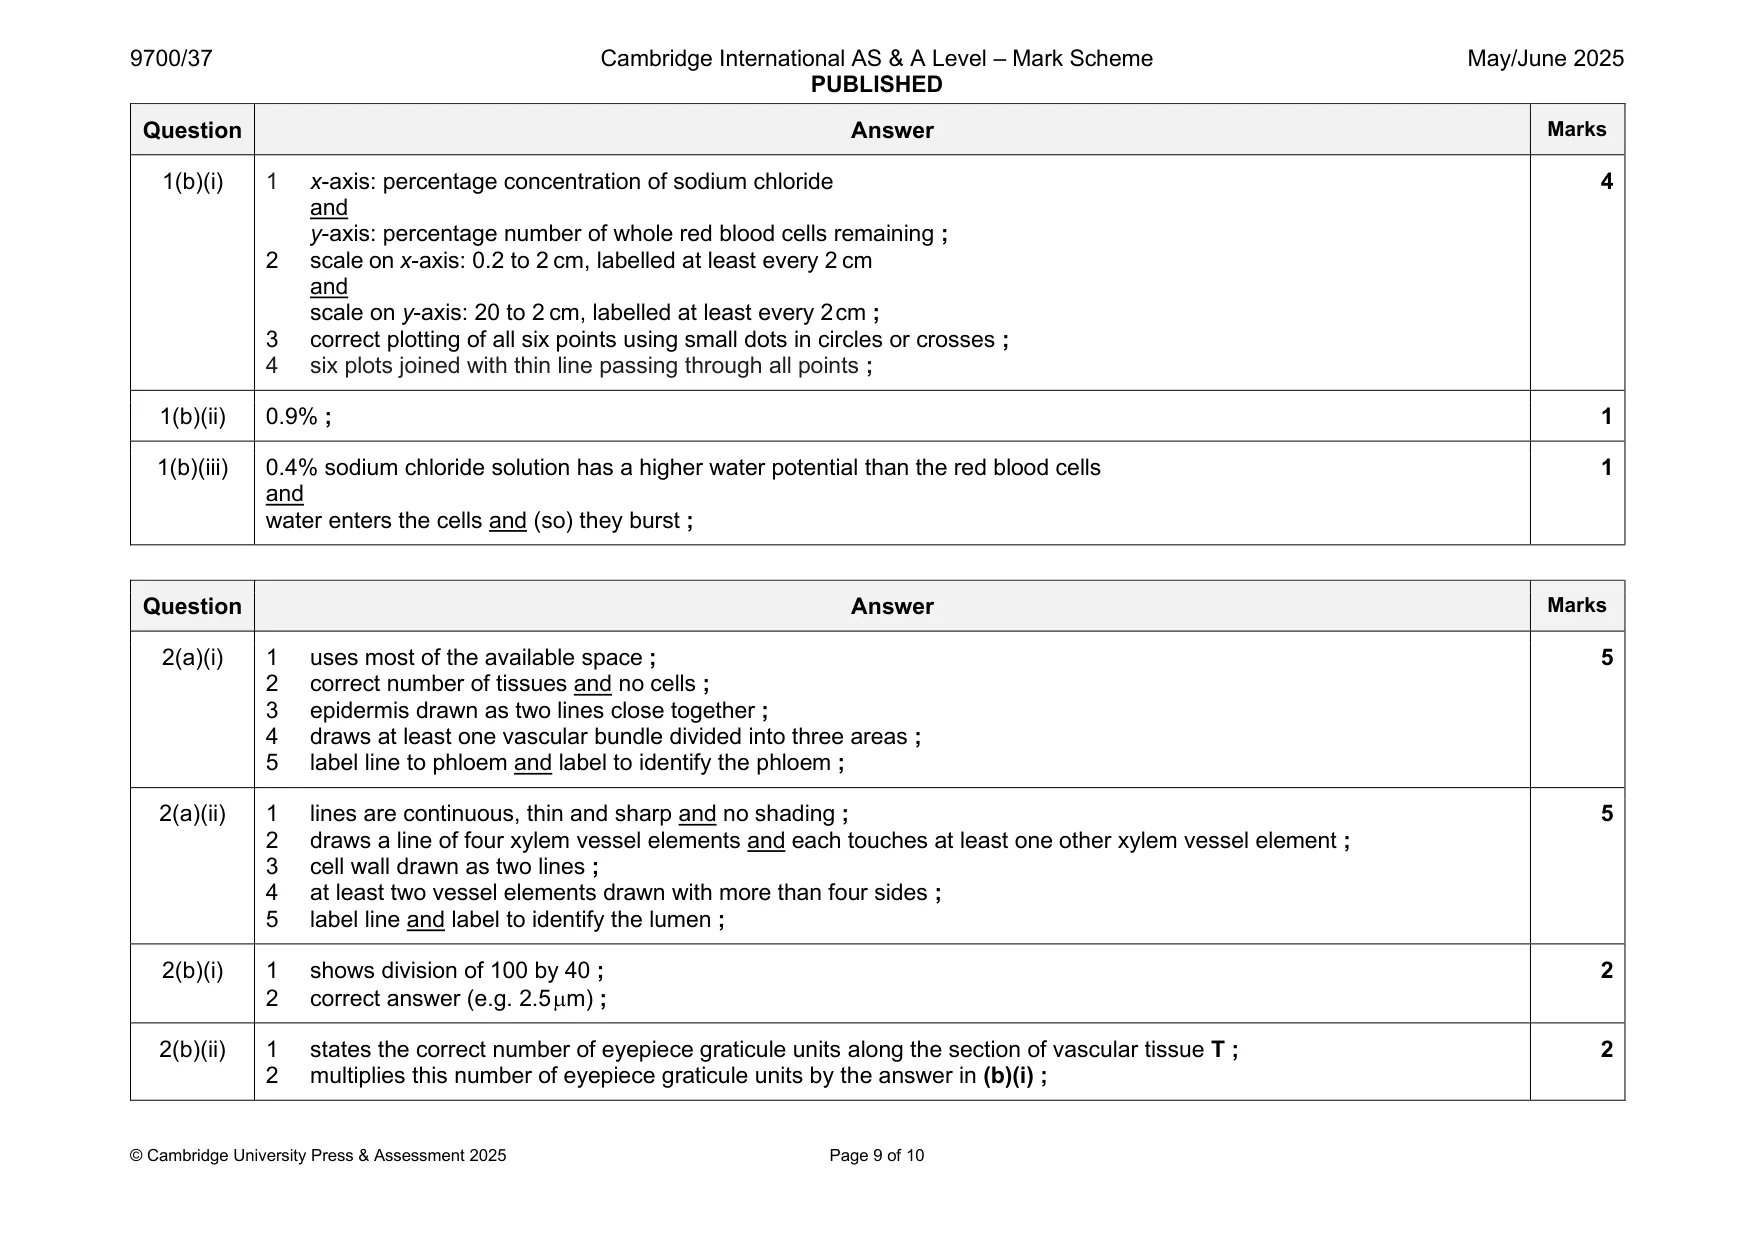
Mark scheme: Question Answer Marks 1(a)(i) diameter of the cylinder stated and the correct radius and appropriate units, mm or cm ; 1 1(a)(ii) volume of S stated and a correct reason e.g. so that the cylinders of potato are completely submerged ; 1 1(a)(iii) 1 shows the surface area of one piece and the total surface area when n = 1 and h = 40 mm ; 2 2 shows the surface area of one piece and the total surface area when n = 16 and h = 2.5 mm ; 1(a)(iv) (the total surface area) increases ; 1 1(a)(v) 1 heading for independent variable: number of pieces / cylinders of potato and to the left of the dependent variable ; 5 2 heading for dependent variable: total length with appropriate units (mm or cm) ; 3 length for each of the five cylinders of potato ; 4 expected trend (the higher number of pieces the shorter the total length) ; 5 results recorded in whole mm ; 1(a)(vi) correct description of the trend according to the candidates’ results ; 1 e.g. as the surface area increases the length decreases 1(a)(vii) (as the number of pieces of potato increases, there is an increase in the total surface area) 2 any two from: 1 increases the (total) surface area in contact with the sodium chloride solution ; 2 increased surface area to volume ratio ; 3 (so) there is a shorter (diffusion) distance (to the cells in the middle of the potato cylinder) ; 1(a)(viii) exactly lining up cylinders is difficult as there will be gaps between them and they are not straight / AW ; 1 1(a)(ix) 1 use, the same surface area / one length of plant tissue ; 2 2 use five different temperatures ; 1(b)(i) 1 x-axis: percentage concentration of sodium chloride 4 and y-axis: percentage number of whole red blood cells remaining ; 2 scale on x-axis: 0.2 to 2 cm, labelled at least every 2 cm and scale on y-axis: 20 to 2 cm, labelled at least every 2 cm ; 3 correct plotting of all six points using small dots in circles or crosses ; 4 six plots joined with thin line passing through all points ; 1(b)(ii) 0.9% ; 1 1(b)(iii) 0.4% sodium chloride solution has a higher water potential than the red blood cells 1 and water enters the cells and (so) they burst ;
Q2 · L1 is a slide of a stained transverse section through a plant organ
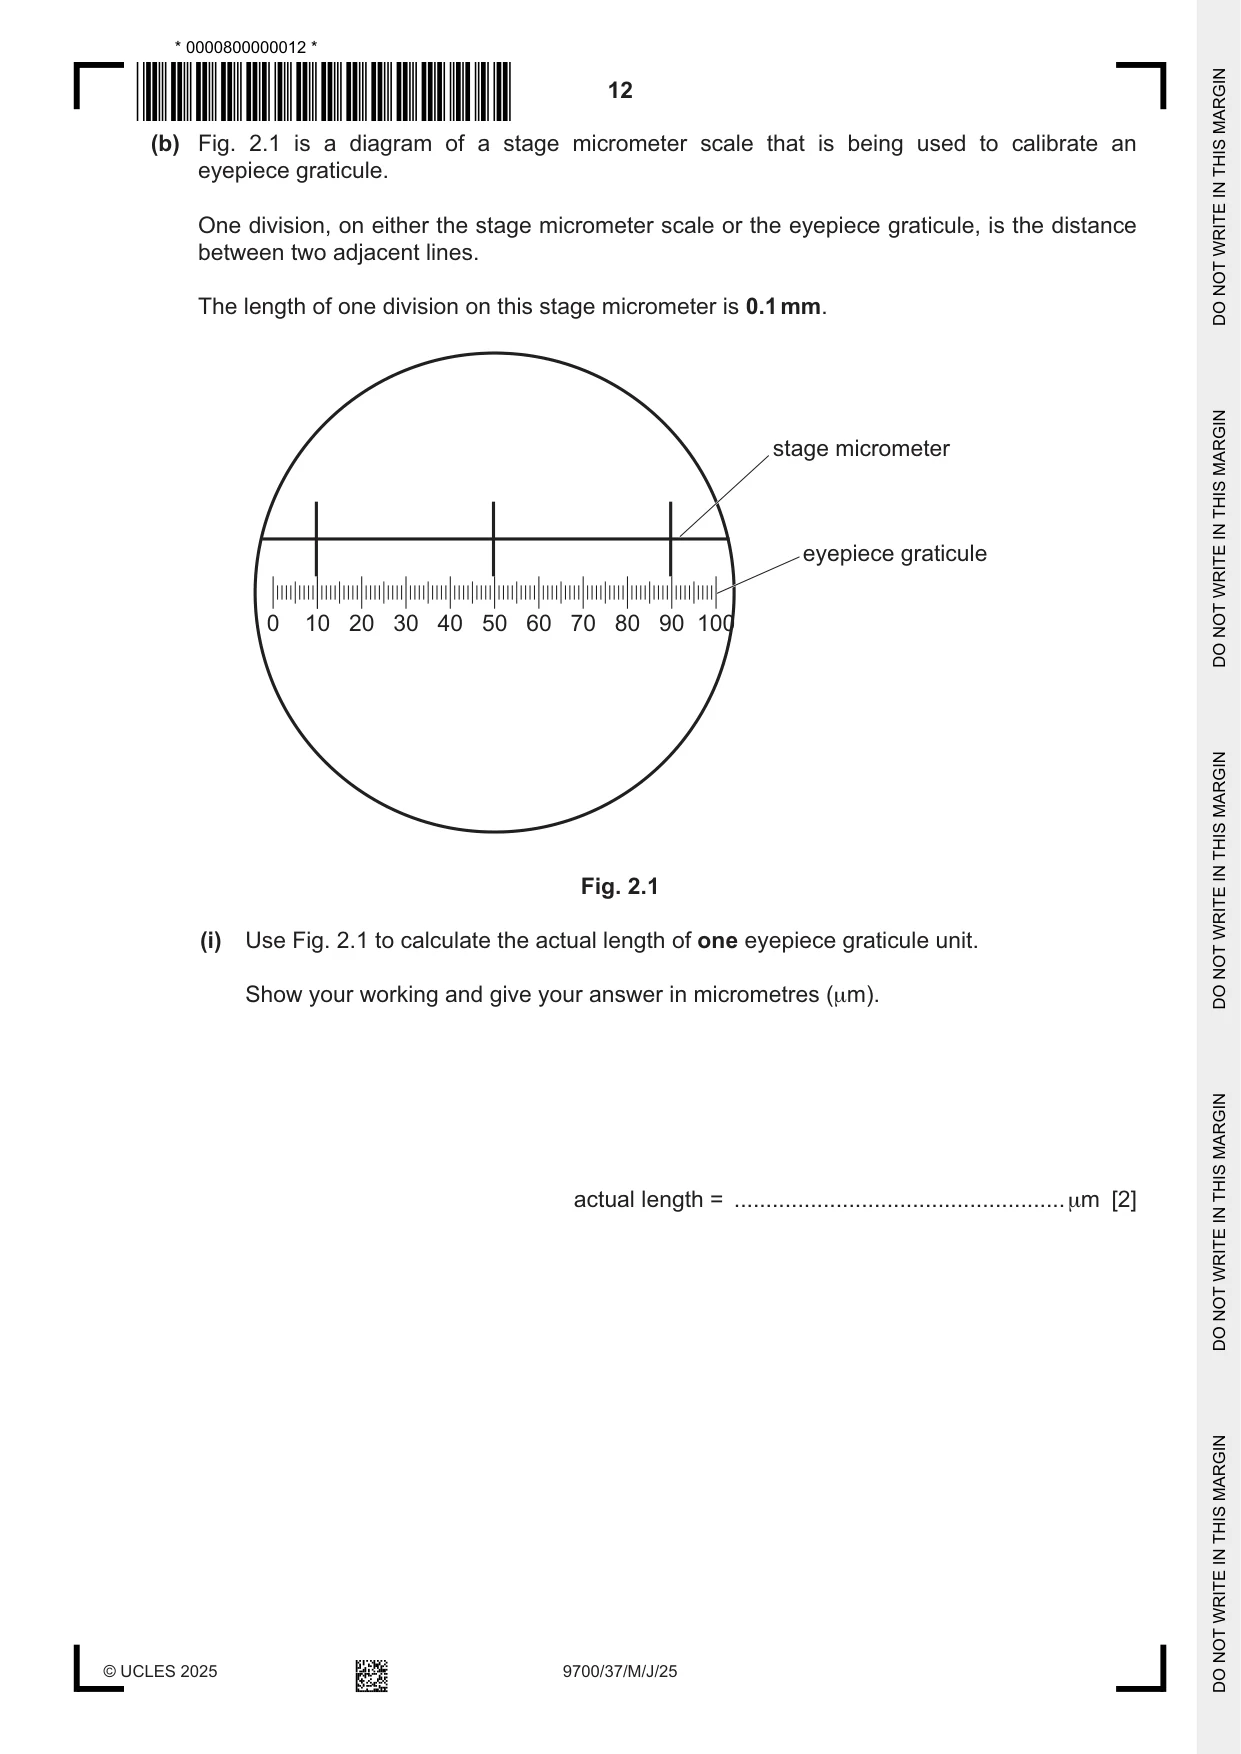
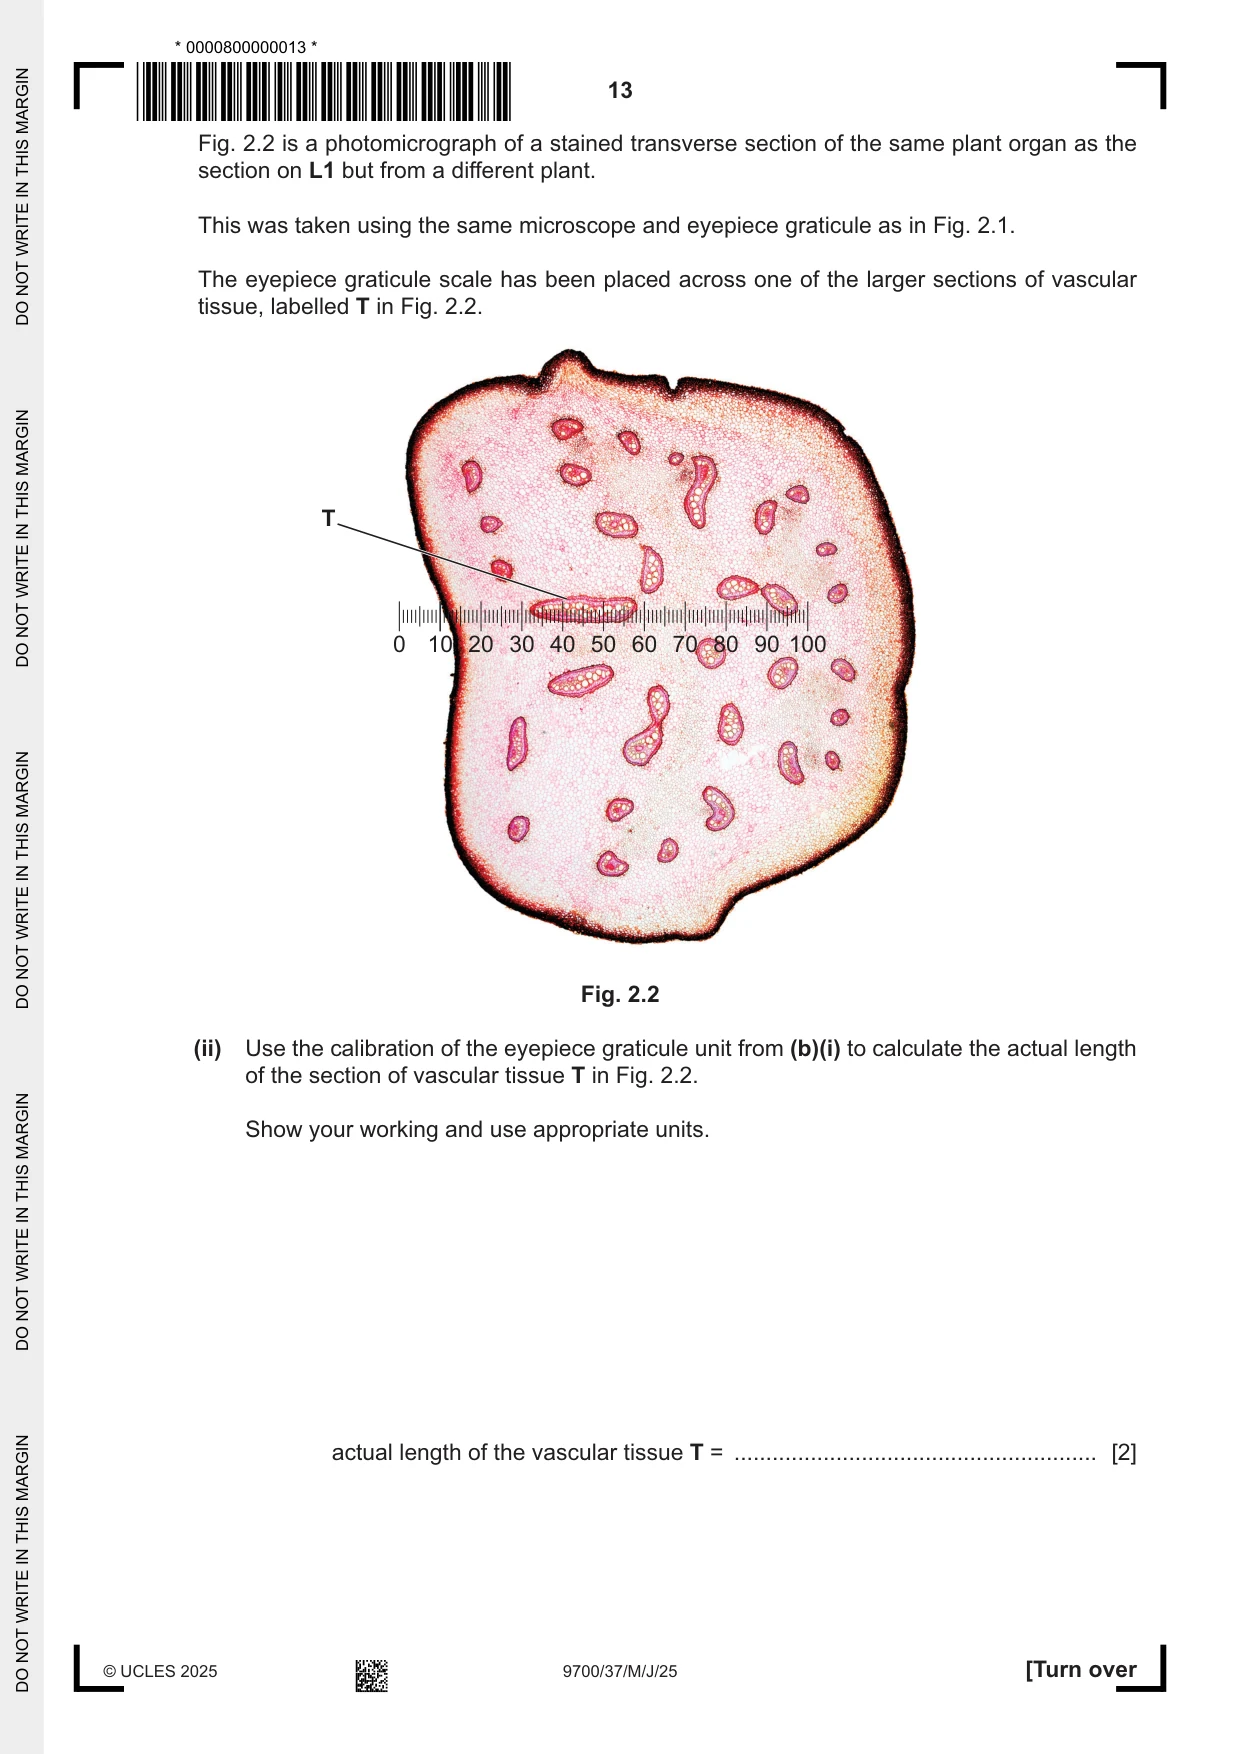
2 L1 is a slide of a stained transverse section through a plant organ. (a) (i) Draw a large plan diagram of a region of the organ on L1 to include the epidermis and two vascular bundles. Use a sharp pencil. Use one ruled label line and label to identify the phloem. [5] (ii) Observe the xylem on the section of the plant organ on L1. Select a line of four adjacent xylem vessel elements. Each xylem vessel element must touch at least one of the other xylem vessel elements. • Make a large drawing of this line of four xylem vessel elements. • Use one ruled label line and label to identify the lumen. [5] (b) Fig. 2.1 is a diagram of a stage micrometer scale that is being used to calibrate an eyepiece graticule. One division, on either the stage micrometer scale or the eyepiece graticule, is the distance between two adjacent lines. The length of one division on this stage micrometer is 0.1 mm. stage micrometer eyepiece graticule 0 10 20 30 40 50 60 70 80 90 100 Fig. 2.1 (i) Use Fig. 2.1 to calculate the actual length of one eyepiece graticule unit. Show your working and give your answer in micrometres (µm). actual length = .................................................... µm [2]
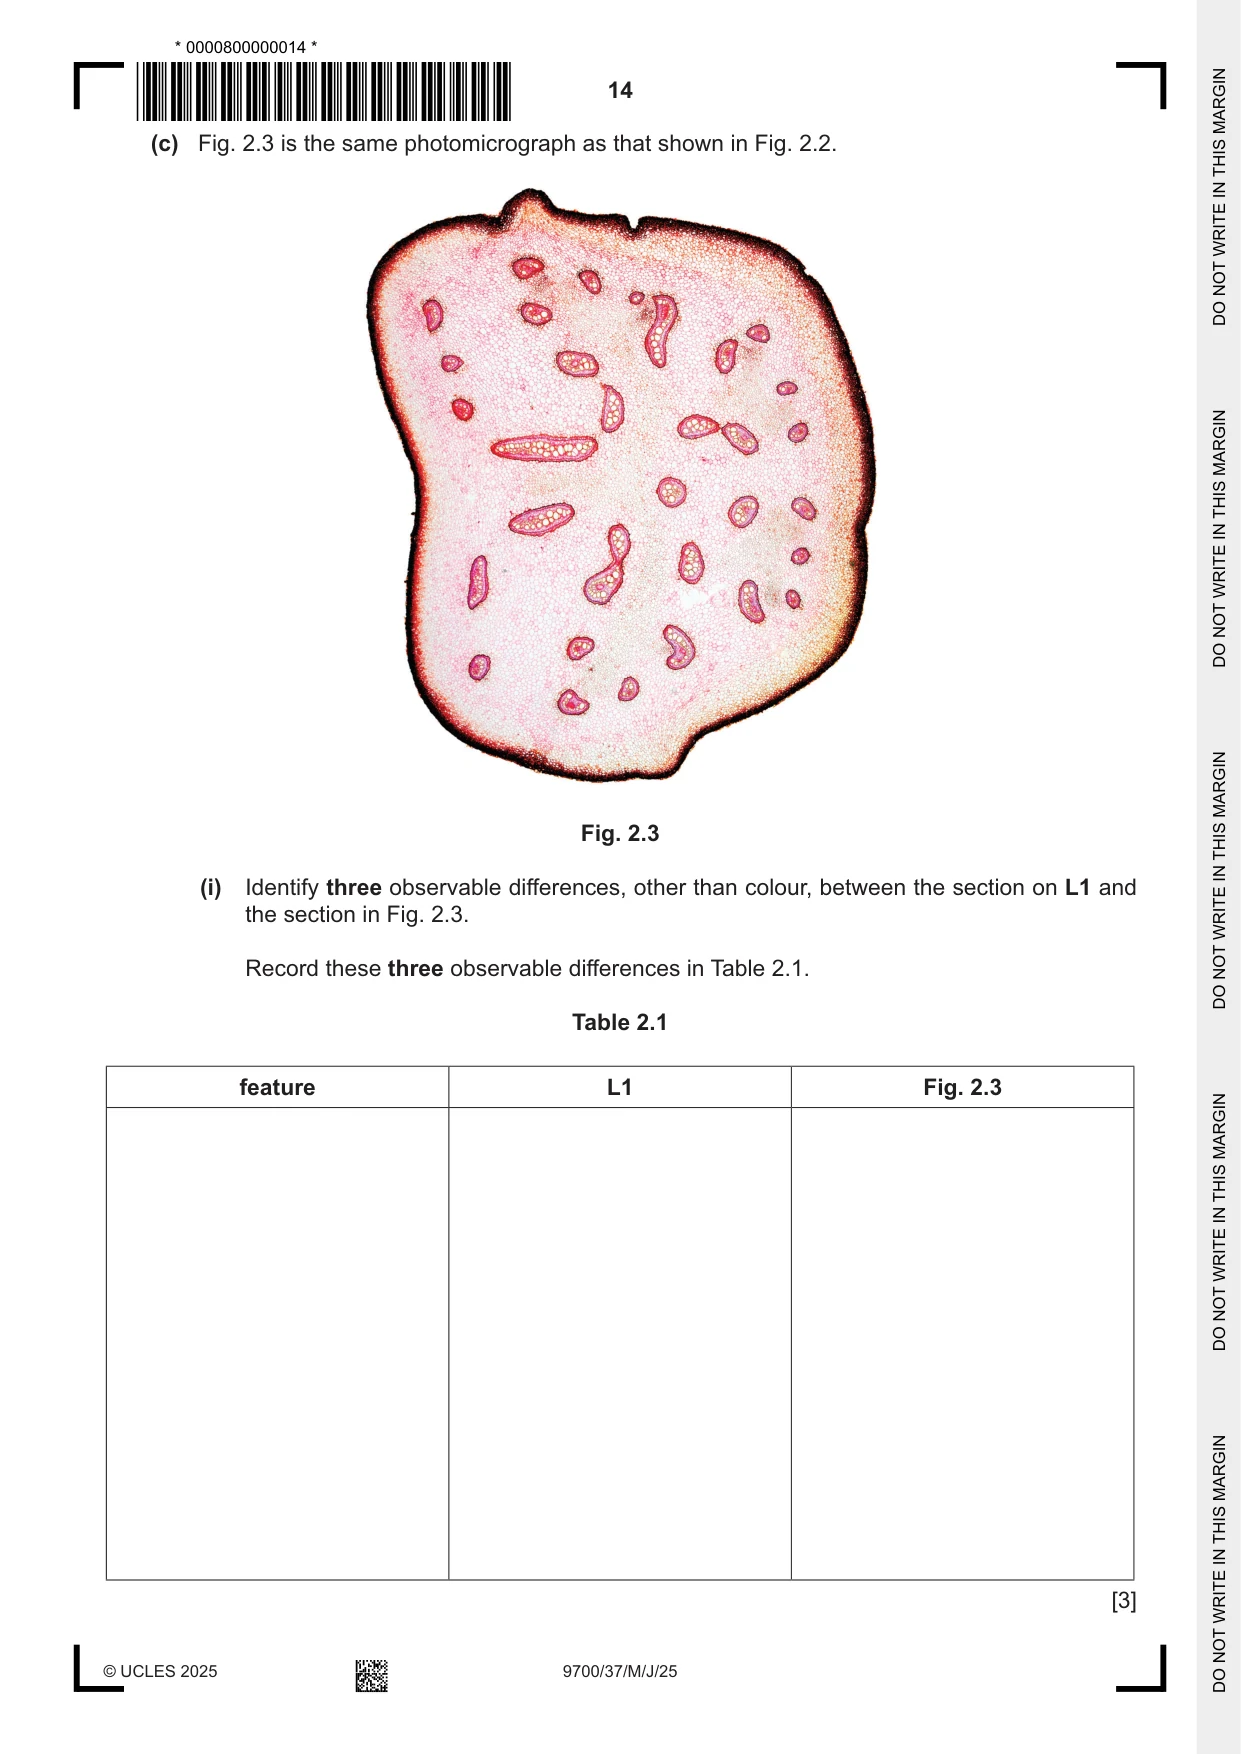
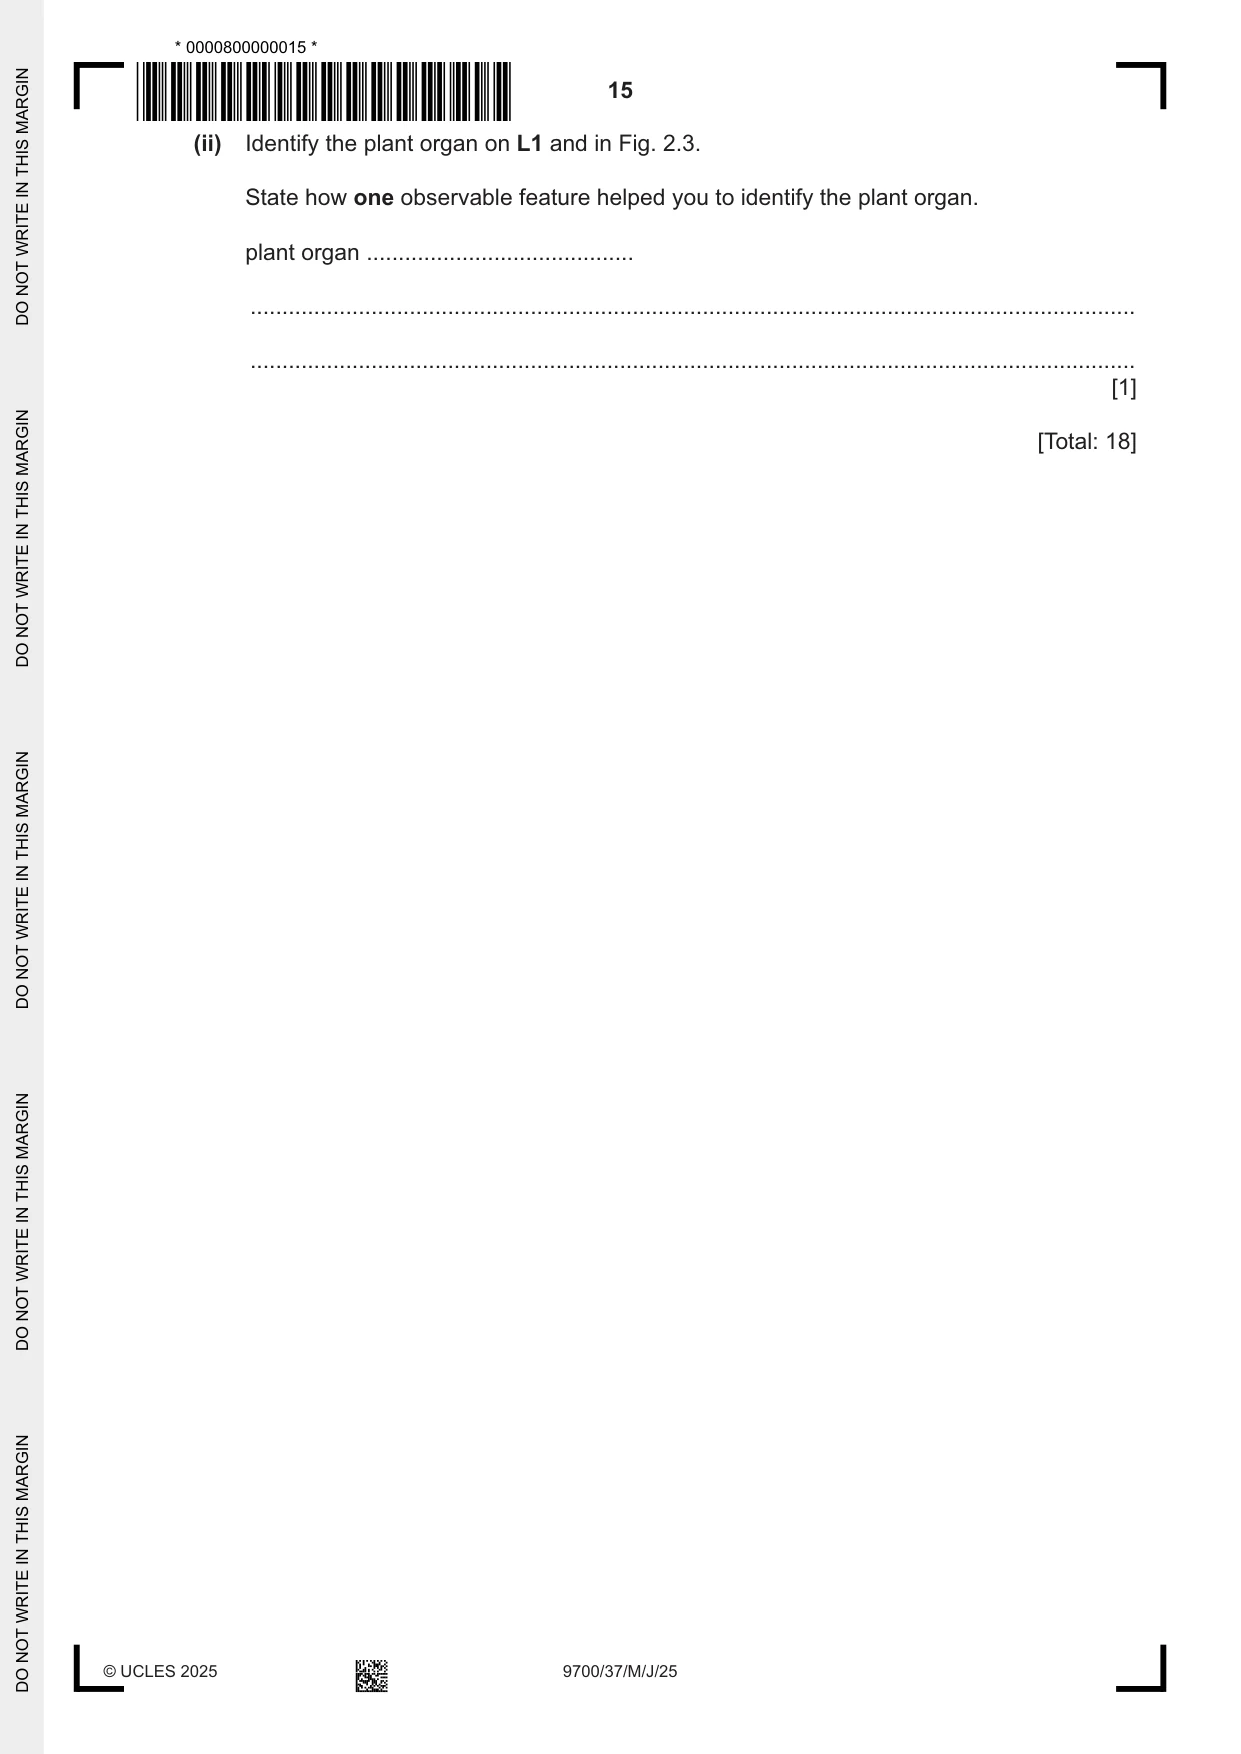
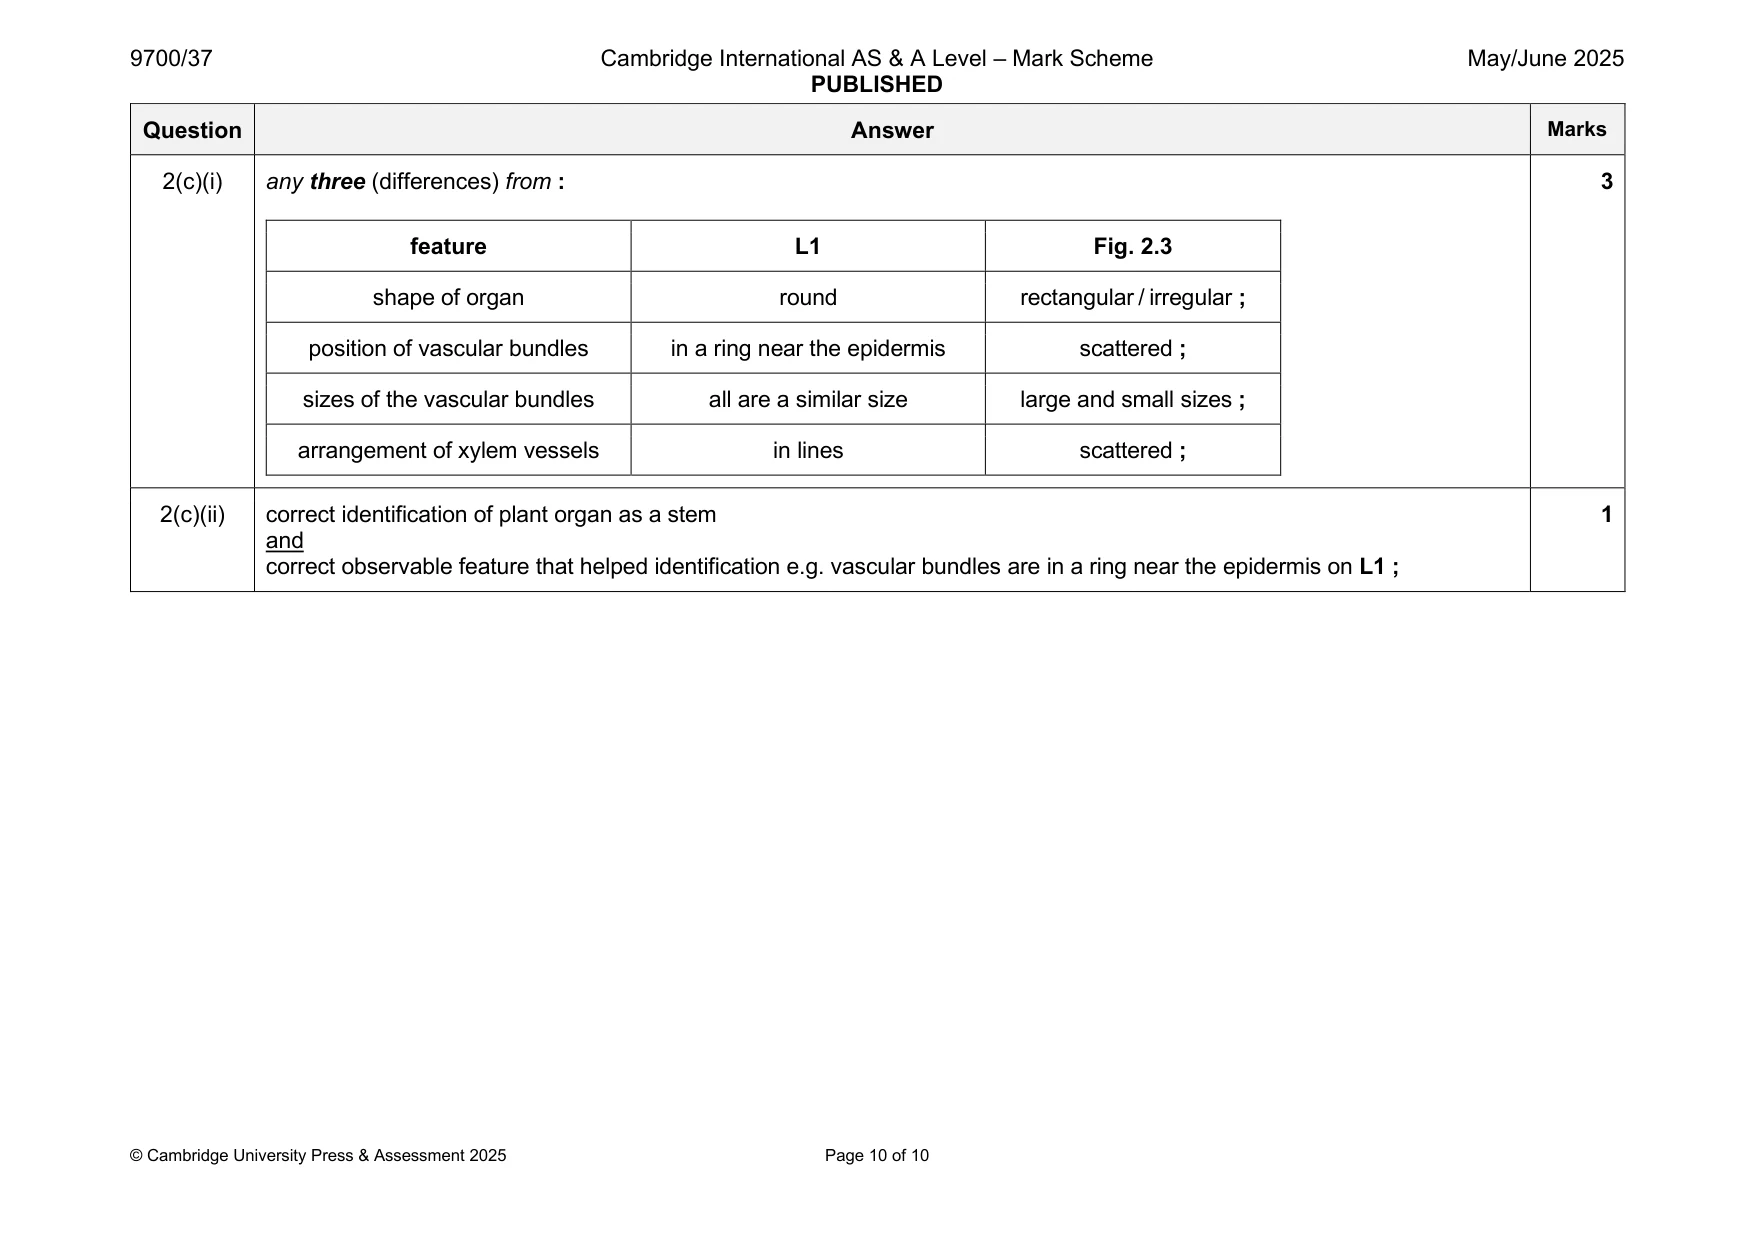
Mark scheme: 2(a)(i) 1 uses most of the available space ; 5 2 correct number of tissues and no cells ; 3 epidermis drawn as two lines close together ; 4 draws at least one vascular bundle divided into three areas ; 5 label line to phloem and label to identify the phloem ; 2(a)(ii) 1 lines are continuous, thin and sharp and no shading ; 5 2 draws a line of four xylem vessel elements and each touches at least one other xylem vessel element ; 3 cell wall drawn as two lines ; 4 at least two vessel elements drawn with more than four sides ; 5 label line and label to identify the lumen ; 2(b)(i) 1 shows division of 100 by 40 ; 2 2 correct answer (e.g. 2.5 m) ; 2(b)(ii) 1 states the correct number of eyepiece graticule units along the section of vascular tissue T ; 2 2 multiplies this number of eyepiece graticule units by the answer in (b)(i) ; 2(c)(i) any three (differences) from : 3 feature L1 Fig. 2.3 shape of organ round rectangular / irregular ; position of vascular bundles in a ring near the epidermis scattered ; sizes of the vascular bundles all are a similar size large and small sizes ; arrangement of xylem vessels in lines scattered ; 2(c)(ii) correct identification of plant organ as a stem 1 and correct observable feature that helped identification e.g. vascular bundles are in a ring near the epidermis on L1 ;
What was in this paper
The subtopics covered by these 2 questions, and how many questions each got. Open one in a new tab to see every Cambridge question on it.
What you needed in this session
Cambridge’s own grade thresholds for 2025 May/June, Paper 3 · Variant 7. A higher threshold means an easier paper — the bar moves with how the cohort did.