Cambridge A Level Biology 9700 — 2022 Feb/March Paper 3 · Variant 3
9700/33/F/M/22 · 2 questions · 40 marks · ≈45 min
The question paper and its mark scheme, free to read here and free to download. This is Cambridge’s own paper, exactly as it was sat.
Question paper20 pages

Mark scheme7 pages
Answers below. Sit the paper first if you are practising.
Questions as text
Q1 · You will investigate the water potential of potato cells
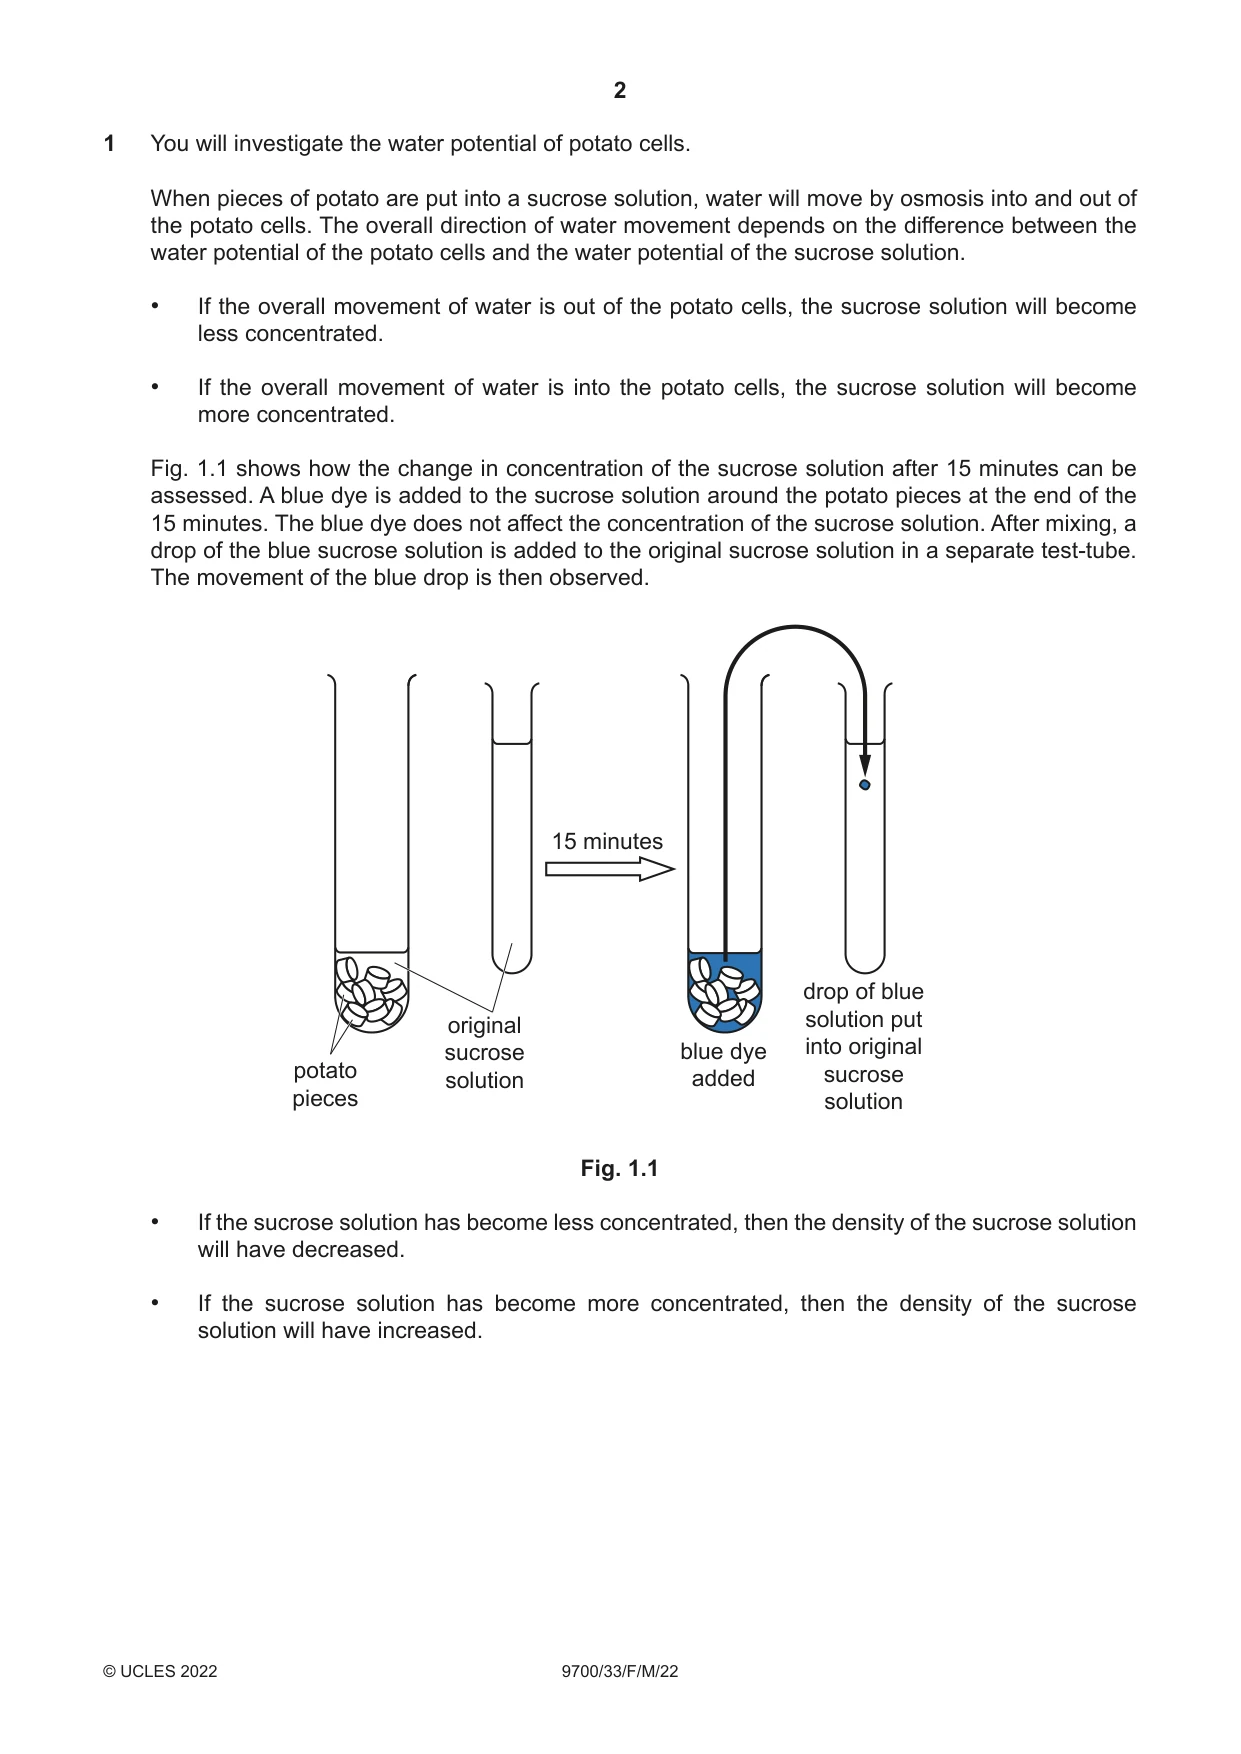
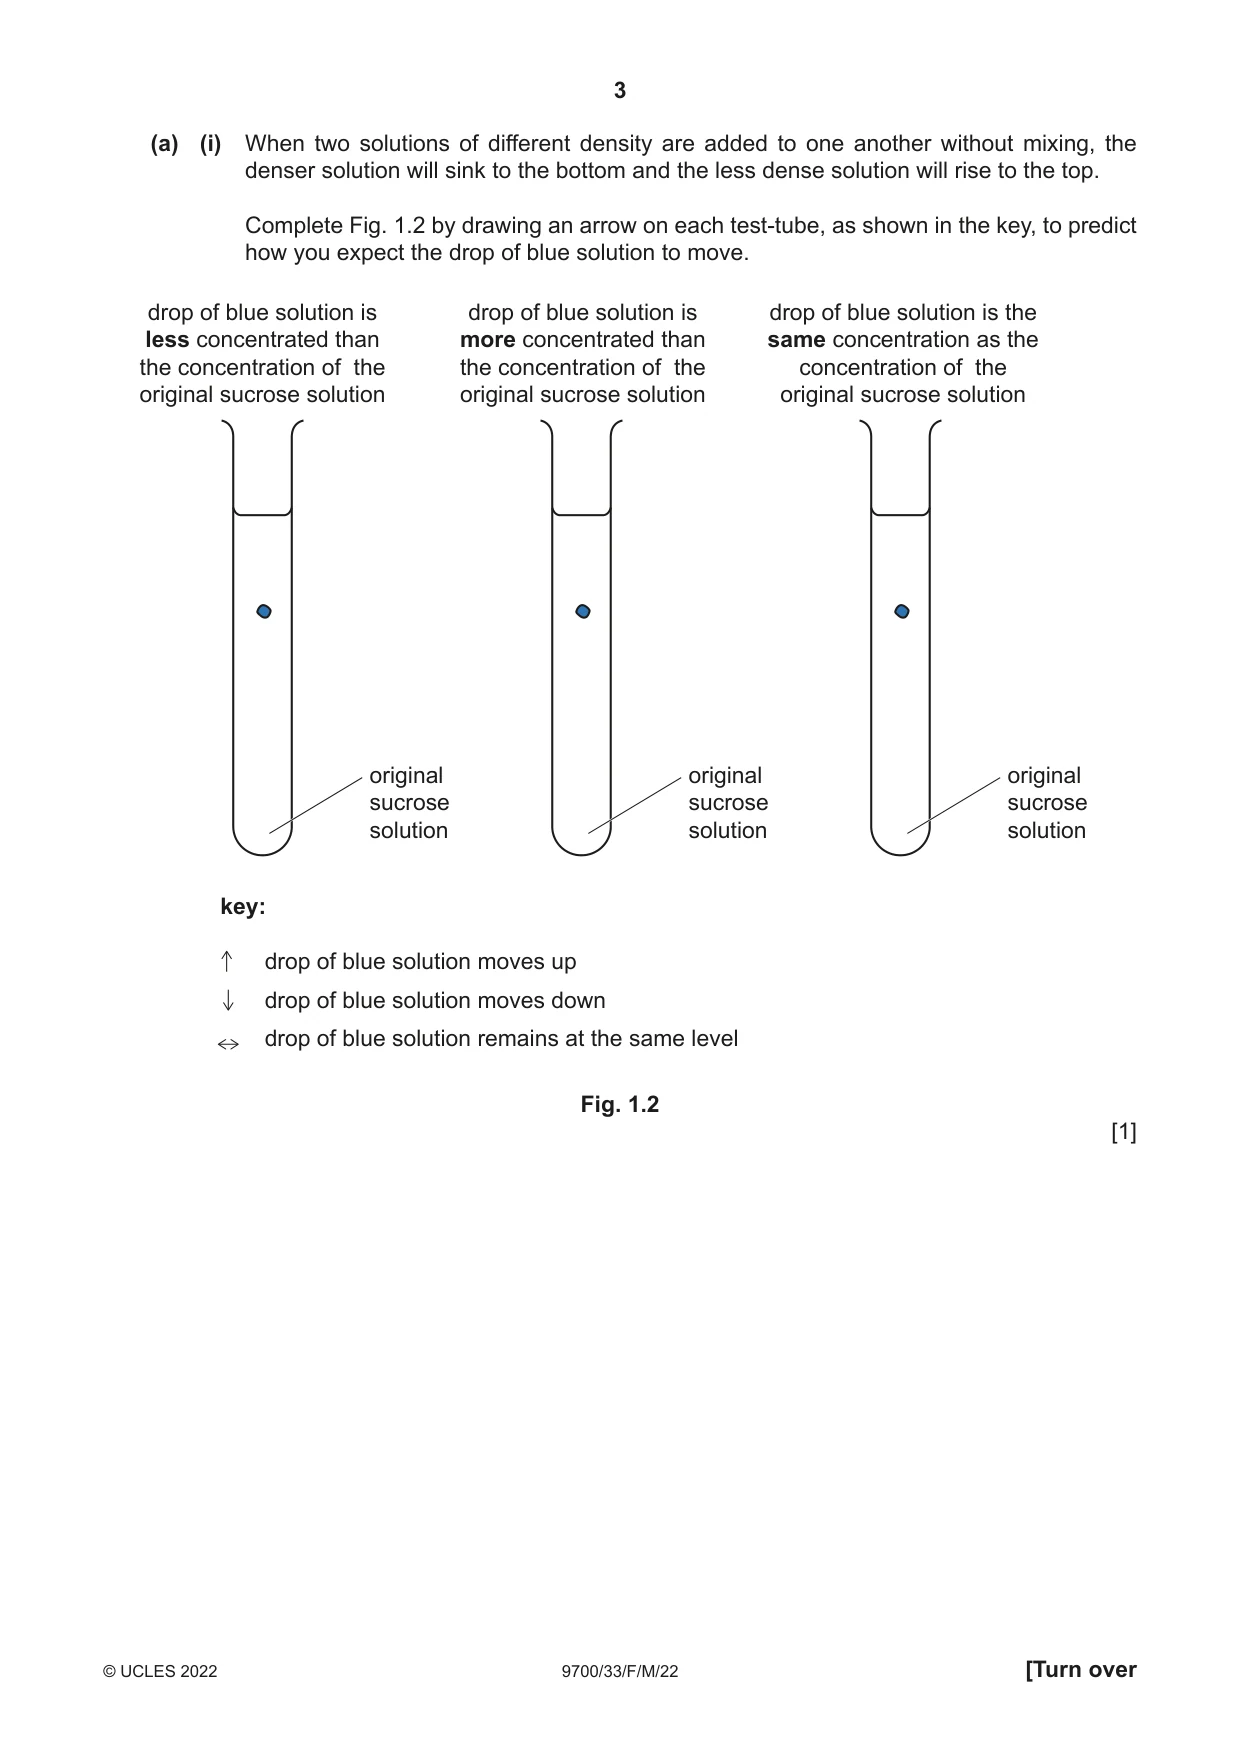
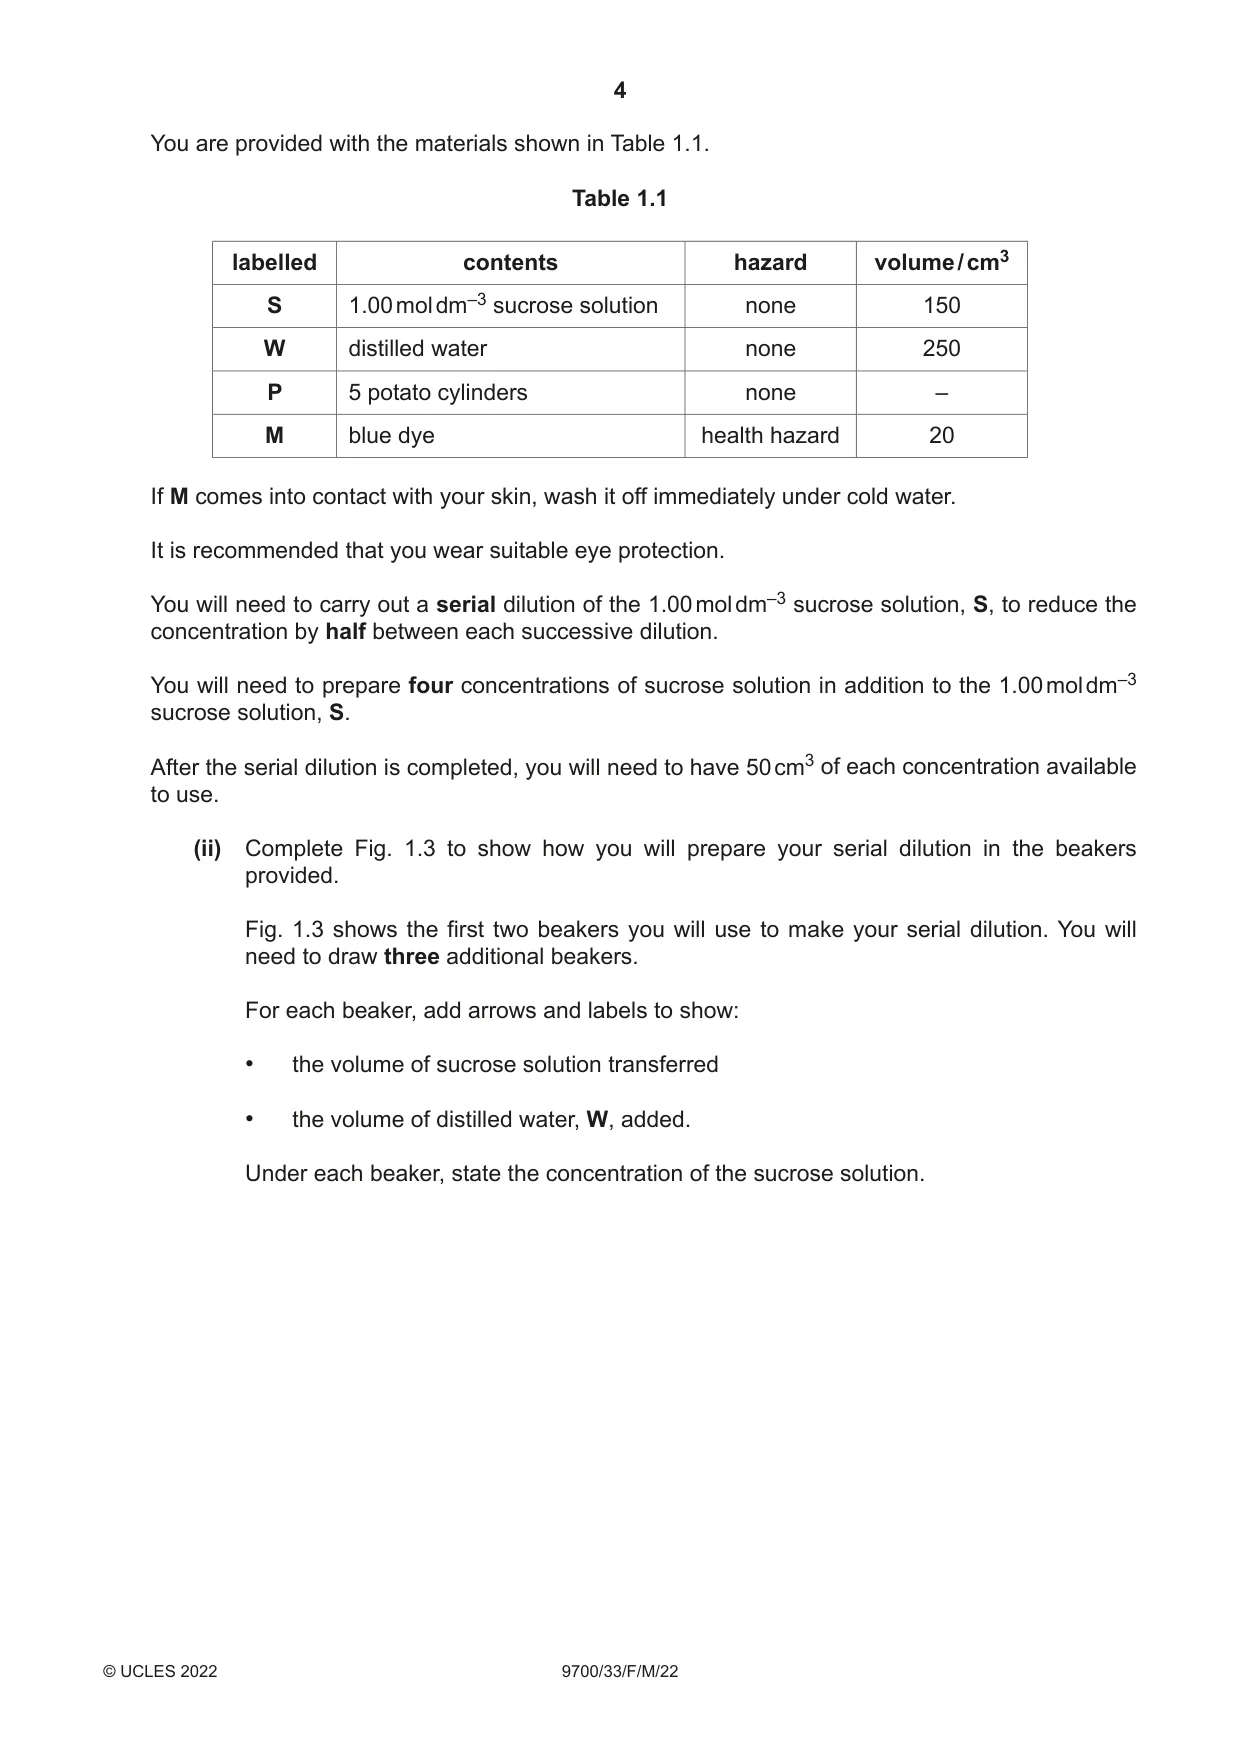
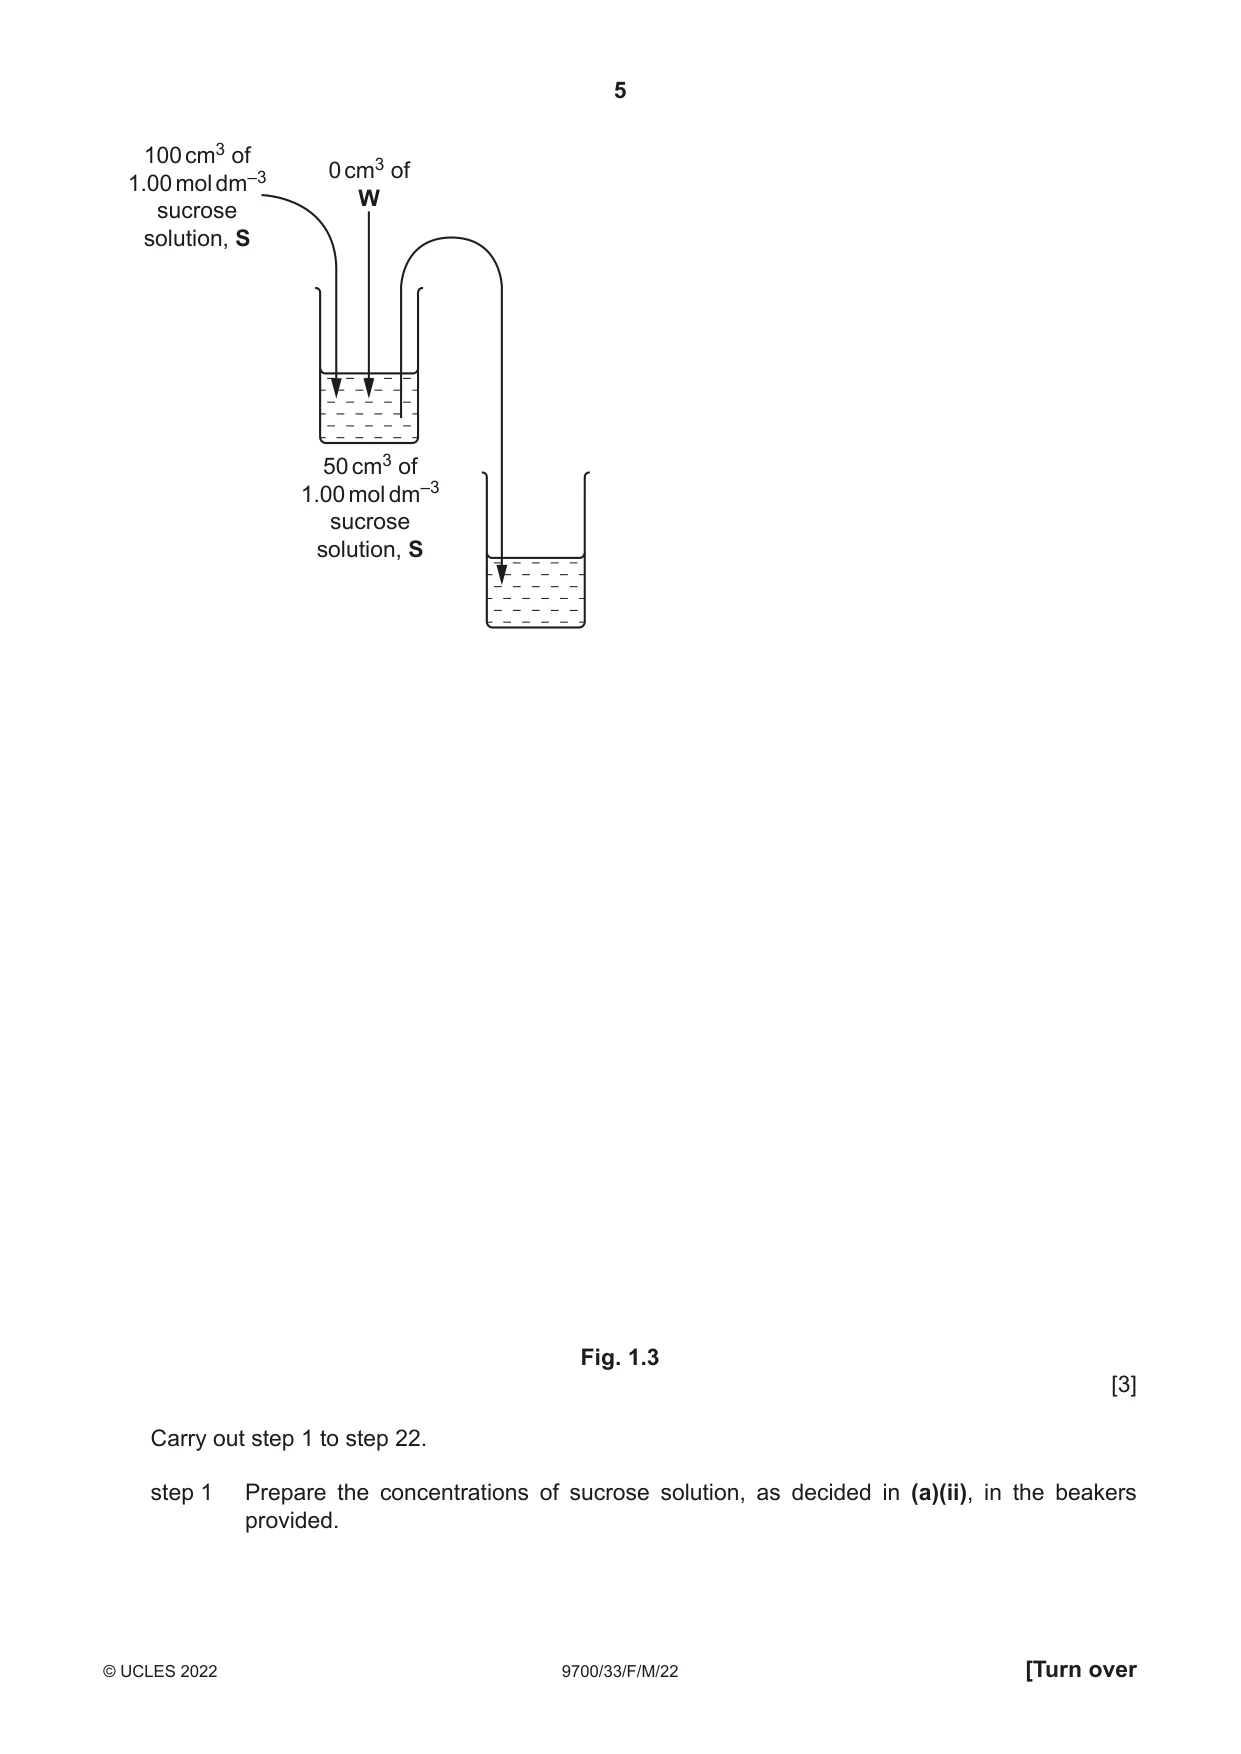
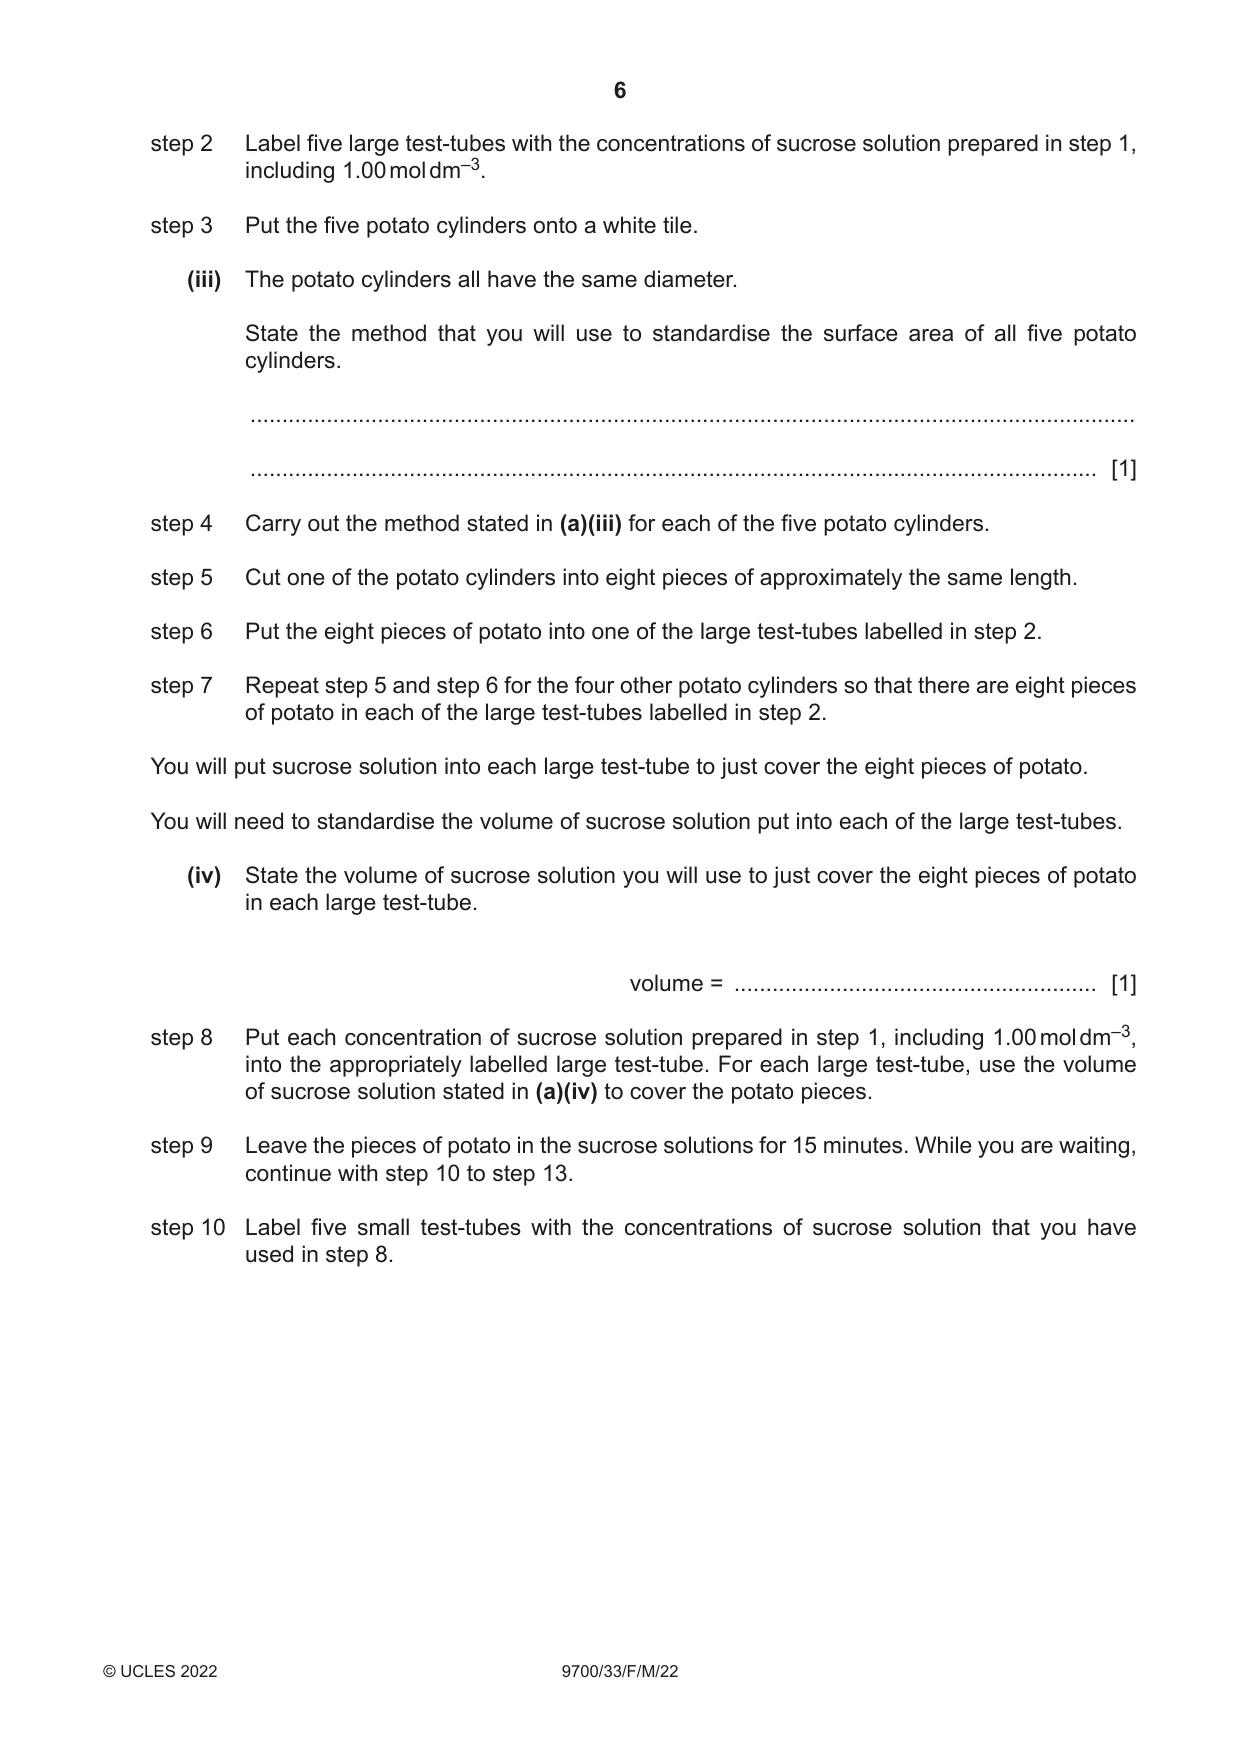
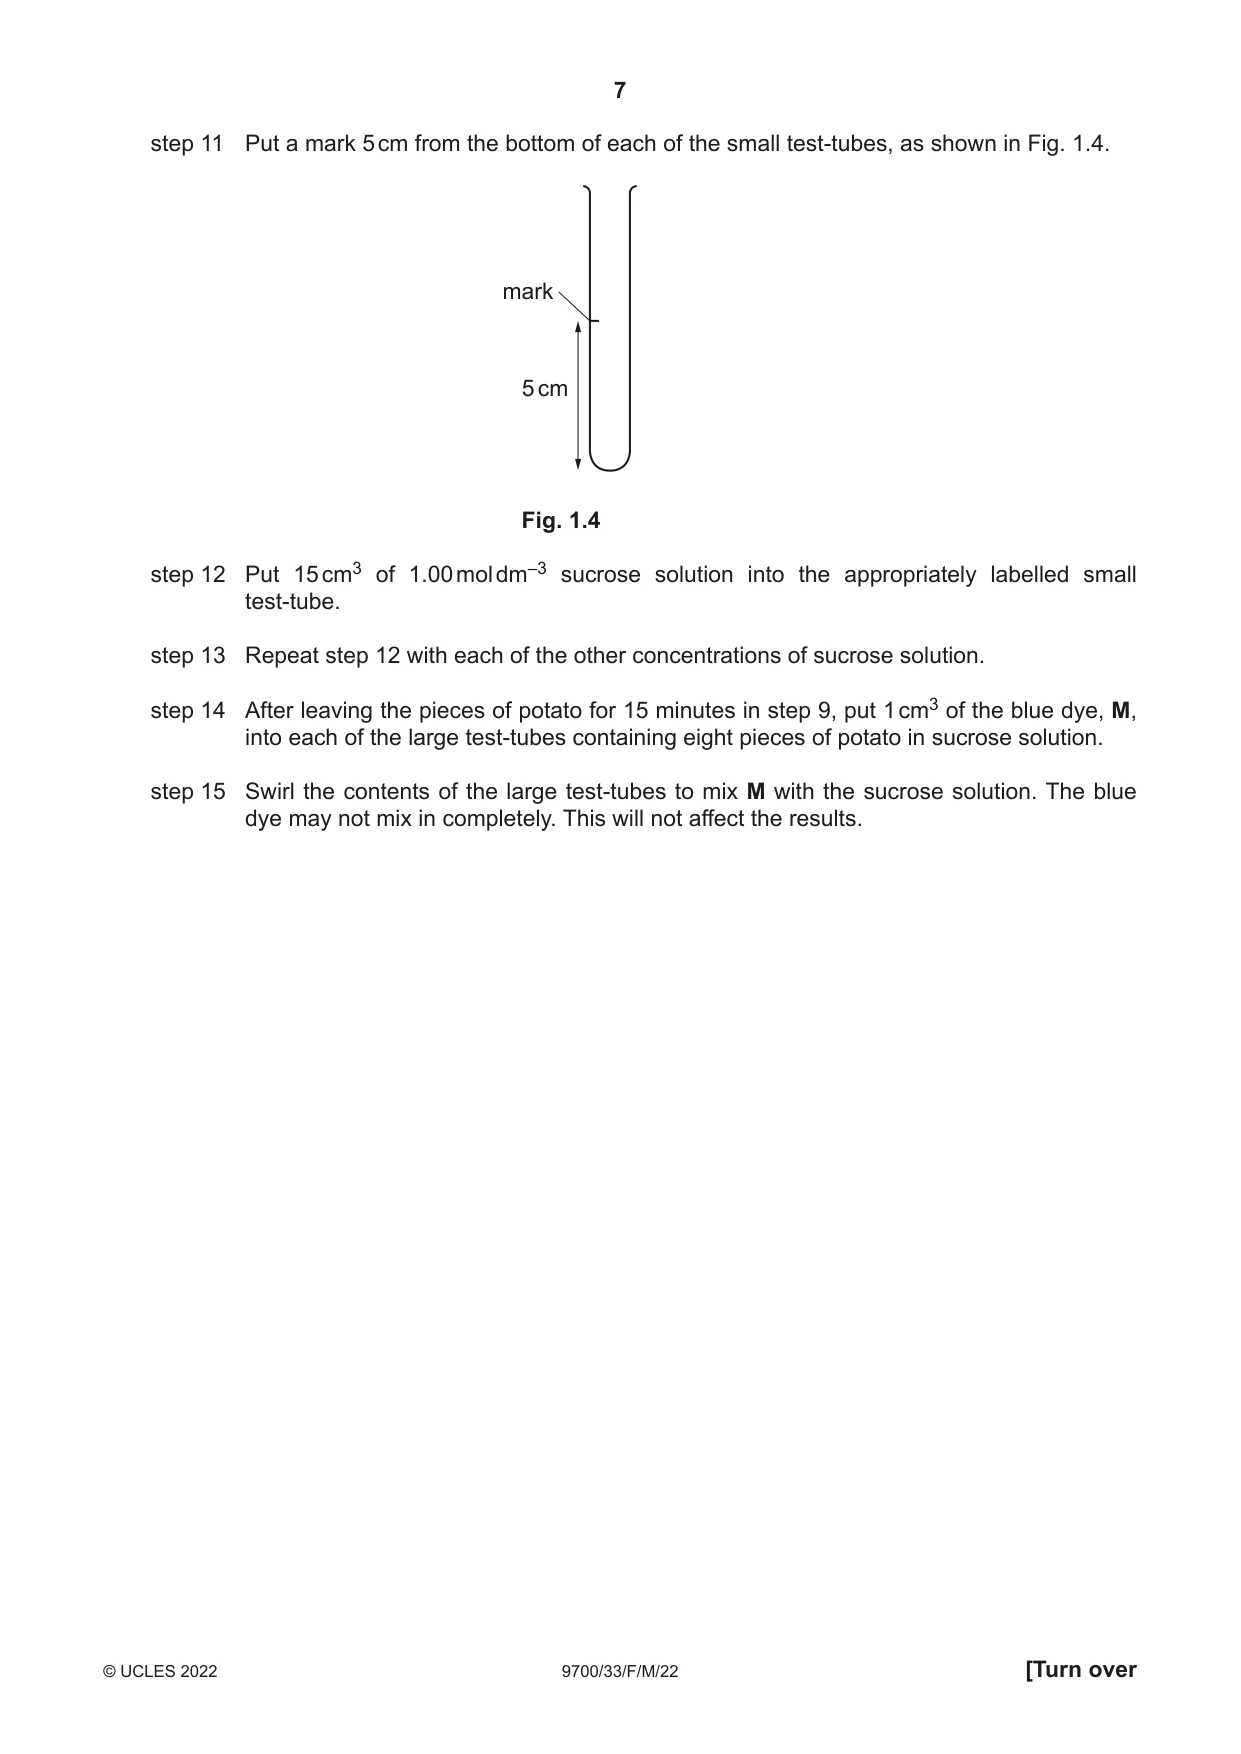
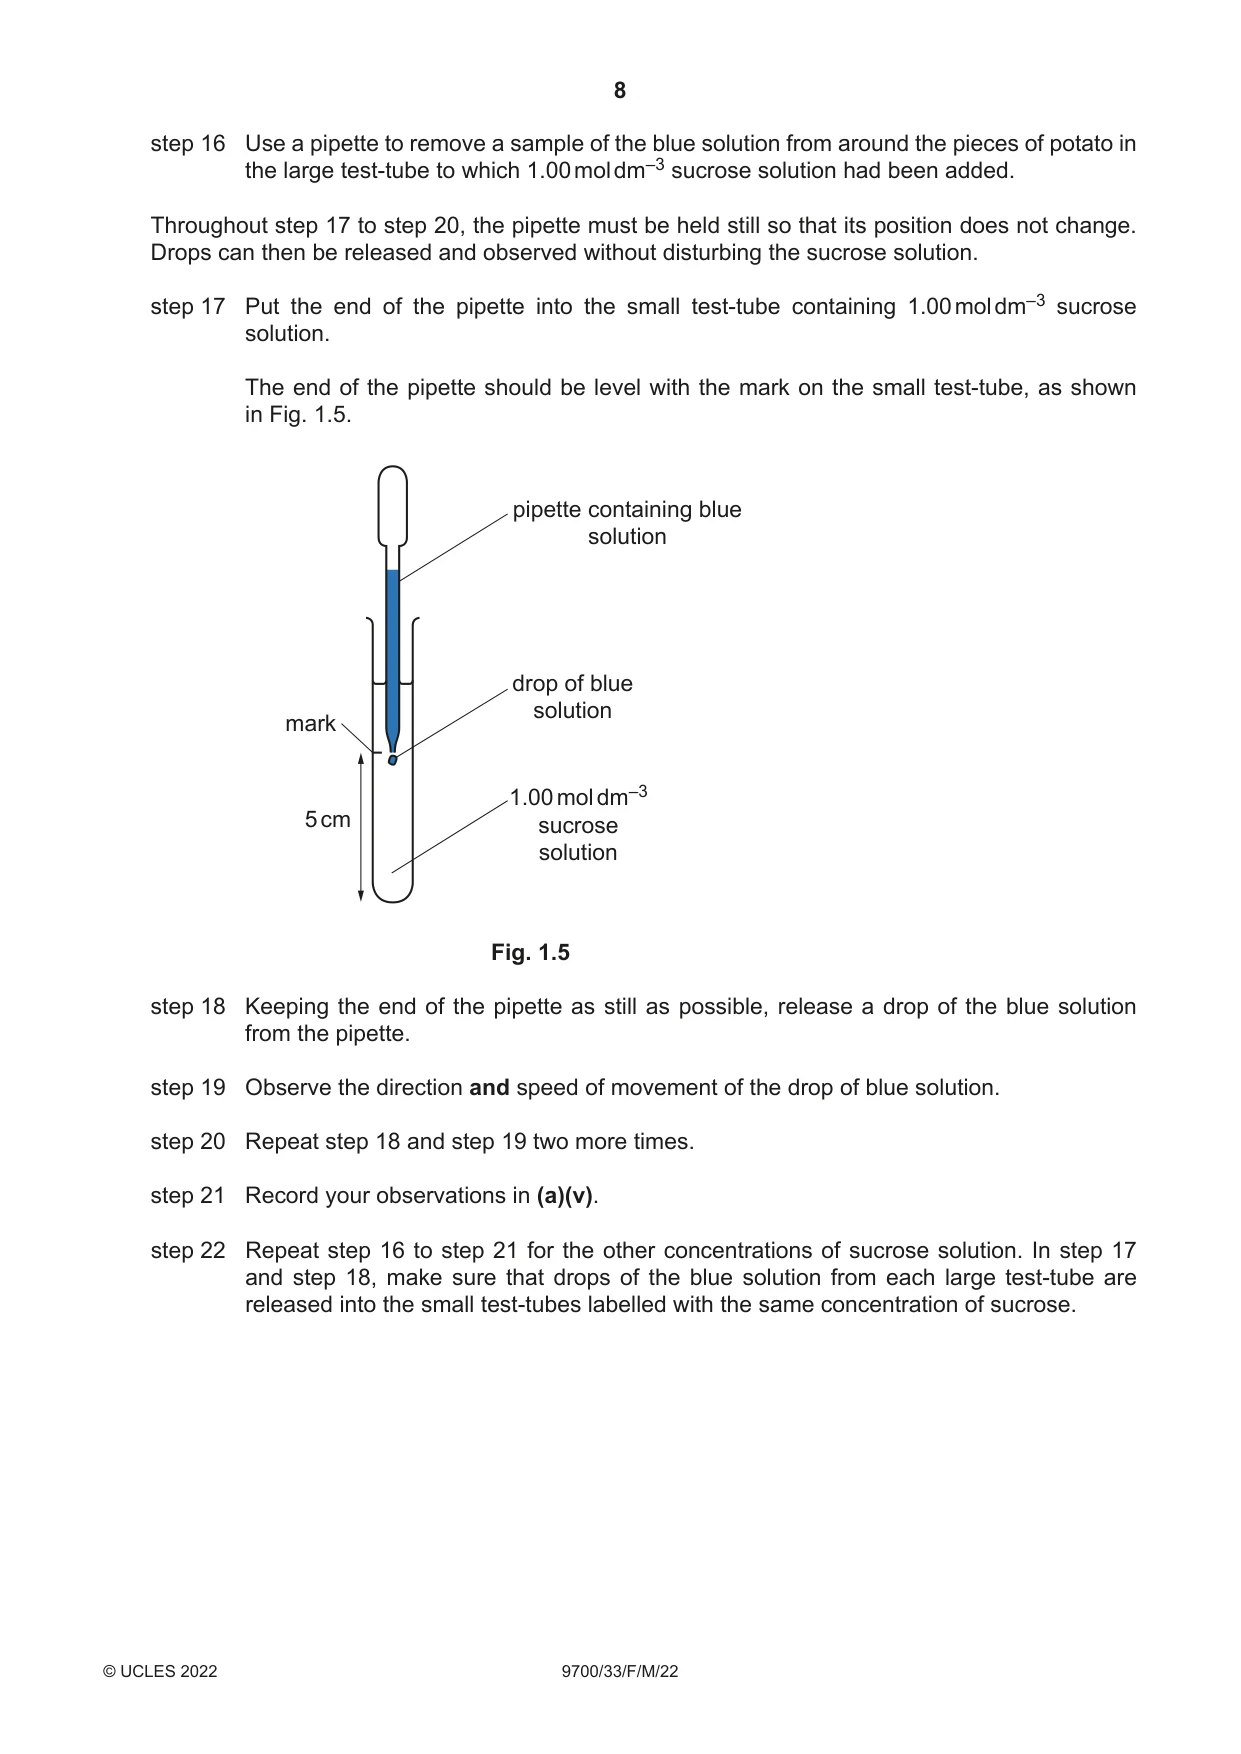
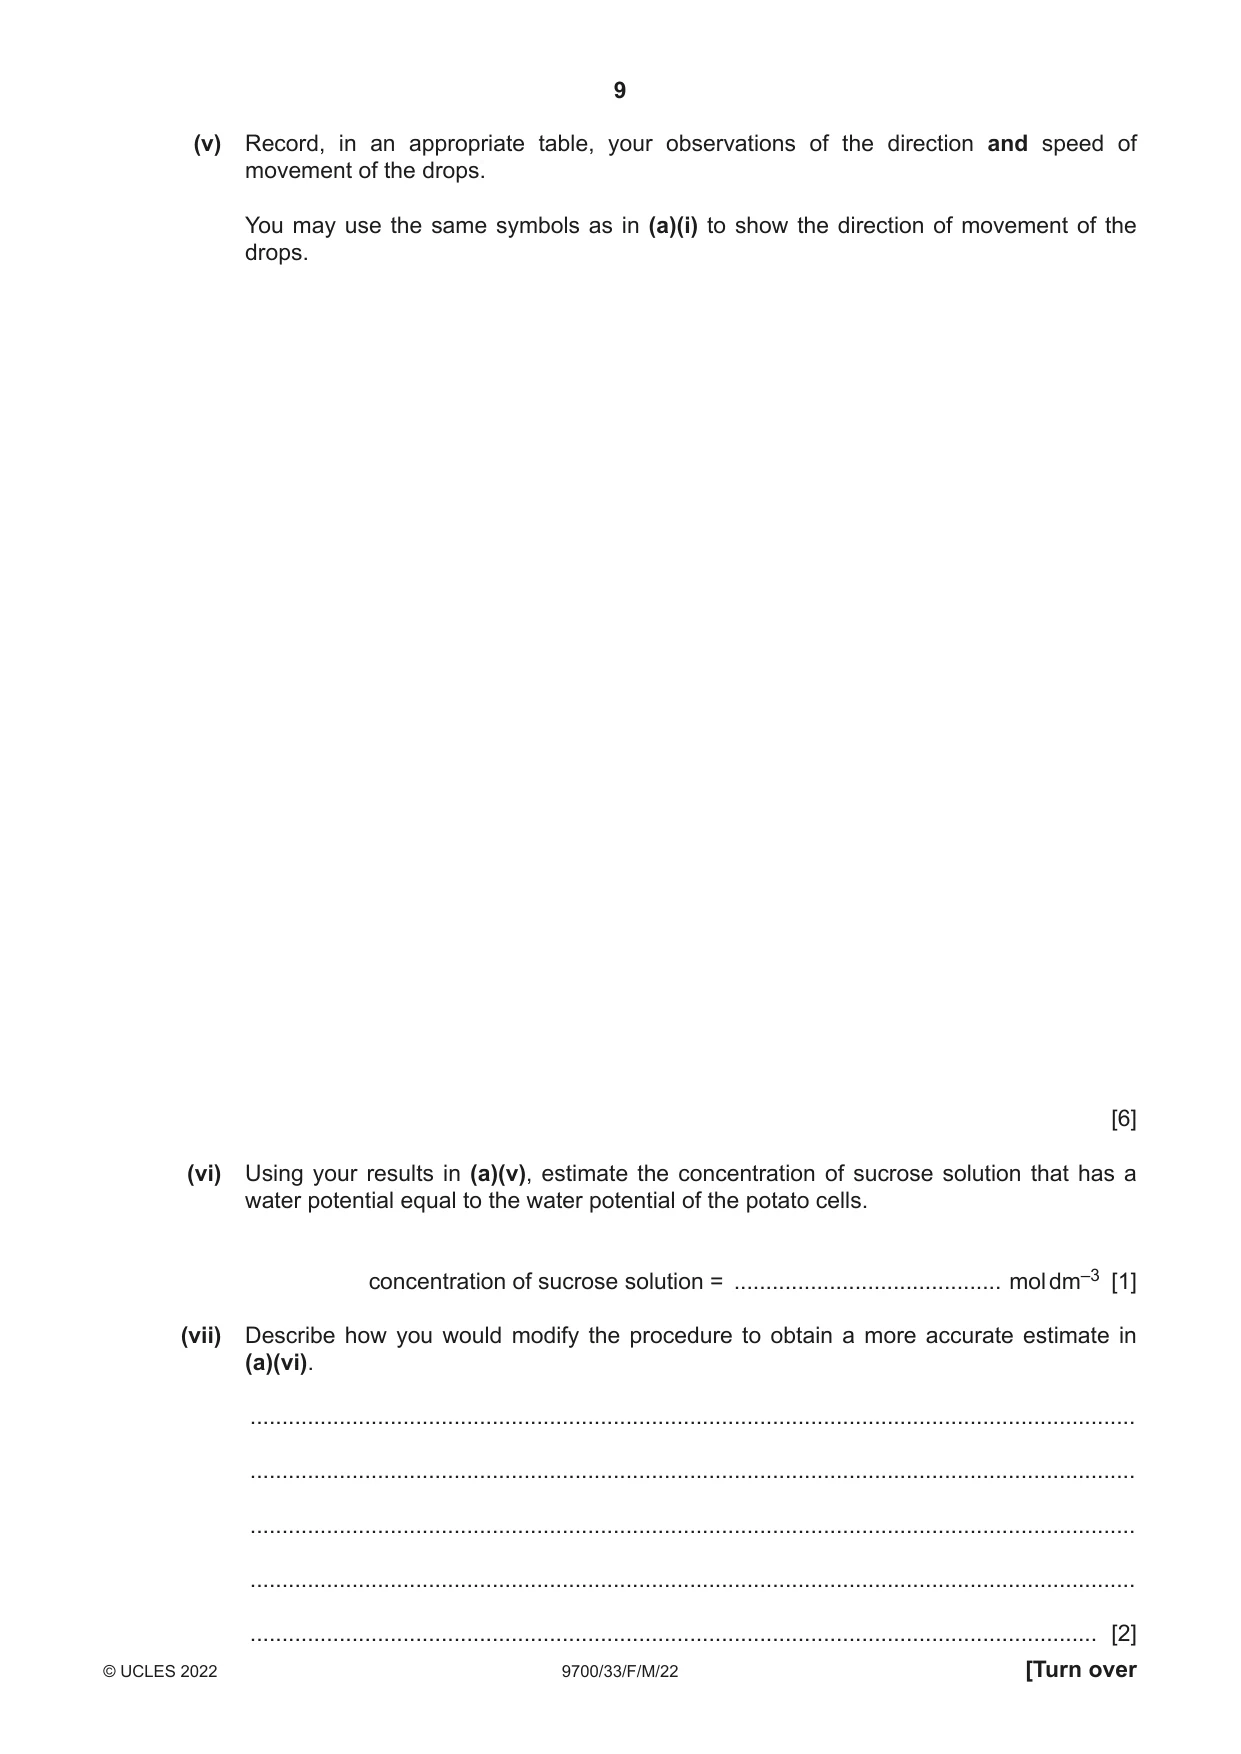
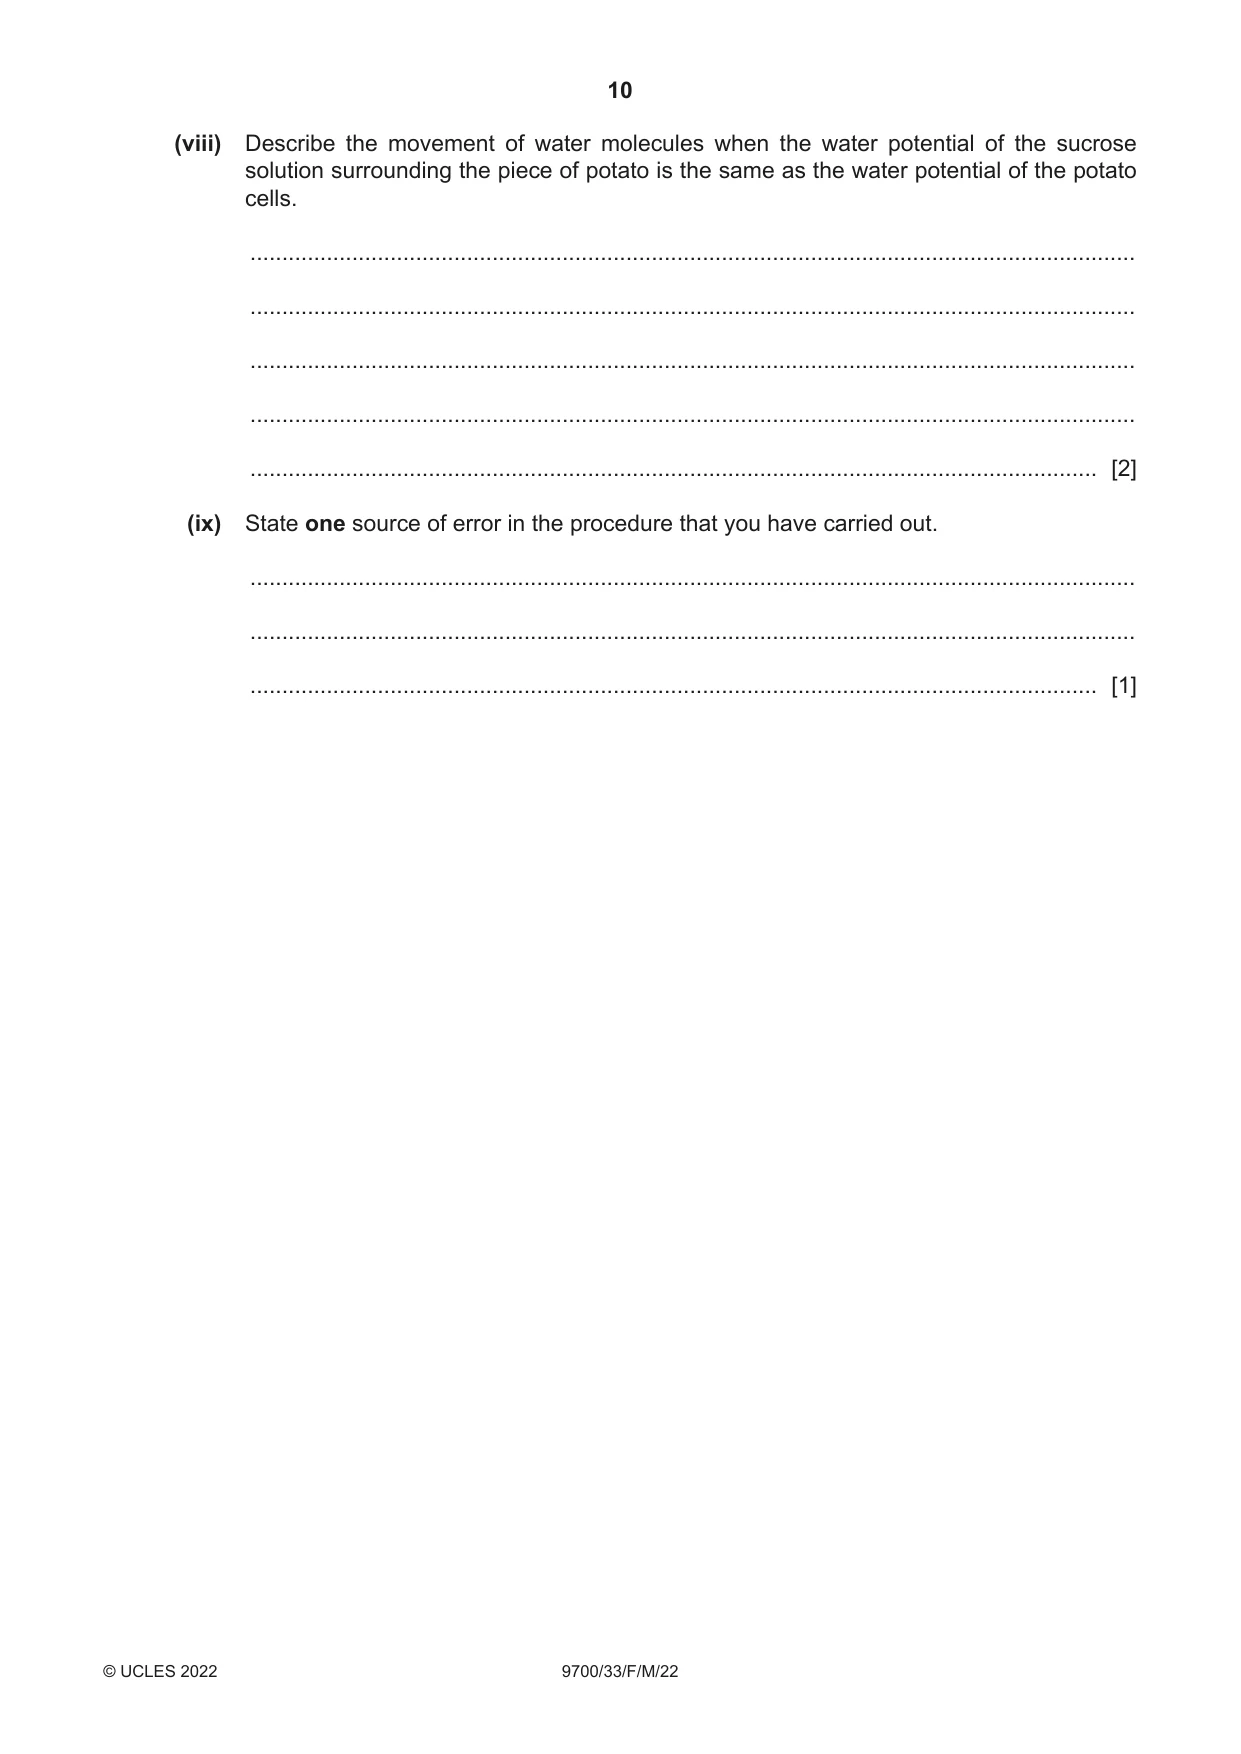
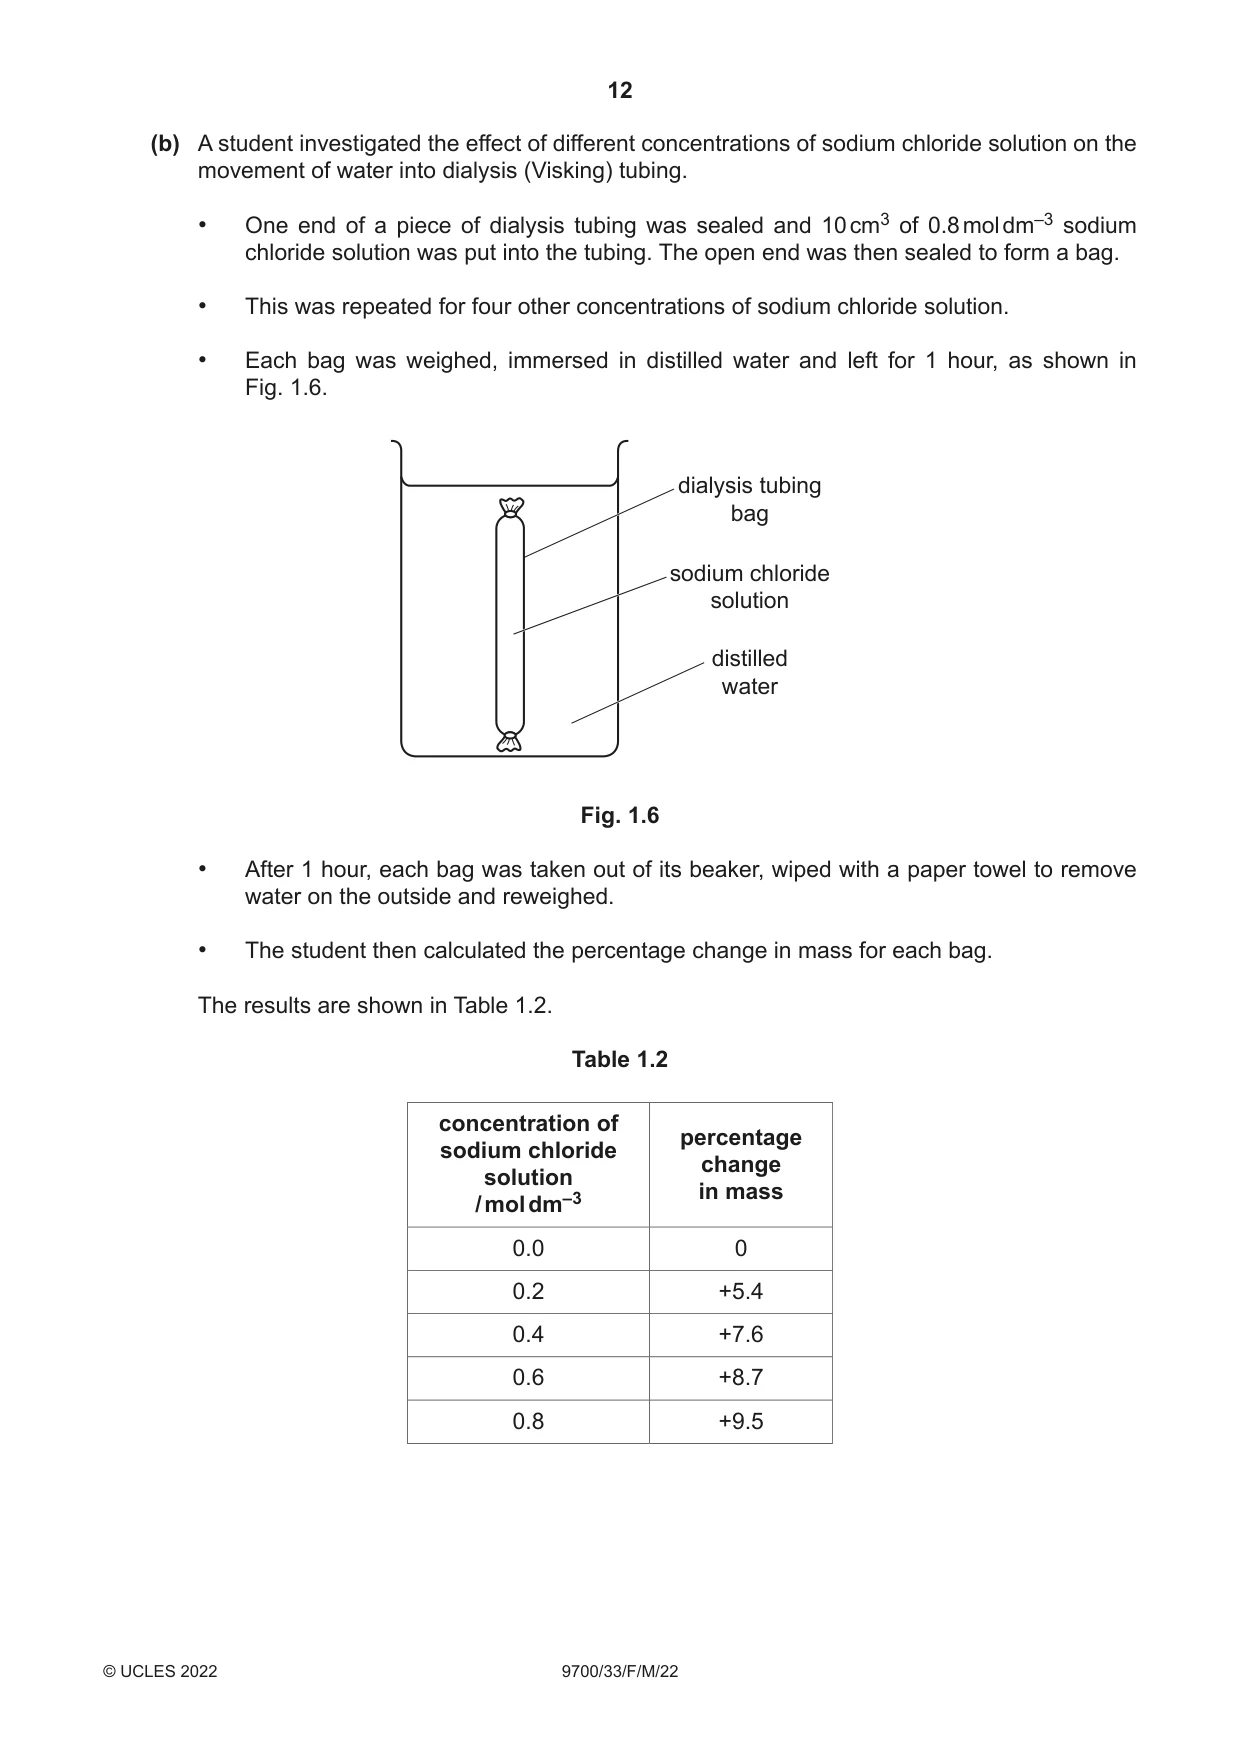
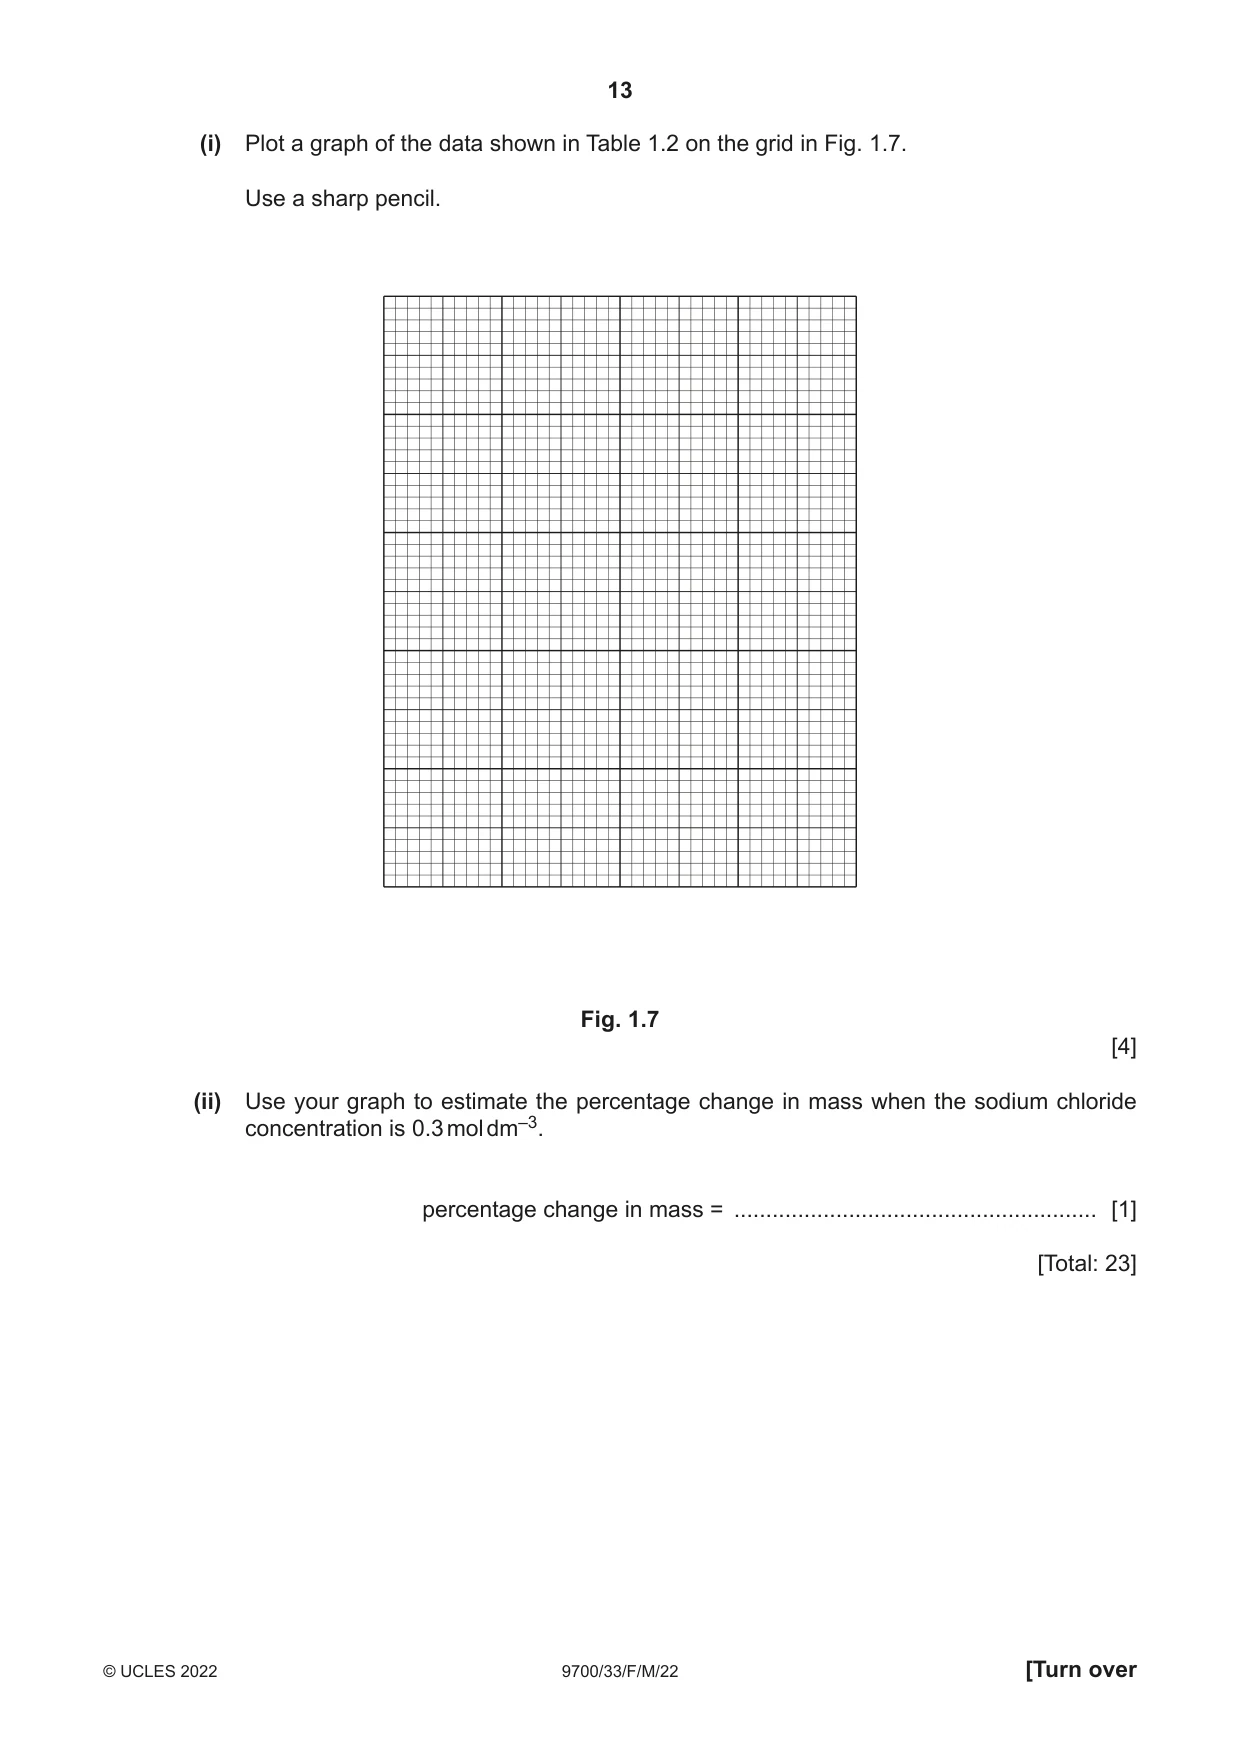
1 You will investigate the water potential of potato cells. When pieces of potato are put into a sucrose solution, water will move by osmosis into and out of the potato cells. The overall direction of water movement depends on the difference between the water potential of the potato cells and the water potential of the sucrose solution. • If the overall movement of water is out of the potato cells, the sucrose solution will become less concentrated. • If the overall movement of water is into the potato cells, the sucrose solution will become more concentrated. Fig. 1.1 shows how the change in concentration of the sucrose solution after 15 minutes can be assessed. A blue dye is added to the sucrose solution around the potato pieces at the end of the 15 minutes. The blue dye does not affect the concentration of the sucrose solution. After mixing, a drop of the blue sucrose solution is added to the original sucrose solution in a separate test-tube. The movement of the blue drop is then observed. 15 minutes drop of blue original solution put sucrose blue dye into original potato solution added sucrose pieces solution Fig. 1.1 • If the sucrose solution has become less concentrated, then the density of the sucrose solution will have decreased. • If the sucrose solution has become more concentrated, then the density of the sucrose solution will have increased. (a) (i) When two solutions of different density are added to one another without mixing, the denser solution will sink to the bottom and the less dense solution will rise to the top. Complete Fig. 1.2 by drawing an arrow on each test-tube, as shown in the key, to predict how you expect the drop of blue solution to move. drop of blue solution is drop of blue solution is drop of blue solution is the less concentrated than more concentrated than same concentration as the the concentration of the the concentration of the concentration of the original sucrose solution original sucrose solution original sucrose solution original original original sucrose sucrose sucrose solution solution solution key: drop of blue solution moves up drop of blue solution moves down drop of blue solution remains at the same level Fig. 1.2 [1] You are provided with the materials shown in Table 1.1. Table 1.1 labelled contents hazard volume / cm3 S 1.00 mol dm–3 sucrose solution none 150 W distilled water none 250 P 5 potato cylinders none – M blue dye health hazard 20 If M comes into contact with your skin, wash it off immediately under cold water. It is recommended that you wear suitable eye protection. You will need to carry out a serial dilution of the 1.00 mol dm–3 sucrose solution, S, to reduce the concentration by half between each successive dilution. You will need to prepare four concentrations of sucrose solution in addition to the 1.00 mol dm–3 sucrose solution, S. After the serial dilution is completed, you will need to have 50 cm3 of each concentration available to use. (ii) Complete Fig. 1.3 to show how you will prepare your serial dilution in the beakers provided. Fig. 1.3 shows the first two beakers you will use to make your serial dilution. You will need to draw three additional beakers. For each beaker, add arrows and labels to show: • the volume of sucrose solution transferred • the volume of distilled water, W, added. Under each beaker, state the concentration of the sucrose solution. 100 cm3 of 0 cm3 of1.00 mol dm–3 W sucrose solution, S 50 cm3 of 1.00 mol dm–3 sucrose solution, S Fig. 1.3 [3] Carry out step 1 to step 22. step 1 Prepare the concentrations of sucrose solution, as decided in (a)(ii), in the beakers provided. step 2 Label five large test-tubes with the concentrations of sucrose solution prepared in step 1, including 1.00 mol dm–3. step 3 Put the five potato cylinders onto a white tile. (iii) The potato cylinders all have the same diameter. State the method that you will use to standardise the surface area of all five potato cylinders. ........................................................................................................................................... ..................................................................................................................................... [1] step 4 Carry out the method stated in (a)(iii) for each of the five potato cylinders. step 5 Cut one of the potato cylinders into eight pieces of approximately the same length. step 6 Put the eight pieces of potato into one of the large test-tubes labelled in step 2. step 7 Repeat step 5 and step 6 for the four other potato cylinders so that there are eight pieces of potato in each of the large test-tubes labelled in step 2. You will put sucrose solution into each large test-tube to just cover the eight pieces of potato. You will need to standardise the volume of sucrose solution put into each of the large test-tubes. (iv) State the volume of sucrose solution you will use to just cover the eight pieces of potato in each large test-tube. volume = ......................................................... [1] step 8 Put each concentration of sucrose solution prepared in step 1, including 1.00 mol dm–3, into the appropriately labelled large test-tube. For each large test-tube, use the volume of sucrose solution stated in (a)(iv) to cover the potato pieces. step 9 Leave the pieces of potato in the sucrose solutions for 15 minutes. While you are waiting, continue with step 10 to step 13. step 10 Label five small test-tubes with the concentrations of sucrose solution that you have used in step 8. step 11 Put a mark 5 cm from the bottom of each of the small test-tubes, as shown in Fig. 1.4. mark 5 cm Fig. 1.4 step 12 Put 15 cm3 of 1.00 mol dm–3 sucrose solution into the appropriately labelled small test-tube. step 13 Repeat step 12 with each of the other concentrations of sucrose solution. step 14 After leaving the pieces of potato for 15 minutes in step 9, put 1 cm3 of the blue dye, M, into each of the large test-tubes containing eight pieces of potato in sucrose solution. step 15 Swirl the contents of the large test-tubes to mix M with the sucrose solution. The blue dye may not mix in completely. This will not affect the results. step 16 Use a pipette to remove a sample of the blue solution from around the pieces of potato in the large test-tube to which 1.00 mol dm–3 sucrose solution had been added. Throughout step 17 to step 20, the pipette must be held still so that its position does not change. Drops can then be released and observed without disturbing the sucrose solution. step 17 Put the end of the pipette into the small test-tube containing 1.00 mol dm–3 sucrose solution. The end of the pipette should be level with the mark on the small test-tube, as shown in Fig. 1.5. pipette containing blue solution drop of blue solution mark 1.00 mol dm–3 5 cm sucrose solution Fig. 1.5 step 18 Keeping the end of the pipette as still as possible, release a drop of the blue solution from the pipette. step 19 Observe the direction and speed of movement of the drop of blue solution. step 20 Repeat step 18 and step 19 two more times. step 21 Record your observations in (a)(v). step 22 Repeat step 16 to step 21 for the other concentrations of sucrose solution. In step 17 and step 18, make sure that drops of the blue solution from each large test-tube are released into the small test-tubes labelled with the same concentration of sucrose. (v) Record, in an appropriate table, your observations of the direction and speed of movement of the drops. You may use the same symbols as in (a)(i) to show the direction of movement of the drops. [6] (vi) Using your results in (a)(v), estimate the concentration of sucrose solution that has a water potential equal to the water potential of the potato cells. concentration of sucrose solution = .......................................... mol dm–3 [1] (vii) Describe how you would modify the procedure to obtain a more accurate estimate in (a)(vi). ........................................................................................................................................... ........................................................................................................................................... ........................................................................................................................................... ........................................................................................................................................... ..................................................................................................................................... [2] (viii) Describe the movement of water molecules when the water potential of the sucrose solution surrounding the piece of potato is the same as the water potential of the potato cells. ........................................................................................................................................... ........................................................................................................................................... ........................................................................................................................................... ........................................................................................................................................... ..................................................................................................................................... [2] (ix) State one source of error in the procedure that you have carried out. ........................................................................................................................................... ........................................................................................................................................... ..................................................................................................................................... [1] Question 1 continues on page 12 (b) A student investigated the effect of different concentrations of sodium chloride solution on the movement of water into dialysis (Visking) tubing. • One end of a piece of dialysis tubing was sealed and 10 cm3 of 0.8 mol dm–3 sodium chloride solution was put into the tubing. The open end was then sealed to form a bag. • This was repeated for four other concentrations of sodium chloride solution. • Each bag was weighed, immersed in distilled water and left for 1 hour, as shown in Fig. 1.6. dialysis tubing bag sodium chloride solution distilled water Fig. 1.6 • After 1 hour, each bag was taken out of its beaker, wiped with a paper towel to remove water on the outside and reweighed. • The student then calculated the percentage change in mass for each bag. The results are shown in Table 1.2. Table 1.2 concentration of percentage sodium chloride change solution in mass / mol dm–3 0.0 0 0.2 +5.4 0.4 +7.6 0.6 +8.7 0.8 +9.5 (i) Plot a graph of the data shown in Table 1.2 on the grid in Fig. 1.7. Use a sharp pencil. Fig. 1.7 [4] (ii) Use your graph to estimate the percentage change in mass when the sodium chloride concentration is 0.3 mol dm–3. percentage change in mass = ......................................................... [1] [Total: 23]
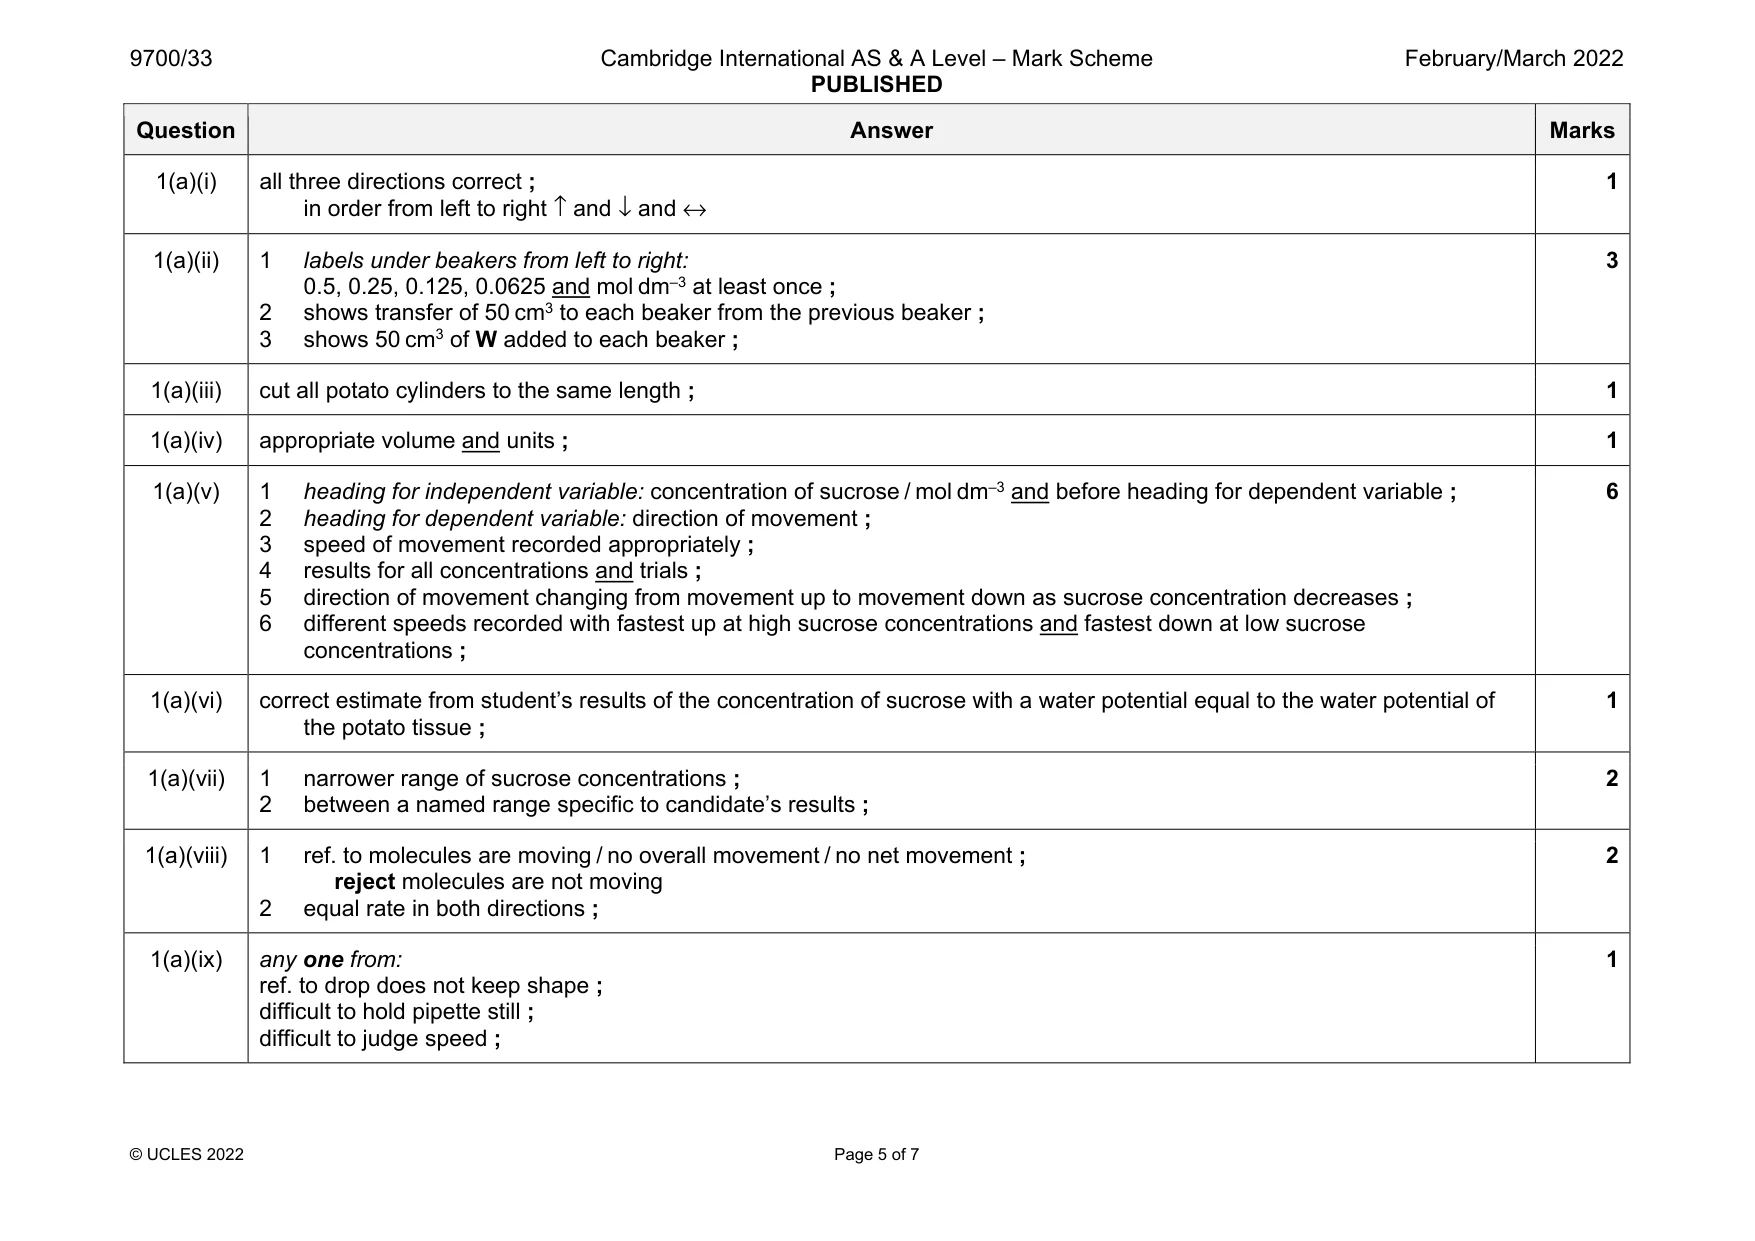
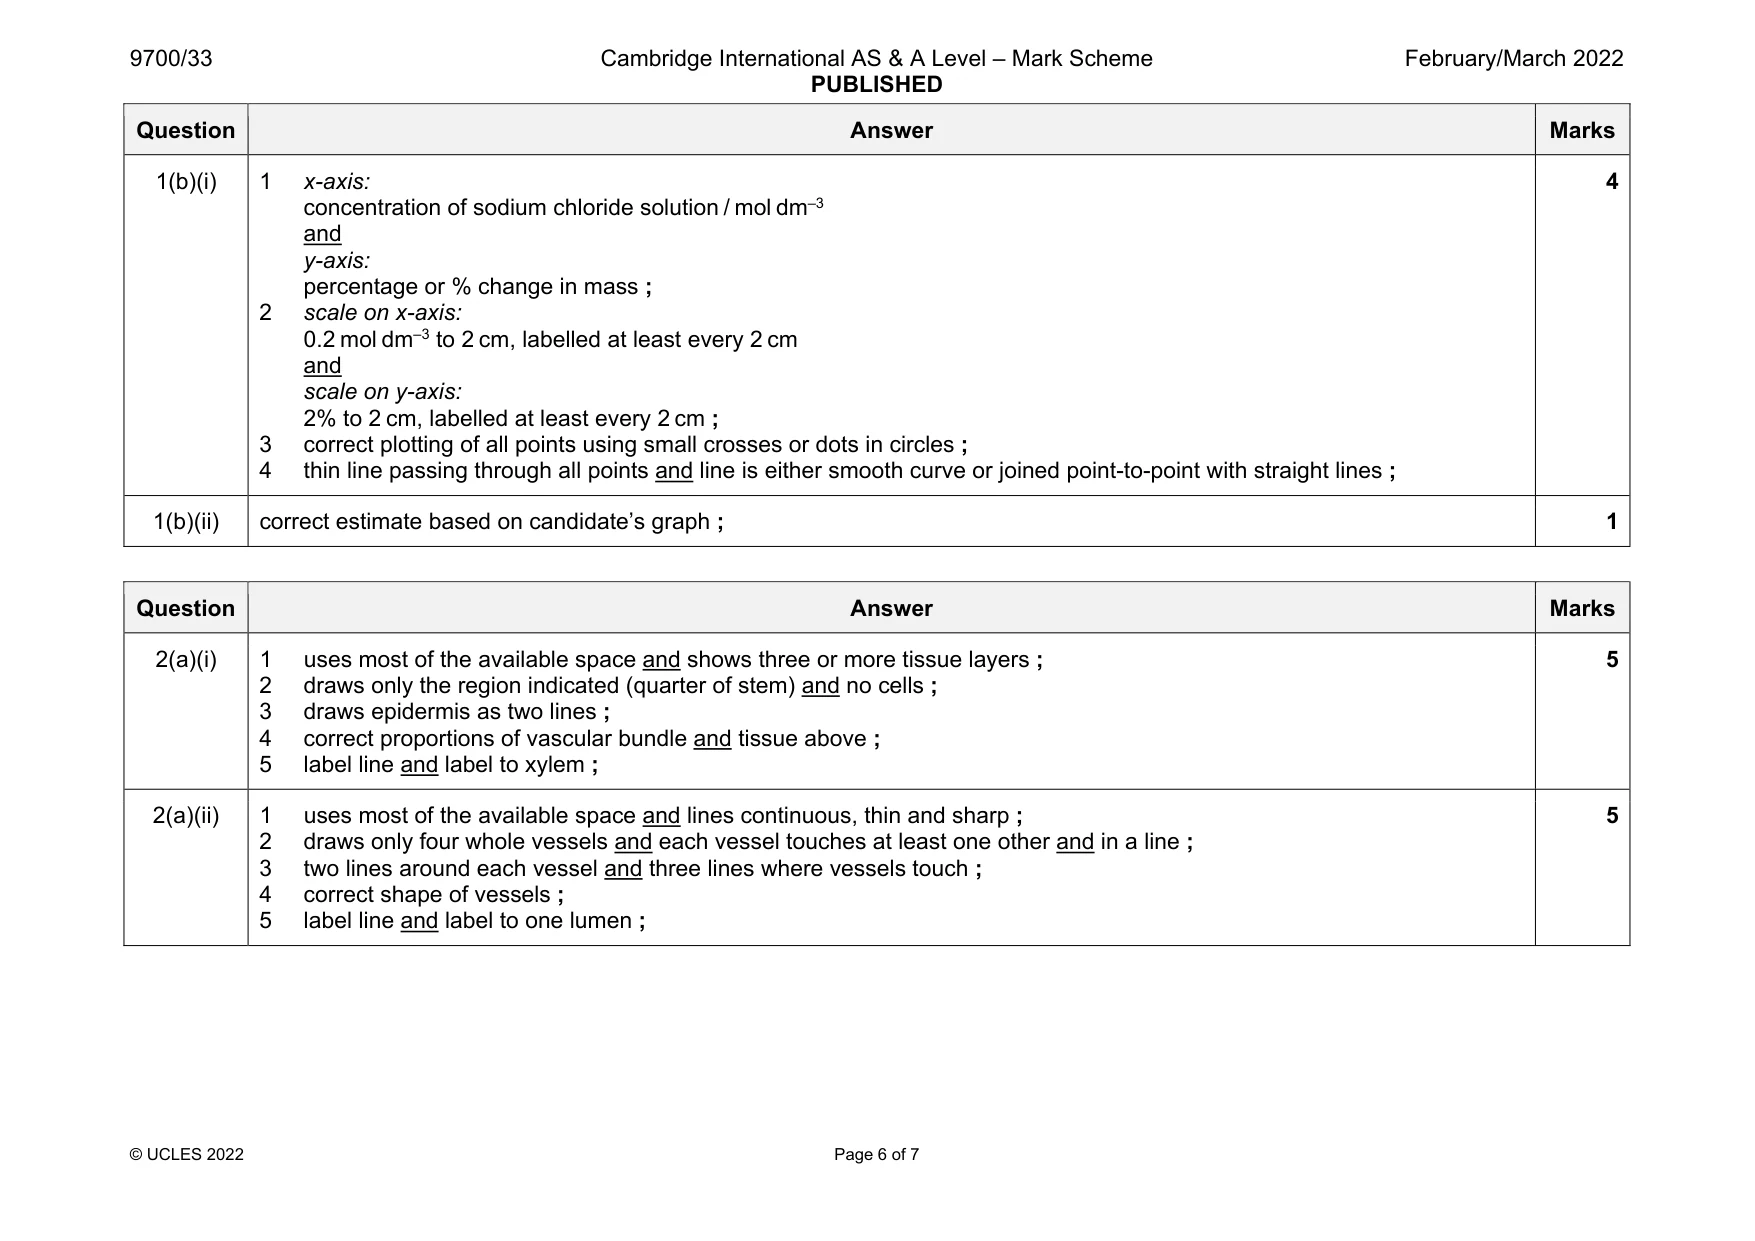
Mark scheme: 1(a)(i) all three directions correct ; in order from left to right ↑ and ↓ and ↔ 1 1(a)(ii) 1 labels under beakers from left to right: 0.5, 0.25, 0.125, 0.0625 and mol dm–3 at least once ; 2 shows transfer of 50 cm3 to each beaker from the previous beaker ; 3 shows 50 cm3 of W added to each beaker ; 3 1(a)(iii) cut all potato cylinders to the same length ; 1 1(a)(iv) appropriate volume and units ; 1 1(a)(v) 1 heading for independent variable: concentration of sucrose / mol dm–3 and before heading for dependent variable ; 2 heading for dependent variable: direction of movement ; 3 speed of movement recorded appropriately ; 4 results for all concentrations and trials ; 5 direction of movement changing from movement up to movement down as sucrose concentration decreases ; 6 different speeds recorded with fastest up at high sucrose concentrations and fastest down at low sucrose concentrations ; 6 1(a)(vi) correct estimate from student’s results of the concentration of sucrose with a water potential equal to the water potential of the potato tissue ; 1 1(a)(vii) 1 narrower range of sucrose concentrations ; 2 between a named range specific to candidate’s results ; 2 1(a)(viii) 1 ref. to molecules are moving / no overall movement / no net movement ; reject molecules are not moving 2 equal rate in both directions ; 2 1(a)(ix) any one from: ref. to drop does not keep shape ; difficult to hold pipette still ; difficult to judge speed ; 1 Question Answer Marks 1(b)(i) 1 x-axis: concentration of sodium chloride solution / mol dm–3 and y-axis: percentage or % change in mass ; 2 scale on x-axis: 0.2 mol dm–3 to 2 cm, labelled at least every 2 cm and scale on y-axis: 2% to 2 cm, labelled at least every 2 cm ; 3 correct plotting of all points using small crosses or dots in circles ; 4 thin line passing through all points and line is either smooth curve or joined point-to-point with straight lines ; 4 1(b)(ii) correct estimate based on candidate’s graph ; 1
Q2 · J1 is a slide of a stained transverse section through a plant stem
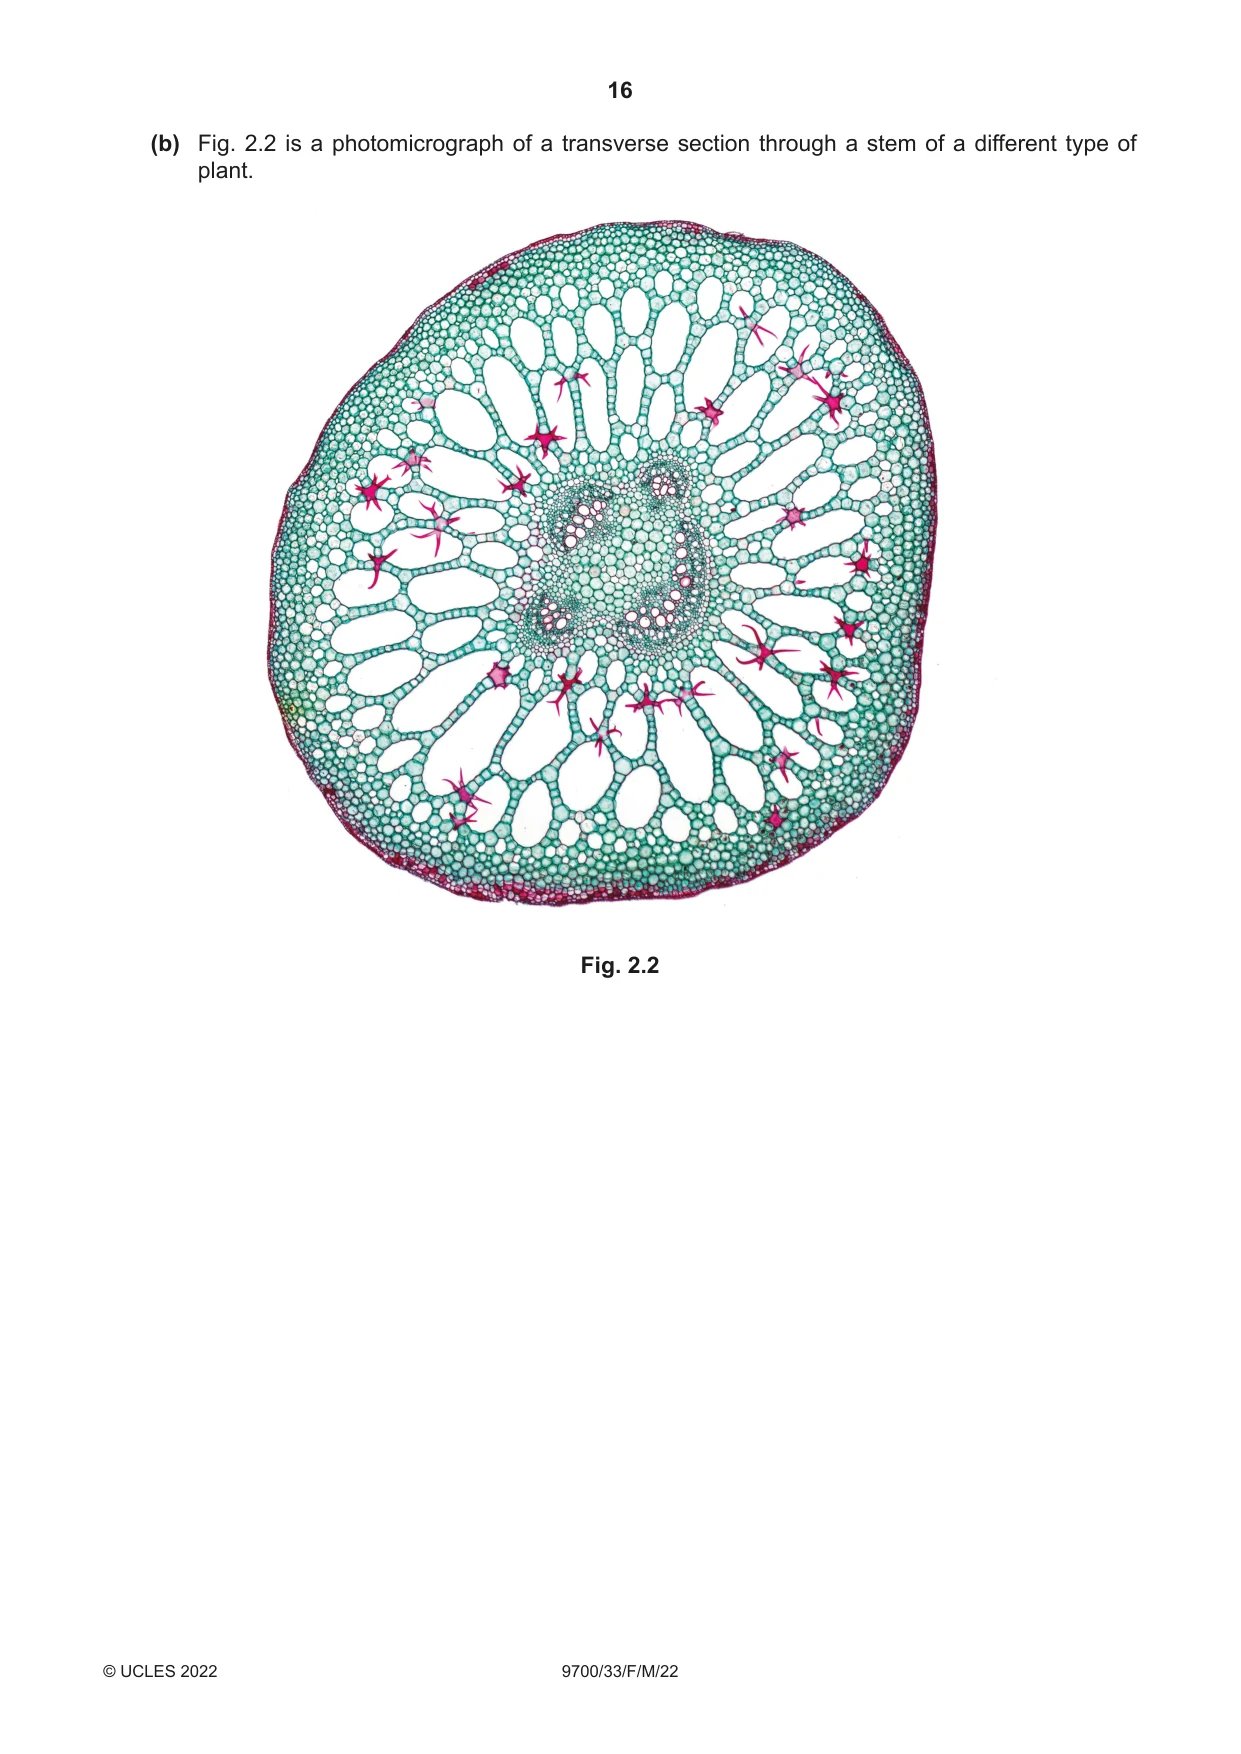
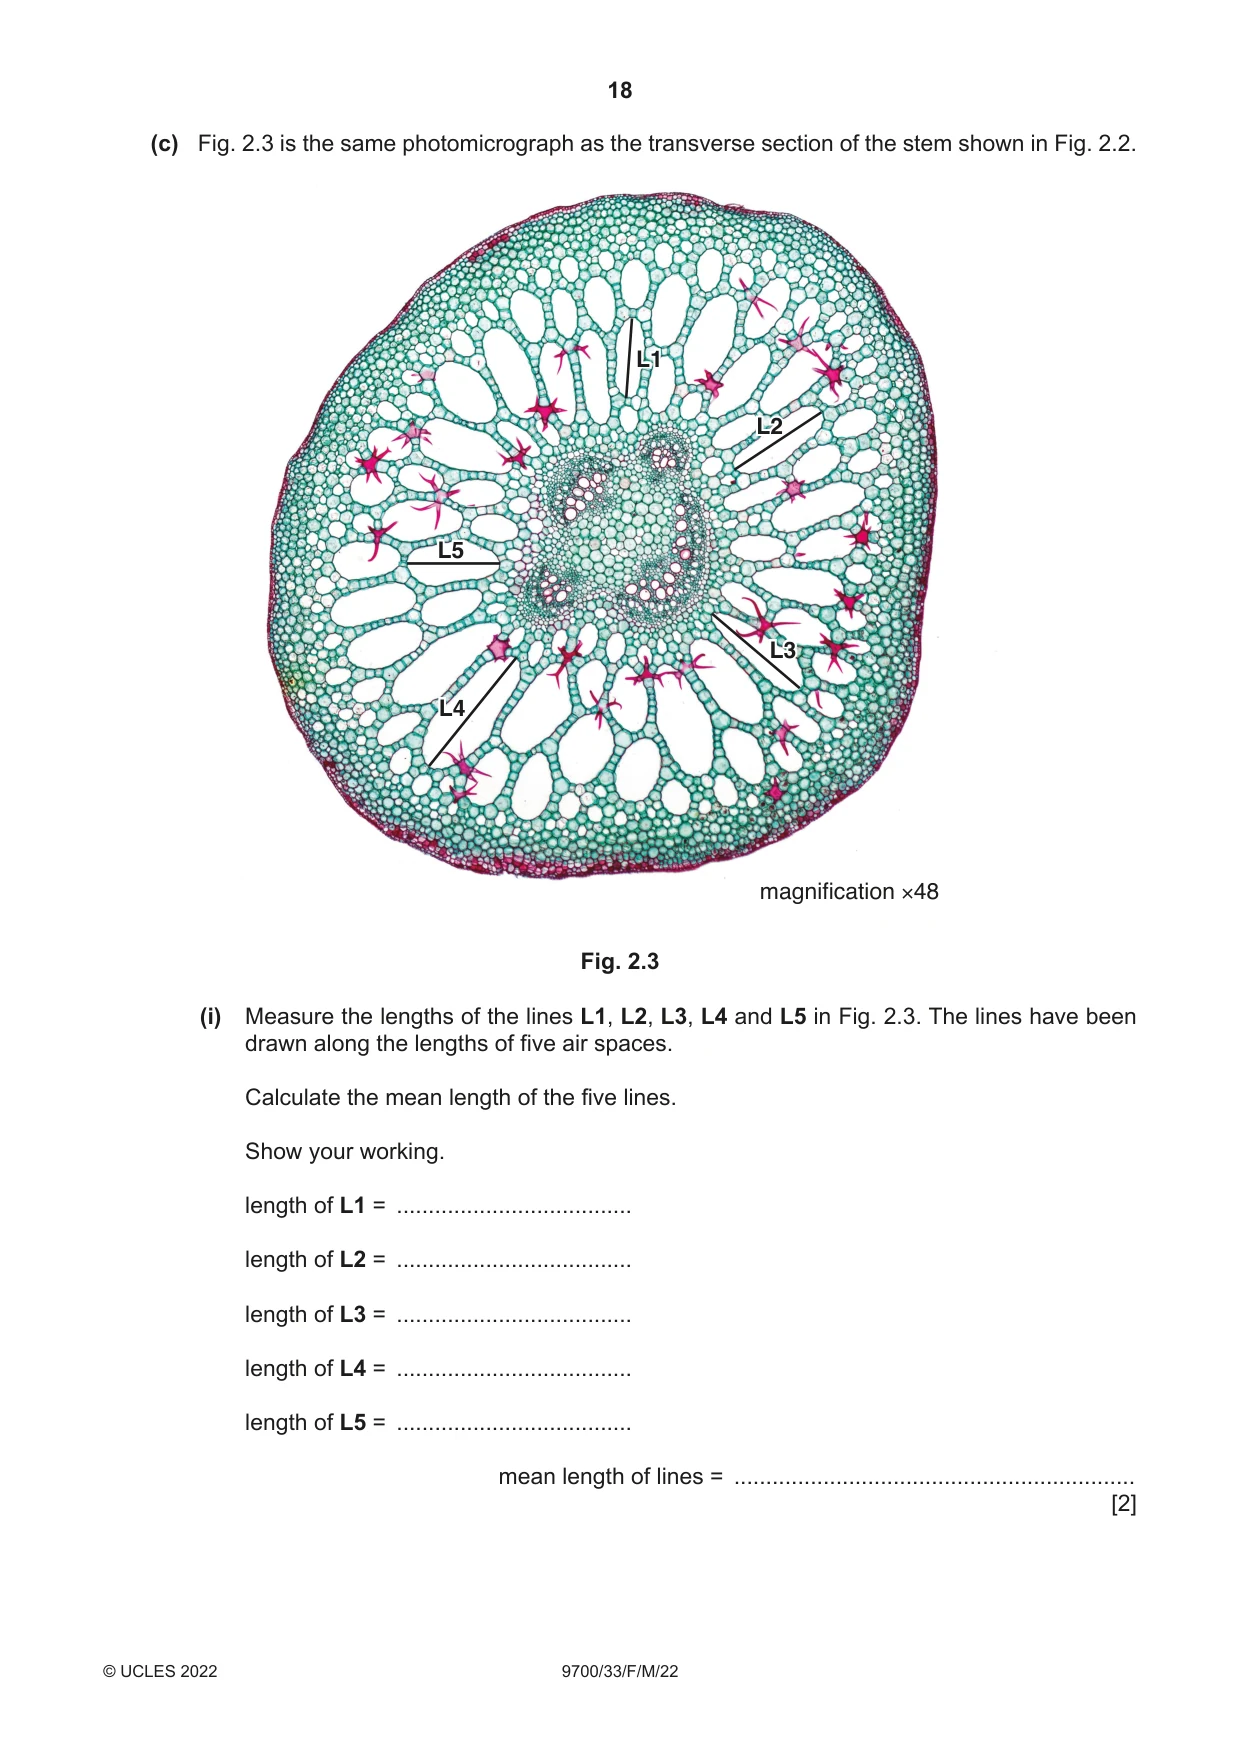
2 J1 is a slide of a stained transverse section through a plant stem. (a) (i) Draw a large plan diagram of the region of the stem on slide J1 indicated by the shaded area in Fig. 2.1. Use a sharp pencil. draw this region Fig. 2.1 Use one ruled label line and label to identify the xylem. [5] (ii) Observe one vascular bundle in the stem on slide J1. Select four adjacent touching xylem vessel elements that are arranged in a line. Each of these four xylem vessel elements must touch at least one other. • Make a large drawing of the line of four xylem vessel elements that you have selected. • Use one ruled label line and label to identify one lumen. [5] (b) Fig. 2.2 is a photomicrograph of a transverse section through a stem of a different type of plant. Fig. 2.2
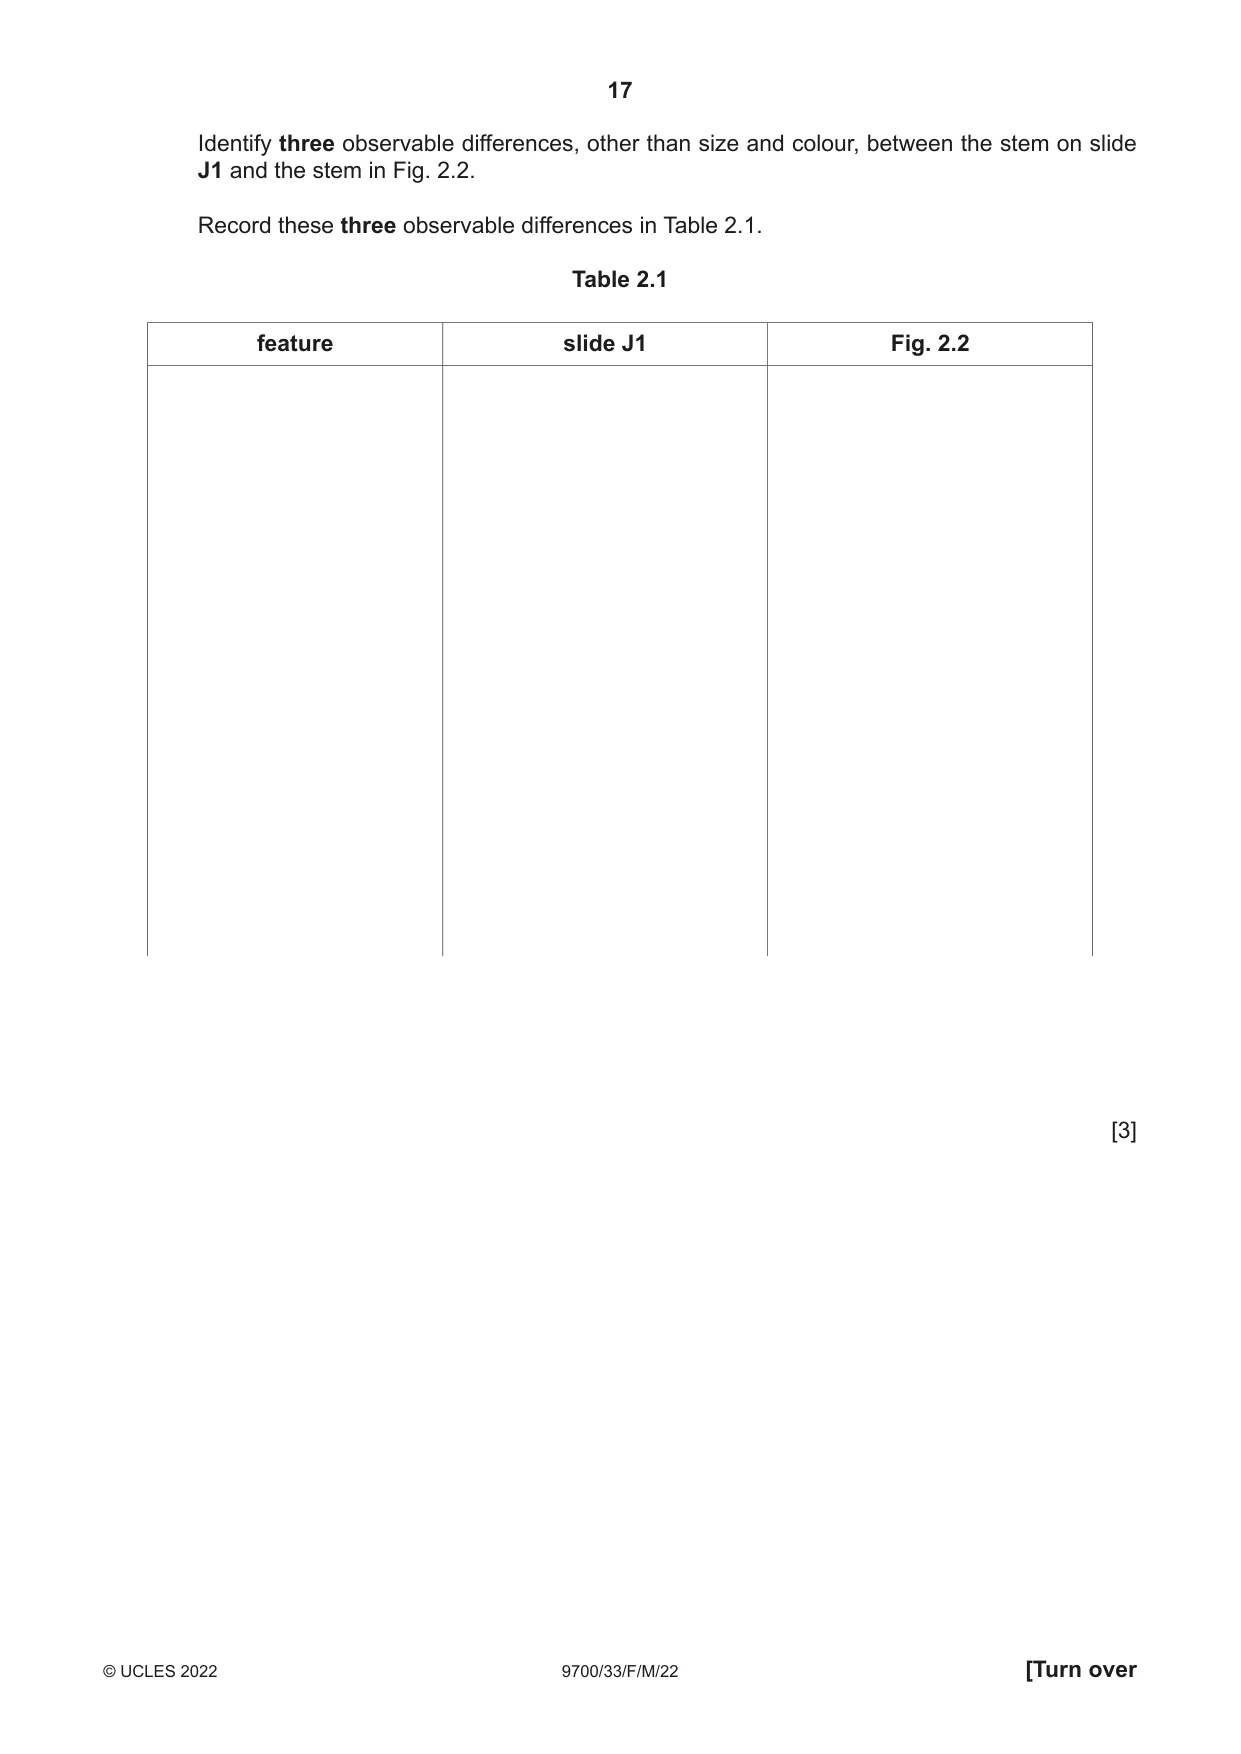
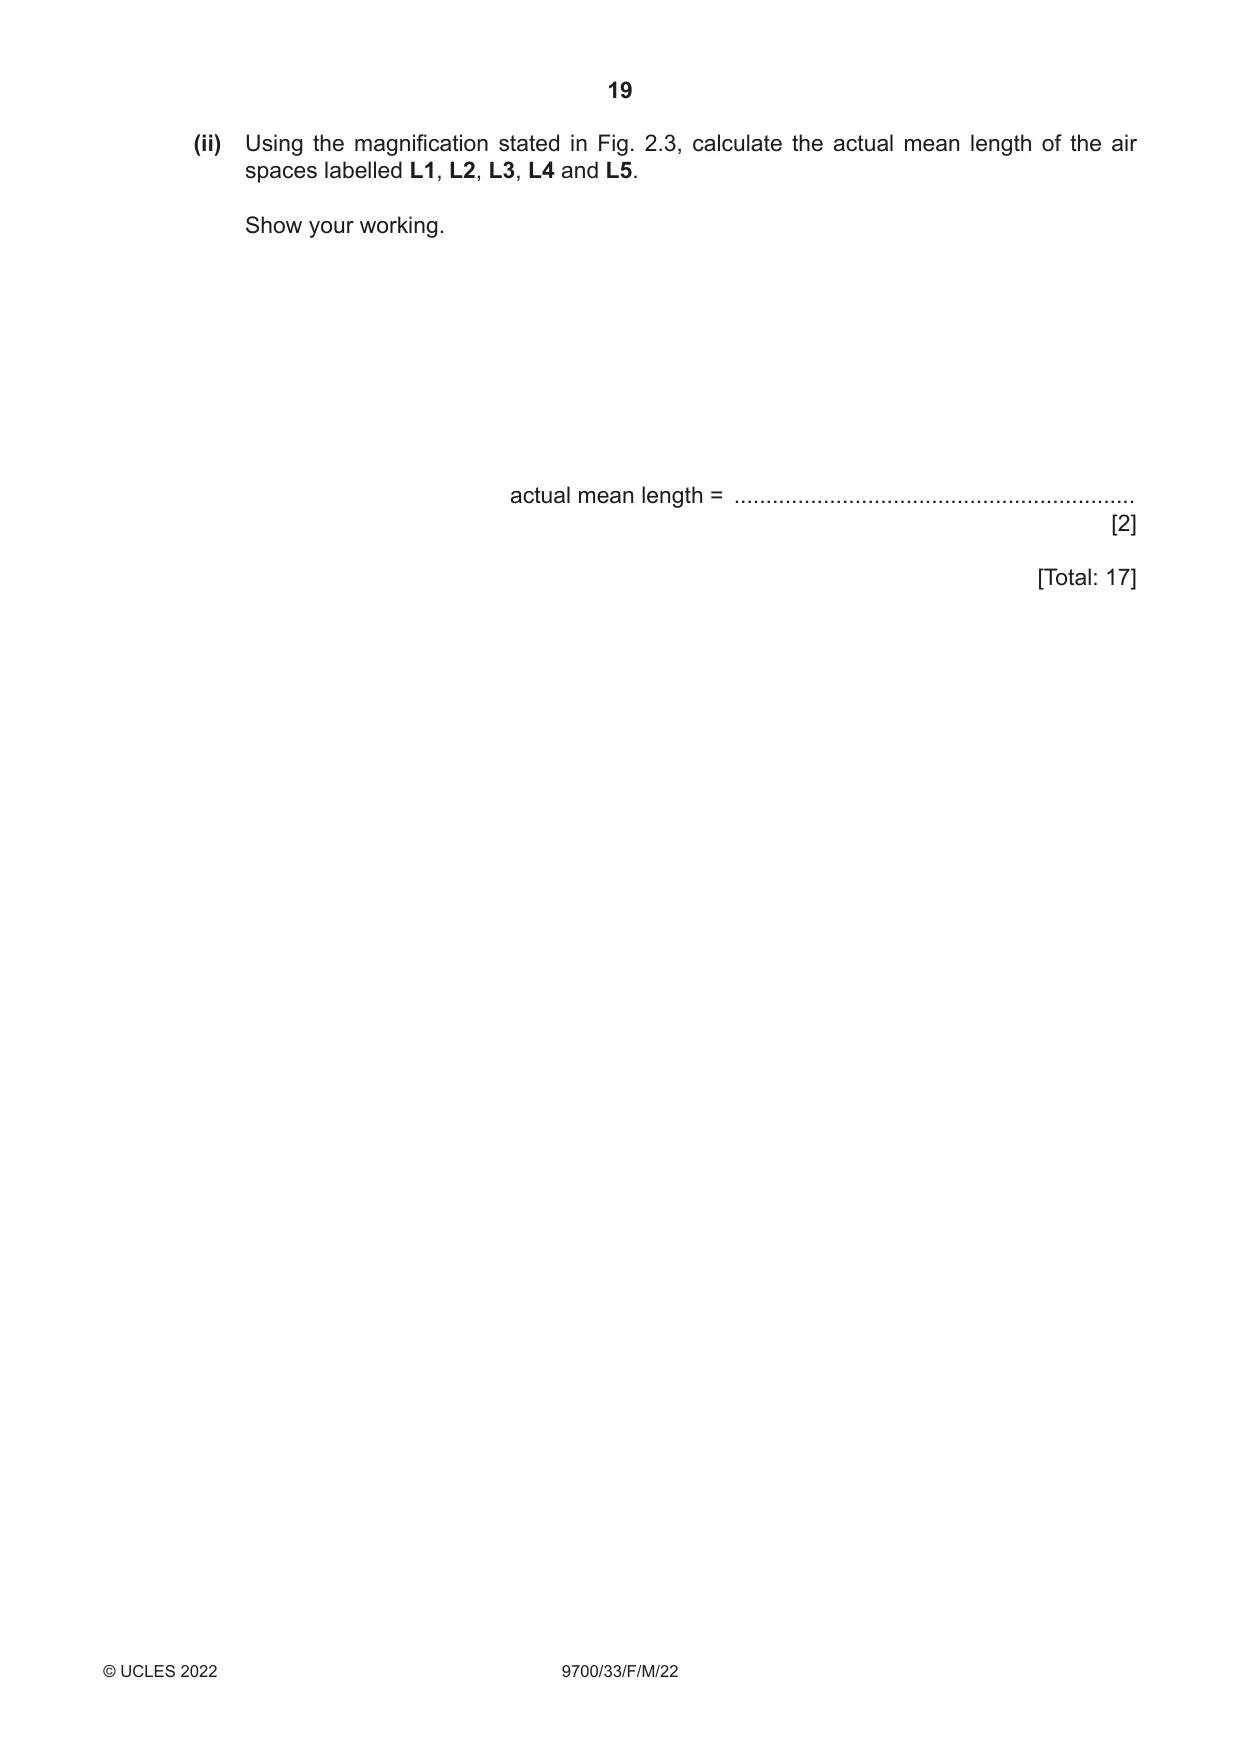
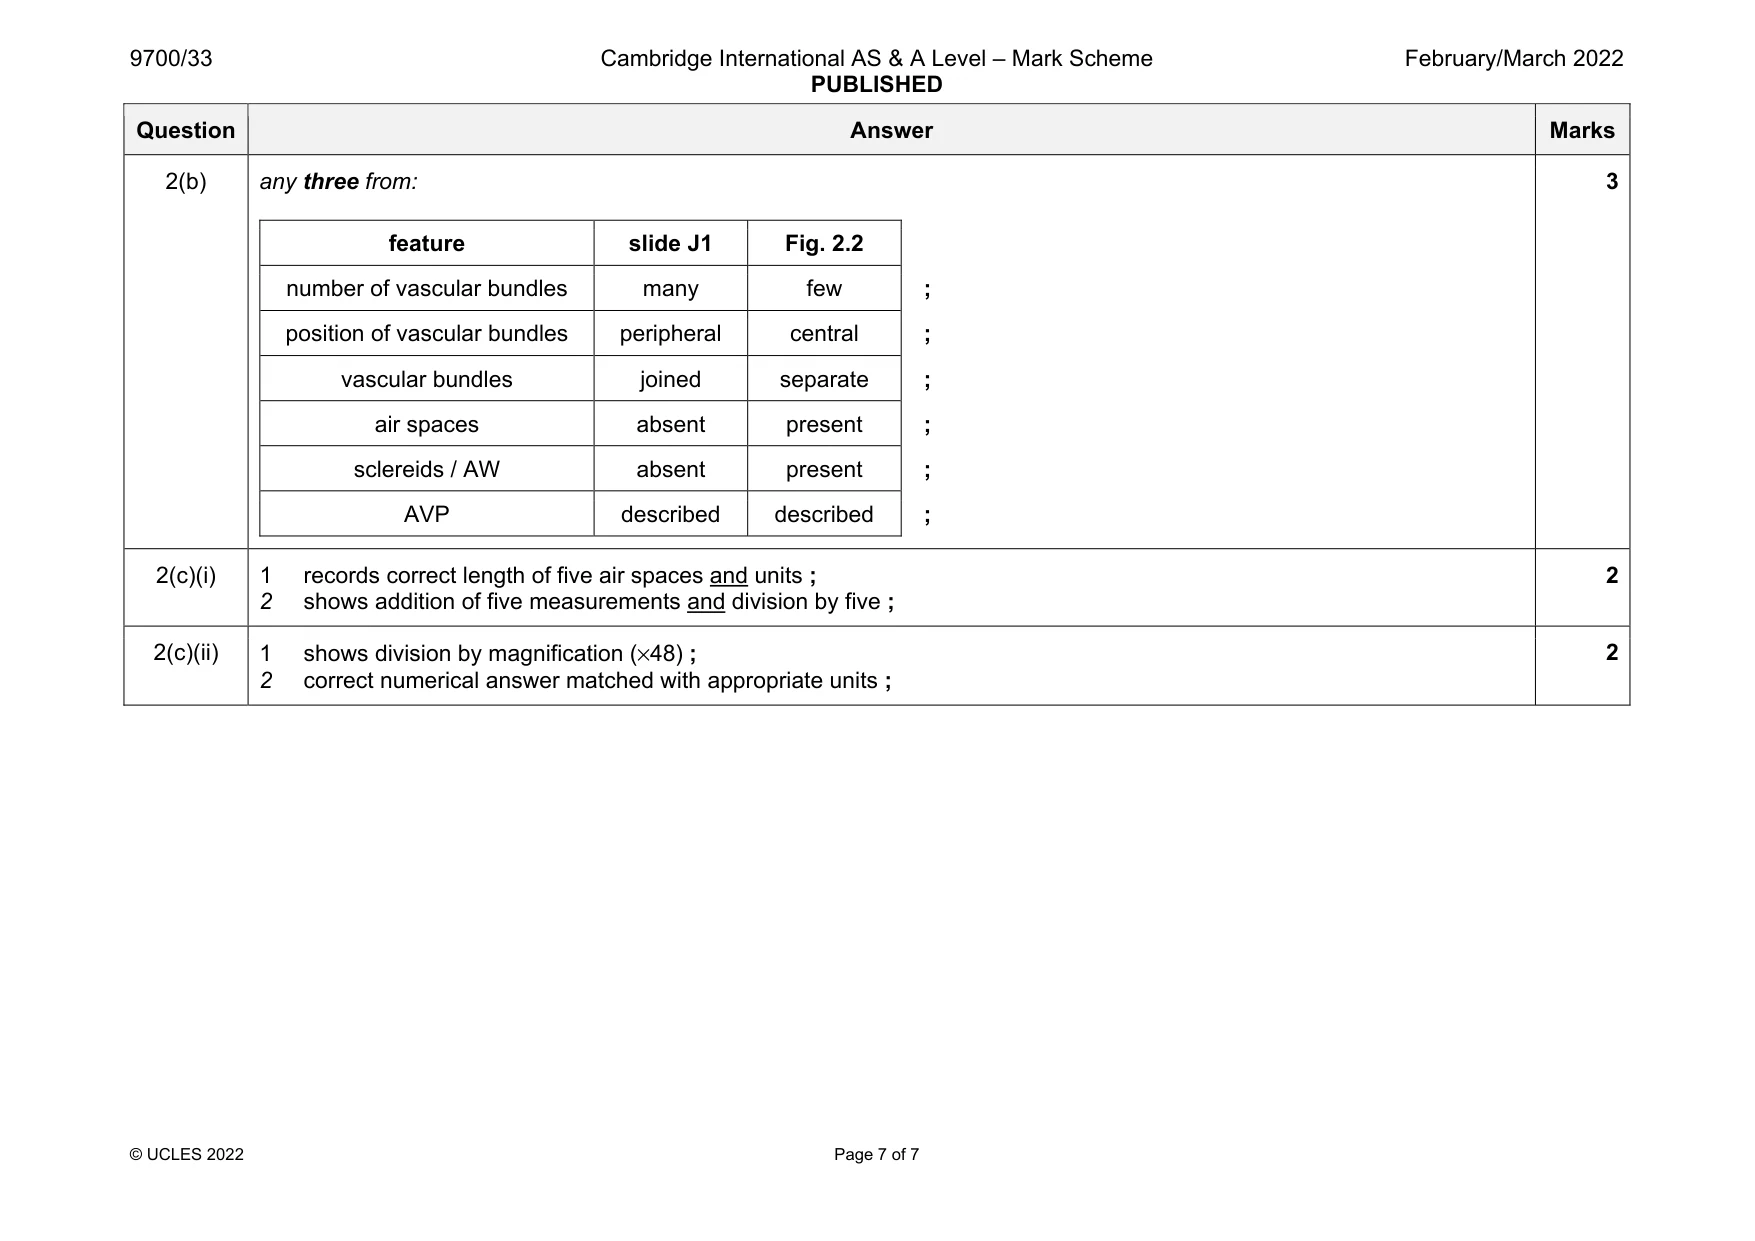
Mark scheme: 2(a)(i) 1 uses most of the available space and shows three or more tissue layers ; 2 draws only the region indicated (quarter of stem) and no cells ; 3 draws epidermis as two lines ; 4 correct proportions of vascular bundle and tissue above ; 5 label line and label to xylem ; 5 2(a)(ii) 1 uses most of the available space and lines continuous, thin and sharp ; 2 draws only four whole vessels and each vessel touches at least one other and in a line ; 3 two lines around each vessel and three lines where vessels touch ; 4 correct shape of vessels ; 5 label line and label to one lumen ; 5 Question Answer Marks 2(b) any three from: feature slide J1 Fig. 2.2 number of vascular bundles many few ; position of vascular bundles peripheral central ; vascular bundles joined separate ; air spaces absent present ; sclereids / AW absent present ; AVP described described ; 3 2(c)(i) 1 records correct length of five air spaces and units ; 2 shows addition of five measurements and division by five ; 2 2(c)(ii) 1 shows division by magnification (×48) ; 2 correct numerical answer matched with appropriate units ; 2
What was in this paper
The subtopics covered by these 2 questions, and how many questions each got. Open one in a new tab to see every Cambridge question on it.
What you needed in this session
Cambridge’s own grade thresholds for 2022 Feb/March, Paper 3 · Variant 3. A higher threshold means an easier paper — the bar moves with how the cohort did.