Cambridge A Level Biology 9700 — 2021 Feb/March Paper 3 · Variant 3
9700/33/F/M/21 · 2 questions · 40 marks · ≈45 min
The question paper and its mark scheme, free to read here and free to download. This is Cambridge’s own paper, exactly as it was sat.
Question paper16 pages

Mark scheme8 pages
Answers below. Sit the paper first if you are practising.
Questions as text
Q1 · Agar cubes that have been stained with universal indicator can be used to investigate…
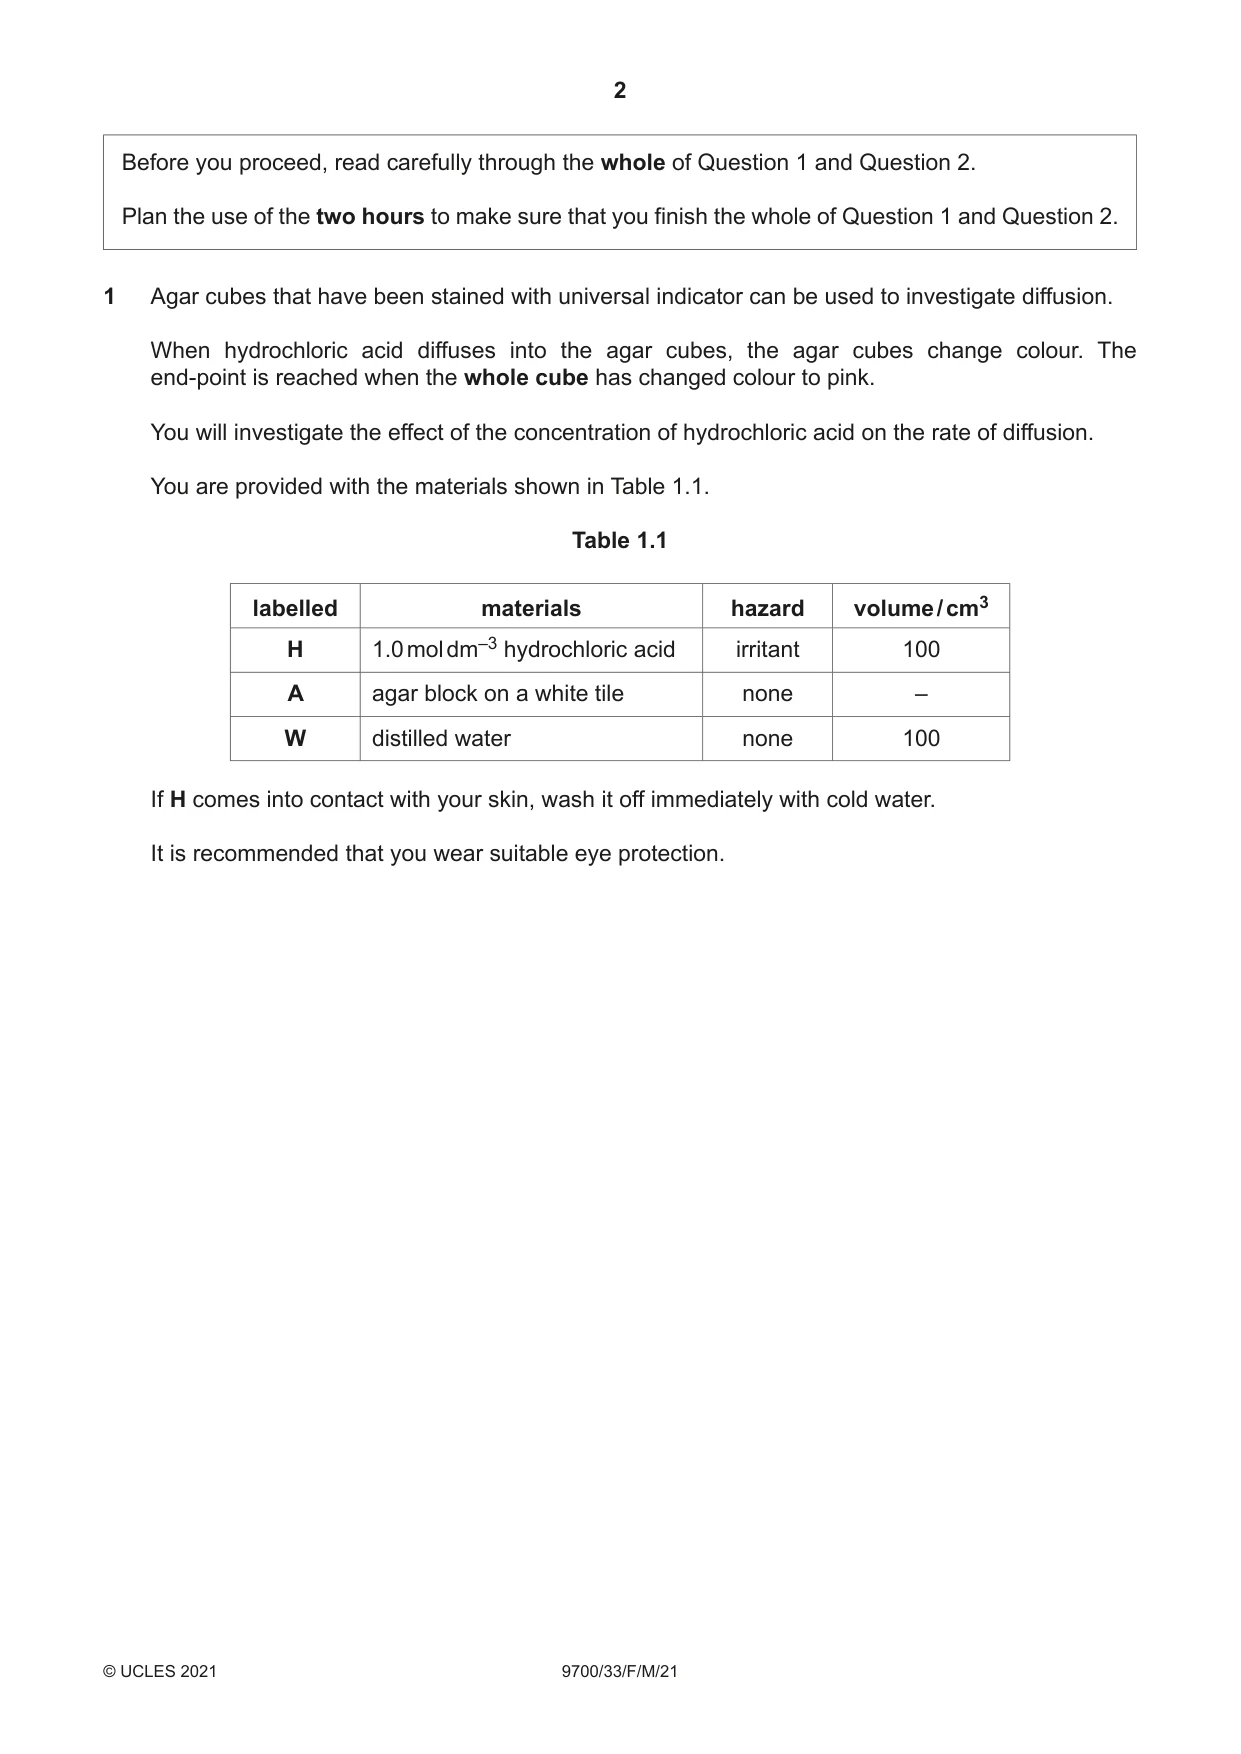
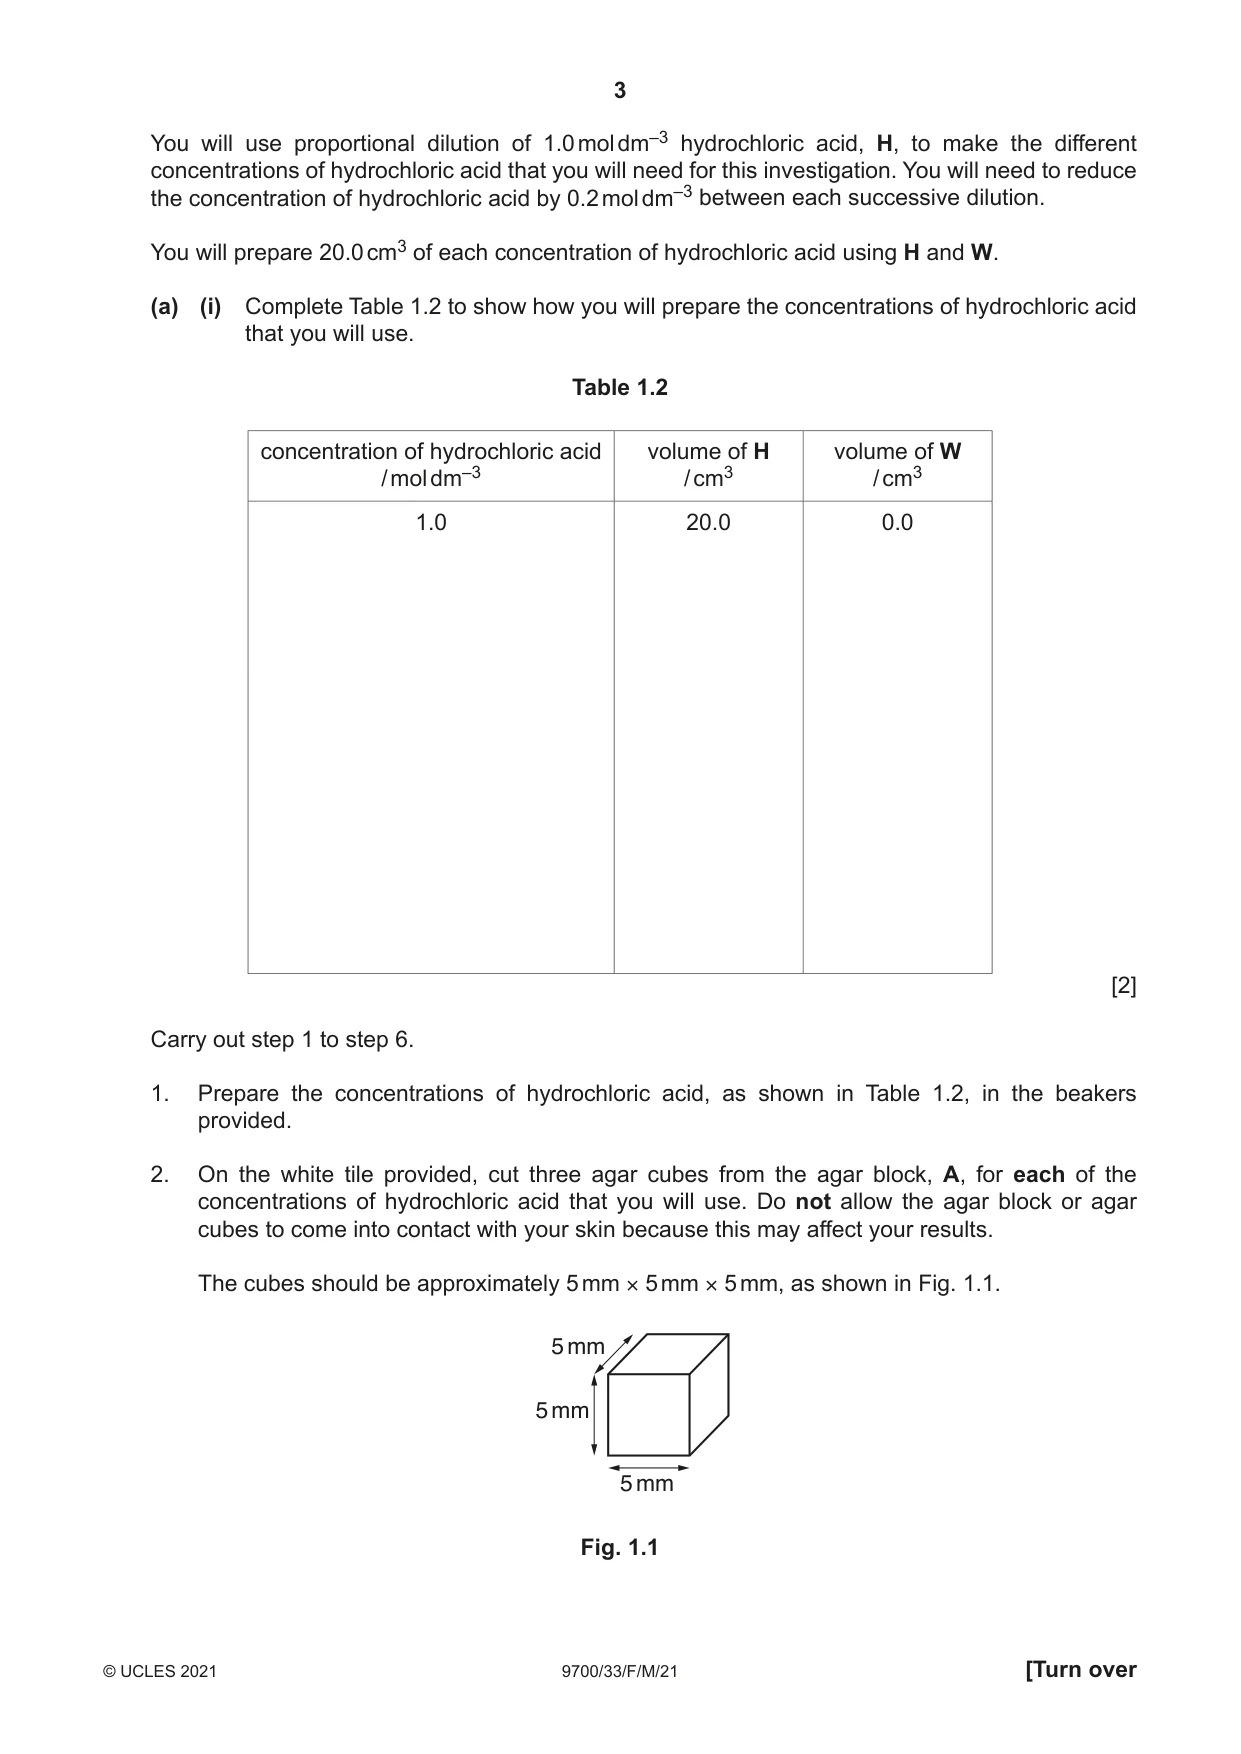
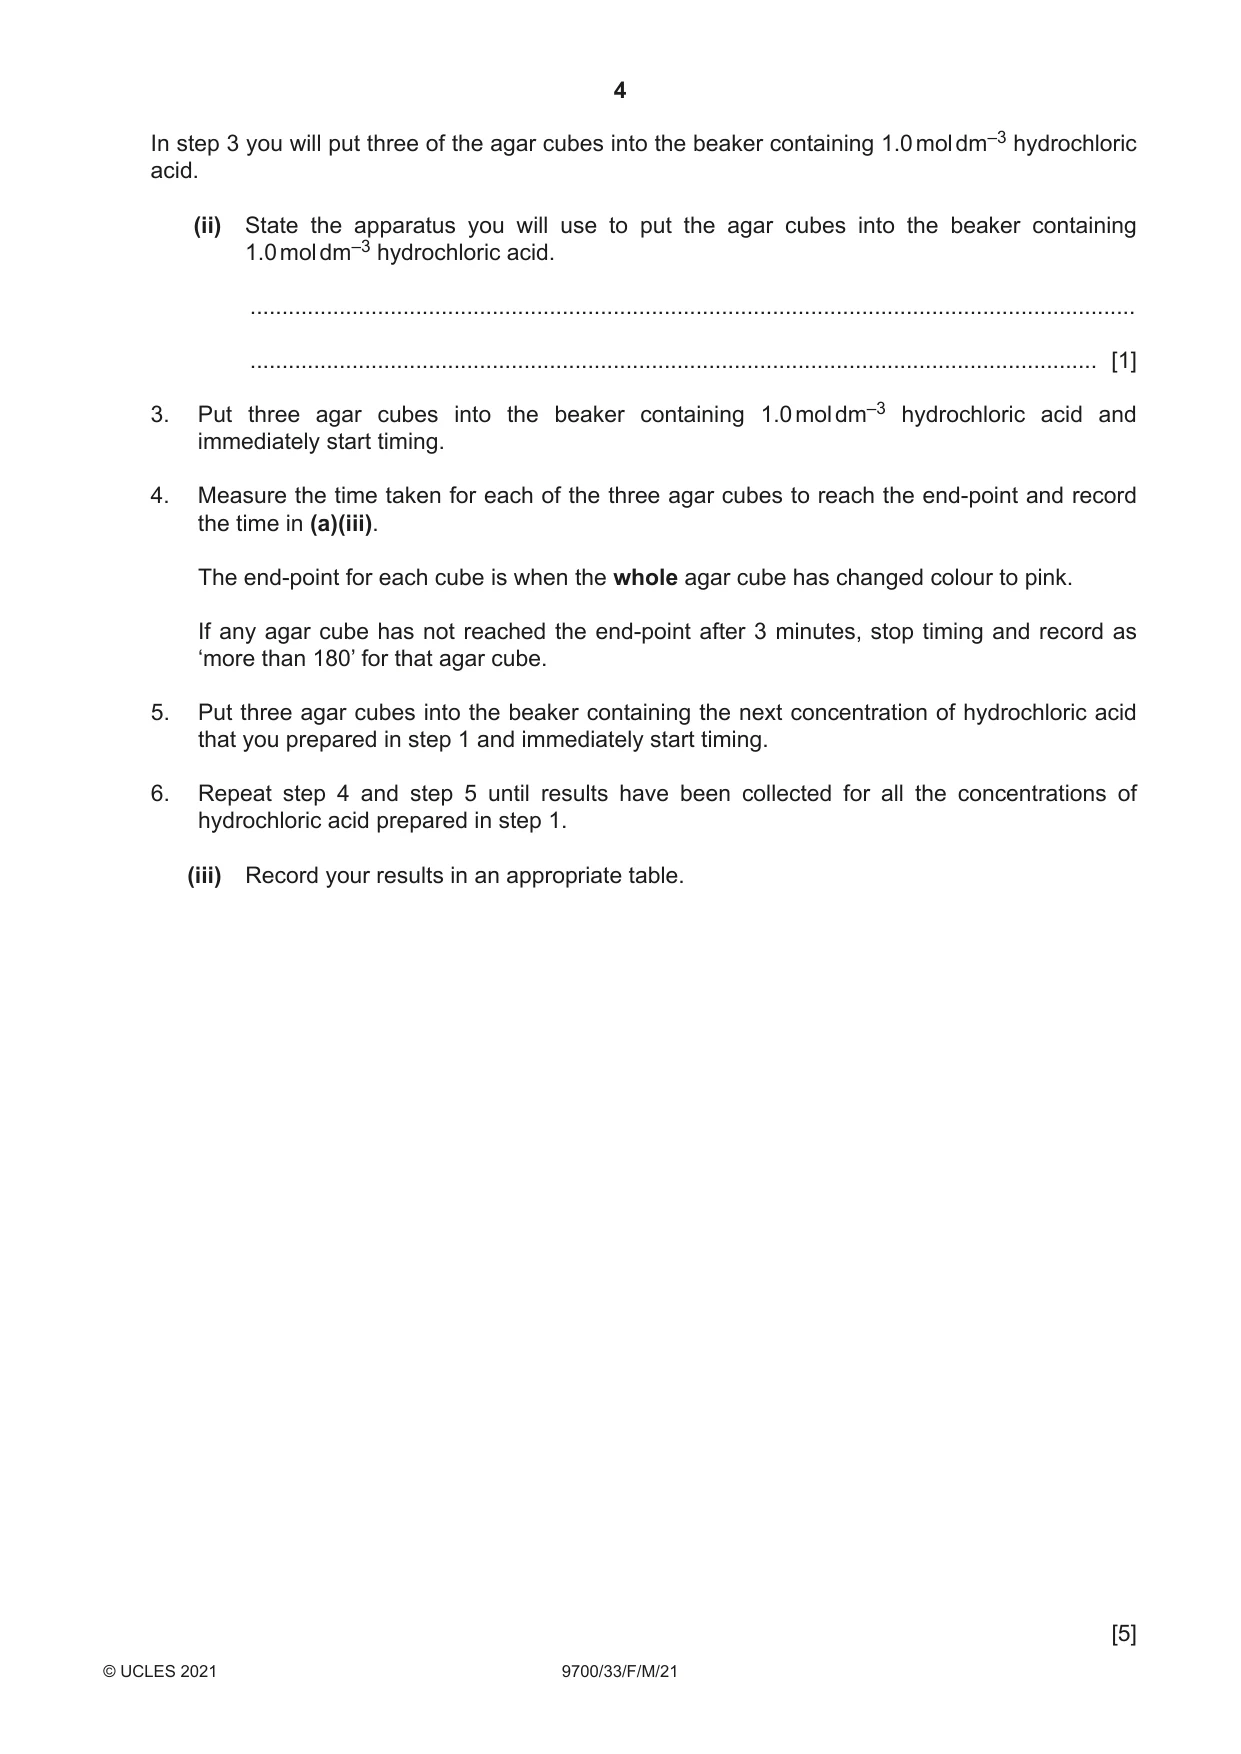
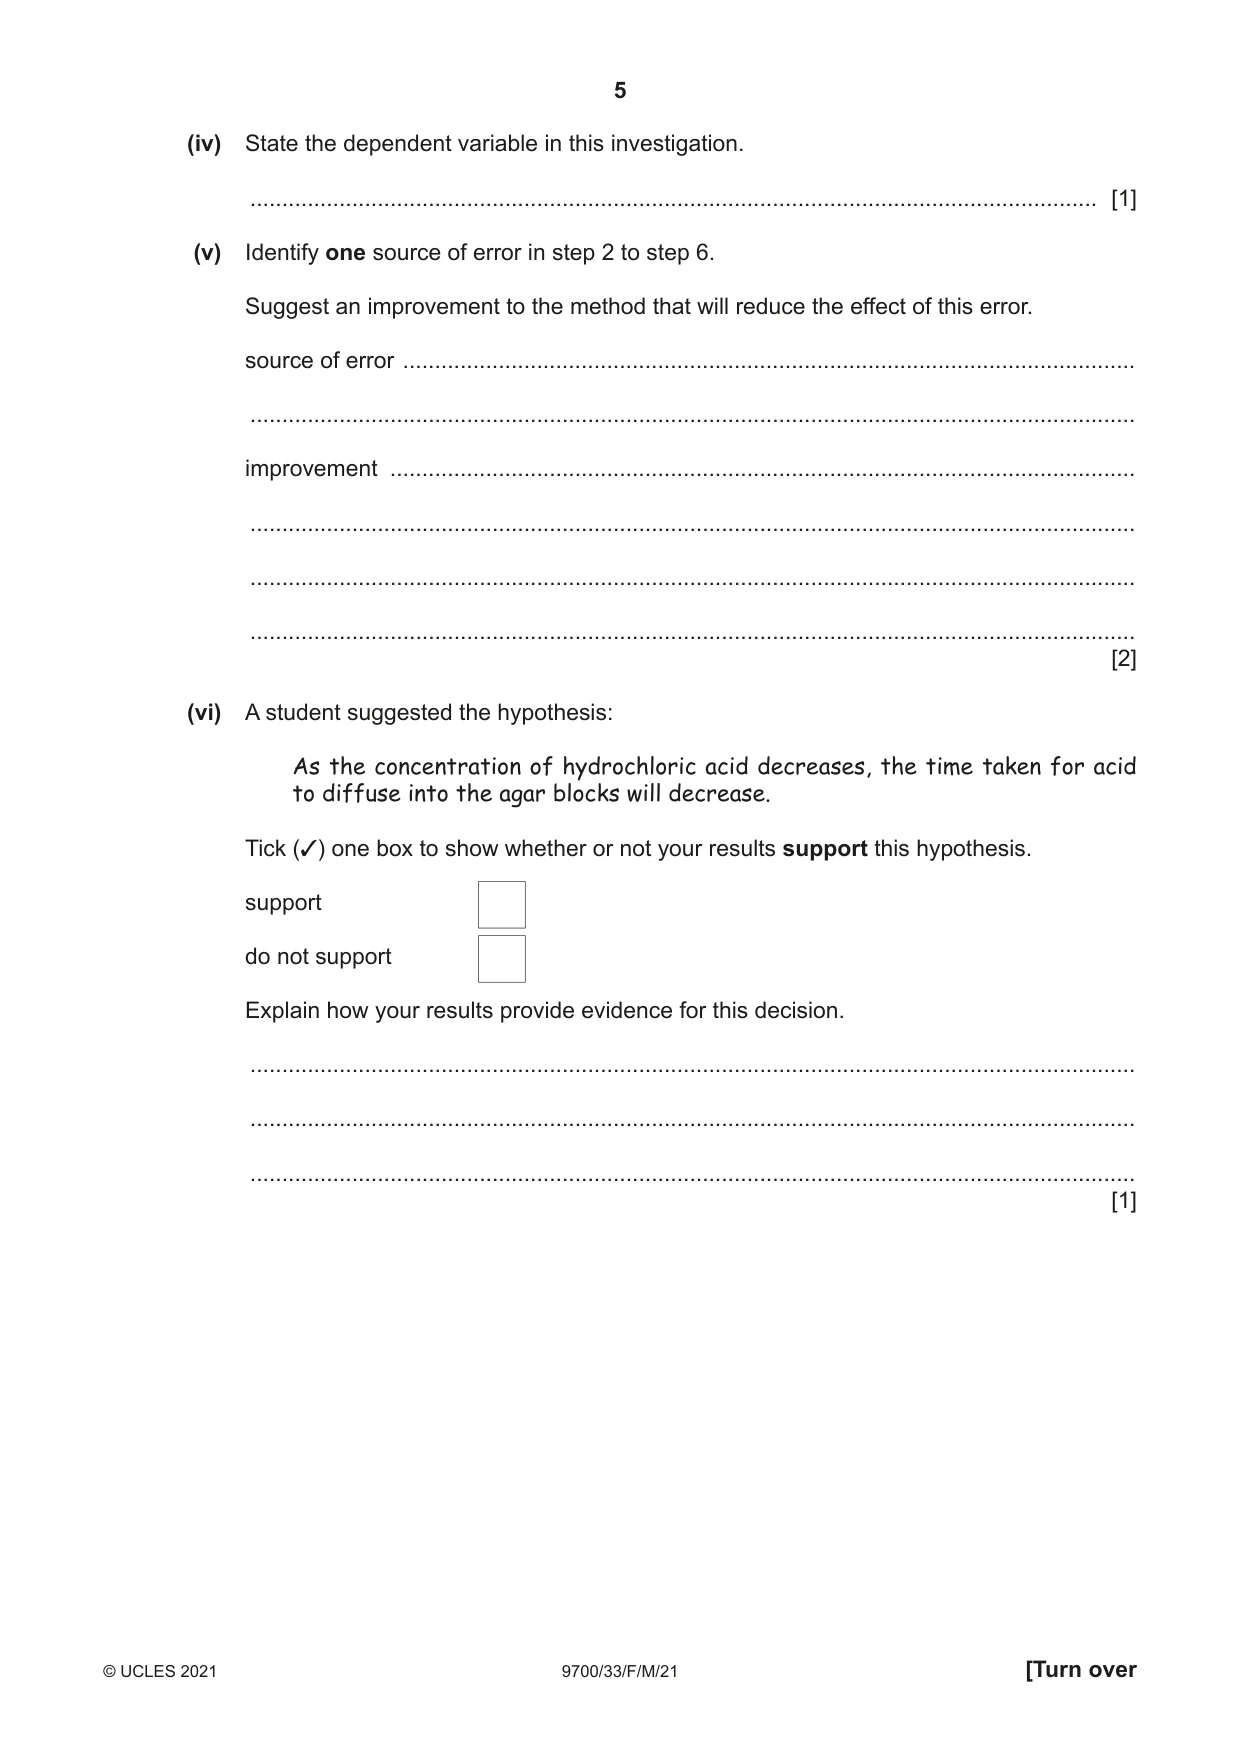
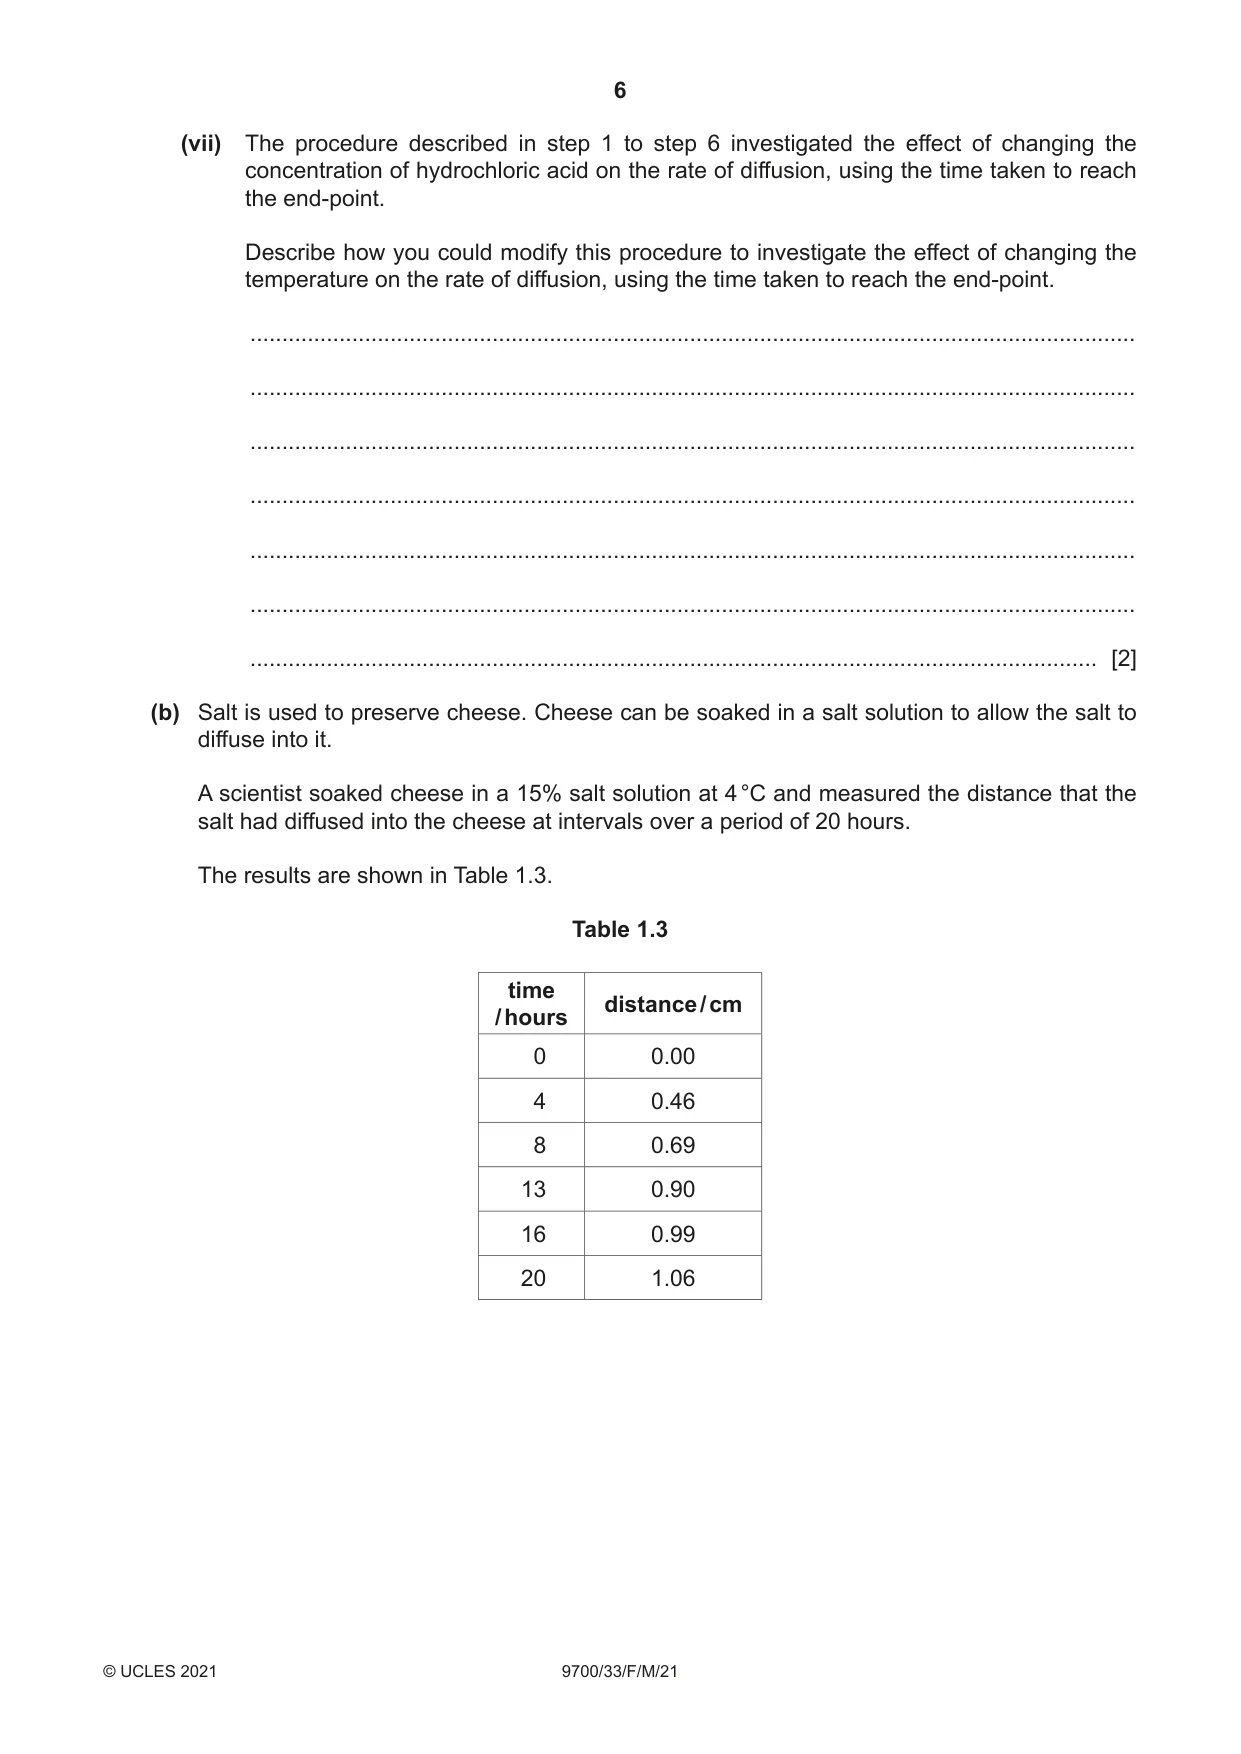
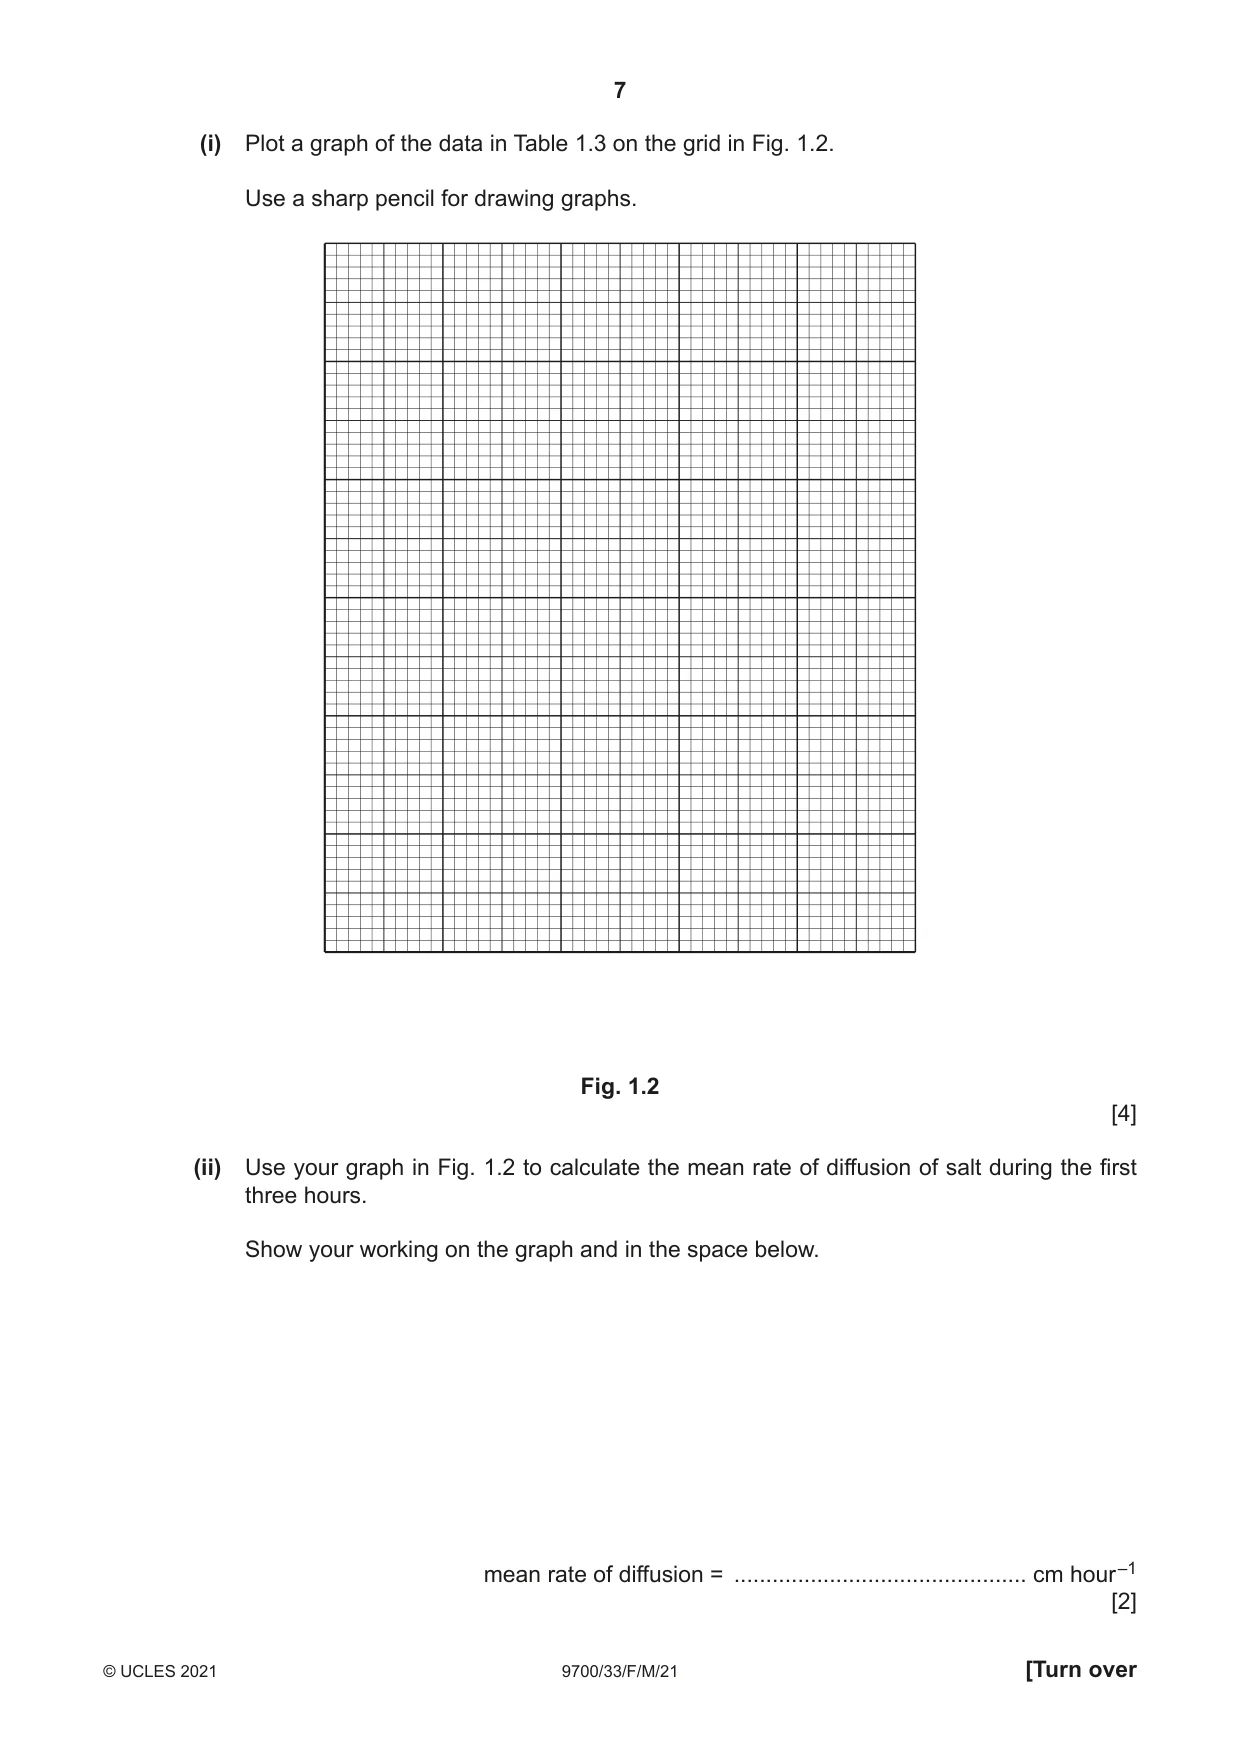
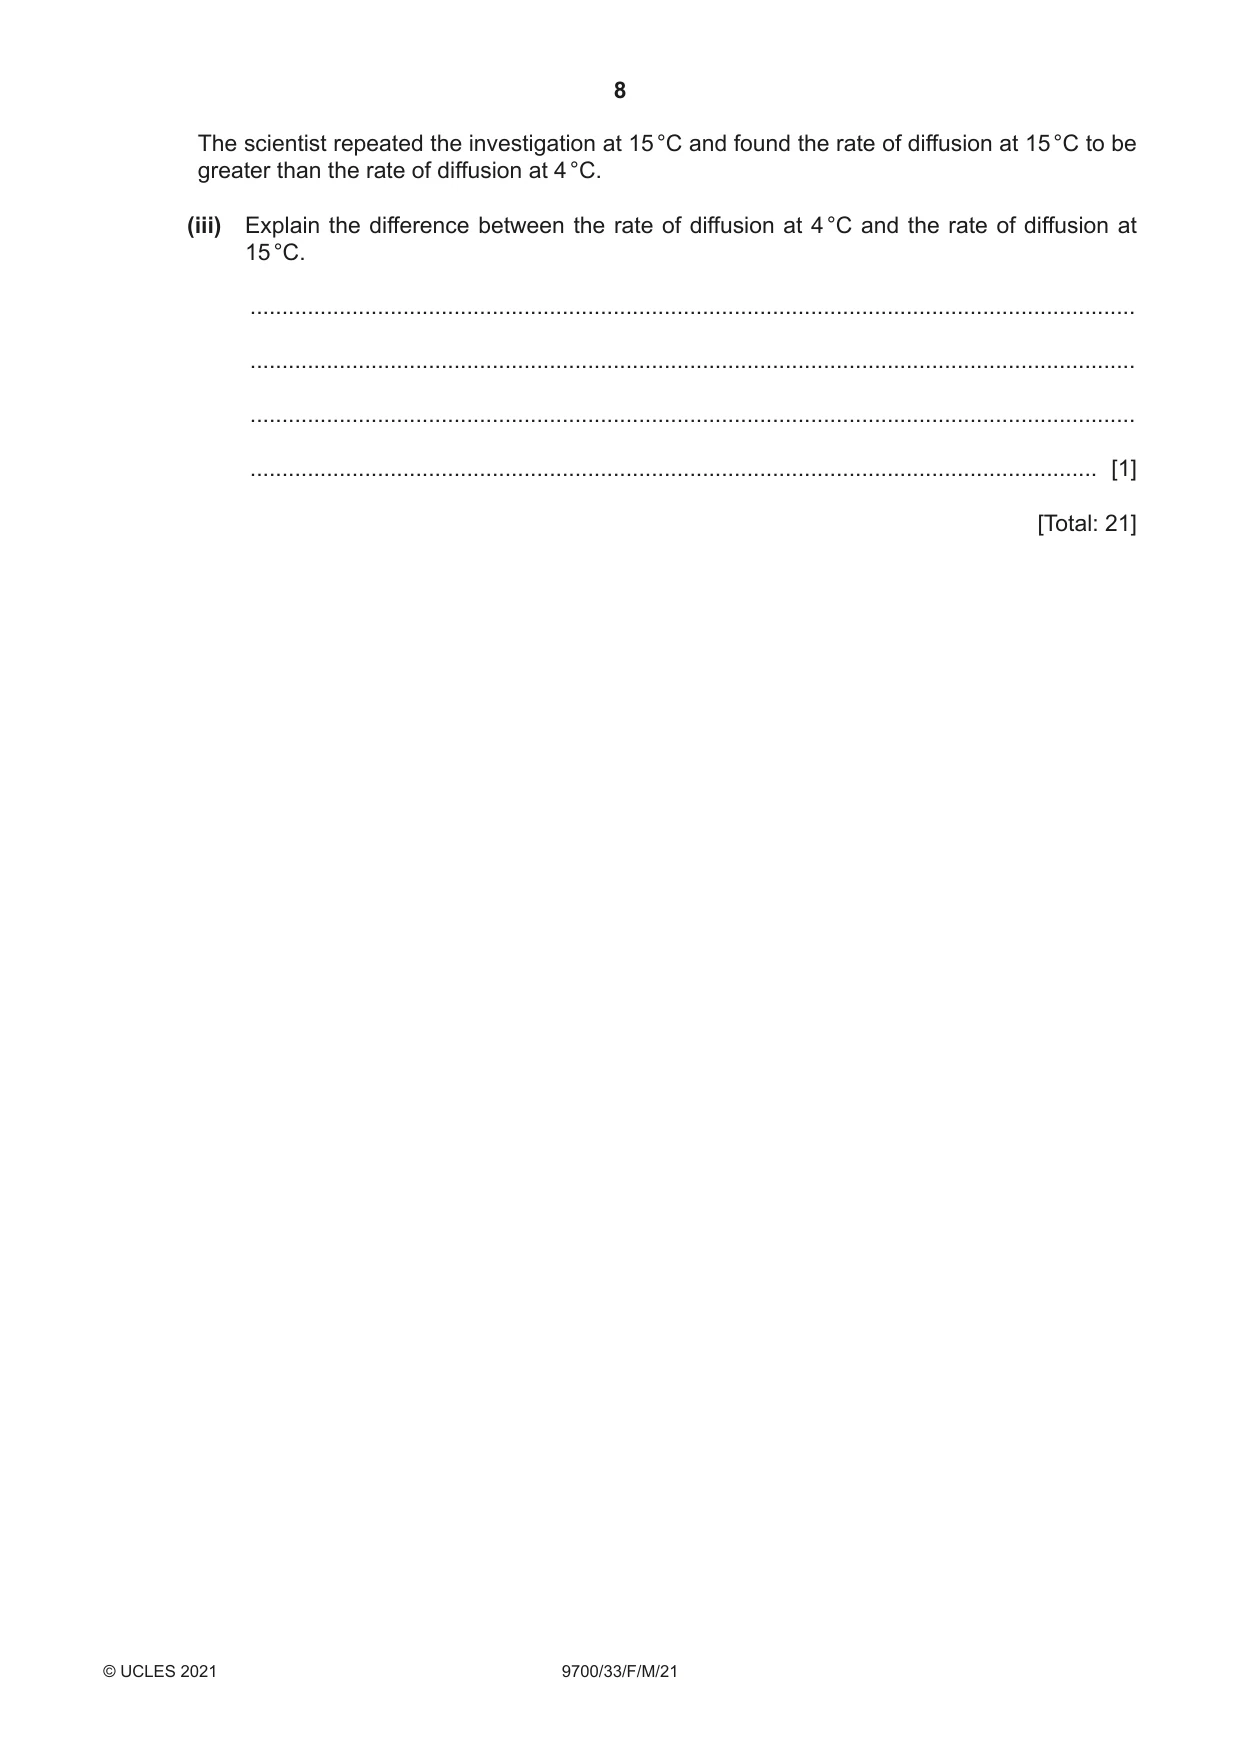
1 Agar cubes that have been stained with universal indicator can be used to investigate diffusion. When hydrochloric acid diffuses into the agar cubes, the agar cubes change colour. The end-point is reached when the whole cube has changed colour to pink. You will investigate the effect of the concentration of hydrochloric acid on the rate of diffusion. You are provided with the materials shown in Table 1.1. Table 1.1 labelled materials hazard volume / cm3 H 1.0 mol dm–3 hydrochloric acid irritant 100 A agar block on a white tile none – W distilled water none 100 If H comes into contact with your skin, wash it off immediately with cold water. It is recommended that you wear suitable eye protection. You will use proportional dilution of 1.0 mol dm–3 hydrochloric acid, H, to make the different concentrations of hydrochloric acid that you will need for this investigation. You will need to reduce the concentration of hydrochloric acid by 0.2 mol dm–3 between each successive dilution. You will prepare 20.0 cm3 of each concentration of hydrochloric acid using H and W. (a) (i) Complete Table 1.2 to show how you will prepare the concentrations of hydrochloric acid that you will use. Table 1.2 concentration of hydrochloric acid volume of H volume of W / mol dm–3 / cm3 / cm3 1.0 20.0 0.0 [2] Carry out step 1 to step 6. 1. Prepare the concentrations of hydrochloric acid, as shown in Table 1.2, in the beakers provided. 2. On the white tile provided, cut three agar cubes from the agar block, A, for each of the concentrations of hydrochloric acid that you will use. Do not allow the agar block or agar cubes to come into contact with your skin because this may affect your results. The cubes should be approximately 5 mm × 5 mm × 5 mm, as shown in Fig. 1.1. 5 mm 5 mm 5 mm Fig. 1.1 In step 3 you will put three of the agar cubes into the beaker containing 1.0 mol dm–3 hydrochloric acid. (ii) State the apparatus you will use to put the agar cubes into the beaker containing 1.0 mol dm–3 hydrochloric acid. ........................................................................................................................................... ..................................................................................................................................... [1] 3. Put three agar cubes into the beaker containing 1.0 mol dm–3 hydrochloric acid and immediately start timing. 4. Measure the time taken for each of the three agar cubes to reach the end-point and record the time in (a)(iii). The end-point for each cube is when the whole agar cube has changed colour to pink. If any agar cube has not reached the end-point after 3 minutes, stop timing and record as ‘more than 180’ for that agar cube. 5. Put three agar cubes into the beaker containing the next concentration of hydrochloric acid that you prepared in step 1 and immediately start timing. 6. Repeat step 4 and step 5 until results have been collected for all the concentrations of hydrochloric acid prepared in step 1. (iii) Record your results in an appropriate table. [5] (iv) State the dependent variable in this investigation. ..................................................................................................................................... [1] (v) Identify one source of error in step 2 to step 6. Suggest an improvement to the method that will reduce the effect of this error. source of error ................................................................................................................... ........................................................................................................................................... improvement ..................................................................................................................... ........................................................................................................................................... ........................................................................................................................................... ........................................................................................................................................... [2] (vi) A student suggested the hypothesis: As the concentration of hydrochloric acid decreases, the time taken for acid to diffuse into the agar blocks will decrease. Tick (3) one box to show whether or not your results support this hypothesis. support do not support Explain how your results provide evidence for this decision. ........................................................................................................................................... ........................................................................................................................................... ........................................................................................................................................... [1] (vii) The procedure described in step 1 to step 6 investigated the effect of changing the concentration of hydrochloric acid on the rate of diffusion, using the time taken to reach the end-point. Describe how you could modify this procedure to investigate the effect of changing the temperature on the rate of diffusion, using the time taken to reach the end-point. ........................................................................................................................................... ........................................................................................................................................... ........................................................................................................................................... ........................................................................................................................................... ........................................................................................................................................... ........................................................................................................................................... ..................................................................................................................................... [2] (b) Salt is used to preserve cheese. Cheese can be soaked in a salt solution to allow the salt to diffuse into it. A scientist soaked cheese in a 15% salt solution at 4 °C and measured the distance that the salt had diffused into the cheese at intervals over a period of 20 hours. The results are shown in Table 1.3. Table 1.3 time distance / cm / hours 0 0.00 4 0.46 8 0.69 13 0.90 16 0.99 20 1.06 (i) Plot a graph of the data in Table 1.3 on the grid in Fig. 1.2. Use a sharp pencil for drawing graphs. Fig. 1.2 [4] (ii) Use your graph in Fig. 1.2 to calculate the mean rate of diffusion of salt during the first three hours. Show your working on the graph and in the space below. mean rate of diffusion = .............................................. cm hour –1 [2] The scientist repeated the investigation at 15 °C and found the rate of diffusion at 15 °C to be greater than the rate of diffusion at 4 °C. (iii) Explain the difference between the rate of diffusion at 4 °C and the rate of diffusion at 15 °C. ........................................................................................................................................... ........................................................................................................................................... ........................................................................................................................................... ..................................................................................................................................... [1] [Total: 21] Question 2 starts on page 10
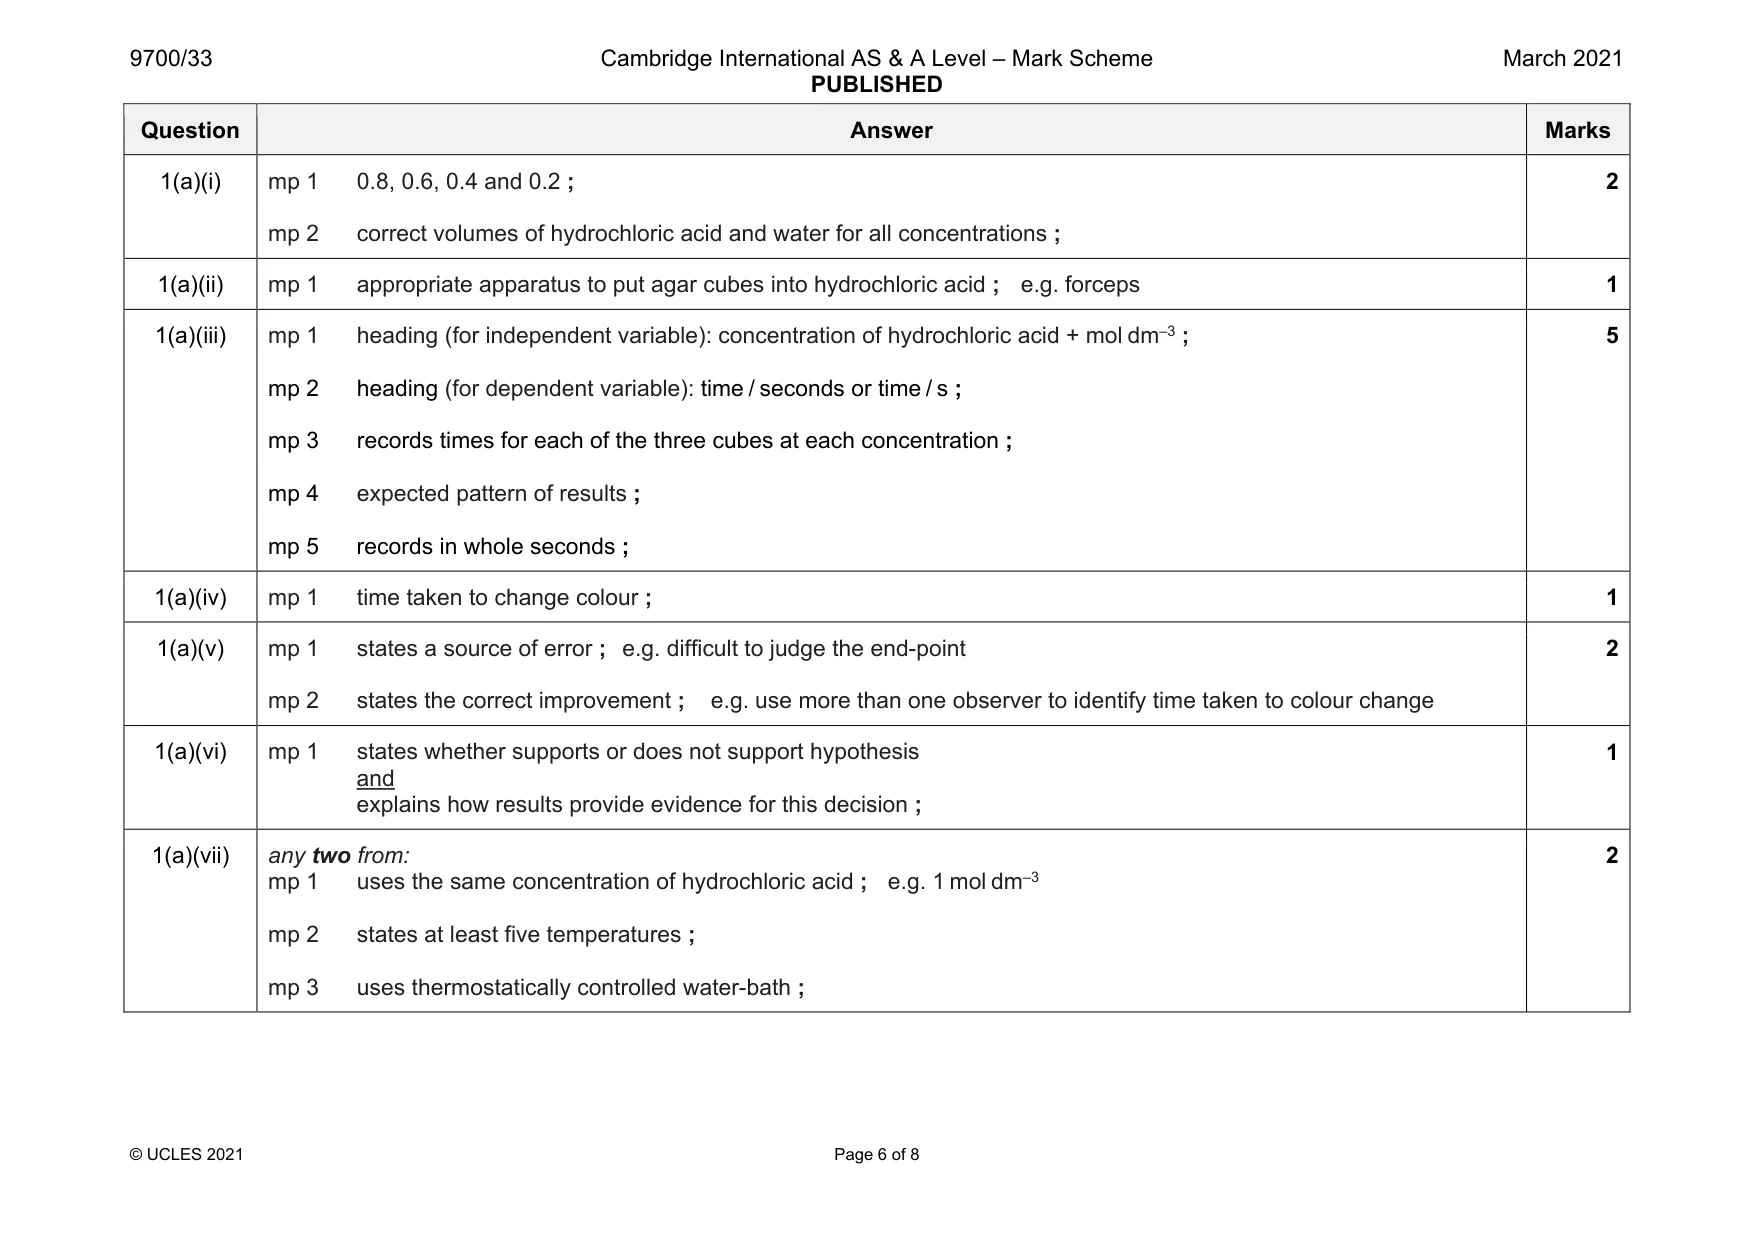
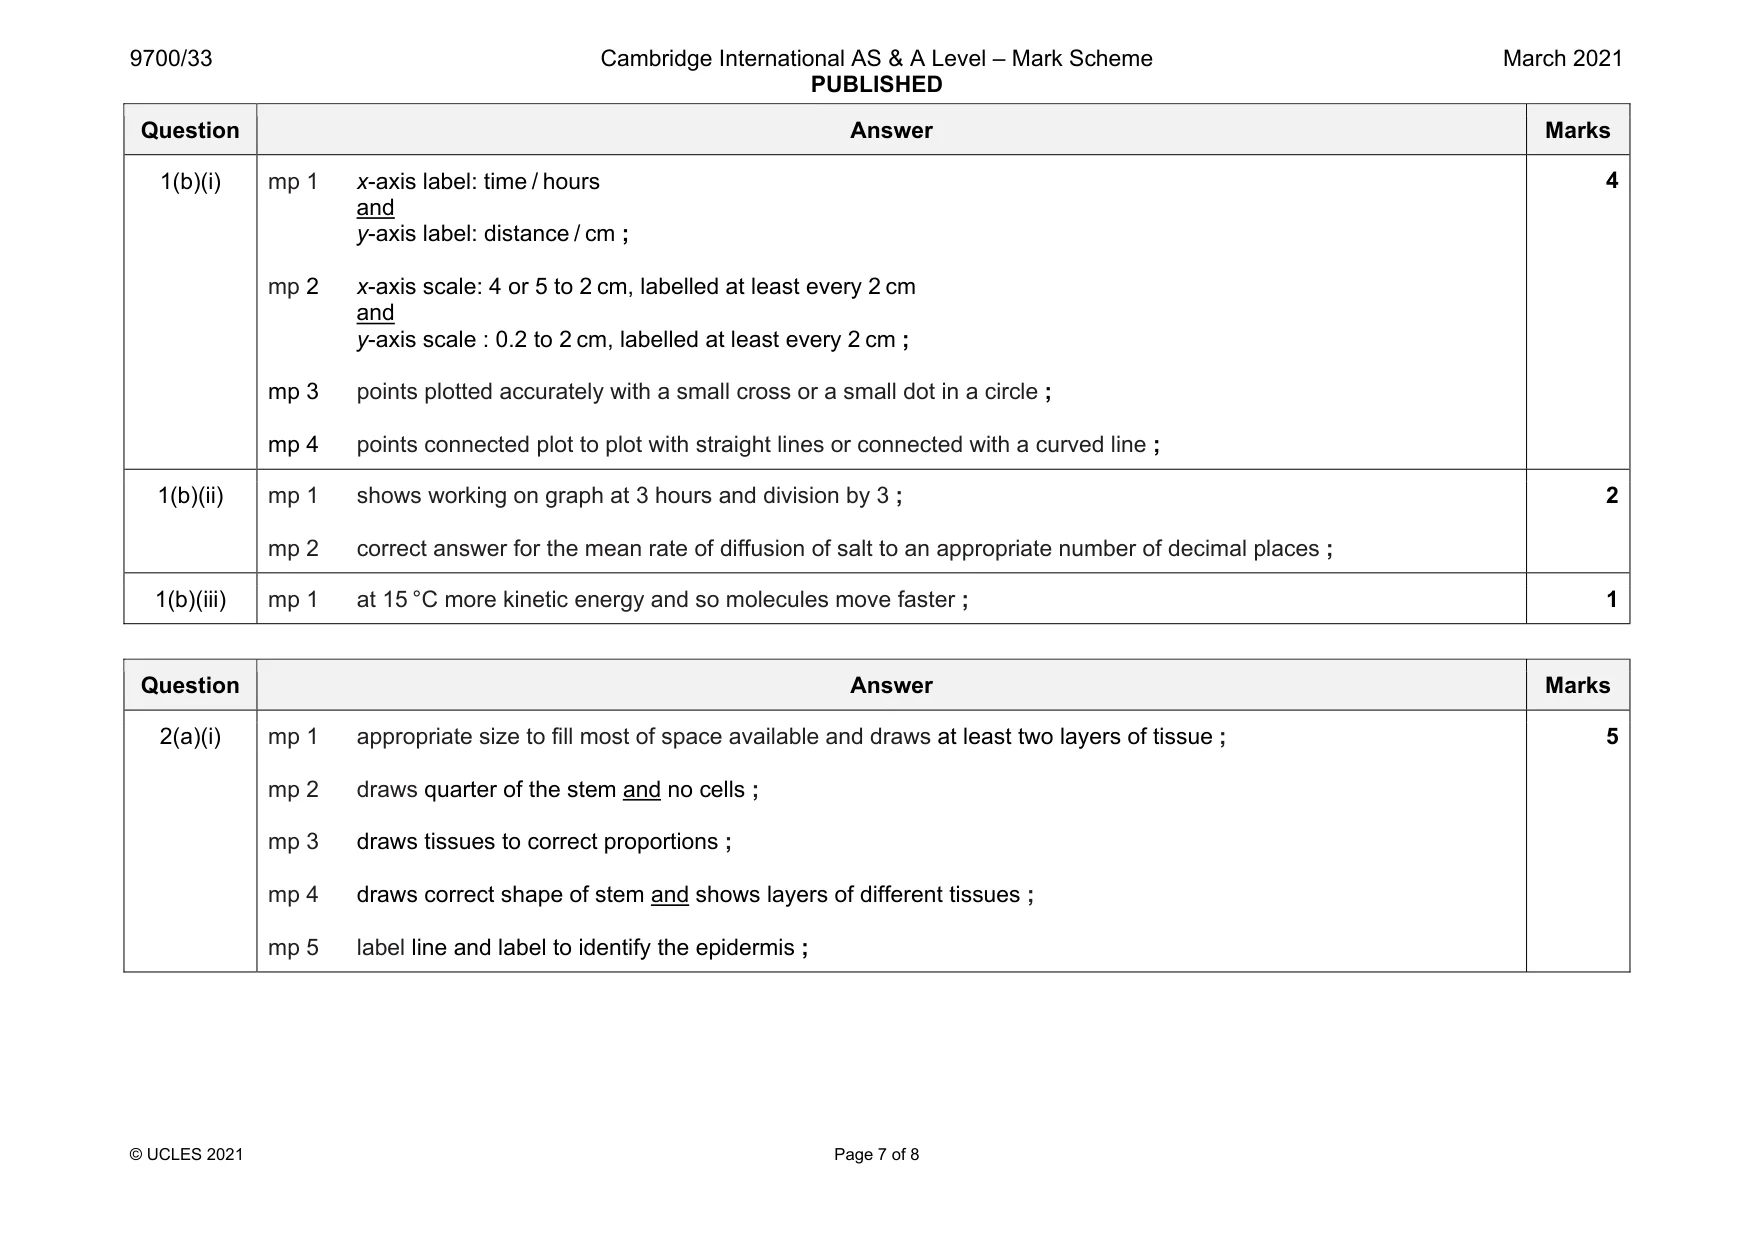
Mark scheme: 1(a)(i) mp 1 0.8, 0.6, 0.4 and 0.2 ; mp 2 correct volumes of hydrochloric acid and water for all concentrations ; 2 1(a)(ii) mp 1 appropriate apparatus to put agar cubes into hydrochloric acid ; e.g. forceps 1 1(a)(iii) mp 1 heading (for independent variable): concentration of hydrochloric acid + mol dm–3 ; mp 2 heading (for dependent variable): time / seconds or time / s ; mp 3 records times for each of the three cubes at each concentration ; mp 4 expected pattern of results ; mp 5 records in whole seconds ; 5 1(a)(iv) mp 1 time taken to change colour ; 1 1(a)(v) mp 1 states a source of error ; e.g. difficult to judge the end-point mp 2 states the correct improvement ; e.g. use more than one observer to identify time taken to colour change 2 1(a)(vi) mp 1 states whether supports or does not support hypothesis and explains how results provide evidence for this decision ; 1 1(a)(vii) any two from: mp 1 uses the same concentration of hydrochloric acid ; e.g. 1 mol dm–3 mp 2 states at least five temperatures ; mp 3 uses thermostatically controlled water-bath ; 2 Question Answer Marks 1(b)(i) mp 1 x-axis label: time / hours and y-axis label: distance / cm ; mp 2 x-axis scale: 4 or 5 to 2 cm, labelled at least every 2 cm and y-axis scale : 0.2 to 2 cm, labelled at least every 2 cm ; mp 3 points plotted accurately with a small cross or a small dot in a circle ; mp 4 points connected plot to plot with straight lines or connected with a curved line ; 4 1(b)(ii) mp 1 shows working on graph at 3 hours and division by 3 ; mp 2 correct answer for the mean rate of diffusion of salt to an appropriate number of decimal places ; 2 1(b)(iii) mp 1 at 15 °C more kinetic energy and so molecules move faster ; 1
Q2 · P1 is a slide of a stained transverse section through a plant stem
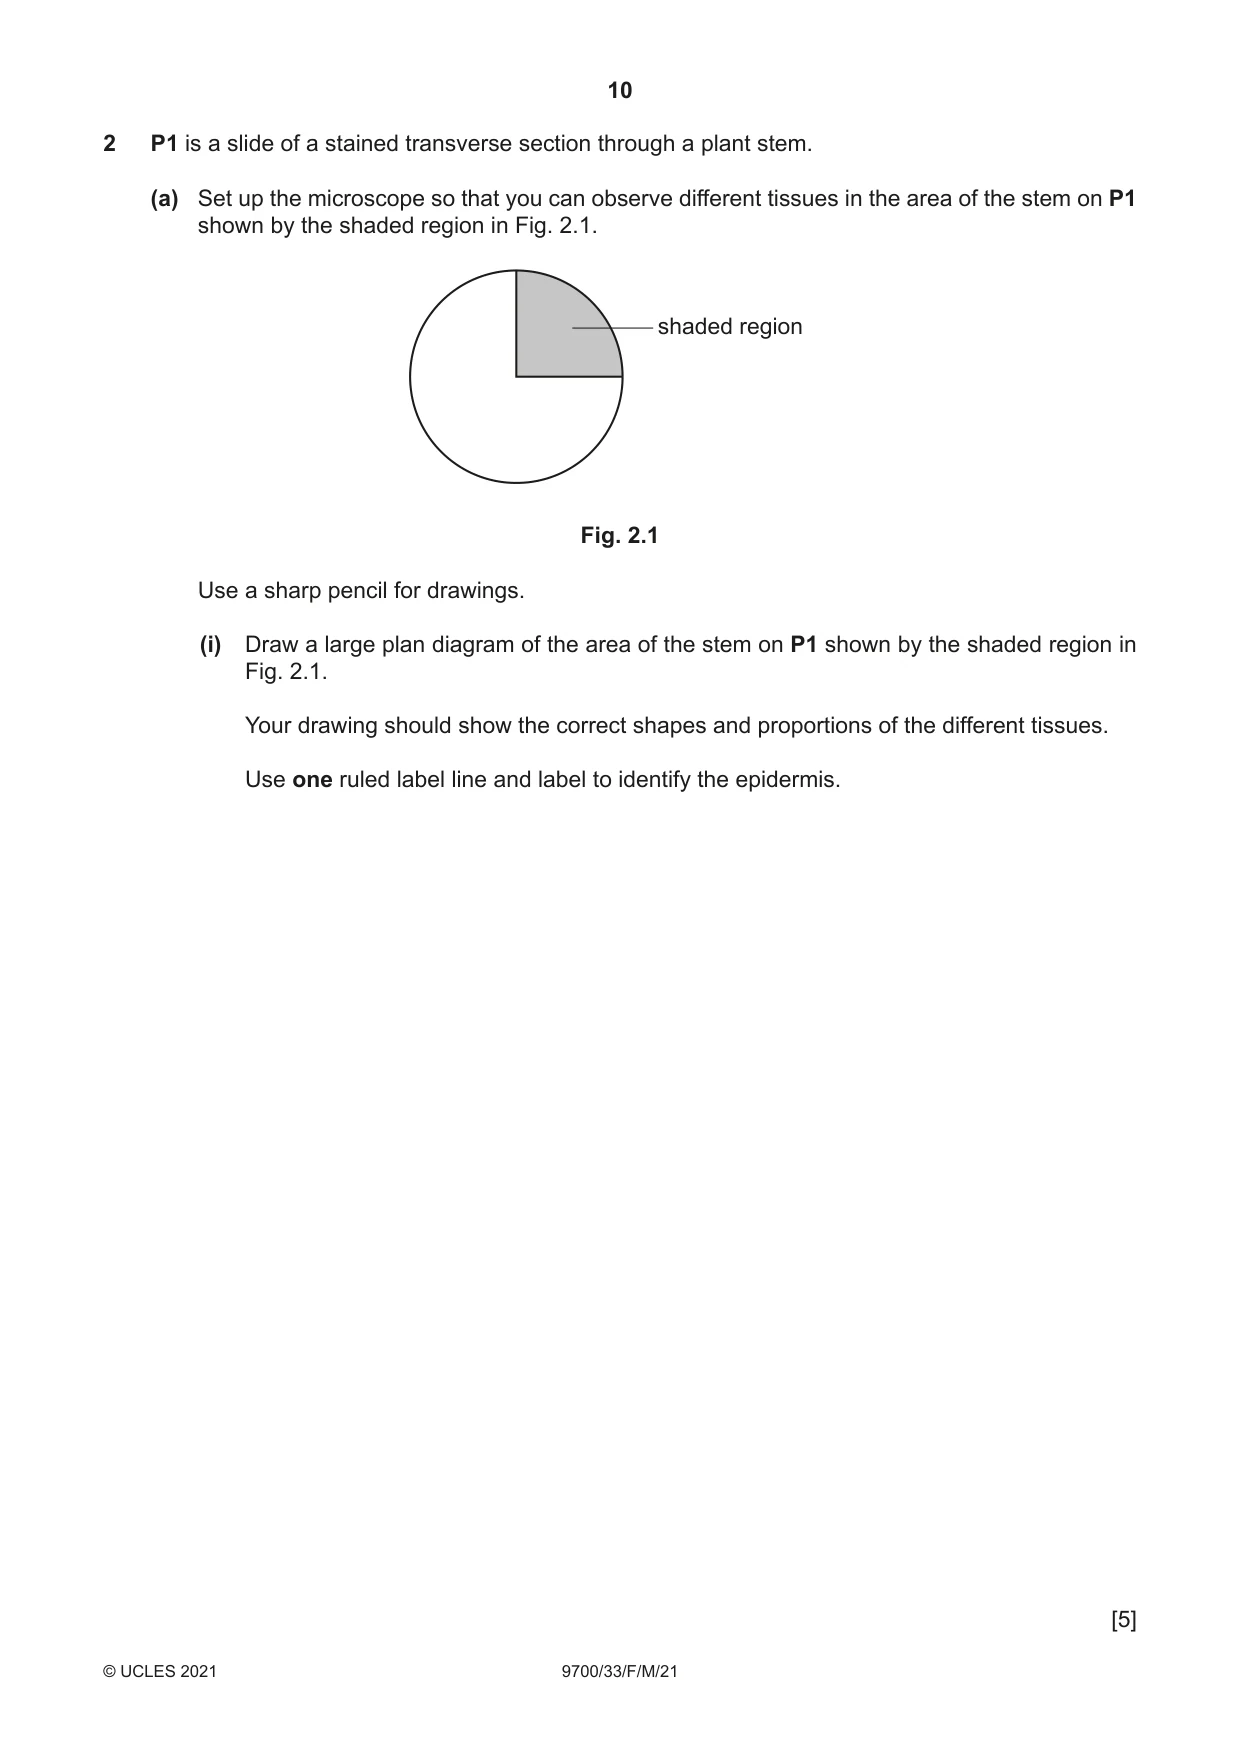
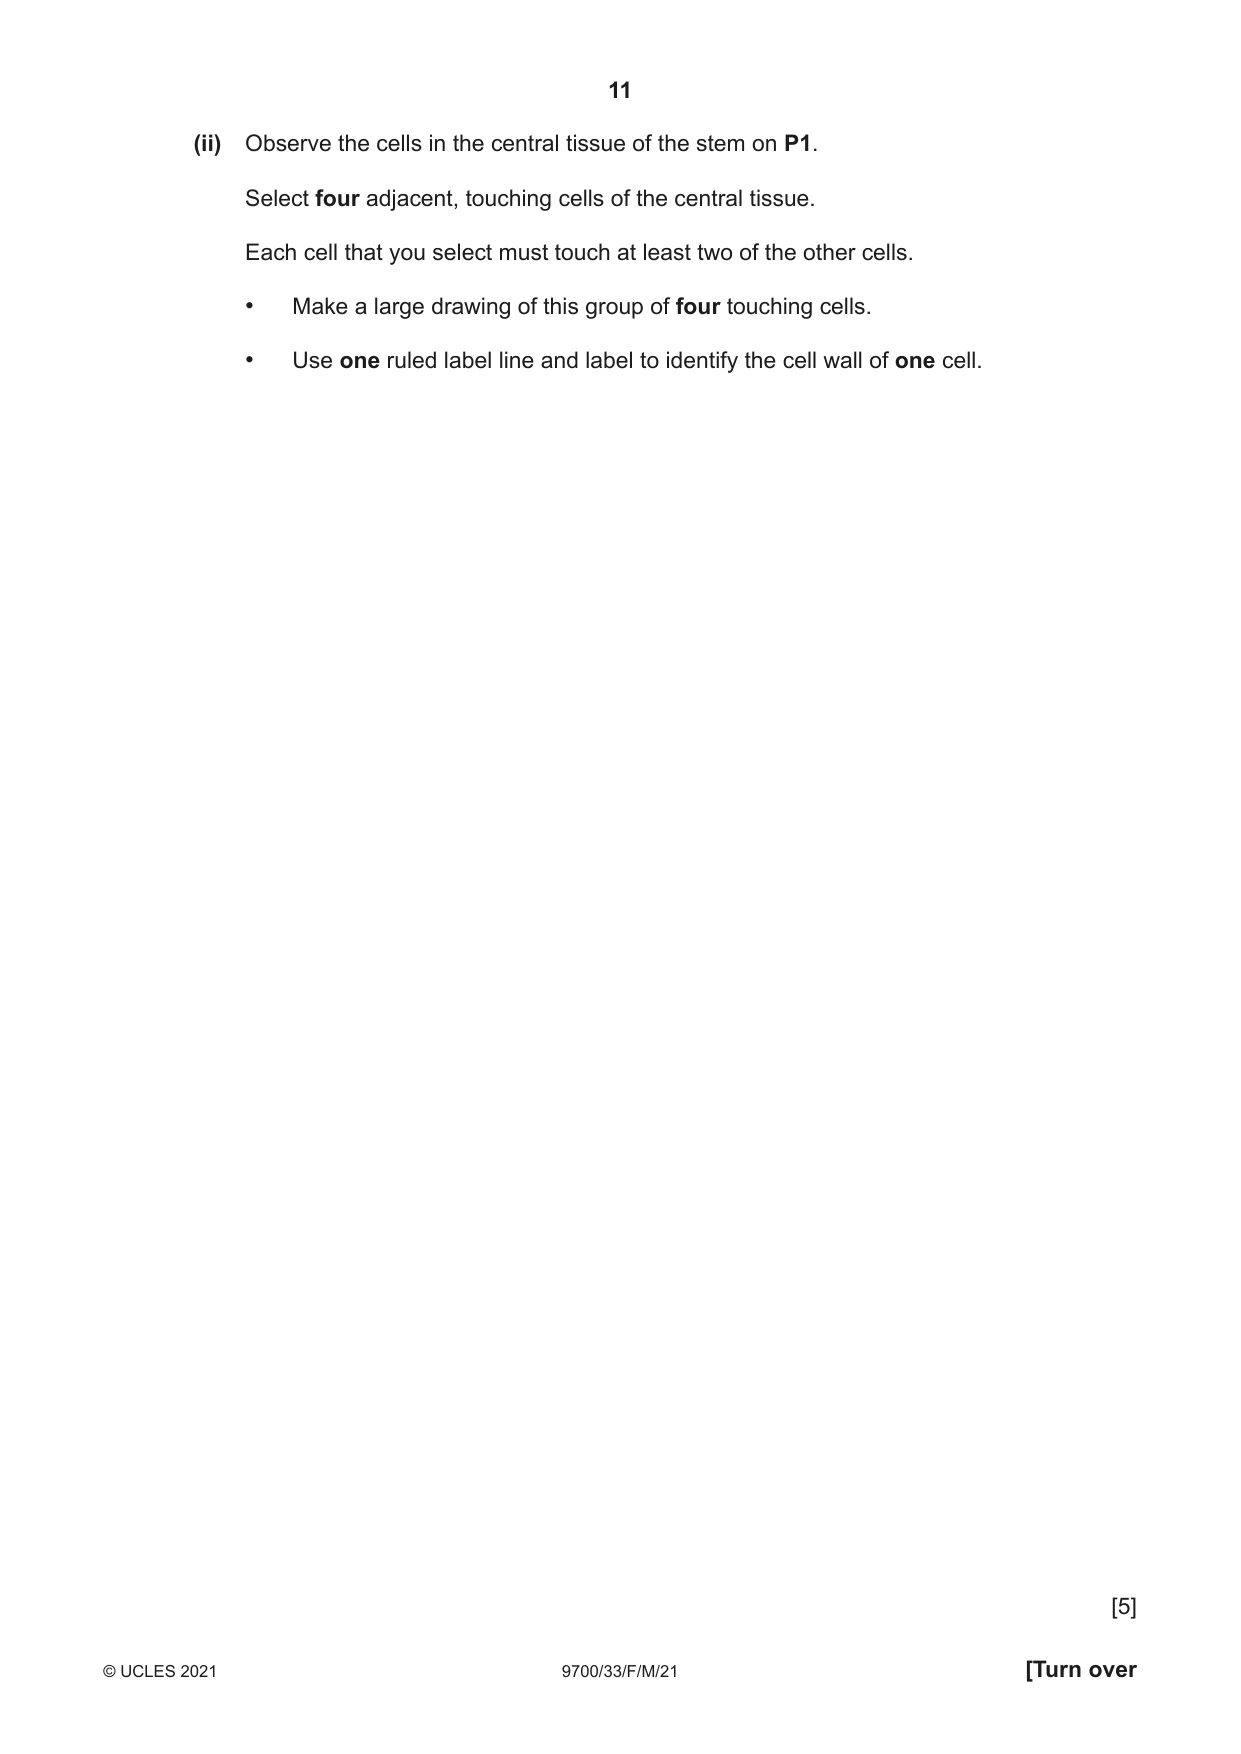
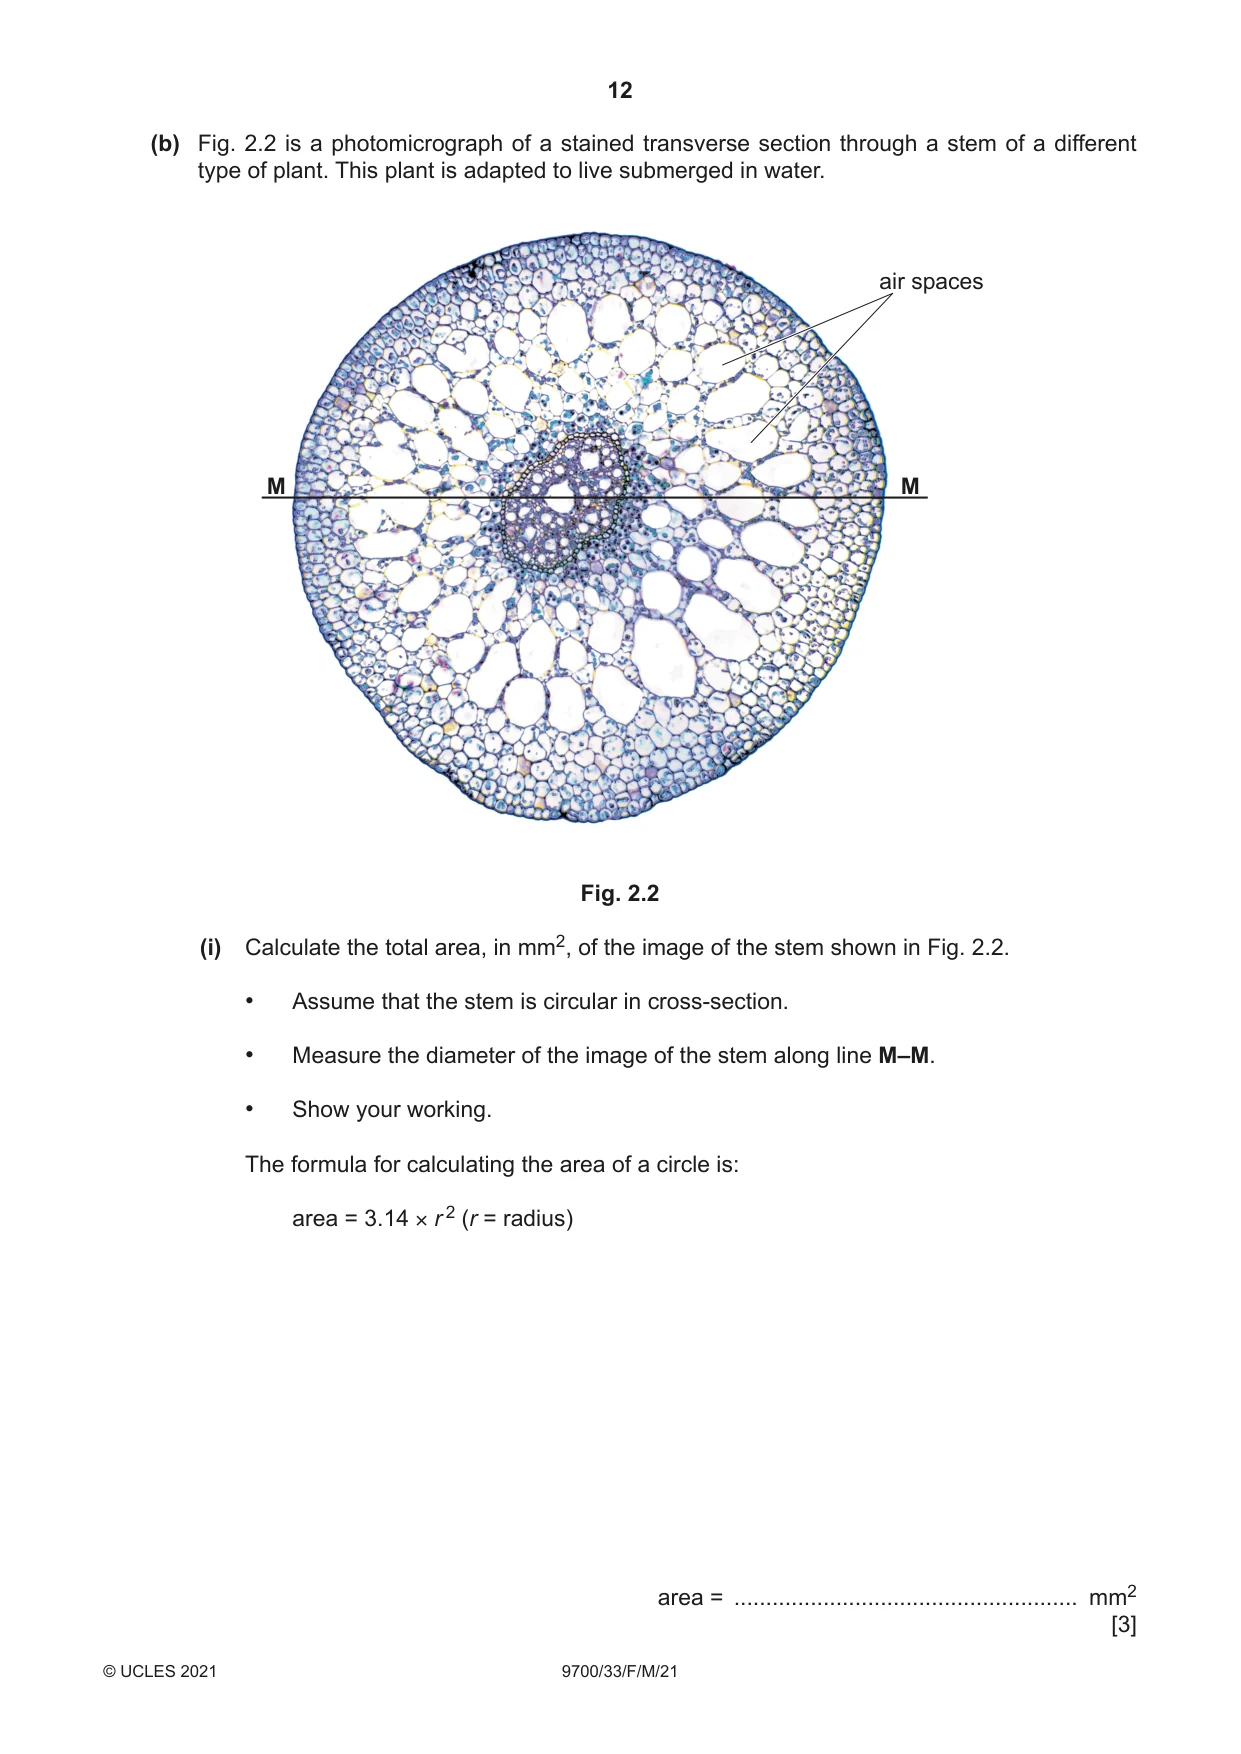
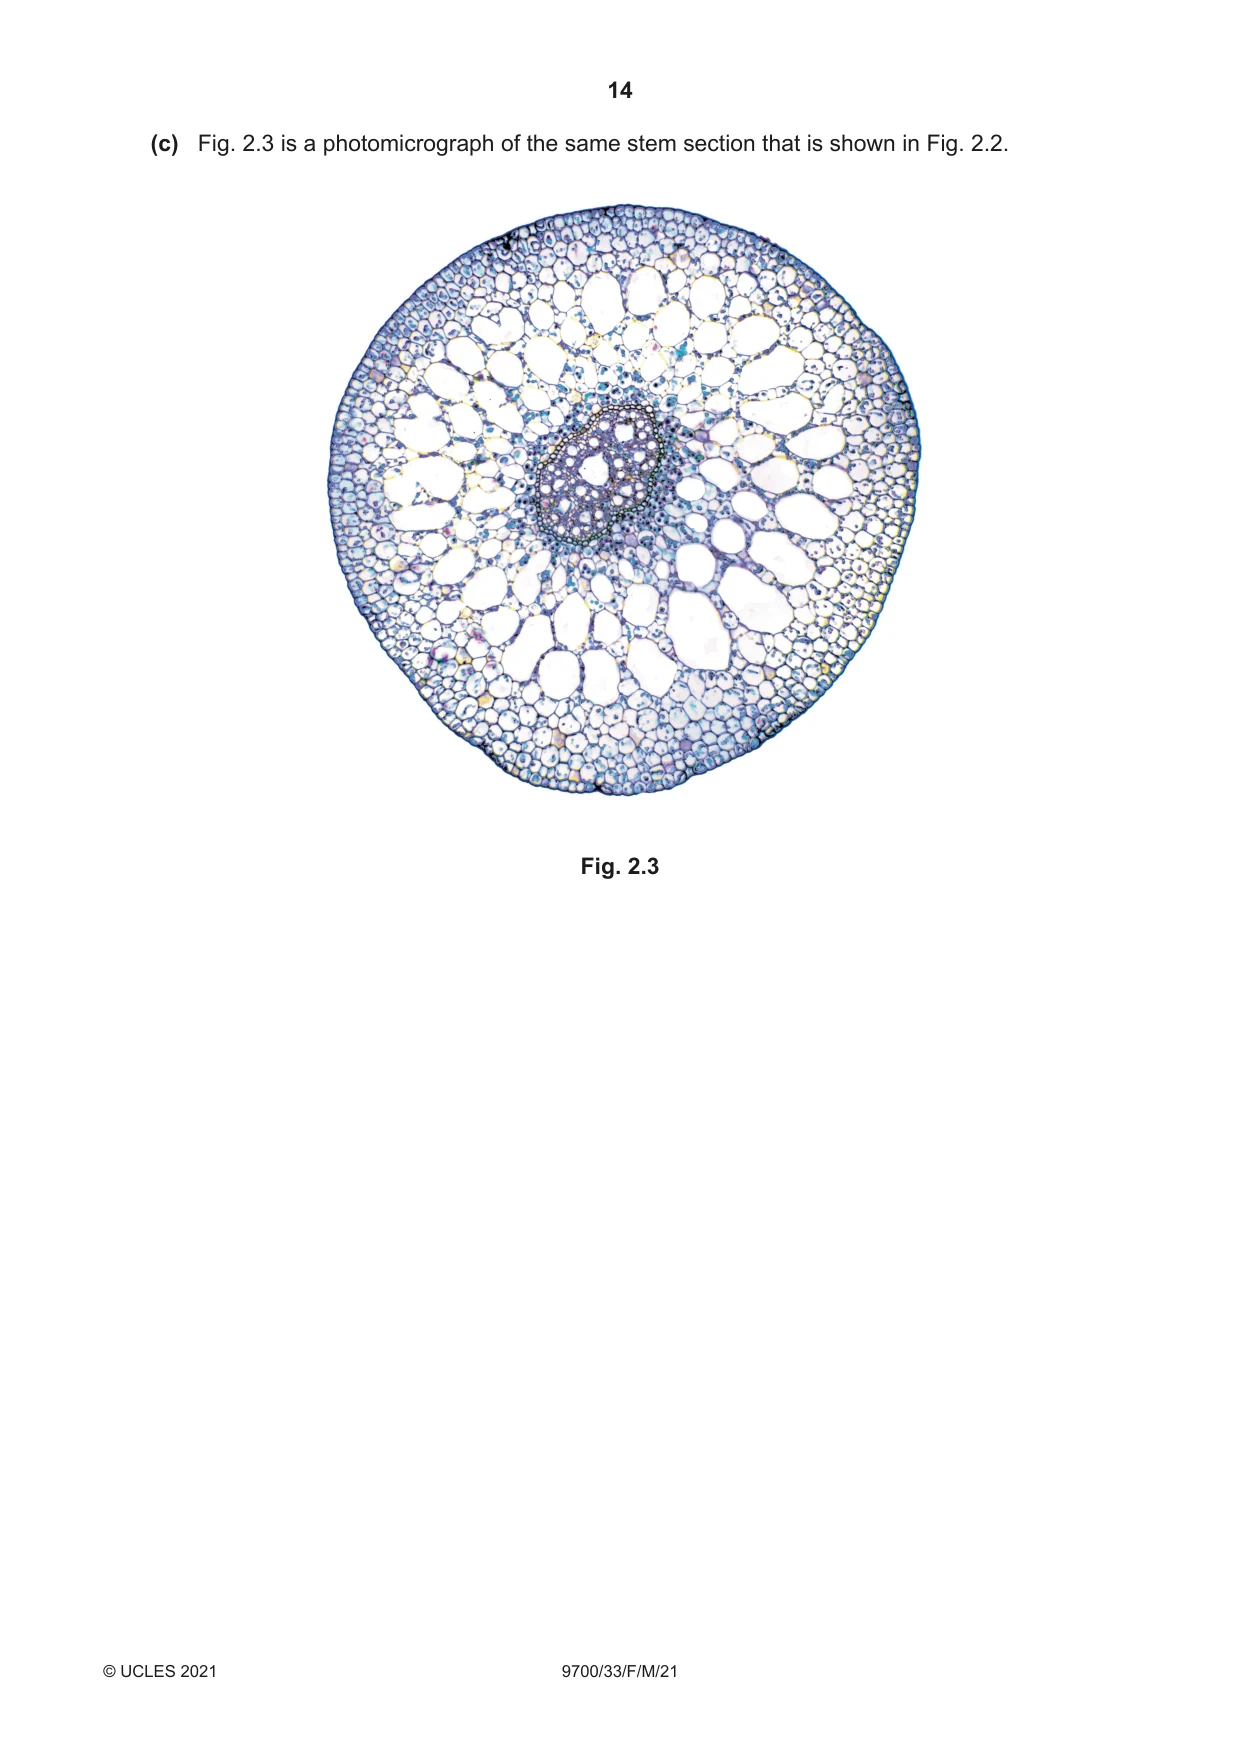
2 P1 is a slide of a stained transverse section through a plant stem. (a) Set up the microscope so that you can observe different tissues in the area of the stem on P1 shown by the shaded region in Fig. 2.1. shaded region Fig. 2.1 Use a sharp pencil for drawings. (i) Draw a large plan diagram of the area of the stem on P1 shown by the shaded region in Fig. 2.1. Your drawing should show the correct shapes and proportions of the different tissues. Use one ruled label line and label to identify the epidermis. [5] (ii) Observe the cells in the central tissue of the stem on P1. Select four adjacent, touching cells of the central tissue. Each cell that you select must touch at least two of the other cells. • Make a large drawing of this group of four touching cells. • Use one ruled label line and label to identify the cell wall of one cell. [5] (b) Fig. 2.2 is a photomicrograph of a stained transverse section through a stem of a different type of plant. This plant is adapted to live submerged in water. air spaces M M Fig. 2.2 (i) Calculate the total area, in mm2, of the image of the stem shown in Fig. 2.2. • Assume that the stem is circular in cross-section. • Measure the diameter of the image of the stem along line M–M. • Show your working. The formula for calculating the area of a circle is: area = 3.14 × r 2 (r = radius) area = ...................................................... mm2 [3]
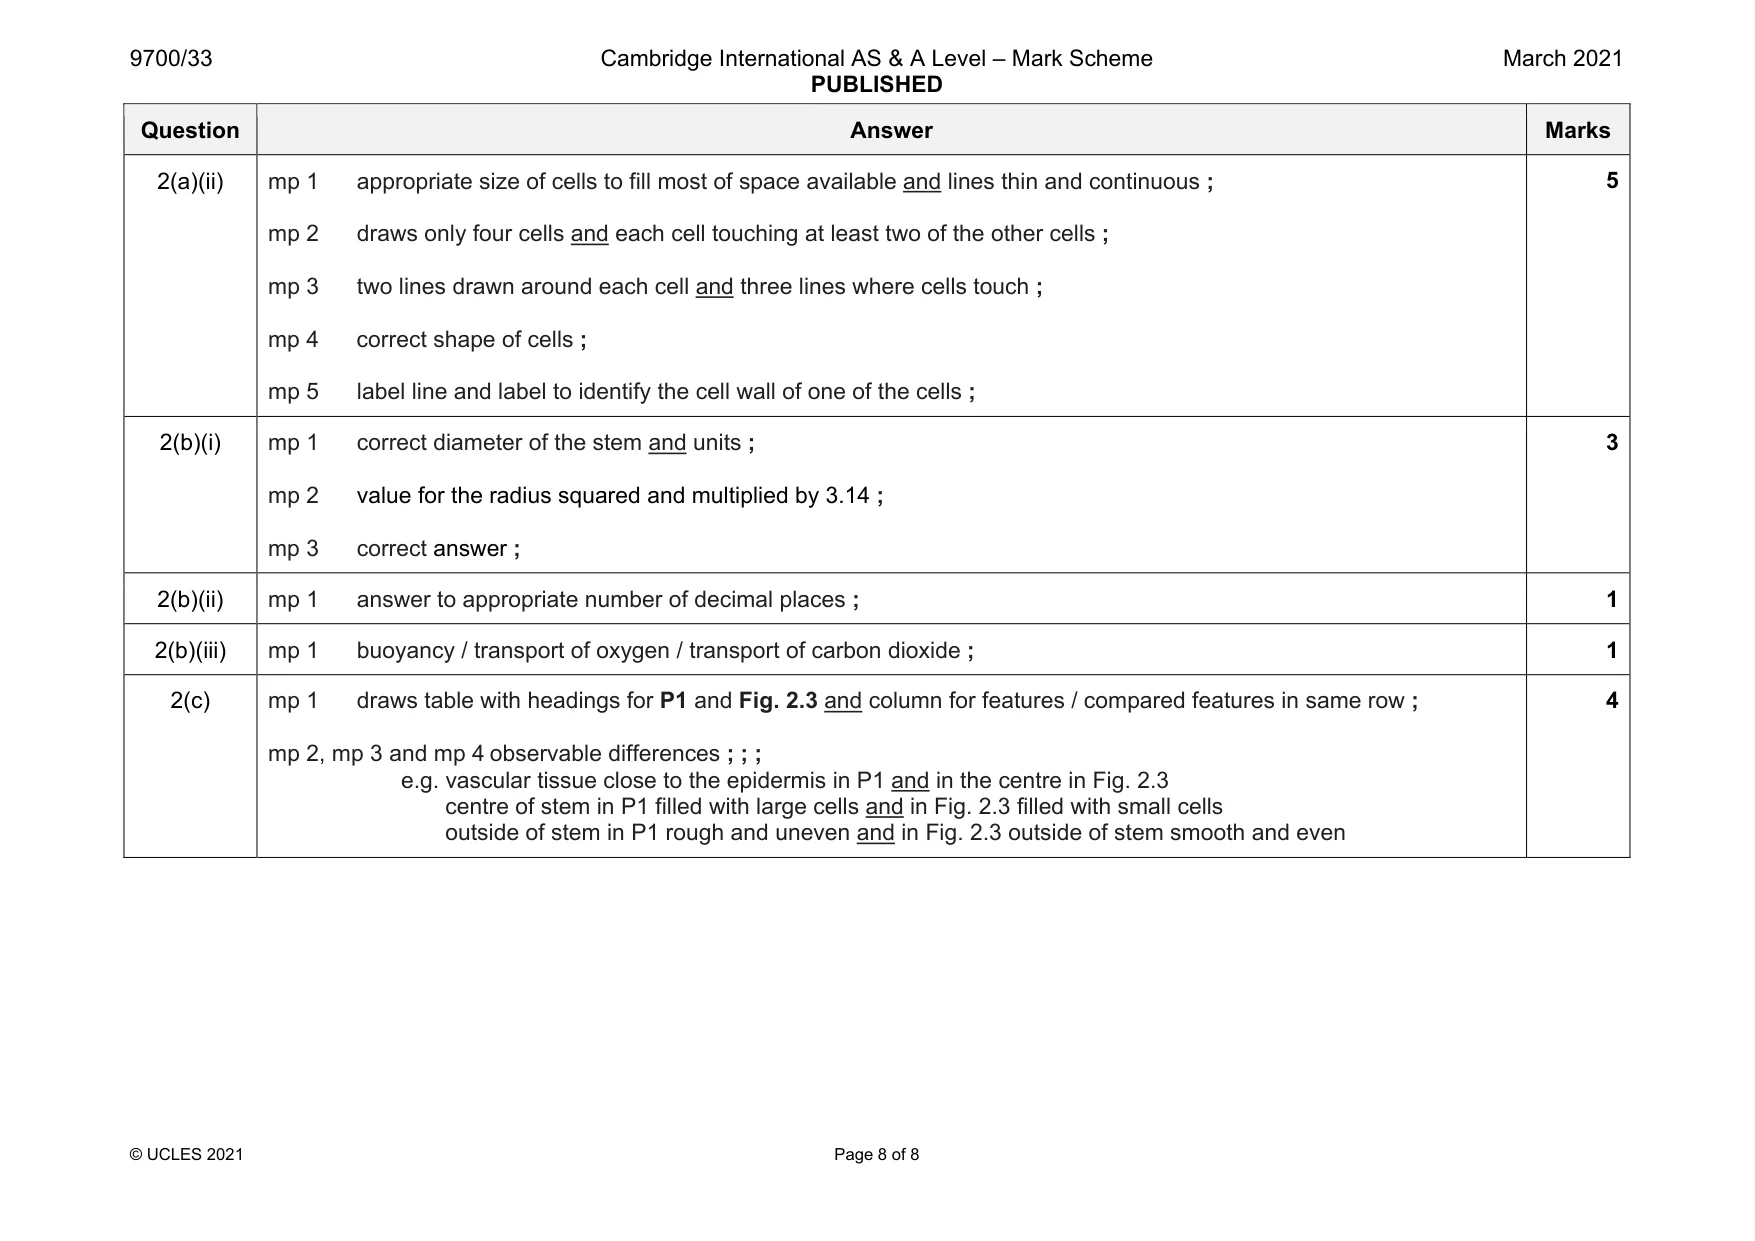
Mark scheme: 2(a)(i) mp 1 appropriate size to fill most of space available and draws at least two layers of tissue ; mp 2 draws quarter of the stem and no cells ; mp 3 draws tissues to correct proportions ; mp 4 draws correct shape of stem and shows layers of different tissues ; mp 5 label line and label to identify the epidermis ; Question Answer Marks 2(a)(ii) mp 1 appropriate size of cells to fill most of space available and lines thin and continuous ; mp 2 draws only four cells and each cell touching at least two of the other cells ; mp 3 two lines drawn around each cell and three lines where cells touch ; mp 4 correct shape of cells ; mp 5 label line and label to identify the cell wall of one of the cells ; 5 2(b)(i) mp 1 correct diameter of the stem and units ; mp 2 value for the radius squared and multiplied by 3.14 ; mp 3 correct answer ; 3 2(b)(ii) mp 1 answer to appropriate number of decimal places ; 1 2(b)(iii) mp 1 buoyancy / transport of oxygen / transport of carbon dioxide ; 1 2(c) mp 1 draws table with headings for P1 and Fig. 2.3 and column for features / compared features in same row ; mp 2, mp 3 and mp 4 observable differences ; ; ; e.g. vascular tissue close to the epidermis in P1 and in the centre in Fig. 2.3 centre of stem in P1 filled with large cells and in Fig. 2.3 filled with small cells outside of stem in P1 rough and uneven and in Fig. 2.3 outside of stem smooth and even 4
What was in this paper
The subtopics covered by these 2 questions, and how many questions each got. Open one in a new tab to see every Cambridge question on it.
What you needed in this session
Cambridge’s own grade thresholds for 2021 Feb/March, Paper 3 · Variant 3. A higher threshold means an easier paper — the bar moves with how the cohort did.