Cambridge A Level Biology 9700 — 2020 Feb/March Paper 3 · Variant 3
9700/33/F/M/20 · 2 questions · 40 marks · ≈45 min
The question paper and its mark scheme, free to read here and free to download. This is Cambridge’s own paper, exactly as it was sat.
Question paper20 pages







Mark scheme8 pages
Answers below. Sit the paper first if you are practising.
Questions as text
Q1 · Yeast cells contain an enzyme, catalase, which catalyses the release of oxygen from the…
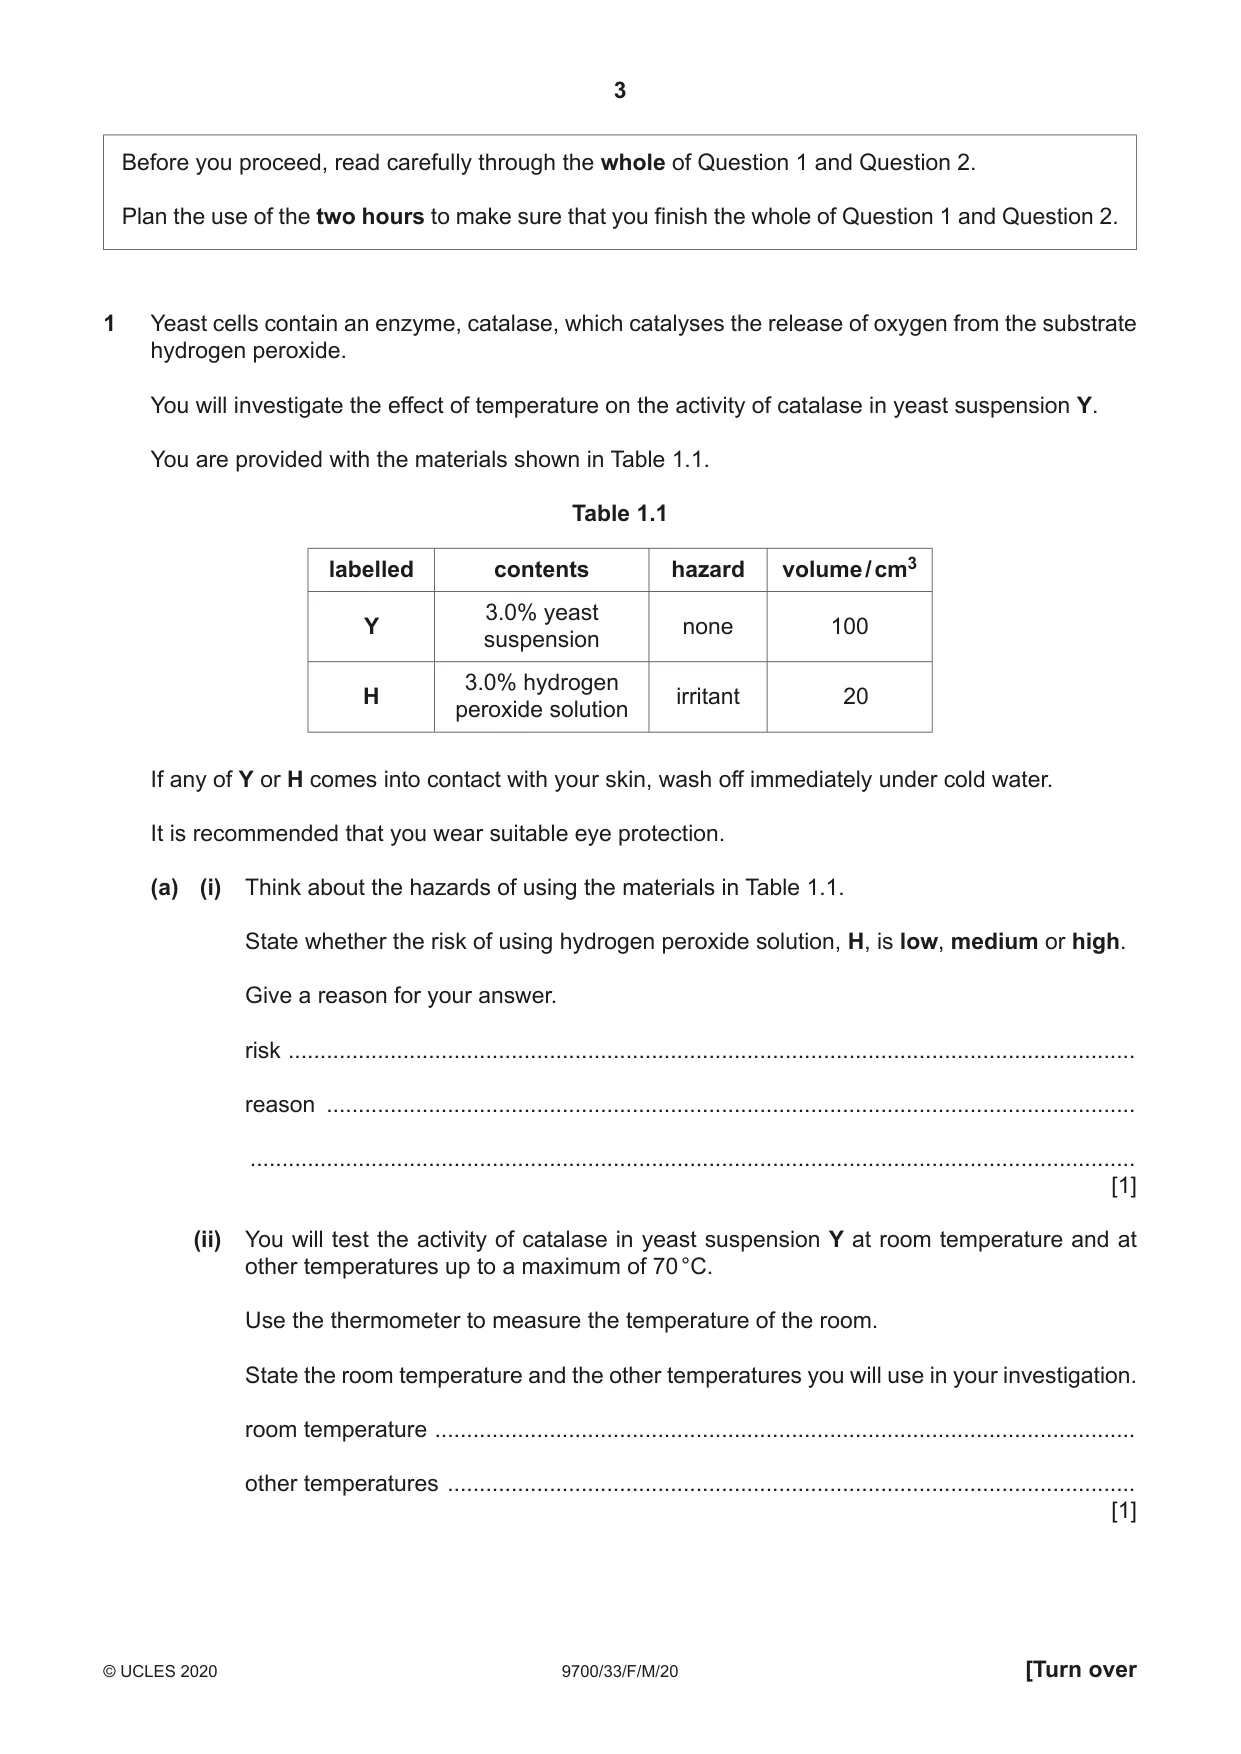
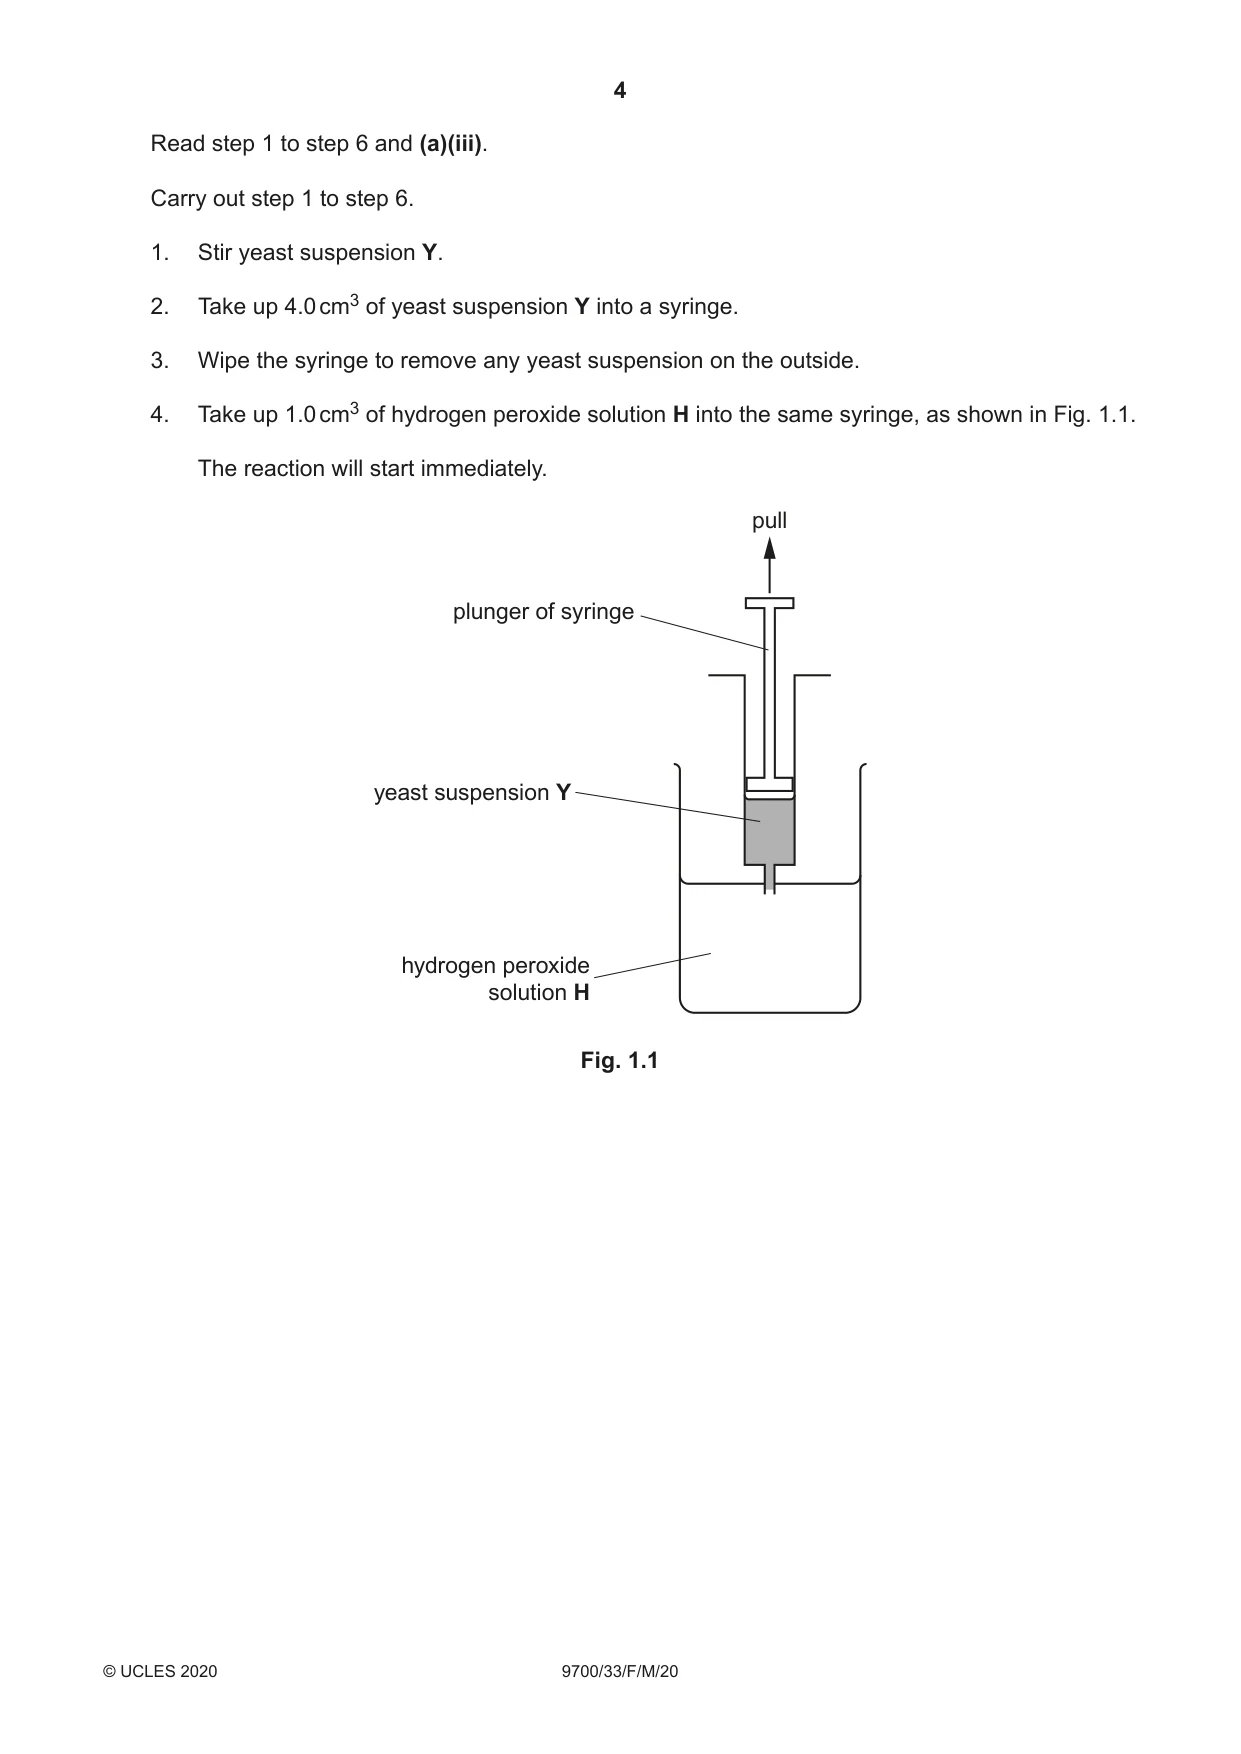
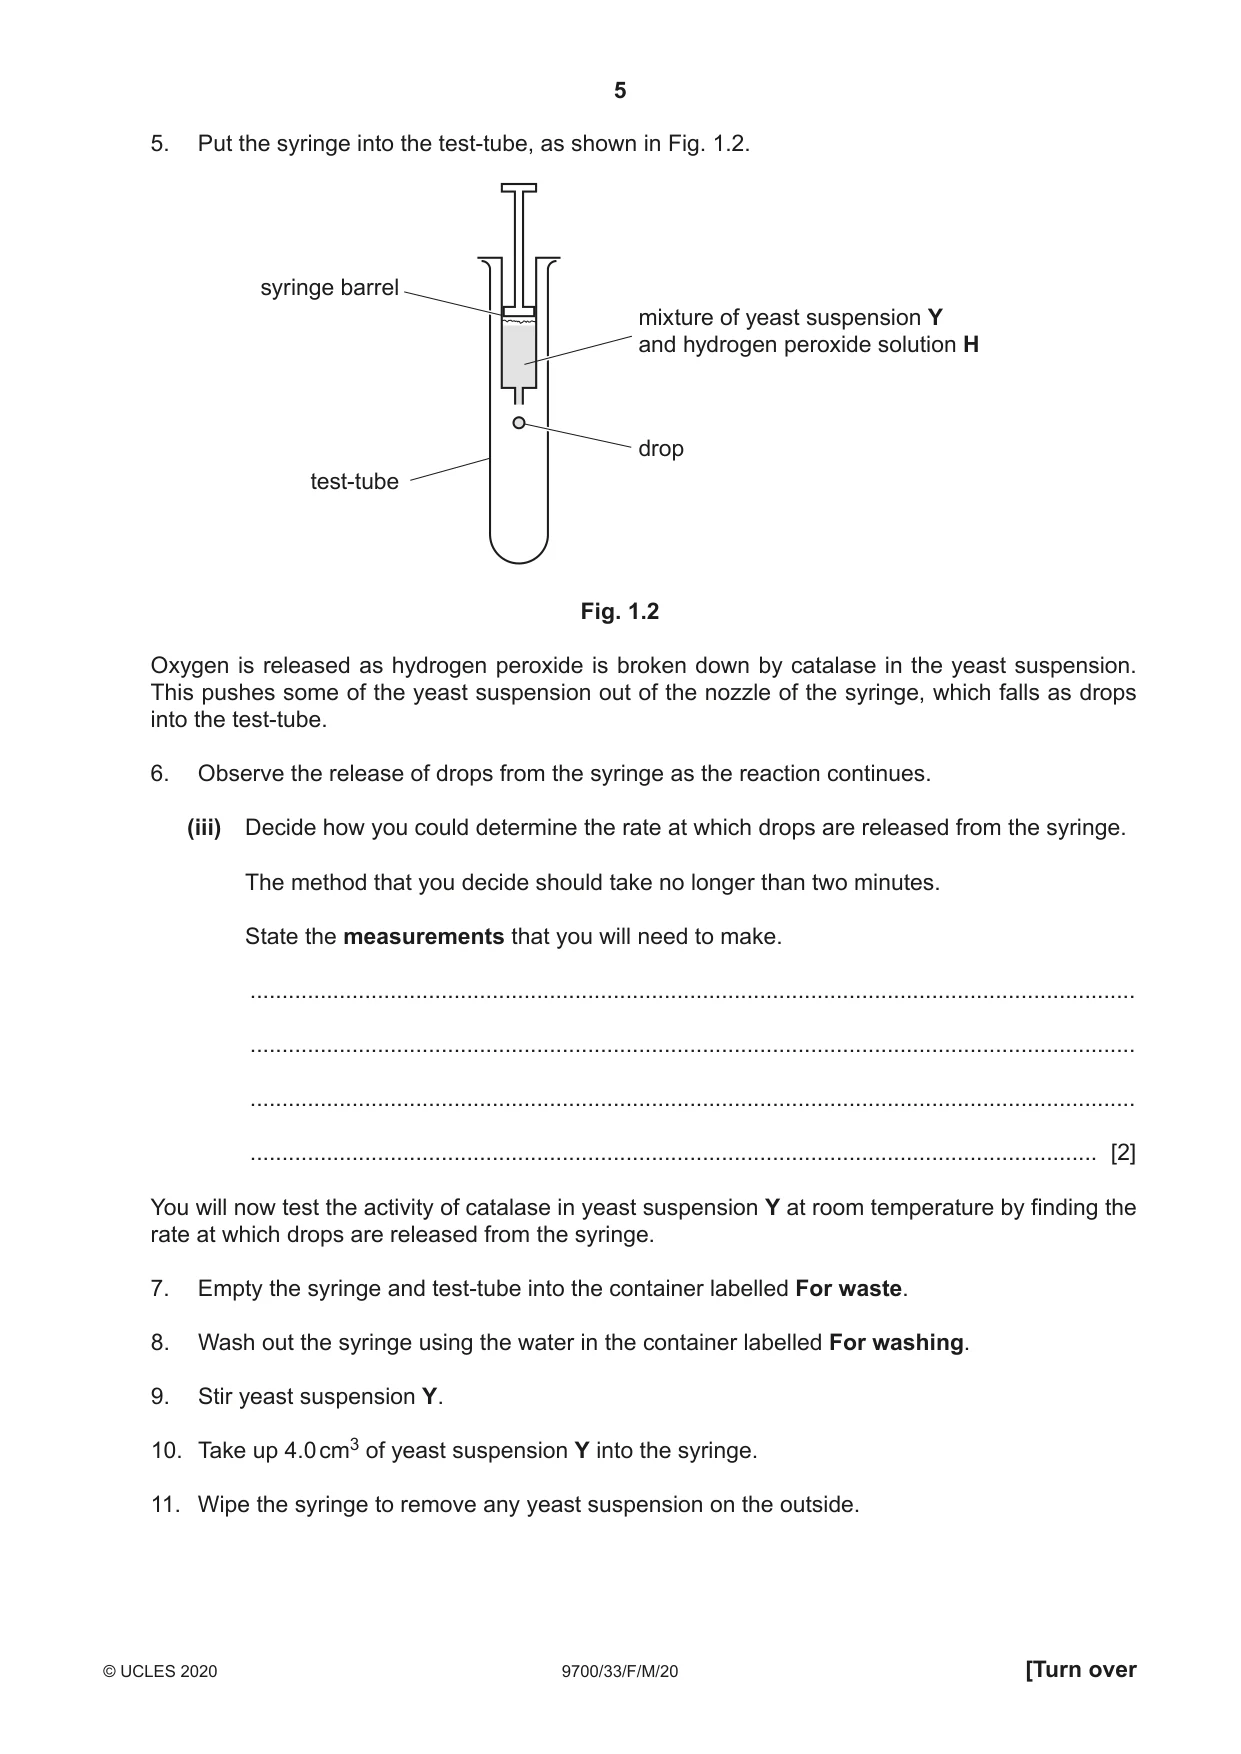
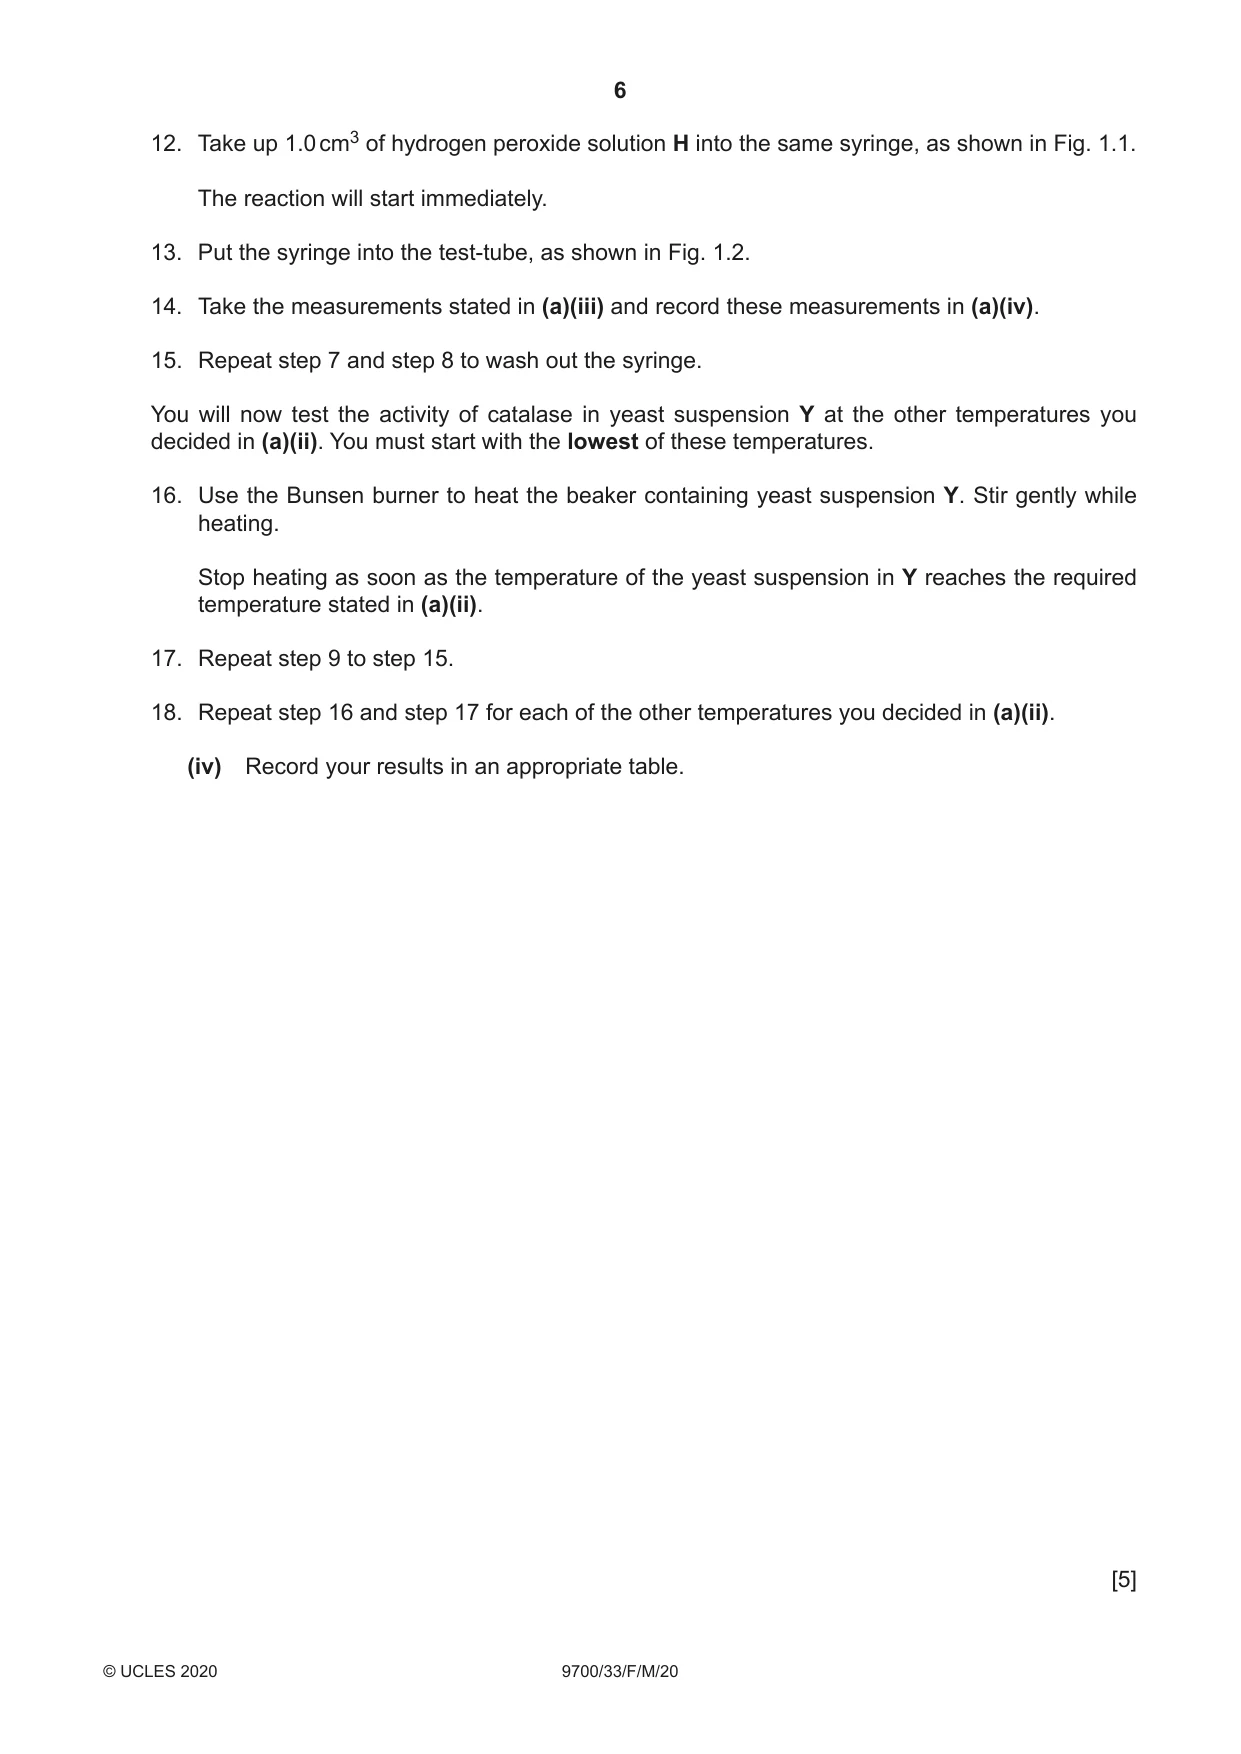
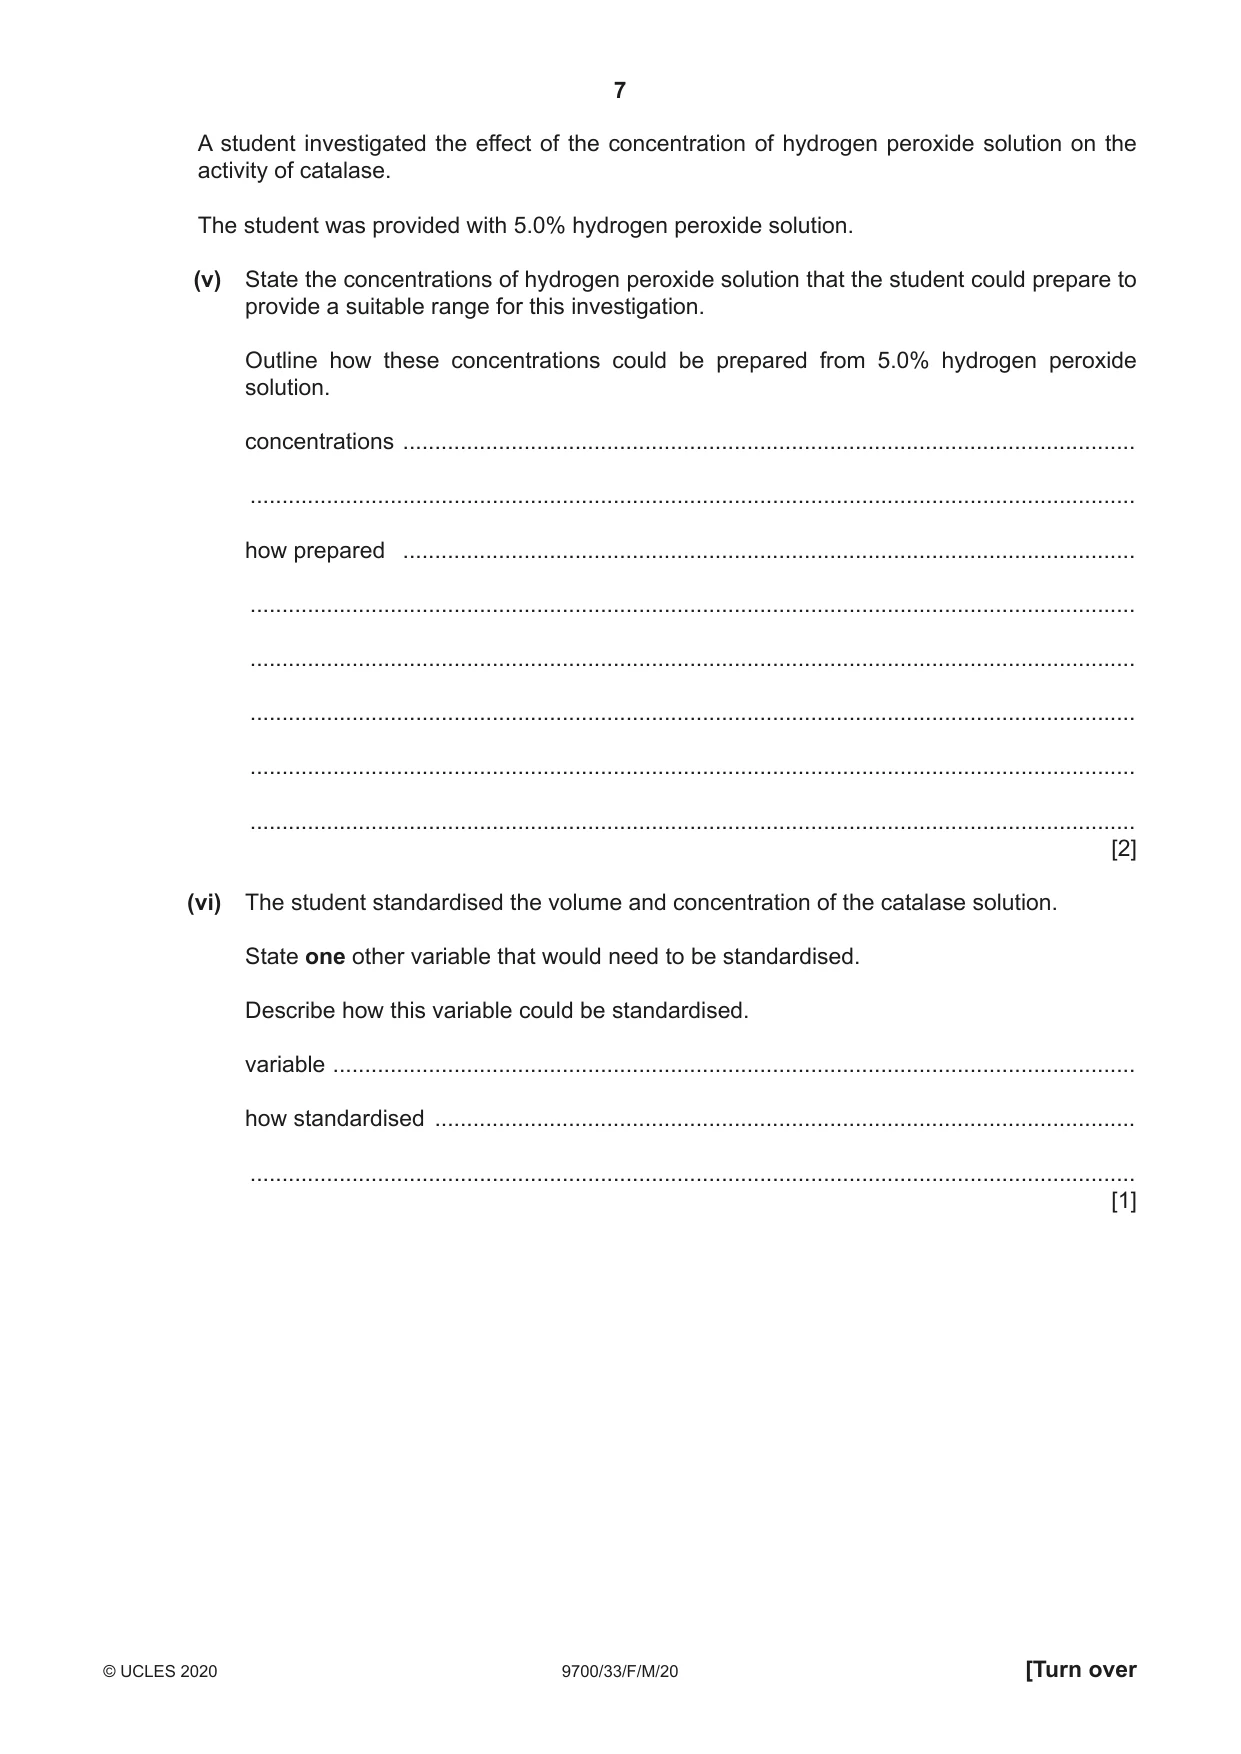
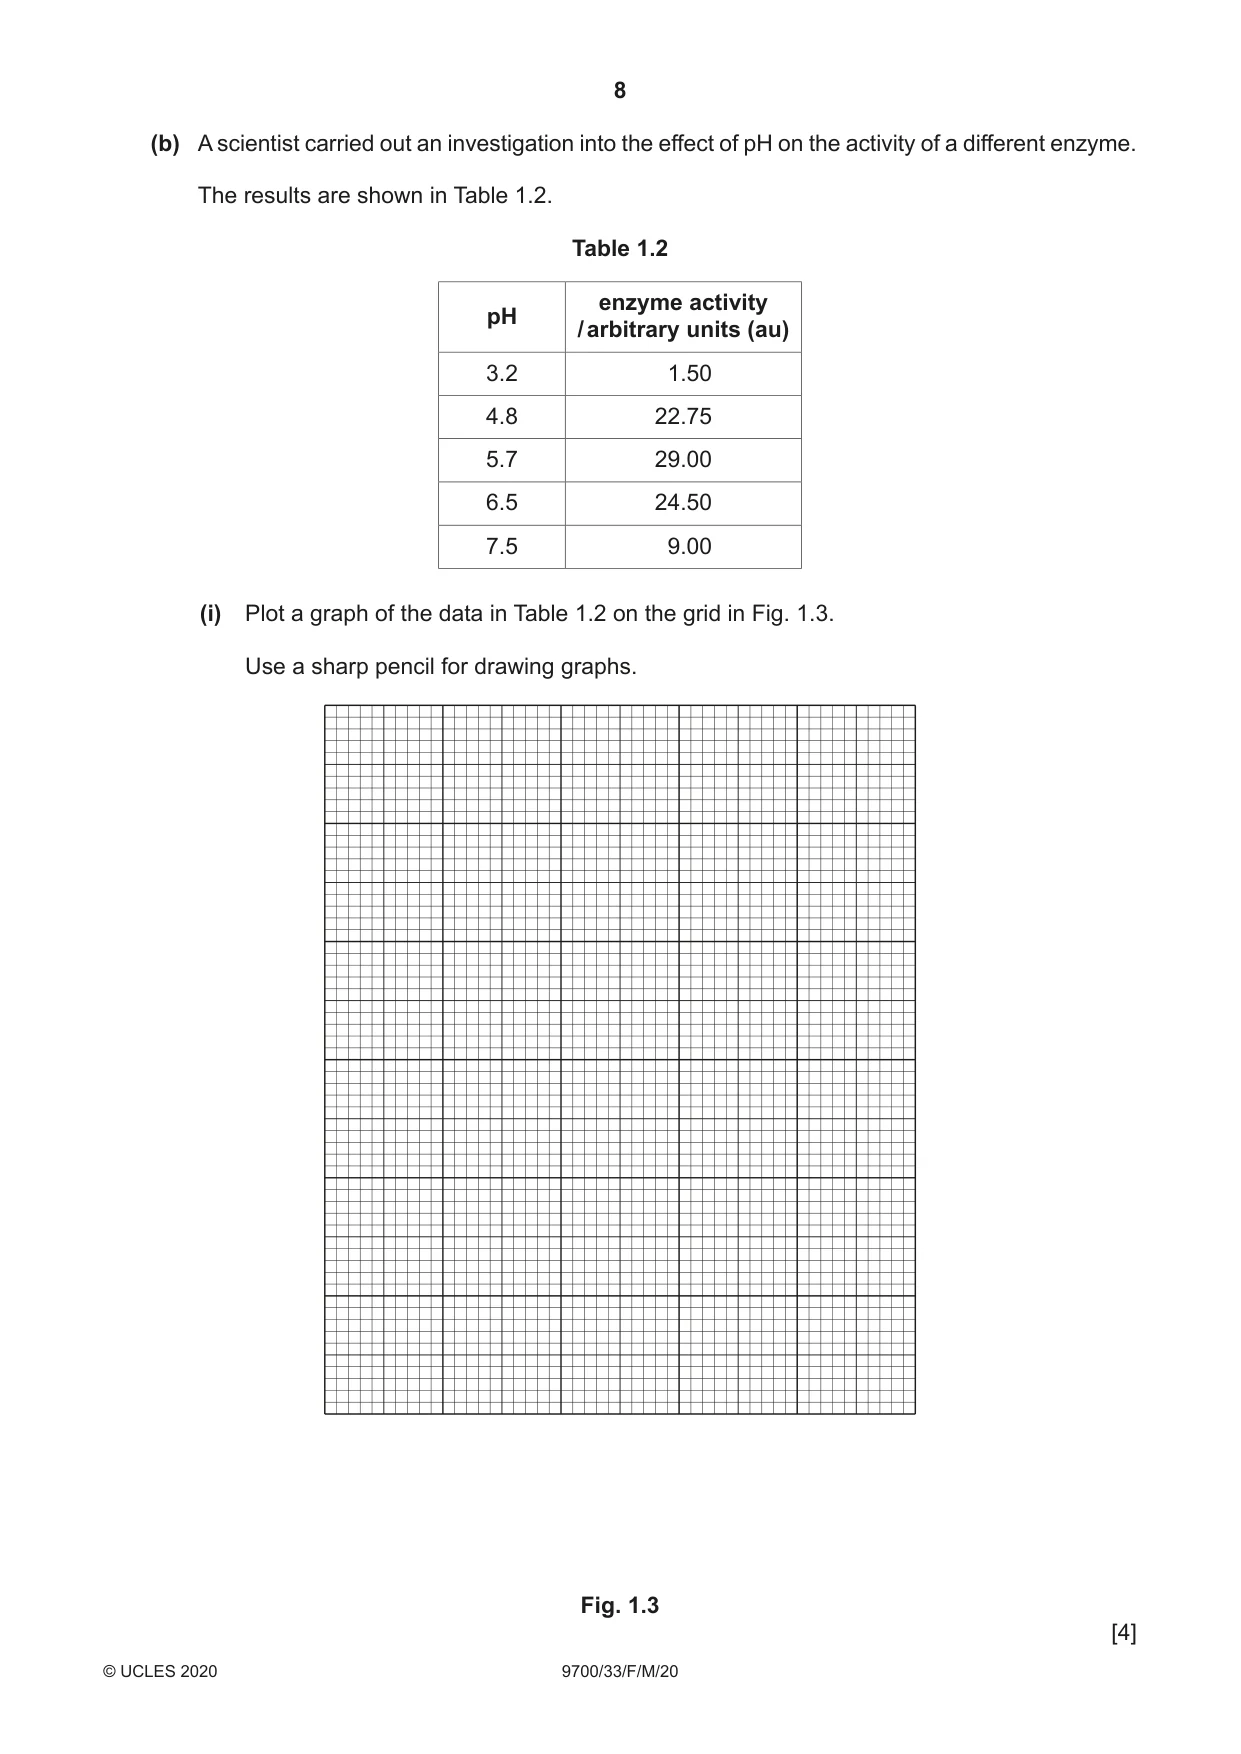
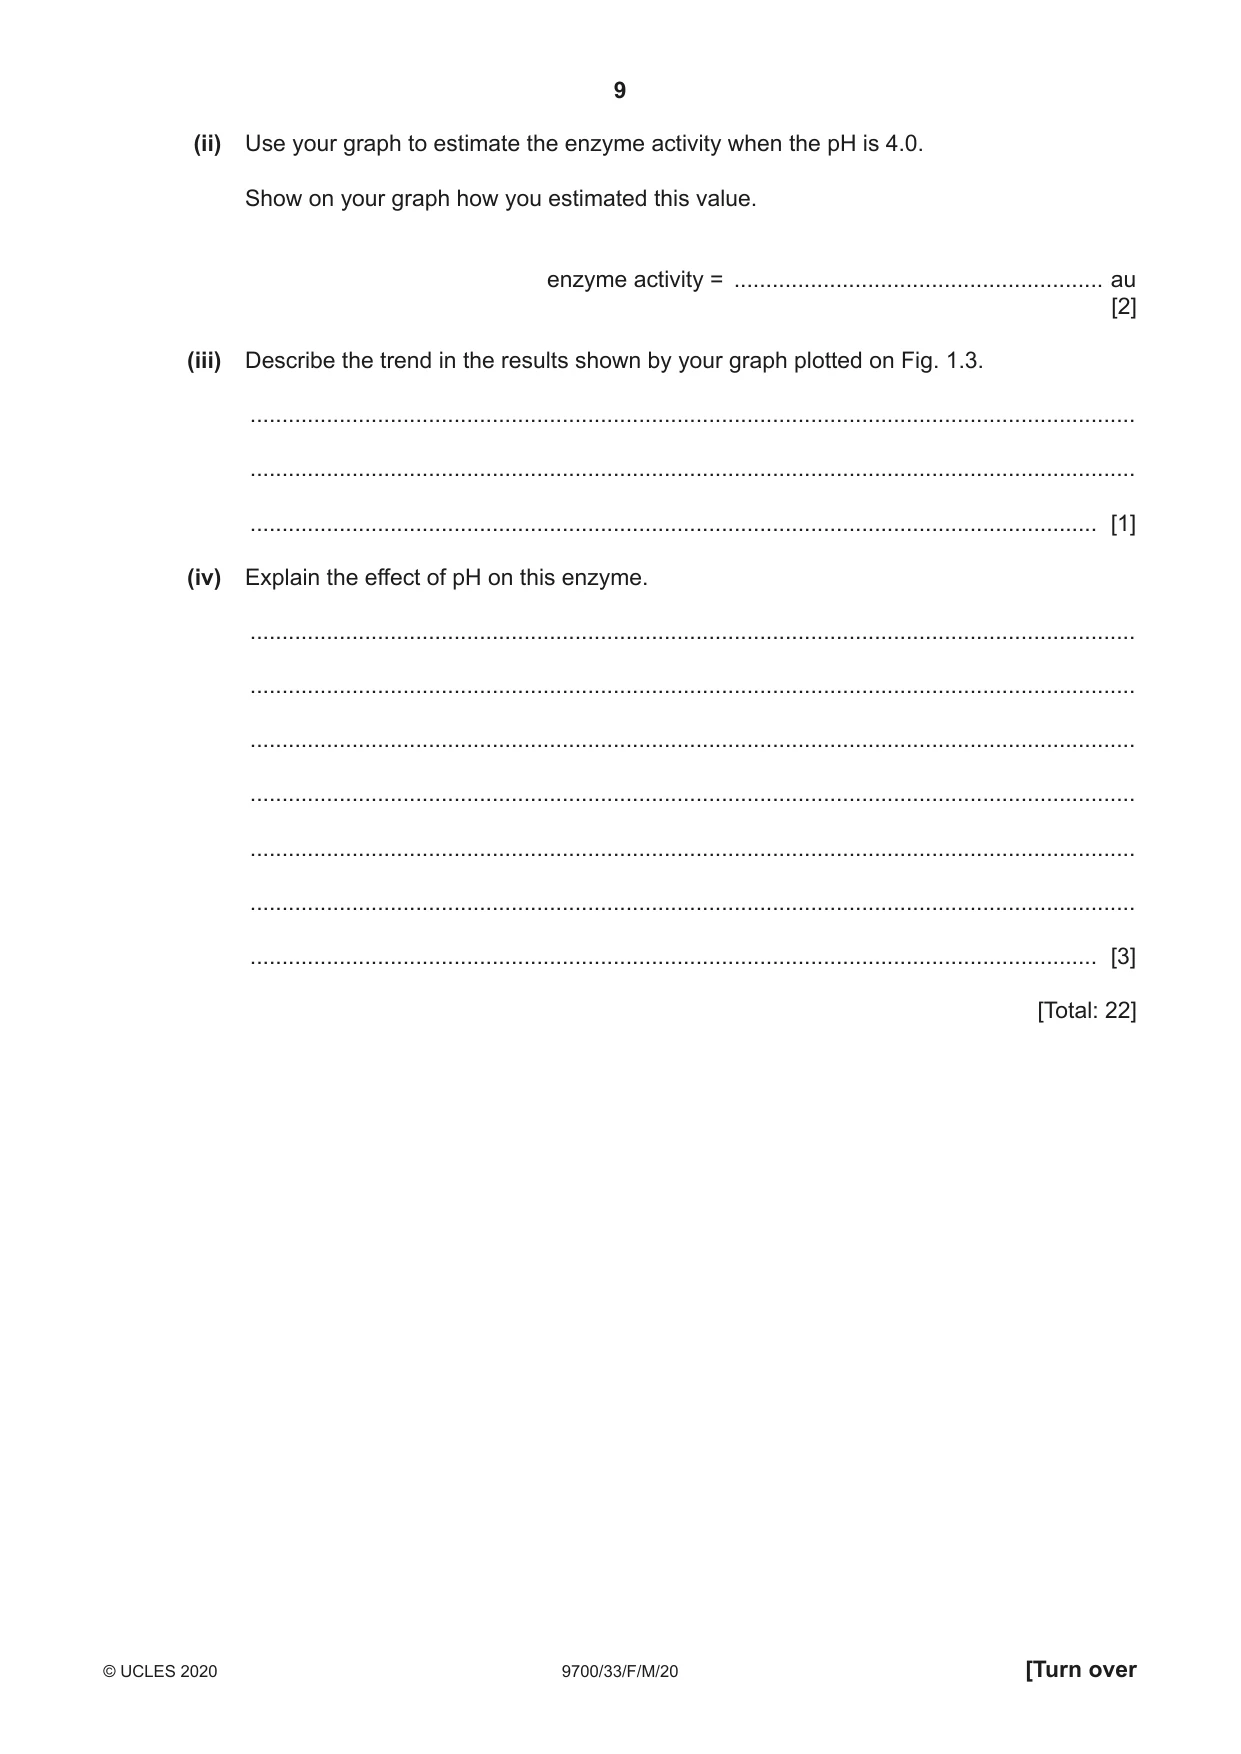
1 Yeast cells contain an enzyme, catalase, which catalyses the release of oxygen from the substrate hydrogen peroxide. You will investigate the effect of temperature on the activity of catalase in yeast suspension Y. You are provided with the materials shown in Table 1.1. Table 1.1 labelled contents hazard volume / cm3 3.0% yeast Y none 100 suspension 3.0% hydrogen H irritant 20 peroxide solution If any of Y or H comes into contact with your skin, wash off immediately under cold water. It is recommended that you wear suitable eye protection. (a) (i) Think about the hazards of using the materials in Table 1.1. State whether the risk of using hydrogen peroxide solution, H, is low, medium or high. Give a reason for your answer. risk ..................................................................................................................................... reason ............................................................................................................................... ........................................................................................................................................... [1] (ii) You will test the activity of catalase in yeast suspension Y at room temperature and at other temperatures up to a maximum of 70 °C. Use the thermometer to measure the temperature of the room. State the room temperature and the other temperatures you will use in your investigation. room temperature .............................................................................................................. other temperatures ............................................................................................................ [1] Read step 1 to step 6 and (a)(iii). Carry out step 1 to step 6. 1. Stir yeast suspension Y. 2. Take up 4.0 cm3 of yeast suspension Y into a syringe. 3. Wipe the syringe to remove any yeast suspension on the outside. 4. Take up 1.0 cm3 of hydrogen peroxide solution H into the same syringe, as shown in Fig. 1.1. The reaction will start immediately. pull plunger of syringe yeast suspension Y hydrogen peroxide solution H Fig. 1.1 5. Put the syringe into the test-tube, as shown in Fig. 1.2. syringe barrel mixture of yeast suspension Y and hydrogen peroxide solution H drop test-tube Fig. 1.2 Oxygen is released as hydrogen peroxide is broken down by catalase in the yeast suspension. This pushes some of the yeast suspension out of the nozzle of the syringe, which falls as drops into the test-tube. 6. Observe the release of drops from the syringe as the reaction continues. (iii) Decide how you could determine the rate at which drops are released from the syringe. The method that you decide should take no longer than two minutes. State the measurements that you will need to make. ........................................................................................................................................... ........................................................................................................................................... ........................................................................................................................................... ..................................................................................................................................... [2] You will now test the activity of catalase in yeast suspension Y at room temperature by finding the rate at which drops are released from the syringe. 7. Empty the syringe and test-tube into the container labelled For waste. 8. Wash out the syringe using the water in the container labelled For washing. 9. Stir yeast suspension Y. 10. Take up 4.0 cm3 of yeast suspension Y into the syringe. 11. Wipe the syringe to remove any yeast suspension on the outside. 12. Take up 1.0 cm3 of hydrogen peroxide solution H into the same syringe, as shown in Fig. 1.1. The reaction will start immediately. 13. Put the syringe into the test-tube, as shown in Fig. 1.2. 14. Take the measurements stated in (a)(iii) and record these measurements in (a)(iv). 15. Repeat step 7 and step 8 to wash out the syringe. You will now test the activity of catalase in yeast suspension Y at the other temperatures you decided in (a)(ii). You must start with the lowest of these temperatures. 16. Use the Bunsen burner to heat the beaker containing yeast suspension Y. Stir gently while heating. Stop heating as soon as the temperature of the yeast suspension in Y reaches the required temperature stated in (a)(ii). 17. Repeat step 9 to step 15. 18. Repeat step 16 and step 17 for each of the other temperatures you decided in (a)(ii). (iv) Record your results in an appropriate table. [5] A student investigated the effect of the concentration of hydrogen peroxide solution on the activity of catalase. The student was provided with 5.0% hydrogen peroxide solution. (v) State the concentrations of hydrogen peroxide solution that the student could prepare to provide a suitable range for this investigation. Outline how these concentrations could be prepared from 5.0% hydrogen peroxide solution. concentrations ................................................................................................................... ........................................................................................................................................... how prepared ................................................................................................................... ........................................................................................................................................... ........................................................................................................................................... ........................................................................................................................................... ........................................................................................................................................... ........................................................................................................................................... [2] (vi) The student standardised the volume and concentration of the catalase solution. State one other variable that would need to be standardised. Describe how this variable could be standardised. variable .............................................................................................................................. how standardised .............................................................................................................. ........................................................................................................................................... [1] (b) A scientist carried out an investigation into the effect of pH on the activity of a different enzyme. The results are shown in Table 1.2. Table 1.2 enzyme activity pH / arbitrary units (au) 3.2 1.50 4.8 22.75 5.7 29.00 6.5 24.50 7.5 9.00 (i) Plot a graph of the data in Table 1.2 on the grid in Fig. 1.3. Use a sharp pencil for drawing graphs. Fig. 1.3 [4] (ii) Use your graph to estimate the enzyme activity when the pH is 4.0. Show on your graph how you estimated this value. enzyme activity = .......................................................... au [2] (iii) Describe the trend in the results shown by your graph plotted on Fig. 1.3. ........................................................................................................................................... ........................................................................................................................................... ..................................................................................................................................... [1] (iv) Explain the effect of pH on this enzyme. ........................................................................................................................................... ........................................................................................................................................... ........................................................................................................................................... ........................................................................................................................................... ........................................................................................................................................... ........................................................................................................................................... ..................................................................................................................................... [3] [Total: 22]
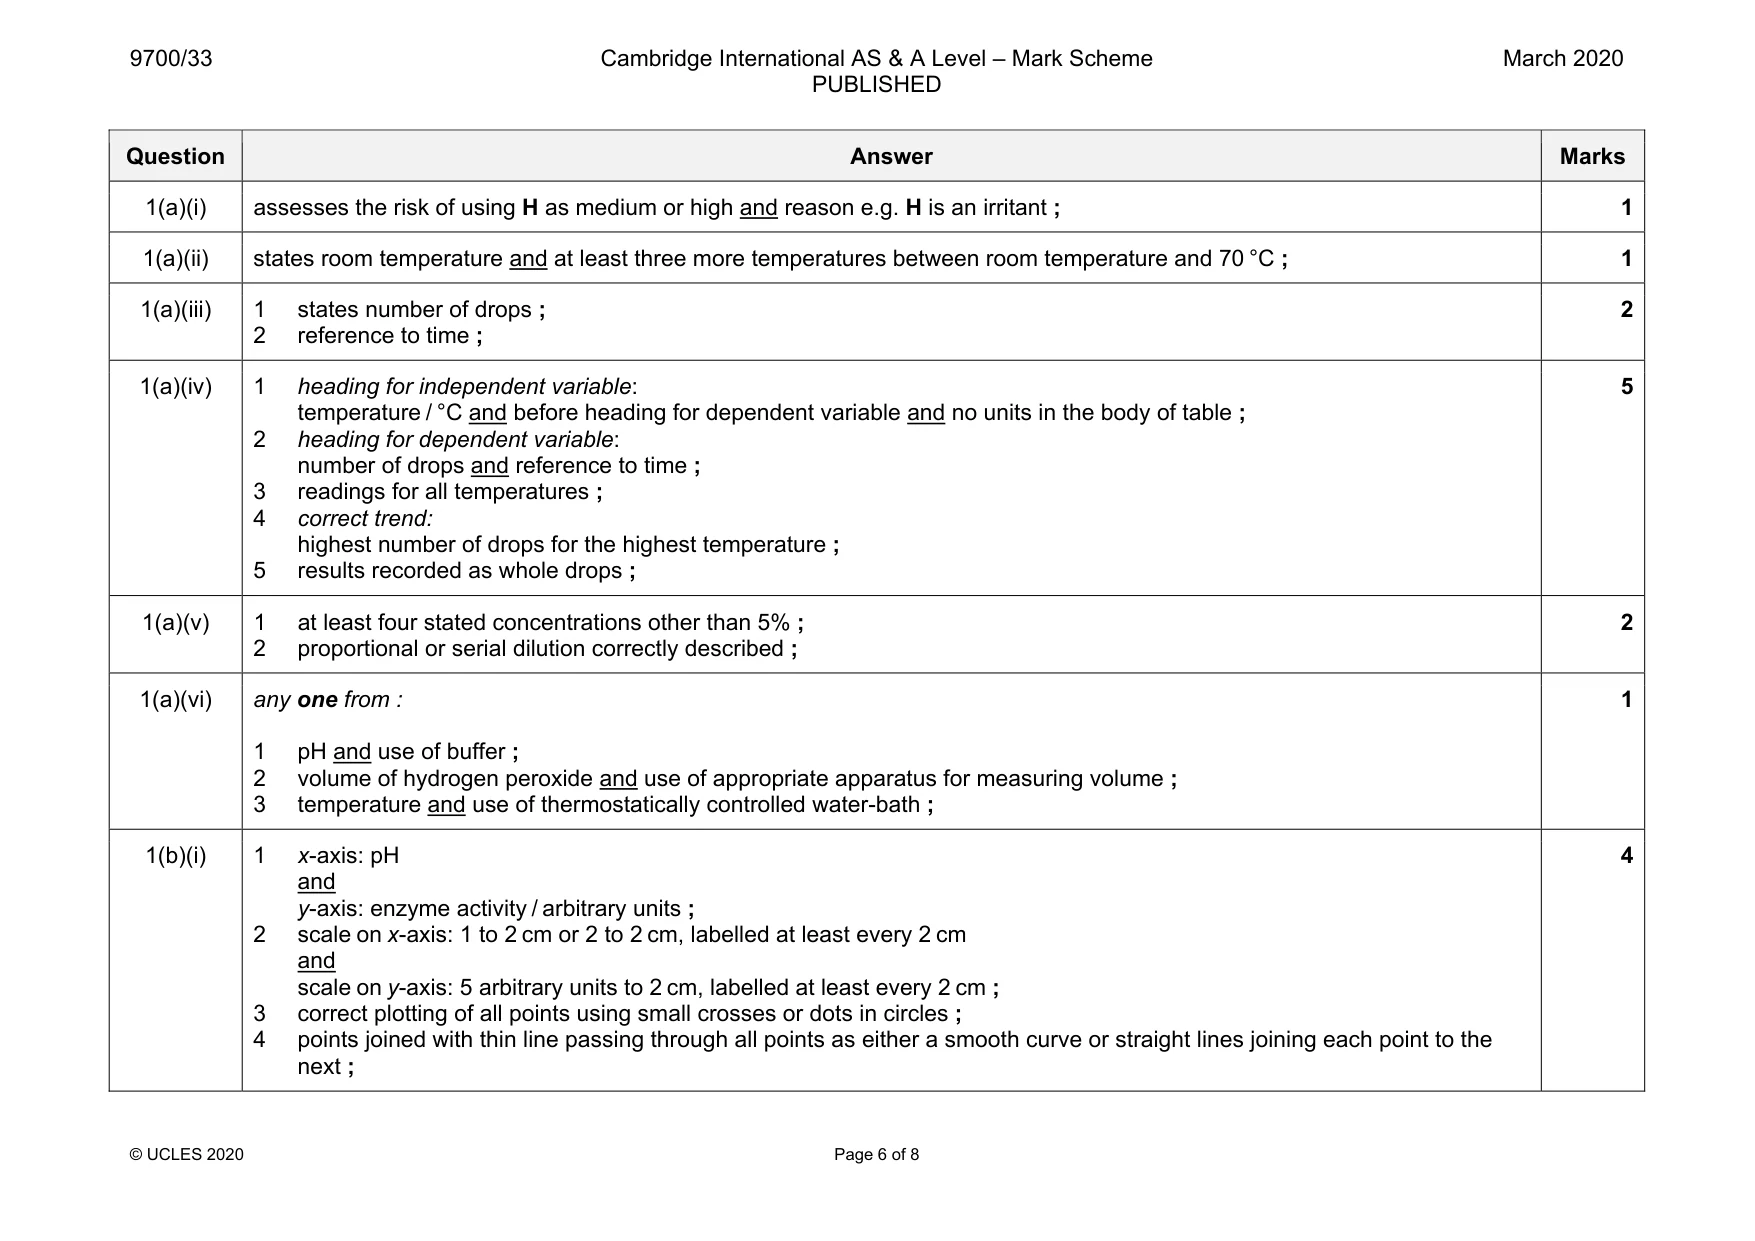
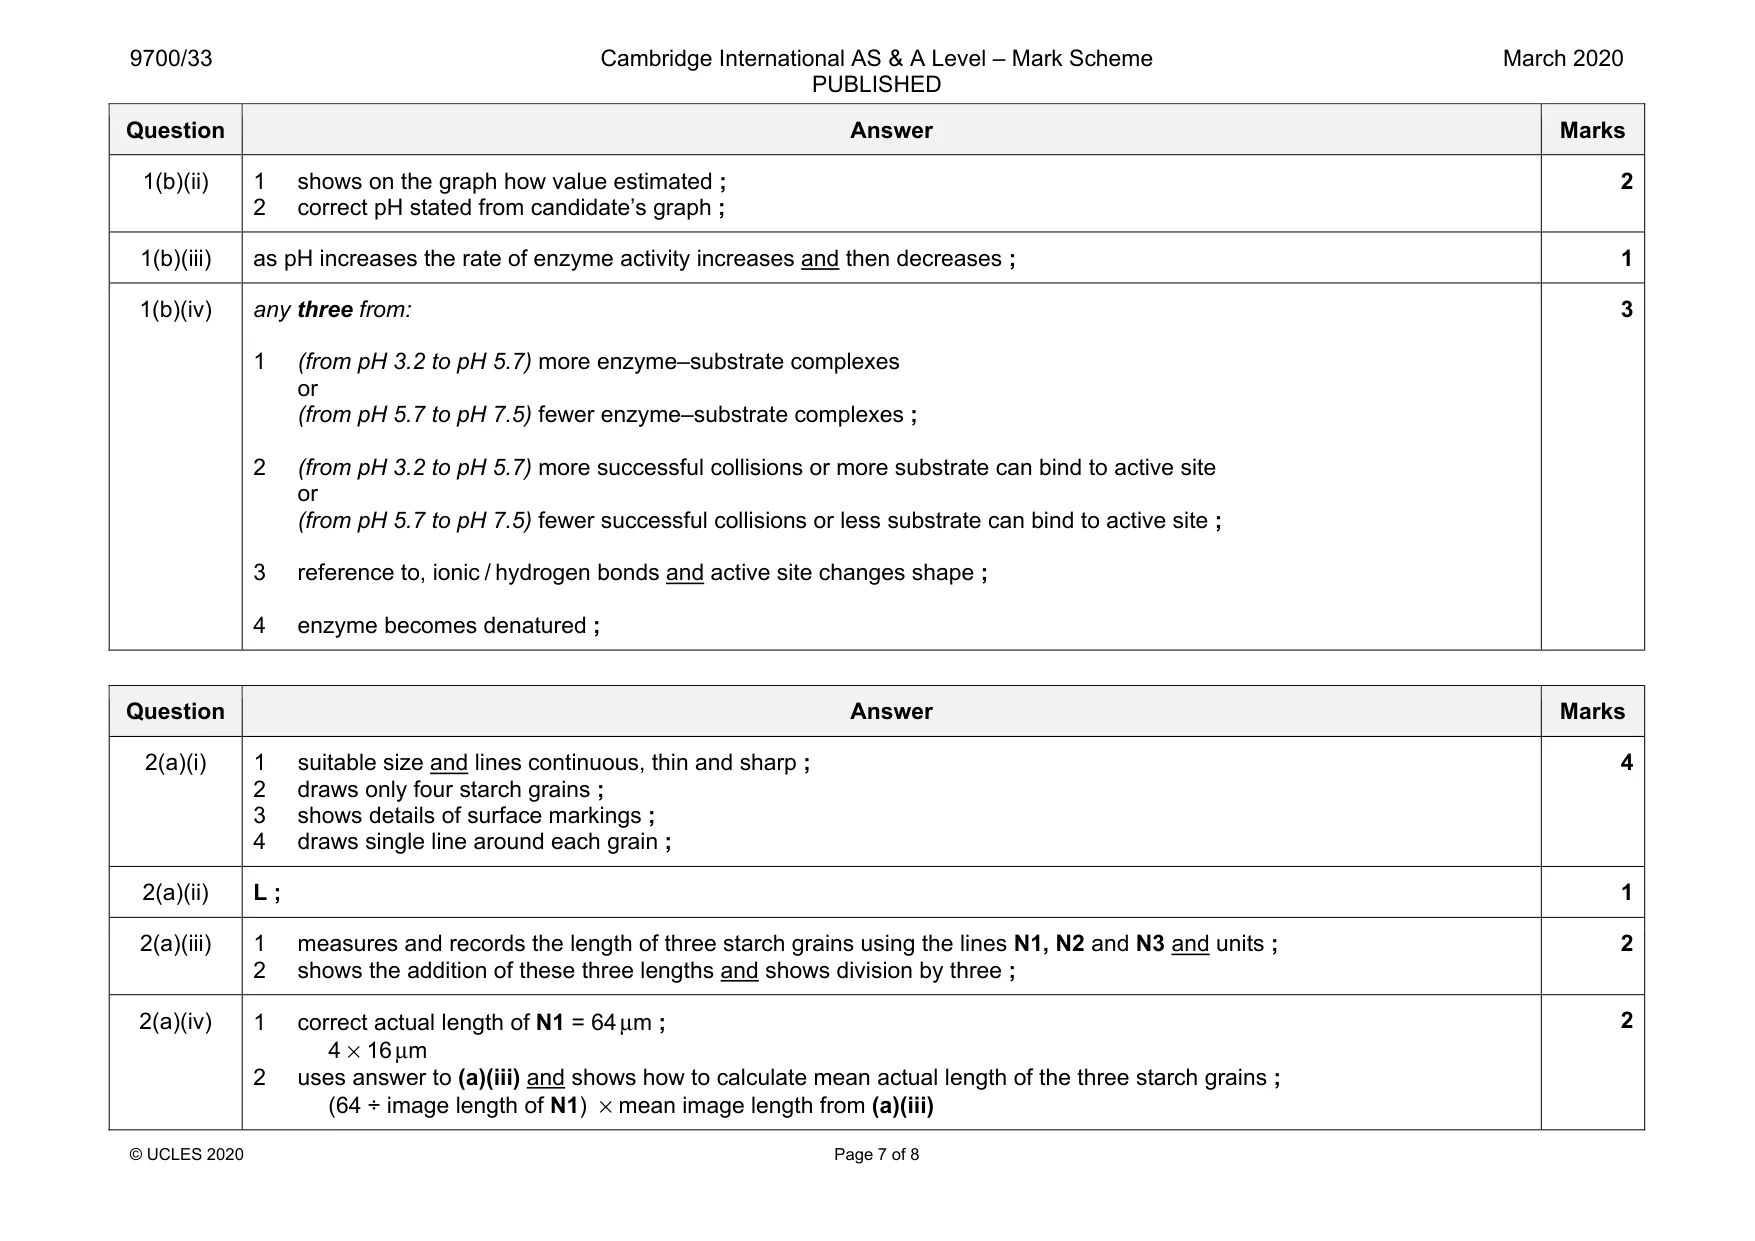
Mark scheme: 1(a)(i) assesses the risk of using H as medium or high and reason e.g. H is an irritant ; 1 1(a)(ii) states room temperature and at least three more temperatures between room temperature and 70 °C ; 1 1(a)(iii) 1 states number of drops ; 2 reference to time ; 2 1(a)(iv) 1 heading for independent variable: temperature / °C and before heading for dependent variable and no units in the body of table ; 2 heading for dependent variable: number of drops and reference to time ; 3 readings for all temperatures ; 4 correct trend: highest number of drops for the highest temperature ; 5 results recorded as whole drops ; 5 1(a)(v) 1 at least four stated concentrations other than 5% ; 2 proportional or serial dilution correctly described ; 2 1(a)(vi) any one from : 1 pH and use of buffer ; 2 volume of hydrogen peroxide and use of appropriate apparatus for measuring volume ; 3 temperature and use of thermostatically controlled water-bath ; 1 1(b)(i) 1 x-axis: pH and y-axis: enzyme activity / arbitrary units ; 2 scale on x-axis: 1 to 2 cm or 2 to 2 cm, labelled at least every 2 cm and scale on y-axis: 5 arbitrary units to 2 cm, labelled at least every 2 cm ; 3 correct plotting of all points using small crosses or dots in circles ; 4 points joined with thin line passing through all points as either a smooth curve or straight lines joining each point to the next ; 4 Question Answer Marks 1(b)(ii) 1 shows on the graph how value estimated ; 2 correct pH stated from candidate’s graph ; 2 1(b)(iii) as pH increases the rate of enzyme activity increases and then decreases ; 1 1(b)(iv) any three from: 1 (from pH 3.2 to pH 5.7) more enzyme–substrate complexes or (from pH 5.7 to pH 7.5) fewer enzyme–substrate complexes ; 2 (from pH 3.2 to pH 5.7) more successful collisions or more substrate can bind to active site or (from pH 5.7 to pH 7.5) fewer successful collisions or less substrate can bind to active site ; 3 reference to, ionic / hydrogen bonds and active site changes shape ; 4 enzyme becomes denatured ; 3
Q2 · Starch grains from different types of plant differ in size and shape
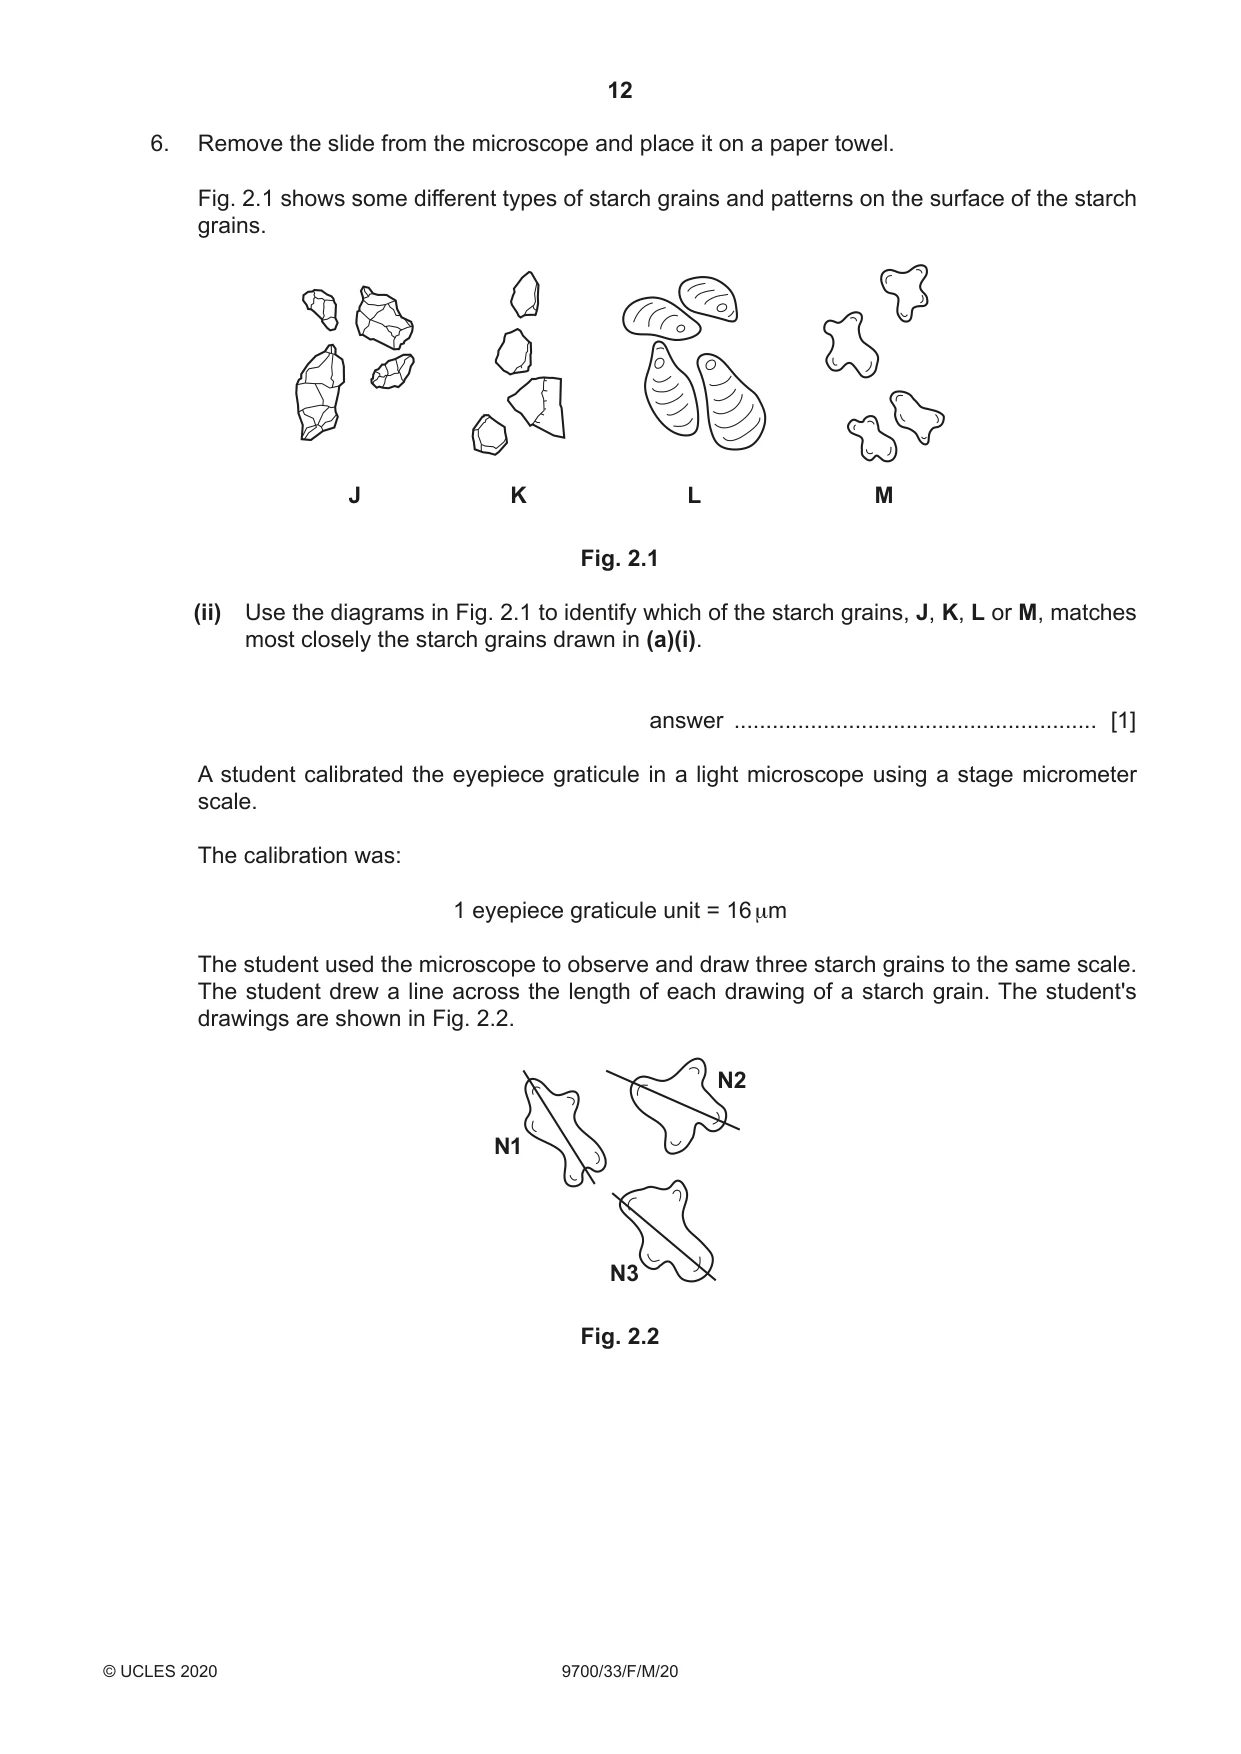
2 Starch grains from different types of plant differ in size and shape. Some starch grains have rings on their surfaces. You will now observe and draw starch grains from one type of plant. 1. Put one clean and dry microscope slide onto a paper towel. 2. Using a pipette, put a few drops of S onto the slide. S is a suspension of starch grains. 3. Cover the drops of S on the slide with a coverslip and use a paper towel to remove any excess suspension. 4. Use the microscope to find and observe the starch grains on the slide. You may need to reduce the amount of light entering the microscope and adjust the fine focus to observe the starch grains clearly. 5. Select, from a single field of view, four starch grains that show different sizes and features. (a) (i) Make a large drawing of the four starch grains that you have selected. [4] 6. Remove the slide from the microscope and place it on a paper towel. Fig. 2.1 shows some different types of starch grains and patterns on the surface of the starch grains. J K L M Fig. 2.1 (ii) Use the diagrams in Fig. 2.1 to identify which of the starch grains, J, K, L or M, matches most closely the starch grains drawn in (a)(i). answer ......................................................... [1] A student calibrated the eyepiece graticule in a light microscope using a stage micrometer scale. The calibration was: 1 eyepiece graticule unit = 16 μm The student used the microscope to observe and draw three starch grains to the same scale. The student drew a line across the length of each drawing of a starch grain. The student's drawings are shown in Fig. 2.2. N2 N1 N3 Fig. 2.2 (iii) Find the mean image length of the three starch grains drawn by the student, along the lines shown in Fig. 2.2. Show all the steps in your working and use appropriate units. mean image length = ............................................................... [2] (iv) When viewed using the microscope, the student found that starch grain N1 measured 4 eyepiece graticule units along the position of the line drawn in Fig. 2.2. Use this information and your answer to (a)(iii) to calculate the mean actual length of the three starch grains in Fig. 2.2. Show all the steps in your working and use appropriate units. mean actual length = ............................................................... [2]
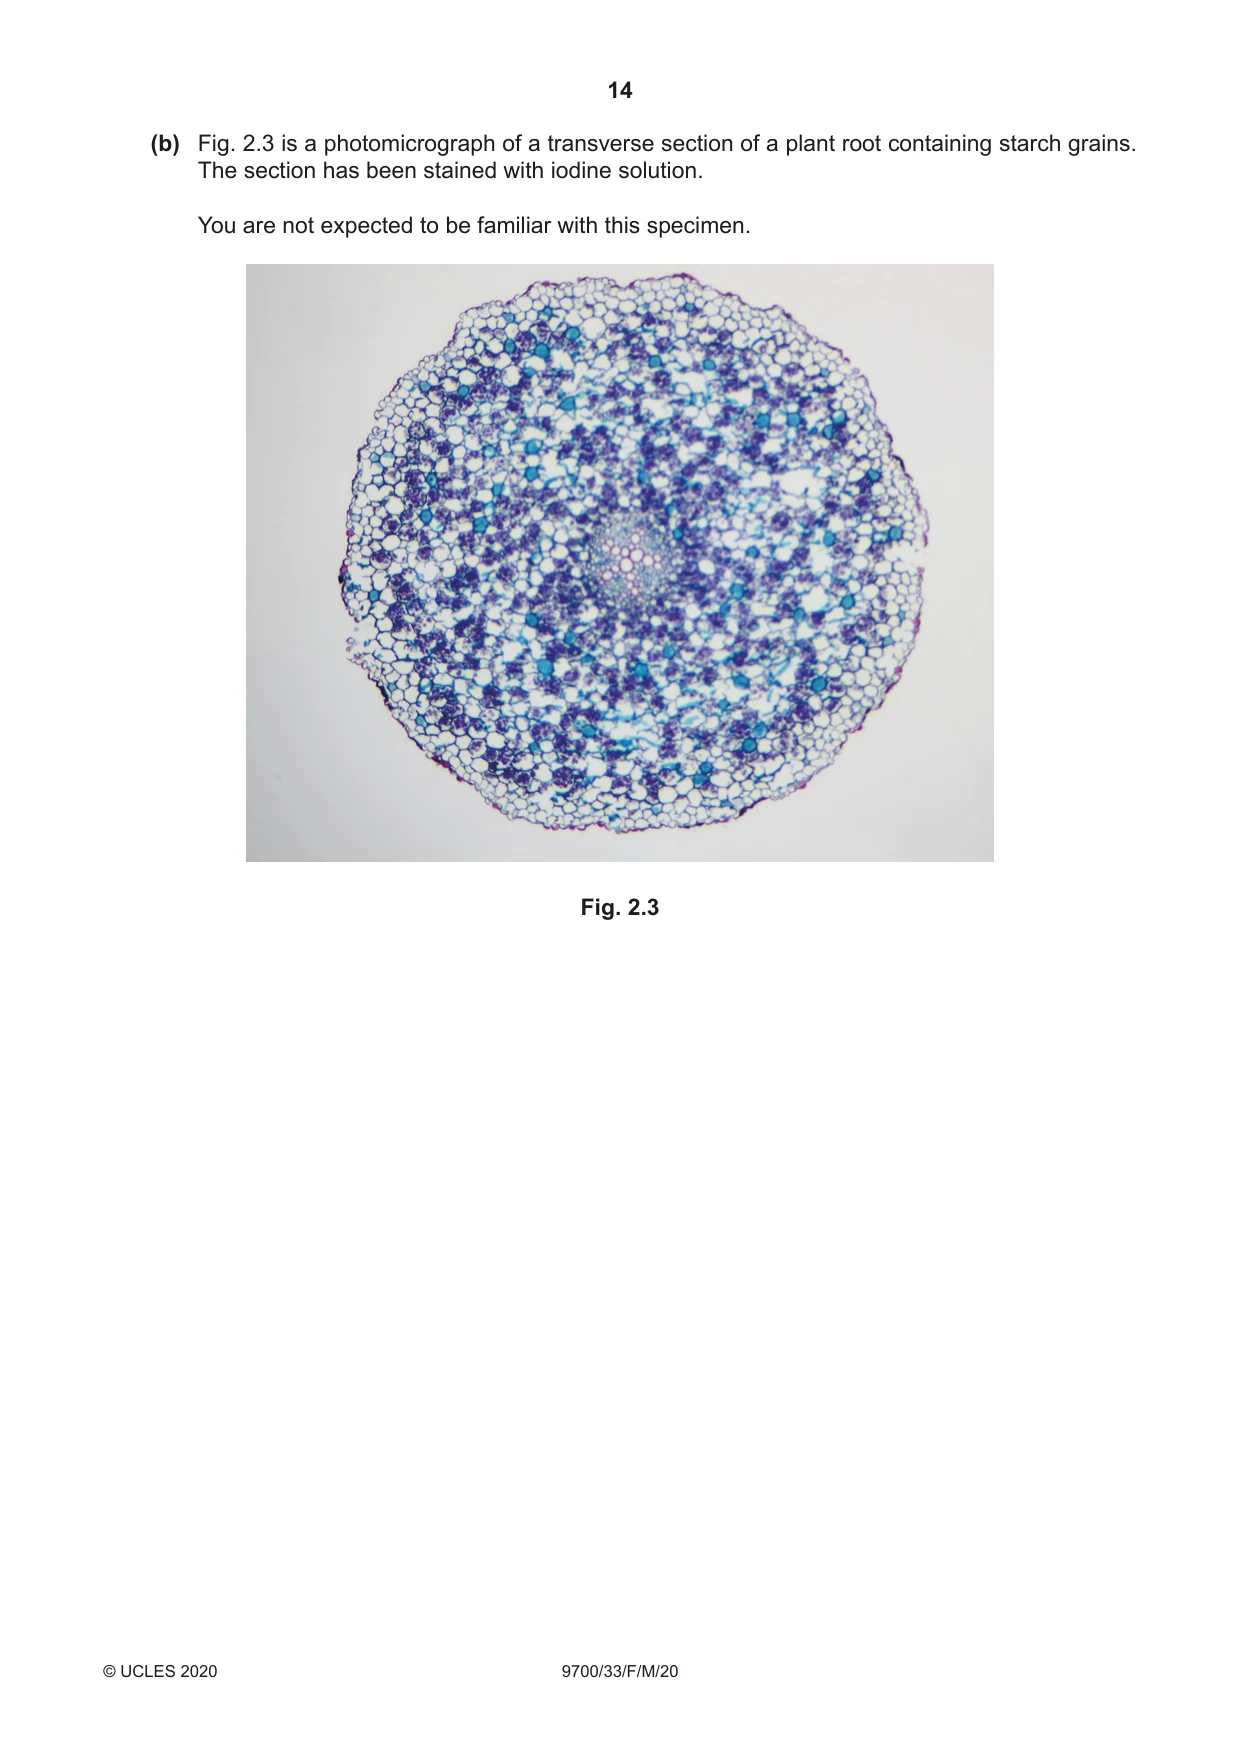
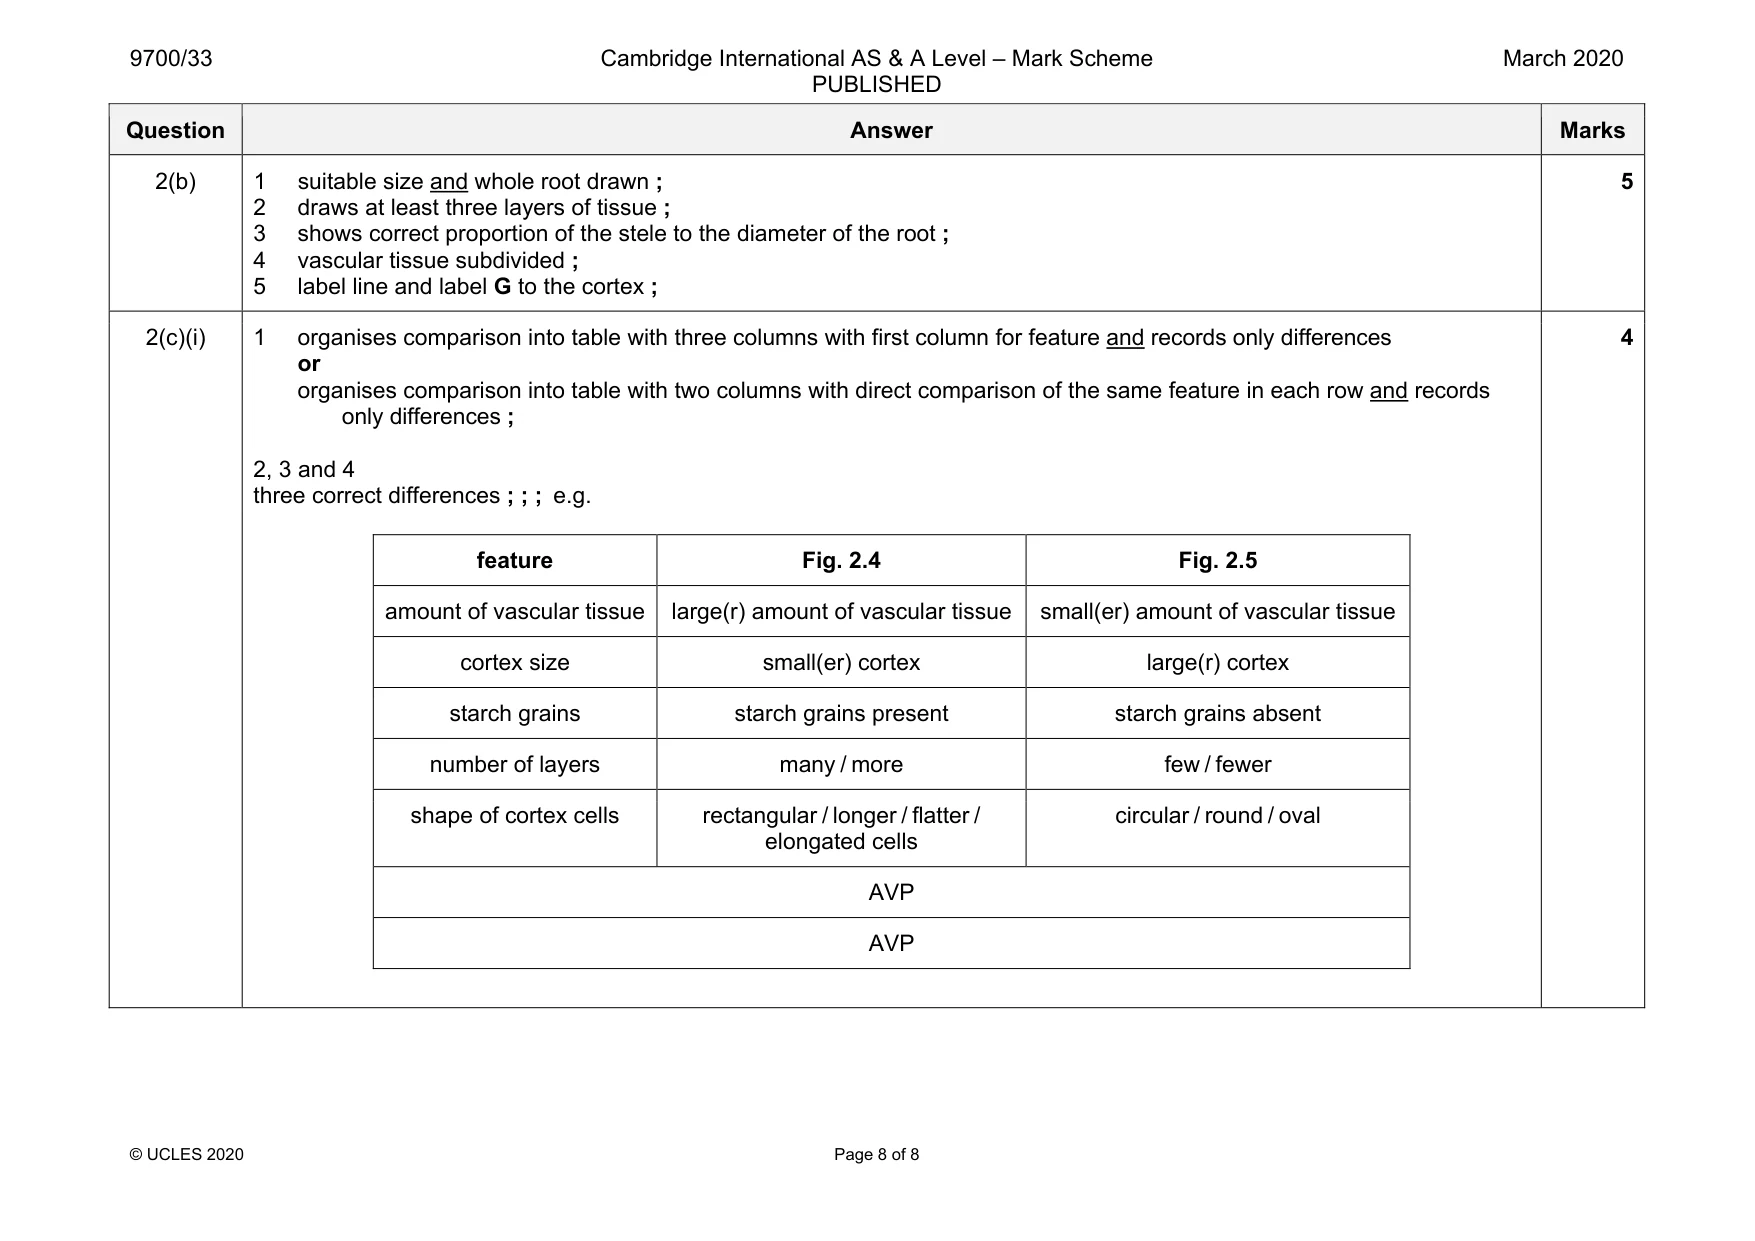
Mark scheme: 2(a)(i) 1 suitable size and lines continuous, thin and sharp ; 2 draws only four starch grains ; 3 shows details of surface markings ; 4 draws single line around each grain ; 4 2(a)(ii) L ; 1 2(a)(iii) 1 measures and records the length of three starch grains using the lines N1, N2 and N3 and units ; 2 shows the addition of these three lengths and shows division by three ; 2 2(a)(iv) 1 correct actual length of N1 = 64 μm ; 4 × 16 μm 2 uses answer to (a)(iii) and shows how to calculate mean actual length of the three starch grains ; (64 ÷ image length of N1) × mean image length from (a)(iii) 2 Question Answer Marks 2(b) 1 suitable size and whole root drawn ; 2 draws at least three layers of tissue ; 3 shows correct proportion of the stele to the diameter of the root ; 4 vascular tissue subdivided ; 5 label line and label G to the cortex ; 5 2(c)(i) 1 organises comparison into table with three columns with first column for feature and records only differences or organises comparison into table with two columns with direct comparison of the same feature in each row and records only differences ; 2, 3 and 4 three correct differences ; ; ; e.g. feature Fig. 2.4 Fig. 2.5 amount of vascular tissue large(r) amount of vascular tissue small(er) amount of vascular tissue cortex size small(er) cortex large(r) cortex starch grains starch grains present starch grains absent number of layers many / more few / fewer shape of cortex cells rectangular / longer / flatter / elongated cells circular / round / oval AVP AVP 4
What was in this paper
The subtopics covered by these 2 questions, and how many questions each got. Open one in a new tab to see every Cambridge question on it.
What you needed in this session
Cambridge’s own grade thresholds for 2020 Feb/March, Paper 3 · Variant 3. A higher threshold means an easier paper — the bar moves with how the cohort did.