Cambridge A Level Biology 9700 — 2019 Feb/March Paper 3 · Variant 3
9700/33/F/M/19 · 2 questions · 40 marks · ≈45 min
The question paper and its mark scheme, free to read here and free to download. This is Cambridge’s own paper, exactly as it was sat.
Question paper16 pages
Mark scheme6 pages
Answers below. Sit the paper first if you are practising.
Questions as text
Q1 · Plants transport sucrose through vascular bundles in stems and roots
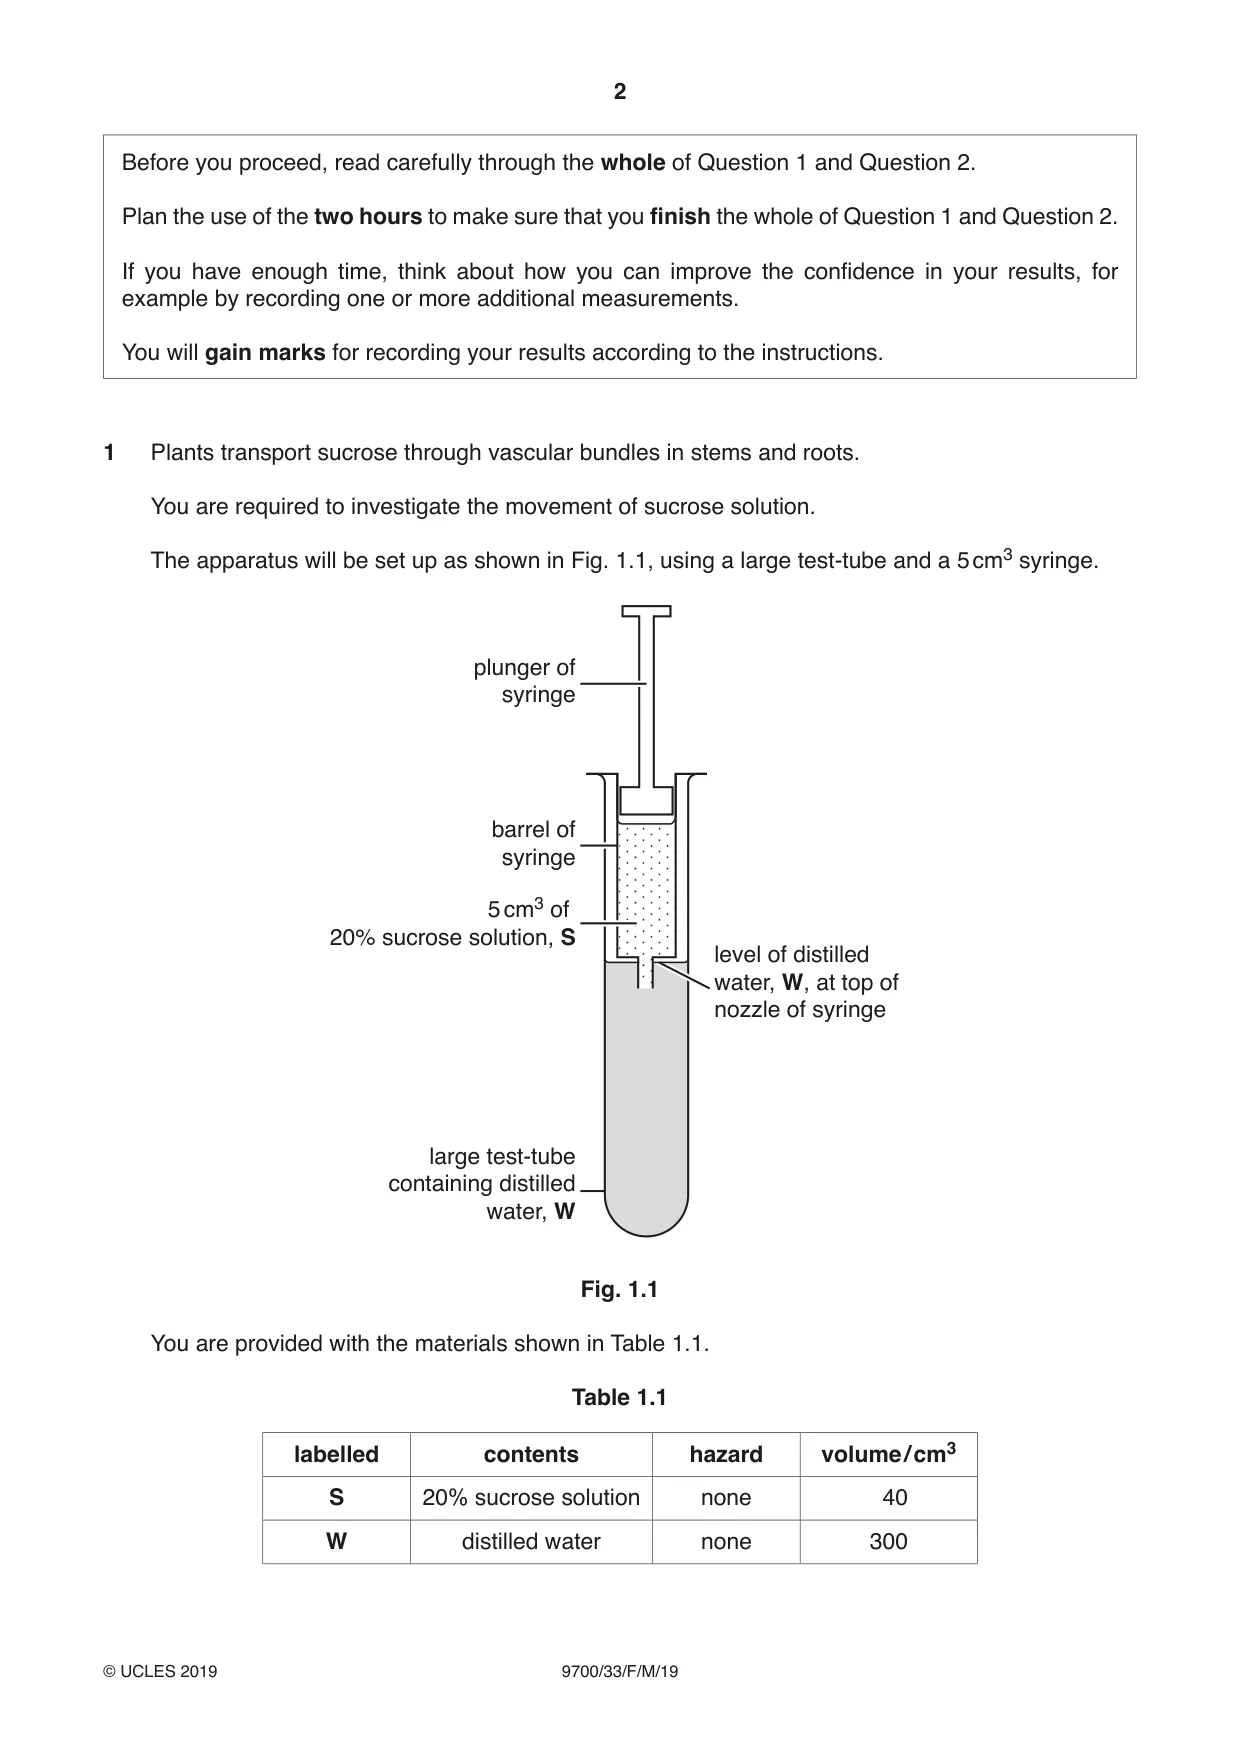
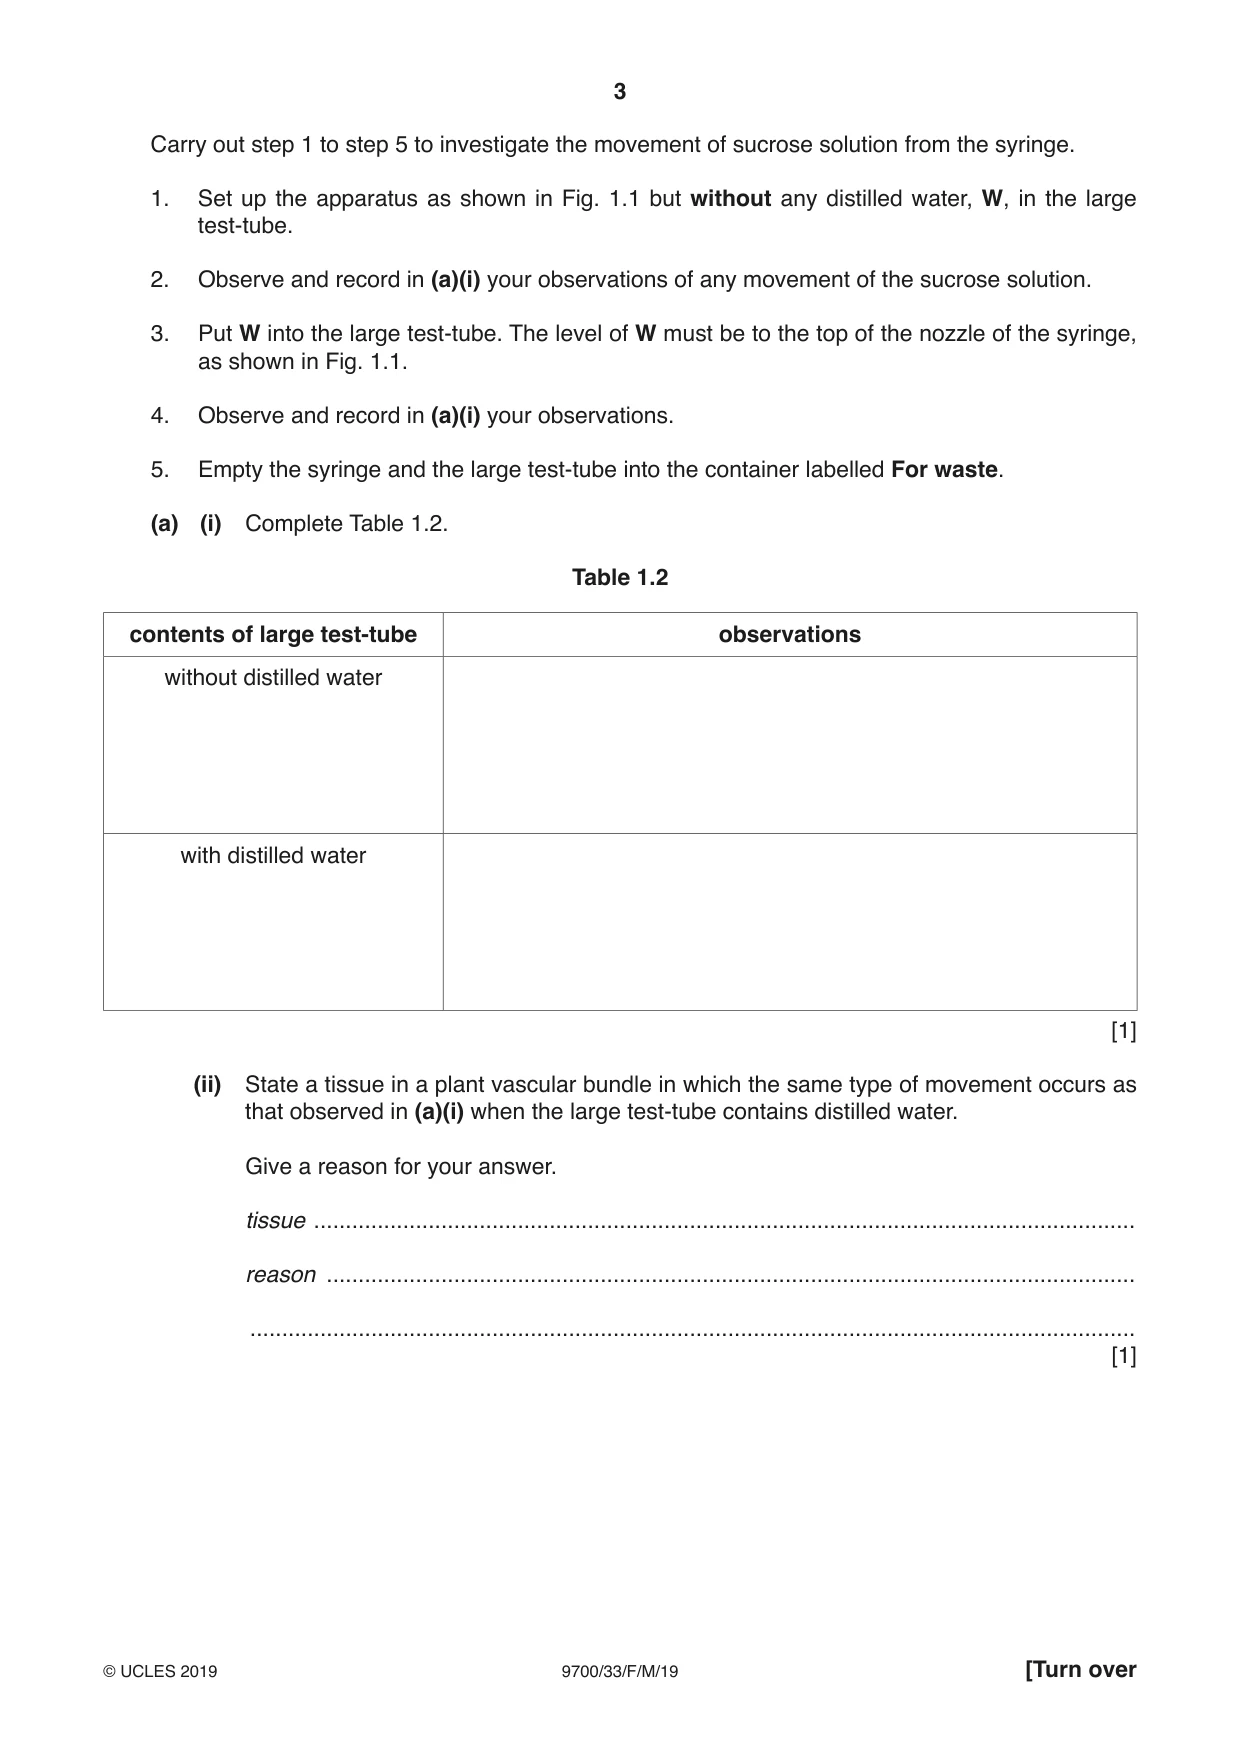
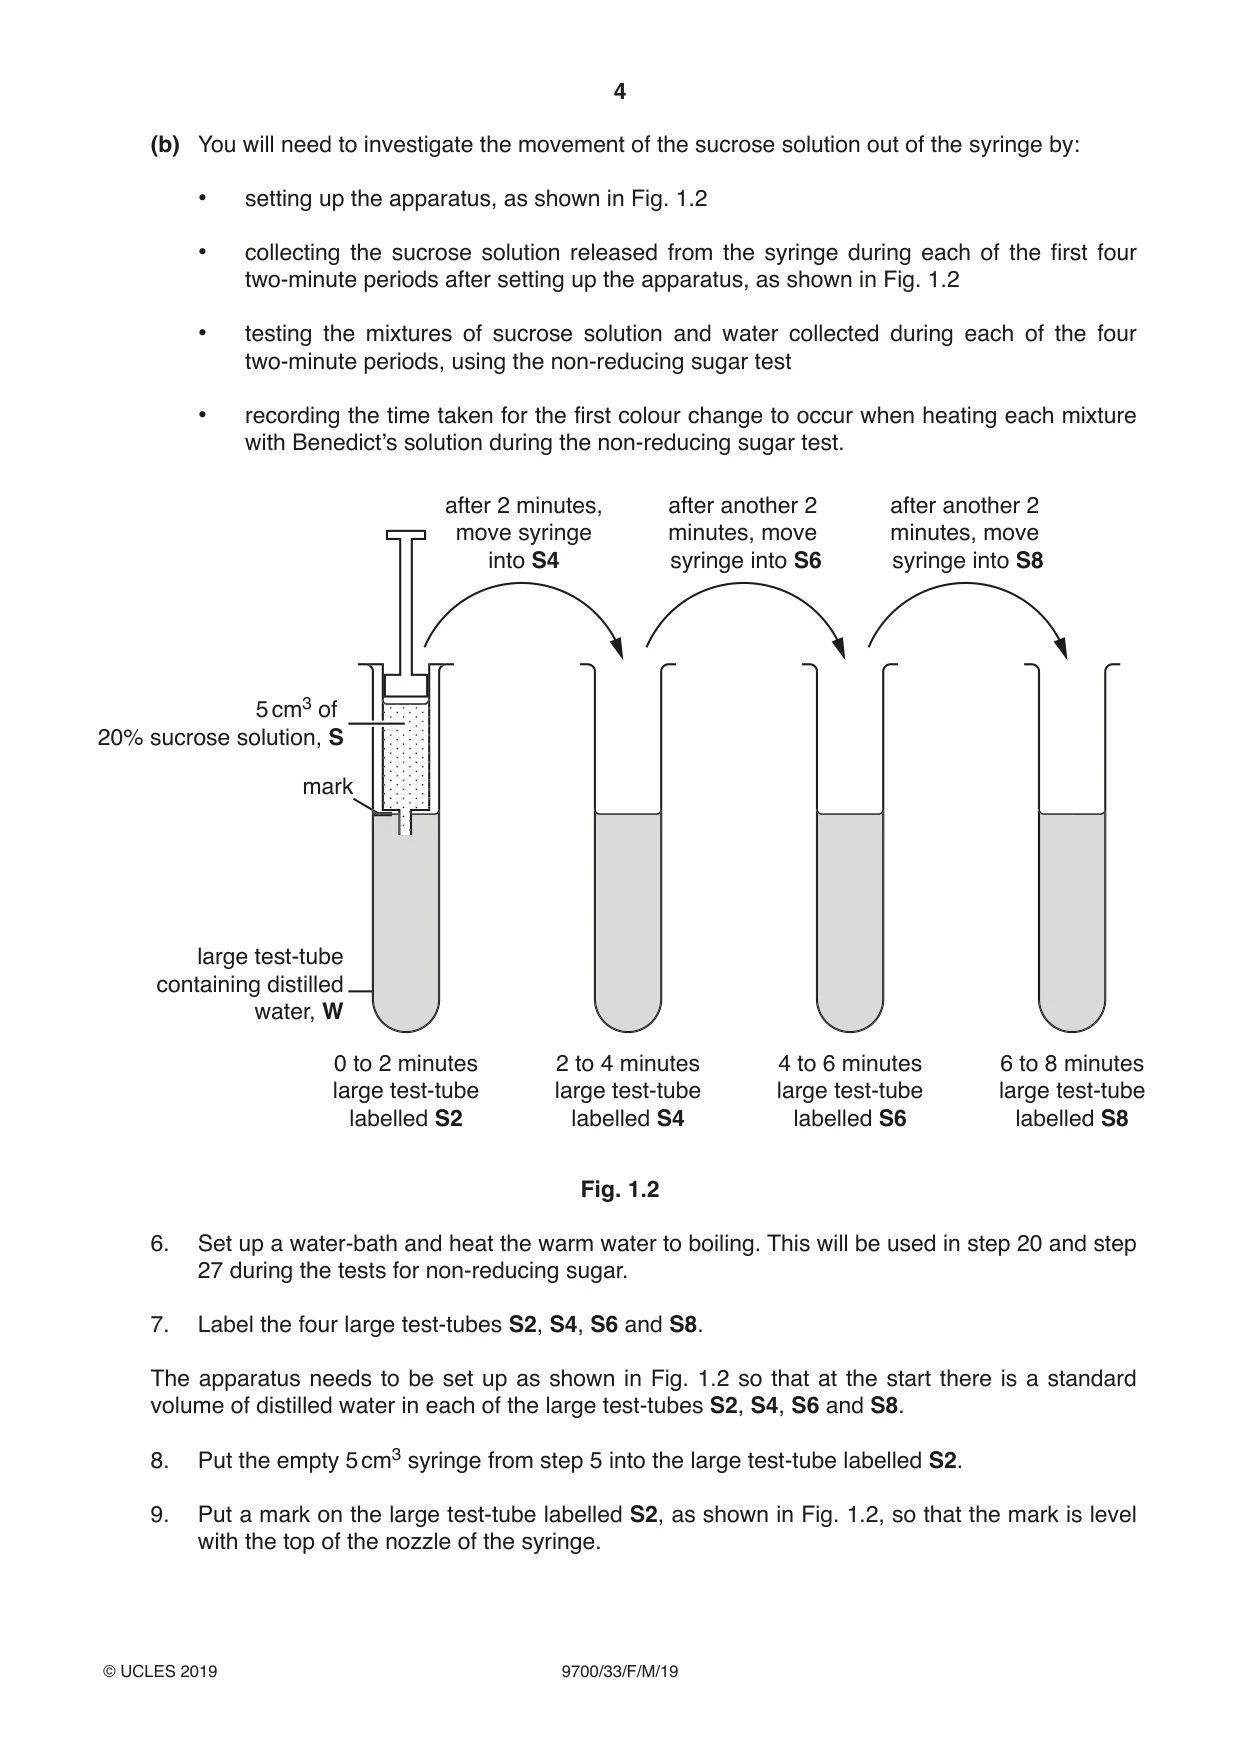
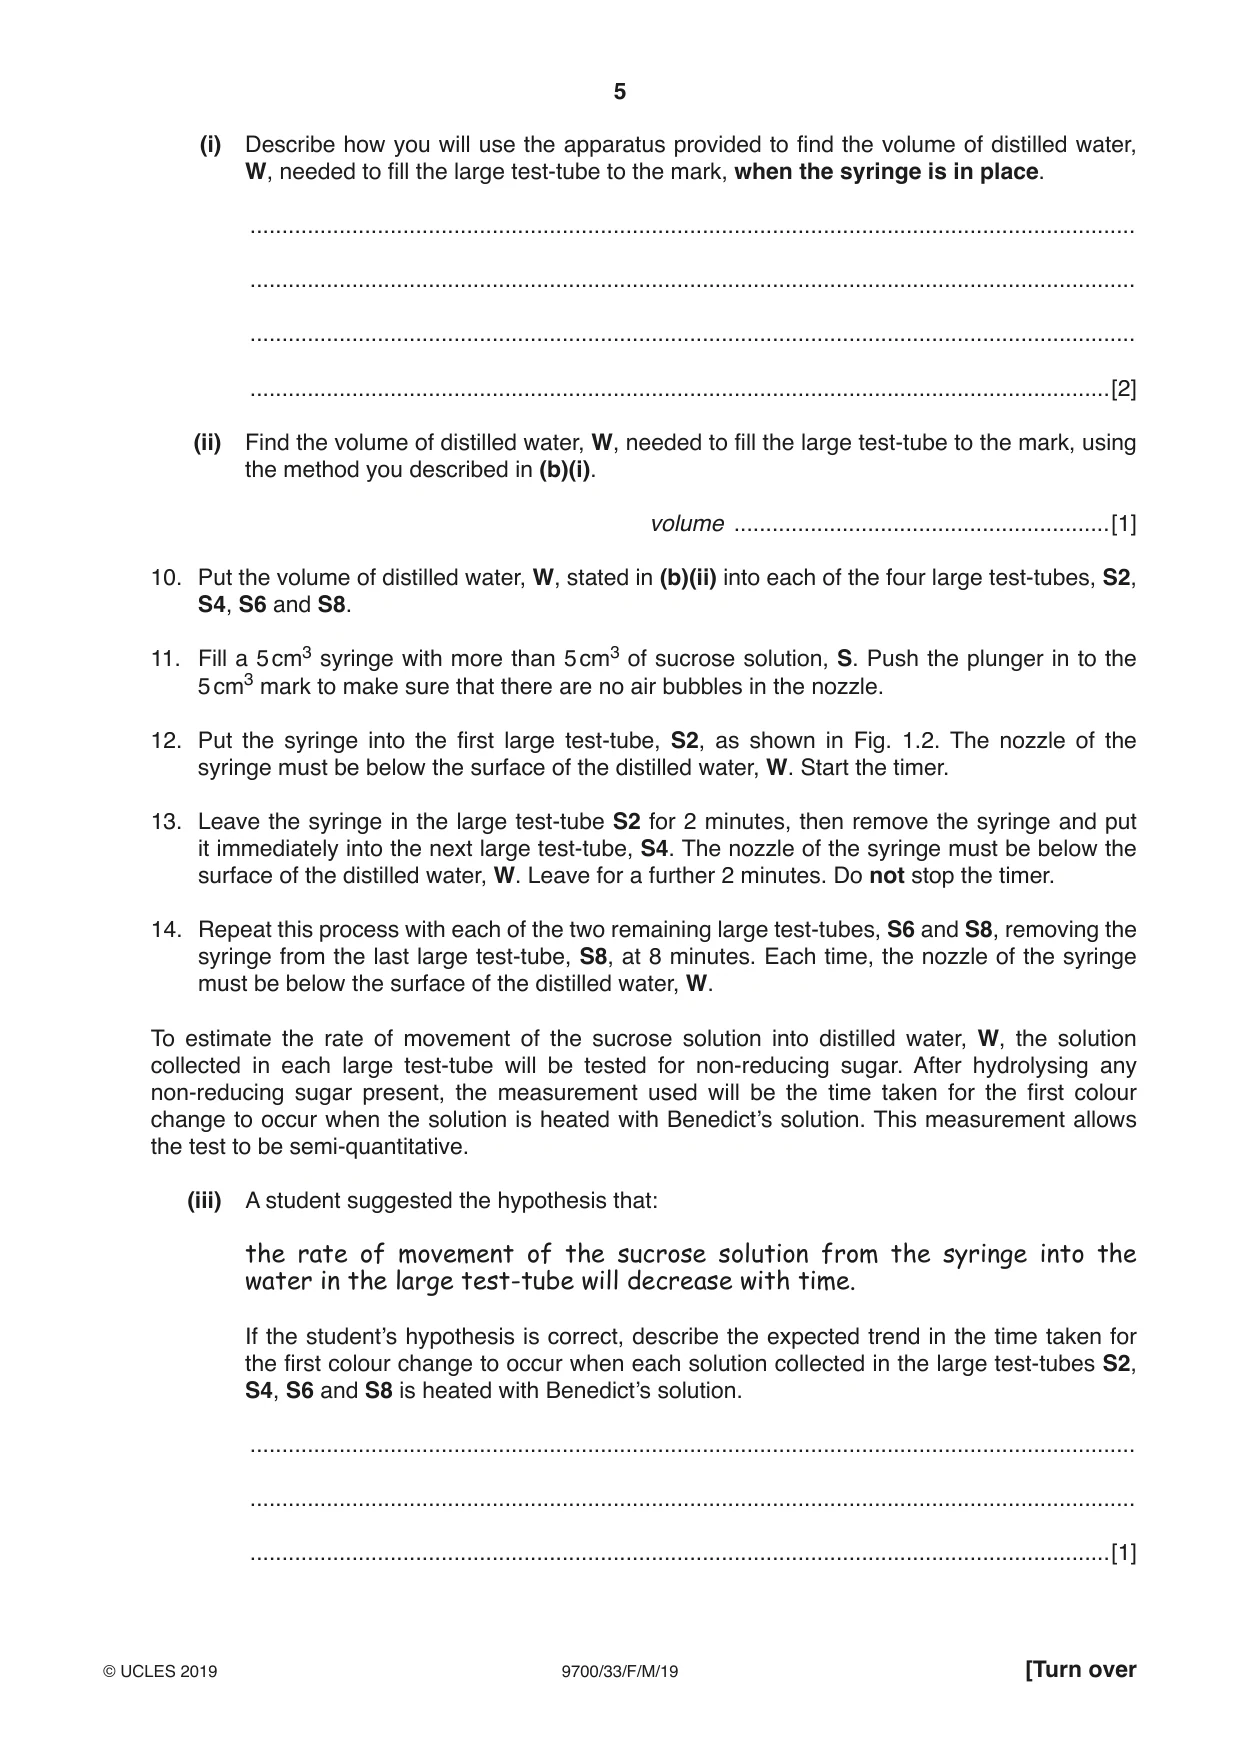
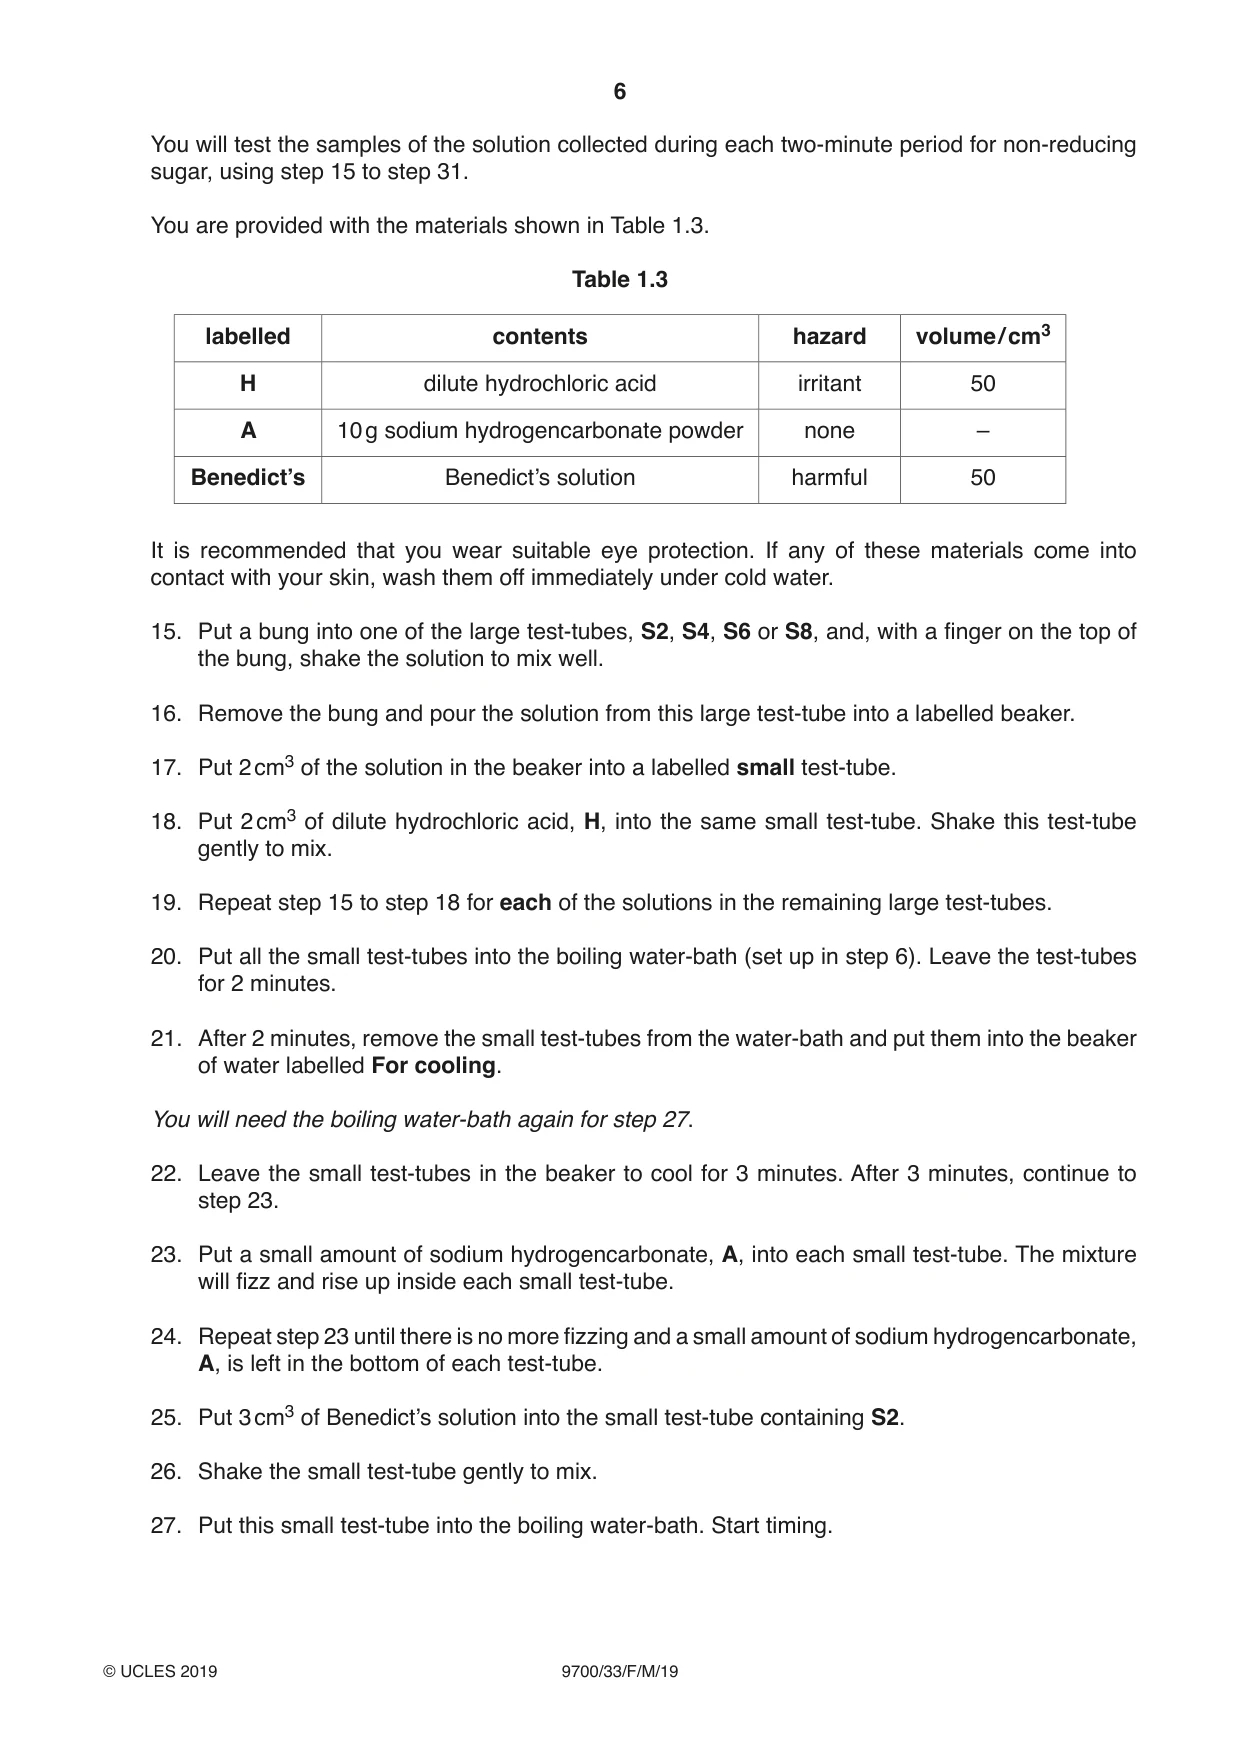
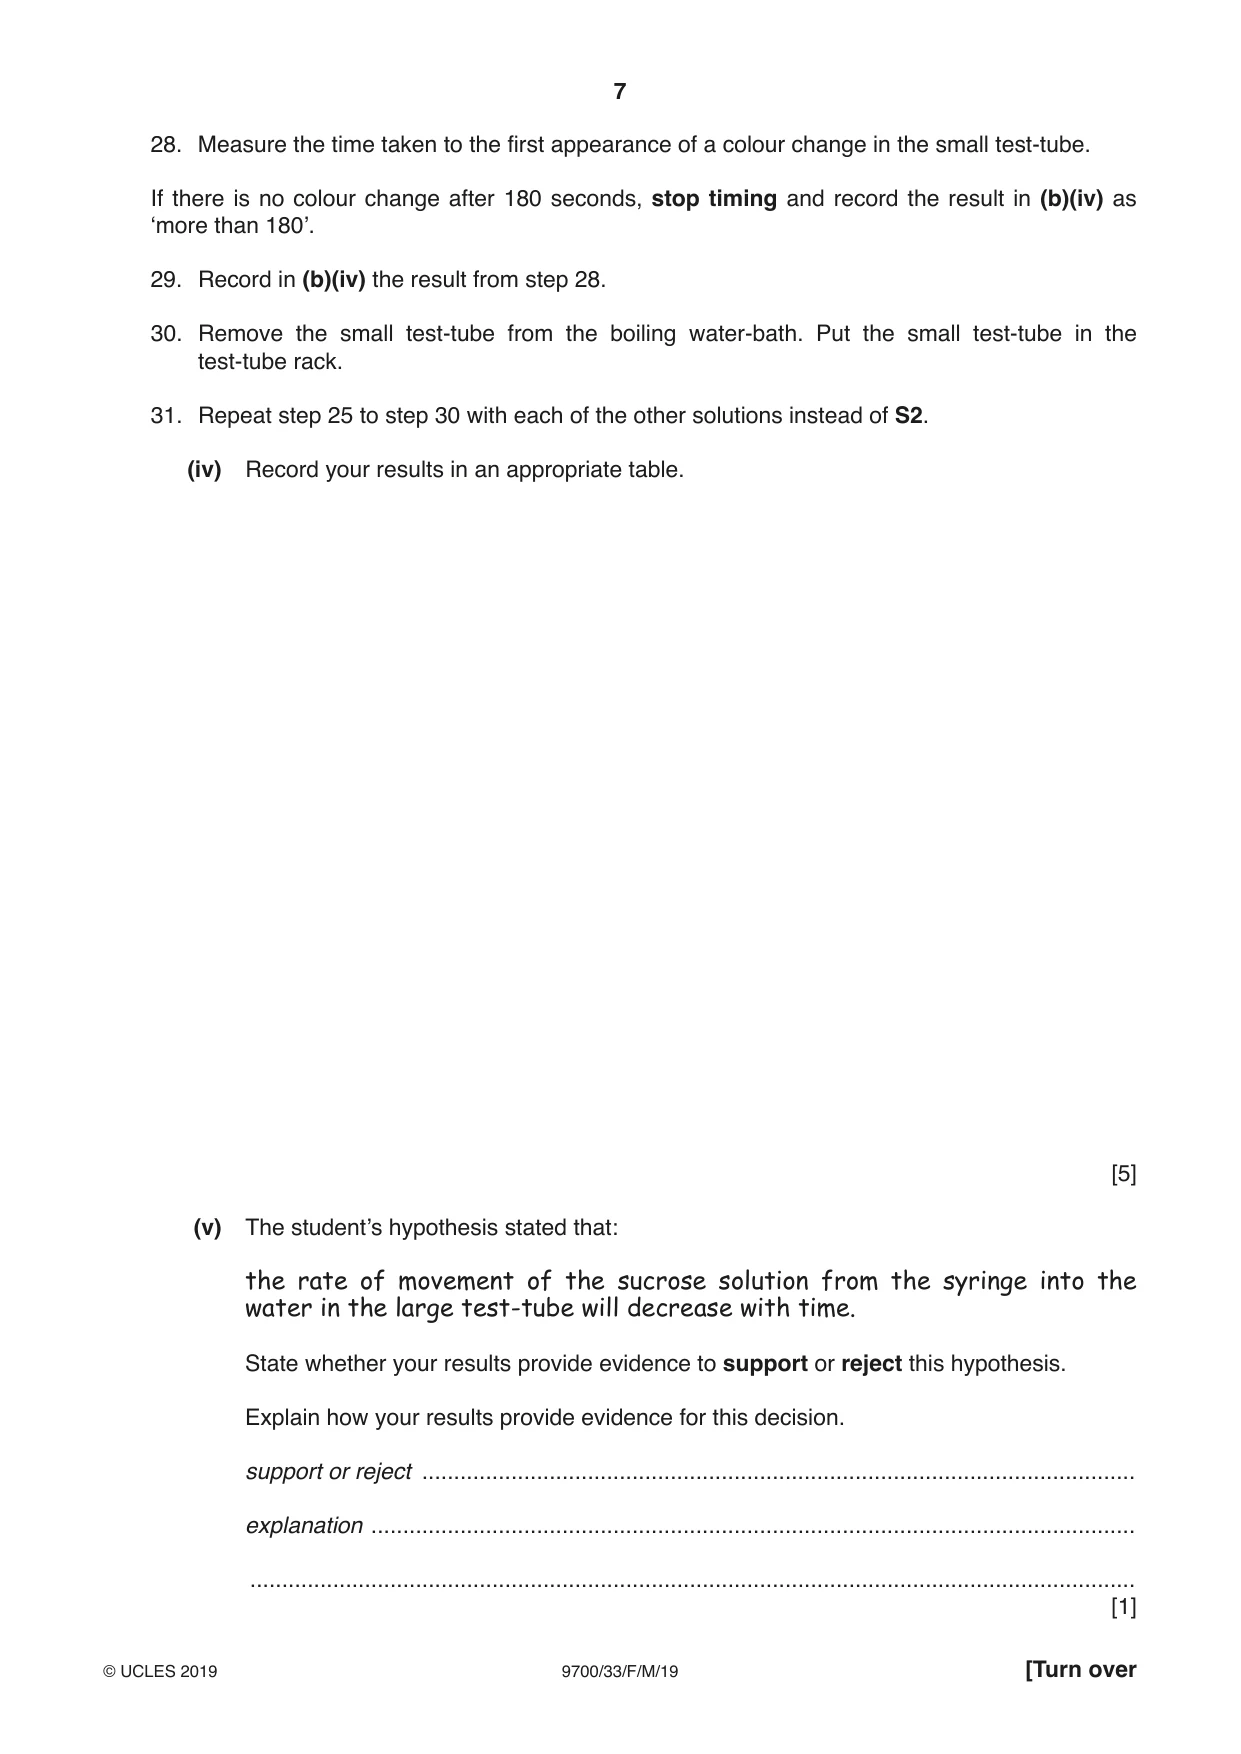
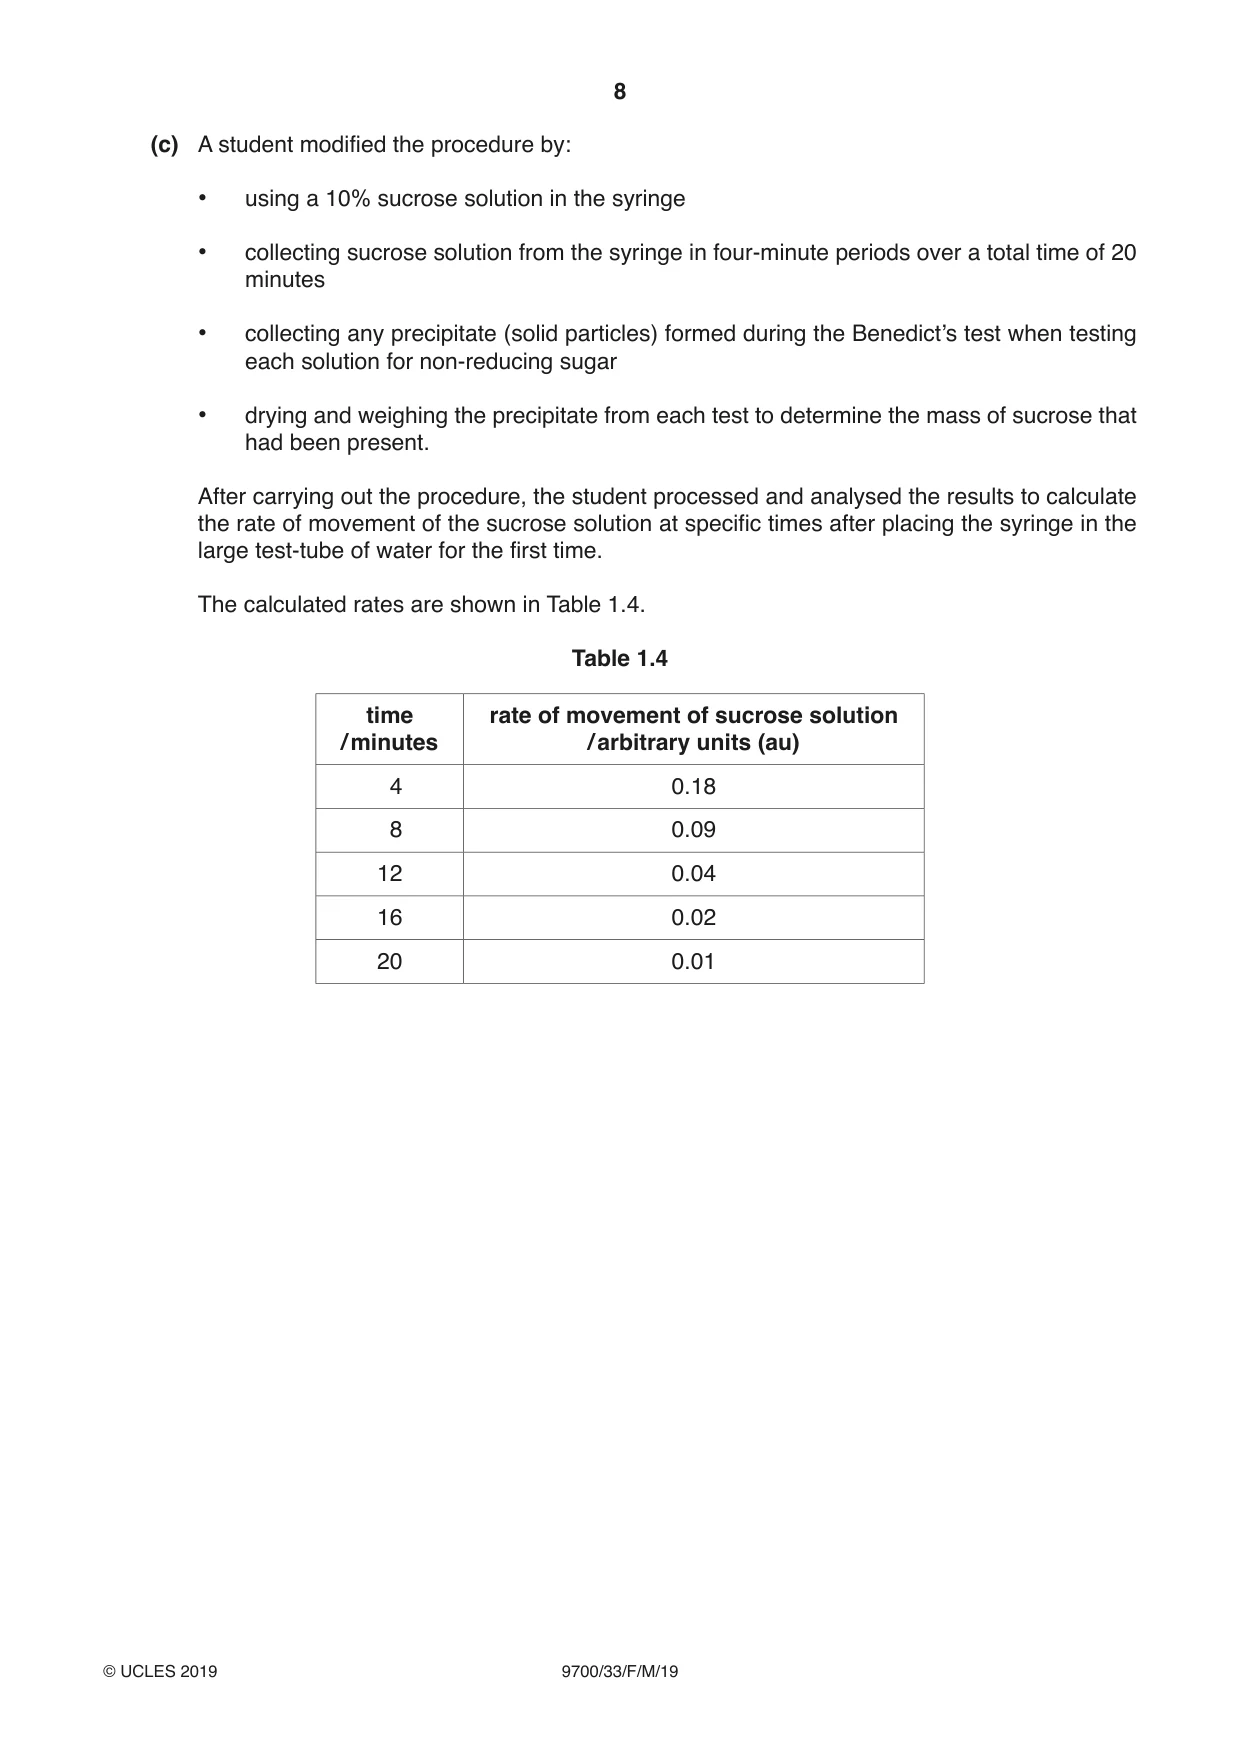
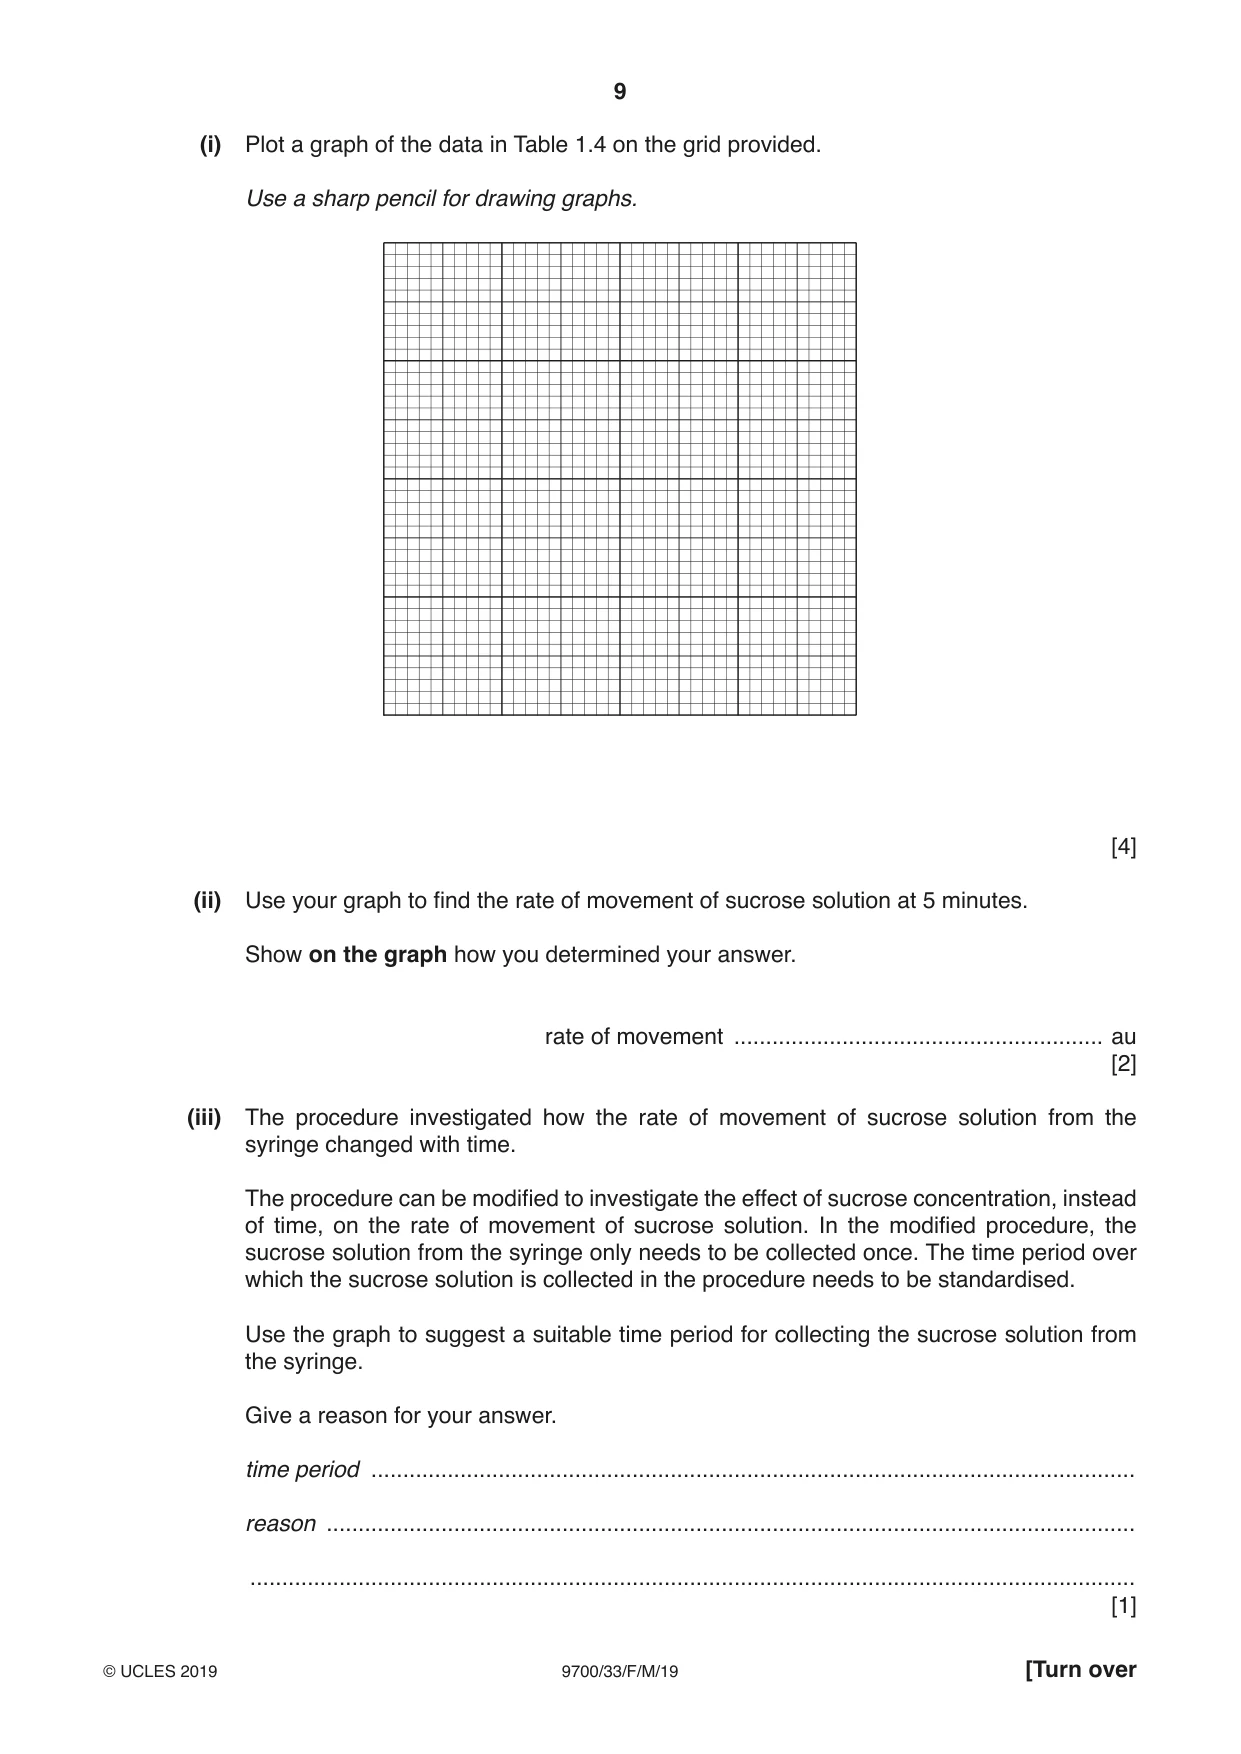
1 Plants transport sucrose through vascular bundles in stems and roots. You are required to investigate the movement of sucrose solution. The apparatus will be set up as shown in Fig. 1.1, using a large test-tube and a 5 cm3 syringe. plunger of syringe barrel of syringe 5 cm3 of 20% sucrose solution, S level of distilled water, W, at top of nozzle of syringe large test-tube containing distilled water, W Fig. 1.1 You are provided with the materials shown in Table 1.1. Table 1.1 labelled contents hazard volume / cm3 S 20% sucrose solution none 40 W distilled water none 300 Carry out step 1 to step 5 to investigate the movement of sucrose solution from the syringe. 1. Set up the apparatus as shown in Fig. 1.1 but without any distilled water, W, in the large test-tube. 2. Observe and record in (a)(i) your observations of any movement of the sucrose solution. 3. Put W into the large test-tube. The level of W must be to the top of the nozzle of the syringe, as shown in Fig. 1.1. 4. Observe and record in (a)(i) your observations. 5. Empty the syringe and the large test-tube into the container labelled For waste. (a) (i) Complete Table 1.2. Table 1.2 contents of large test-tube observations without distilled water with distilled water [1] (ii) State a tissue in a plant vascular bundle in which the same type of movement occurs as that observed in (a)(i) when the large test-tube contains distilled water. Give a reason for your answer. tissue ................................................................................................................................. reason ............................................................................................................................... ........................................................................................................................................... [1] (b) You will need to investigate the movement of the sucrose solution out of the syringe by: • setting up the apparatus, as shown in Fig. 1.2 • collecting the sucrose solution released from the syringe during each of the first four two-minute periods after setting up the apparatus, as shown in Fig. 1.2 • testing the mixtures of sucrose solution and water collected during each of the four two-minute periods, using the non-reducing sugar test • recording the time taken for the first colour change to occur when heating each mixture with Benedict’s solution during the non-reducing sugar test. after 2 minutes, after another 2 after another 2 move syringe minutes, move minutes, move into S4 syringe into S6 syringe into S8 5 cm3 of 20% sucrose solution, S mark large test-tube containing distilled water, W 0 to 2 minutes 2 to 4 minutes 4 to 6 minutes 6 to 8 minutes large test-tube large test-tube large test-tube large test-tube labelled S2 labelled S4 labelled S6 labelled S8 Fig. 1.2 6. Set up a water-bath and heat the warm water to boiling. This will be used in step 20 and step 27 during the tests for non-reducing sugar. 7. Label the four large test-tubes S2, S4, S6 and S8. The apparatus needs to be set up as shown in Fig. 1.2 so that at the start there is a standard volume of distilled water in each of the large test-tubes S2, S4, S6 and S8. 8. Put the empty 5 cm3 syringe from step 5 into the large test-tube labelled S2. 9. Put a mark on the large test-tube labelled S2, as shown in Fig. 1.2, so that the mark is level with the top of the nozzle of the syringe. (i) Describe how you will use the apparatus provided to find the volume of distilled water, W, needed to fill the large test-tube to the mark, when the syringe is in place. ........................................................................................................................................... ........................................................................................................................................... ........................................................................................................................................... .......................................................................................................................................[2] (ii) Find the volume of distilled water, W, needed to fill the large test-tube to the mark, using the method you described in (b)(i). volume ...........................................................[1] 10. Put the volume of distilled water, W, stated in (b)(ii) into each of the four large test-tubes, S2, S4, S6 and S8. 11. Fill a 5 cm3 syringe with more than 5 cm3 of sucrose solution, S. Push the plunger in to the 5 cm3 mark to make sure that there are no air bubbles in the nozzle. 12. Put the syringe into the first large test-tube, S2, as shown in Fig. 1.2. The nozzle of the syringe must be below the surface of the distilled water, W. Start the timer. 13. Leave the syringe in the large test-tube S2 for 2 minutes, then remove the syringe and put it immediately into the next large test-tube, S4. The nozzle of the syringe must be below the surface of the distilled water, W. Leave for a further 2 minutes. Do not stop the timer. 14. Repeat this process with each of the two remaining large test-tubes, S6 and S8, removing the syringe from the last large test-tube, S8, at 8 minutes. Each time, the nozzle of the syringe must be below the surface of the distilled water, W. To estimate the rate of movement of the sucrose solution into distilled water, W, the solution collected in each large test-tube will be tested for non-reducing sugar. After hydrolysing any non-reducing sugar present, the measurement used will be the time taken for the first colour change to occur when the solution is heated with Benedict’s solution. This measurement allows the test to be semi-quantitative. (iii) A student suggested the hypothesis that: the rate of movement of the sucrose solution from the syringe into the water in the large test-tube will decrease with time. If the student’s hypothesis is correct, describe the expected trend in the time taken for the first colour change to occur when each solution collected in the large test-tubes S2, S4, S6 and S8 is heated with Benedict’s solution. ........................................................................................................................................... ........................................................................................................................................... .......................................................................................................................................[1] You will test the samples of the solution collected during each two-minute period for non-reducing sugar, using step 15 to step 31. You are provided with the materials shown in Table 1.3. Table 1.3 labelled contents hazard volume / cm3 H dilute hydrochloric acid irritant 50 A 10 g sodium hydrogencarbonate powder none – Benedict’s Benedict’s solution harmful 50 It is recommended that you wear suitable eye protection. If any of these materials come into contact with your skin, wash them off immediately under cold water. 15. Put a bung into one of the large test-tubes, S2, S4, S6 or S8, and, with a finger on the top of the bung, shake the solution to mix well. 16. Remove the bung and pour the solution from this large test-tube into a labelled beaker. 17. Put 2 cm3 of the solution in the beaker into a labelled small test-tube. 18. Put 2 cm3 of dilute hydrochloric acid, H, into the same small test-tube. Shake this test-tube gently to mix. 19. Repeat step 15 to step 18 for each of the solutions in the remaining large test-tubes. 20. Put all the small test-tubes into the boiling water-bath (set up in step 6). Leave the test-tubes for 2 minutes. 21. After 2 minutes, remove the small test-tubes from the water-bath and put them into the beaker of water labelled For cooling. You will need the boiling water-bath again for step 27. 22. Leave the small test-tubes in the beaker to cool for 3 minutes. After 3 minutes, continue to step 23. 23. Put a small amount of sodium hydrogencarbonate, A, into each small test-tube. The mixture will fizz and rise up inside each small test-tube. 24. Repeat step 23 until there is no more fizzing and a small amount of sodium hydrogencarbonate, A, is left in the bottom of each test-tube. 25. Put 3 cm3 of Benedict’s solution into the small test-tube containing S2. 26. Shake the small test-tube gently to mix. 27. Put this small test-tube into the boiling water-bath. Start timing. 28. Measure the time taken to the first appearance of a colour change in the small test-tube. If there is no colour change after 180 seconds, stop timing and record the result in (b)(iv) as ‘more than 180’. 29. Record in (b)(iv) the result from step 28. 30. Remove the small test-tube from the boiling water-bath. Put the small test-tube in the test-tube rack. 31. Repeat step 25 to step 30 with each of the other solutions instead of S2. (iv) Record your results in an appropriate table. [5] (v) The student’s hypothesis stated that: the rate of movement of the sucrose solution from the syringe into the water in the large test-tube will decrease with time. State whether your results provide evidence to support or reject this hypothesis. Explain how your results provide evidence for this decision. support or reject ................................................................................................................ explanation ........................................................................................................................ ........................................................................................................................................... [1] (c) A student modified the procedure by: • using a 10% sucrose solution in the syringe • collecting sucrose solution from the syringe in four-minute periods over a total time of 20 minutes • collecting any precipitate (solid particles) formed during the Benedict’s test when testing each solution for non-reducing sugar • drying and weighing the precipitate from each test to determine the mass of sucrose that had been present. After carrying out the procedure, the student processed and analysed the results to calculate the rate of movement of the sucrose solution at specific times after placing the syringe in the large test-tube of water for the first time. The calculated rates are shown in Table 1.4. Table 1.4 time rate of movement of sucrose solution / minutes / arbitrary units (au) 4 0.18 8 0.09 12 0.04 16 0.02 20 0.01 (i) Plot a graph of the data in Table 1.4 on the grid provided. Use a sharp pencil for drawing graphs. [4] (ii) Use your graph to find the rate of movement of sucrose solution at 5 minutes. Show on the graph how you determined your answer. rate of movement .......................................................... au [2] (iii) The procedure investigated how the rate of movement of sucrose solution from the syringe changed with time. The procedure can be modified to investigate the effect of sucrose concentration, instead of time, on the rate of movement of sucrose solution. In the modified procedure, the sucrose solution from the syringe only needs to be collected once. The time period over which the sucrose solution is collected in the procedure needs to be standardised. Use the graph to suggest a suitable time period for collecting the sucrose solution from the syringe. Give a reason for your answer. time period ........................................................................................................................ reason ............................................................................................................................... ........................................................................................................................................... [1] (iv) Think about how else you could modify this procedure to investigate the effect of using different concentrations of sucrose on the rate of movement of the sucrose solution. State the concentrations of sucrose solution you would use. ........................................................................................................................................... Describe how the concentrations of sucrose solution would be prepared. ........................................................................................................................................... ........................................................................................................................................... ........................................................................................................................................... ........................................................................................................................................... ........................................................................................................................................... [2] [Total: 21] Question 2 starts on page 12
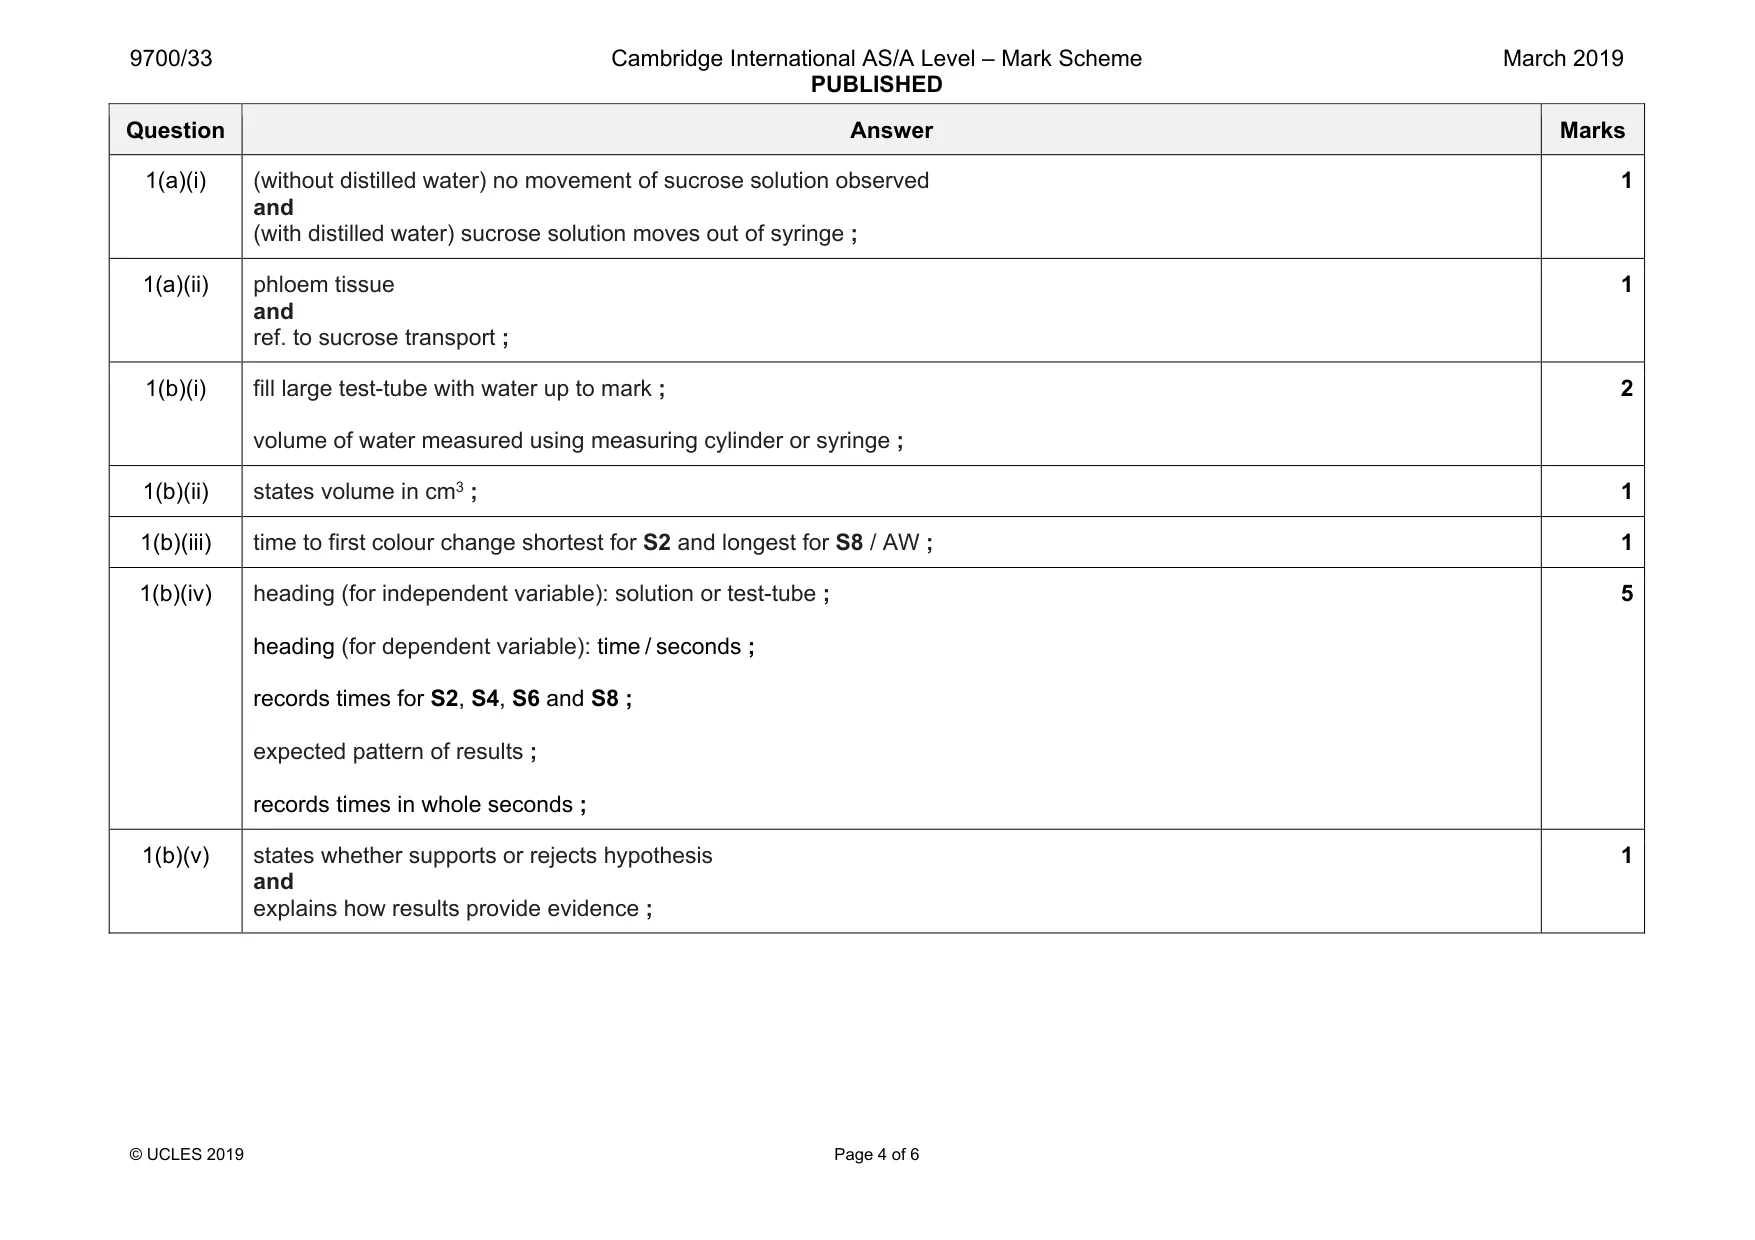
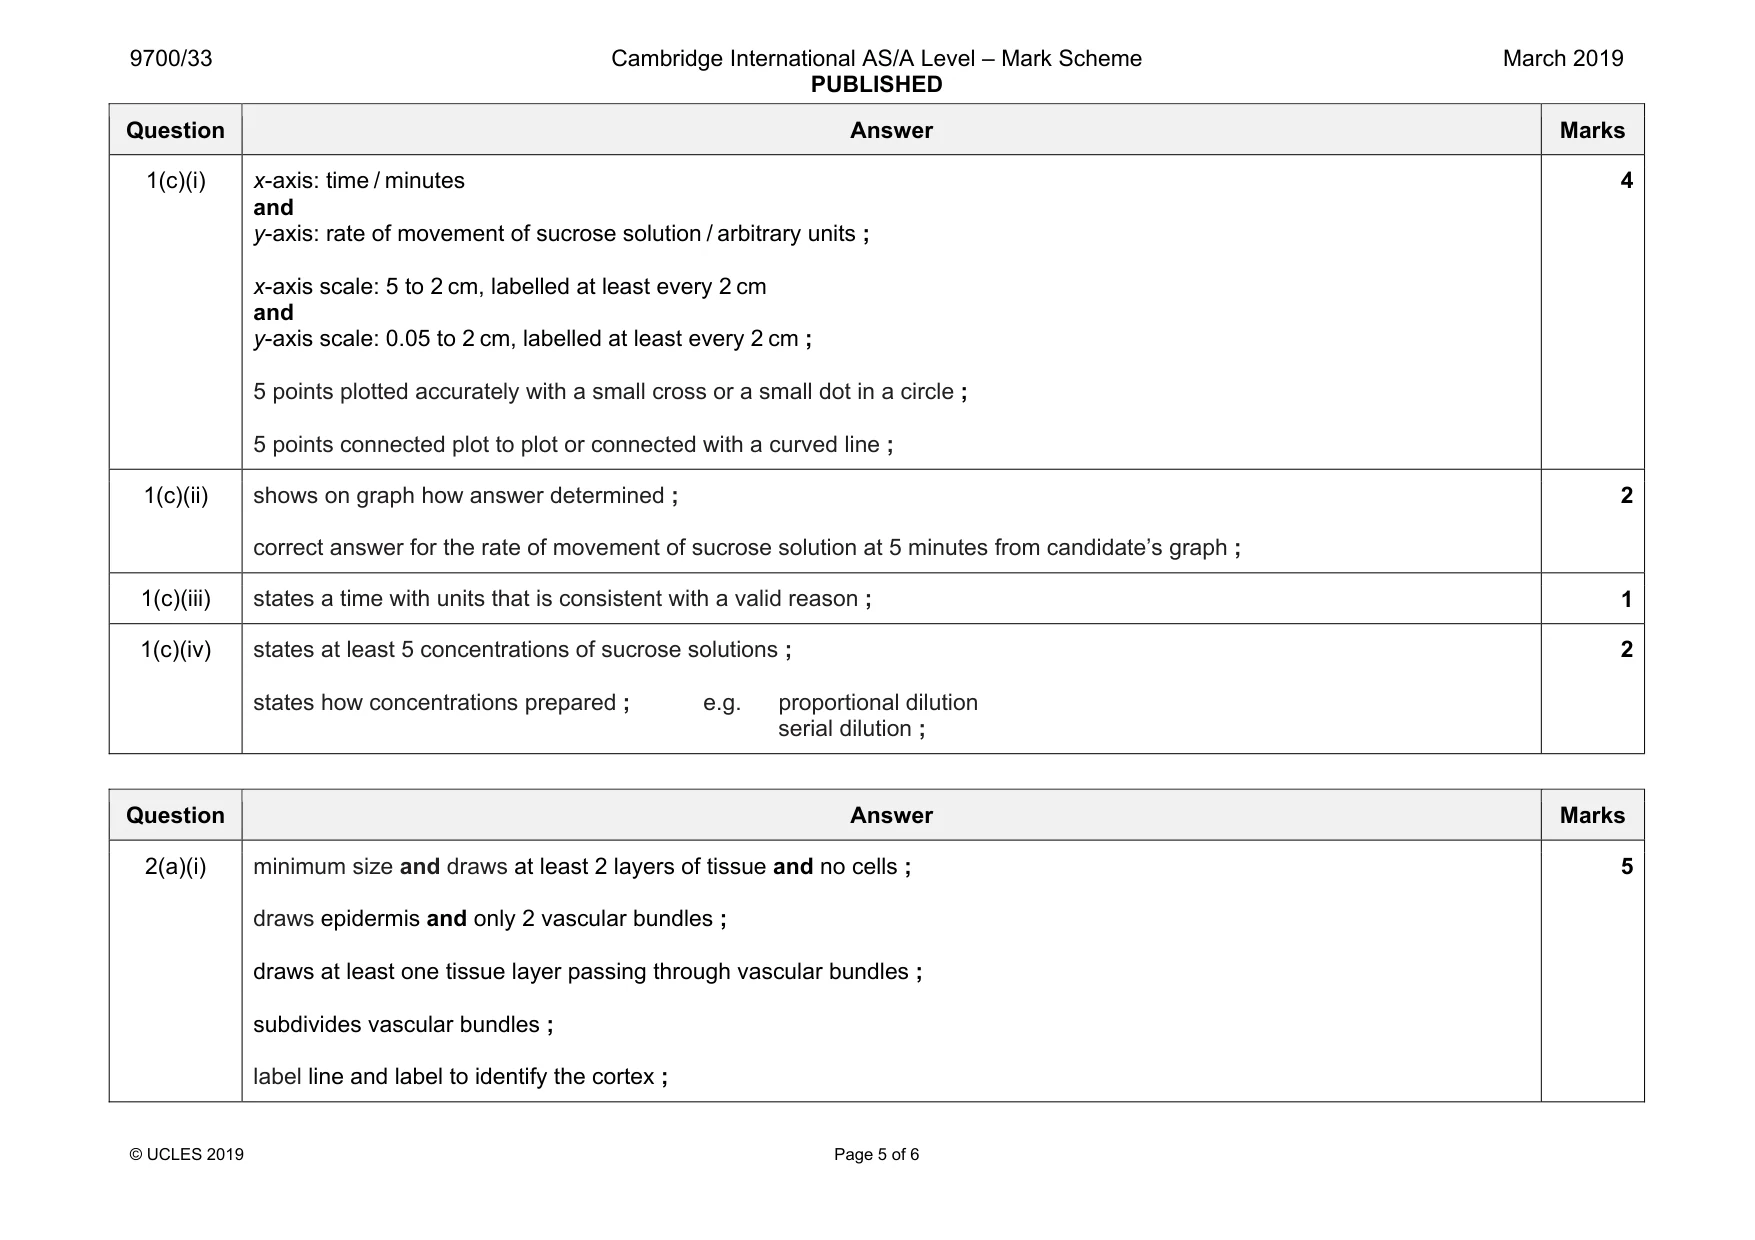
Mark scheme: 1(a)(i) (without distilled water) no movement of sucrose solution observed and (with distilled water) sucrose solution moves out of syringe ; 1 1(a)(ii) phloem tissue and ref. to sucrose transport ; 1 1(b)(i) fill large test-tube with water up to mark ; volume of water measured using measuring cylinder or syringe ; 2 1(b)(ii) states volume in cm3 ; 1 1(b)(iii) time to first colour change shortest for S2 and longest for S8 / AW ; 1 1(b)(iv) heading (for independent variable): solution or test-tube ; heading (for dependent variable): time / seconds ; records times for S2, S4, S6 and S8 ; expected pattern of results ; records times in whole seconds ; 5 1(b)(v) states whether supports or rejects hypothesis and explains how results provide evidence ; 1 Question Answer Marks 1(c)(i) x-axis: time / minutes and y-axis: rate of movement of sucrose solution / arbitrary units ; x-axis scale: 5 to 2 cm, labelled at least every 2 cm and y-axis scale: 0.05 to 2 cm, labelled at least every 2 cm ; 5 points plotted accurately with a small cross or a small dot in a circle ; 5 points connected plot to plot or connected with a curved line ; 4 1(c)(ii) shows on graph how answer determined ; correct answer for the rate of movement of sucrose solution at 5 minutes from candidate’s graph ; 2 1(c)(iii) states a time with units that is consistent with a valid reason ; 1 1(c)(iv) states at least 5 concentrations of sucrose solutions ; states how concentrations prepared ; e.g. proportional dilution serial dilution ; 2
Q2 · P1 is a slide of a stained transverse section through a plant stem
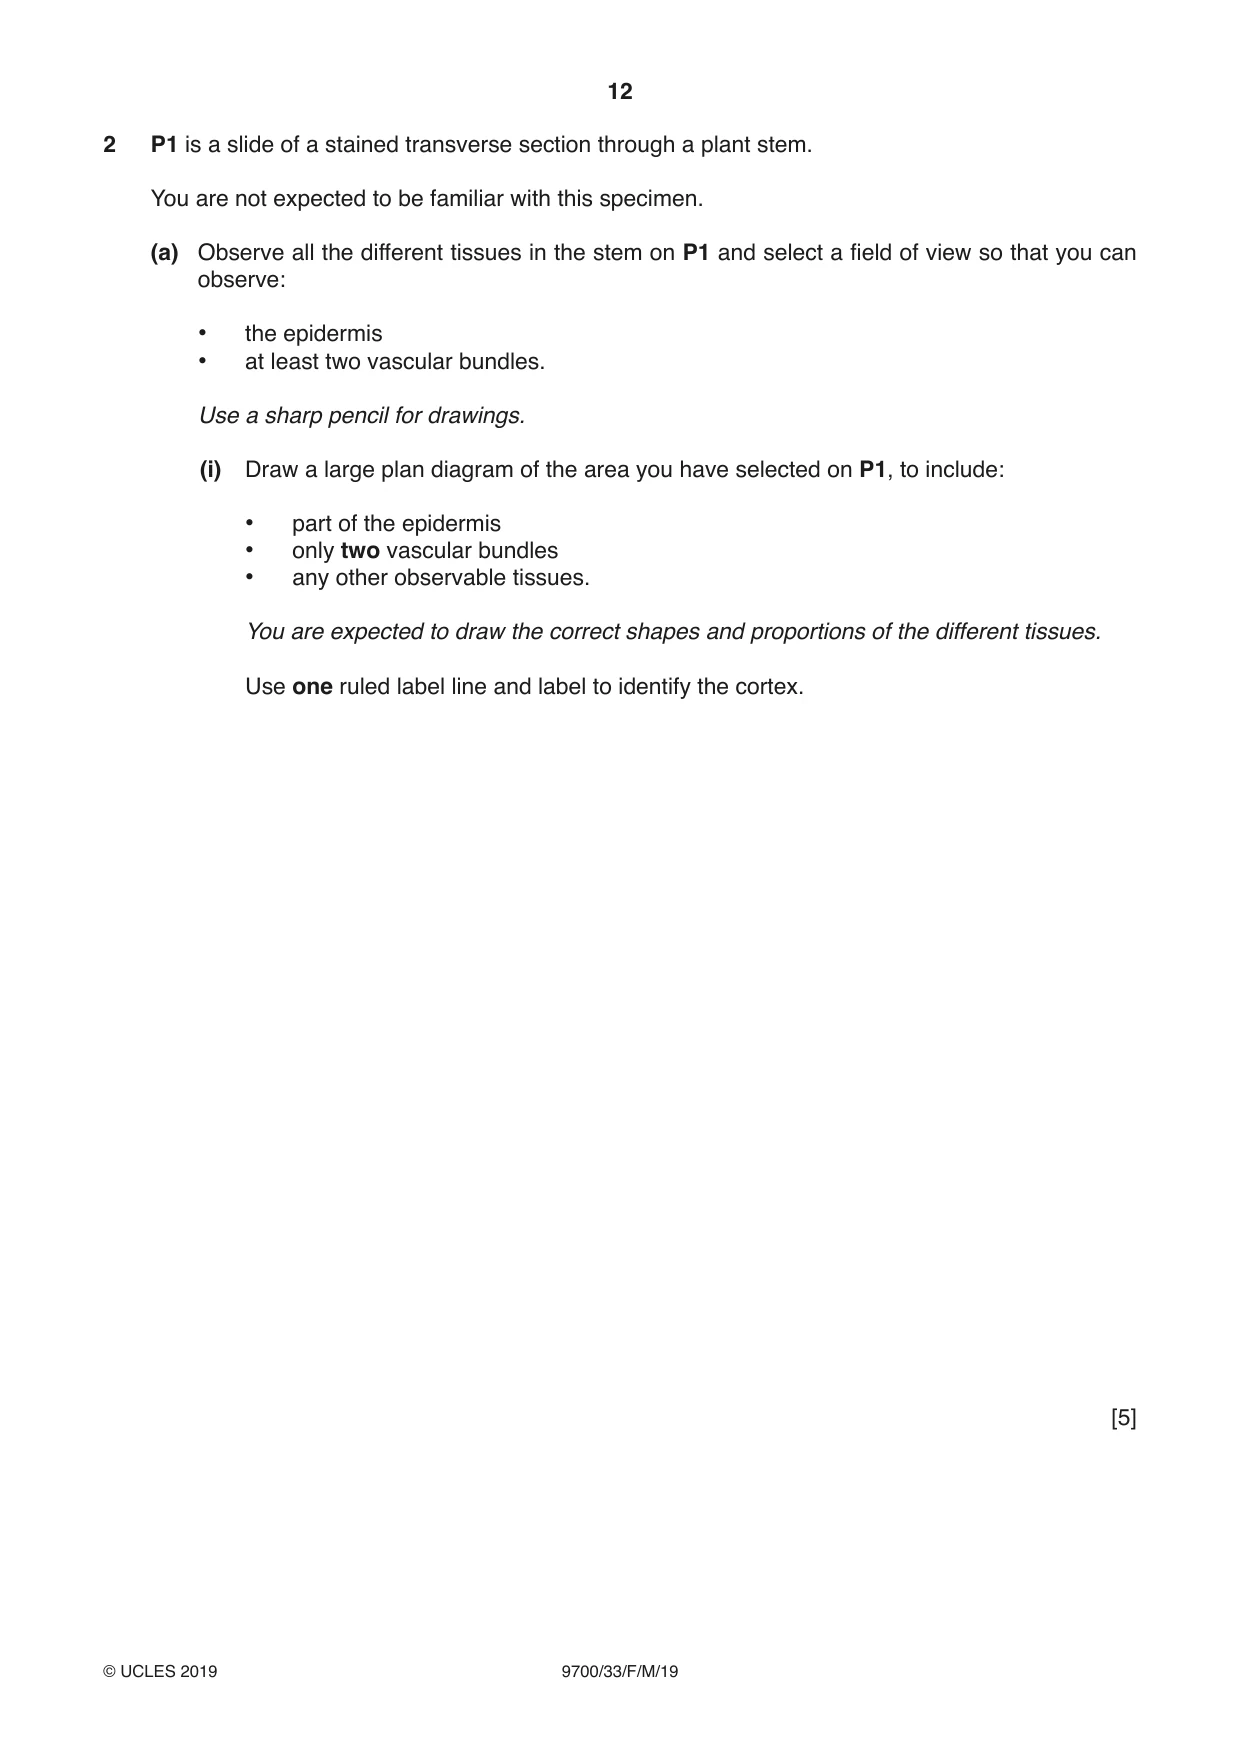
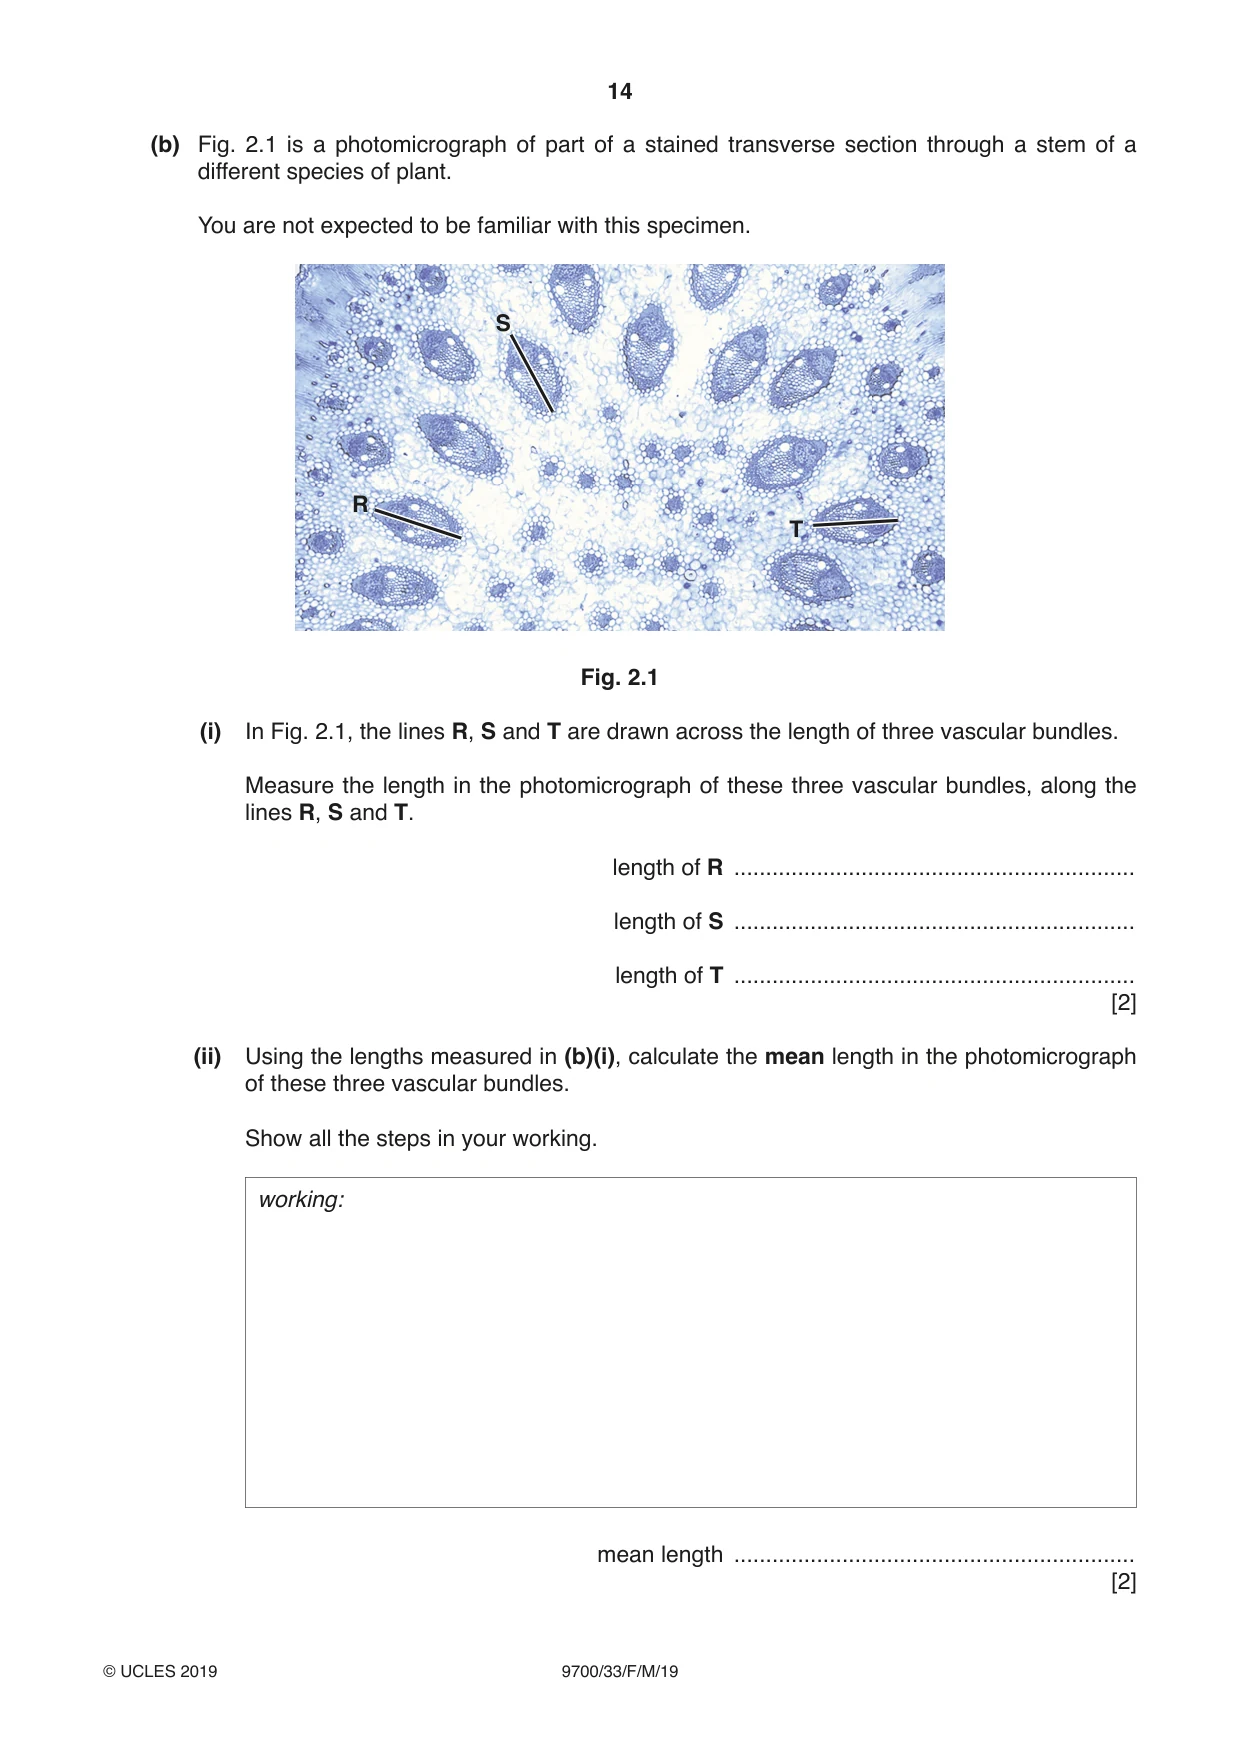
2 P1 is a slide of a stained transverse section through a plant stem. You are not expected to be familiar with this specimen. (a) Observe all the different tissues in the stem on P1 and select a field of view so that you can observe: • the epidermis • at least two vascular bundles. Use a sharp pencil for drawings. (i) Draw a large plan diagram of the area you have selected on P1, to include: • part of the epidermis • only two vascular bundles • any other observable tissues. You are expected to draw the correct shapes and proportions of the different tissues. Use one ruled label line and label to identify the cortex. [5] (ii) Observe the vascular bundles in the stem on P1. Select one large xylem vessel element and three cells that touch this xylem vessel element. Make a large drawing of this group of four cells. Each cell must touch at least two of the other cells. Use one ruled label line and label to identify the lumen in one of the cells. [6] (b) Fig. 2.1 is a photomicrograph of part of a stained transverse section through a stem of a different species of plant. You are not expected to be familiar with this specimen. S R T Fig. 2.1 (i) In Fig. 2.1, the lines R, S and T are drawn across the length of three vascular bundles. Measure the length in the photomicrograph of these three vascular bundles, along the lines R, S and T. length of R ............................................................... length of S ............................................................... length of T ............................................................... [2] (ii) Using the lengths measured in (b)(i), calculate the mean length in the photomicrograph of these three vascular bundles. Show all the steps in your working. working: mean length ............................................................... [2]
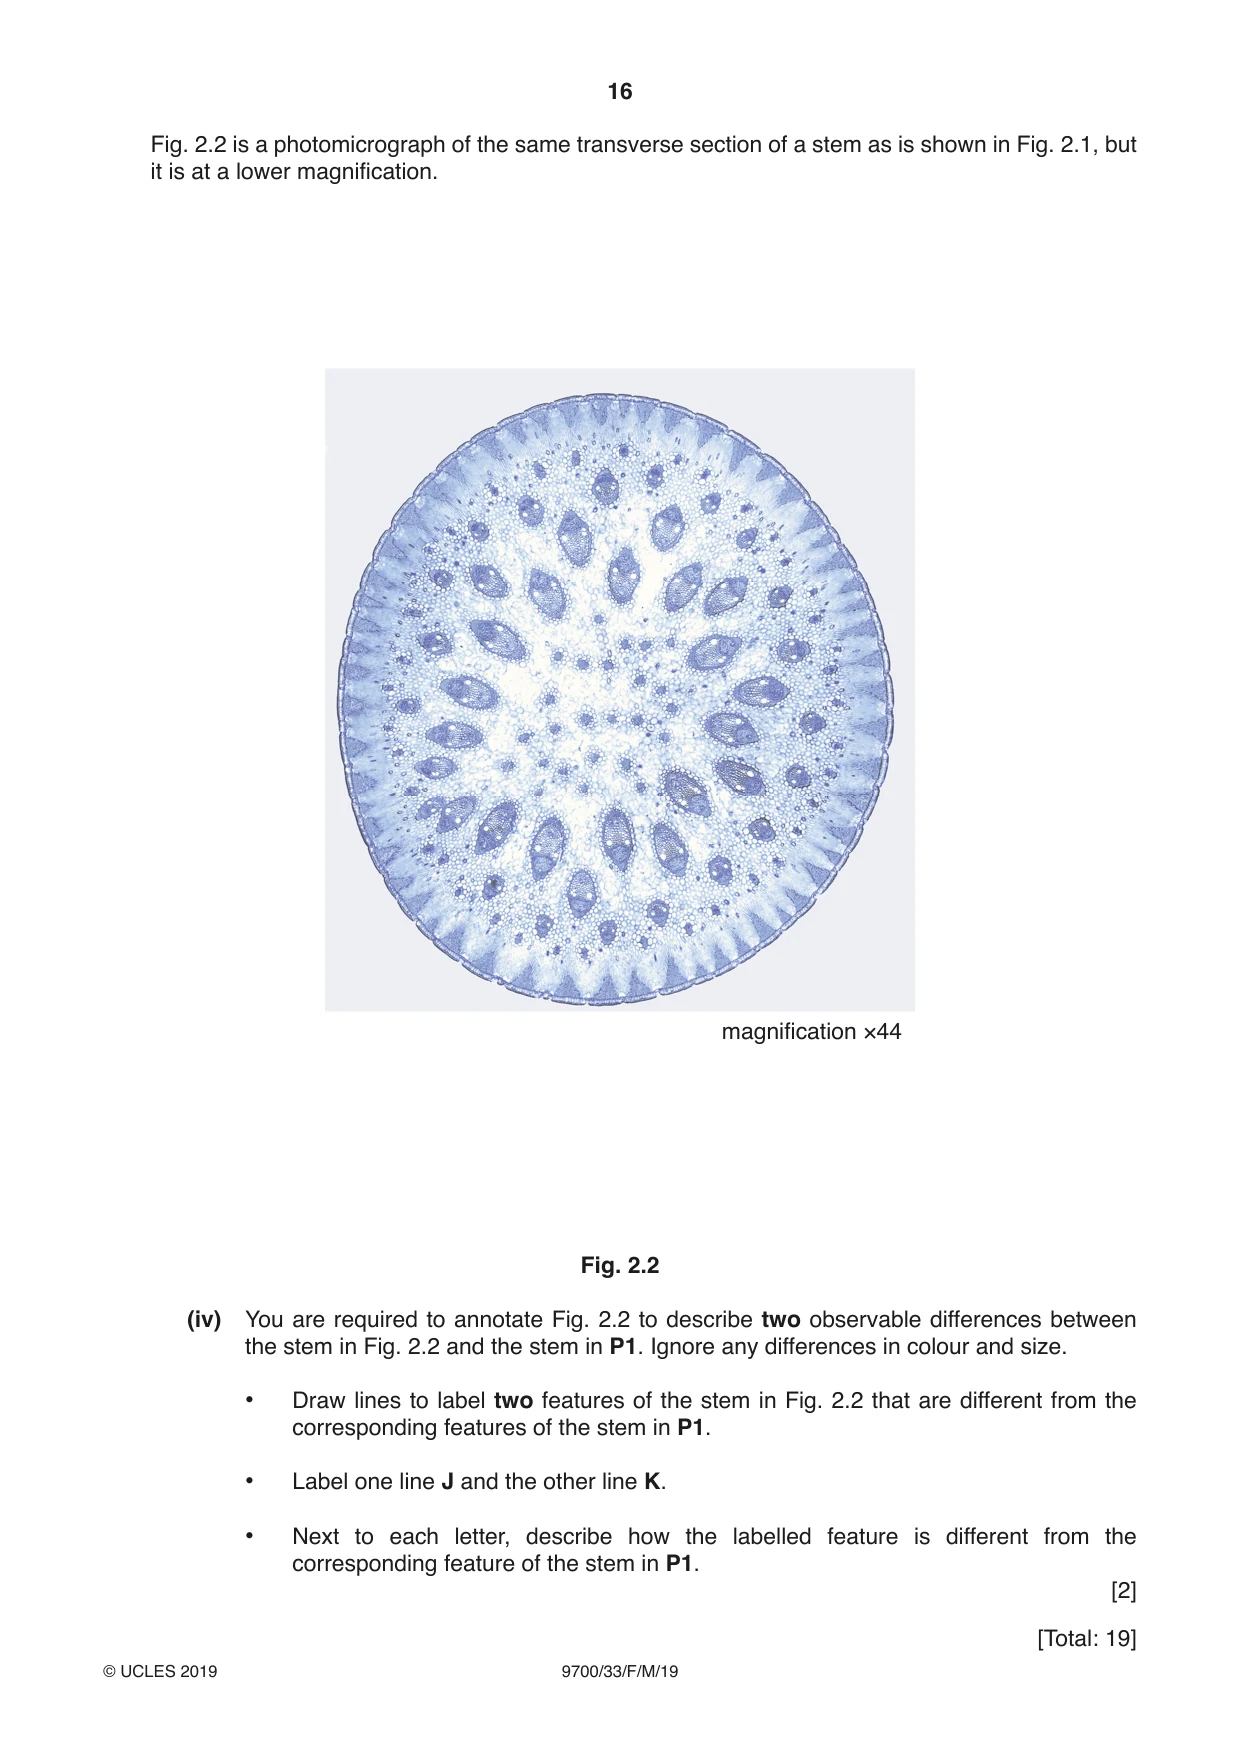
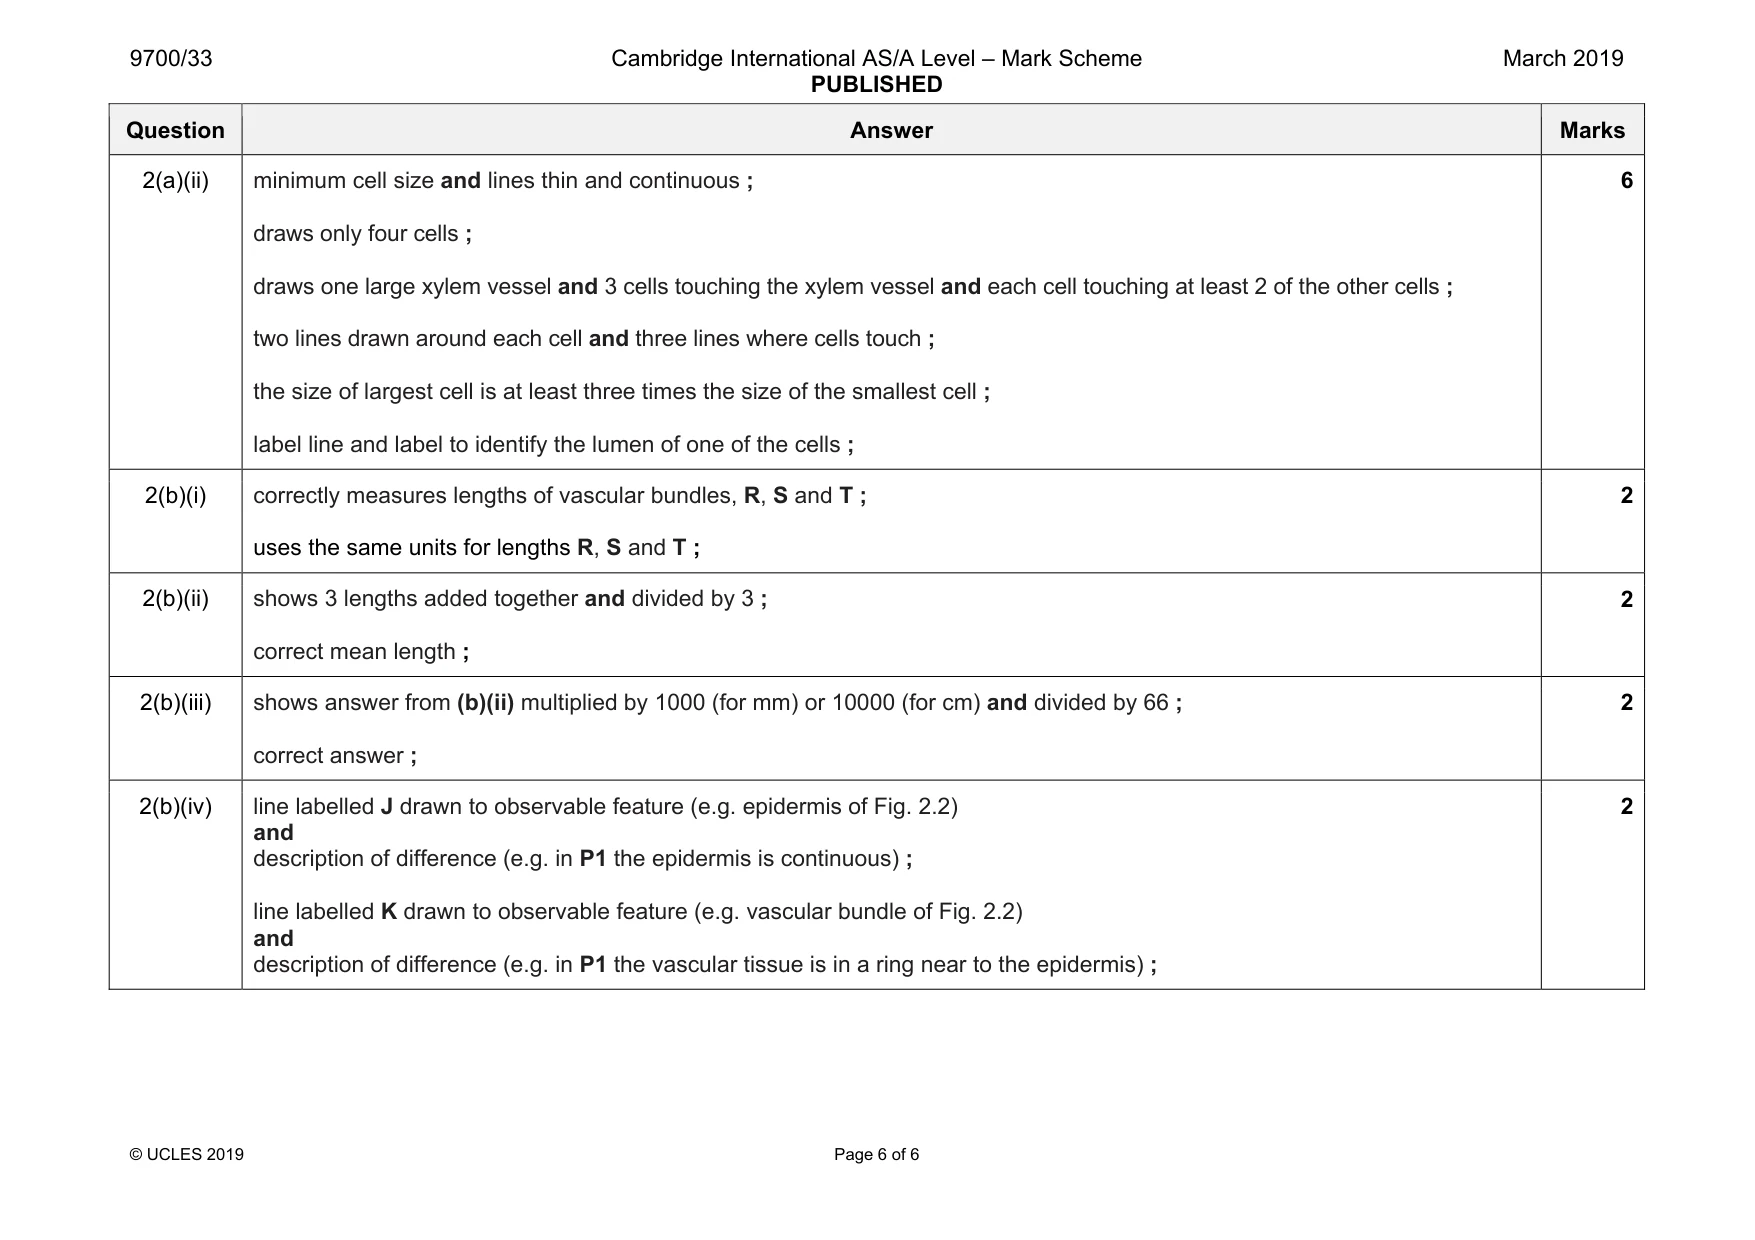
Mark scheme: 2(a)(i) minimum size and draws at least 2 layers of tissue and no cells ; draws epidermis and only 2 vascular bundles ; draws at least one tissue layer passing through vascular bundles ; subdivides vascular bundles ; label line and label to identify the cortex ; 5 Question Answer Marks 2(a)(ii) minimum cell size and lines thin and continuous ; draws only four cells ; draws one large xylem vessel and 3 cells touching the xylem vessel and each cell touching at least 2 of the other cells ; two lines drawn around each cell and three lines where cells touch ; the size of largest cell is at least three times the size of the smallest cell ; label line and label to identify the lumen of one of the cells ; 6 2(b)(i) correctly measures lengths of vascular bundles, R, S and T ; uses the same units for lengths R, S and T ; 2 2(b)(ii) shows 3 lengths added together and divided by 3 ; correct mean length ; 2 2(b)(iii) shows answer from (b)(ii) multiplied by 1000 (for mm) or 10000 (for cm) and divided by 66 ; correct answer ; 2 2(b)(iv) line labelled J drawn to observable feature (e.g. epidermis of Fig. 2.2) and description of difference (e.g. in P1 the epidermis is continuous) ; line labelled K drawn to observable feature (e.g. vascular bundle of Fig. 2.2) and description of difference (e.g. in P1 the vascular tissue is in a ring near to the epidermis) ; 2
What was in this paper
The subtopics covered by these 2 questions, and how many questions each got. Open one in a new tab to see every Cambridge question on it.
What you needed in this session
Cambridge’s own grade thresholds for 2019 Feb/March, Paper 3 · Variant 3. A higher threshold means an easier paper — the bar moves with how the cohort did.