Cambridge A Level Biology 9700 — 2018 Feb/March Paper 3 · Variant 3
9700/33/F/M/18 · 2 questions · 40 marks · ≈45 min
The question paper and its mark scheme, free to read here and free to download. This is Cambridge’s own paper, exactly as it was sat.
Question paper16 pages



Mark scheme6 pages
Answers below. Sit the paper first if you are practising.
Questions as text
Q1 · Mung bean seeds contain an enzyme that is used to hydrolyse (break down) sucrose into…
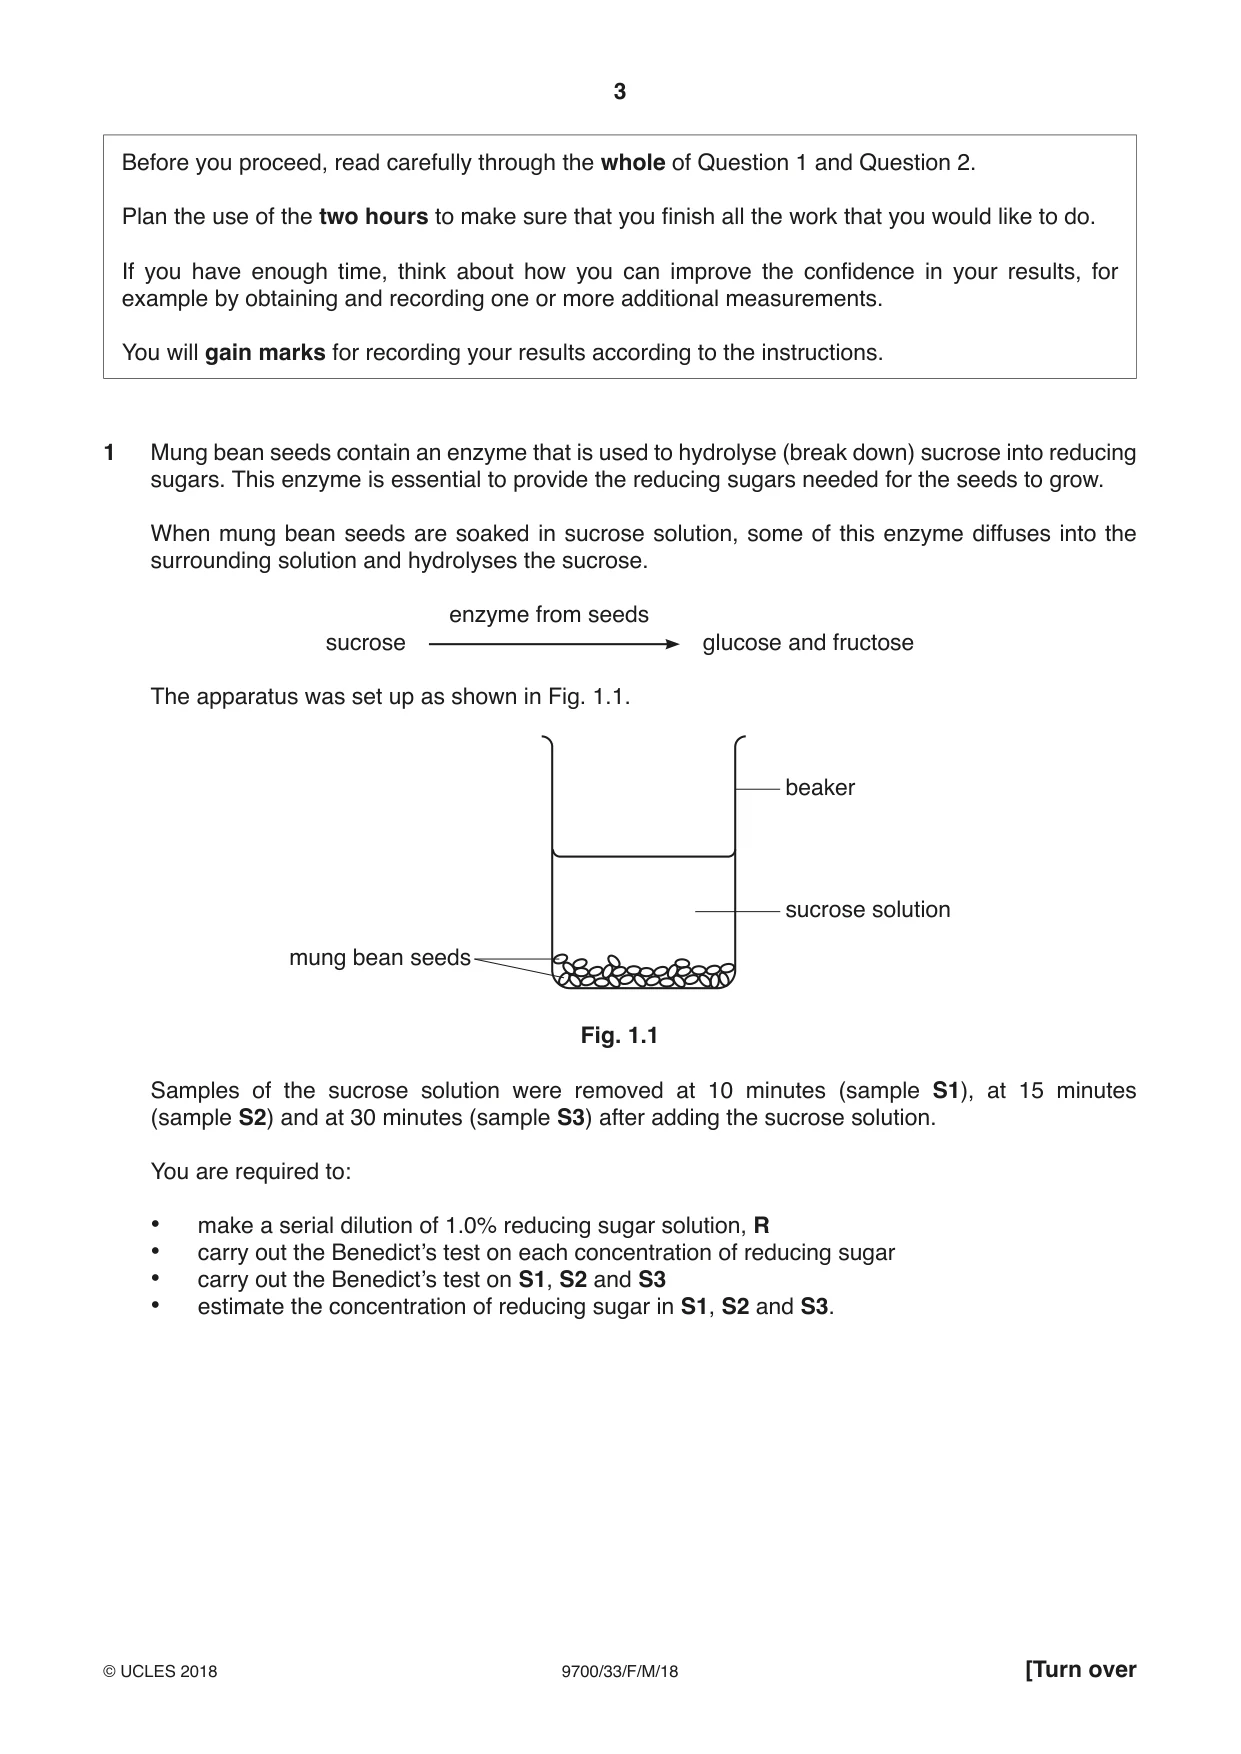
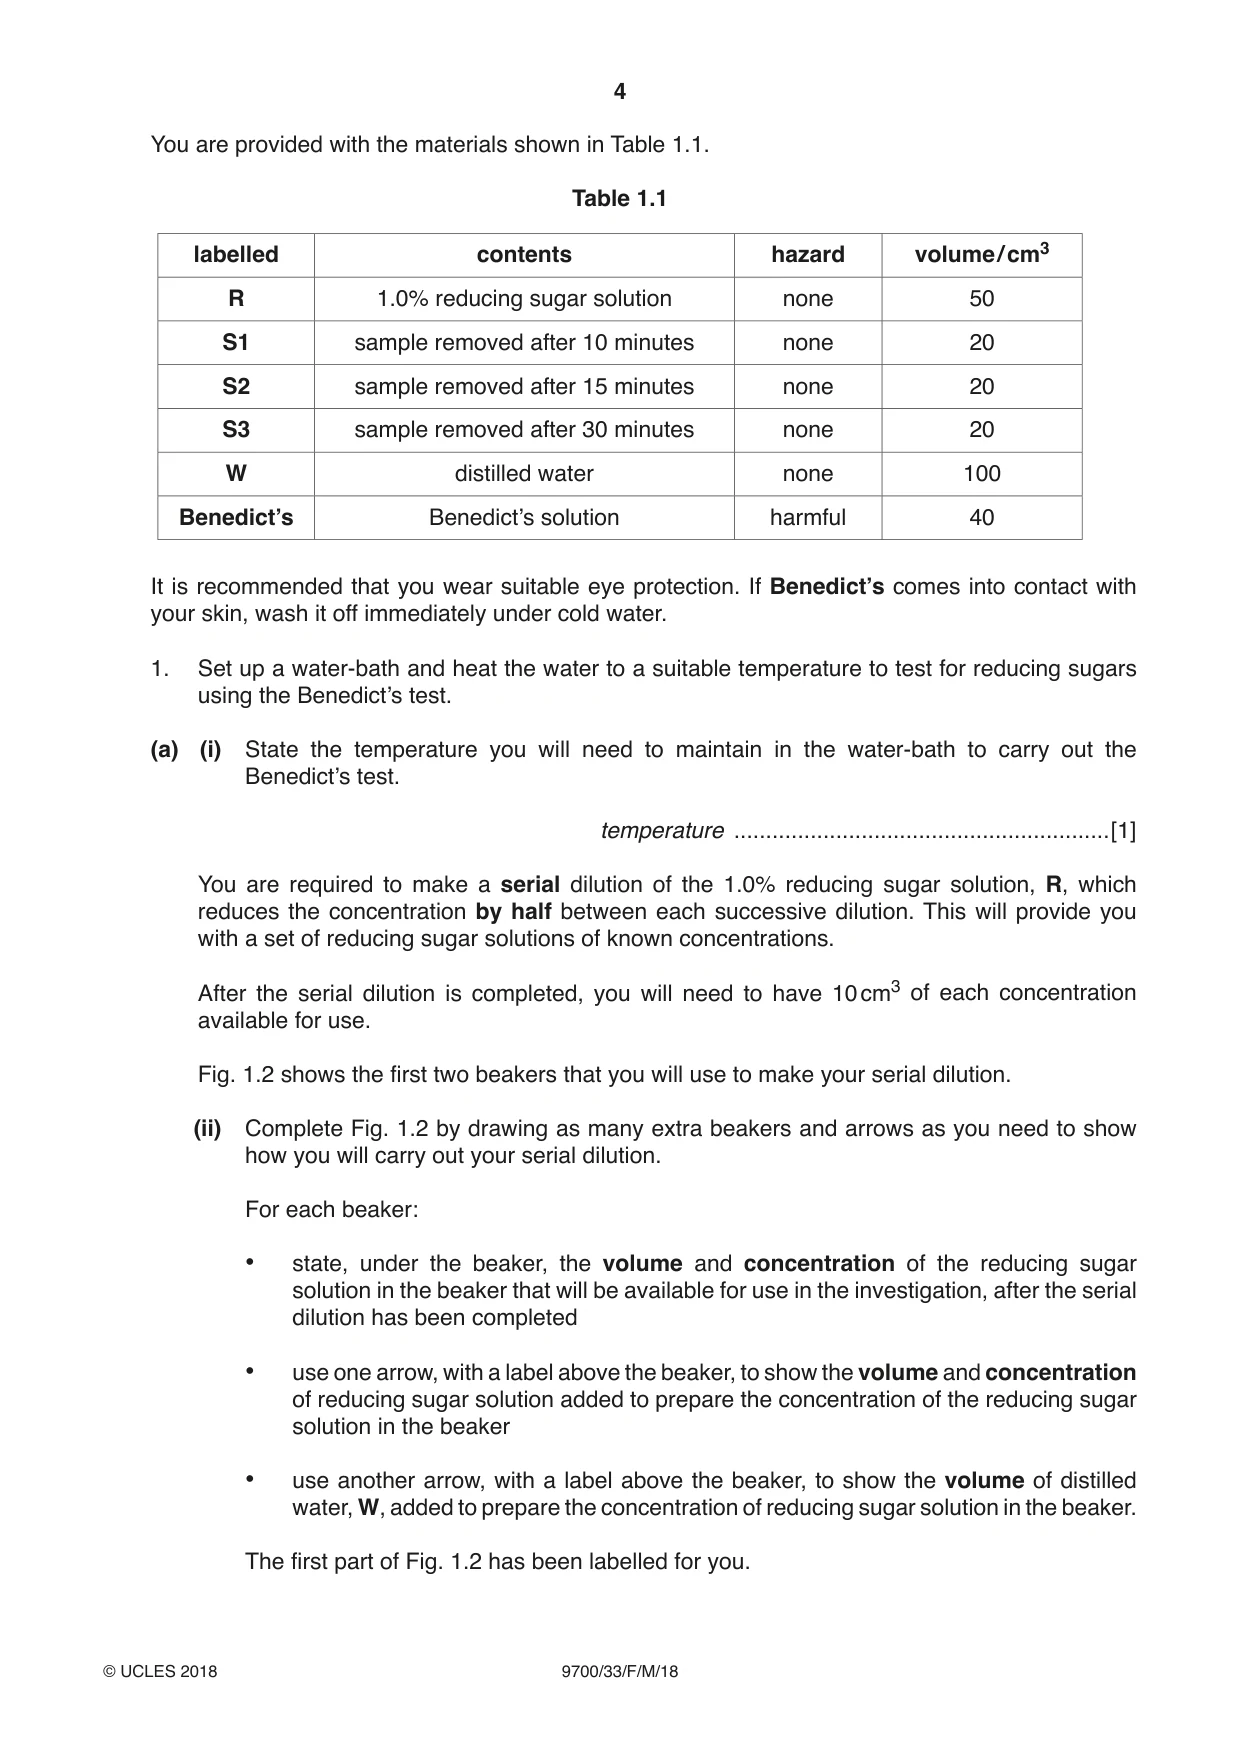
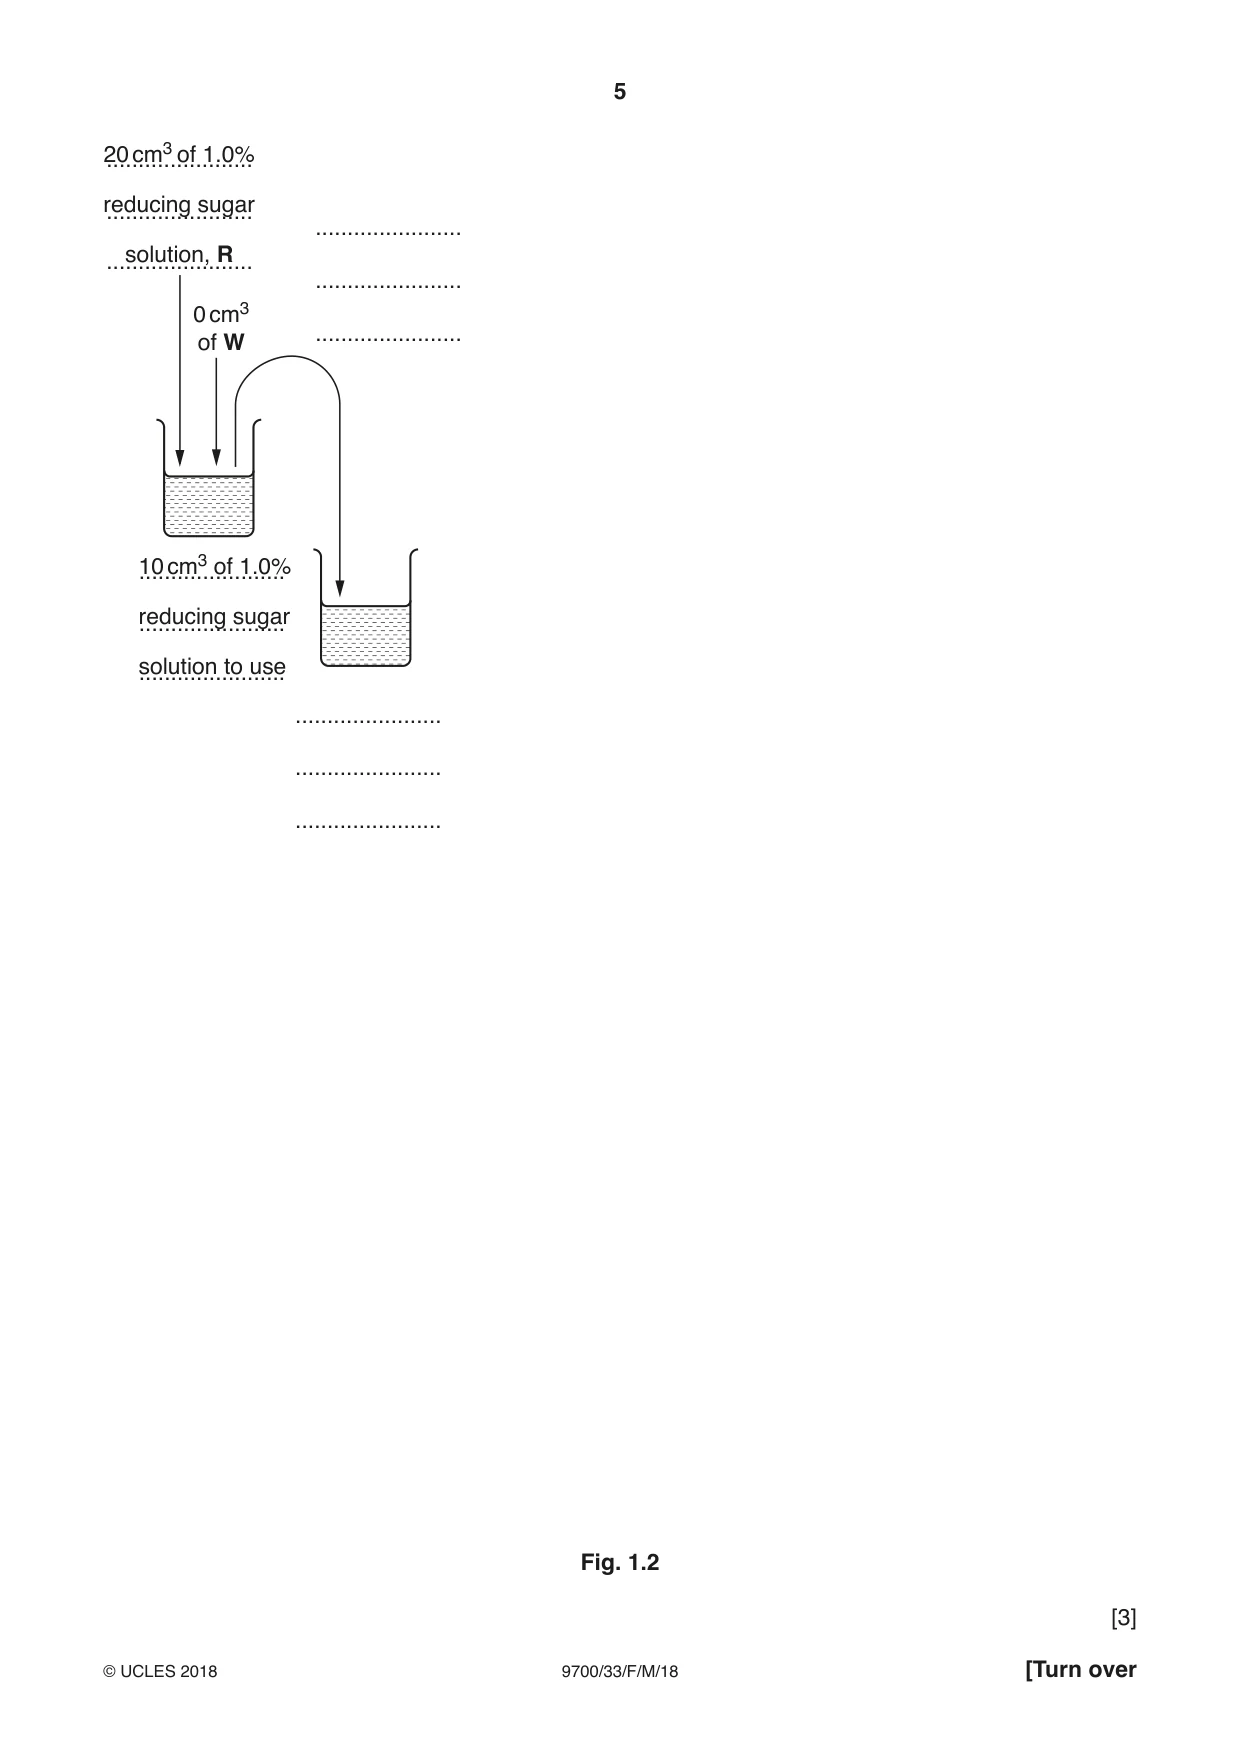
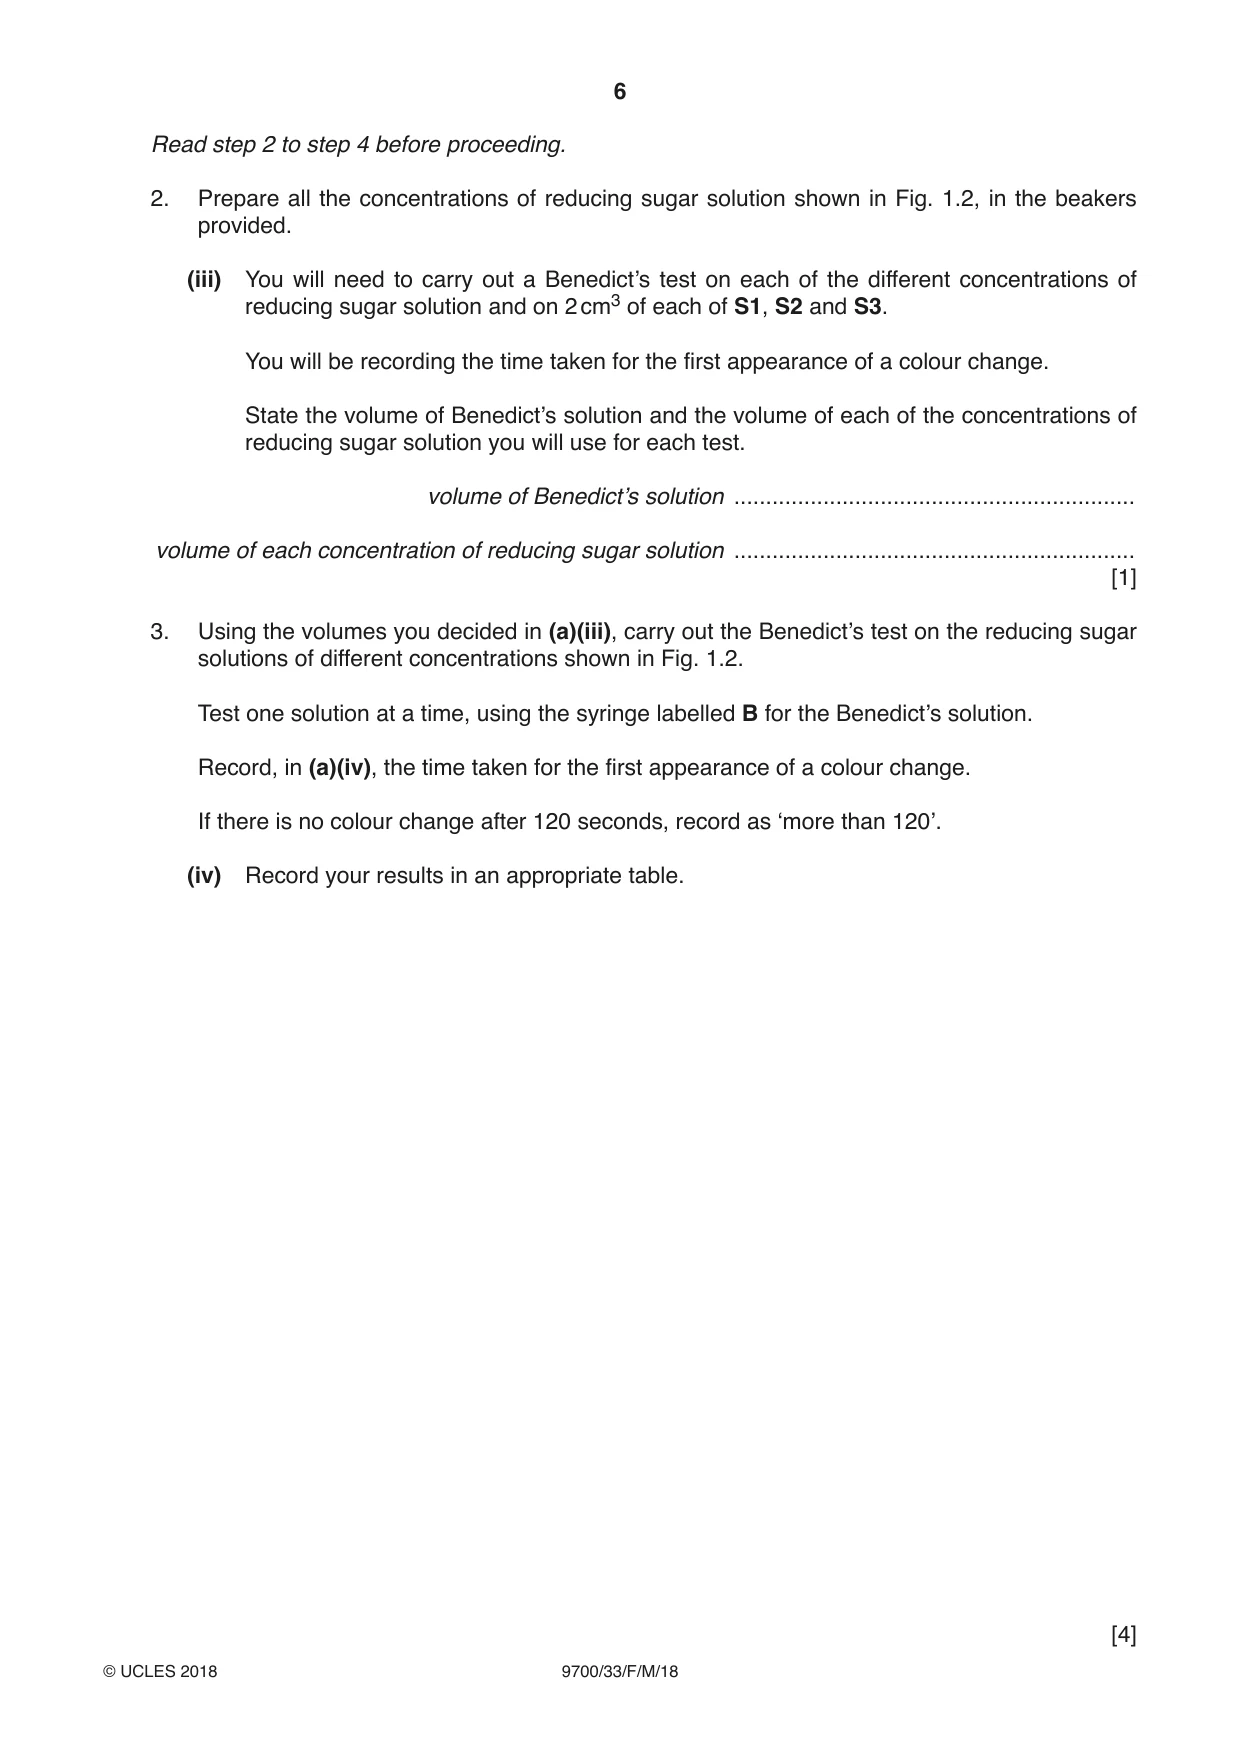
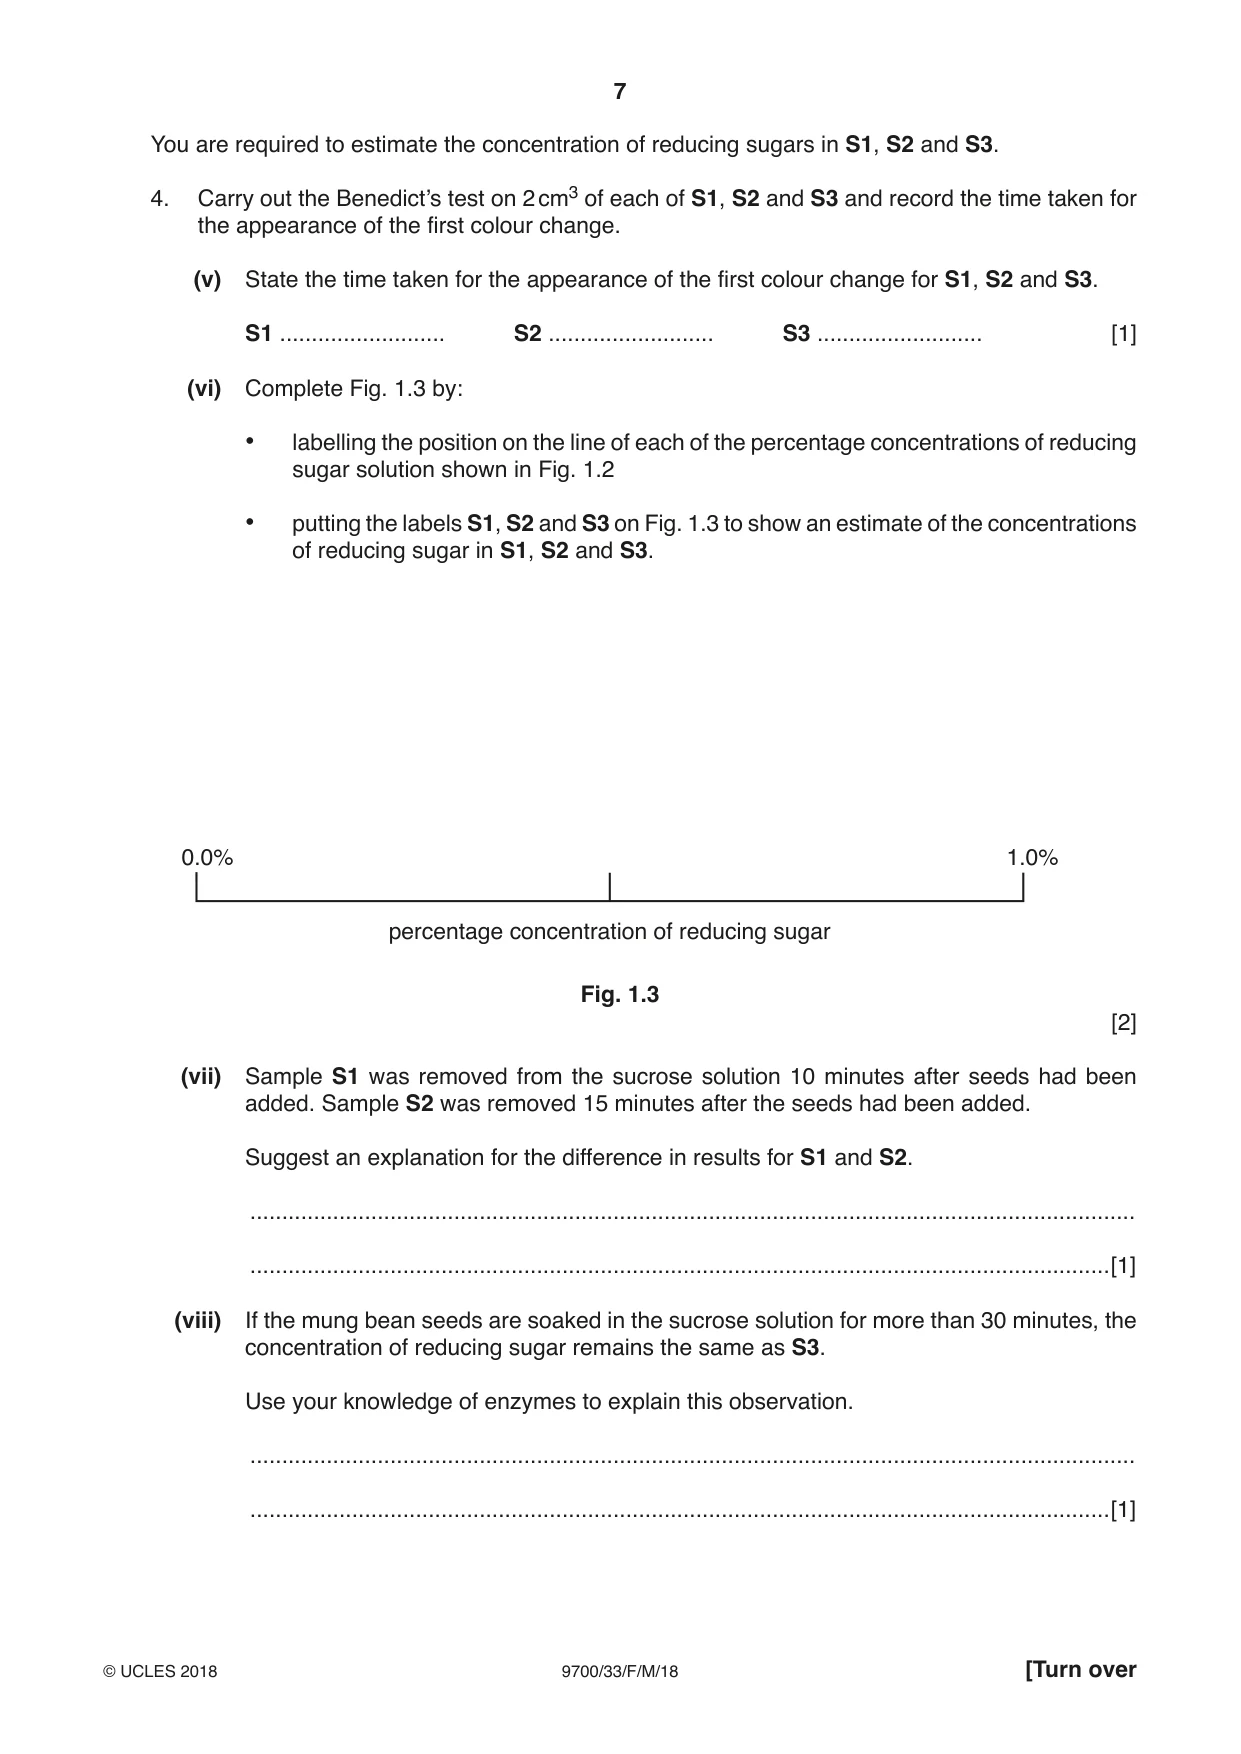
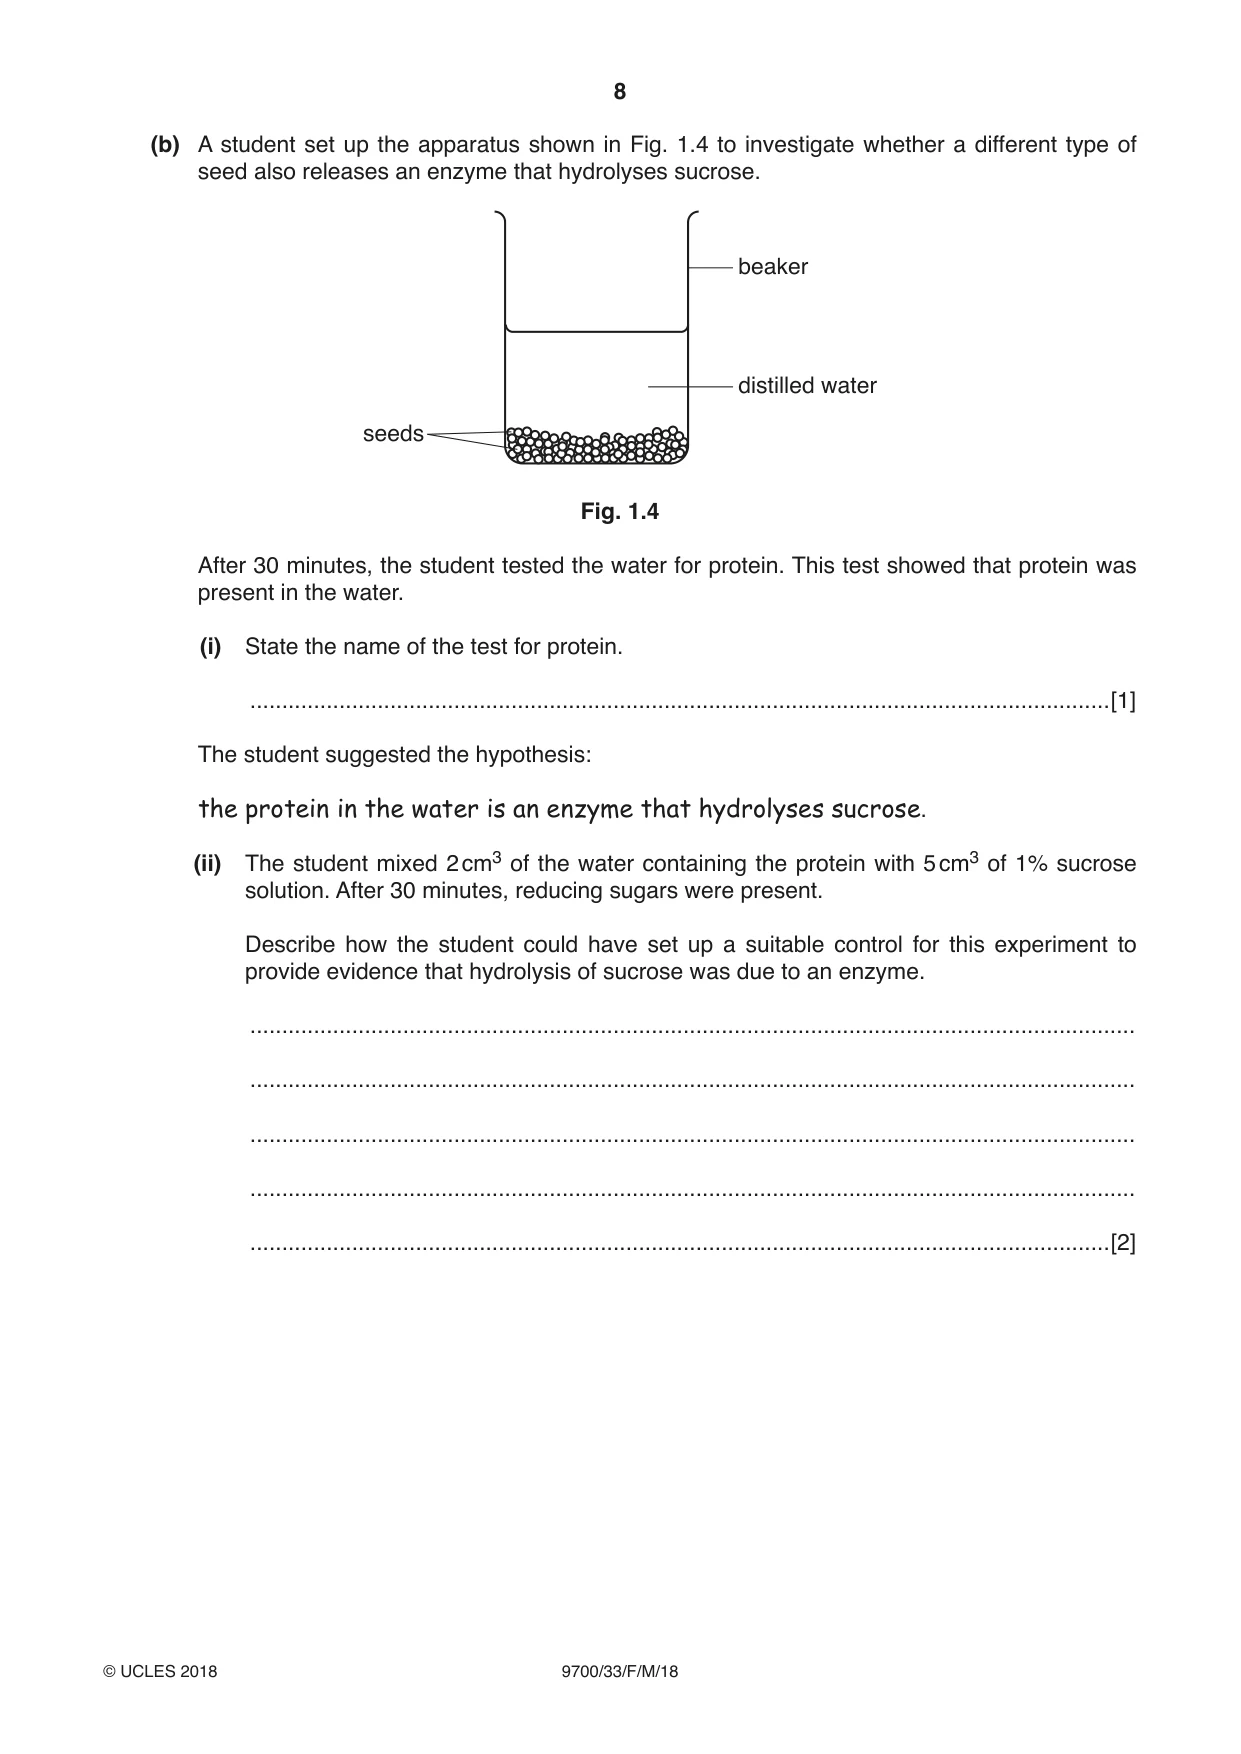
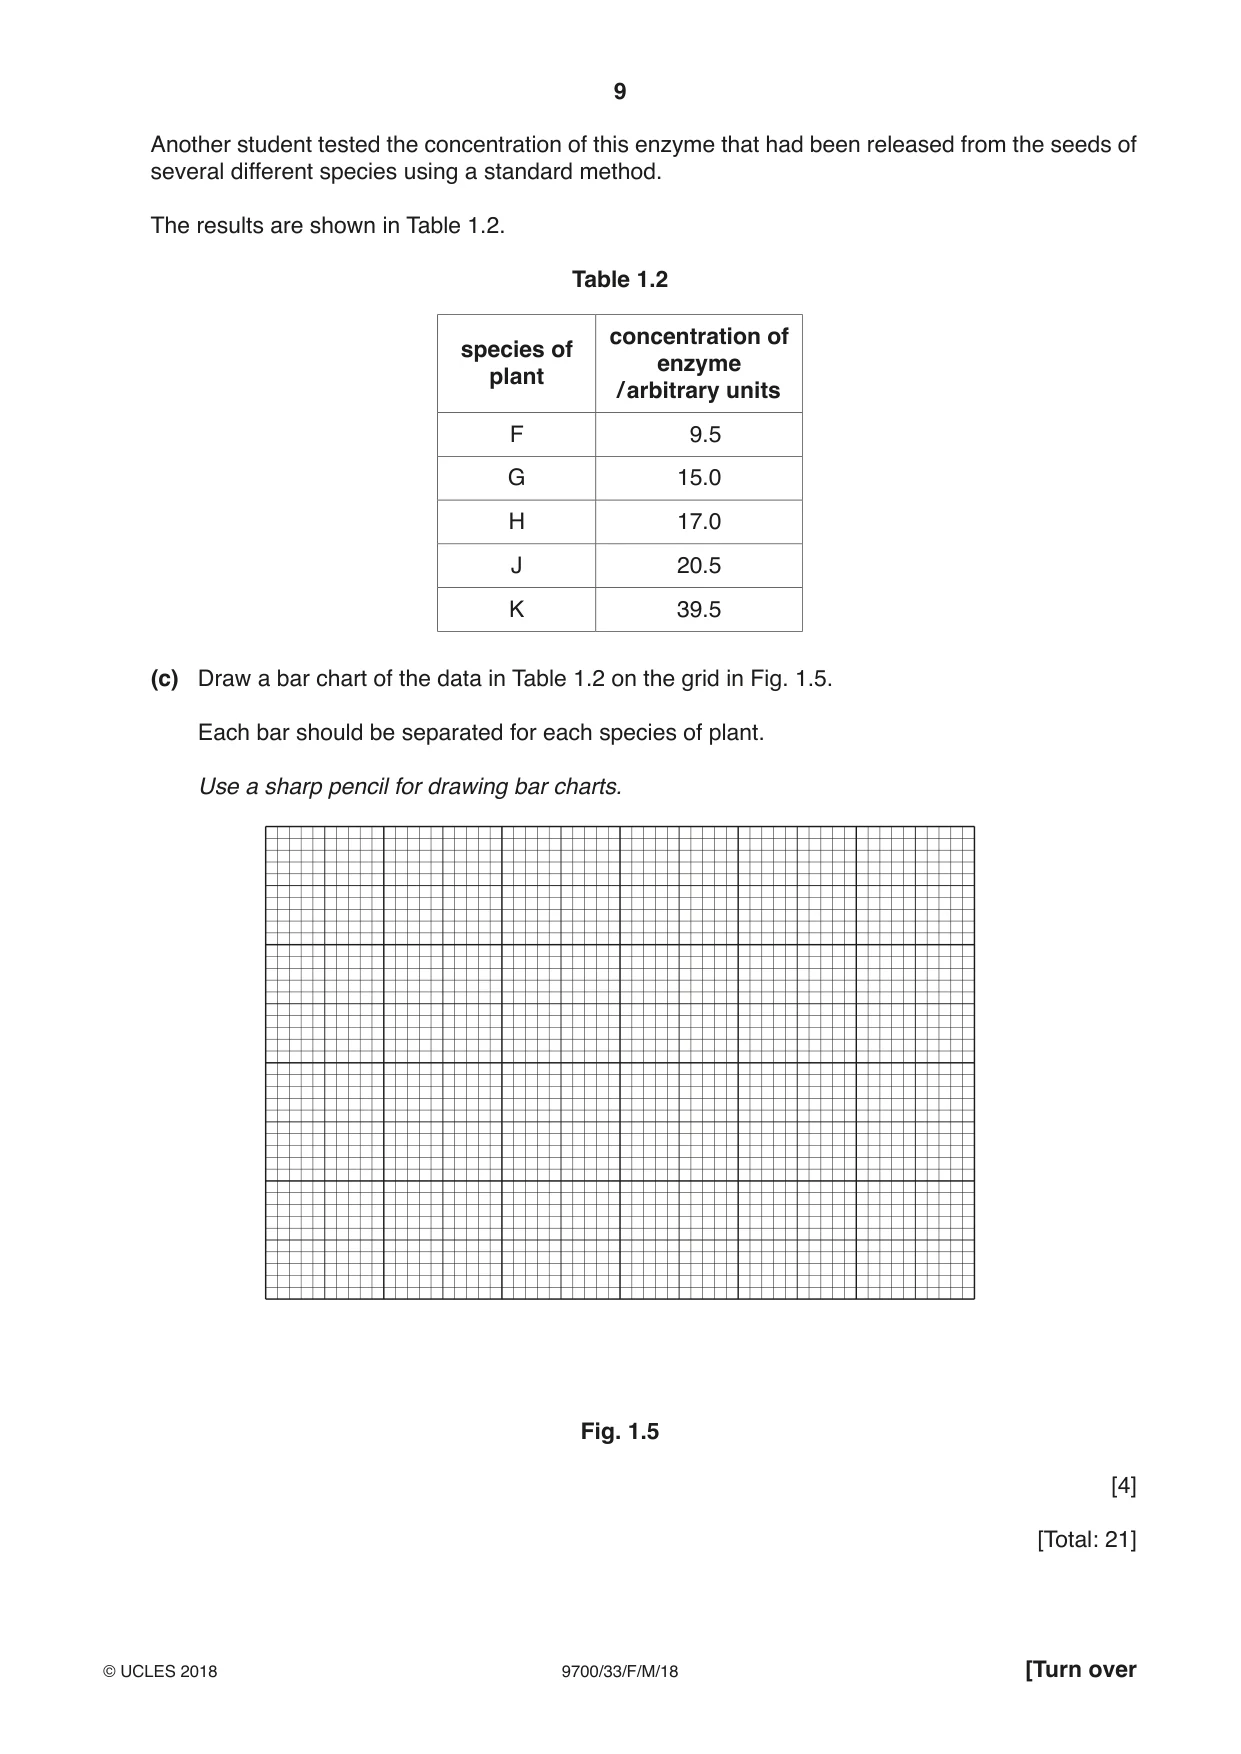
1 Mung bean seeds contain an enzyme that is used to hydrolyse (break down) sucrose into reducing sugars. This enzyme is essential to provide the reducing sugars needed for the seeds to grow. When mung bean seeds are soaked in sucrose solution, some of this enzyme diffuses into the surrounding solution and hydrolyses the sucrose. enzyme from seeds sucrose glucose and fructose The apparatus was set up as shown in Fig. 1.1. beaker sucrose solution mung bean seeds Fig. 1.1 Samples of the sucrose solution were removed at 10 minutes (sample S1), at 15 minutes (sample S2) and at 30 minutes (sample S3) after adding the sucrose solution. You are required to: • make a serial dilution of 1.0% reducing sugar solution, R • carry out the Benedict’s test on each concentration of reducing sugar • carry out the Benedict’s test on S1, S2 and S3 • estimate the concentration of reducing sugar in S1, S2 and S3. You are provided with the materials shown in Table 1.1. Table 1.1 labelled contents hazard volume / cm3 R 1.0% reducing sugar solution none 50 S1 sample removed after 10 minutes none 20 S2 sample removed after 15 minutes none 20 S3 sample removed after 30 minutes none 20 W distilled water none 100 Benedict’s Benedict’s solution harmful 40 It is recommended that you wear suitable eye protection. If Benedict’s comes into contact with your skin, wash it off immediately under cold water. 1. Set up a water-bath and heat the water to a suitable temperature to test for reducing sugars using the Benedict’s test. (a) (i) State the temperature you will need to maintain in the water-bath to carry out the Benedict’s test. temperature ...........................................................[1] You are required to make a serial dilution of the 1.0% reducing sugar solution, R, which reduces the concentration by half between each successive dilution. This will provide you with a set of reducing sugar solutions of known concentrations. After the serial dilution is completed, you will need to have 10 cm3 of each concentration available for use. Fig. 1.2 shows the first two beakers that you will use to make your serial dilution. (ii) Complete Fig. 1.2 by drawing as many extra beakers and arrows as you need to show how you will carry out your serial dilution. For each beaker: • state, under the beaker, the volume and concentration of the reducing sugar solution in the beaker that will be available for use in the investigation, after the serial dilution has been completed • use one arrow, with a label above the beaker, to show the volume and concentration of reducing sugar solution added to prepare the concentration of the reducing sugar solution in the beaker • use another arrow, with a label above the beaker, to show the volume of distilled water, W, added to prepare the concentration of reducing sugar solution in the beaker. The first part of Fig. 1.2 has been labelled for you. 20.......................cm3 of 1.0% reducing sugar....................... ....................... solution, R....................... ....................... 0 cm3 ....................... of W 10.......................cm3 of 1.0% reducing sugar ....................... solution to use ....................... ....................... ....................... ....................... Fig. 1.2 [3] Read step 2 to step 4 before proceeding. 2. Prepare all the concentrations of reducing sugar solution shown in Fig. 1.2, in the beakers provided. (iii) You will need to carry out a Benedict’s test on each of the different concentrations of reducing sugar solution and on 2 cm3 of each of S1, S2 and S3. You will be recording the time taken for the first appearance of a colour change. State the volume of Benedict’s solution and the volume of each of the concentrations of reducing sugar solution you will use for each test. volume of Benedict’s solution ............................................................... volume of each concentration of reducing sugar solution ............................................................... [1] 3. Using the volumes you decided in (a)(iii), carry out the Benedict’s test on the reducing sugar solutions of different concentrations shown in Fig. 1.2. Test one solution at a time, using the syringe labelled B for the Benedict’s solution. Record, in (a)(iv), the time taken for the first appearance of a colour change. If there is no colour change after 120 seconds, record as ‘more than 120’. (iv) Record your results in an appropriate table. [4] You are required to estimate the concentration of reducing sugars in S1, S2 and S3. 4. Carry out the Benedict’s test on 2 cm3 of each of S1, S2 and S3 and record the time taken for the appearance of the first colour change. (v) State the time taken for the appearance of the first colour change for S1, S2 and S3. S1 .......................... S2 .......................... S3 .......................... [1] (vi) Complete Fig. 1.3 by: • labelling the position on the line of each of the percentage concentrations of reducing sugar solution shown in Fig. 1.2 • putting the labels S1, S2 and S3 on Fig. 1.3 to show an estimate of the concentrations of reducing sugar in S1, S2 and S3. 0.0% 1.0% percentage concentration of reducing sugar Fig. 1.3 [2] (vii) Sample S1 was removed from the sucrose solution 10 minutes after seeds had been added. Sample S2 was removed 15 minutes after the seeds had been added. Suggest an explanation for the difference in results for S1 and S2. ........................................................................................................................................... .......................................................................................................................................[1] (viii) If the mung bean seeds are soaked in the sucrose solution for more than 30 minutes, the concentration of reducing sugar remains the same as S3. Use your knowledge of enzymes to explain this observation. ........................................................................................................................................... .......................................................................................................................................[1] (b) A student set up the apparatus shown in Fig. 1.4 to investigate whether a different type of seed also releases an enzyme that hydrolyses sucrose. beaker distilled water seeds Fig. 1.4 After 30 minutes, the student tested the water for protein. This test showed that protein was present in the water. (i) State the name of the test for protein. .......................................................................................................................................[1] The student suggested the hypothesis: the protein in the water is an enzyme that hydrolyses sucrose. (ii) The student mixed 2 cm3 of the water containing the protein with 5 cm3 of 1% sucrose solution. After 30 minutes, reducing sugars were present. Describe how the student could have set up a suitable control for this experiment to provide evidence that hydrolysis of sucrose was due to an enzyme. ........................................................................................................................................... ........................................................................................................................................... ........................................................................................................................................... ........................................................................................................................................... .......................................................................................................................................[2] Another student tested the concentration of this enzyme that had been released from the seeds of several different species using a standard method. The results are shown in Table 1.2. Table 1.2 concentration of species of enzyme plant / arbitrary units F 9.5 G 15.0 H 17.0 J 20.5 K 39.5 (c) Draw a bar chart of the data in Table 1.2 on the grid in Fig. 1.5. Each bar should be separated for each species of plant. Use a sharp pencil for drawing bar charts. Fig. 1.5 [4] [Total: 21]
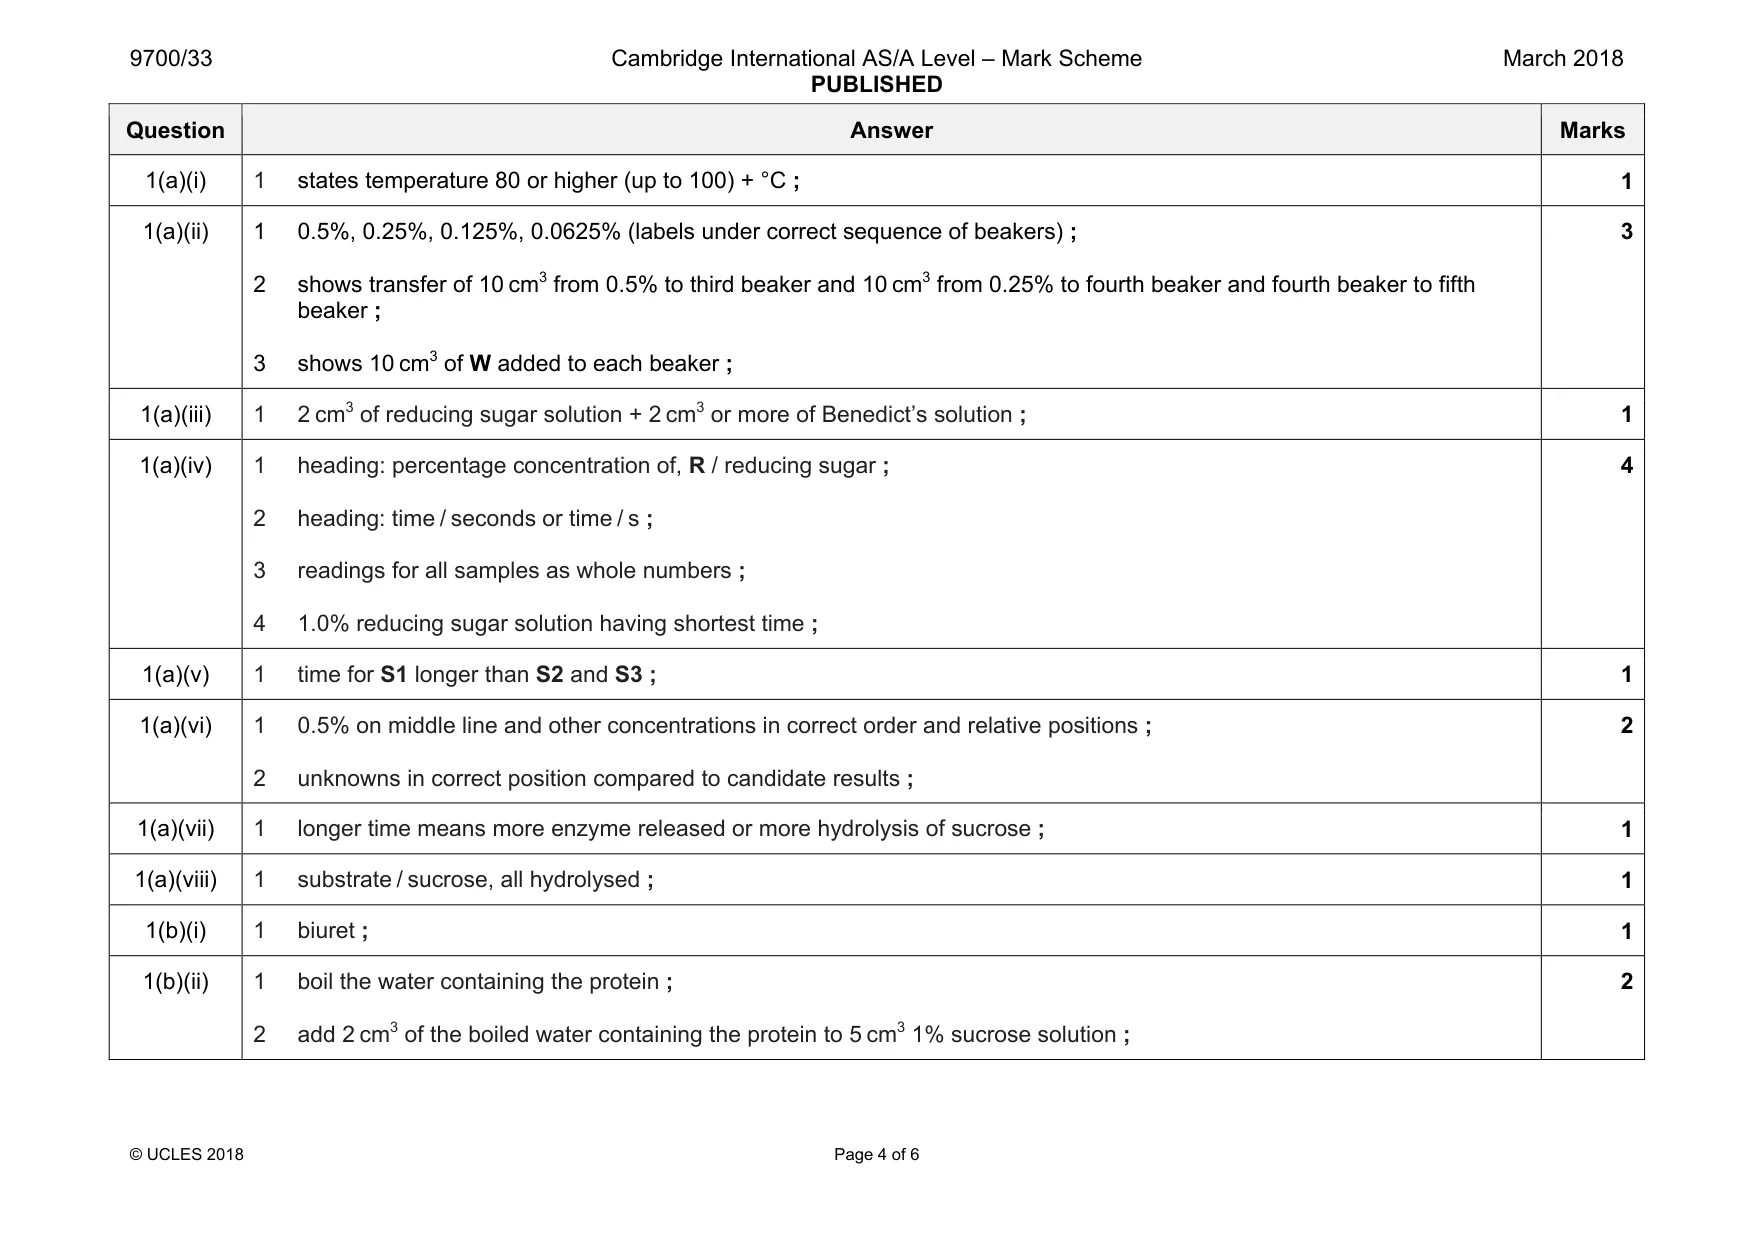
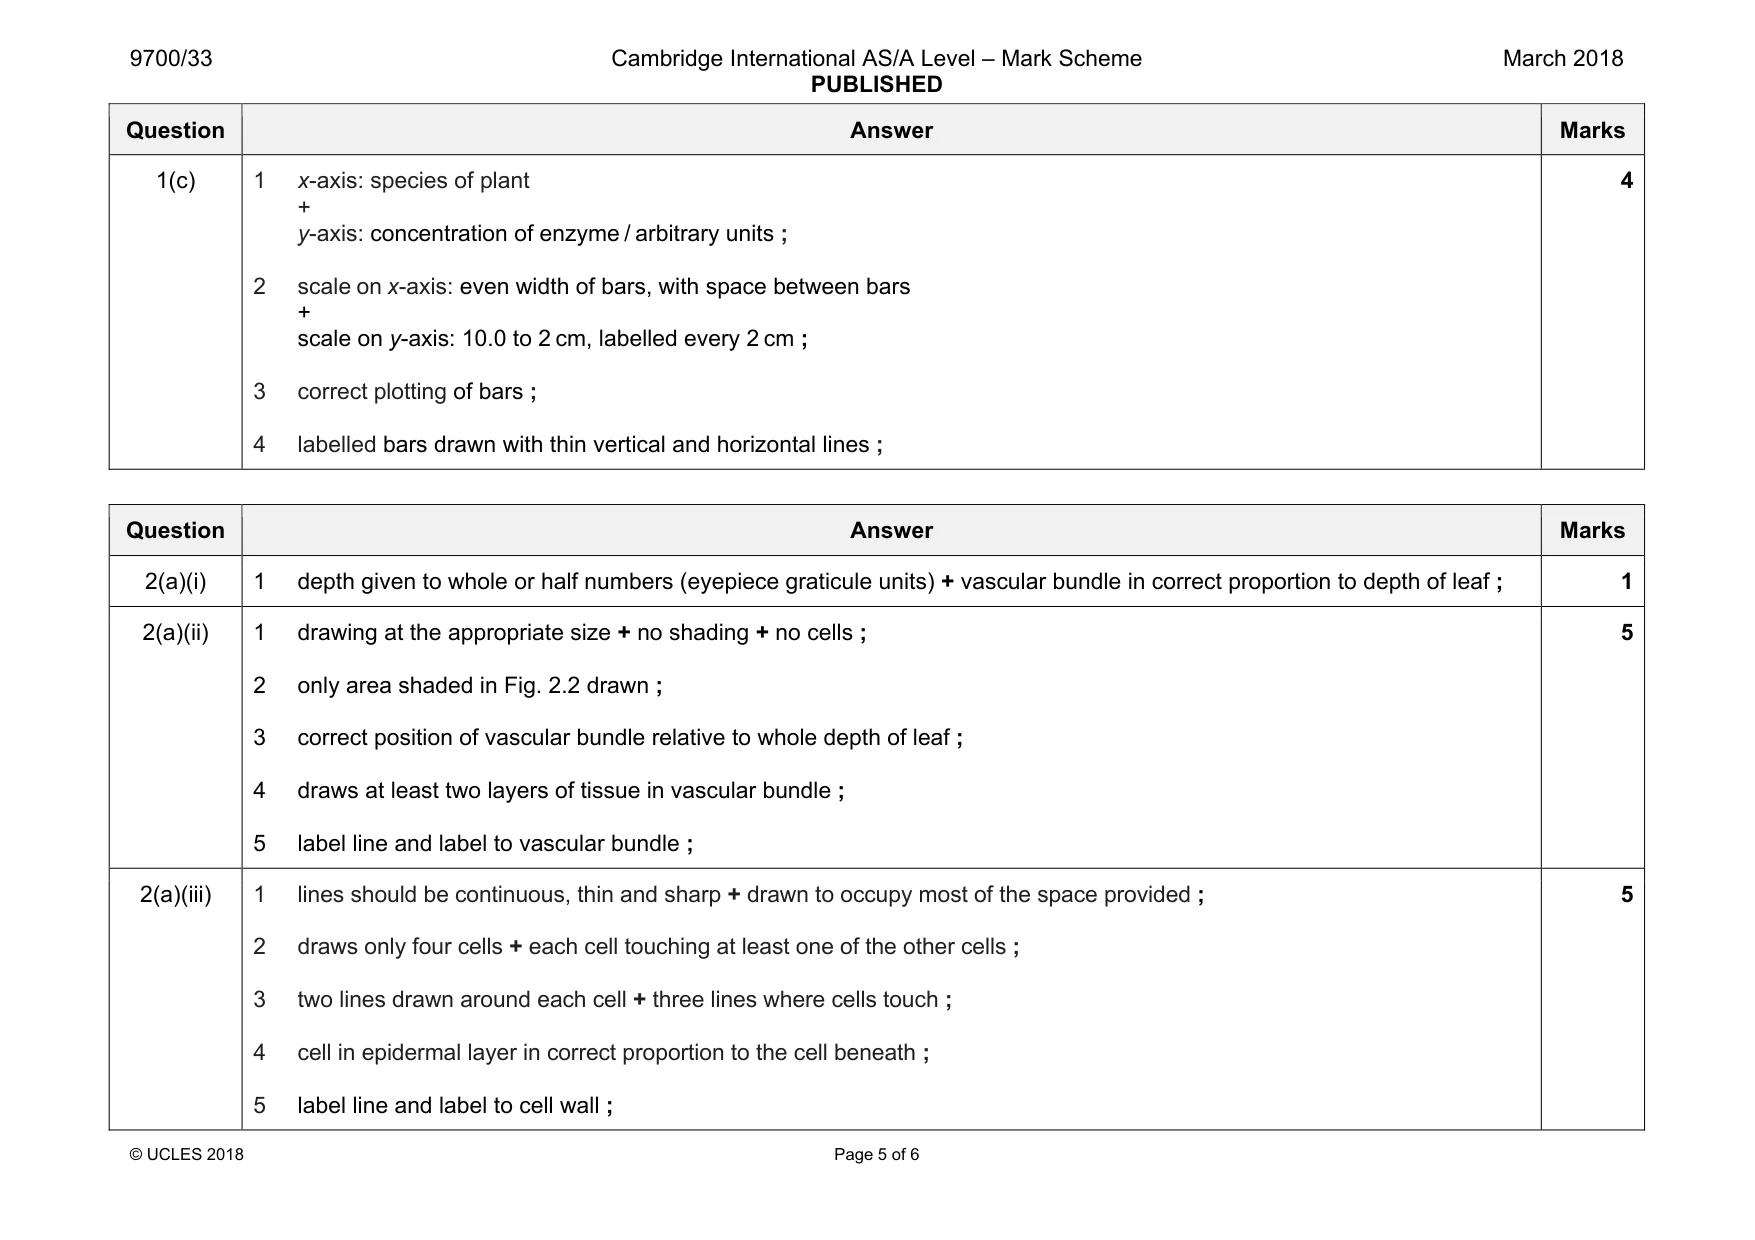
Mark scheme: 1(a)(i) 1 states temperature 80 or higher (up to 100) + °C ; 1 1(a)(ii) 1 0.5%, 0.25%, 0.125%, 0.0625% (labels under correct sequence of beakers) ; 2 shows transfer of 10 cm3 from 0.5% to third beaker and 10 cm3 from 0.25% to fourth beaker and fourth beaker to fifth beaker ; 3 shows 10 cm3 of W added to each beaker ; 3 1(a)(iii) 1 2 cm3 of reducing sugar solution + 2 cm3 or more of Benedict’s solution ; 1 1(a)(iv) 1 heading: percentage concentration of, R / reducing sugar ; 2 heading: time / seconds or time / s ; 3 readings for all samples as whole numbers ; 4 1.0% reducing sugar solution having shortest time ; 4 1(a)(v) 1 time for S1 longer than S2 and S3 ; 1 1(a)(vi) 1 0.5% on middle line and other concentrations in correct order and relative positions ; 2 unknowns in correct position compared to candidate results ; 2 1(a)(vii) 1 longer time means more enzyme released or more hydrolysis of sucrose ; 1 1(a)(viii) 1 substrate / sucrose, all hydrolysed ; 1 1(b)(i) 1 biuret ; 1 1(b)(ii) 1 boil the water containing the protein ; 2 add 2 cm3 of the boiled water containing the protein to 5 cm3 1% sucrose solution ; 2 Question Answer Marks 1(c) 1 x-axis: species of plant + y-axis: concentration of enzyme / arbitrary units ; 2 scale on x-axis: even width of bars, with space between bars + scale on y-axis: 10.0 to 2 cm, labelled every 2 cm ; 3 correct plotting of bars ; 4 labelled bars drawn with thin vertical and horizontal lines ; 4
Q2 · P1 is a slide of a stained transverse section through a plant leaf
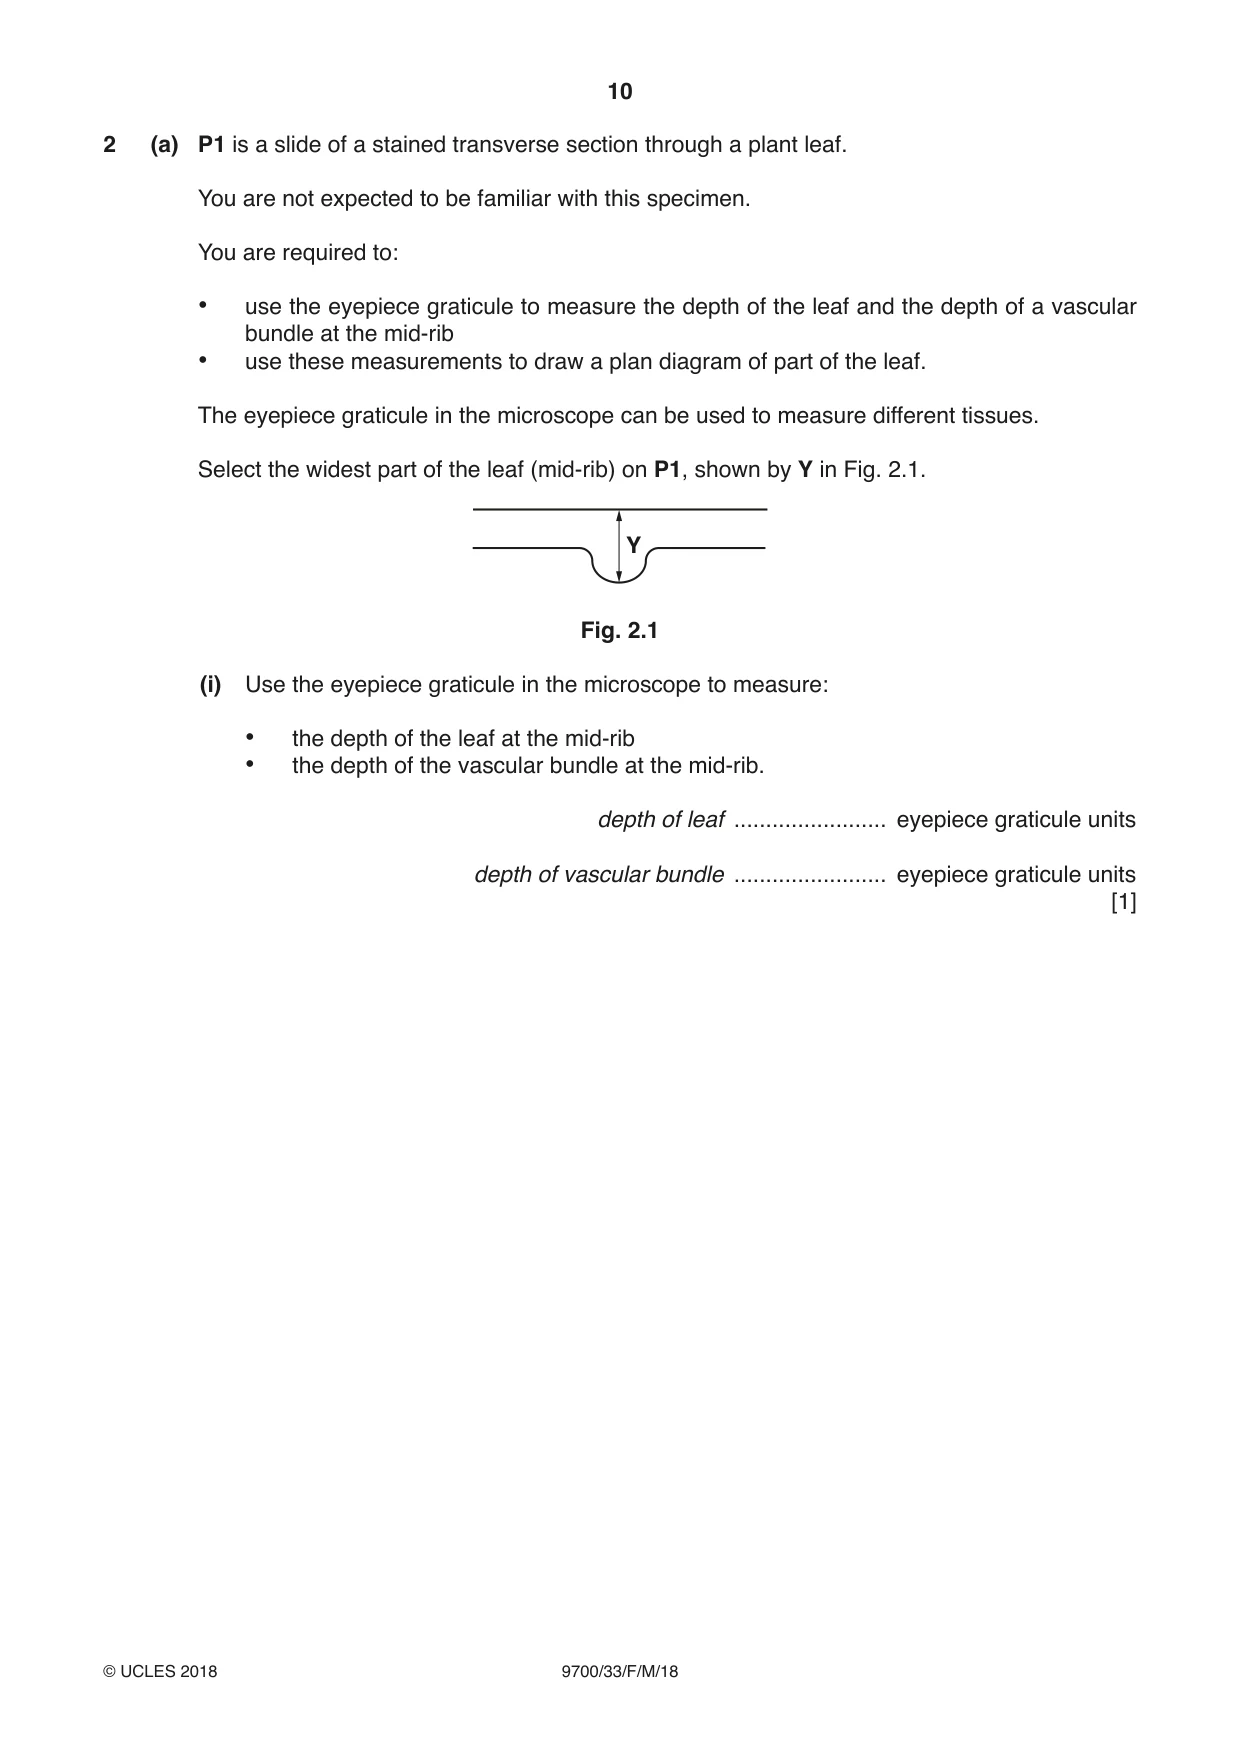
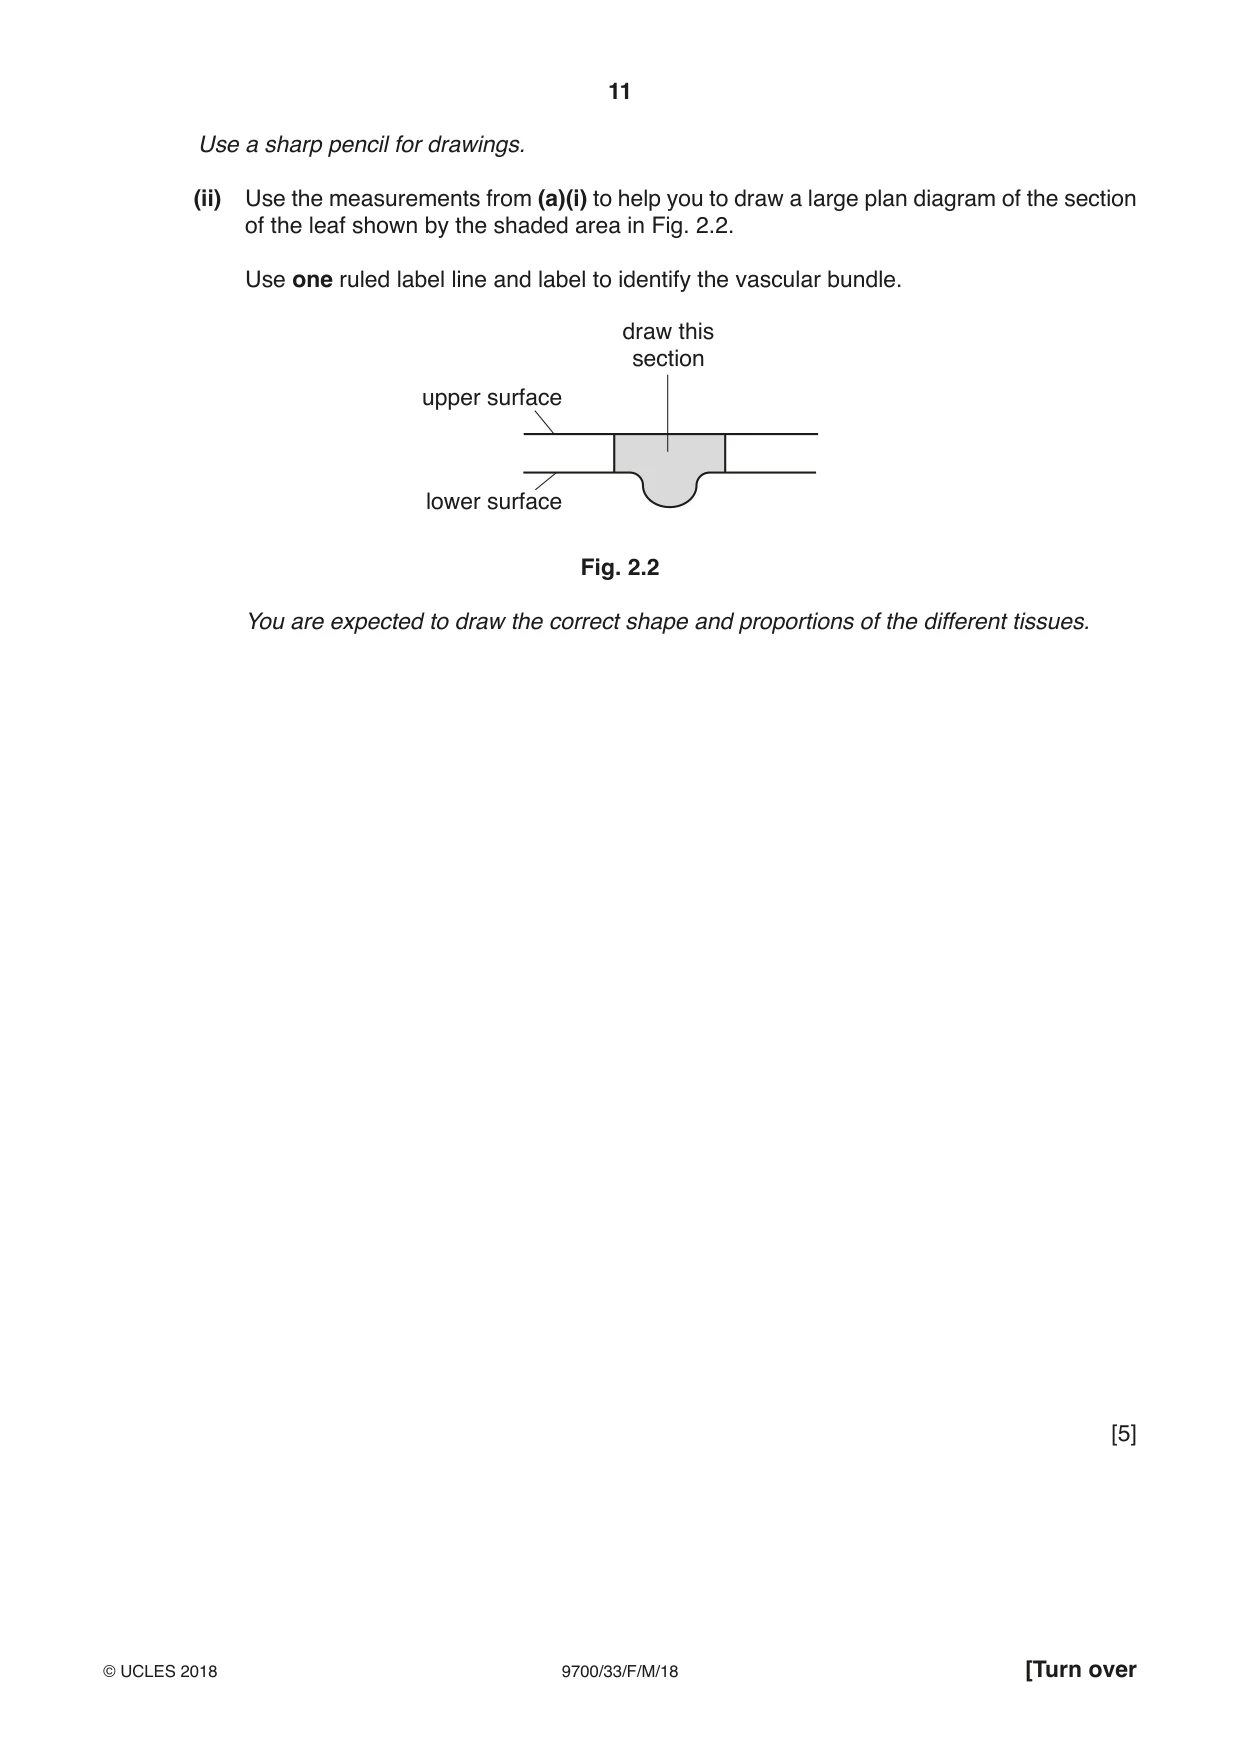
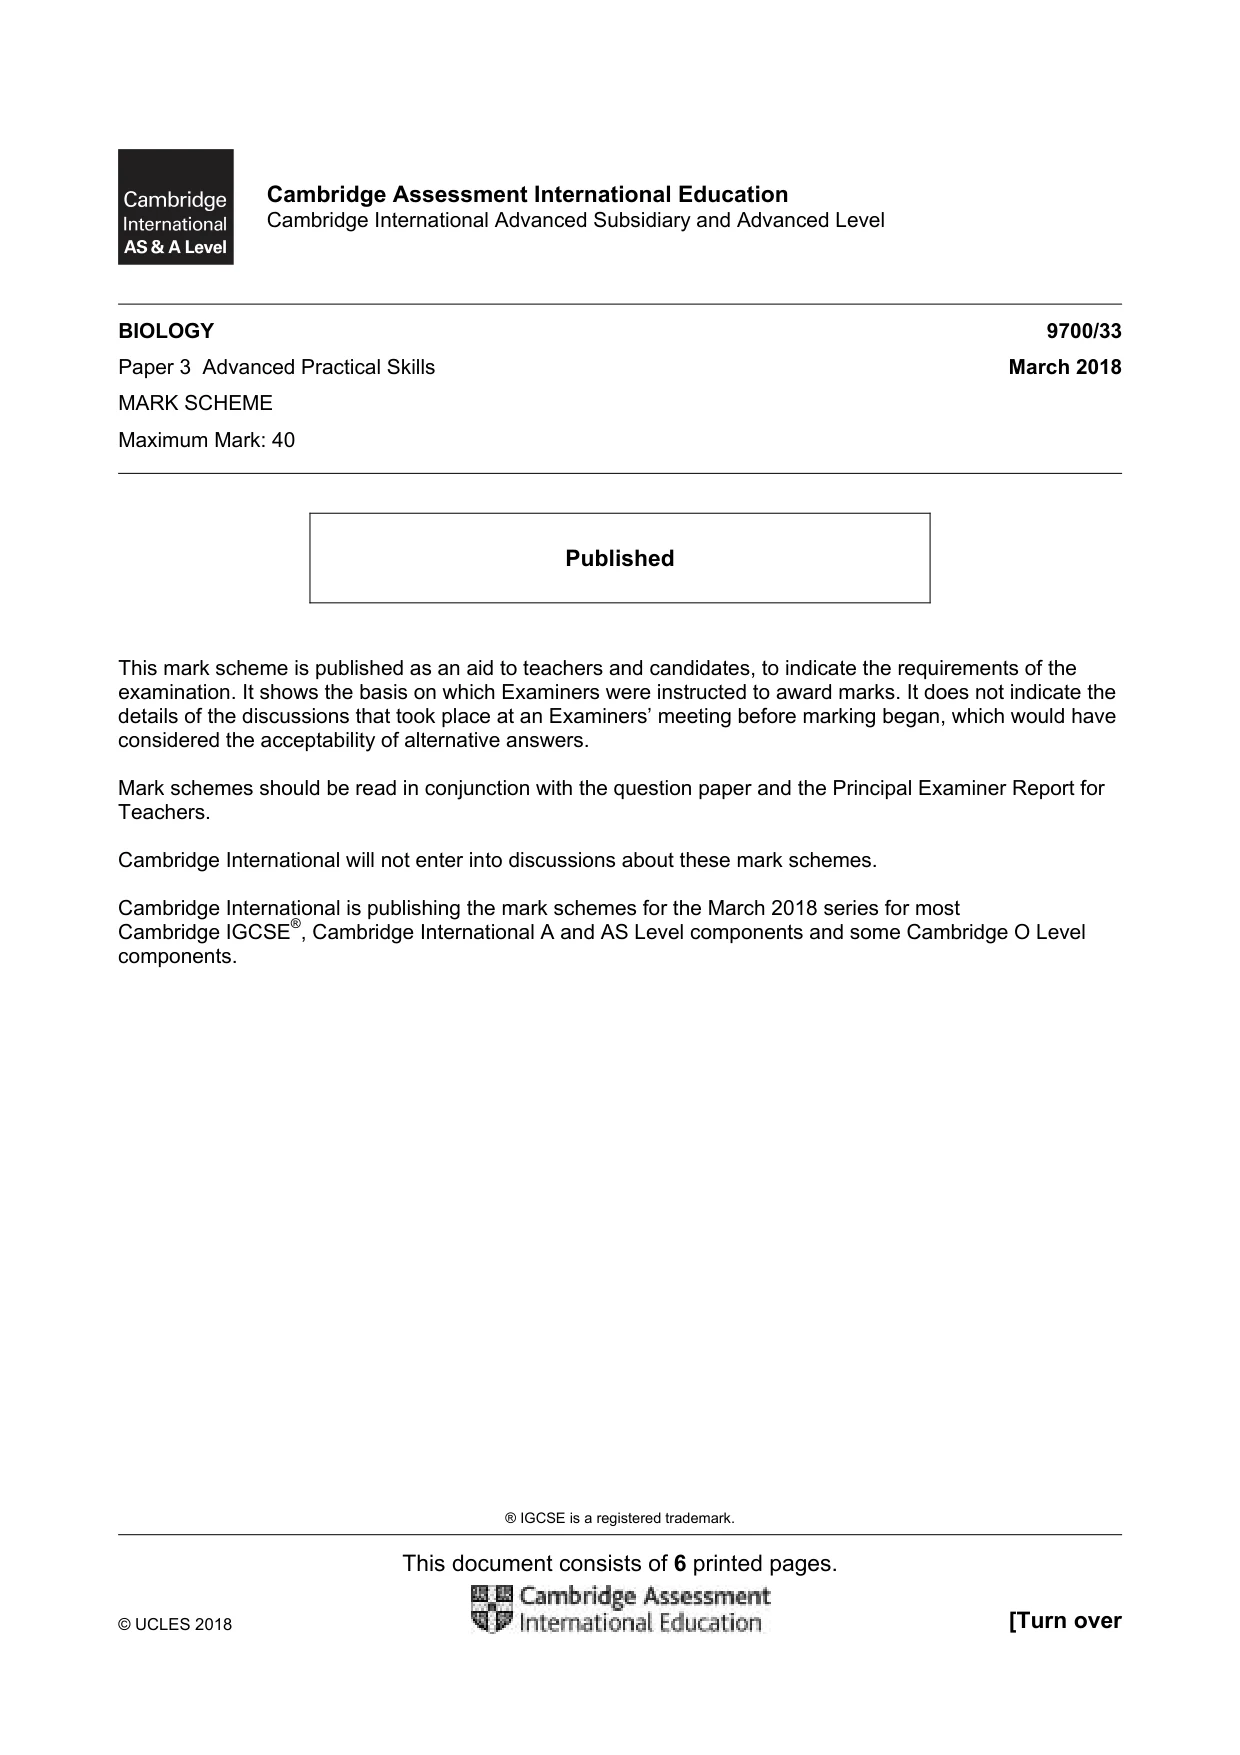
2 (a) P1 is a slide of a stained transverse section through a plant leaf. You are not expected to be familiar with this specimen. You are required to: • use the eyepiece graticule to measure the depth of the leaf and the depth of a vascular bundle at the mid-rib • use these measurements to draw a plan diagram of part of the leaf. The eyepiece graticule in the microscope can be used to measure different tissues. Select the widest part of the leaf (mid-rib) on P1, shown by Y in Fig. 2.1. Y Fig. 2.1 (i) Use the eyepiece graticule in the microscope to measure: • the depth of the leaf at the mid-rib • the depth of the vascular bundle at the mid-rib. depth of leaf ........................ eyepiece graticule units depth of vascular bundle ........................ eyepiece graticule units [1] Use a sharp pencil for drawings. (ii) Use the measurements from (a)(i) to help you to draw a large plan diagram of the section of the leaf shown by the shaded area in Fig. 2.2. Use one ruled label line and label to identify the vascular bundle. draw this section upper surface lower surface Fig. 2.2 You are expected to draw the correct shape and proportions of the different tissues. [5] Question 2 continues on page 13
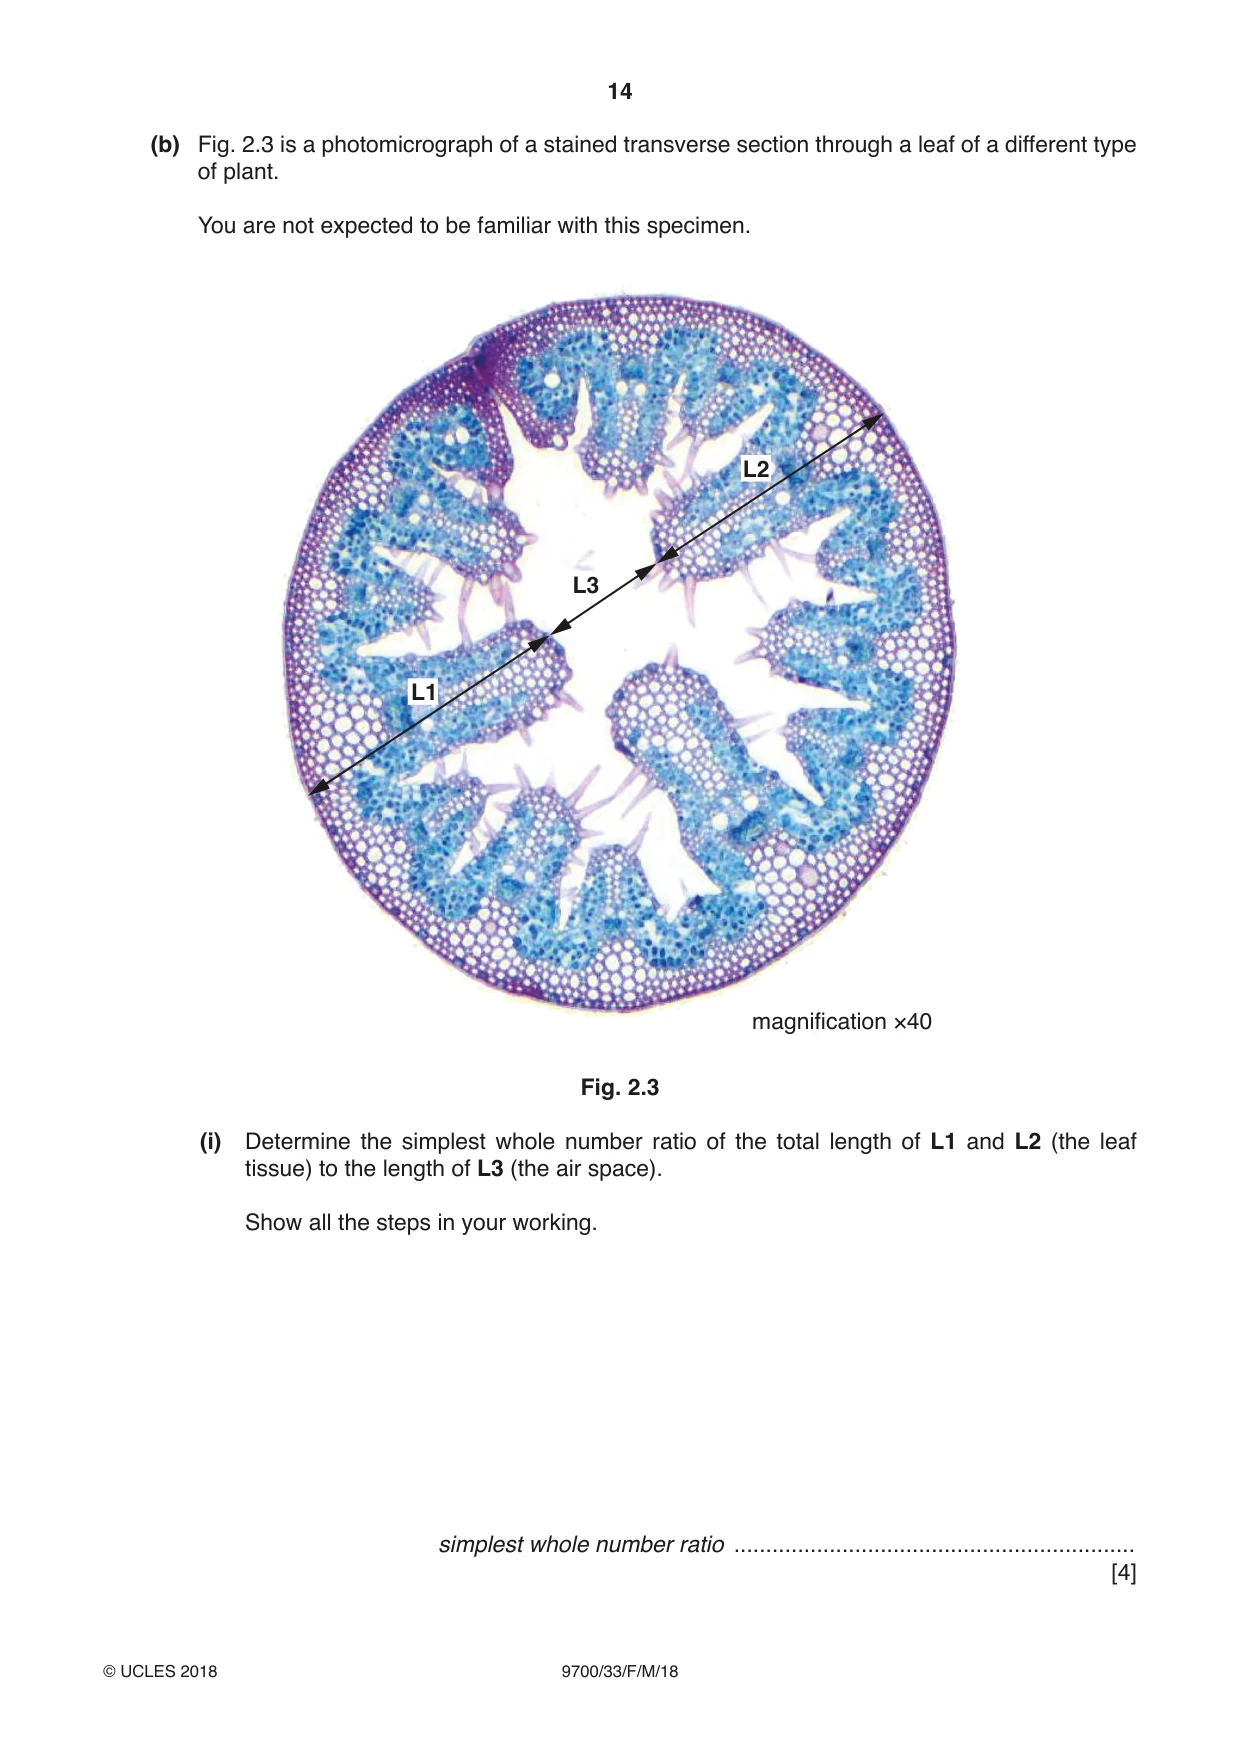
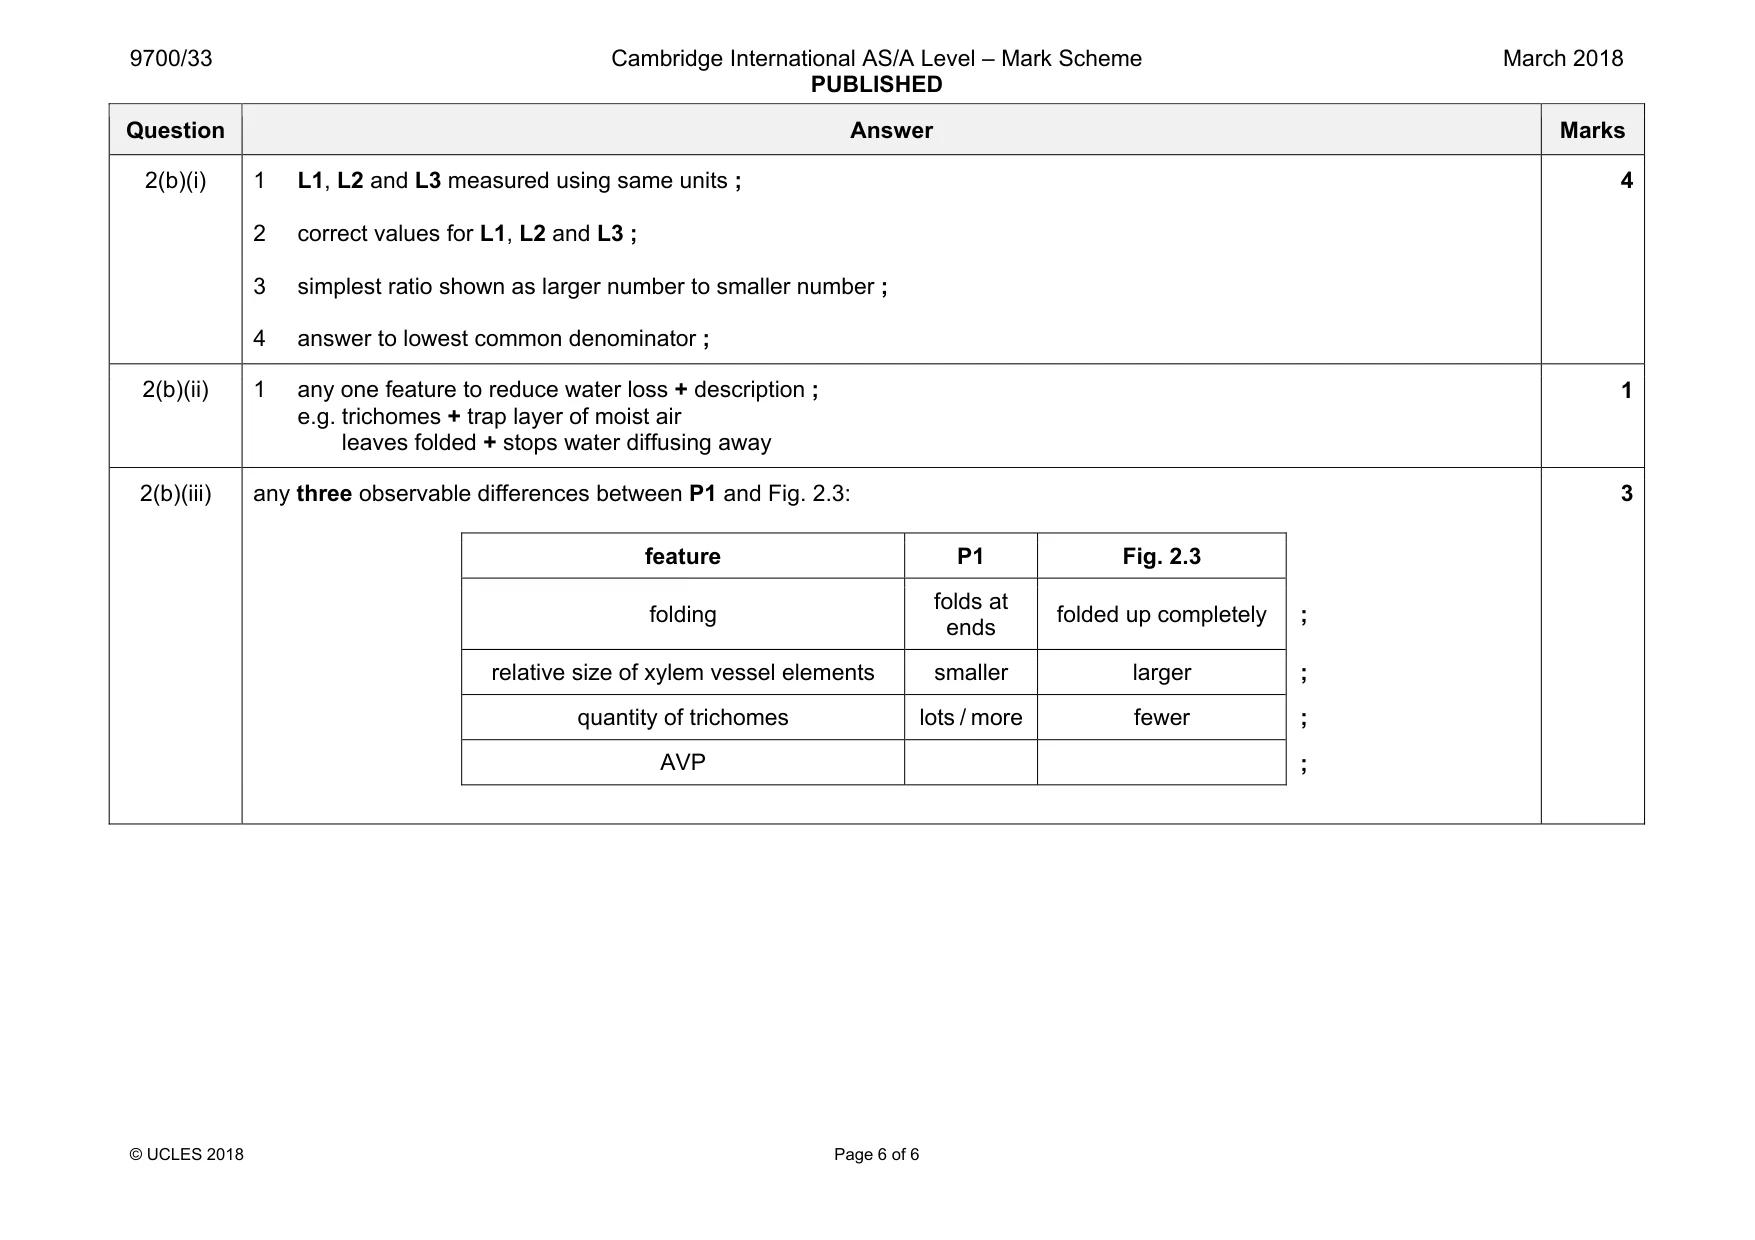
Mark scheme: 2(a)(i) 1 depth given to whole or half numbers (eyepiece graticule units) + vascular bundle in correct proportion to depth of leaf ; 1 2(a)(ii) 1 drawing at the appropriate size + no shading + no cells ; 2 only area shaded in Fig. 2.2 drawn ; 3 correct position of vascular bundle relative to whole depth of leaf ; 4 draws at least two layers of tissue in vascular bundle ; 5 label line and label to vascular bundle ; 5 2(a)(iii) 1 lines should be continuous, thin and sharp + drawn to occupy most of the space provided ; 2 draws only four cells + each cell touching at least one of the other cells ; 3 two lines drawn around each cell + three lines where cells touch ; 4 cell in epidermal layer in correct proportion to the cell beneath ; 5 label line and label to cell wall ; 5 Question Answer Marks 2(b)(i) 1 L1, L2 and L3 measured using same units ; 2 correct values for L1, L2 and L3 ; 3 simplest ratio shown as larger number to smaller number ; 4 answer to lowest common denominator ; 4 2(b)(ii) 1 any one feature to reduce water loss + description ; e.g. trichomes + trap layer of moist air leaves folded + stops water diffusing away 1 2(b)(iii) any three observable differences between P1 and Fig. 2.3: feature P1 Fig. 2.3 folding folds at ends folded up completely ; relative size of xylem vessel elements smaller larger ; quantity of trichomes lots / more fewer ; AVP ; 3
What was in this paper
The subtopics covered by these 2 questions, and how many questions each got. Open one in a new tab to see every Cambridge question on it.
What you needed in this session
Cambridge’s own grade thresholds for 2018 Feb/March, Paper 3 · Variant 3. A higher threshold means an easier paper — the bar moves with how the cohort did.