Cambridge A Level Biology 9700 — 2017 Feb/March Paper 3 · Variant 3
9700/33/F/M/17 · 2 questions · 40 marks · ≈45 min
The question paper and its mark scheme, free to read here and free to download. This is Cambridge’s own paper, exactly as it was sat.
Question paper12 pages
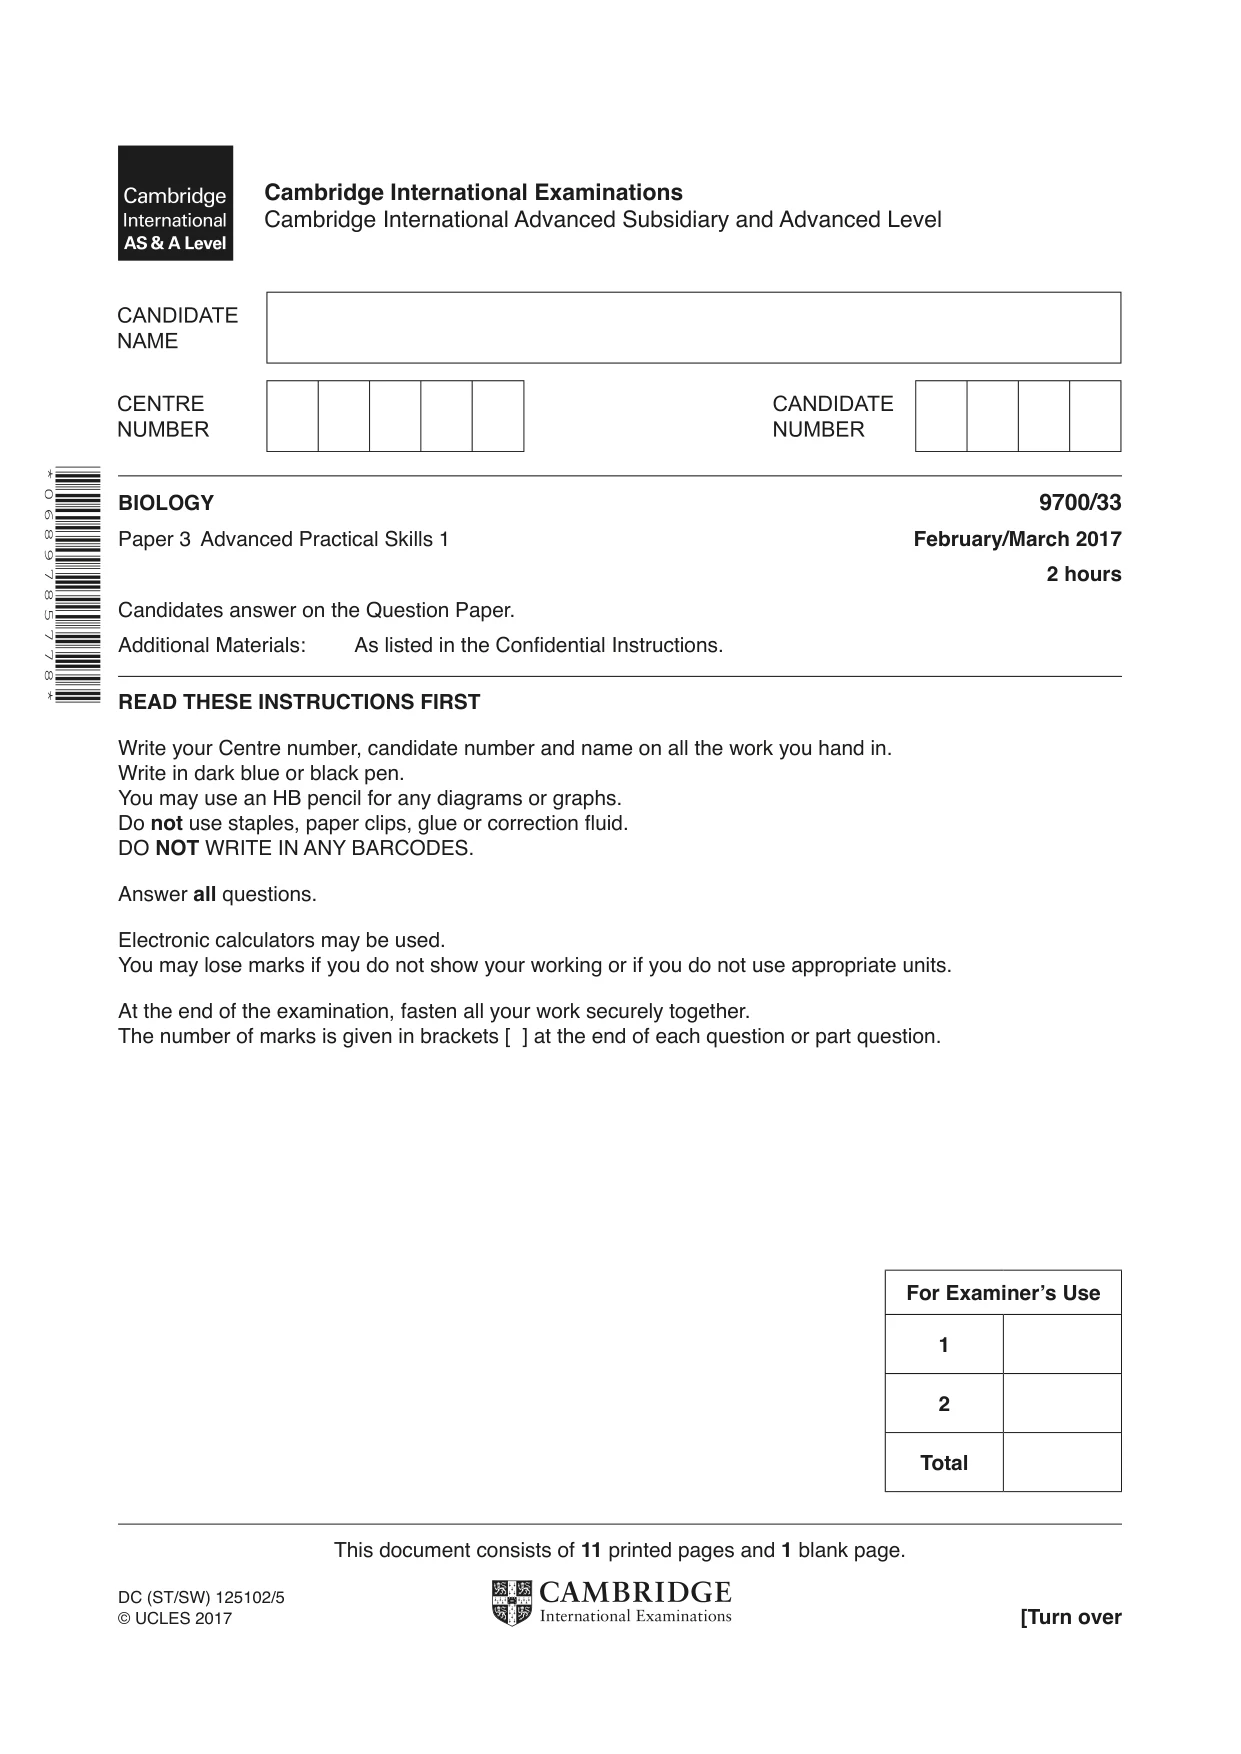



Mark scheme5 pages
Answers below. Sit the paper first if you are practising.
Questions as text
Q1 · Enzyme E hydrolyses (breaks down) starch to reducing sugar
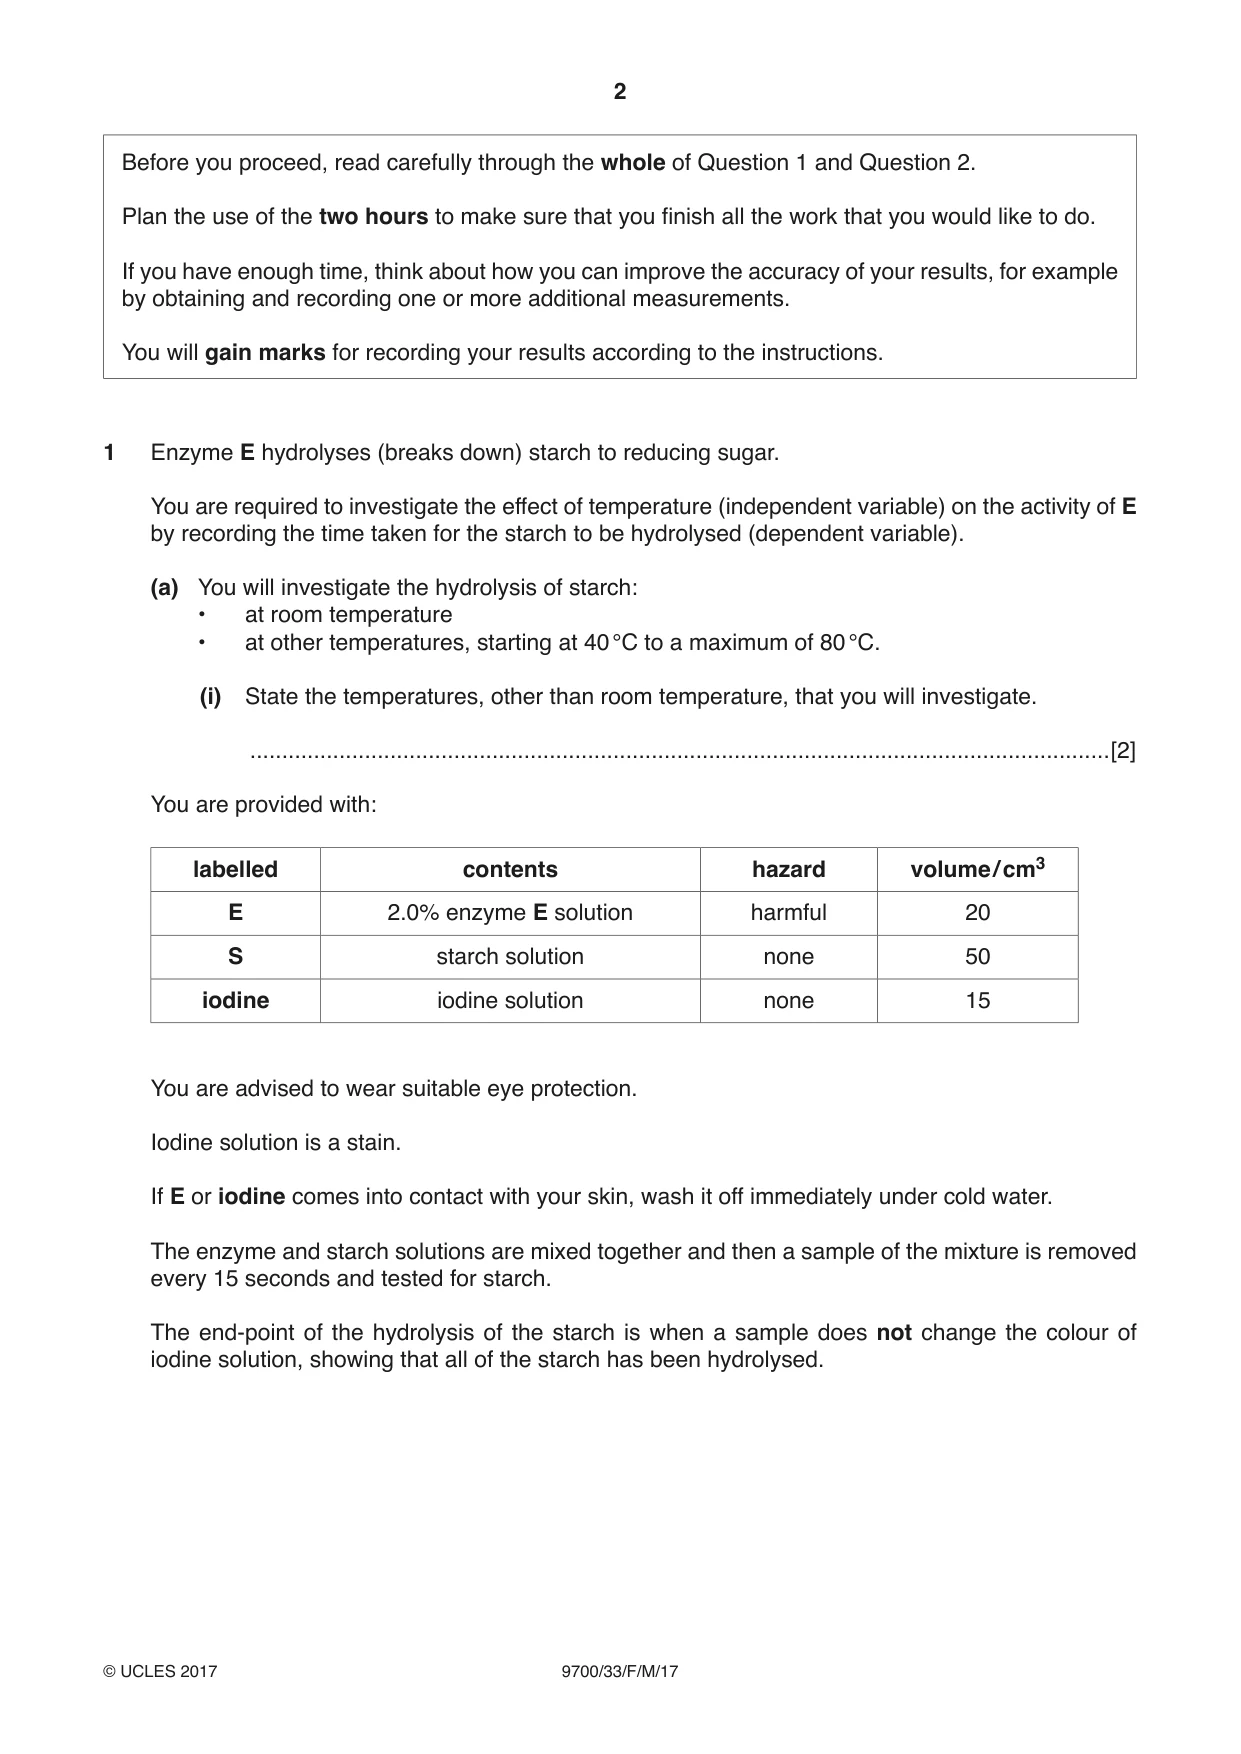
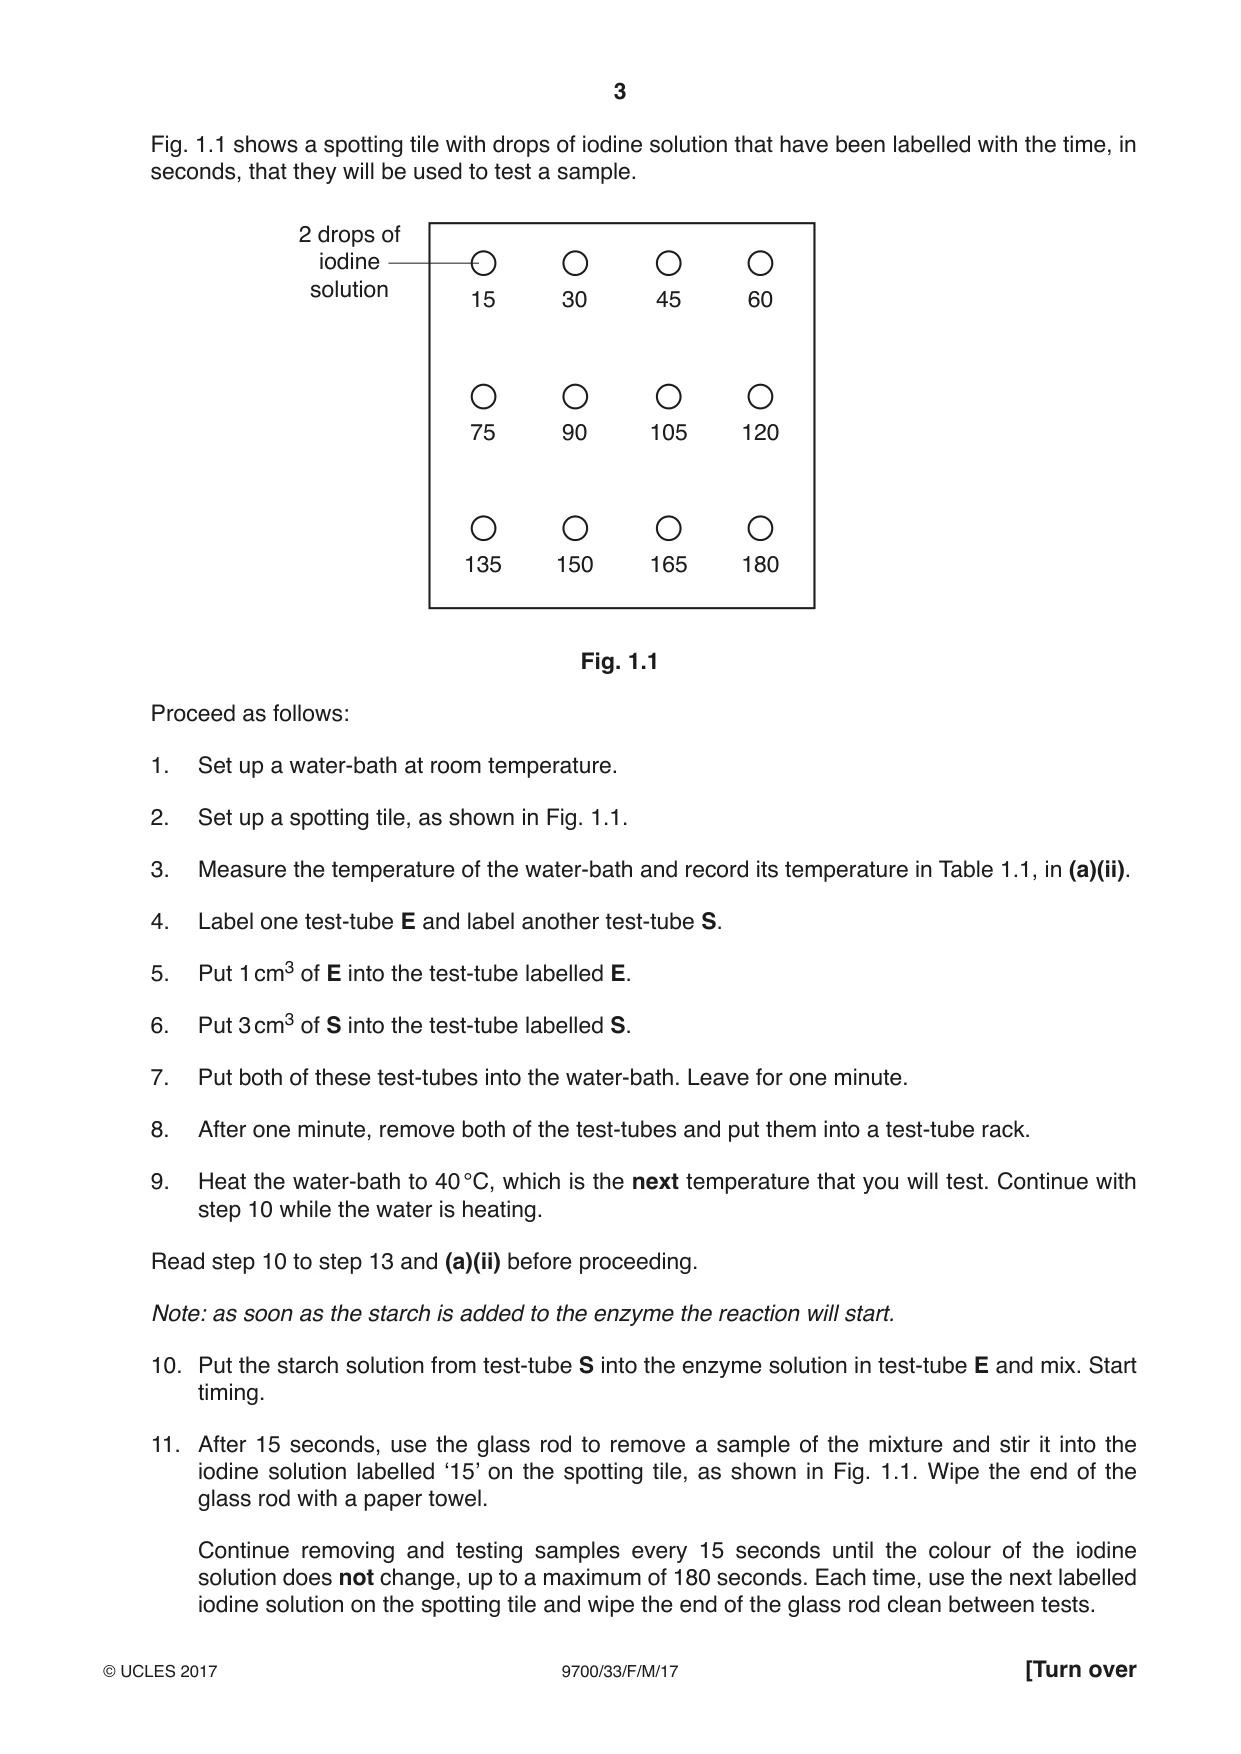
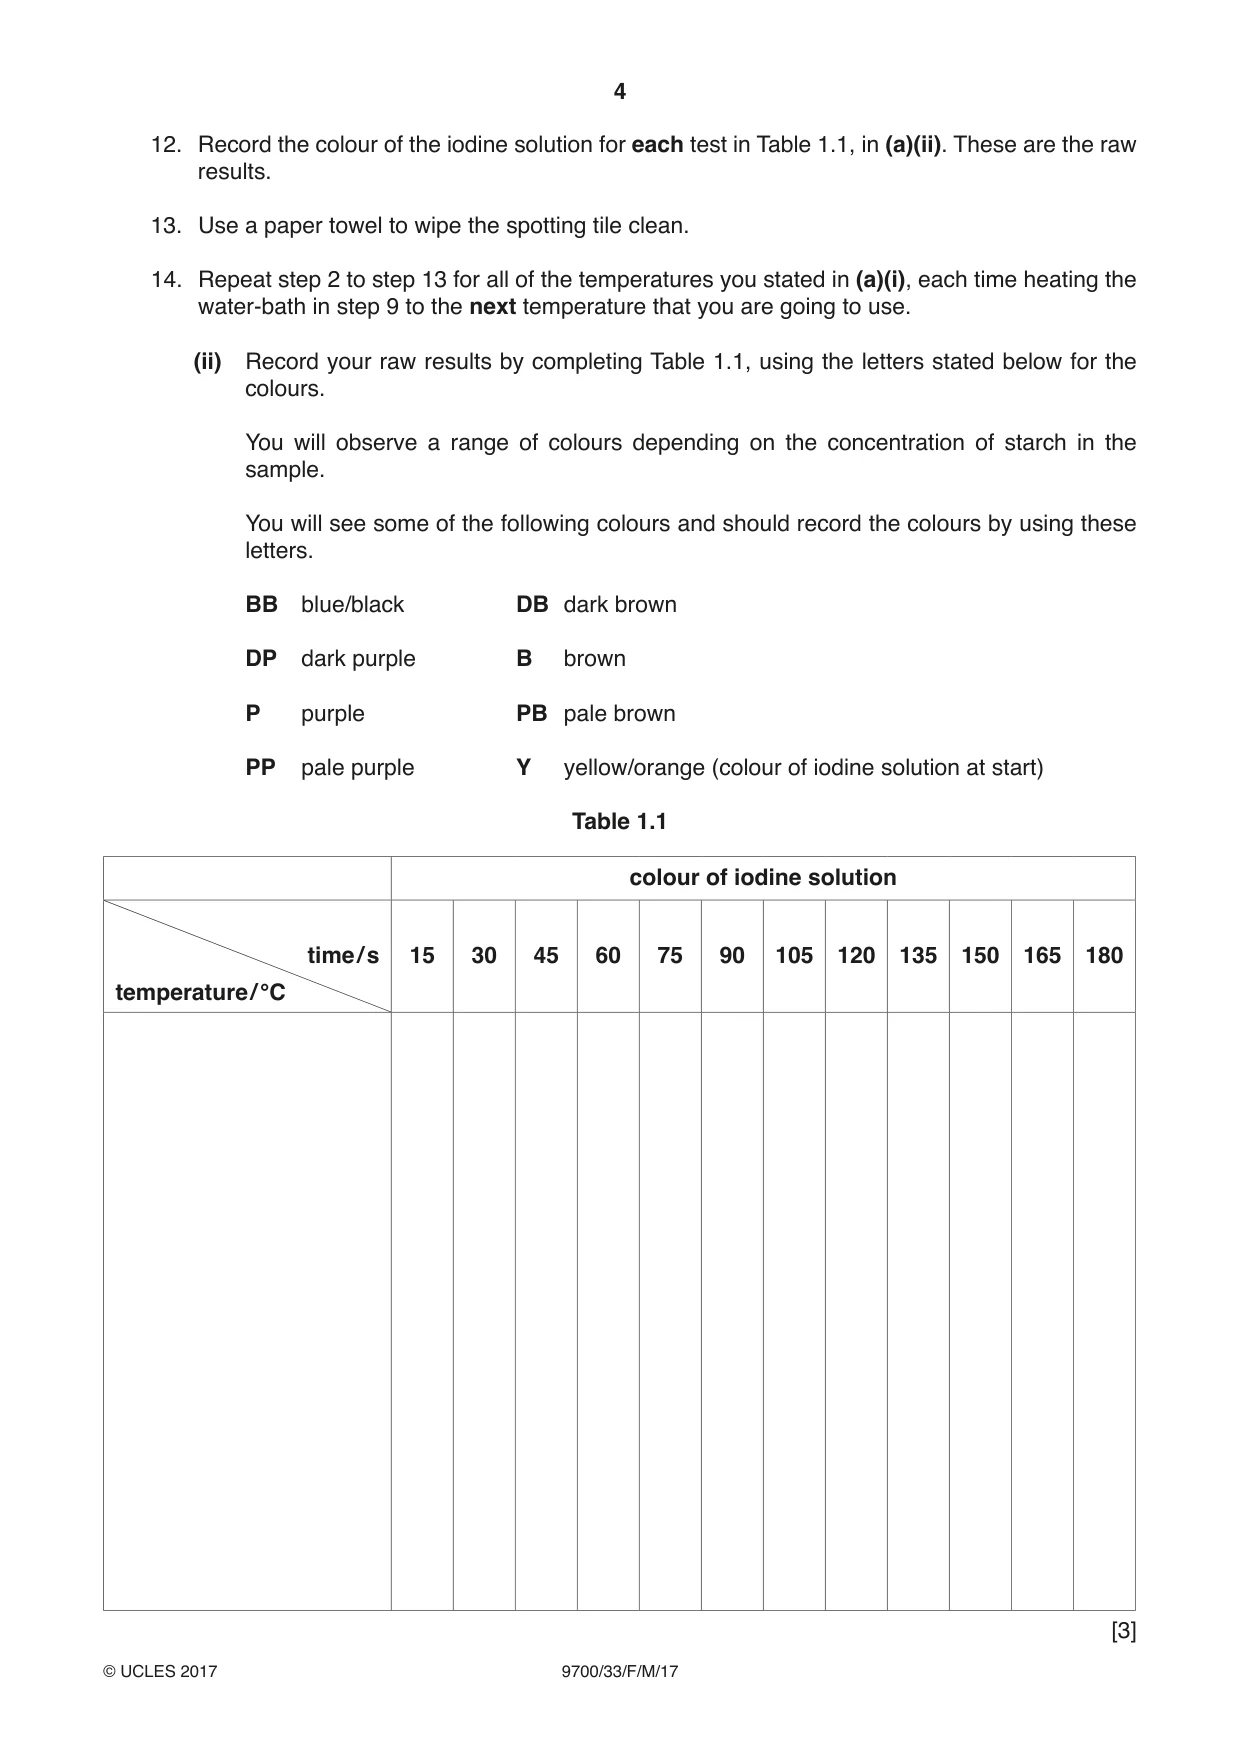
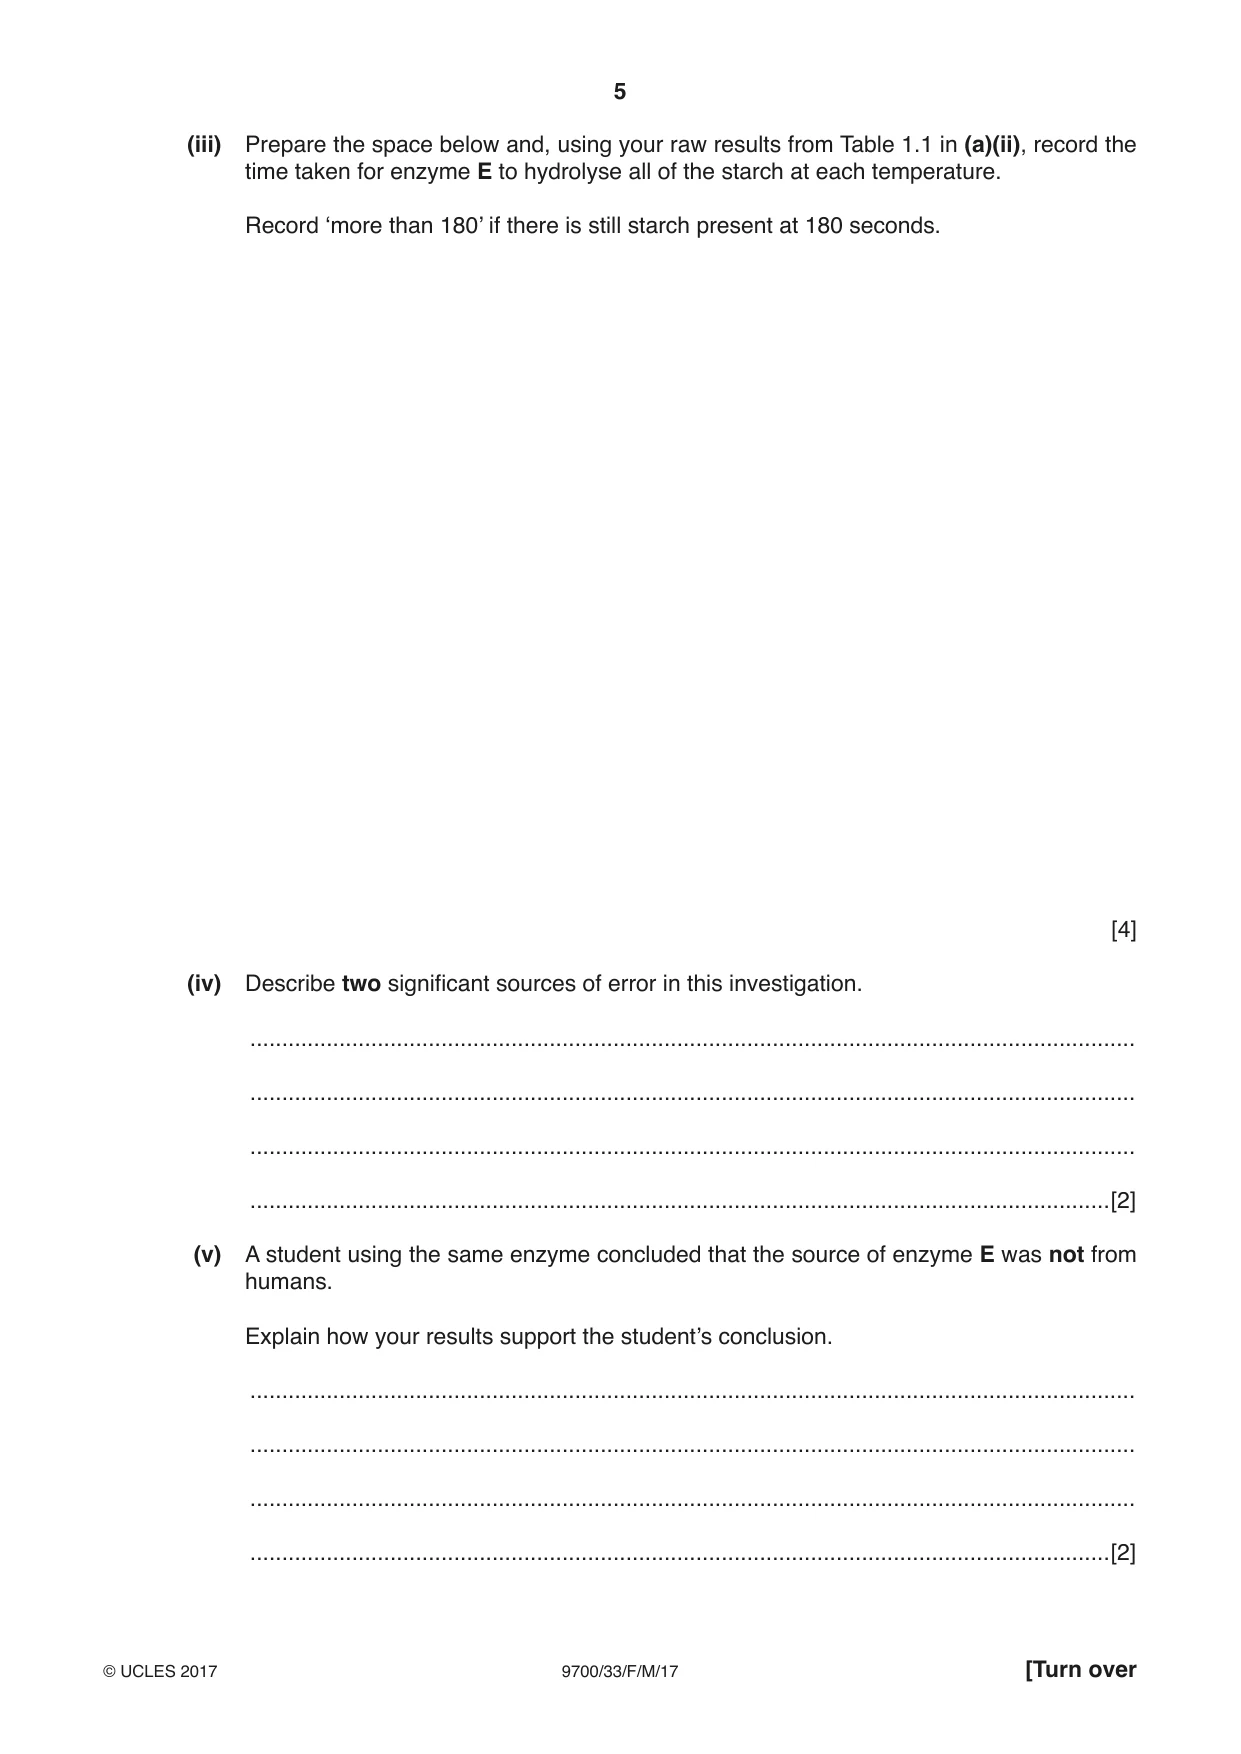
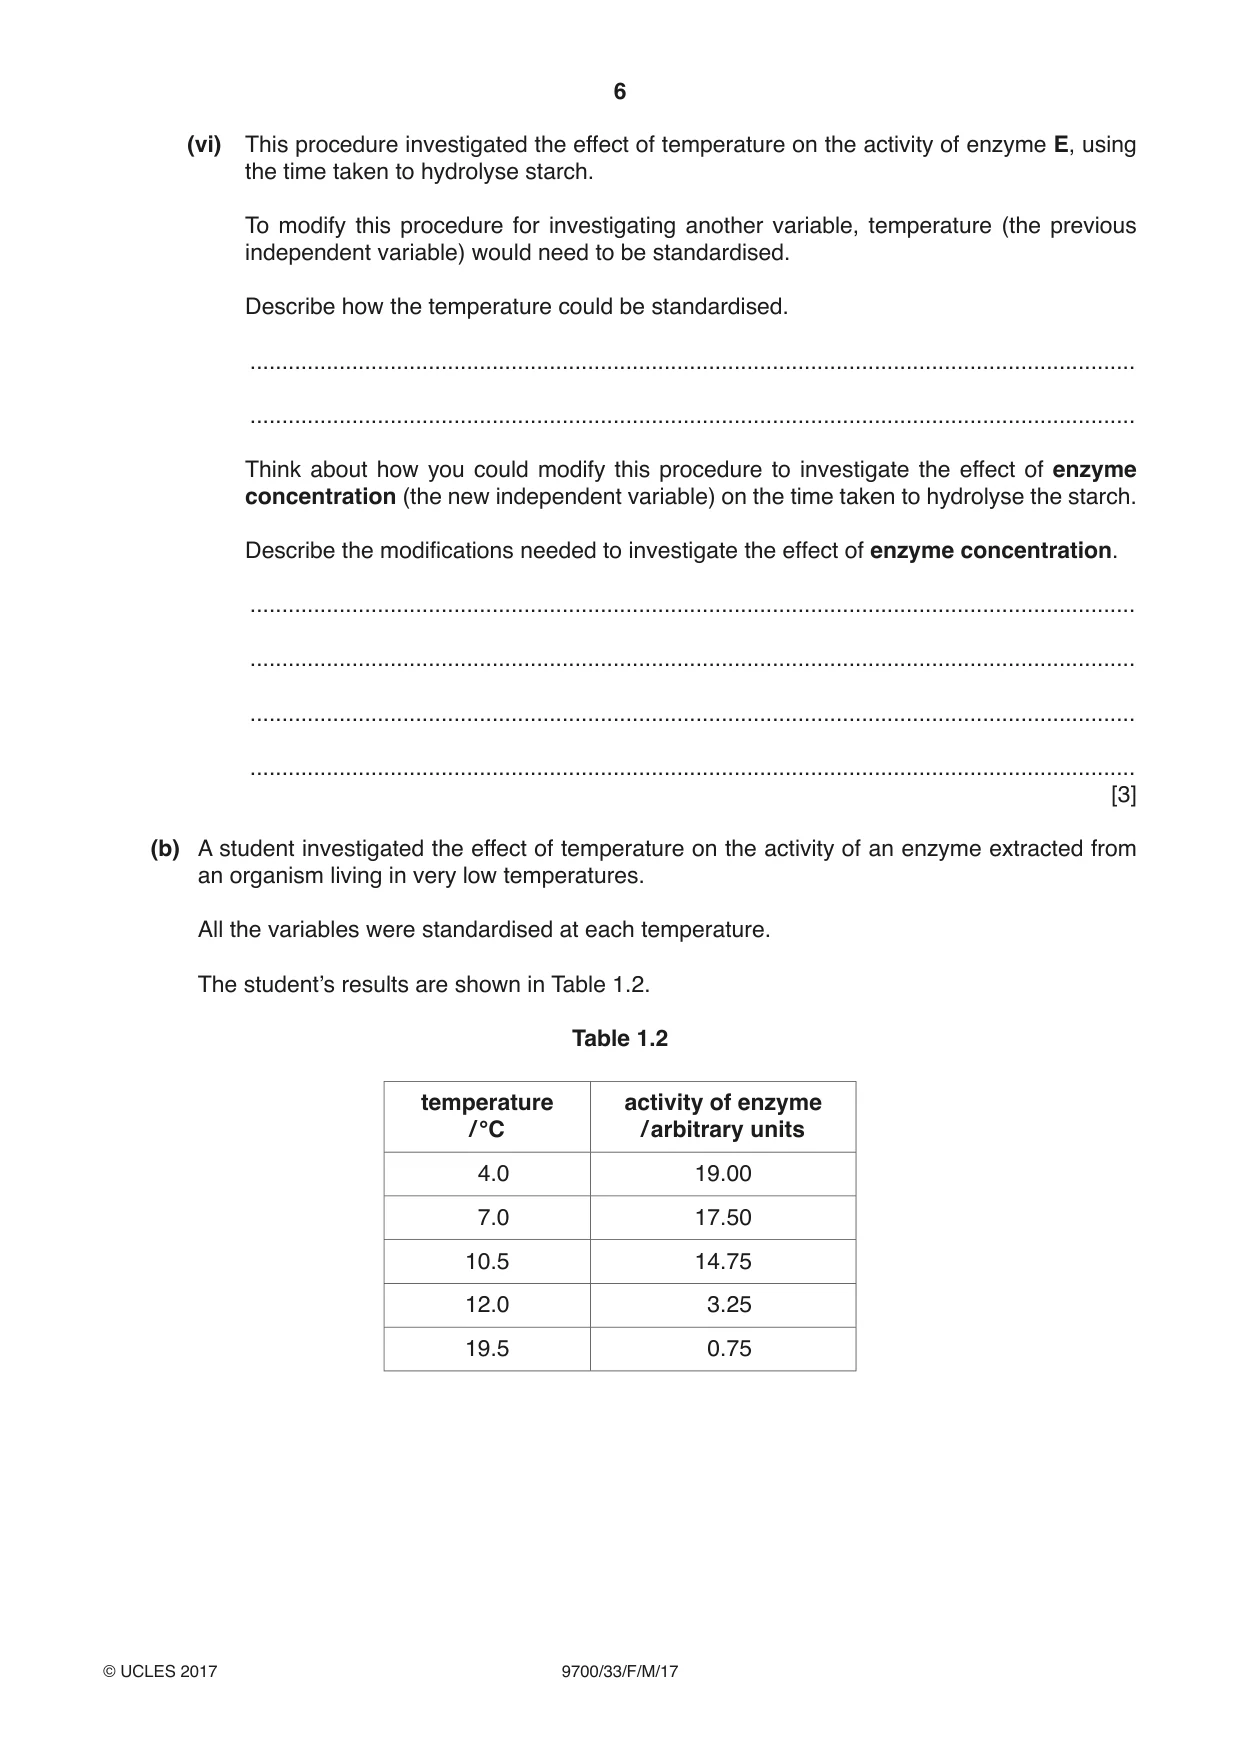
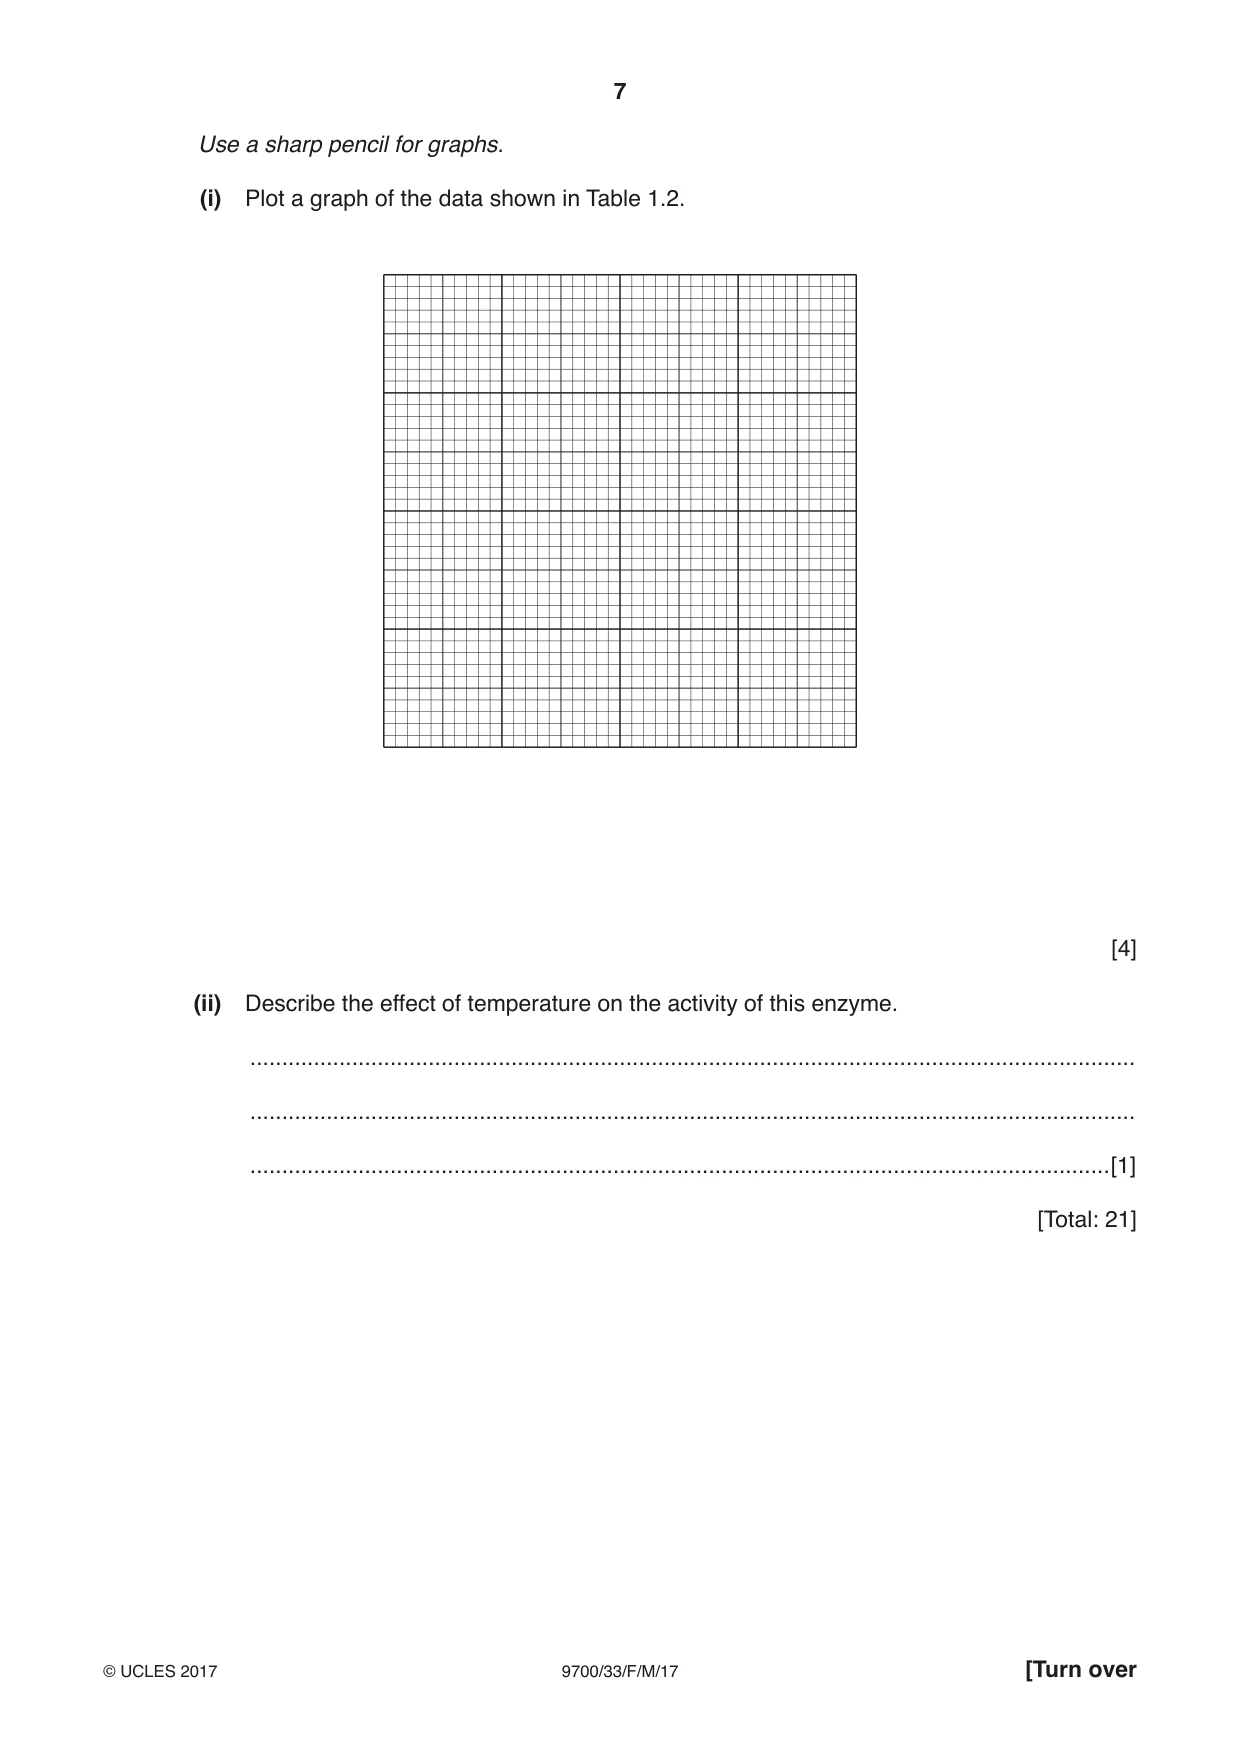
1 Enzyme E hydrolyses (breaks down) starch to reducing sugar. You are required to investigate the effect of temperature (independent variable) on the activity of E by recording the time taken for the starch to be hydrolysed (dependent variable). (a) You will investigate the hydrolysis of starch: • at room temperature • at other temperatures, starting at 40 °C to a maximum of 80 °C. (i) State the temperatures, other than room temperature, that you will investigate. .......................................................................................................................................[2] You are provided with: labelled contents hazard volume / cm3 E 2.0% enzyme E solution harmful 20 S starch solution none 50 iodine iodine solution none 15 You are advised to wear suitable eye protection. Iodine solution is a stain. If E or iodine comes into contact with your skin, wash it off immediately under cold water. The enzyme and starch solutions are mixed together and then a sample of the mixture is removed every 15 seconds and tested for starch. The end-point of the hydrolysis of the starch is when a sample does not change the colour of iodine solution, showing that all of the starch has been hydrolysed. Fig. 1.1 shows a spotting tile with drops of iodine solution that have been labelled with the time, in seconds, that they will be used to test a sample. 2 drops of iodine solution 15 30 45 60 75 90 105 120 135 150 165 180 Fig. 1.1 Proceed as follows: 1. Set up a water-bath at room temperature. 2. Set up a spotting tile, as shown in Fig. 1.1. 3. Measure the temperature of the water-bath and record its temperature in Table 1.1, in (a)(ii). 4. Label one test-tube E and label another test-tube S. 5. Put 1 cm3 of E into the test-tube labelled E. 6. Put 3 cm3 of S into the test-tube labelled S. 7. Put both of these test-tubes into the water-bath. Leave for one minute. 8. After one minute, remove both of the test-tubes and put them into a test-tube rack. 9. Heat the water-bath to 40 °C, which is the next temperature that you will test. Continue with step 10 while the water is heating. Read step 10 to step 13 and (a)(ii) before proceeding. Note: as soon as the starch is added to the enzyme the reaction will start. 10. Put the starch solution from test-tube S into the enzyme solution in test-tube E and mix. Start timing. 11. After 15 seconds, use the glass rod to remove a sample of the mixture and stir it into the iodine solution labelled ‘15’ on the spotting tile, as shown in Fig. 1.1. Wipe the end of the glass rod with a paper towel. Continue removing and testing samples every 15 seconds until the colour of the iodine solution does not change, up to a maximum of 180 seconds. Each time, use the next labelled iodine solution on the spotting tile and wipe the end of the glass rod clean between tests. 12. Record the colour of the iodine solution for each test in Table 1.1, in (a)(ii). These are the raw results. 13. Use a paper towel to wipe the spotting tile clean. 14. Repeat step 2 to step 13 for all of the temperatures you stated in (a)(i), each time heating the water-bath in step 9 to the next temperature that you are going to use. (ii) Record your raw results by completing Table 1.1, using the letters stated below for the colours. You will observe a range of colours depending on the concentration of starch in the sample. You will see some of the following colours and should record the colours by using these letters. BB blue/black DB dark brown DP dark purple B brown P purple PB pale brown PP pale purple Y yellow/orange (colour of iodine solution at start) Table 1.1 colour of iodine solution time / s 15 30 45 60 75 90 105 120 135 150 165 180 temperature / °C [3] (iii) Prepare the space below and, using your raw results from Table 1.1 in (a)(ii), record the time taken for enzyme E to hydrolyse all of the starch at each temperature. Record ‘more than 180’ if there is still starch present at 180 seconds. [4] (iv) Describe two significant sources of error in this investigation. ........................................................................................................................................... ........................................................................................................................................... ........................................................................................................................................... .......................................................................................................................................[2] (v) A student using the same enzyme concluded that the source of enzyme E was not from humans. Explain how your results support the student’s conclusion. ........................................................................................................................................... ........................................................................................................................................... ........................................................................................................................................... .......................................................................................................................................[2] (vi) This procedure investigated the effect of temperature on the activity of enzyme E, using the time taken to hydrolyse starch. To modify this procedure for investigating another variable, temperature (the previous independent variable) would need to be standardised. Describe how the temperature could be standardised. ........................................................................................................................................... ........................................................................................................................................... Think about how you could modify this procedure to investigate the effect of enzyme concentration (the new independent variable) on the time taken to hydrolyse the starch. Describe the modifications needed to investigate the effect of enzyme concentration. ........................................................................................................................................... ........................................................................................................................................... ........................................................................................................................................... ........................................................................................................................................... [3] (b) A student investigated the effect of temperature on the activity of an enzyme extracted from an organism living in very low temperatures. All the variables were standardised at each temperature. The student’s results are shown in Table 1.2. Table 1.2 temperature activity of enzyme / °C / arbitrary units 4.0 19.00 7.0 17.50 10.5 14.75 12.0 3.25 19.5 0.75 Use a sharp pencil for graphs. (i) Plot a graph of the data shown in Table 1.2. [4] (ii) Describe the effect of temperature on the activity of this enzyme. ........................................................................................................................................... ........................................................................................................................................... .......................................................................................................................................[1] [Total: 21]
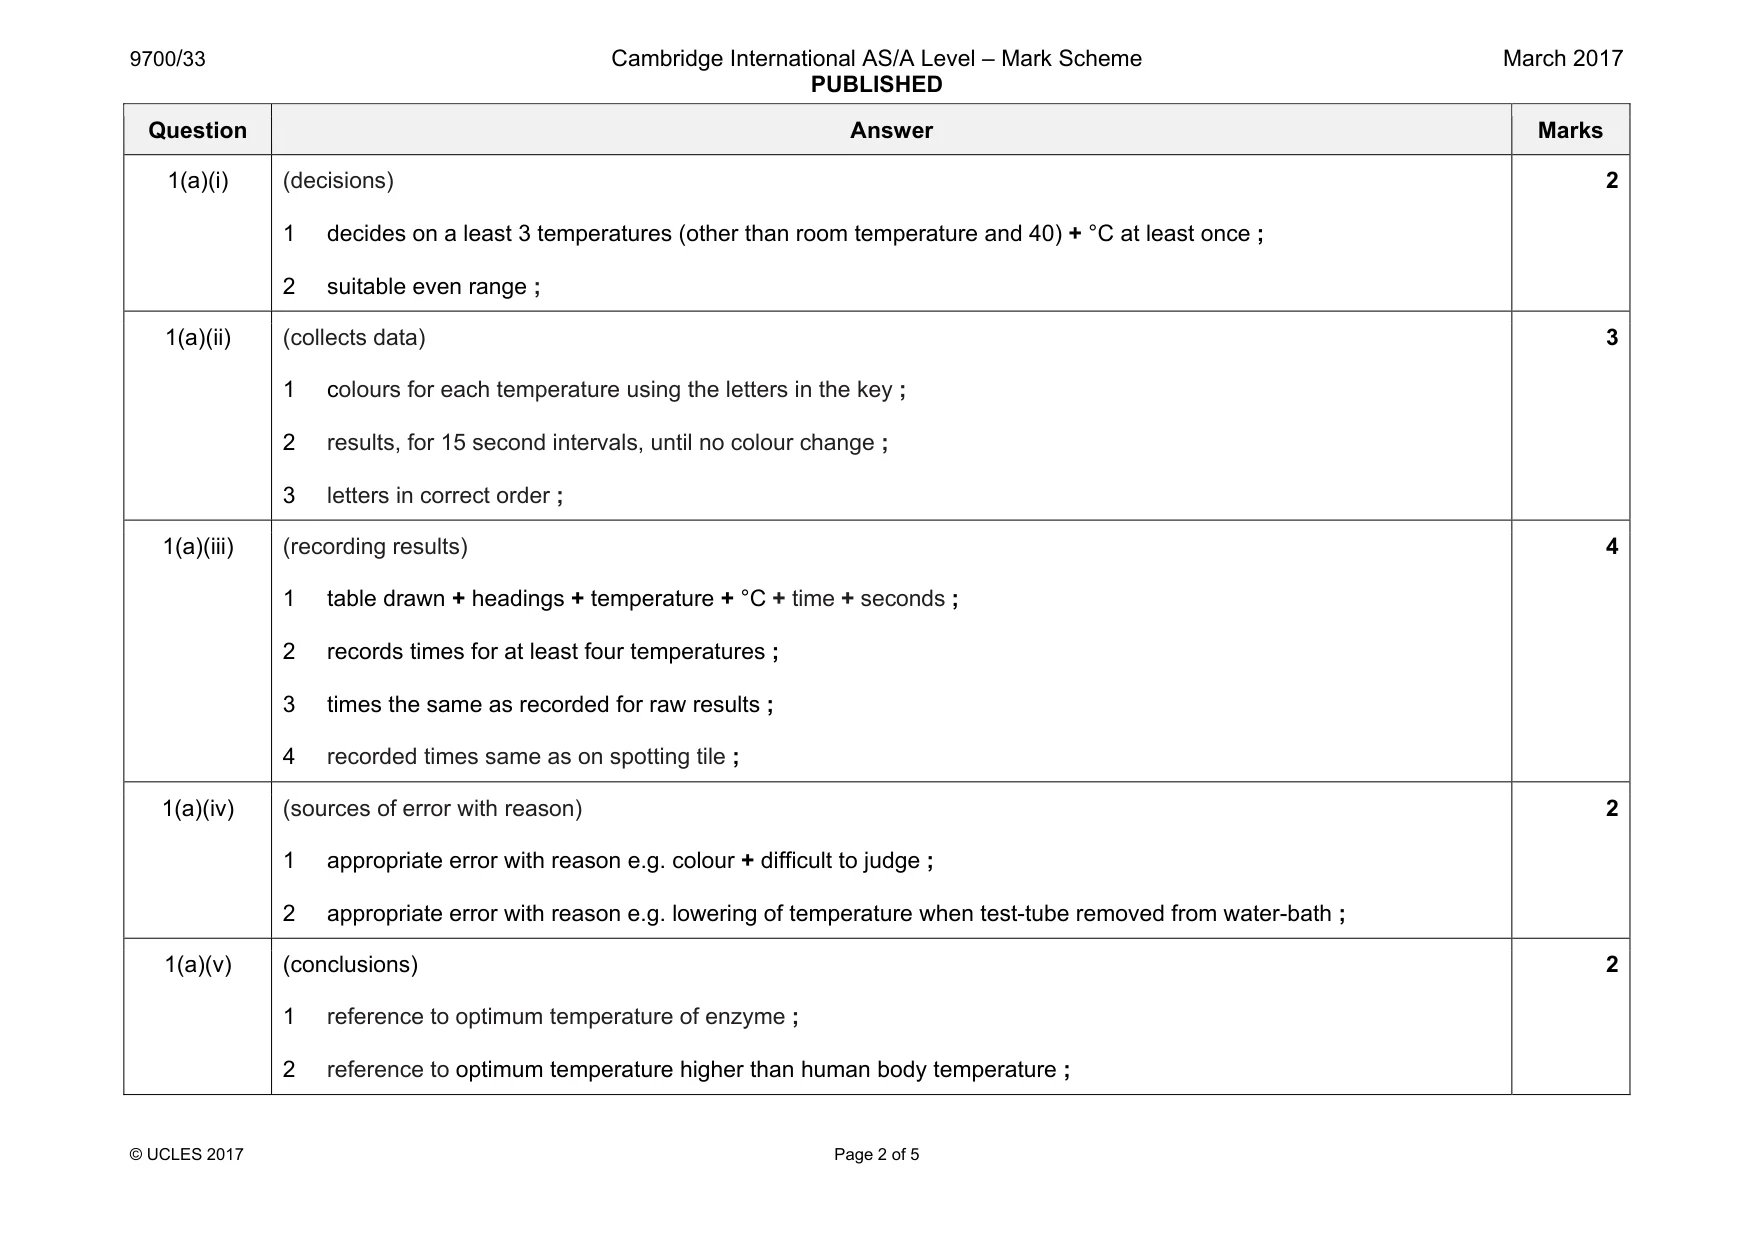
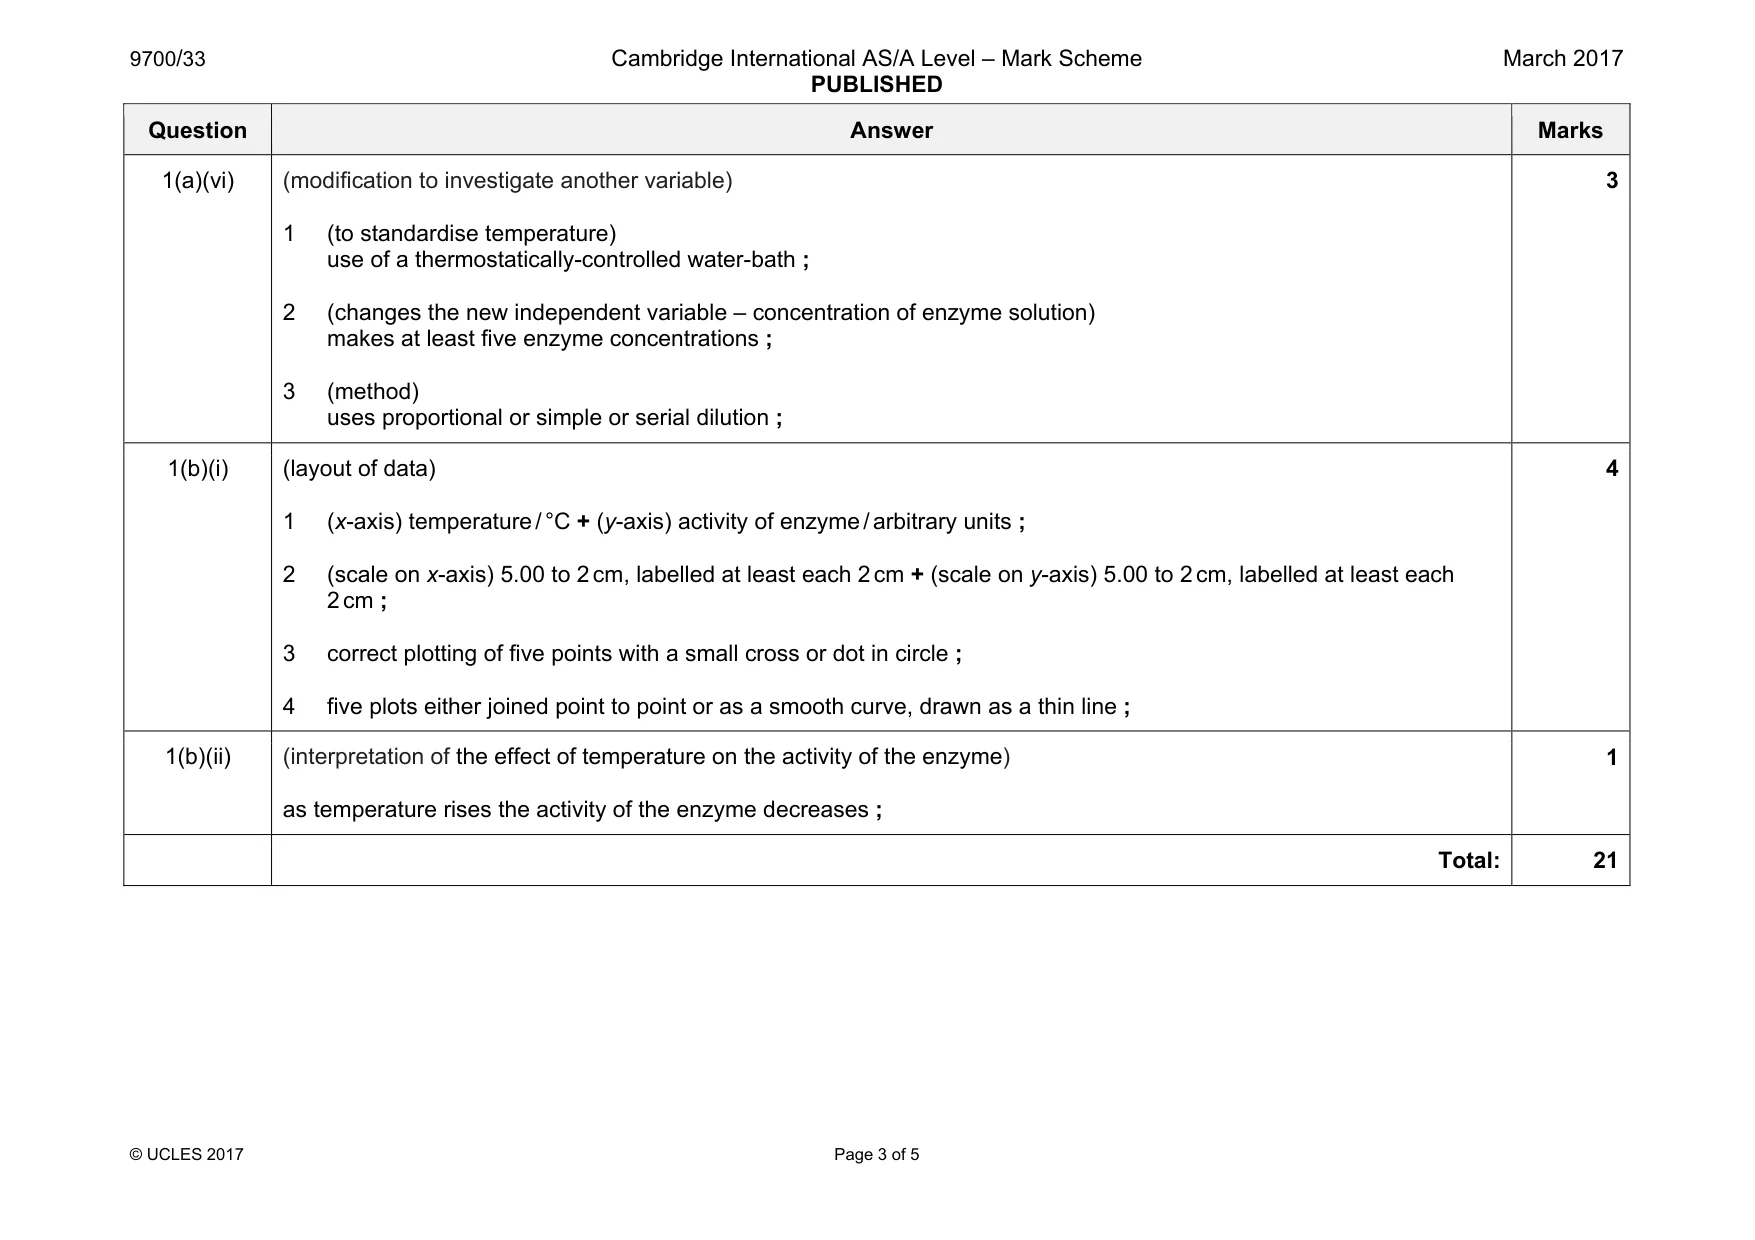
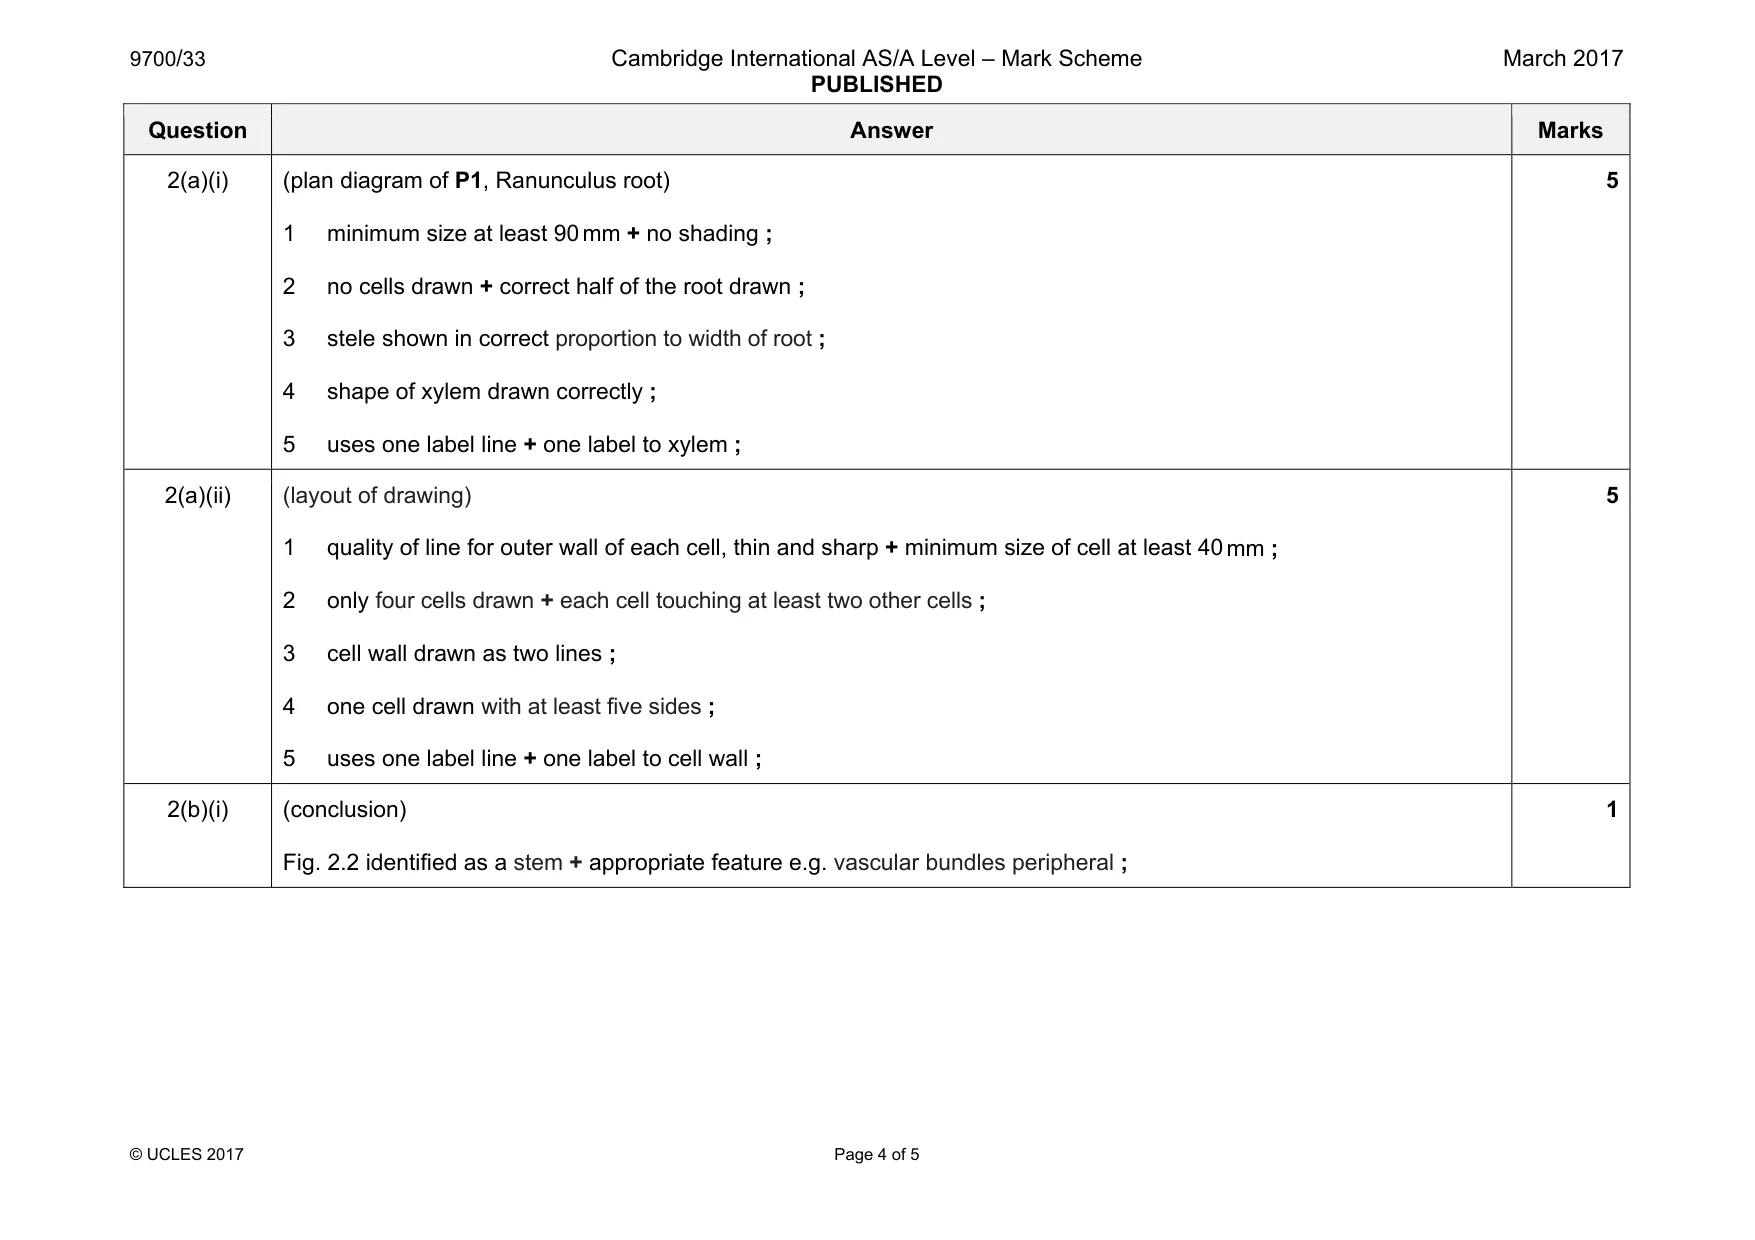
Mark scheme: 1(a)(i) (decisions) 1 decides on a least 3 temperatures (other than room temperature and 40) + °C at least once ; 2 suitable even range ; 2 1(a)(ii) (collects data) 1 colours for each temperature using the letters in the key ; 2 results, for 15 second intervals, until no colour change ; 3 letters in correct order ; 3 1(a)(iii) (recording results) 1 table drawn + headings + temperature + °C + time + seconds ; 2 records times for at least four temperatures ; 3 times the same as recorded for raw results ; 4 recorded times same as on spotting tile ; 4 1(a)(iv) (sources of error with reason) 1 appropriate error with reason e.g. colour + difficult to judge ; 2 appropriate error with reason e.g. lowering of temperature when test-tube removed from water-bath ; 2 1(a)(v) (conclusions) 1 reference to optimum temperature of enzyme ; 2 reference to optimum temperature higher than human body temperature ; 2 Question Answer Marks 1(a)(vi) (modification to investigate another variable) 1 (to standardise temperature) use of a thermostatically-controlled water-bath ; 2 (changes the new independent variable – concentration of enzyme solution) makes at least five enzyme concentrations ; 3 (method) uses proportional or simple or serial dilution ; 3 1(b)(i) (layout of data) 1 (x-axis) temperature / °C + (y-axis) activity of enzyme / arbitrary units ; 2 (scale on x-axis) 5.00 to 2 cm, labelled at least each 2 cm + (scale on y-axis) 5.00 to 2 cm, labelled at least each 2 cm ; 3 correct plotting of five points with a small cross or dot in circle ; 4 five plots either joined point to point or as a smooth curve, drawn as a thin line ; 4 1(b)(ii) (interpretation of the effect of temperature on the activity of the enzyme) as temperature rises the activity of the enzyme decreases ; 1 Total: 21
Q2 · P1 is a slide of a stained transverse section through a plant root
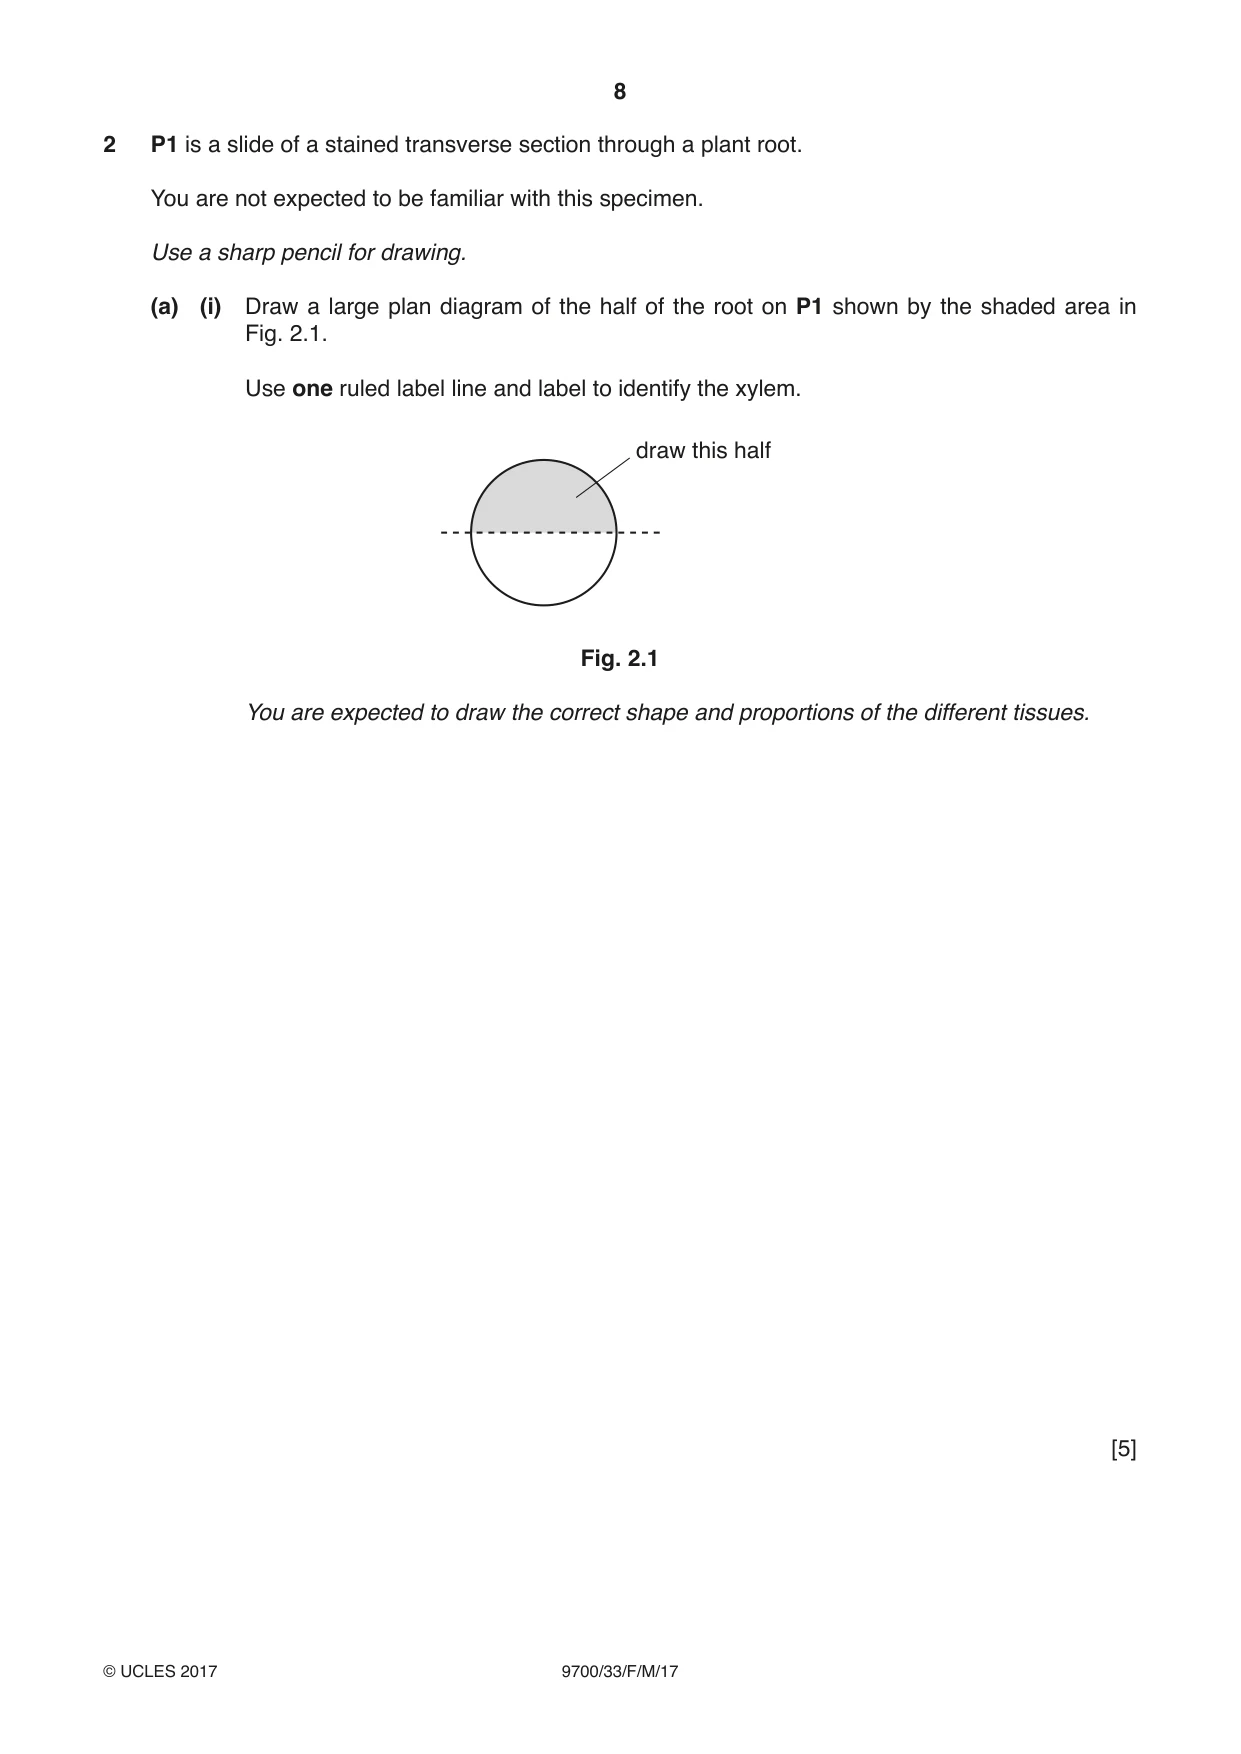
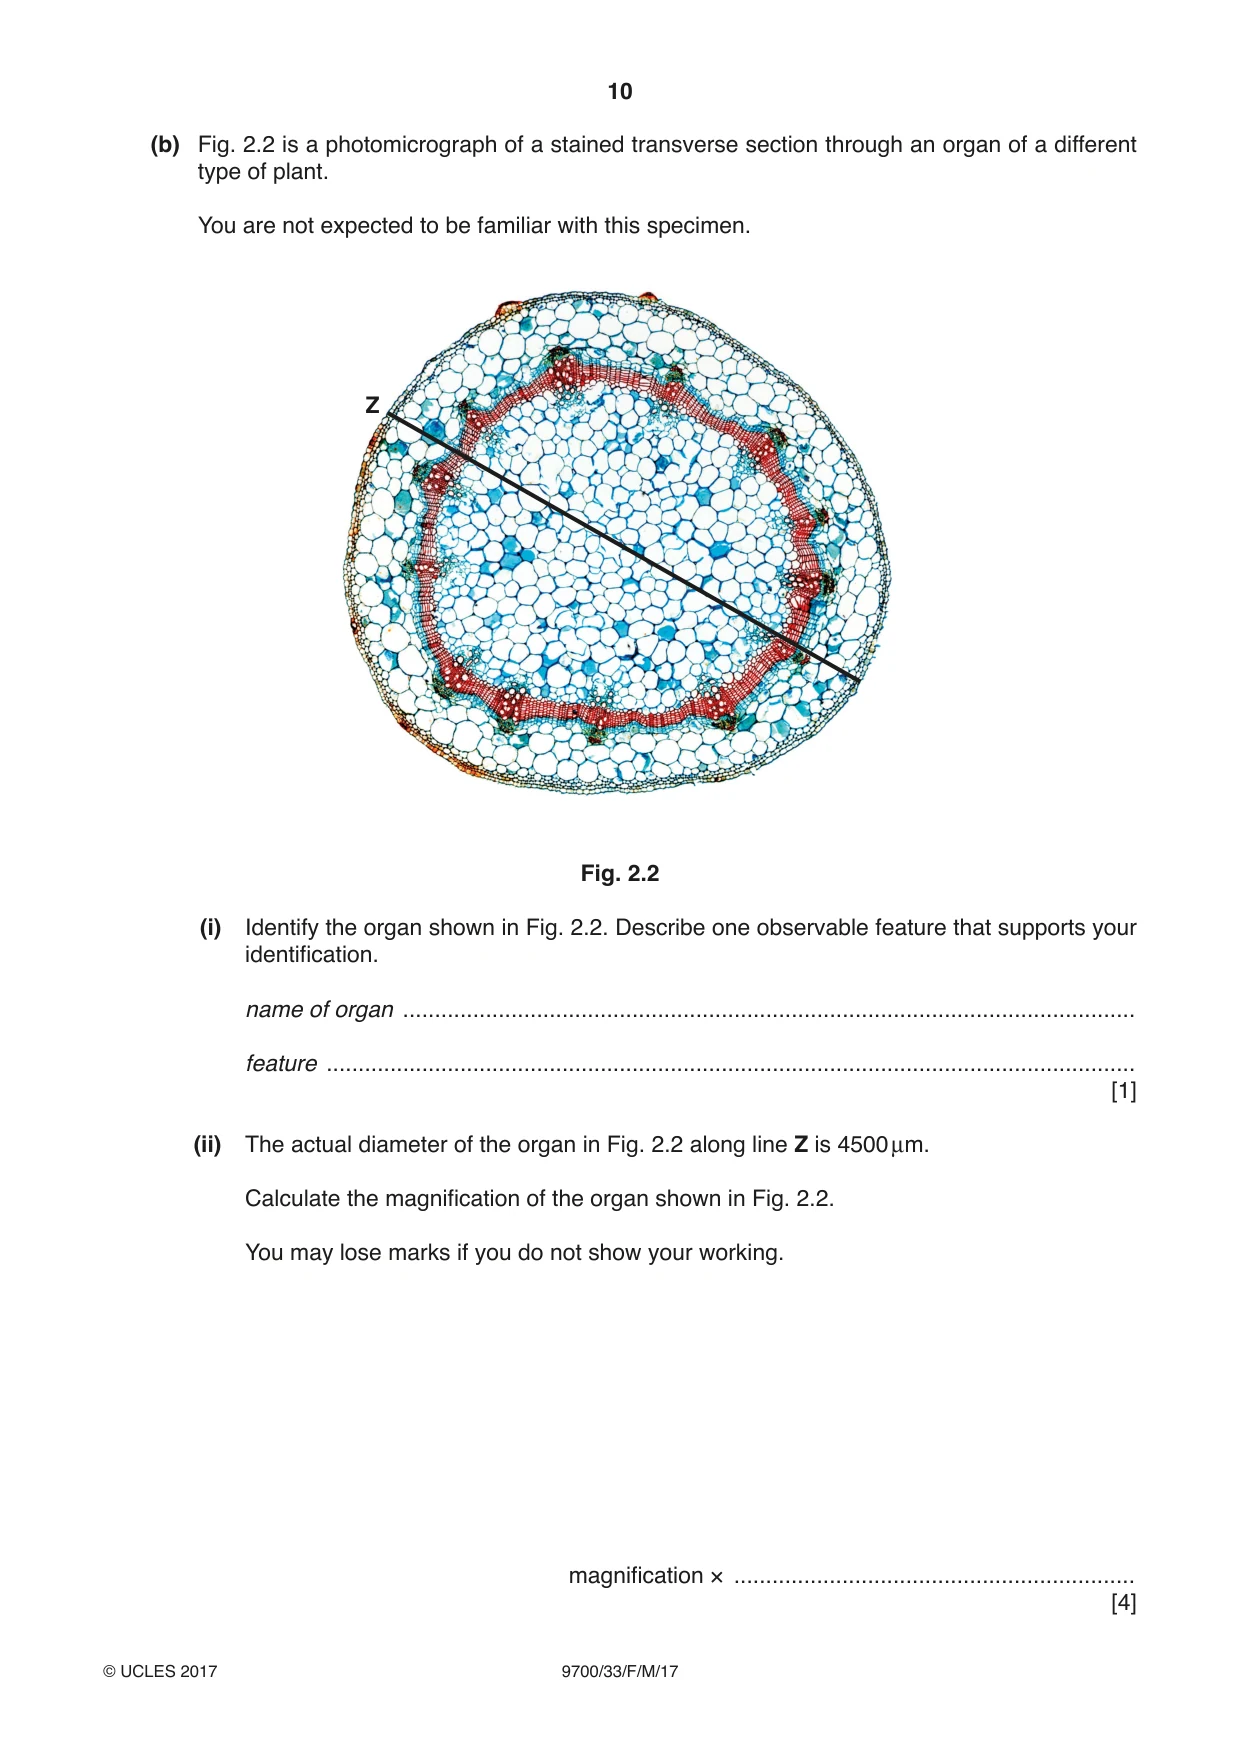
2 P1 is a slide of a stained transverse section through a plant root. You are not expected to be familiar with this specimen. Use a sharp pencil for drawing. (a) (i) Draw a large plan diagram of the half of the root on P1 shown by the shaded area in Fig. 2.1. Use one ruled label line and label to identify the xylem. draw this half Fig. 2.1 You are expected to draw the correct shape and proportions of the different tissues. [5] (ii) Observe the central tissue in the root on P1. The cells in the central tissue are not identical. Select one group of four adjacent (touching) cells that show some of the differences between these cells. Each cell must touch at least two of the other cells. Make a large drawing of this group of four cells. Use one ruled label line and label to identify the cell wall of one cell. [5] (b) Fig. 2.2 is a photomicrograph of a stained transverse section through an organ of a different type of plant. You are not expected to be familiar with this specimen. Z Fig. 2.2 (i) Identify the organ shown in Fig. 2.2. Describe one observable feature that supports your identification. name of organ ................................................................................................................... feature ............................................................................................................................... [1] (ii) The actual diameter of the organ in Fig. 2.2 along line Z is 4500 µm. Calculate the magnification of the organ shown in Fig. 2.2. You may lose marks if you do not show your working. magnification × ............................................................... [4]
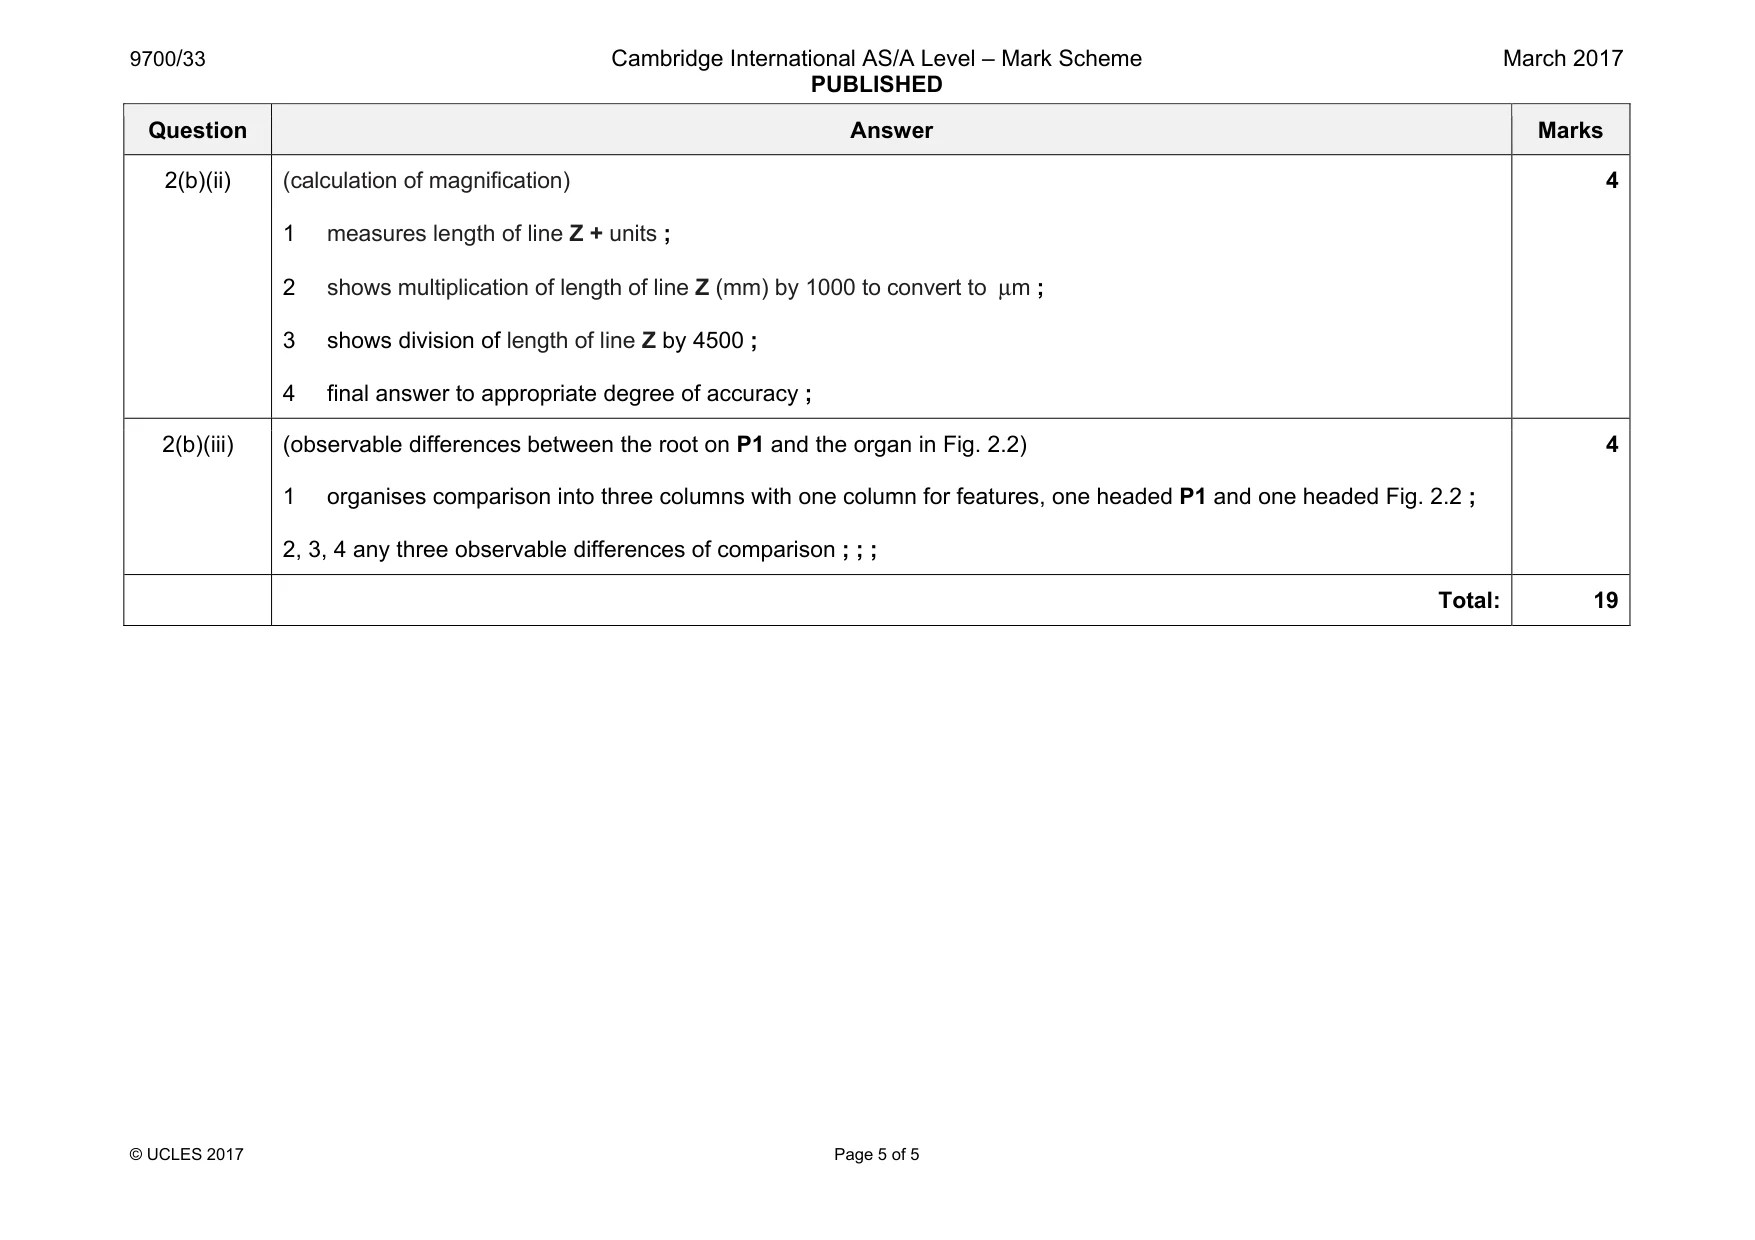
Mark scheme: 2(a)(i) (plan diagram of P1, Ranunculus root) 1 minimum size at least 90 mm + no shading ; 2 no cells drawn + correct half of the root drawn ; 3 stele shown in correct proportion to width of root ; 4 shape of xylem drawn correctly ; 5 uses one label line + one label to xylem ; 5 2(a)(ii) (layout of drawing) 1 quality of line for outer wall of each cell, thin and sharp + minimum size of cell at least 40 mm ; 2 only four cells drawn + each cell touching at least two other cells ; 3 cell wall drawn as two lines ; 4 one cell drawn with at least five sides ; 5 uses one label line + one label to cell wall ; 5 2(b)(i) (conclusion) Fig. 2.2 identified as a stem + appropriate feature e.g. vascular bundles peripheral ; 1 Question Answer Marks 2(b)(ii) (calculation of magnification) 1 measures length of line Z + units ; 2 shows multiplication of length of line Z (mm) by 1000 to convert to µm ; 3 shows division of length of line Z by 4500 ; 4 final answer to appropriate degree of accuracy ; 4 2(b)(iii) (observable differences between the root on P1 and the organ in Fig. 2.2) 1 organises comparison into three columns with one column for features, one headed P1 and one headed Fig. 2.2 ; 2, 3, 4 any three observable differences of comparison ; ; ; 4 Total: 19
What was in this paper
The subtopics covered by these 2 questions, and how many questions each got. Open one in a new tab to see every Cambridge question on it.
What you needed in this session
Cambridge’s own grade thresholds for 2017 Feb/March, Paper 3 · Variant 3. A higher threshold means an easier paper — the bar moves with how the cohort did.