Cambridge A Level Biology 9700 — 2016 Oct/Nov Paper 3 · Variant 5
9700/35/O/N/16 · 40 marks · ≈45 min
The question paper and its mark scheme, free to read here and free to download. This is Cambridge’s own paper, exactly as it was sat.
Question paper16 pages



Mark scheme6 pages
Answers below. Sit the paper first if you are practising.
Paper as text
Question paper, page 1
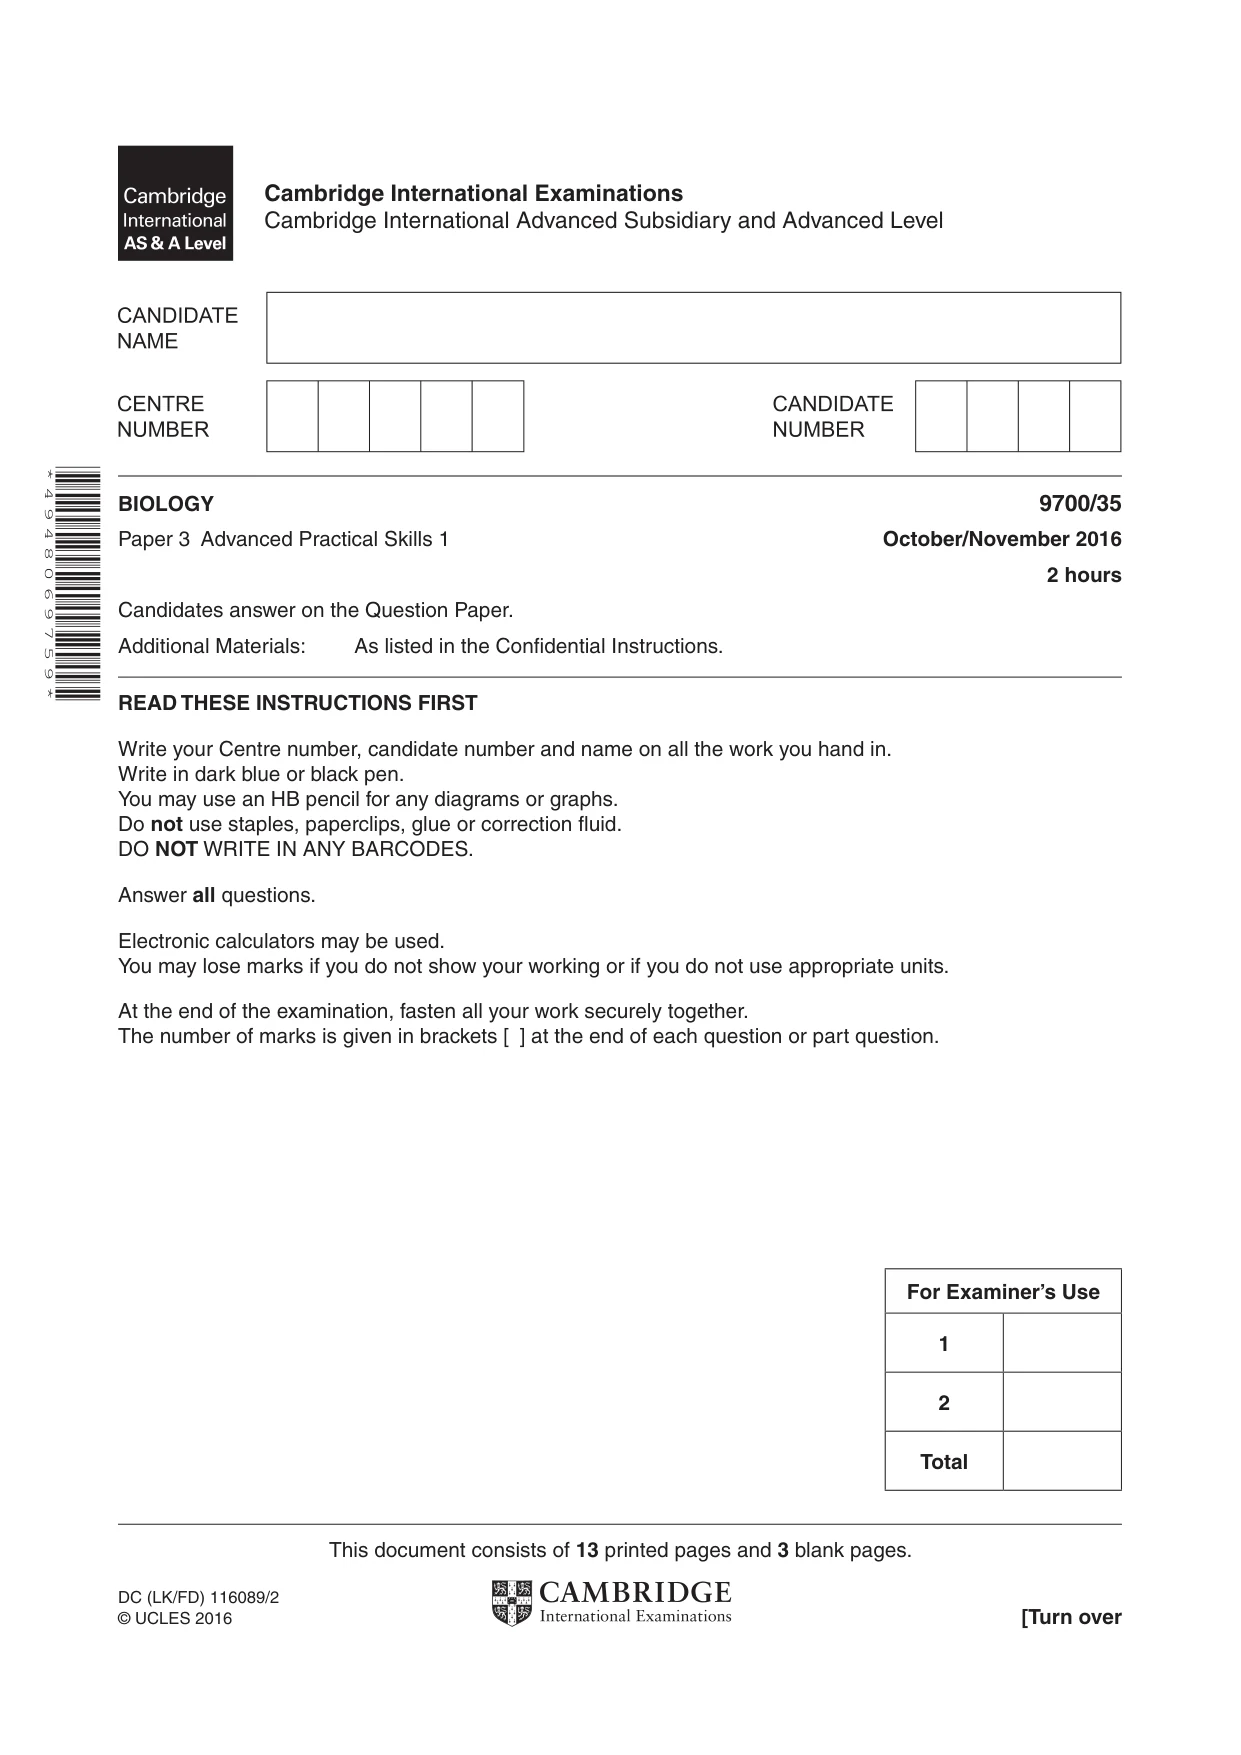
This document consists of 13 printed pages and 3 blank pages. DC (LK/FD) 116089/2 © UCLES 2016 [Turn over Cambridge International Examinations Cambridge International Advanced Subsidiary and Advanced Level * 4 9 4 8 0 6 9 7 5 9 * BIOLOGY 9700/35 Paper 3 Advanced Practical Skills 1 October/November 2016 2 hours Candidates answer on the Question Paper. Additional Materials: As listed in the Confidential Instructions. READ THESE INSTRUCTIONS FIRST Write your Centre number, candidate number and name on all the work you hand in. Write in dark blue or black pen. You may use an HB pencil for any diagrams or graphs. Do not use staples, paperclips, glue or correction fluid. DO NOT WRITE IN ANY BARCODES. Answer all questions. Electronic calculators may be used. You may lose marks if you do not show your working or if you do not use appropriate units. At the end of the examination, fasten all your work securely together. The number of marks is given in brackets [ ] at the end of each question or part question. For Examiner’s Use 1 2 Total
Question paper, page 2
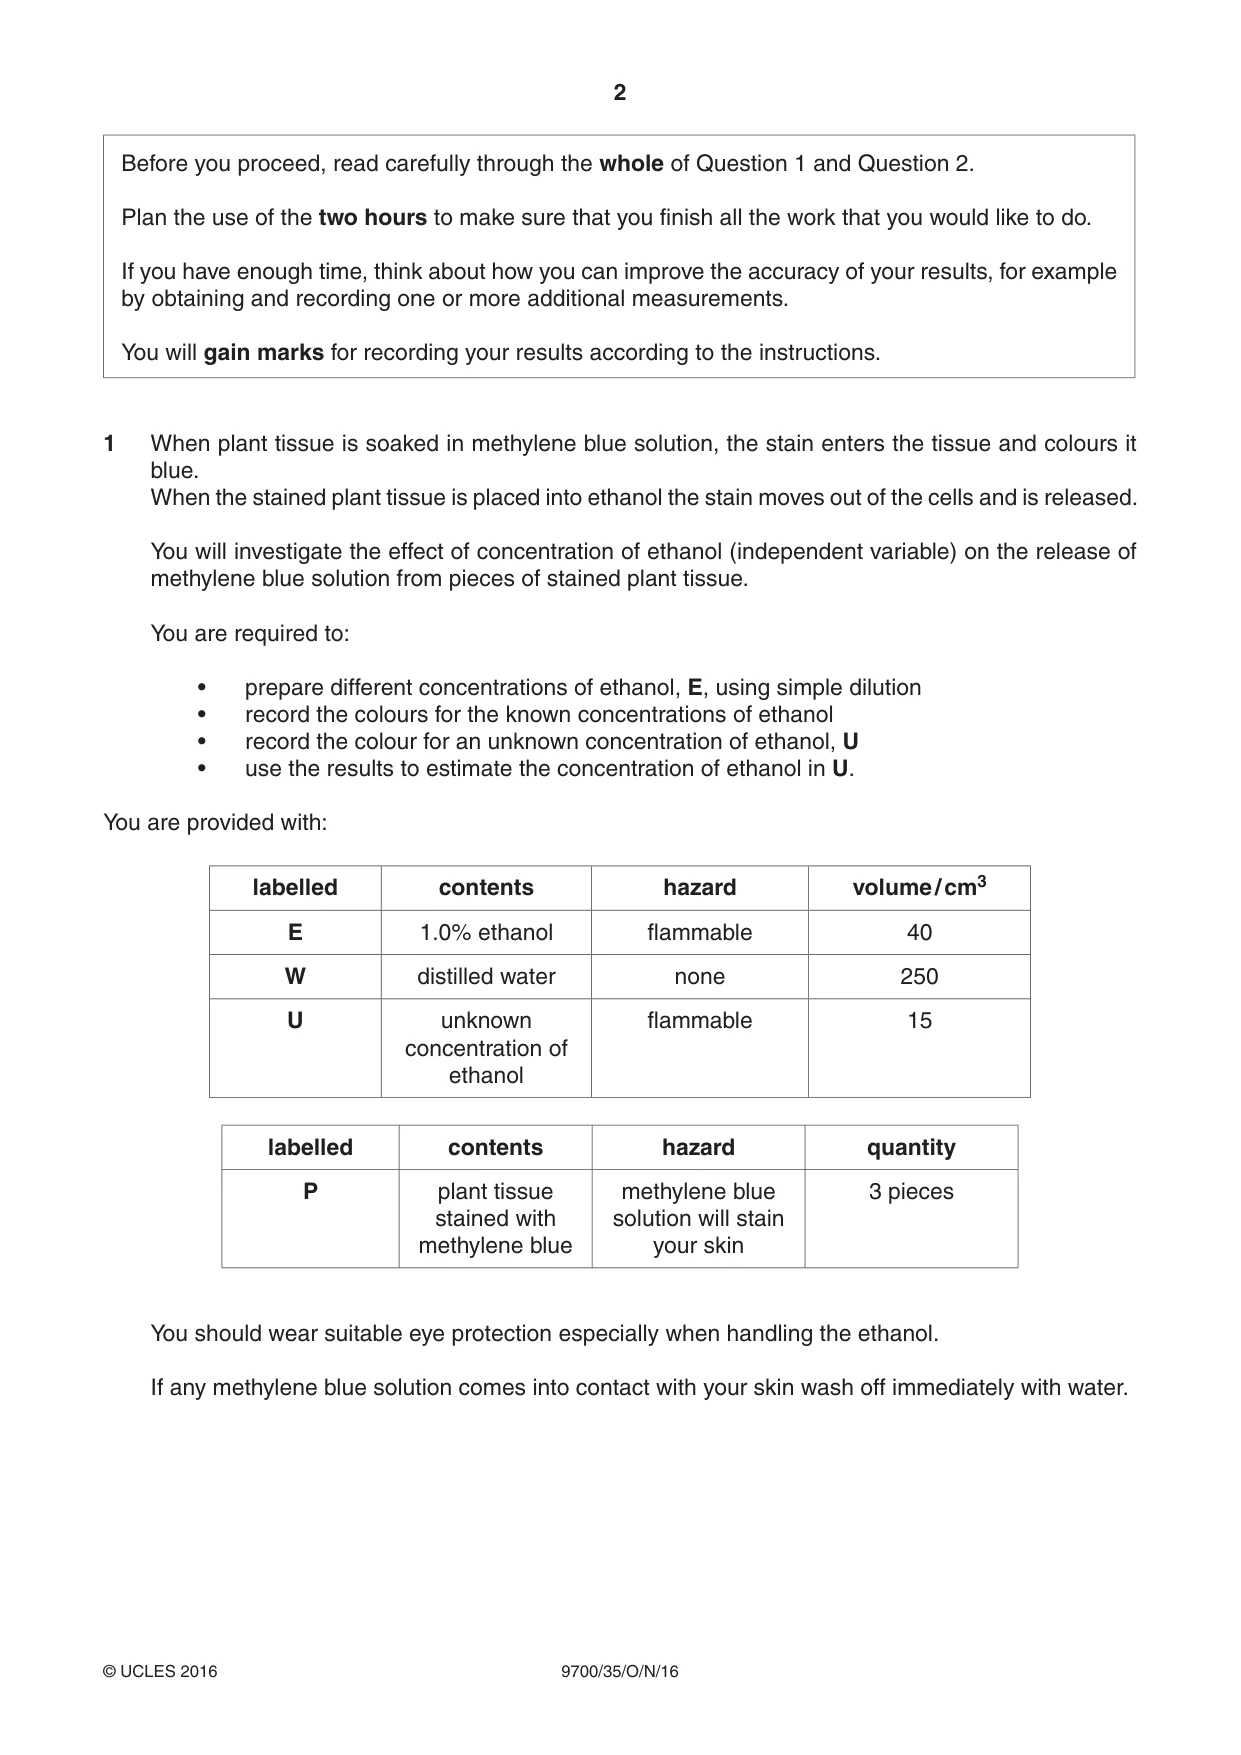
2 9700/35/O/N/16 © UCLES 2016 Before you proceed, read carefully through the whole of Question 1 and Question 2. Plan the use of the two hours to make sure that you finish all the work that you would like to do. If you have enough time, think about how you can improve the accuracy of your results, for example by obtaining and recording one or more additional measurements. You will gain marks for recording your results according to the instructions. 1 When plant tissue is soaked in methylene blue solution, the stain enters the tissue and colours it blue. When the stained plant tissue is placed into ethanol the stain moves out of the cells and is released. You will investigate the effect of concentration of ethanol (independent variable) on the release of methylene blue solution from pieces of stained plant tissue. You are required to: • prepare different concentrations of ethanol, E, using simple dilution • record the colours for the known concentrations of ethanol • record the colour for an unknown concentration of ethanol, U • use the results to estimate the concentration of ethanol in U. You are provided with: labelled contents hazard volume / cm3 E 1.0% ethanol flammable 40 W distilled water none 250 U unknown concentration of ethanol flammable 15 labelled contents hazard quantity P plant tissue stained with methylene blue methylene blue solution will stain your skin 3 pieces You should wear suitable eye protection especially when handling the ethanol. If any methylene blue solution comes into contact with your skin wash off immediately with water.
Question paper, page 3
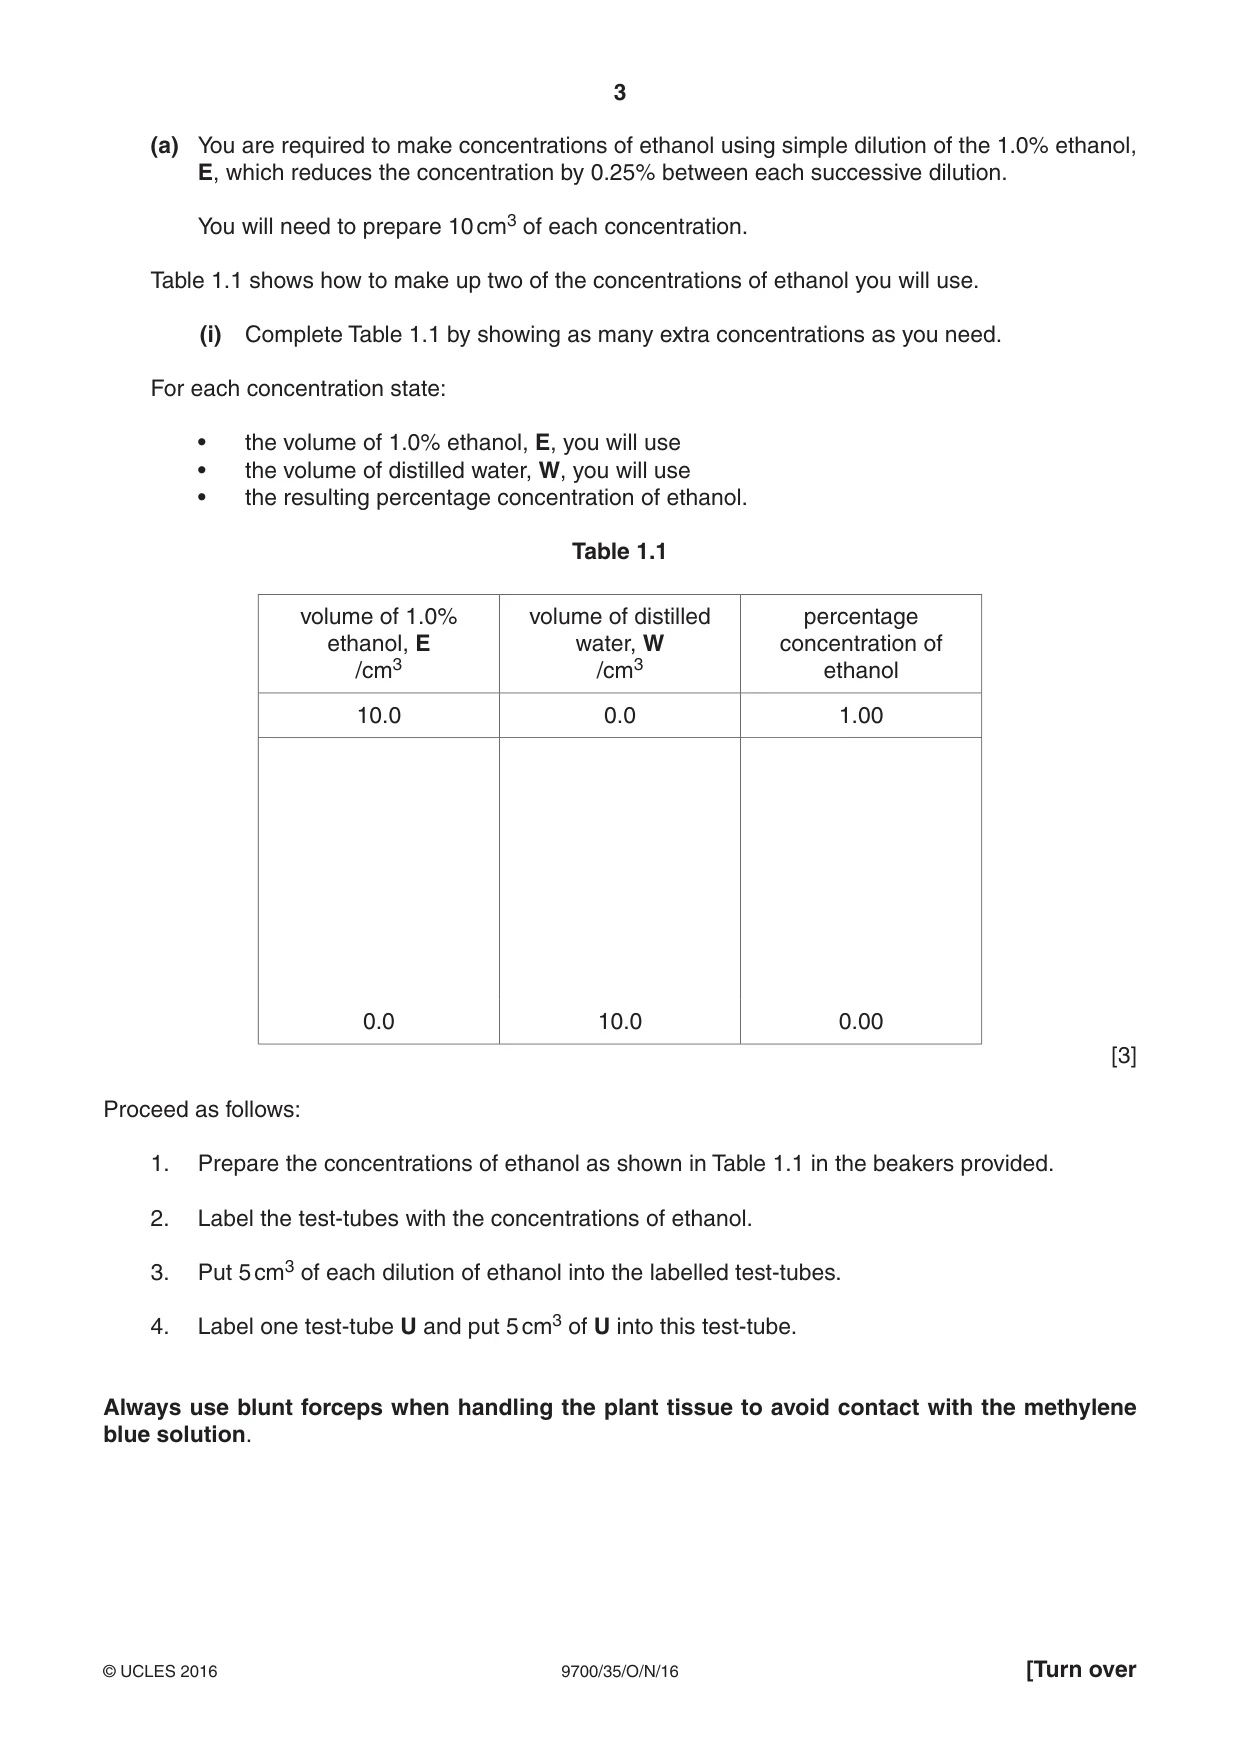
3 9700/35/O/N/16 © UCLES 2016 [Turn over (a) You are required to make concentrations of ethanol using simple dilution of the 1.0% ethanol, E, which reduces the concentration by 0.25% between each successive dilution. You will need to prepare 10 cm3 of each concentration. Table 1.1 shows how to make up two of the concentrations of ethanol you will use. (i) Complete Table 1.1 by showing as many extra concentrations as you need. For each concentration state: • the volume of 1.0% ethanol, E, you will use • the volume of distilled water, W, you will use • the resulting percentage concentration of ethanol. Table 1.1 volume of 1.0% ethanol, E /cm3 volume of distilled water, W /cm3 percentage concentration of ethanol 10.0 0.0 1.00 0.0 10.0 0.00 [3] Proceed as follows: 1. Prepare the concentrations of ethanol as shown in Table 1.1 in the beakers provided. 2. Label the test-tubes with the concentrations of ethanol. 3. Put 5 cm3 of each dilution of ethanol into the labelled test-tubes. 4. Label one test-tube U and put 5 cm3 of U into this test-tube. Always use blunt forceps when handling the plant tissue to avoid contact with the methylene blue solution.
Question paper, page 4
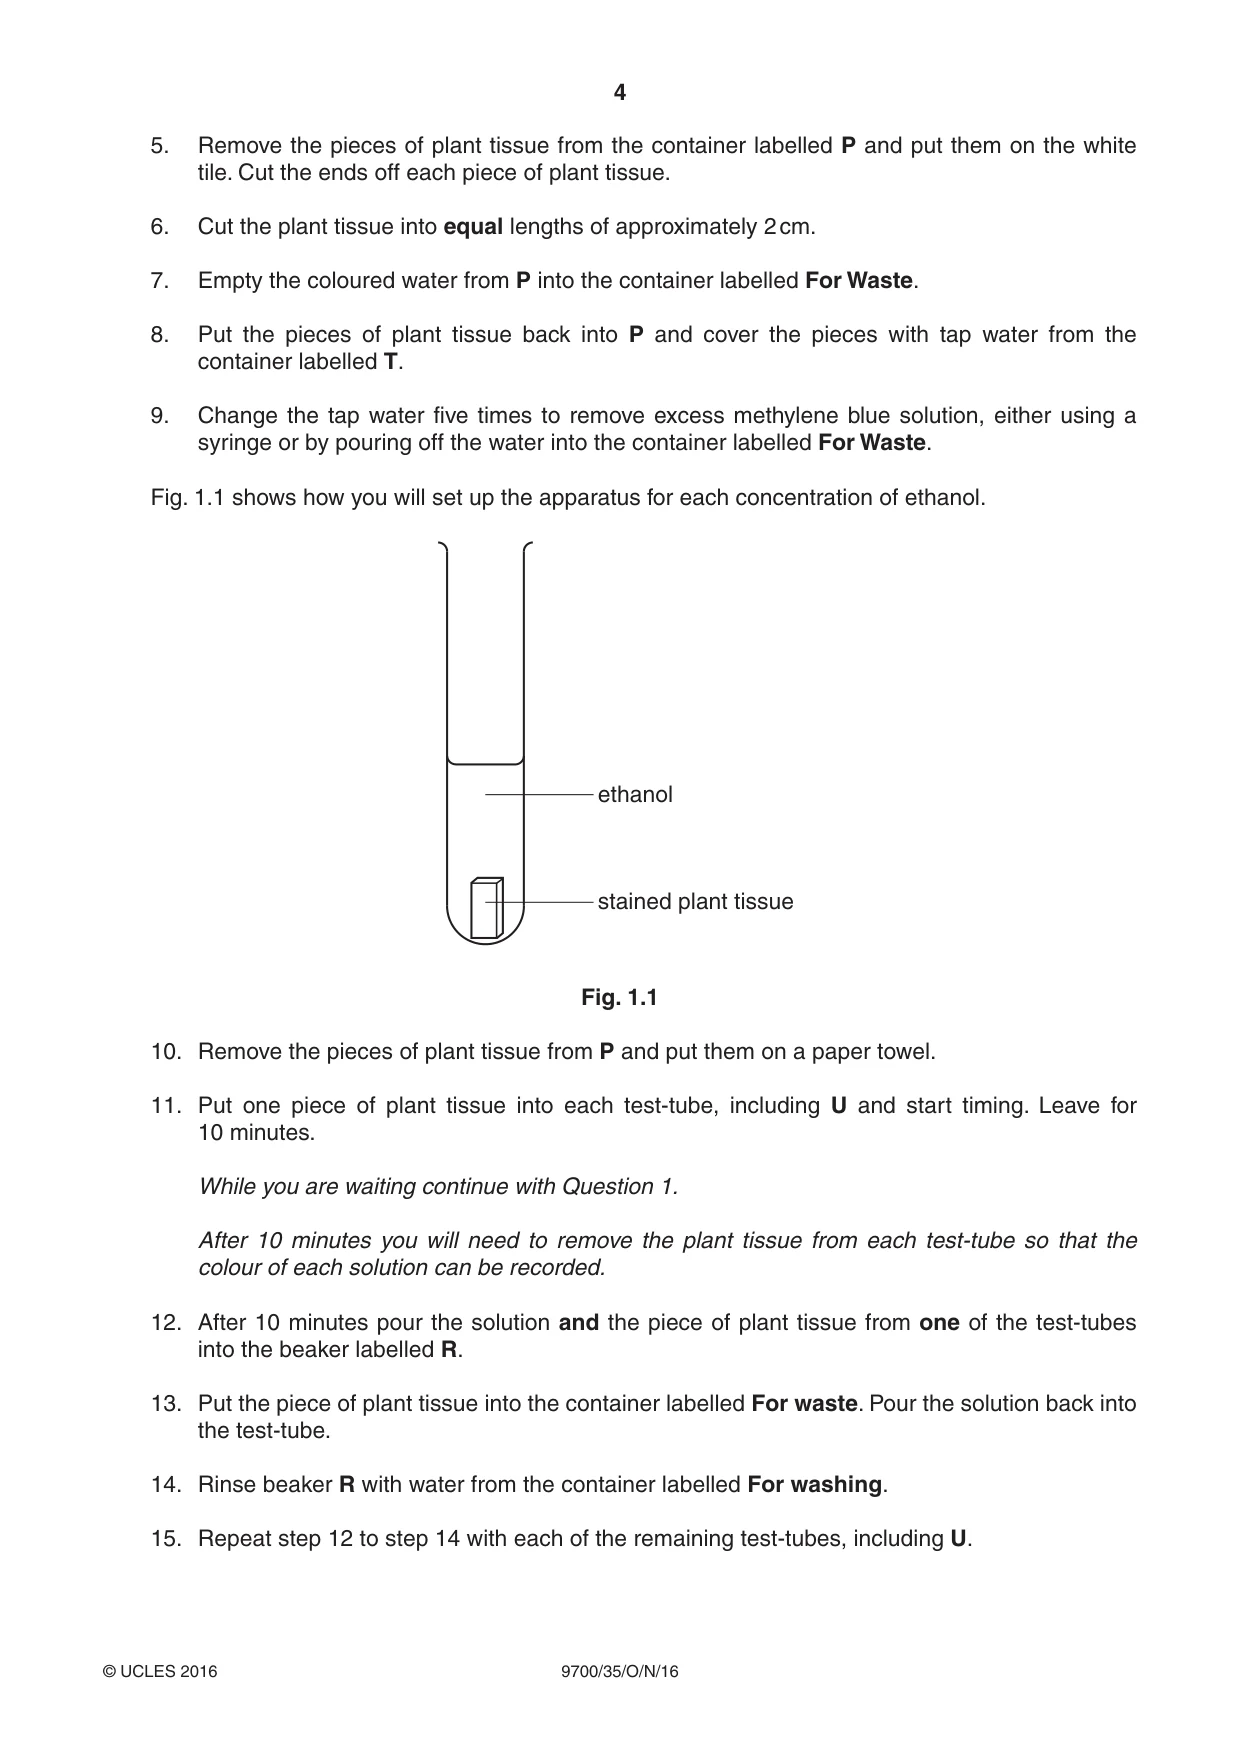
4 9700/35/O/N/16 © UCLES 2016 5. Remove the pieces of plant tissue from the container labelled P and put them on the white tile. Cut the ends off each piece of plant tissue. 6. Cut the plant tissue into equal lengths of approximately 2 cm. 7. Empty the coloured water from P into the container labelled For Waste. 8. Put the pieces of plant tissue back into P and cover the pieces with tap water from the container labelled T. 9. Change the tap water five times to remove excess methylene blue solution, either using a syringe or by pouring off the water into the container labelled For Waste. Fig. 1.1 shows how you will set up the apparatus for each concentration of ethanol. ethanol stained plant tissue Fig. 1.1 10. Remove the pieces of plant tissue from P and put them on a paper towel. 11. Put one piece of plant tissue into each test-tube, including U and start timing. Leave for 10 minutes. While you are waiting continue with Question 1. After 10 minutes you will need to remove the plant tissue from each test-tube so that the colour of each solution can be recorded. 12. After 10 minutes pour the solution and the piece of plant tissue from one of the test-tubes into the beaker labelled R. 13. Put the piece of plant tissue into the container labelled For waste. Pour the solution back into the test-tube. 14. Rinse beaker R with water from the container labelled For washing. 15. Repeat step 12 to step 14 with each of the remaining test-tubes, including U.
Question paper, page 5
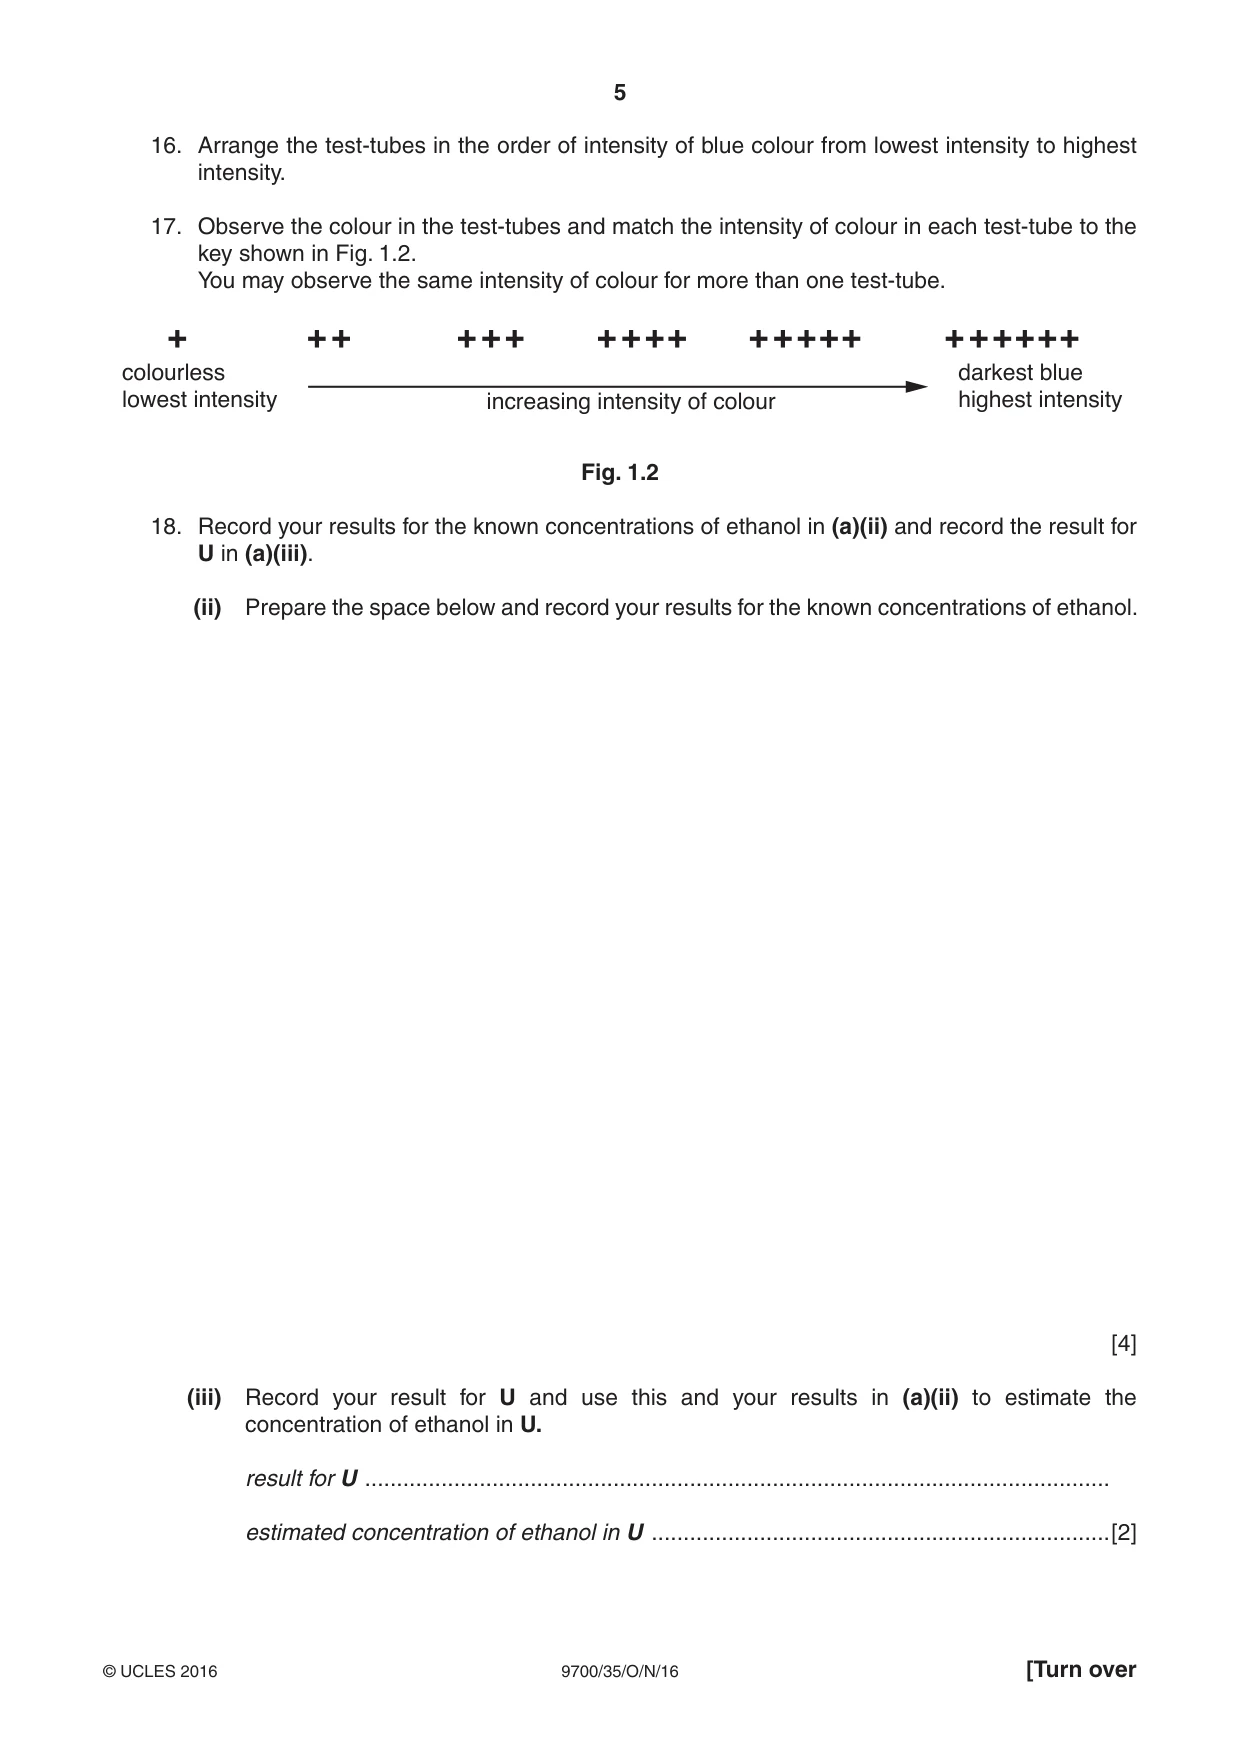
5 9700/35/O/N/16 © UCLES 2016 [Turn over 16. Arrange the test-tubes in the order of intensity of blue colour from lowest intensity to highest intensity. 17. Observe the colour in the test-tubes and match the intensity of colour in each test-tube to the key shown in Fig. 1.2. You may observe the same intensity of colour for more than one test-tube. colourless lowest intensity darkest blue highest intensity increasing intensity of colour Fig. 1.2 18. Record your results for the known concentrations of ethanol in (a)(ii) and record the result for U in (a)(iii). (ii) Prepare the space below and record your results for the known concentrations of ethanol. [4] (iii) Record your result for U and use this and your results in (a)(ii) to estimate the concentration of ethanol in U. result for U … estimated concentration of ethanol in U …[2]
Question paper, page 6
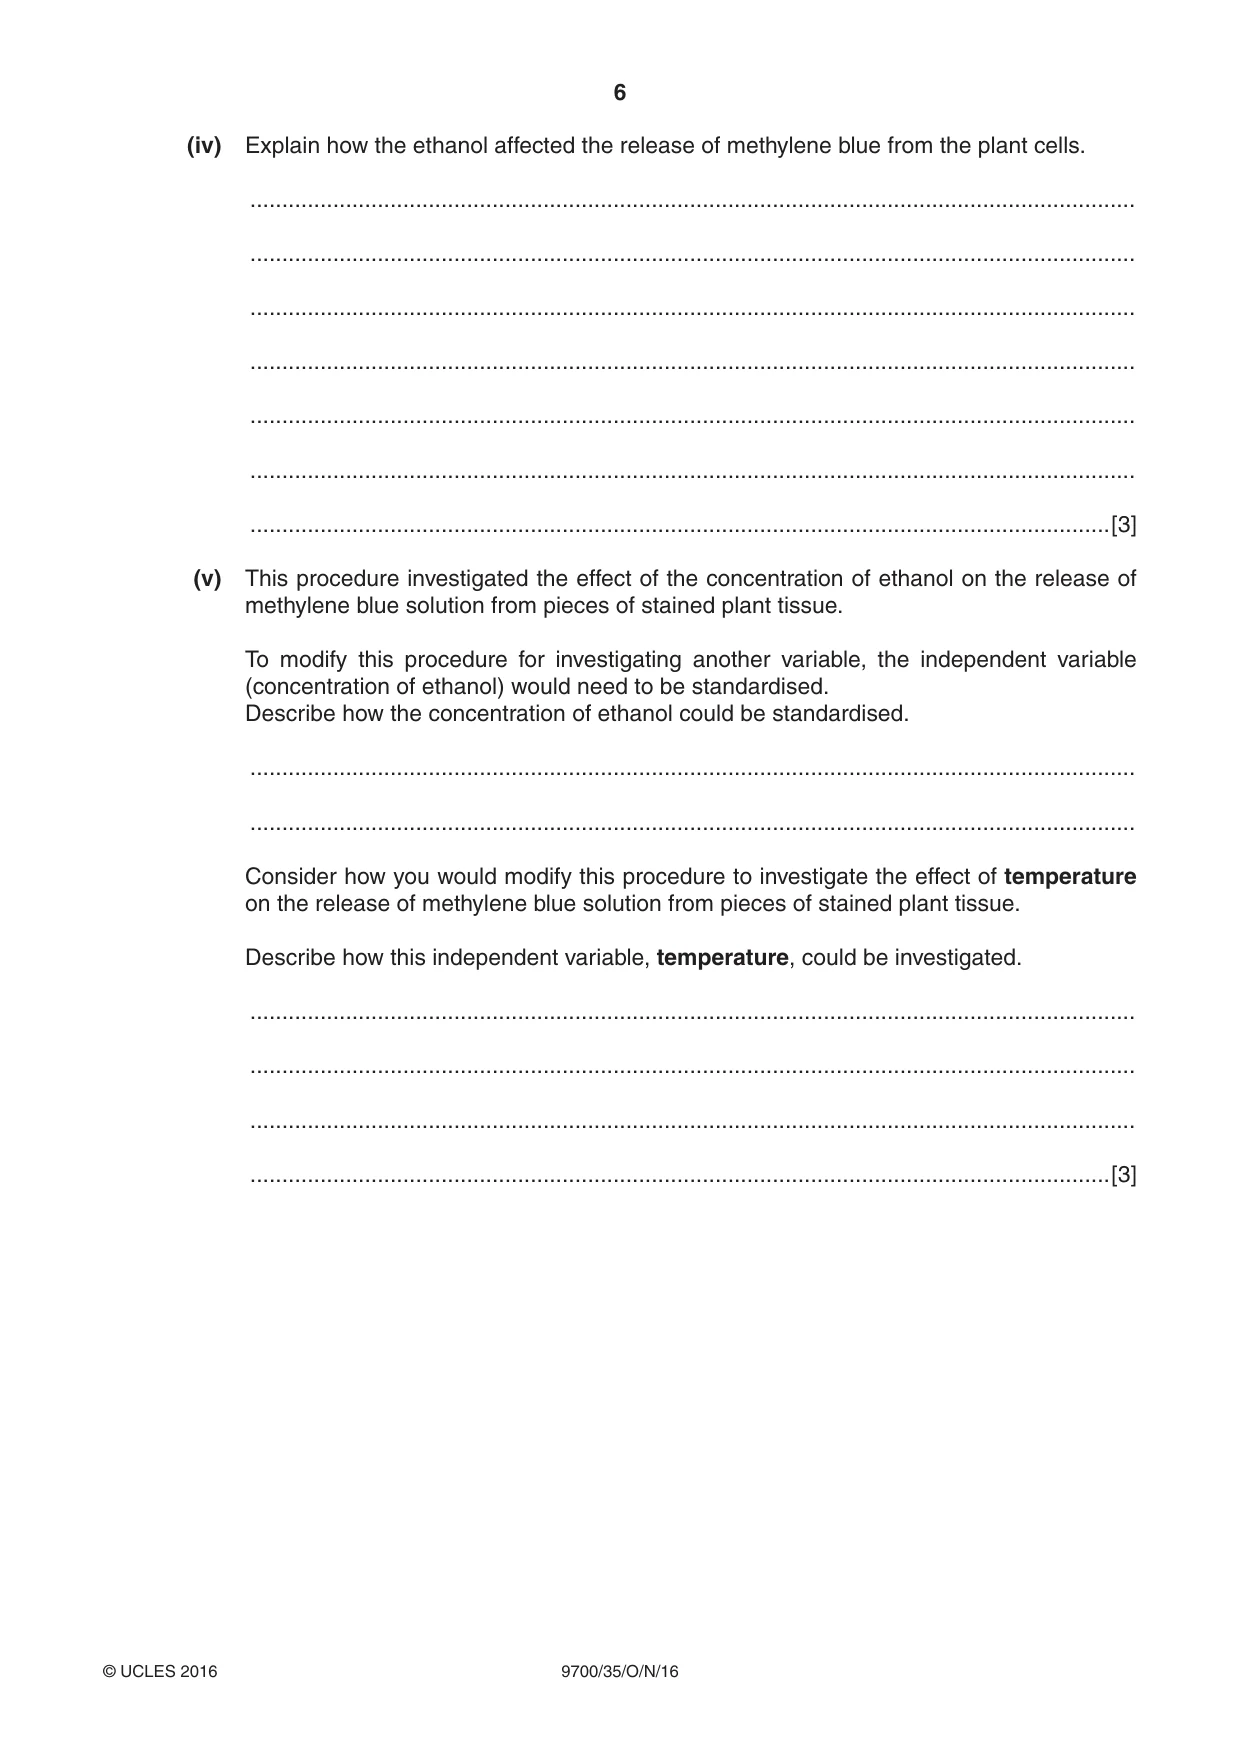
6 9700/35/O/N/16 © UCLES 2016 (iv) Explain how the ethanol affected the release of methylene blue from the plant cells. … … … … … … …[3] (v) This procedure investigated the effect of the concentration of ethanol on the release of methylene blue solution from pieces of stained plant tissue. To modify this procedure for investigating another variable, the independent variable (concentration of ethanol) would need to be standardised. Describe how the concentration of ethanol could be standardised. … … Consider how you would modify this procedure to investigate the effect of temperature on the release of methylene blue solution from pieces of stained plant tissue. Describe how this independent variable, temperature, could be investigated. … … … …[3]
Question paper, page 7
7 9700/35/O/N/16 © UCLES 2016 [Turn over Question 1 continues on page 8
Question paper, page 8
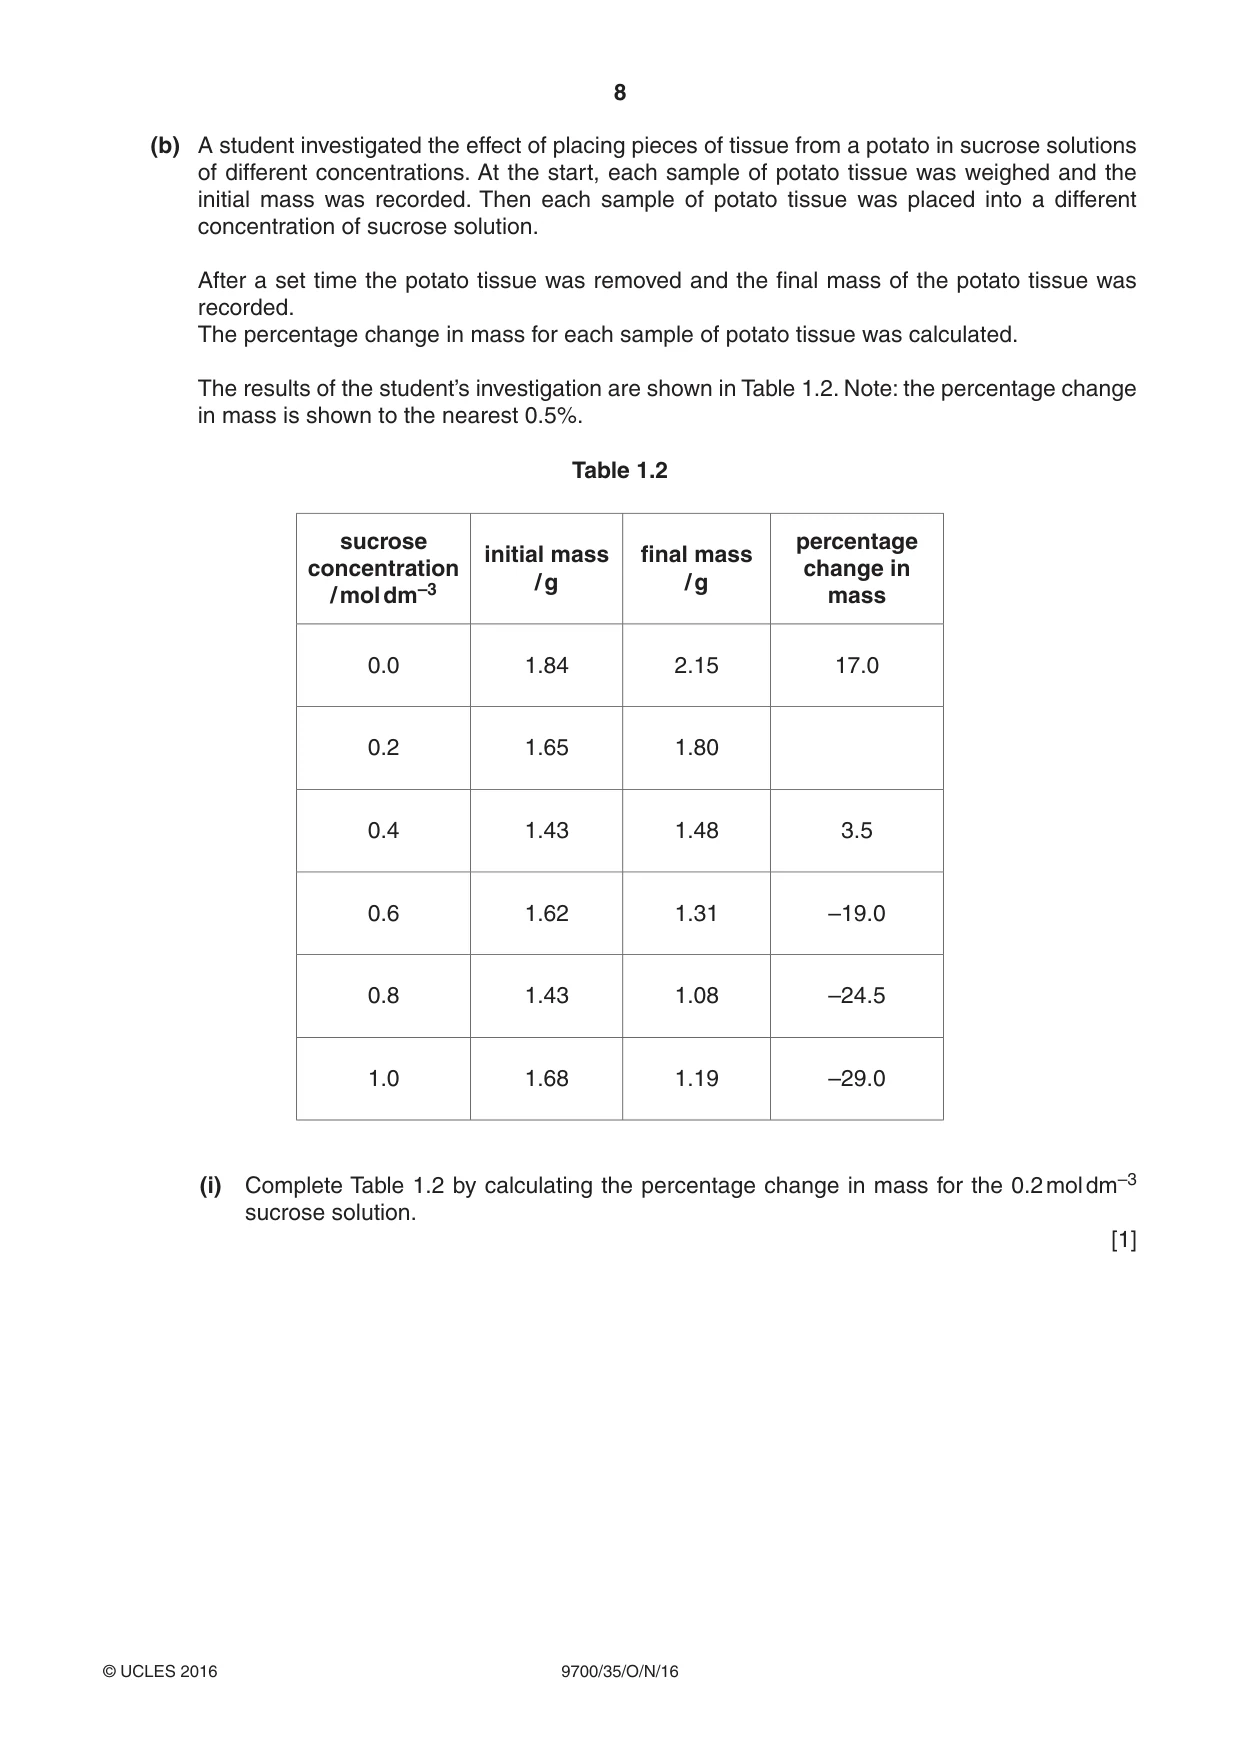
8 9700/35/O/N/16 © UCLES 2016 (b) A student investigated the effect of placing pieces of tissue from a potato in sucrose solutions of different concentrations. At the start, each sample of potato tissue was weighed and the initial mass was recorded. Then each sample of potato tissue was placed into a different concentration of sucrose solution. After a set time the potato tissue was removed and the final mass of the potato tissue was recorded. The percentage change in mass for each sample of potato tissue was calculated. The results of the student’s investigation are shown in Table 1.2. Note: the percentage change in mass is shown to the nearest 0.5%. Table 1.2 sucrose concentration / mol dm–3 initial mass / g final mass / g percentage change in mass 0.0 1.84 2.15 17.0 0.2 1.65 1.80 0.4 1.43 1.48 3.5 0.6 1.62 1.31 –19.0 0.8 1.43 1.08 –24.5 1.0 1.68 1.19 –29.0 (i) Complete Table 1.2 by calculating the percentage change in mass for the 0.2 mol dm–3 sucrose solution. [1]
Question paper, page 9
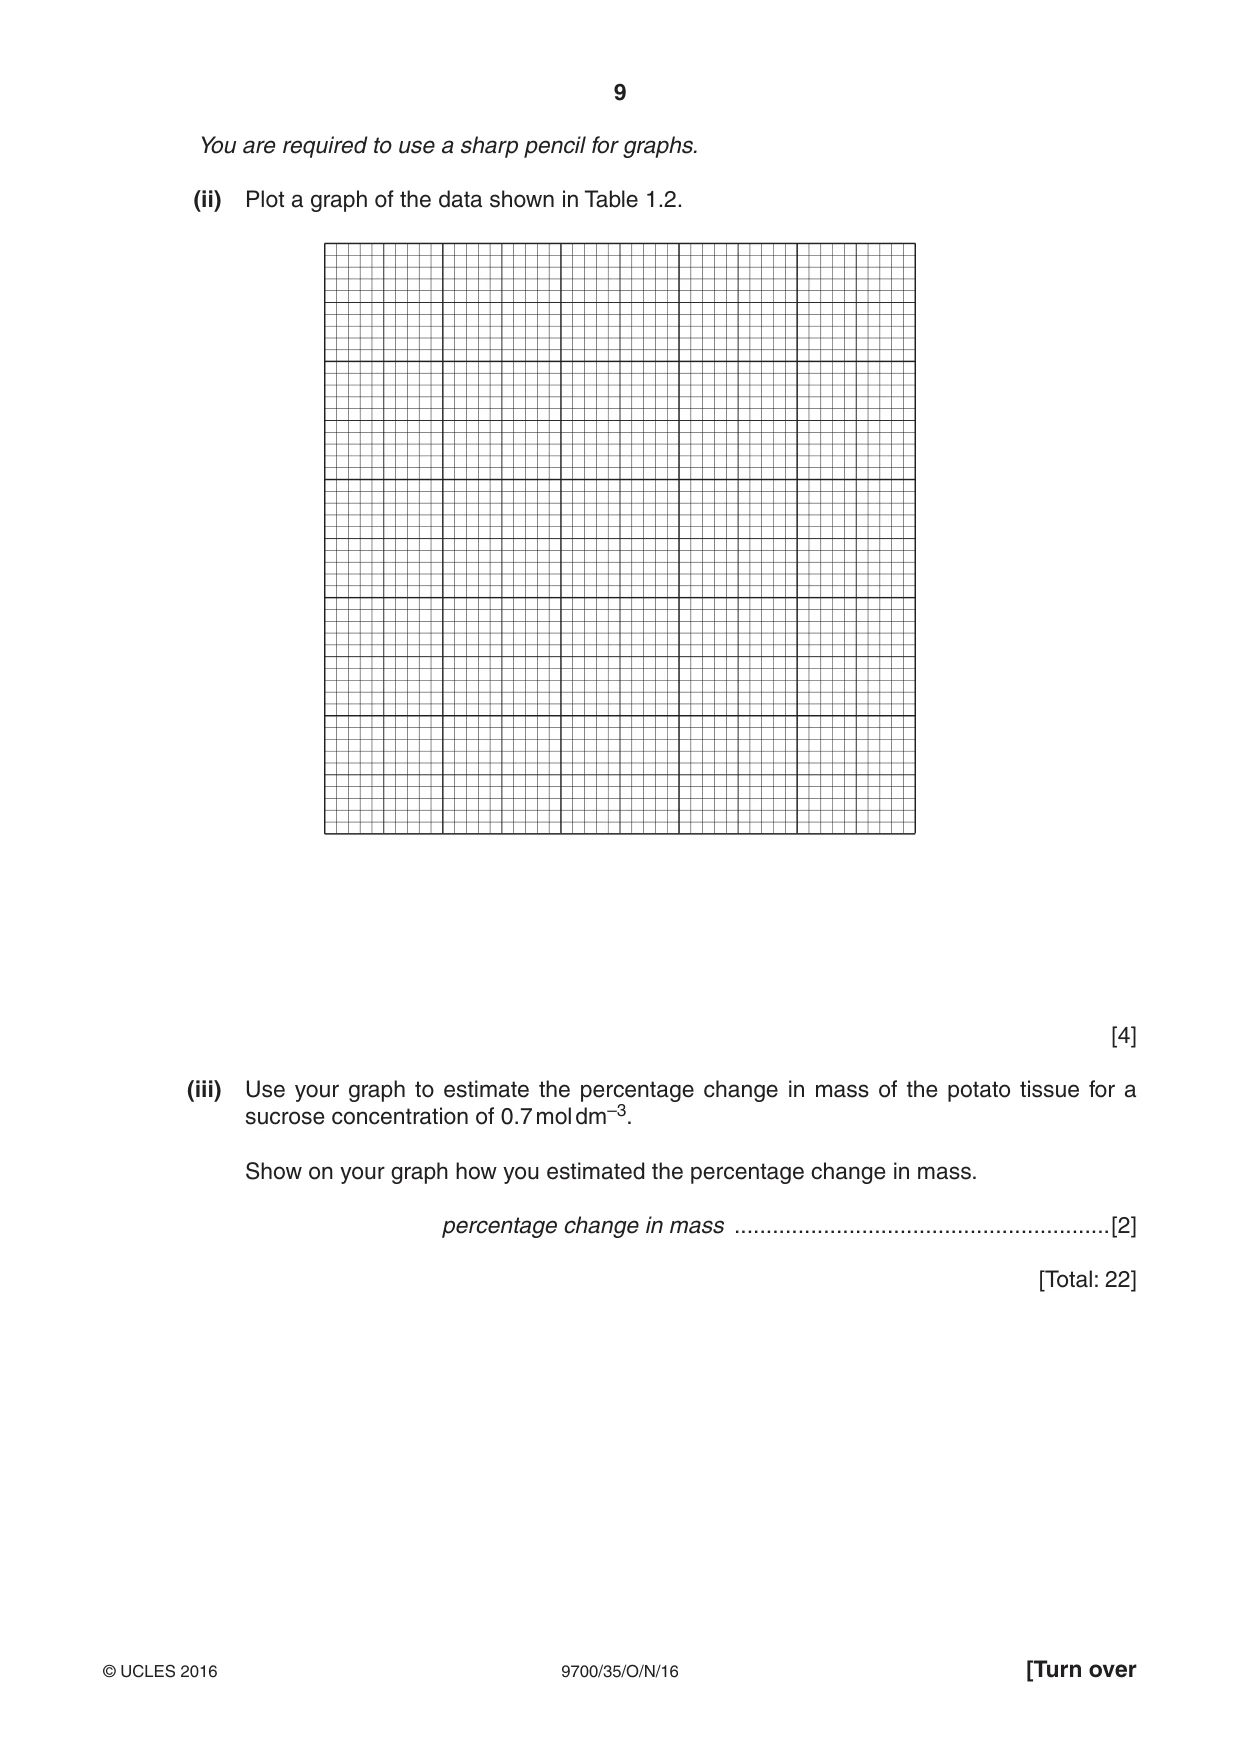
9 9700/35/O/N/16 © UCLES 2016 [Turn over You are required to use a sharp pencil for graphs. (ii) Plot a graph of the data shown in Table 1.2. [4] (iii) Use your graph to estimate the percentage change in mass of the potato tissue for a sucrose concentration of 0.7 mol dm–3. Show on your graph how you estimated the percentage change in mass. percentage change in mass …[2] [Total: 22]
Question paper, page 10
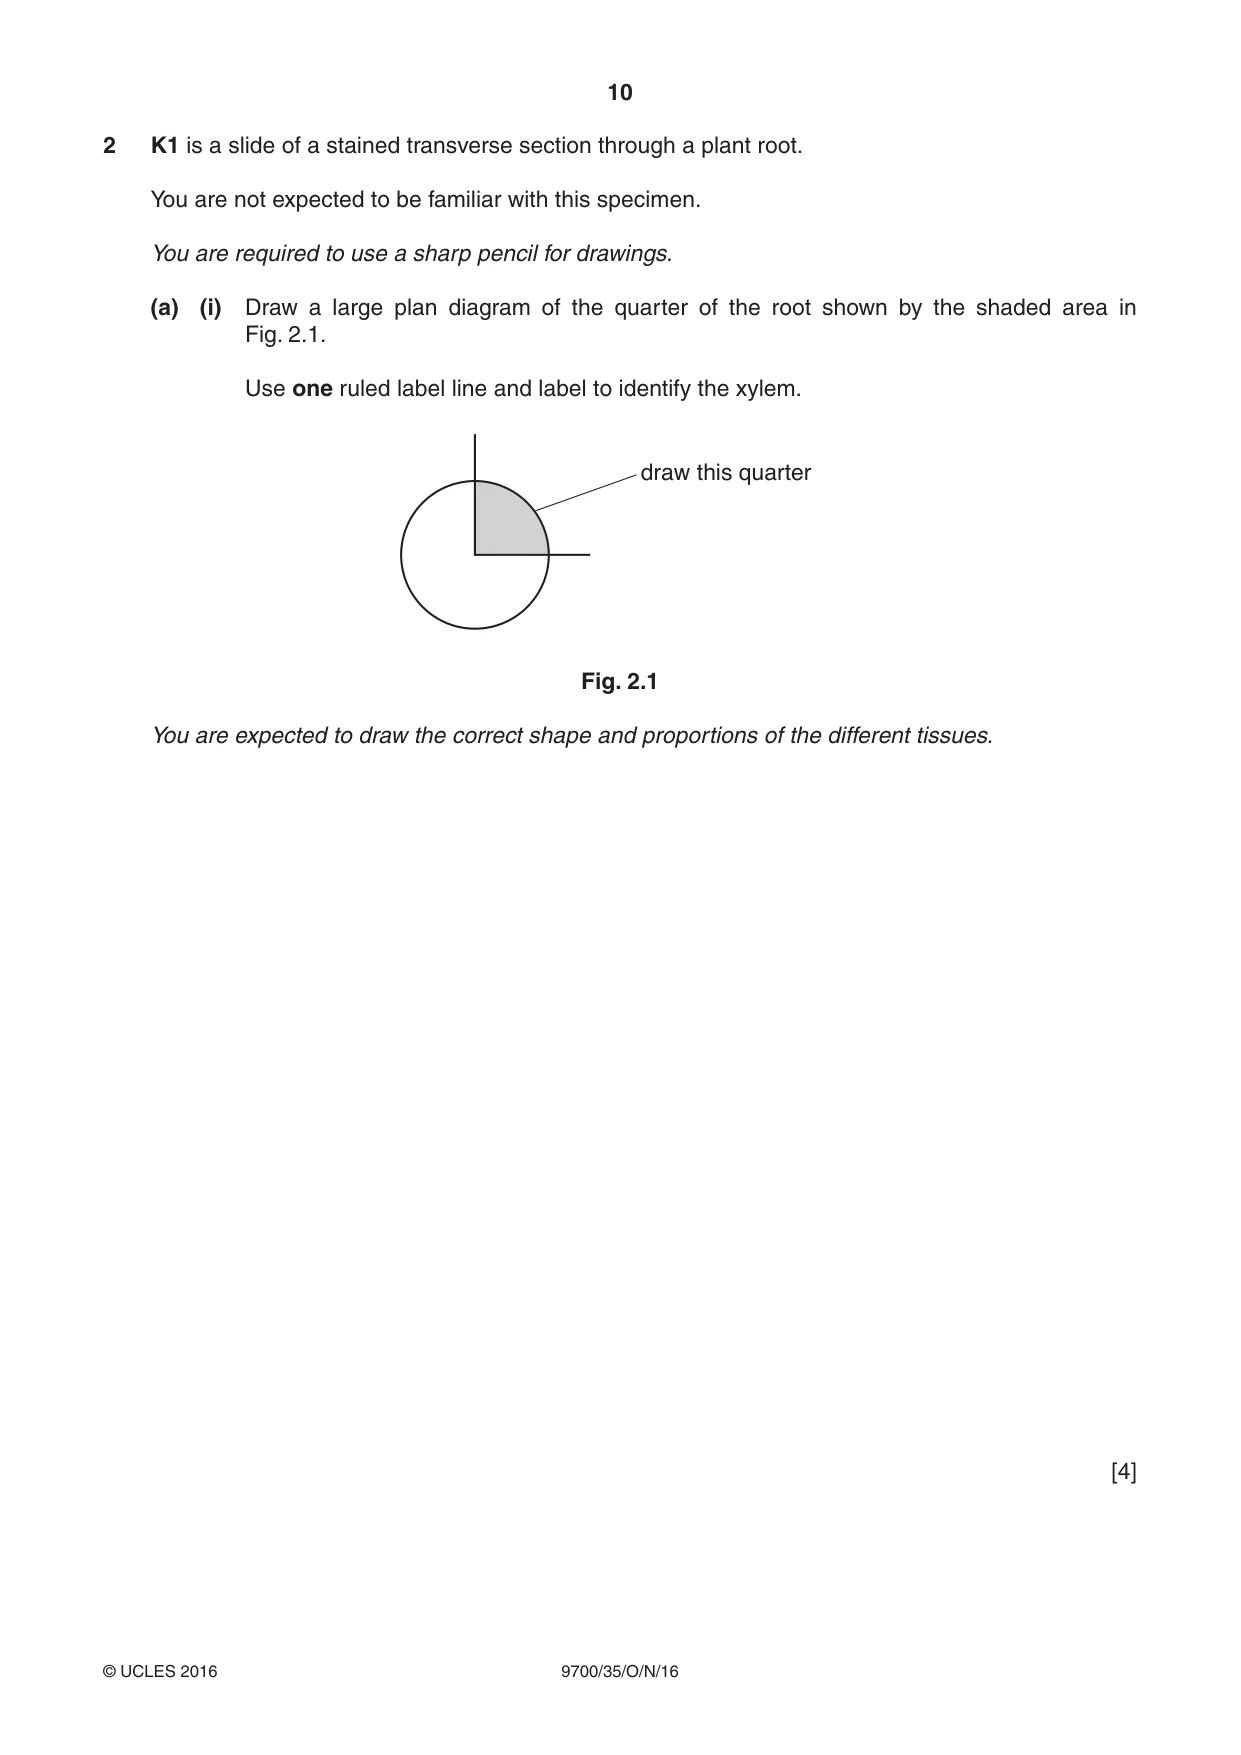
10 9700/35/O/N/16 © UCLES 2016 2 K1 is a slide of a stained transverse section through a plant root. You are not expected to be familiar with this specimen. You are required to use a sharp pencil for drawings. (a) (i) Draw a large plan diagram of the quarter of the root shown by the shaded area in Fig. 2.1. Use one ruled label line and label to identify the xylem. draw this quarter Fig. 2.1 You are expected to draw the correct shape and proportions of the different tissues. [4]
Question paper, page 11
11 9700/35/O/N/16 © UCLES 2016 [Turn over (ii) Observe the central tissue in the root on K1. These cells are not identical. Select one group of four adjacent (touching) cells which show some of the differences between these cells. Each cell must touch at least two of the other cells. Make a large drawing of this group of four cells. Use one ruled label line and label to identify the cell wall of one cell. [5]
Question paper, page 12
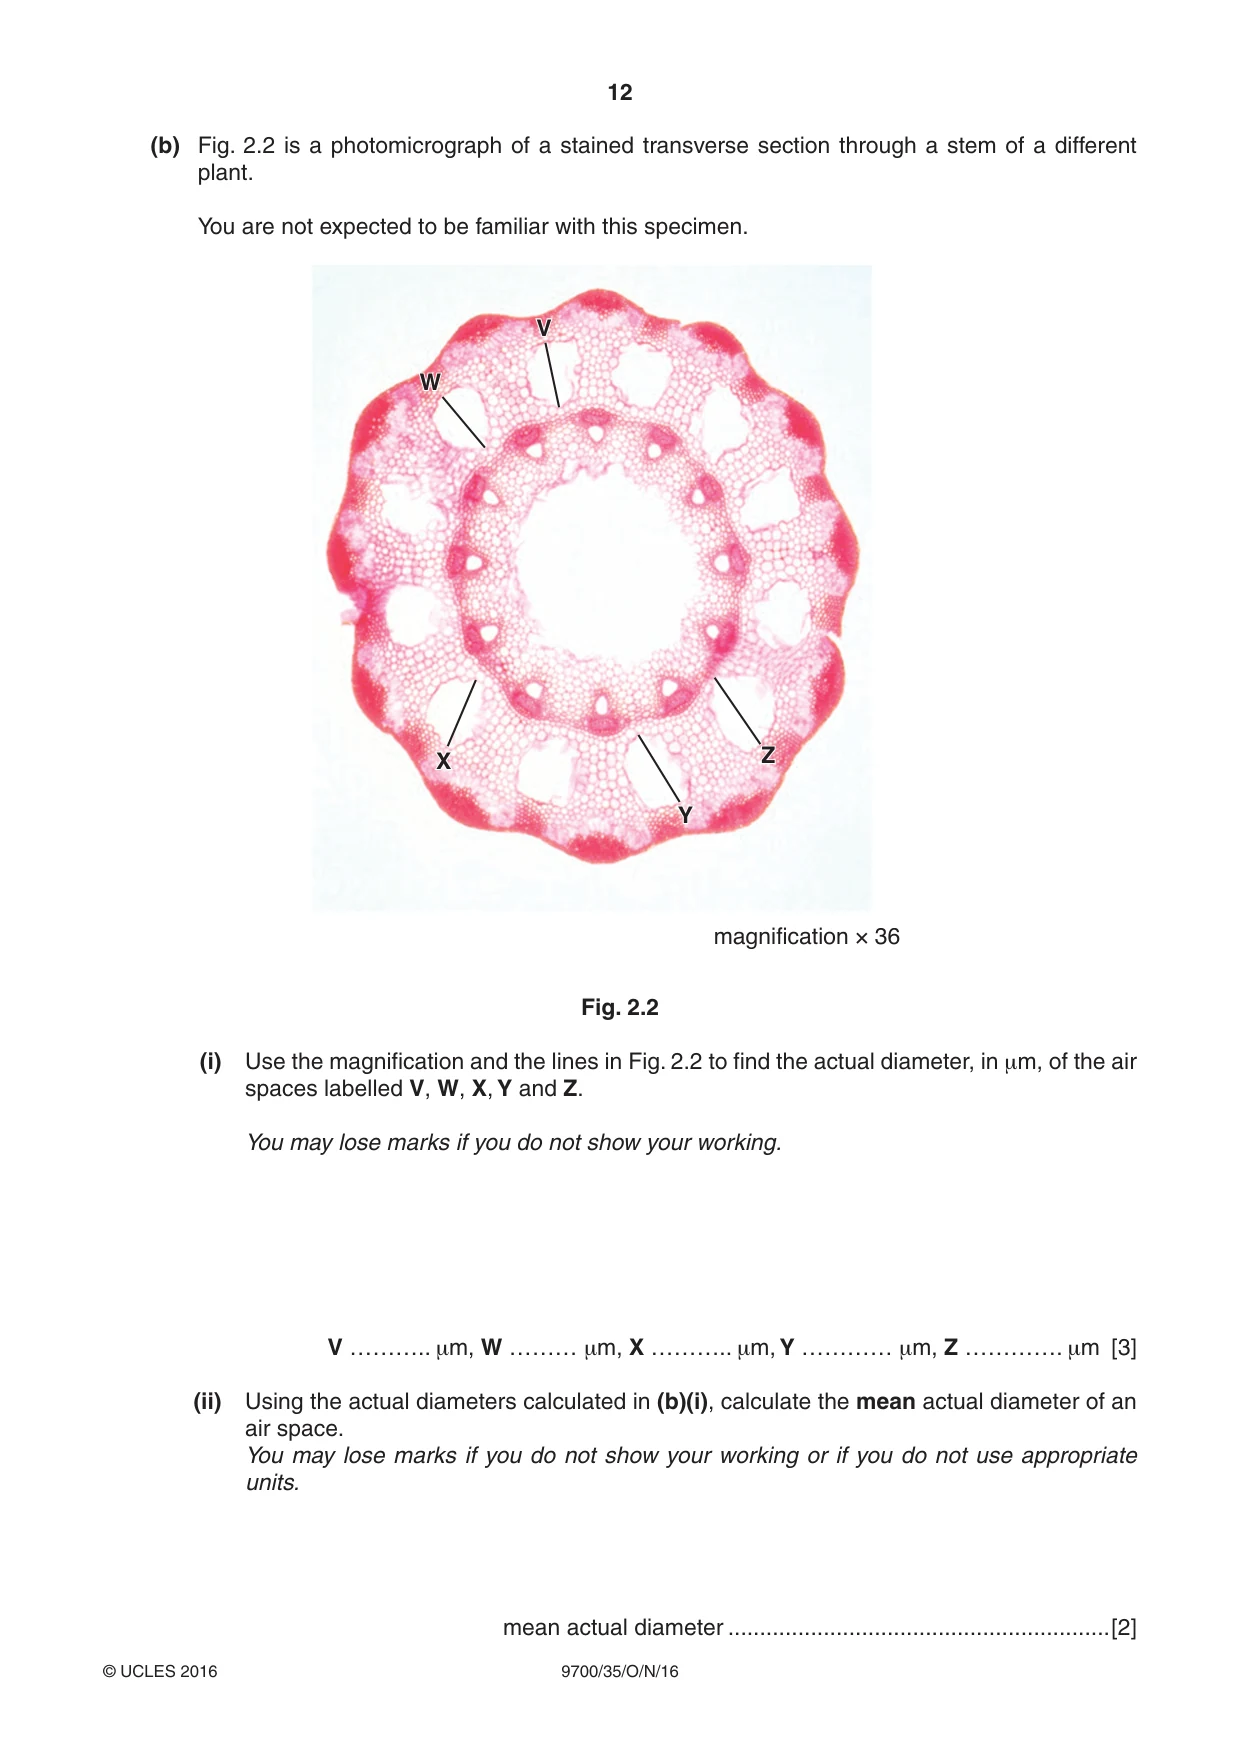
12 9700/35/O/N/16 © UCLES 2016 (b) Fig. 2.2 is a photomicrograph of a stained transverse section through a stem of a different plant. You are not expected to be familiar with this specimen. W X Y Z V magnification × 36 Fig. 2.2 (i) Use the magnification and the lines in Fig. 2.2 to find the actual diameter, in μm, of the air spaces labelled V, W, X, Y and Z. You may lose marks if you do not show your working. V ……….. μm, W ……… μm, X ……….. μm, Y ………… μm, Z …………. μm [3] (ii) Using the actual diameters calculated in (b)(i), calculate the mean actual diameter of an air space. You may lose marks if you do not show your working or if you do not use appropriate units. mean actual diameter …[2]
Question paper, page 13
13 9700/35/O/N/16 © UCLES 2016 (c) Prepare the space below so that it is suitable for you to record the observable differences between the root on K1 and the stem in Fig. 2.2. Record your observations in the space you have prepared. [4] [Total: 18]
Question paper, page 14
14 9700/35/O/N/16 © UCLES 2016 BLANK PAGE
Question paper, page 15
15 9700/35/O/N/16 © UCLES 2016 BLANK PAGE
Question paper, page 16
16 9700/35/O/N/16 © UCLES 2016 Permission to reproduce items where third-party owned material protected by copyright is included has been sought and cleared where possible. Every reasonable effort has been made by the publisher (UCLES) to trace copyright holders, but if any items requiring clearance have unwittingly been included, the publisher will be pleased to make amends at the earliest possible opportunity. To avoid the issue of disclosure of answer-related information to candidates, all copyright acknowledgements are reproduced online in the Cambridge International Examinations Copyright Acknowledgements Booklet. This is produced for each series of examinations and is freely available to download at www.cie.org.uk after the live examination series. Cambridge International Examinations is part of the Cambridge Assessment Group. Cambridge Assessment is the brand name of University of Cambridge Local Examinations Syndicate (UCLES), which is itself a department of the University of Cambridge. BLANK PAGE
Mark scheme, page 1
® IGCSE is the registered trademark of Cambridge International Examinations. This document consists of 6 printed pages. © UCLES 2016 [Turn over Cambridge International Examinations Cambridge International Advanced Subsidiary and Advanced Level BIOLOGY 9700/35 Paper 3 Advanced Practical Skills 1 October/November 2016 MARK SCHEME Maximum Mark: 40 Published This mark scheme is published as an aid to teachers and candidates, to indicate the requirements of the examination. It shows the basis on which Examiners were instructed to award marks. It does not indicate the details of the discussions that took place at an Examiners’ meeting before marking began, which would have considered the acceptability of alternative answers. Mark schemes should be read in conjunction with the question paper and the Principal Examiner Report for Teachers. Cambridge will not enter into discussions about these mark schemes. Cambridge is publishing the mark schemes for the October/November 2016 series for most Cambridge IGCSE®, Cambridge International A and AS Level components and some Cambridge O Level components.
Mark scheme, page 2
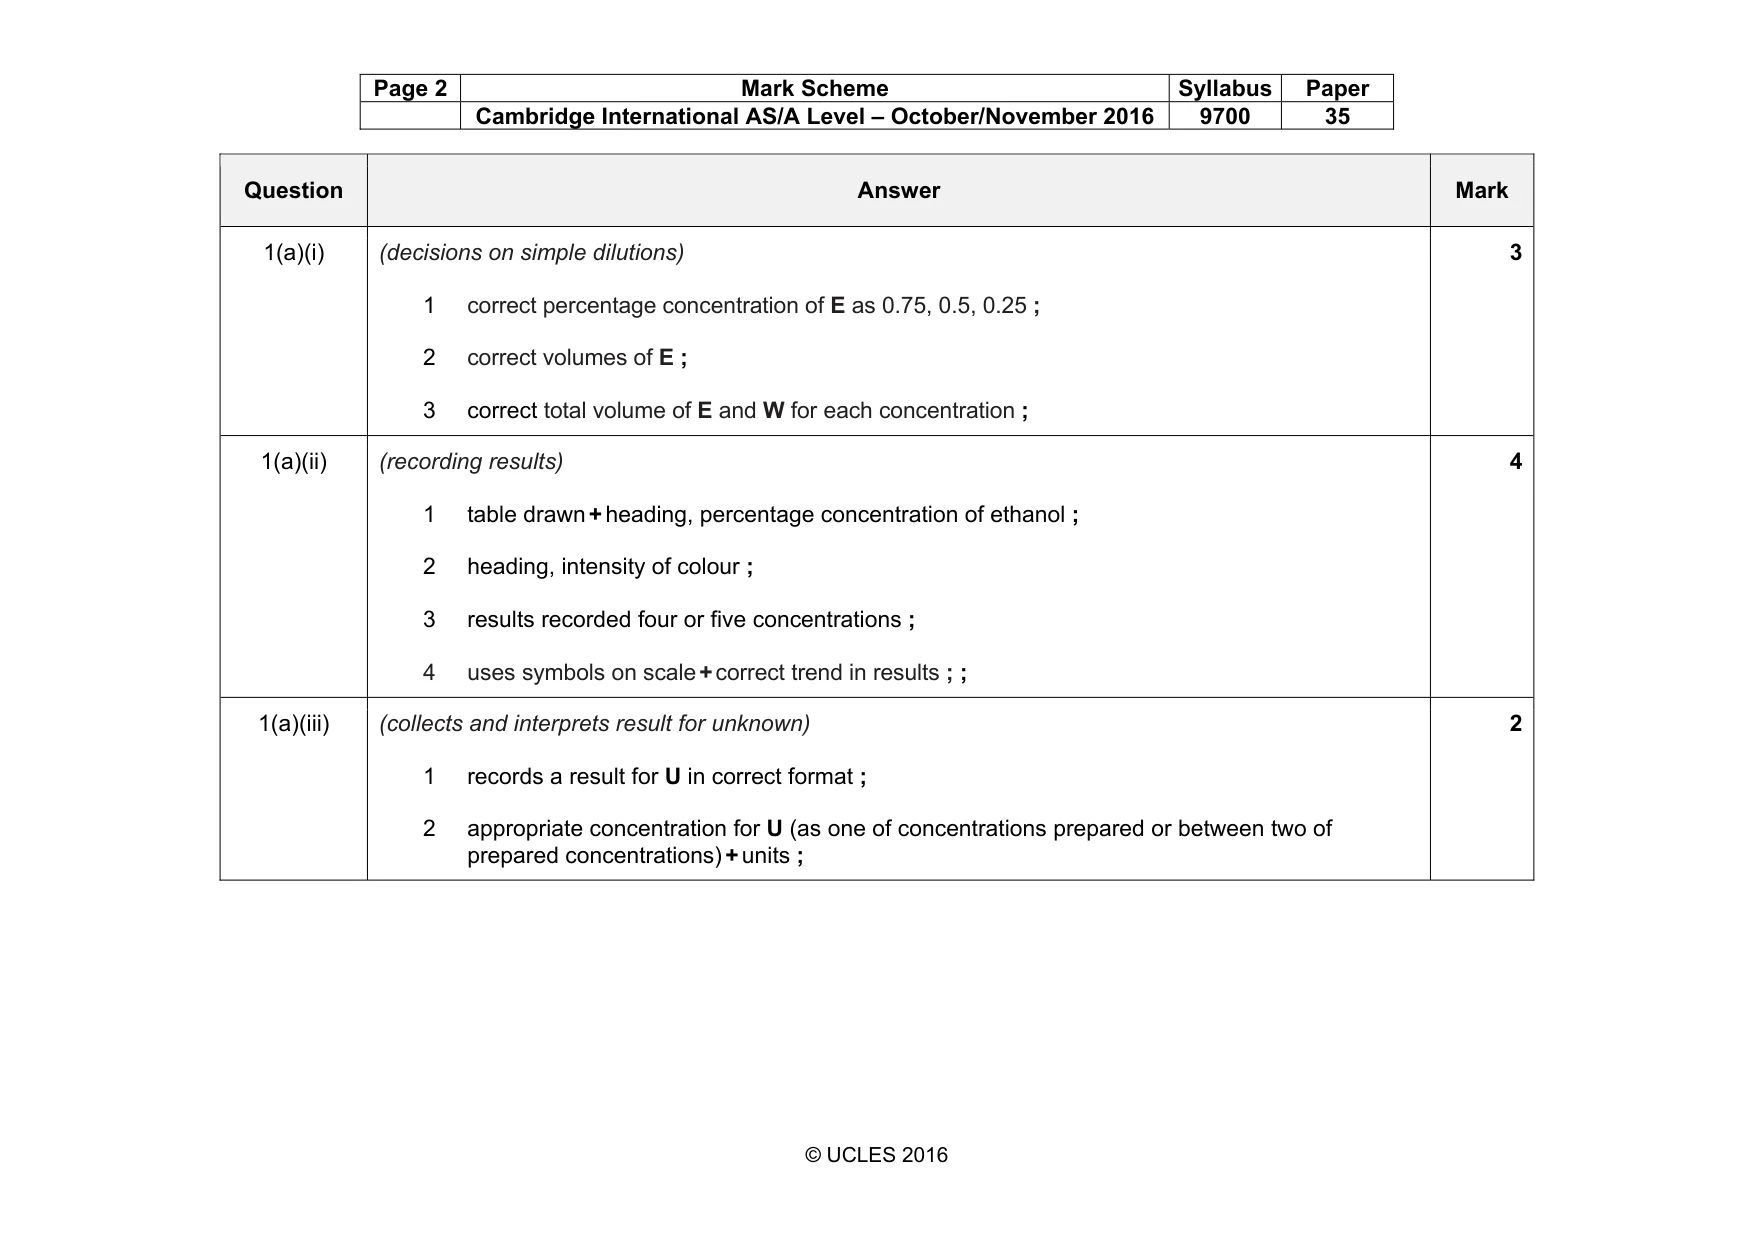
Page 2 Mark Scheme Syllabus Paper Cambridge International AS/A Level – October/November 2016 9700 35 © UCLES 2016 Question Answer Mark 1(a)(i) (decisions on simple dilutions) 1 correct percentage concentration of E as 0.75, 0.5, 0.25 ; 2 correct volumes of E ; 3 correct total volume of E and W for each concentration ; 3 1(a)(ii) (recording results) 1 table drawn + heading, percentage concentration of ethanol ; 2 heading, intensity of colour ; 3 results recorded four or five concentrations ; 4 uses symbols on scale + correct trend in results ; ; 4 1(a)(iii) (collects and interprets result for unknown) 1 records a result for U in correct format ; 2 appropriate concentration for U (as one of concentrations prepared or between two of prepared concentrations) + units ; 2
Mark scheme, page 3
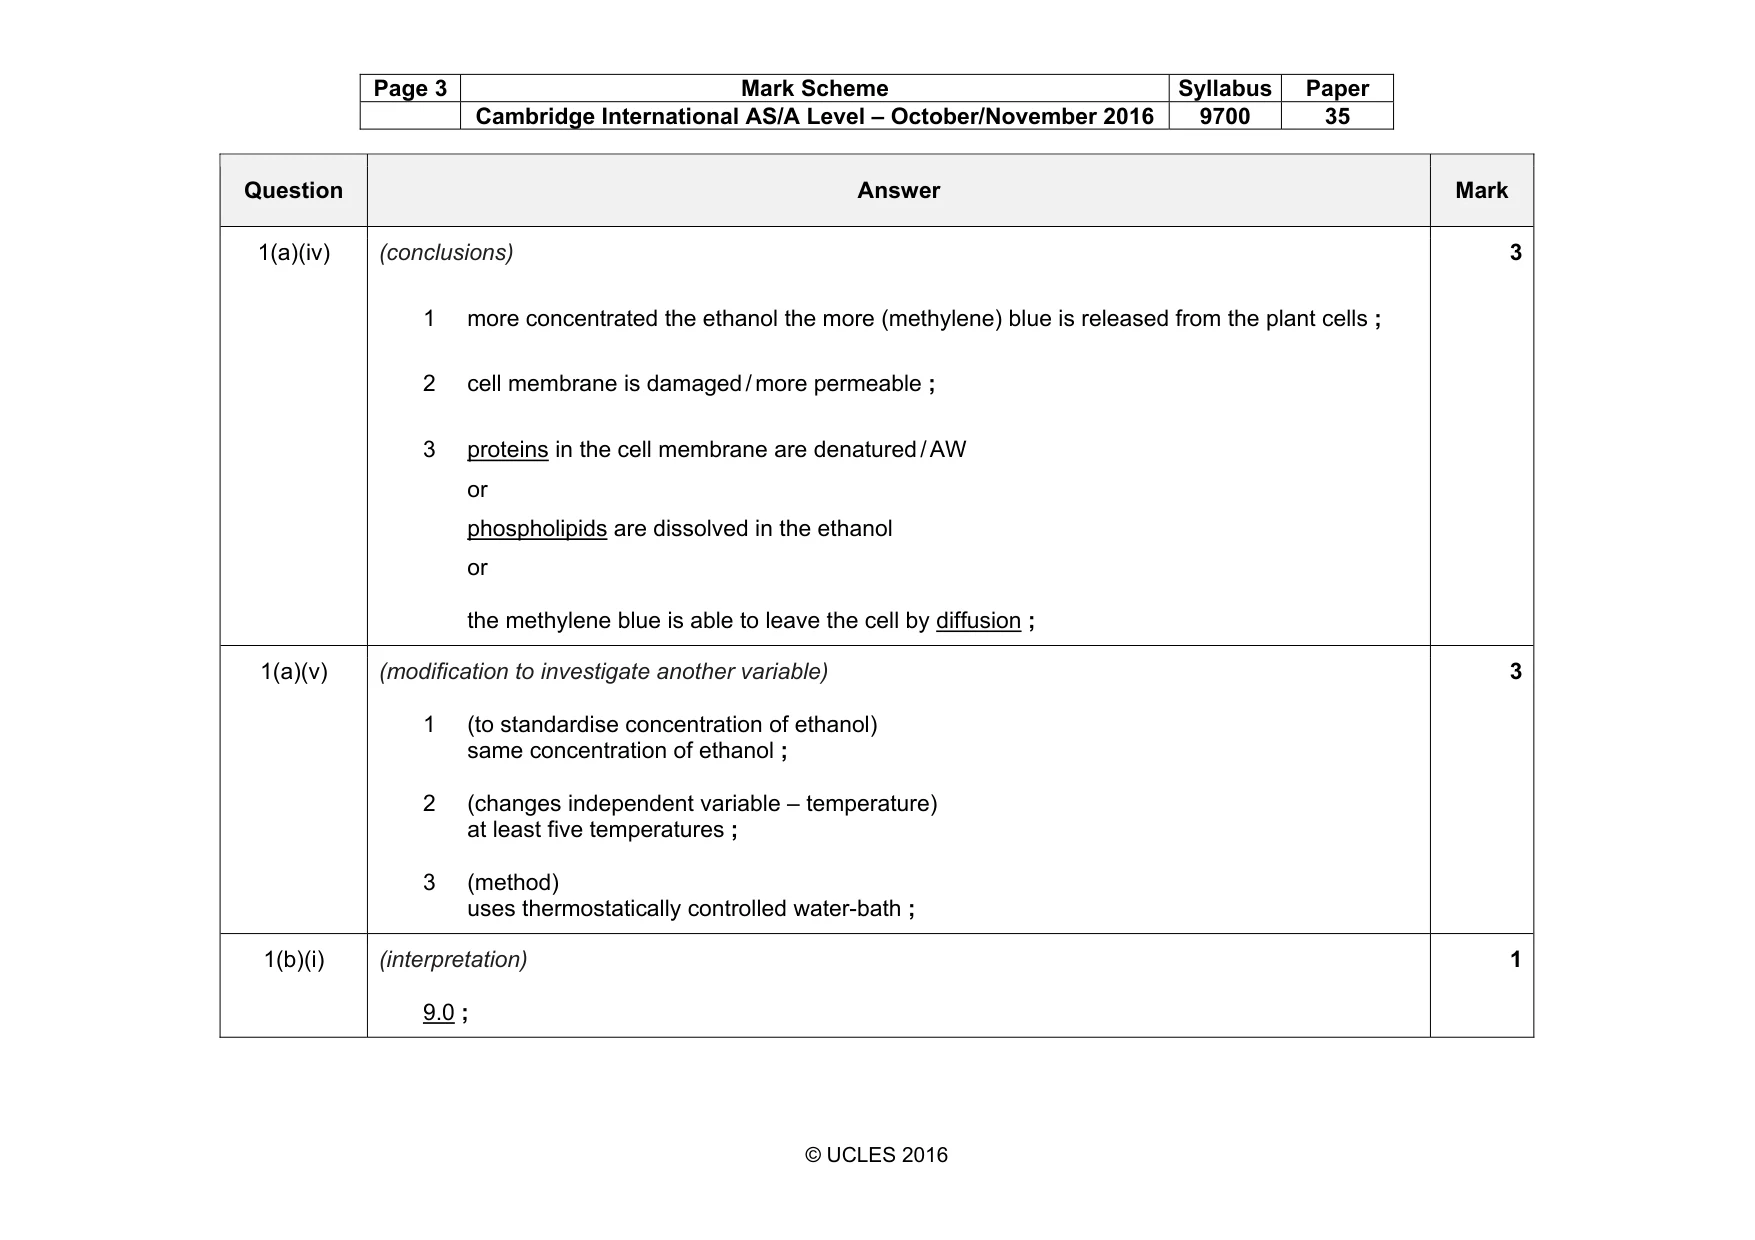
Page 3 Mark Scheme Syllabus Paper Cambridge International AS/A Level – October/November 2016 9700 35 © UCLES 2016 Question Answer Mark 1(a)(iv) (conclusions) 1 more concentrated the ethanol the more (methylene) blue is released from the plant cells ; 2 cell membrane is damaged / more permeable ; 3 proteins in the cell membrane are denatured / AW or phospholipids are dissolved in the ethanol or the methylene blue is able to leave the cell by diffusion ; 3 1(a)(v) (modification to investigate another variable) 1 (to standardise concentration of ethanol) same concentration of ethanol ; 2 (changes independent variable – temperature) at least five temperatures ; 3 (method) uses thermostatically controlled water-bath ; 3 1(b)(i) (interpretation) 9.0 ; 1
Mark scheme, page 4
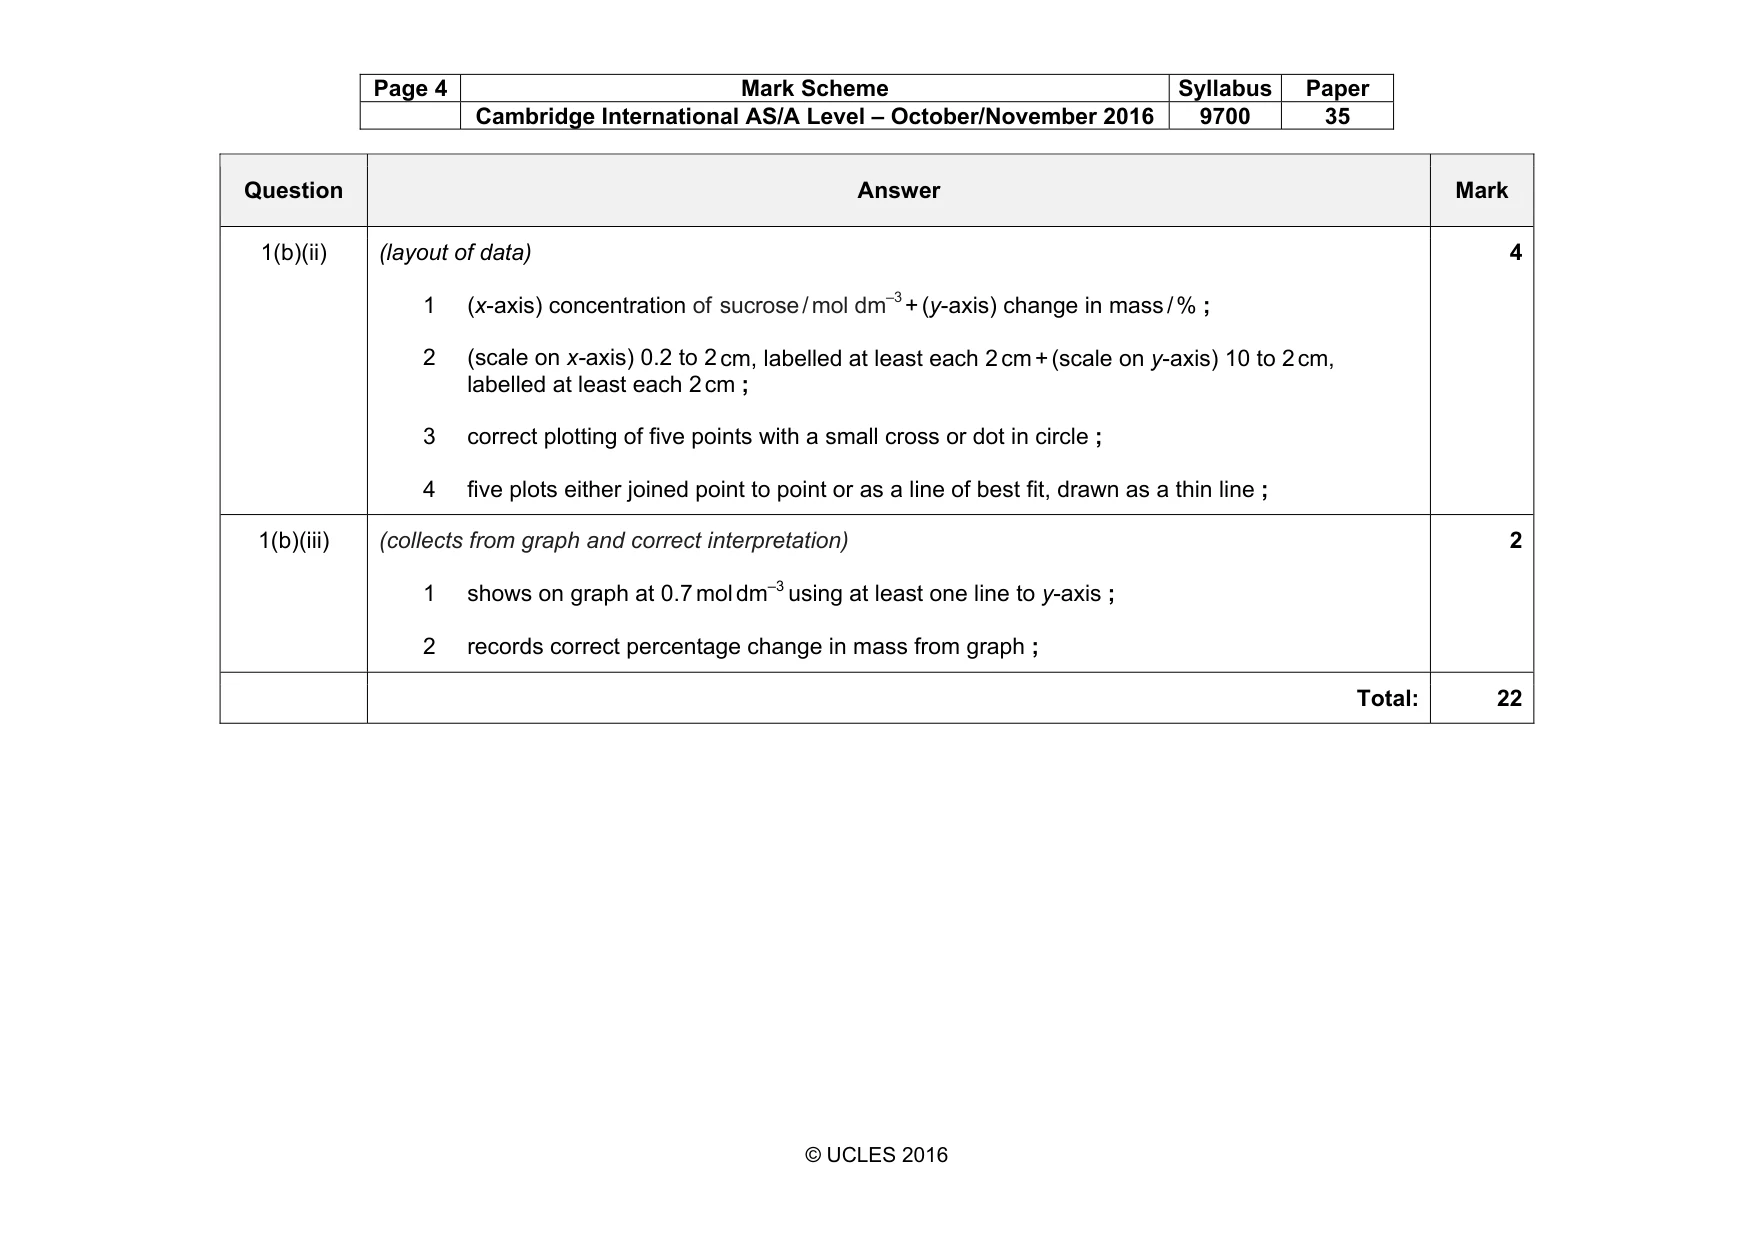
Page 4 Mark Scheme Syllabus Paper Cambridge International AS/A Level – October/November 2016 9700 35 © UCLES 2016 Question Answer Mark 1(b)(ii) (layout of data) 1 (x-axis) concentration of sucrose / mol dm–3 + (y-axis) change in mass / % ; 2 (scale on x-axis) 0.2 to 2 cm, labelled at least each 2 cm + (scale on y-axis) 10 to 2 cm, labelled at least each 2 cm ; 3 correct plotting of five points with a small cross or dot in circle ; 4 five plots either joined point to point or as a line of best fit, drawn as a thin line ; 4 1(b)(iii) (collects from graph and correct interpretation) 1 shows on graph at 0.7 mol dm–3 using at least one line to y-axis ; 2 records correct percentage change in mass from graph ; 2 Total: 22
Mark scheme, page 5
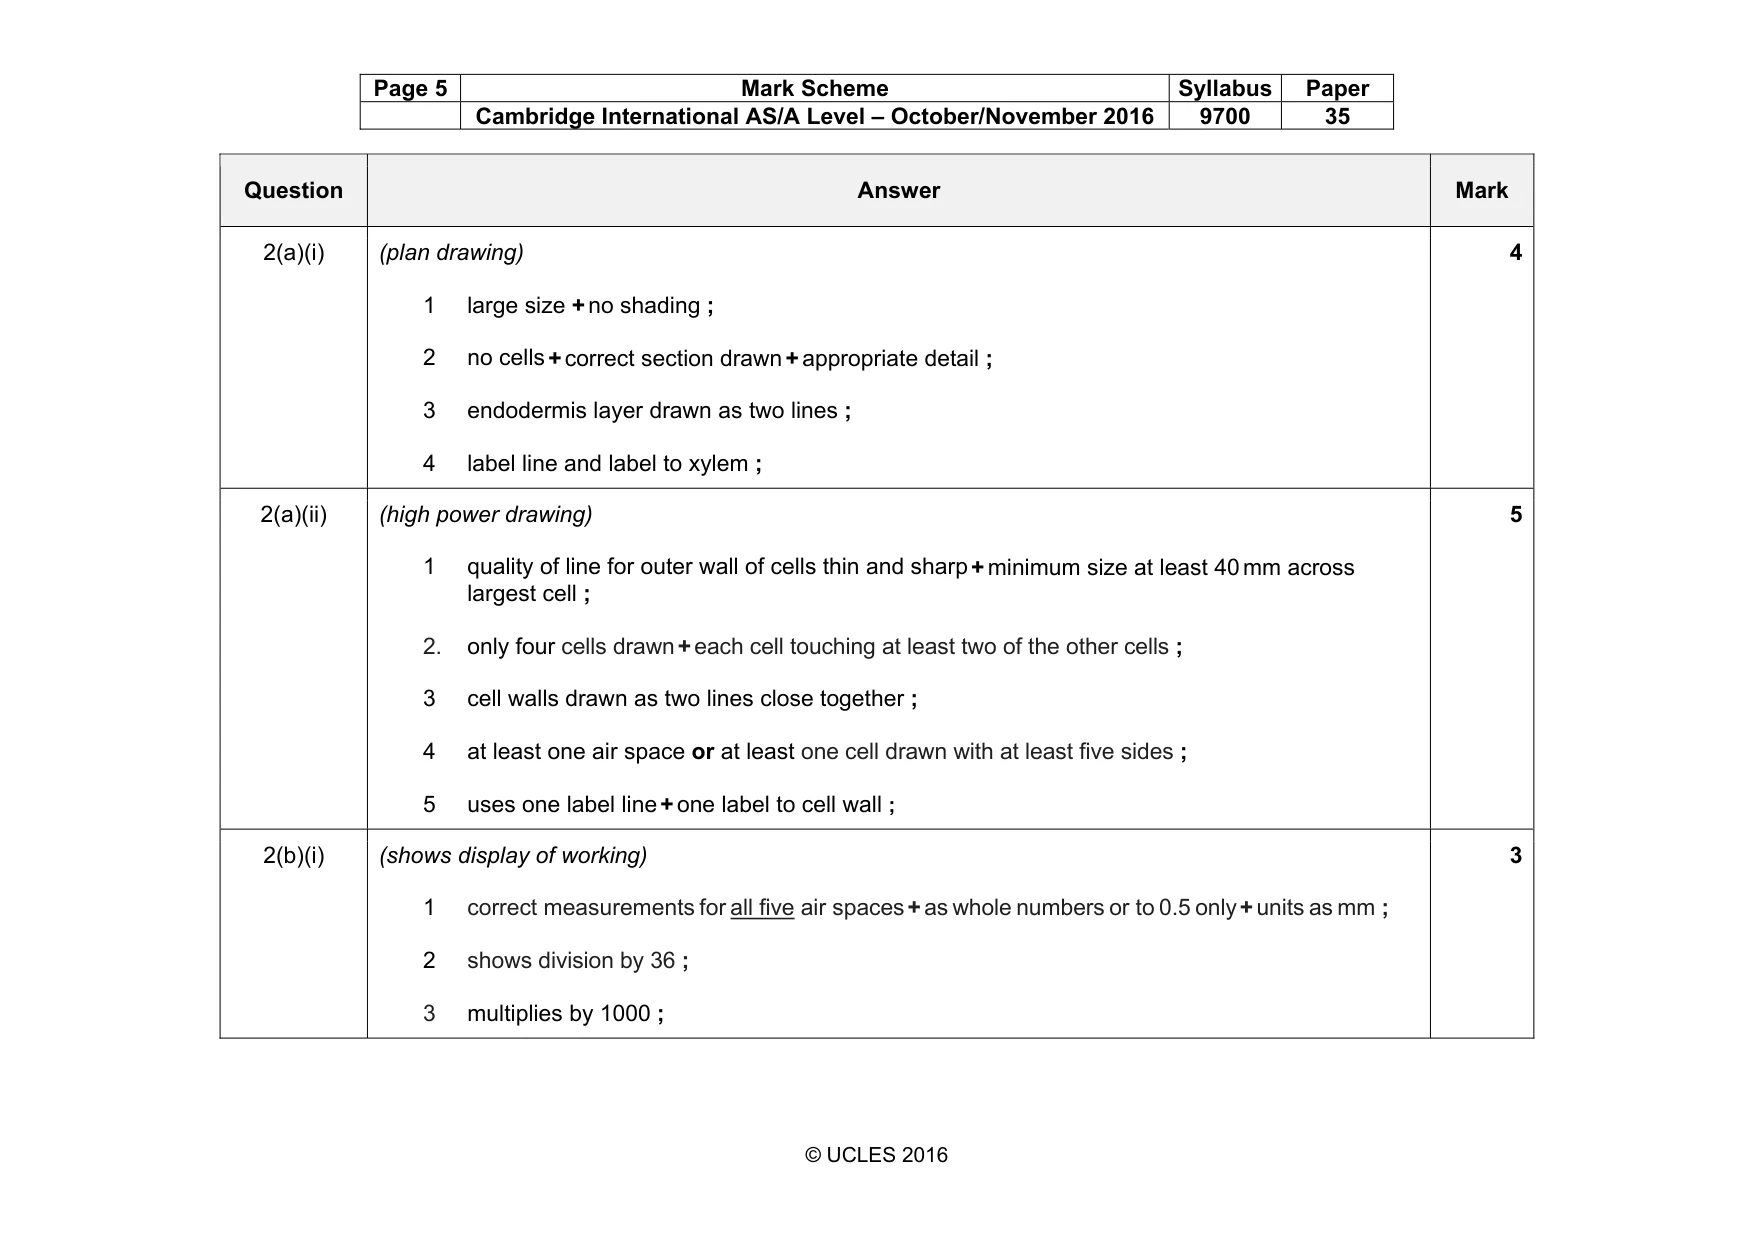
Page 5 Mark Scheme Syllabus Paper Cambridge International AS/A Level – October/November 2016 9700 35 © UCLES 2016 Question Answer Mark 2(a)(i) (plan drawing) 1 large size + no shading ; 2 no cells + correct section drawn + appropriate detail ; 3 endodermis layer drawn as two lines ; 4 label line and label to xylem ; 4 2(a)(ii) (high power drawing) 1 quality of line for outer wall of cells thin and sharp + minimum size at least 40 mm across largest cell ; 2. only four cells drawn + each cell touching at least two of the other cells ; 3 cell walls drawn as two lines close together ; 4 at least one air space or at least one cell drawn with at least five sides ; 5 uses one label line + one label to cell wall ; 5 2(b)(i) (shows display of working) 1 correct measurements for all five air spaces + as whole numbers or to 0.5 only + units as mm ; 2 shows division by 36 ; 3 multiplies by 1000 ; 3
Mark scheme, page 6
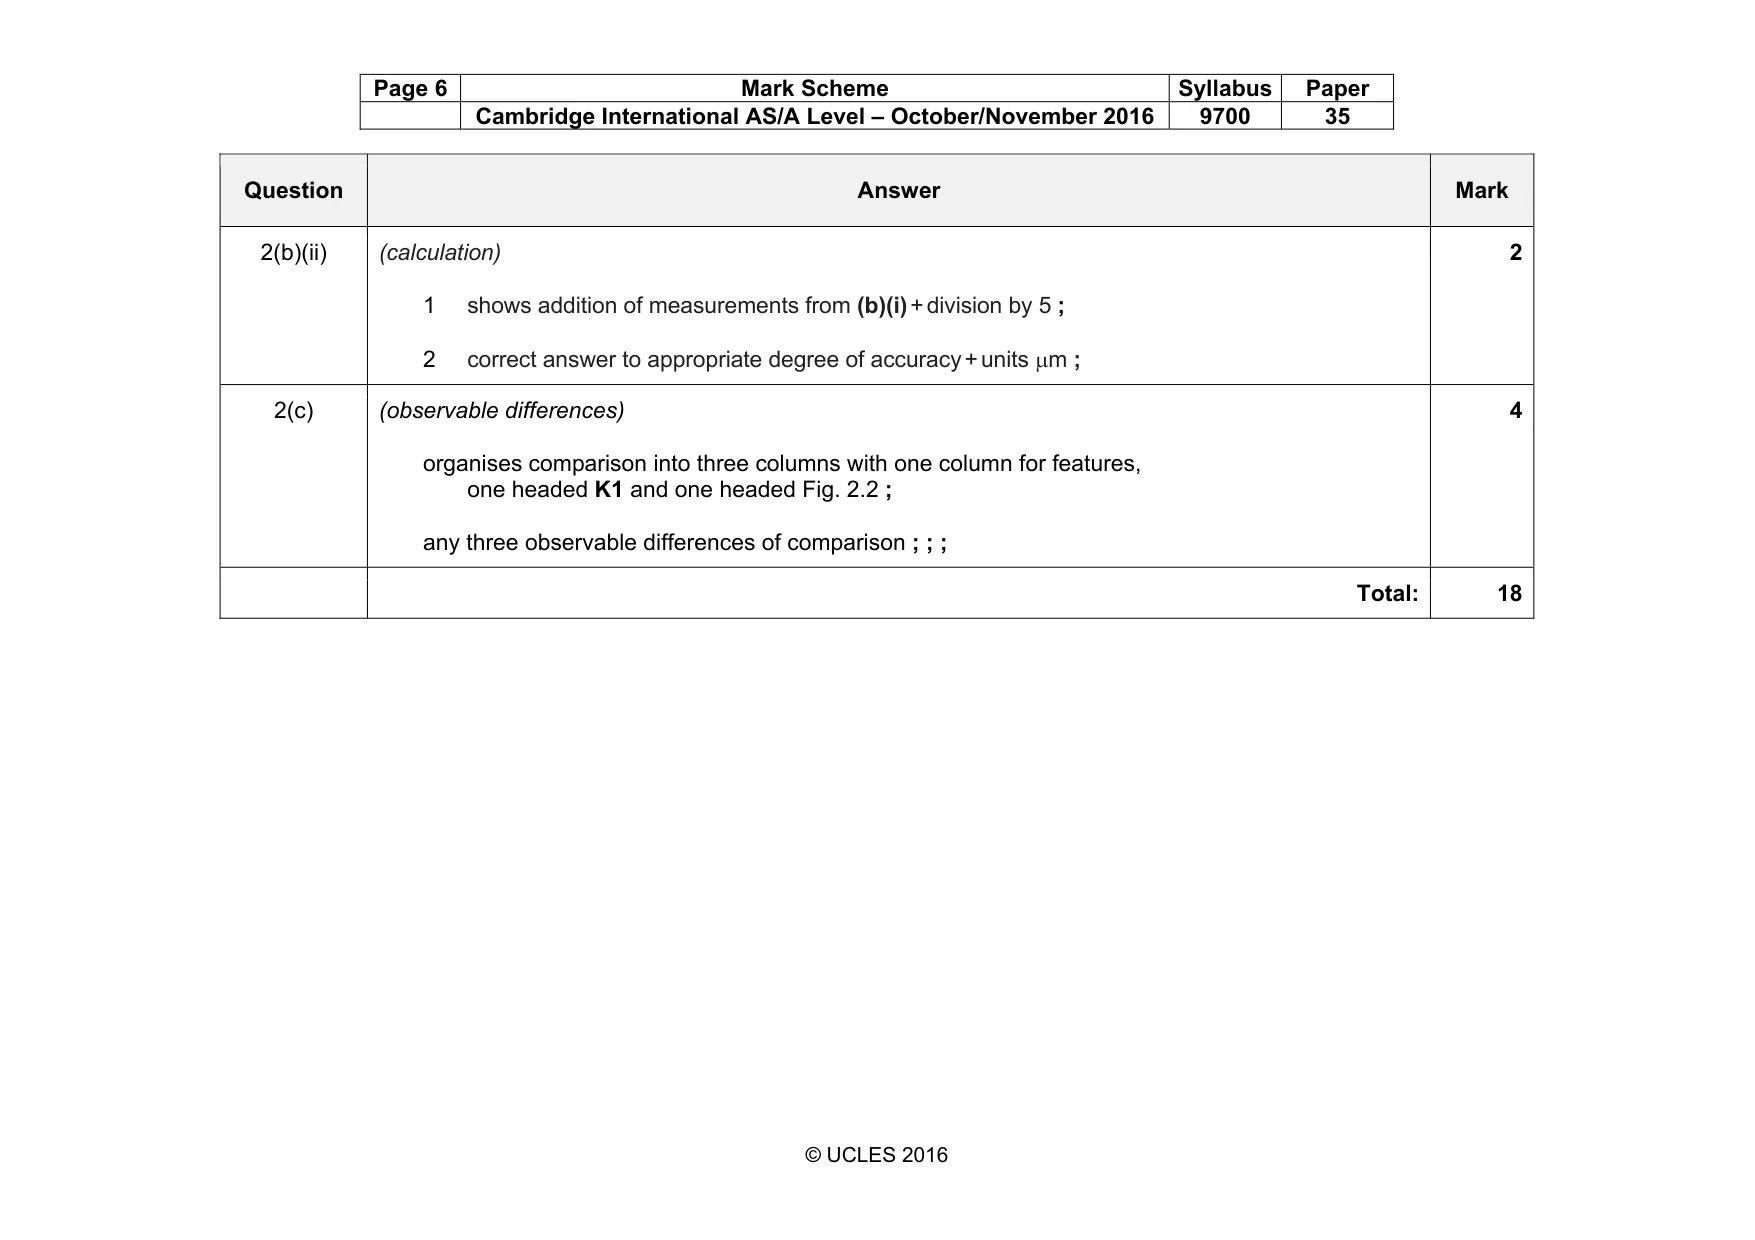
Page 6 Mark Scheme Syllabus Paper Cambridge International AS/A Level – October/November 2016 9700 35 © UCLES 2016 Question Answer Mark 2(b)(ii) (calculation) 1 shows addition of measurements from (b)(i) + division by 5 ; 2 correct answer to appropriate degree of accuracy + units µm ; 2 2(c) (observable differences) organises comparison into three columns with one column for features, one headed K1 and one headed Fig. 2.2 ; any three observable differences of comparison ; ; ; 4 Total: 18
What you needed in this session
Cambridge’s own grade thresholds for 2016 Oct/Nov, Paper 3 · Variant 5. A higher threshold means an easier paper — the bar moves with how the cohort did.