Cambridge A Level Biology 9700 — 2015 May/June Paper 3 · Variant 3
9700/33/M/J/15 · 40 marks · ≈45 min
The question paper and its mark scheme, free to read here and free to download. This is Cambridge’s own paper, exactly as it was sat.
Question paper16 pages



Mark scheme4 pages
Answers below. Sit the paper first if you are practising.
Paper as text
Question paper, page 1
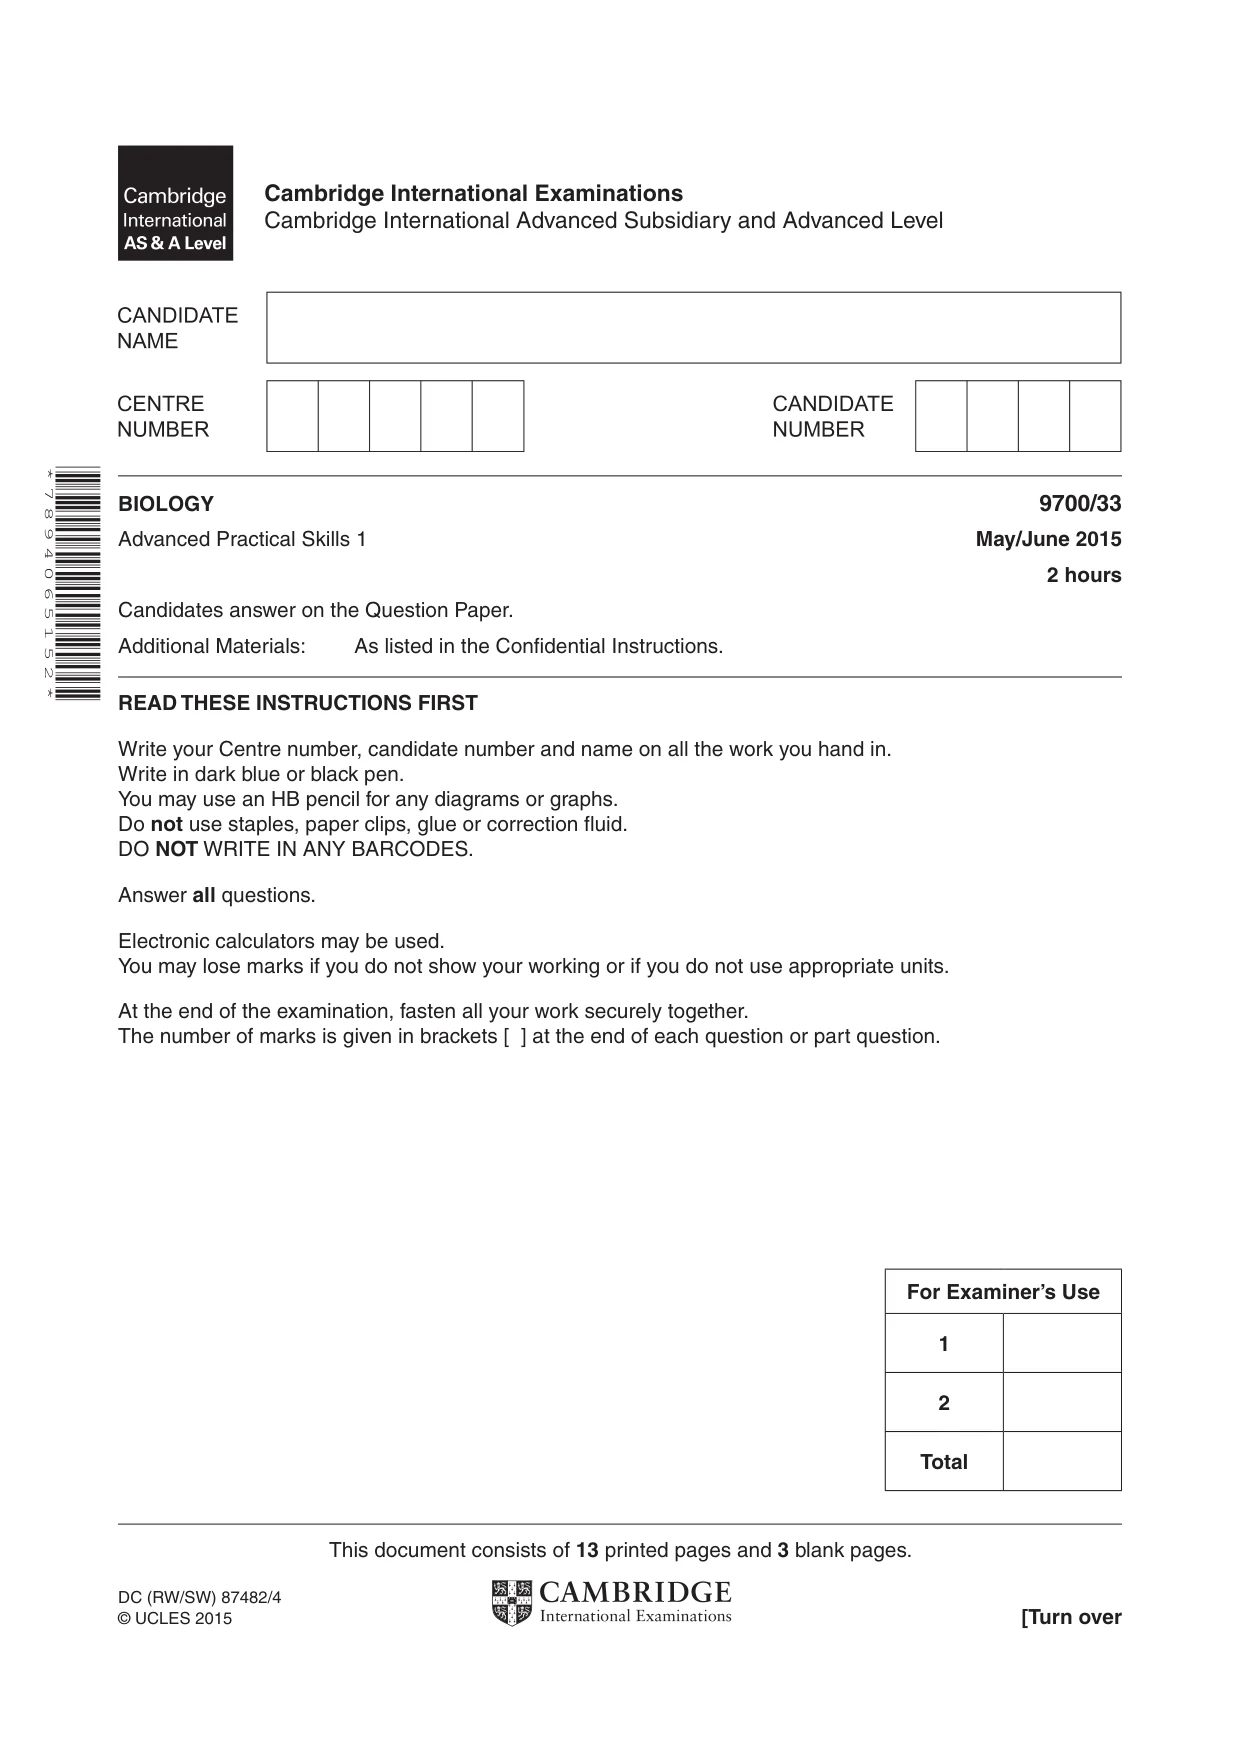
This document consists of 13 printed pages and 3 blank pages. DC (RW/SW) 87482/4 © UCLES 2015 [Turn over Cambridge International Examinations Cambridge International Advanced Subsidiary and Advanced Level * 7 8 9 4 0 6 5 1 5 2 * BIOLOGY 9700/33 Advanced Practical Skills 1 May/June 2015 2 hours Candidates answer on the Question Paper. Additional Materials: As listed in the Confidential Instructions. READ THESE INSTRUCTIONS FIRST Write your Centre number, candidate number and name on all the work you hand in. Write in dark blue or black pen. You may use an HB pencil for any diagrams or graphs. Do not use staples, paper clips, glue or correction fluid. DO NOT WRITE IN ANY BARCODES. Answer all questions. Electronic calculators may be used. You may lose marks if you do not show your working or if you do not use appropriate units. At the end of the examination, fasten all your work securely together. The number of marks is given in brackets [ ] at the end of each question or part question. For Examiner’s Use 1 2 Total
Question paper, page 2
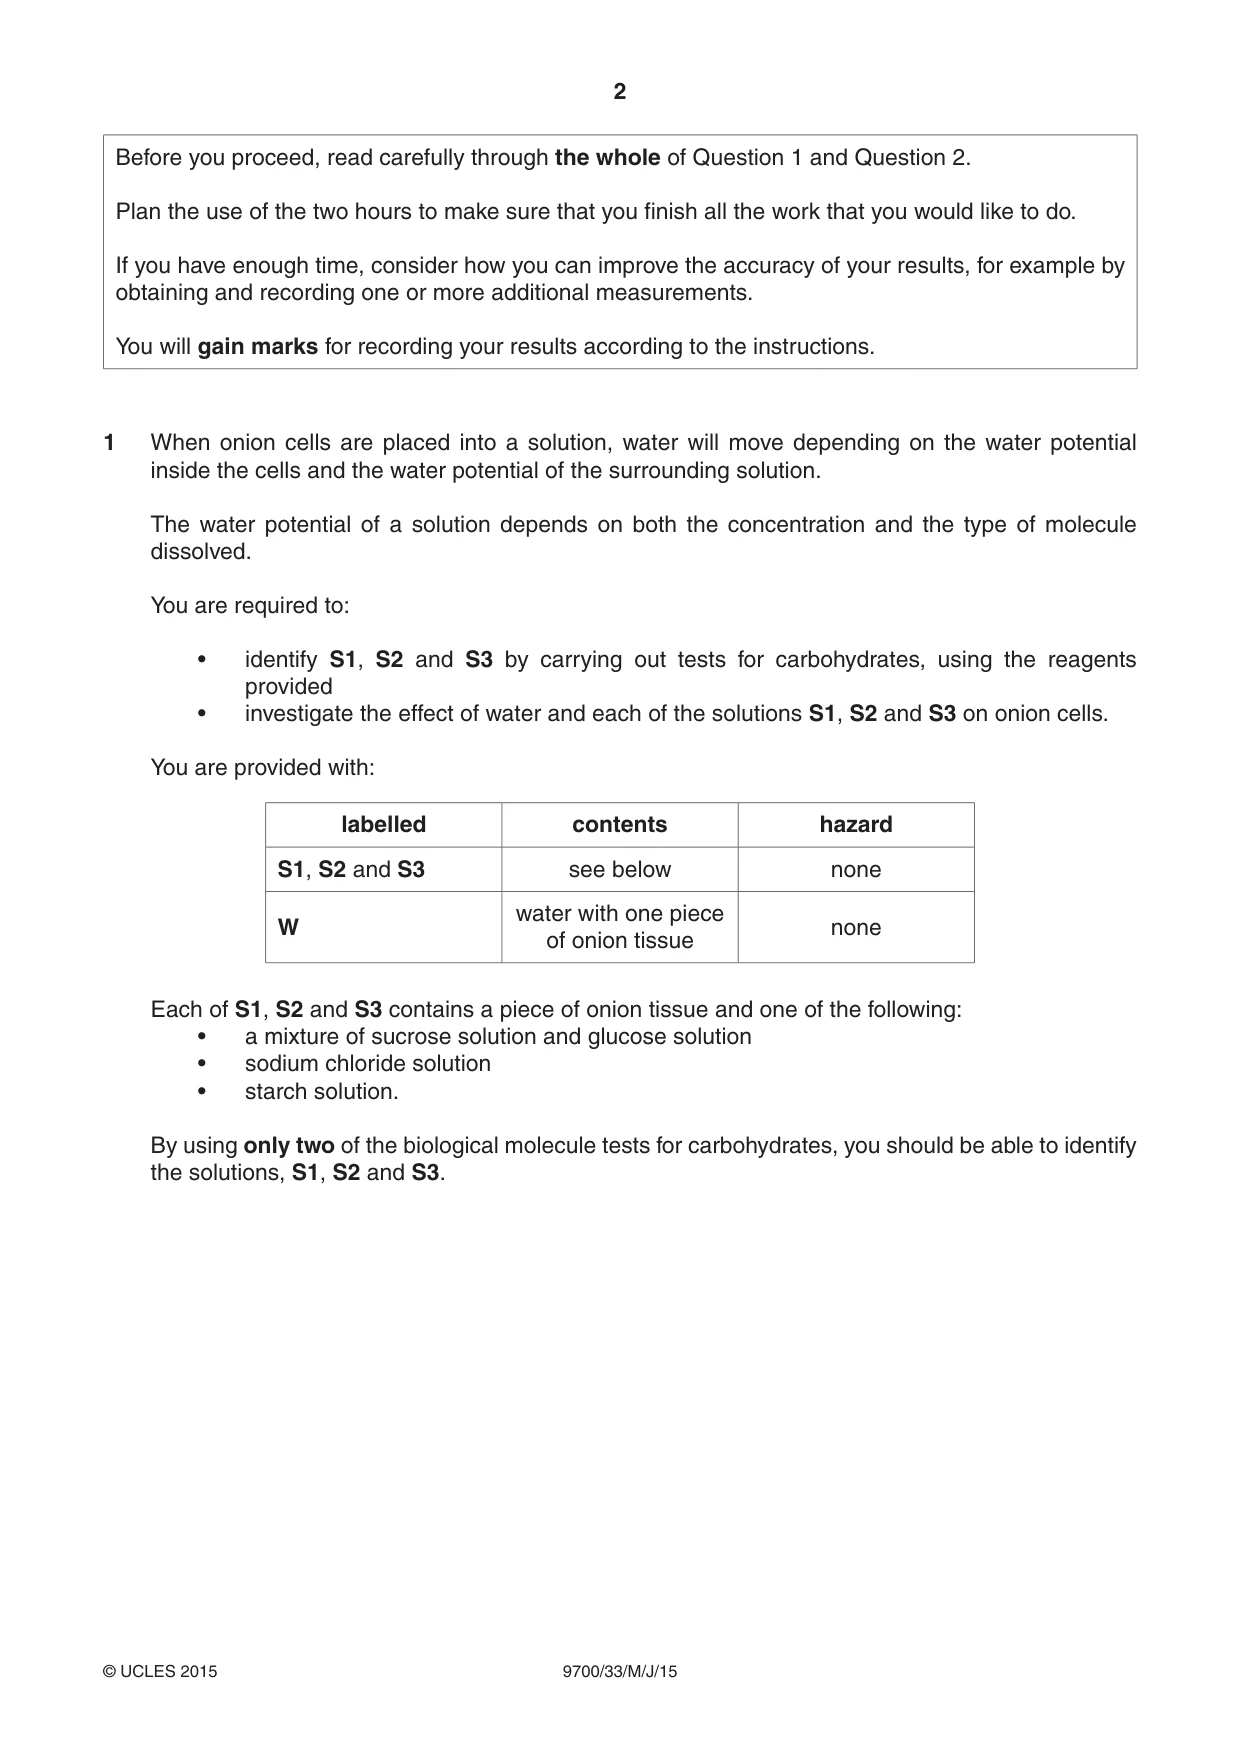
2 9700/33/M/J/15 © UCLES 2015 Before you proceed, read carefully through the whole of Question 1 and Question 2. Plan the use of the two hours to make sure that you finish all the work that you would like to do. If you have enough time, consider how you can improve the accuracy of your results, for example by obtaining and recording one or more additional measurements. You will gain marks for recording your results according to the instructions. 1 When onion cells are placed into a solution, water will move depending on the water potential inside the cells and the water potential of the surrounding solution. The water potential of a solution depends on both the concentration and the type of molecule dissolved. You are required to: • identify S1, S2 and S3 by carrying out tests for carbohydrates, using the reagents provided • investigate the effect of water and each of the solutions S1, S2 and S3 on onion cells. You are provided with: labelled contents hazard S1, S2 and S3 see below none W water with one piece of onion tissue none Each of S1, S2 and S3 contains a piece of onion tissue and one of the following: • a mixture of sucrose solution and glucose solution • sodium chloride solution • starch solution. By using only two of the biological molecule tests for carbohydrates, you should be able to identify the solutions, S1, S2 and S3.
Question paper, page 3
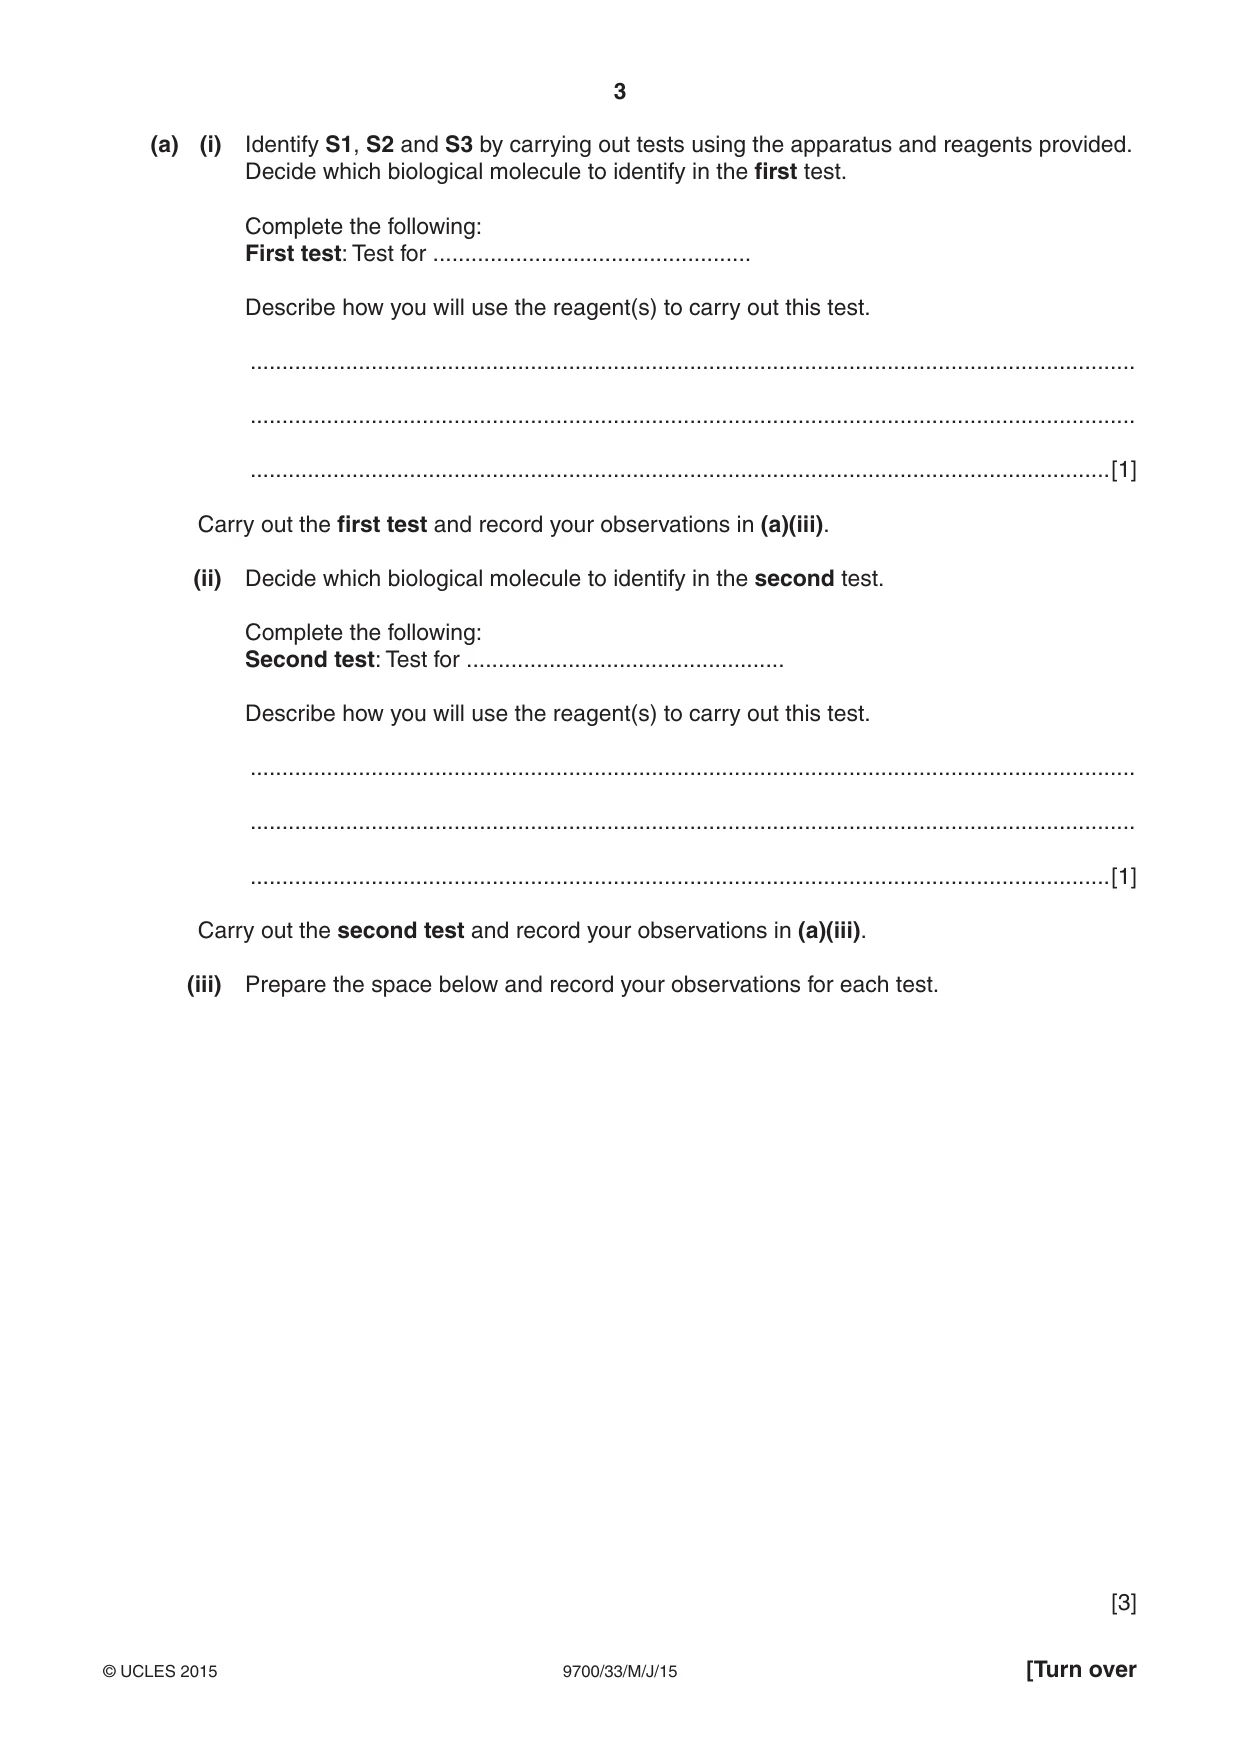
3 9700/33/M/J/15 © UCLES 2015 [Turn over (a) (i) Identify S1, S2 and S3 by carrying out tests using the apparatus and reagents provided. Decide which biological molecule to identify in the first test. Complete the following: First test: Test for … Describe how you will use the reagent(s) to carry out this test. … … …[1] Carry out the first test and record your observations in (a)(iii). (ii) Decide which biological molecule to identify in the second test. Complete the following: Second test: Test for … Describe how you will use the reagent(s) to carry out this test. … … …[1] Carry out the second test and record your observations in (a)(iii). (iii) Prepare the space below and record your observations for each test. [3]
Question paper, page 4
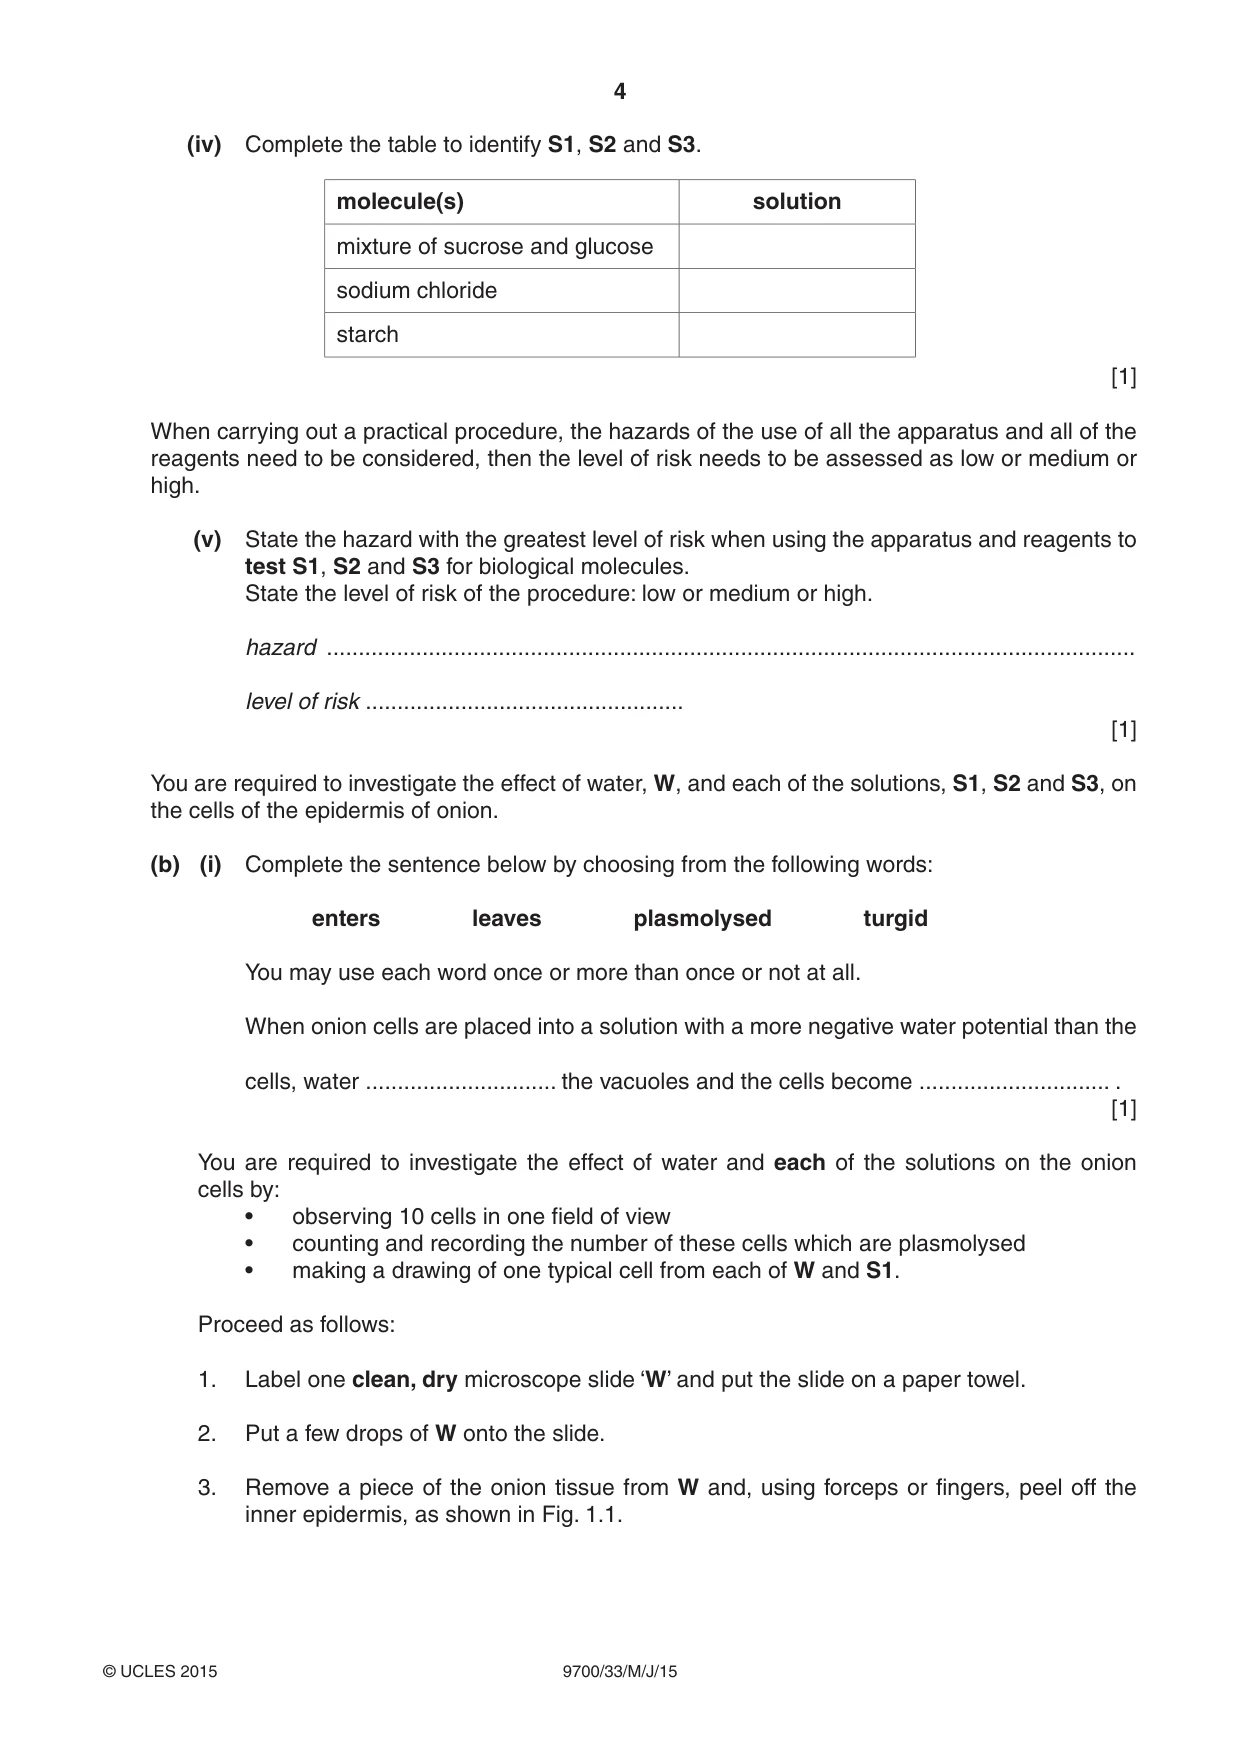
4 9700/33/M/J/15 © UCLES 2015 (iv) Complete the table to identify S1, S2 and S3. molecule(s) solution mixture of sucrose and glucose sodium chloride starch [1] When carrying out a practical procedure, the hazards of the use of all the apparatus and all of the reagents need to be considered, then the level of risk needs to be assessed as low or medium or high. (v) State the hazard with the greatest level of risk when using the apparatus and reagents to test S1, S2 and S3 for biological molecules. State the level of risk of the procedure: low or medium or high. hazard … level of risk … [1] You are required to investigate the effect of water, W, and each of the solutions, S1, S2 and S3, on the cells of the epidermis of onion. (b) (i) Complete the sentence below by choosing from the following words: enters leaves plasmolysed turgid You may use each word once or more than once or not at all. When onion cells are placed into a solution with a more negative water potential than the cells, water … the vacuoles and the cells become … . [1] You are required to investigate the effect of water and each of the solutions on the onion cells by: • observing 10 cells in one field of view • counting and recording the number of these cells which are plasmolysed • making a drawing of one typical cell from each of W and S1. Proceed as follows: 1. Label one clean, dry microscope slide ‘W’ and put the slide on a paper towel. 2. Put a few drops of W onto the slide. 3. Remove a piece of the onion tissue from W and, using forceps or fingers, peel off the inner epidermis, as shown in Fig. 1.1.
Question paper, page 5
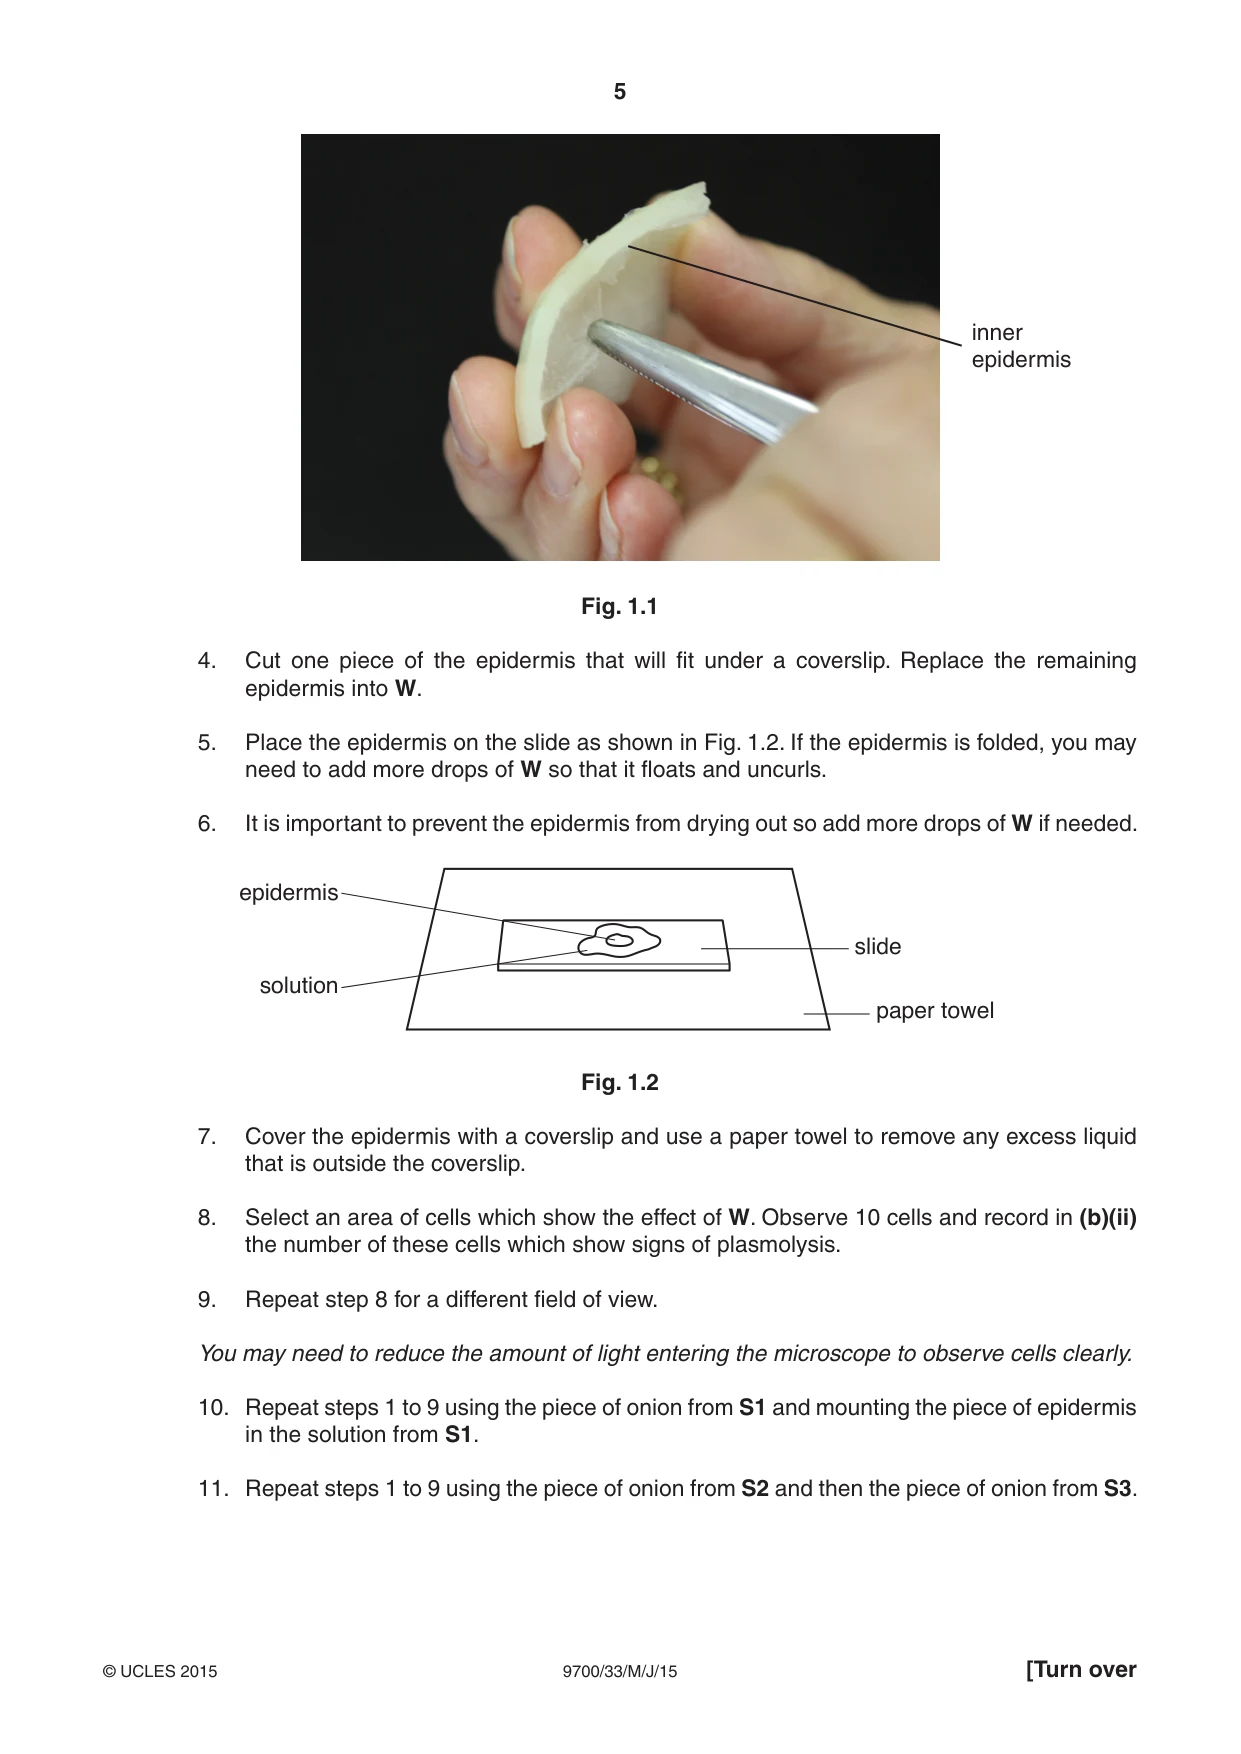
5 9700/33/M/J/15 © UCLES 2015 [Turn over inner epidermis Fig. 1.1 4. Cut one piece of the epidermis that will fit under a coverslip. Replace the remaining epidermis into W. 5. Place the epidermis on the slide as shown in Fig. 1.2. If the epidermis is folded, you may need to add more drops of W so that it floats and uncurls. 6. It is important to prevent the epidermis from drying out so add more drops of W if needed. epidermis solution slide paper towel Fig. 1.2 7. Cover the epidermis with a coverslip and use a paper towel to remove any excess liquid that is outside the coverslip. 8. Select an area of cells which show the effect of W. Observe 10 cells and record in (b)(ii) the number of these cells which show signs of plasmolysis. 9. Repeat step 8 for a different field of view. You may need to reduce the amount of light entering the microscope to observe cells clearly. 10. Repeat steps 1 to 9 using the piece of onion from S1 and mounting the piece of epidermis in the solution from S1. 11. Repeat steps 1 to 9 using the piece of onion from S2 and then the piece of onion from S3.
Question paper, page 6
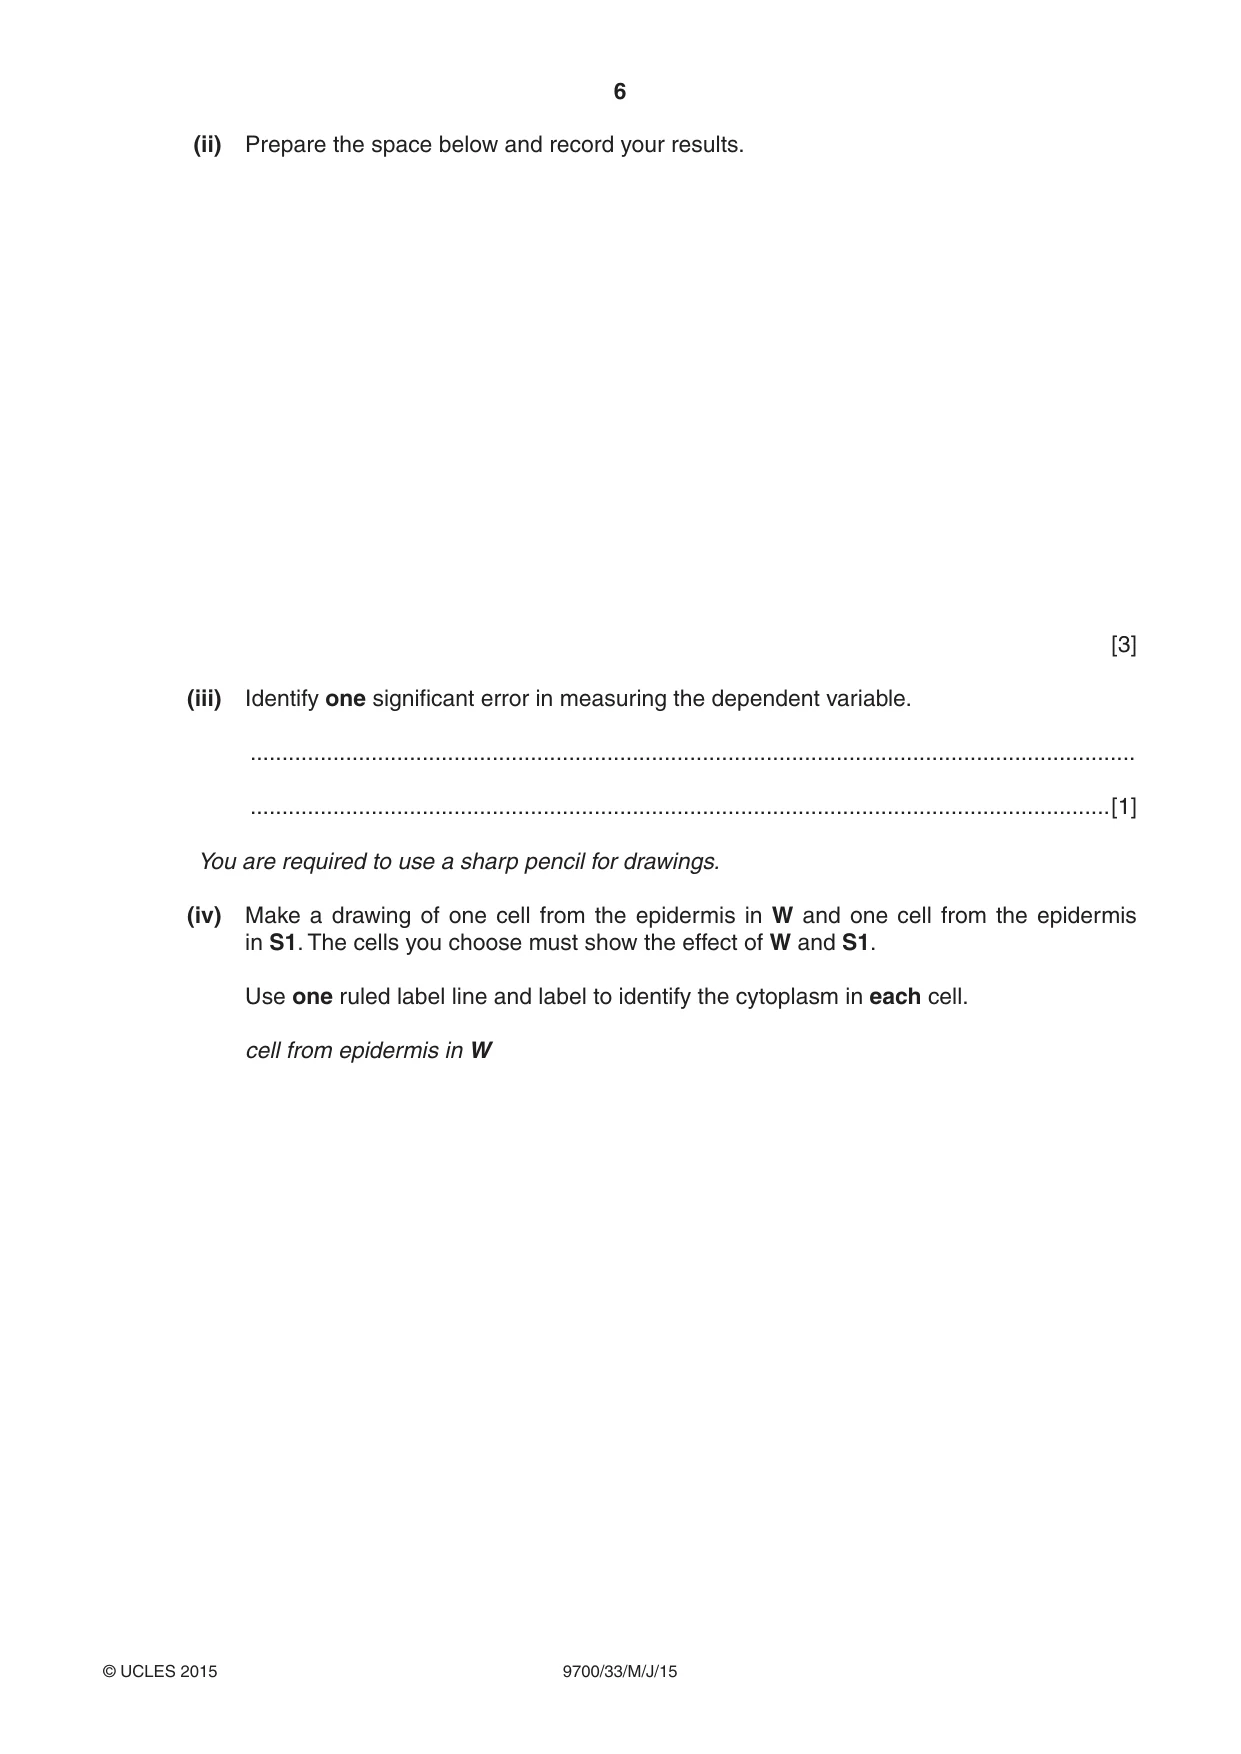
6 9700/33/M/J/15 © UCLES 2015 (ii) Prepare the space below and record your results. [3] (iii) Identify one significant error in measuring the dependent variable. … …[1] You are required to use a sharp pencil for drawings. (iv) Make a drawing of one cell from the epidermis in W and one cell from the epidermis in S1. The cells you choose must show the effect of W and S1. Use one ruled label line and label to identify the cytoplasm in each cell. cell from epidermis in W
Question paper, page 7
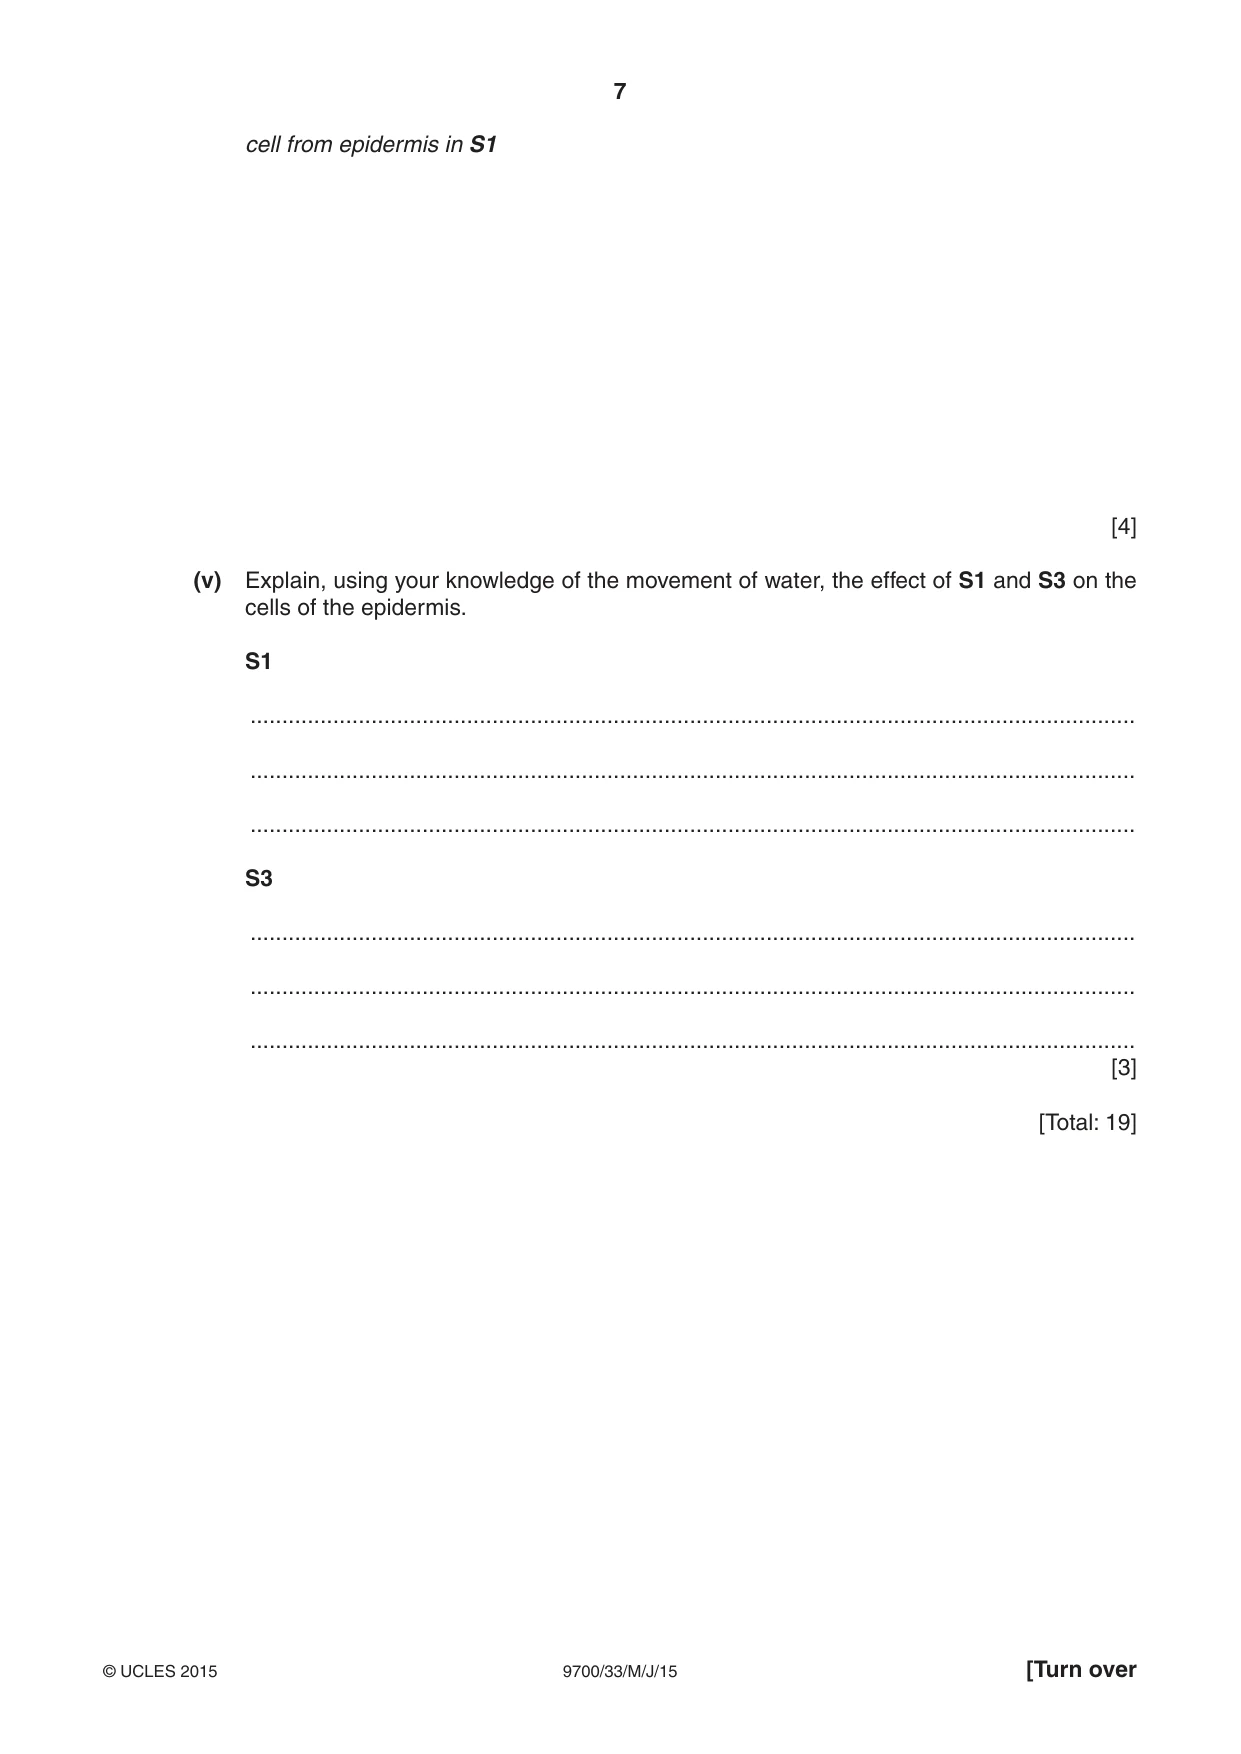
7 9700/33/M/J/15 © UCLES 2015 [Turn over cell from epidermis in S1 [4] (v) Explain, using your knowledge of the movement of water, the effect of S1 and S3 on the cells of the epidermis. S1 … … … S3 … … … [3] [Total: 19]
Question paper, page 8
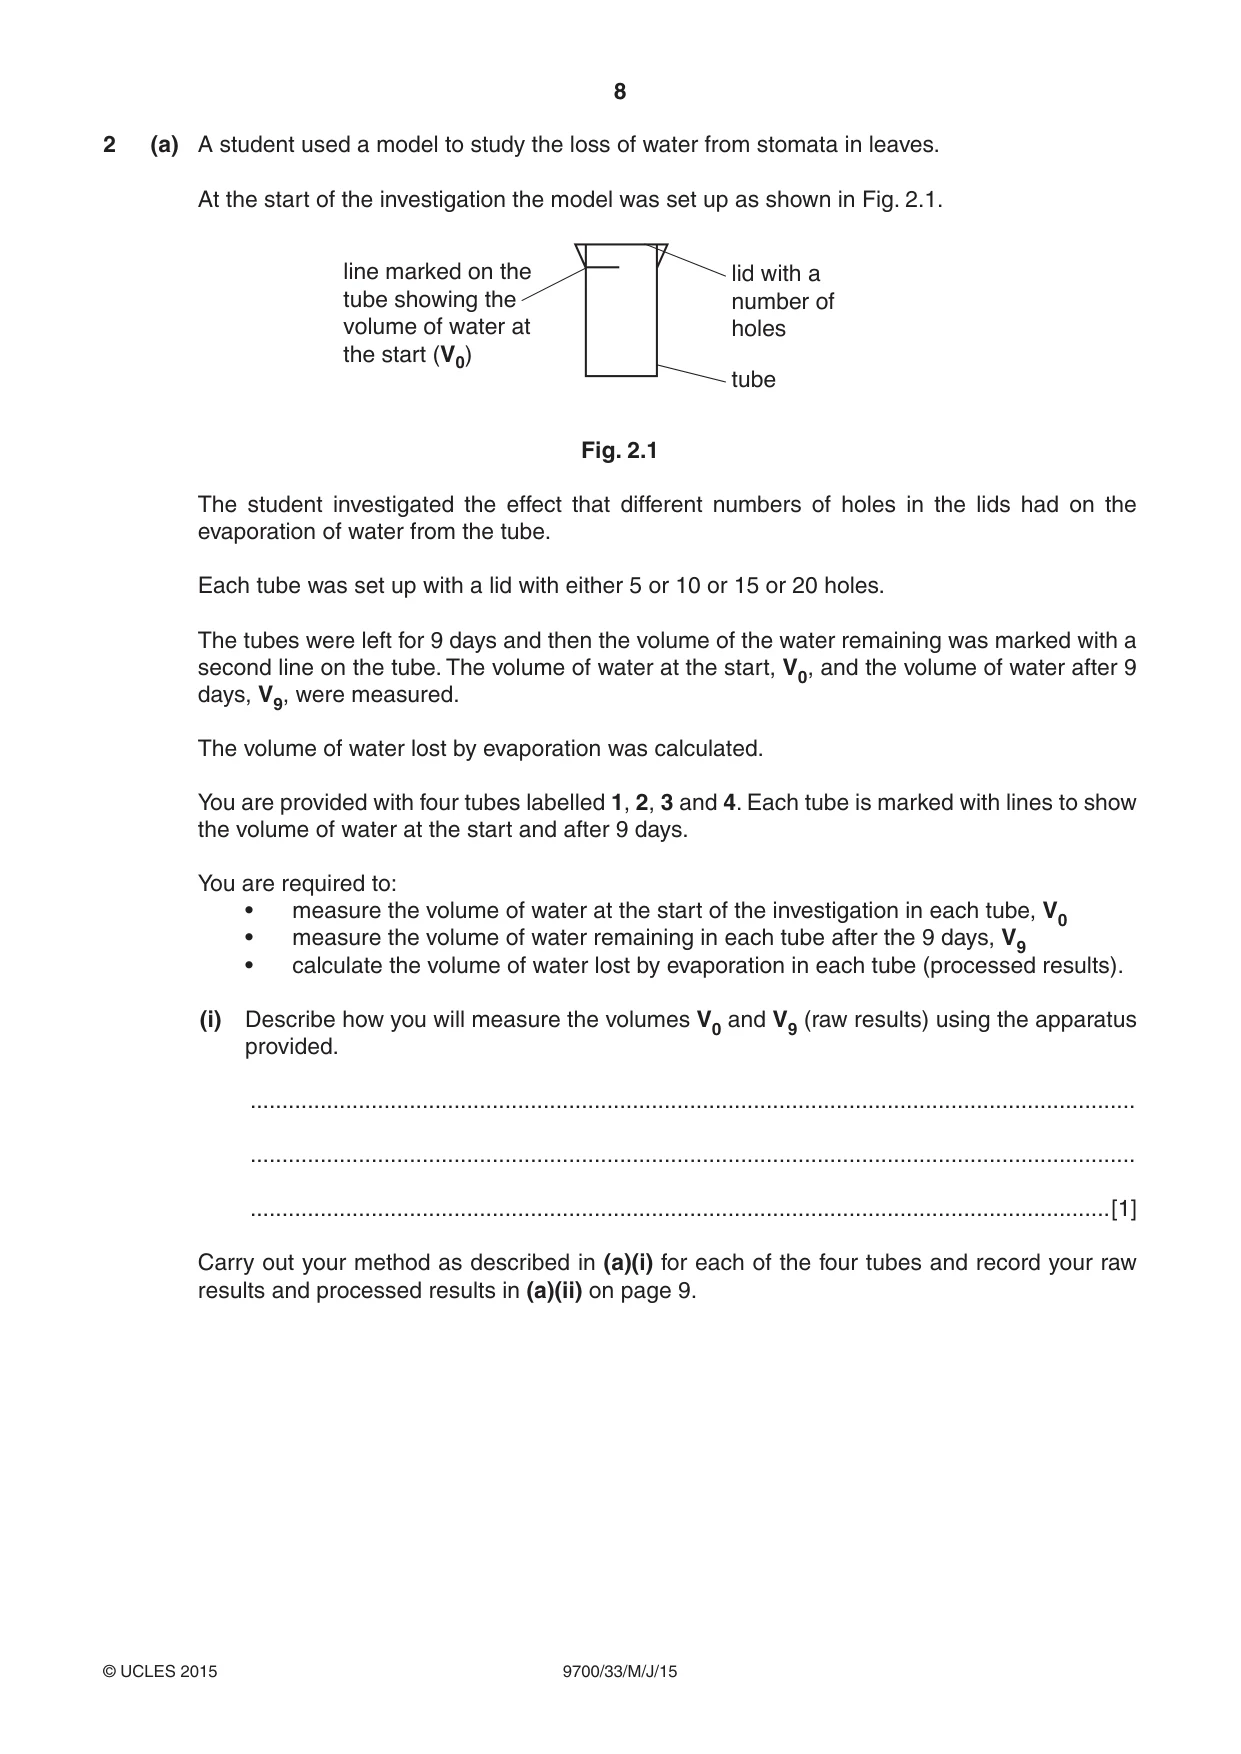
8 9700/33/M/J/15 © UCLES 2015 2 (a) A student used a model to study the loss of water from stomata in leaves. At the start of the investigation the model was set up as shown in Fig. 2.1. lid with a number of holes line marked on the tube showing the volume of water at the start (V0) tube Fig. 2.1 The student investigated the effect that different numbers of holes in the lids had on the evaporation of water from the tube. Each tube was set up with a lid with either 5 or 10 or 15 or 20 holes. The tubes were left for 9 days and then the volume of the water remaining was marked with a second line on the tube. The volume of water at the start, V0, and the volume of water after 9 days, V9, were measured. The volume of water lost by evaporation was calculated. You are provided with four tubes labelled 1, 2, 3 and 4. Each tube is marked with lines to show the volume of water at the start and after 9 days. You are required to: • measure the volume of water at the start of the investigation in each tube, V0 • measure the volume of water remaining in each tube after the 9 days, V9 • calculate the volume of water lost by evaporation in each tube (processed results). (i) Describe how you will measure the volumes V0 and V9 (raw results) using the apparatus provided. … … …[1] Carry out your method as described in (a)(i) for each of the four tubes and record your raw results and processed results in (a)(ii) on page 9.
Question paper, page 9
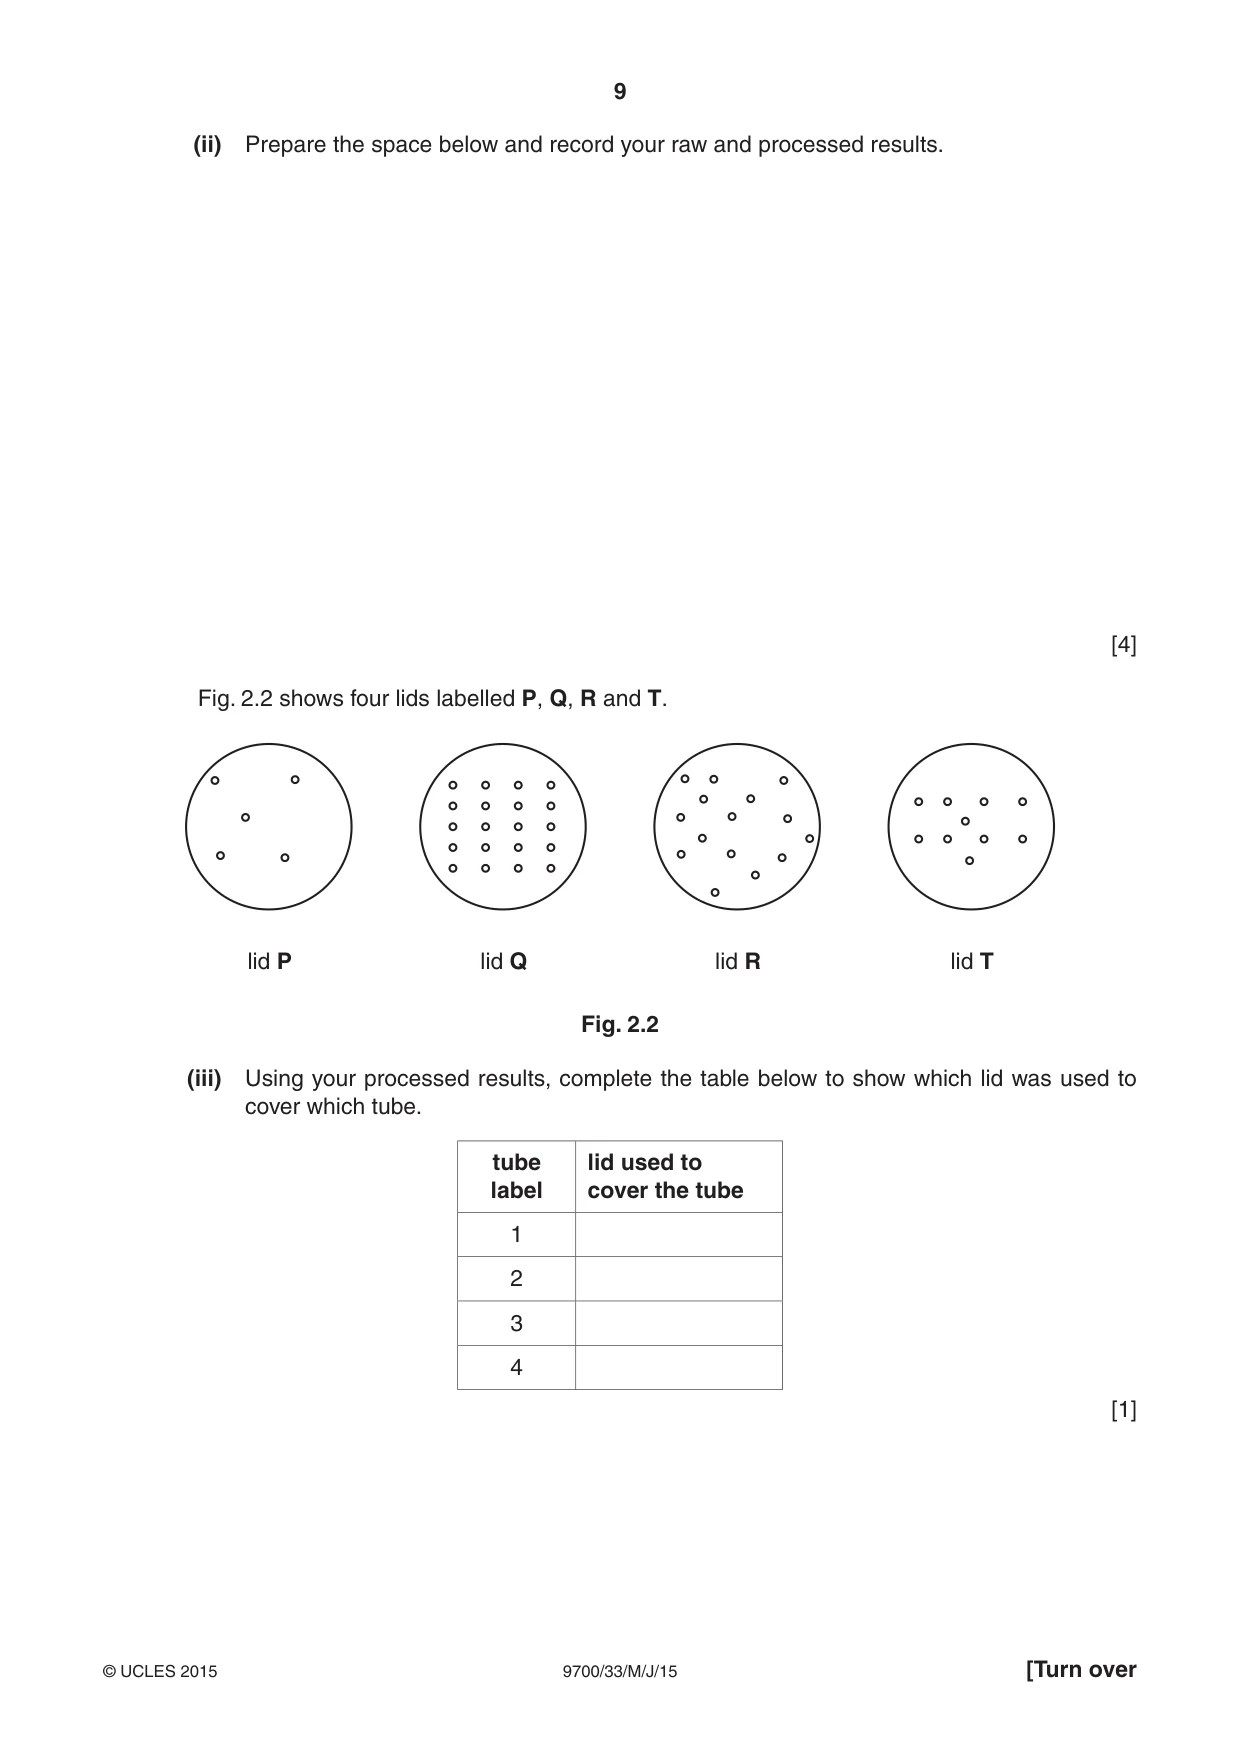
9 9700/33/M/J/15 © UCLES 2015 [Turn over (ii) Prepare the space below and record your raw and processed results. [4] Fig. 2.2 shows four lids labelled P, Q, R and T. lid P lid Q lid R lid T Fig. 2.2 (iii) Using your processed results, complete the table below to show which lid was used to cover which tube. tube label lid used to cover the tube 1 2 3 4 [1]
Question paper, page 10
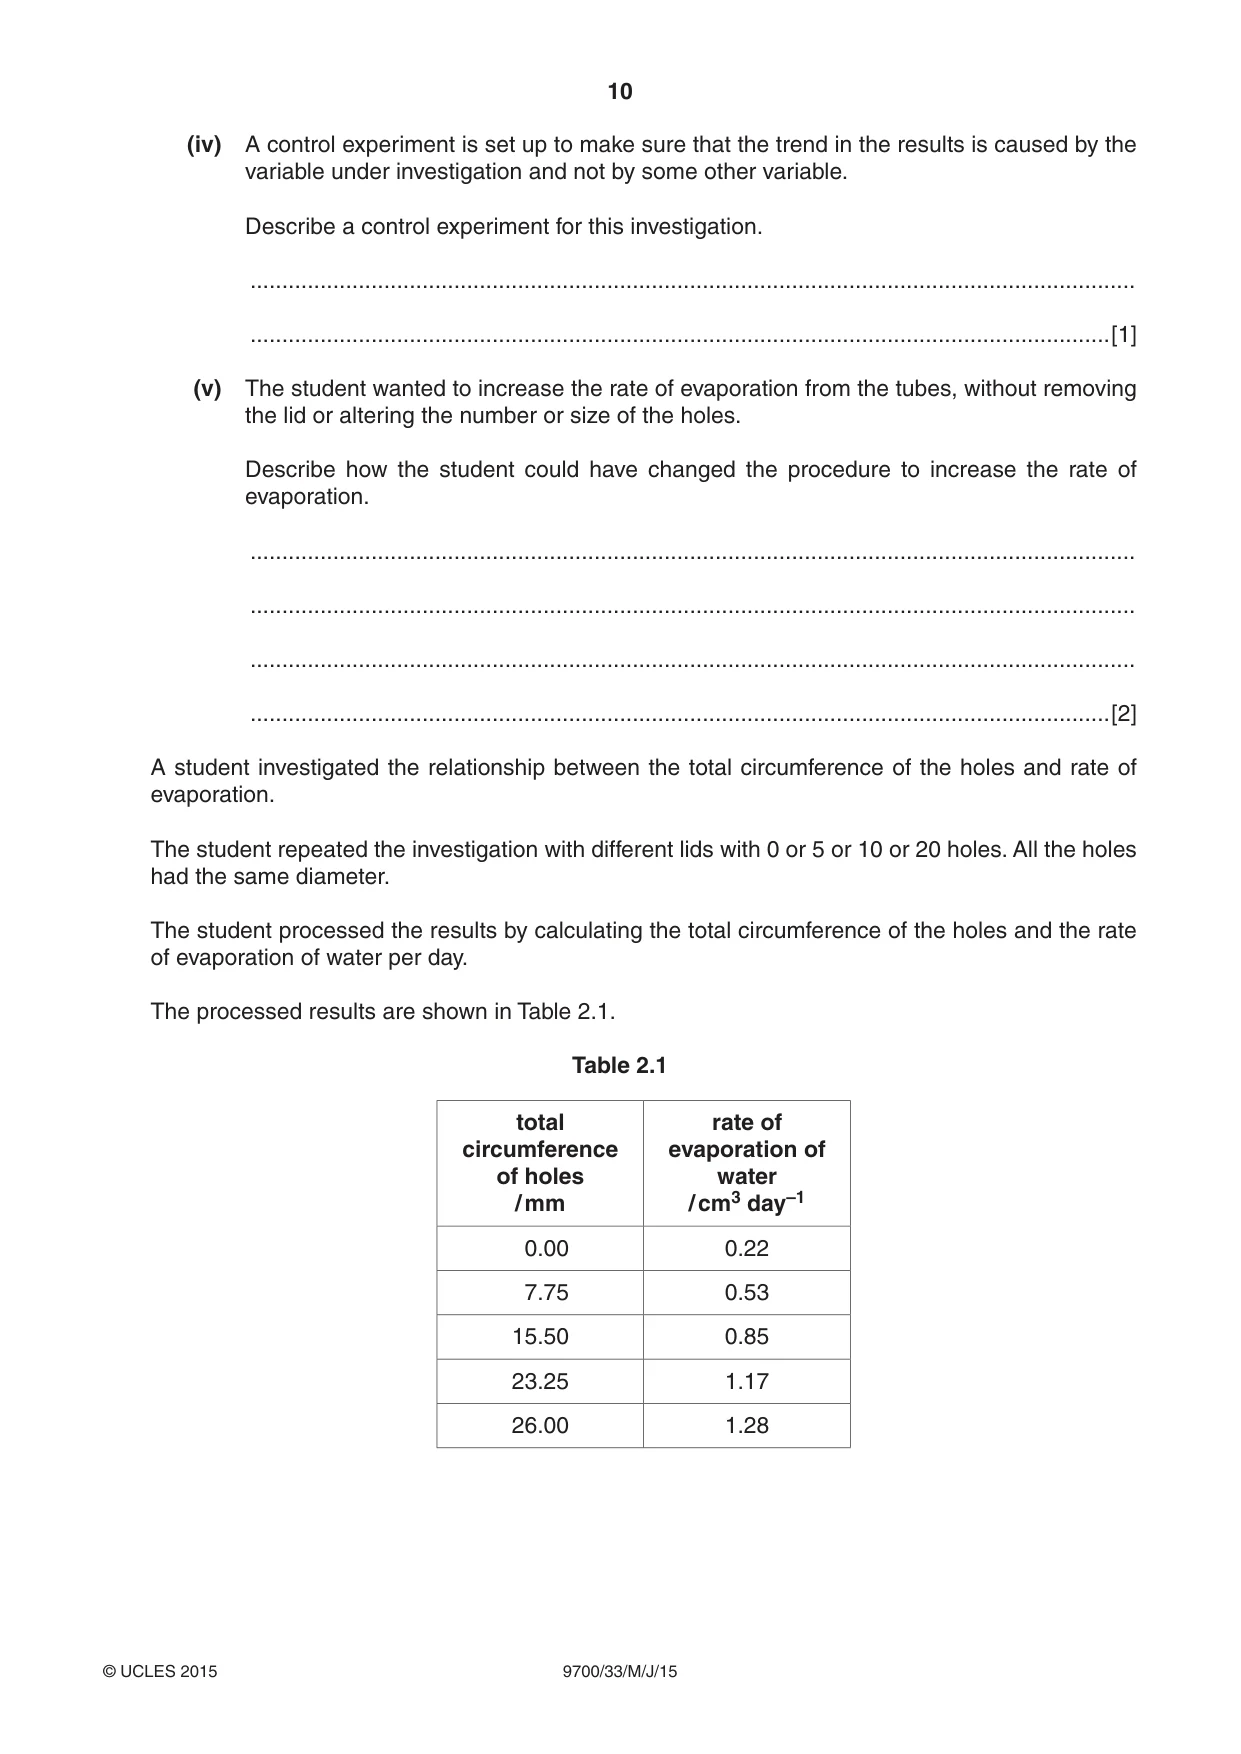
10 9700/33/M/J/15 © UCLES 2015 (iv) A control experiment is set up to make sure that the trend in the results is caused by the variable under investigation and not by some other variable. Describe a control experiment for this investigation. … …[1] (v) The student wanted to increase the rate of evaporation from the tubes, without removing the lid or altering the number or size of the holes. Describe how the student could have changed the procedure to increase the rate of evaporation. … … … …[2] A student investigated the relationship between the total circumference of the holes and rate of evaporation. The student repeated the investigation with different lids with 0 or 5 or 10 or 20 holes. All the holes had the same diameter. The student processed the results by calculating the total circumference of the holes and the rate of evaporation of water per day. The processed results are shown in Table 2.1. Table 2.1 total circumference of holes / mm rate of evaporation of water / cm3 day–1 0.00 0.22 7.75 0.53 15.50 0.85 23.25 1.17 26.00 1.28
Question paper, page 11
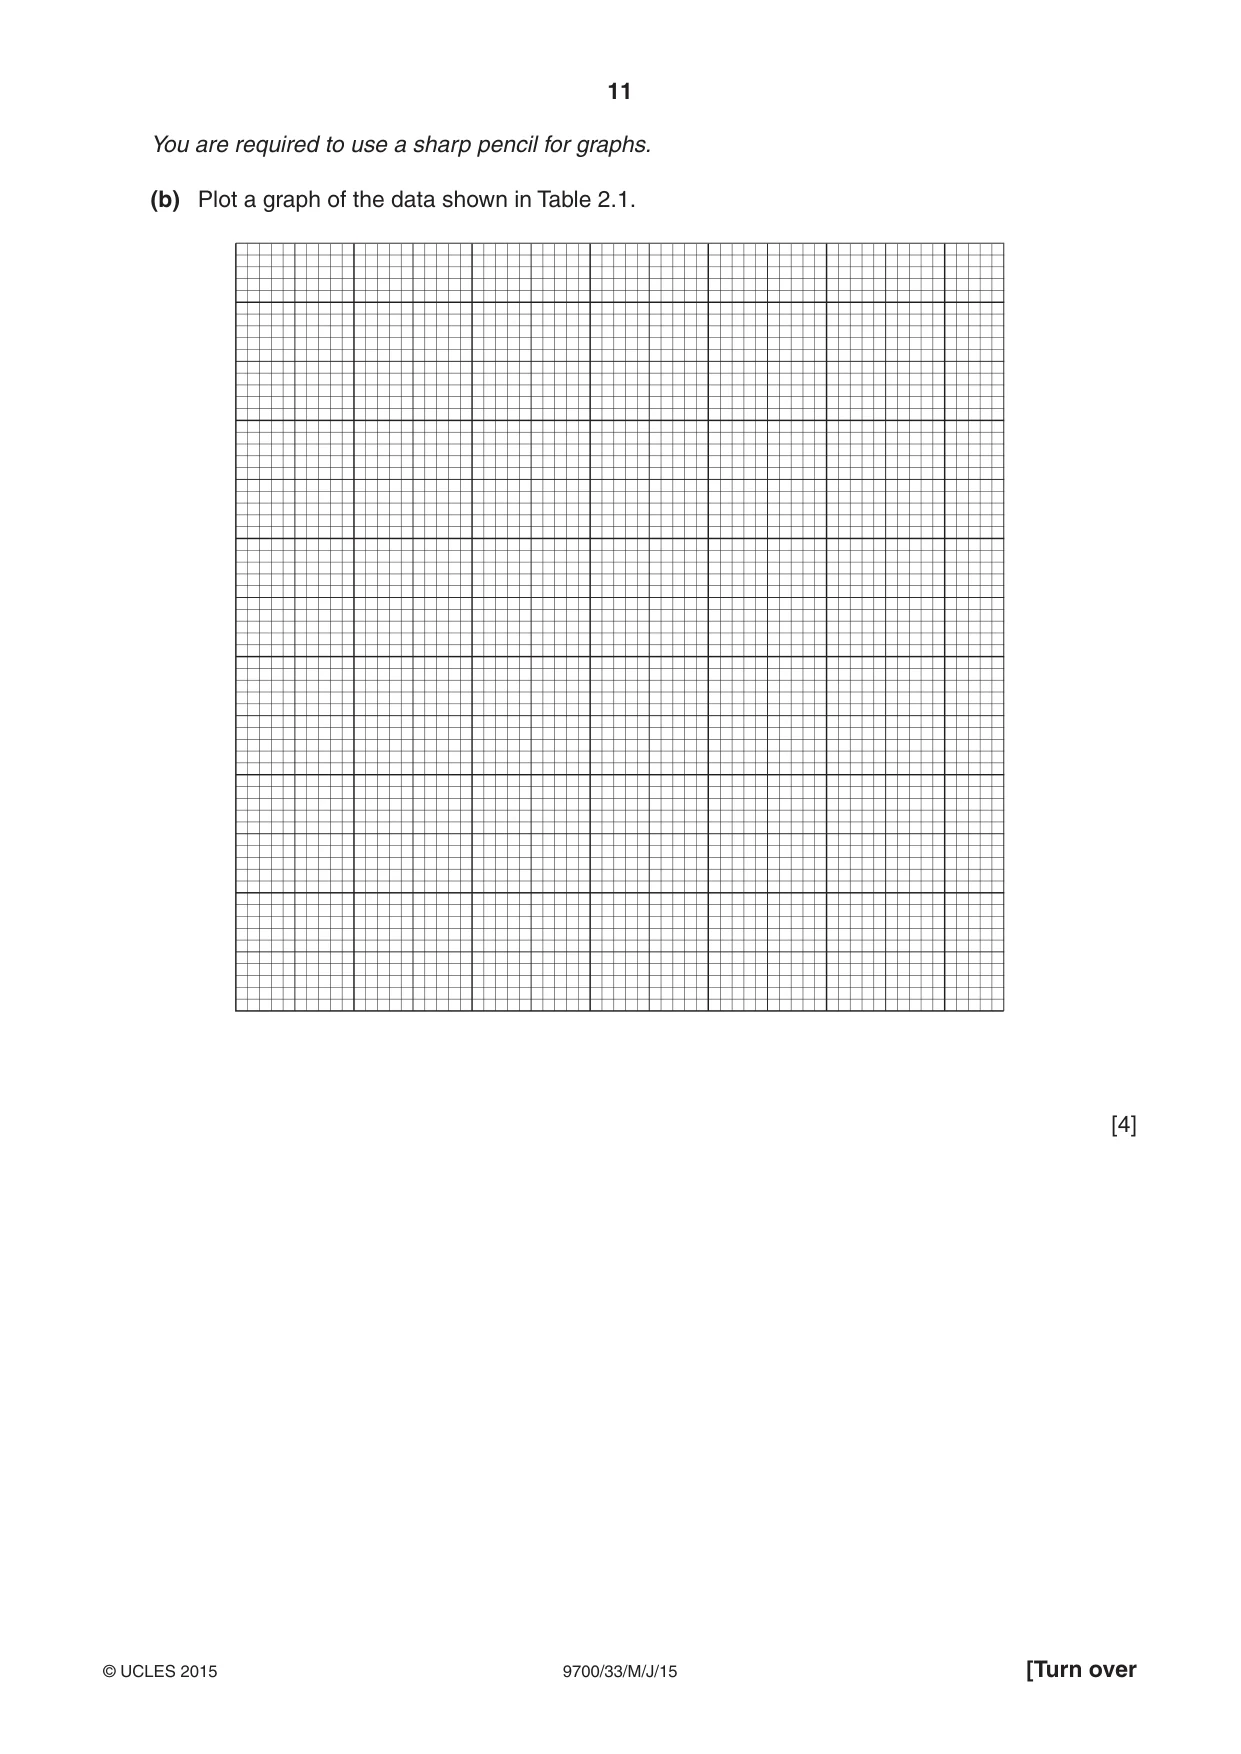
11 9700/33/M/J/15 © UCLES 2015 [Turn over You are required to use a sharp pencil for graphs. (b) Plot a graph of the data shown in Table 2.1. [4]
Question paper, page 12
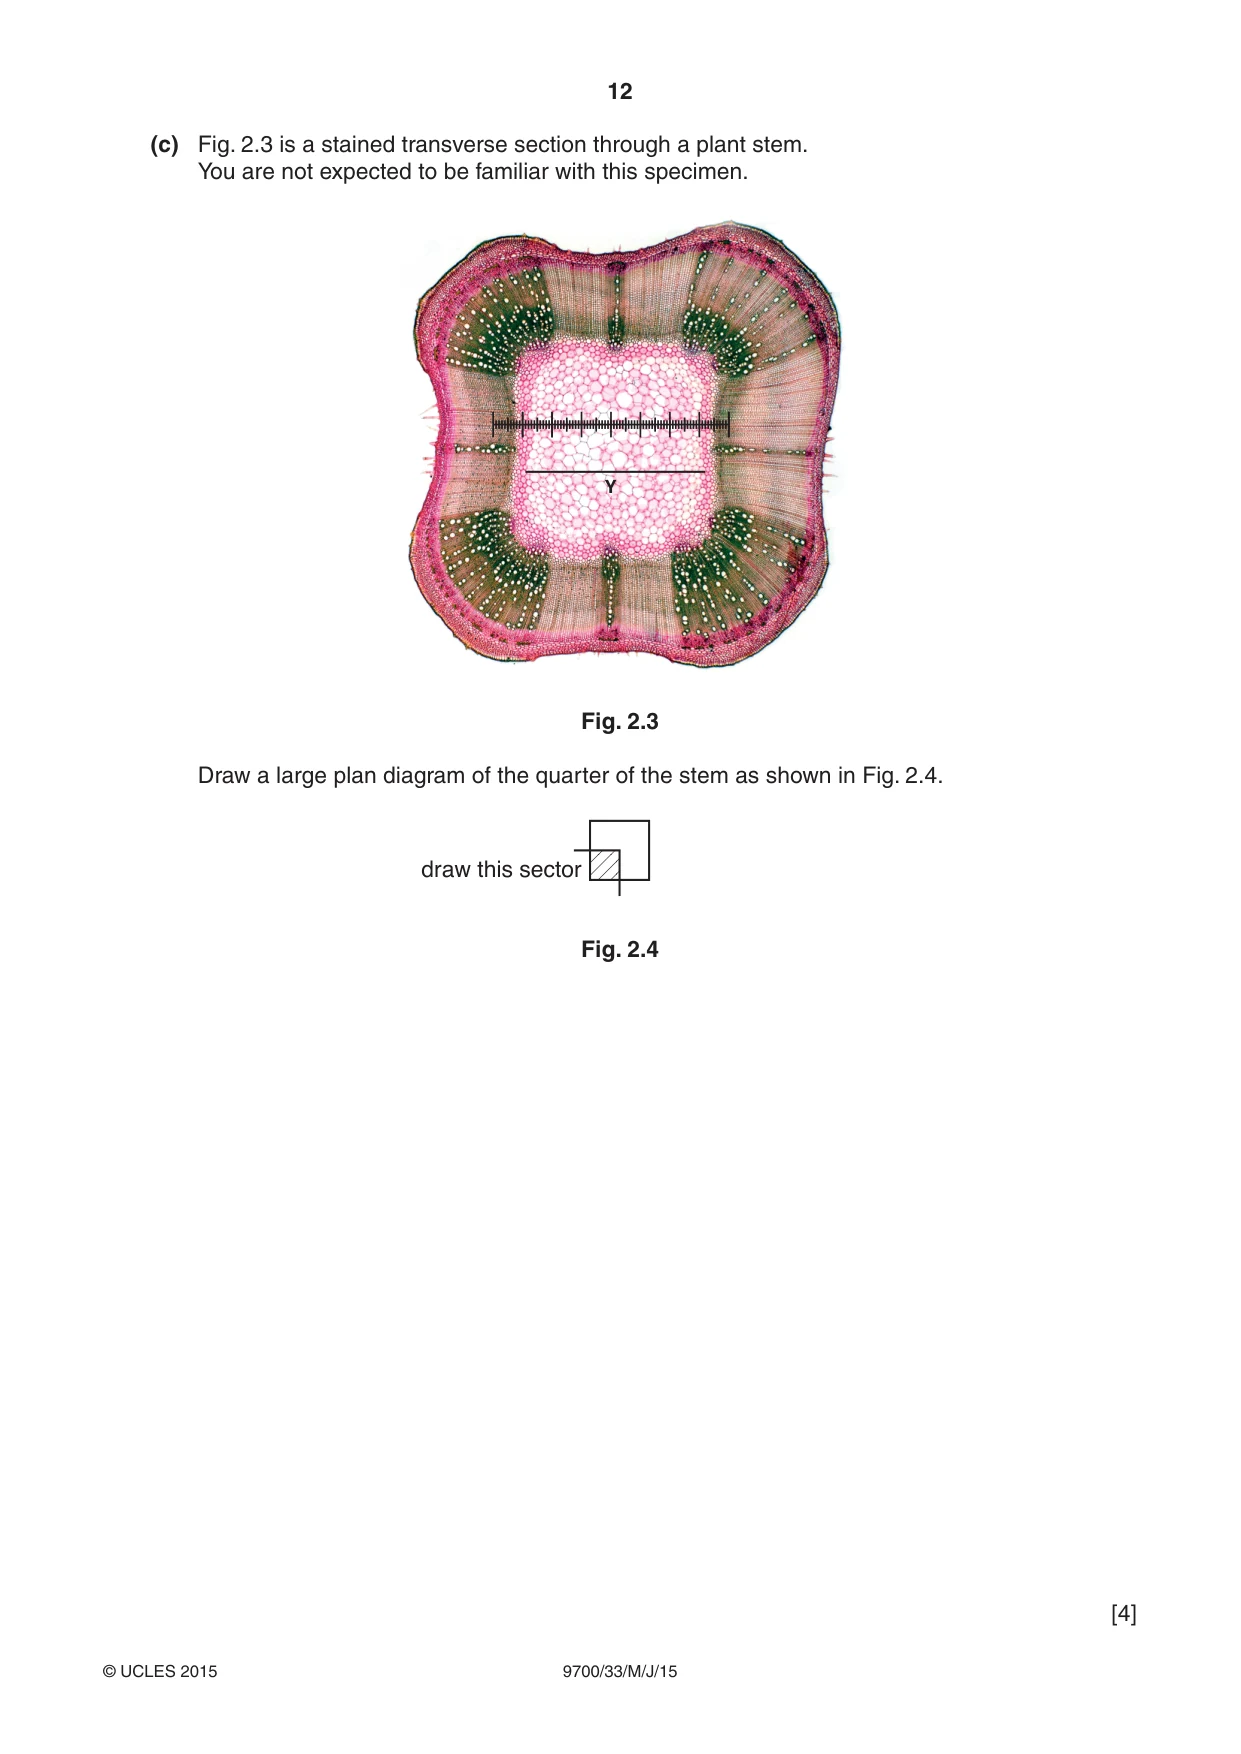
12 9700/33/M/J/15 © UCLES 2015 (c) Fig. 2.3 is a stained transverse section through a plant stem. You are not expected to be familiar with this specimen. Y Fig. 2.3 Draw a large plan diagram of the quarter of the stem as shown in Fig. 2.4. draw this sector Fig. 2.4 [4]
Question paper, page 13
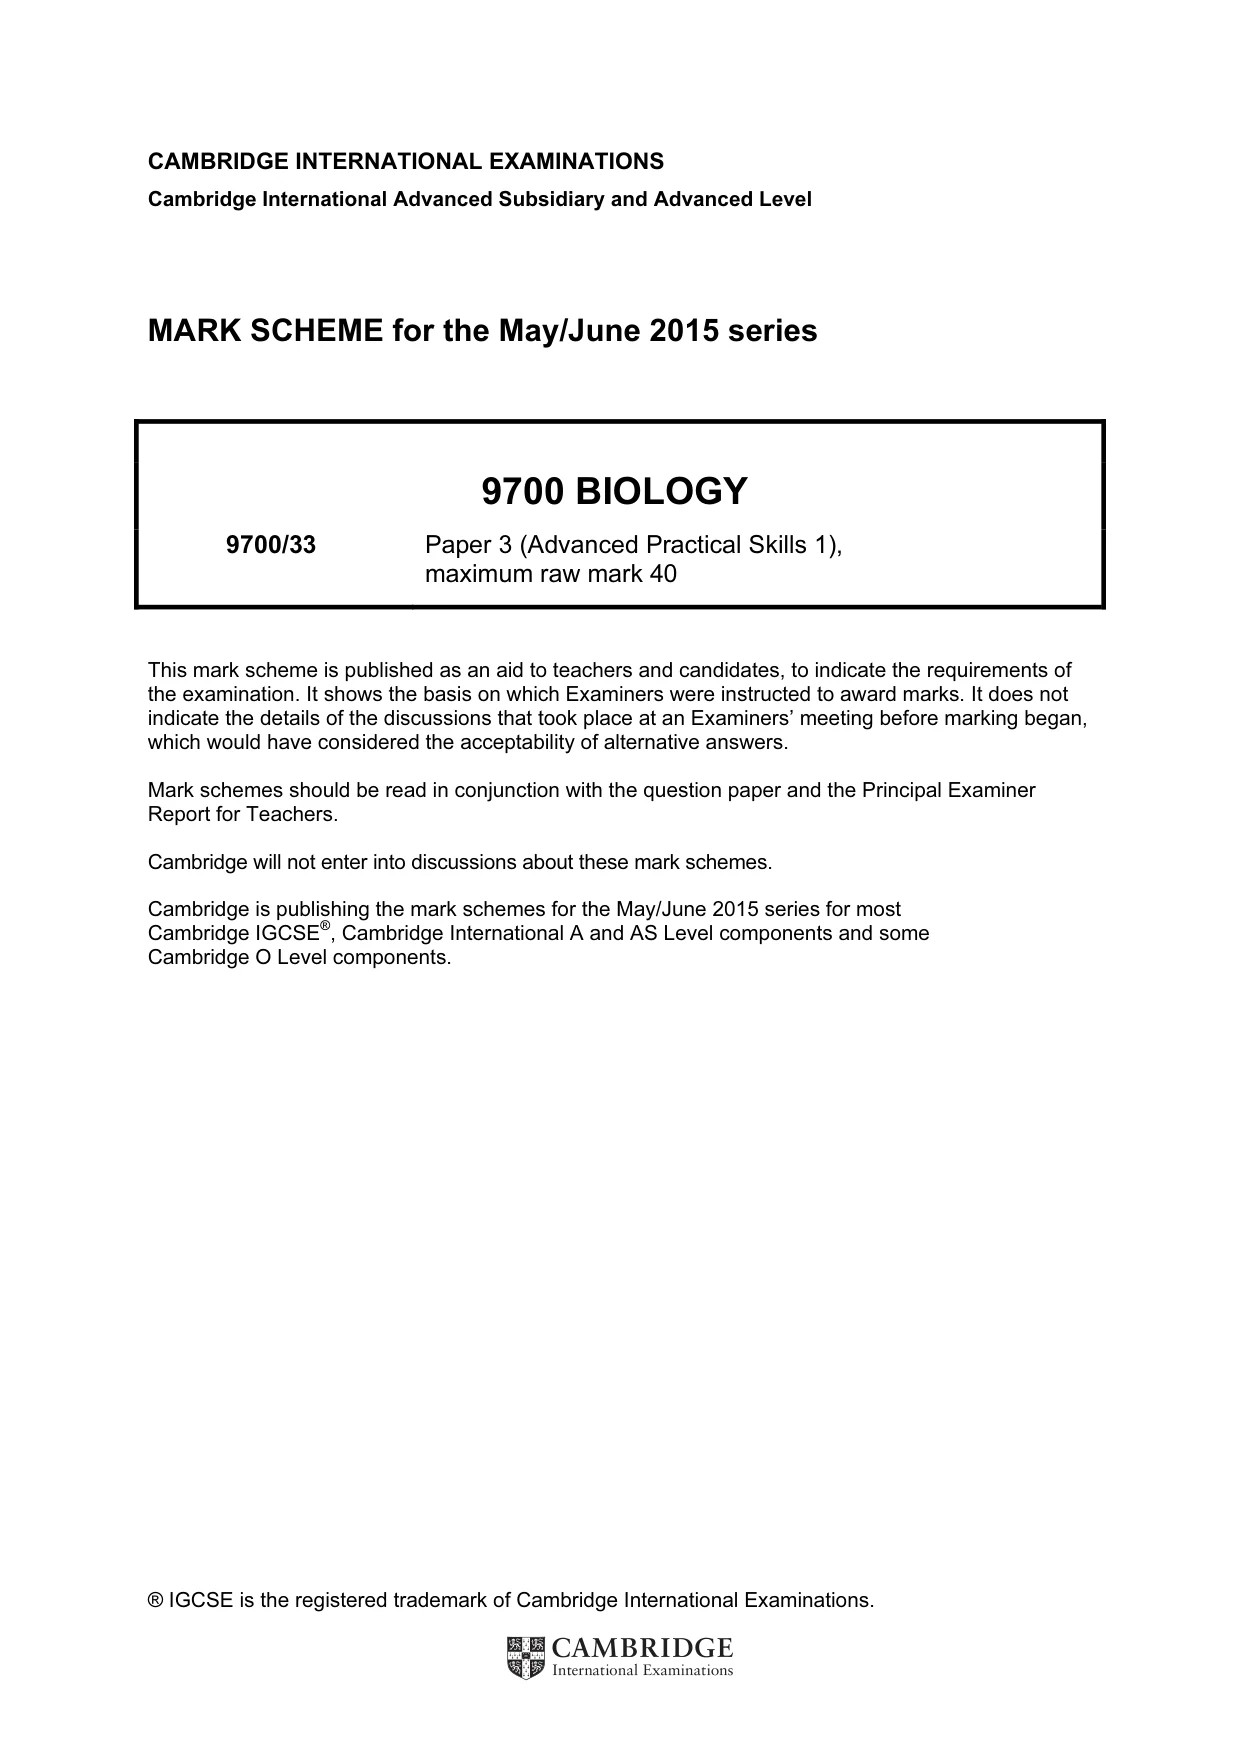
13 9700/33/M/J/15 © UCLES 2015 (d) A student calibrated the eyepiece graticule in a light microscope using a stage micrometer scale so that the actual length of the tissues could be found. The calibration was: one eyepiece graticule division equal to 0.024 mm. (i) The use of the unit mm is not the most appropriate unit for use with the light microscope. State which unit is most appropriate for use with the light microscope and show how 0.024 mm is converted to this unit. You may lose marks if you do not show your working. unit …[2] (ii) Fig. 2.3 shows a photomicrograph taken using the same microscope with the same lenses as the student. Use the calibration of the eyepiece graticule division from (d)(i) and Fig. 2.3 to calculate the actual total width of the pith, shown by line Y. You may lose marks if you do not show all the steps in your calculation and do not use appropriate units. actual total width … [2] [Total: 21]
Question paper, page 14
14 9700/33/M/J/15 © UCLES 2015 BLANK PAGE
Question paper, page 15
15 9700/33/M/J/15 © UCLES 2015 BLANK PAGE
Question paper, page 16
16 9700/33/M/J/15 © UCLES 2015 BLANK PAGE Permission to reproduce items where third-party owned material protected by copyright is included has been sought and cleared where possible. Every reasonable effort has been made by the publisher (UCLES) to trace copyright holders, but if any items requiring clearance have unwittingly been included, the publisher will be pleased to make amends at the earliest possible opportunity. To avoid the issue of disclosure of answer-related information to candidates, all copyright acknowledgements are reproduced online in the Cambridge International Examinations Copyright Acknowledgements Booklet. This is produced for each series of examinations and is freely available to download at www.cie.org.uk after the live examination series. Cambridge International Examinations is part of the Cambridge Assessment Group. Cambridge Assessment is the brand name of University of Cambridge Local Examinations Syndicate (UCLES), which is itself a department of the University of Cambridge.
Mark scheme, page 1
® IGCSE is the registered trademark of Cambridge International Examinations. CAMBRIDGE INTERNATIONAL EXAMINATIONS Cambridge International Advanced Subsidiary and Advanced Level MARK SCHEME for the May/June 2015 series 9700 BIOLOGY 9700/33 Paper 3 (Advanced Practical Skills 1), maximum raw mark 40 This mark scheme is published as an aid to teachers and candidates, to indicate the requirements of the examination. It shows the basis on which Examiners were instructed to award marks. It does not indicate the details of the discussions that took place at an Examiners’ meeting before marking began, which would have considered the acceptability of alternative answers. Mark schemes should be read in conjunction with the question paper and the Principal Examiner Report for Teachers. Cambridge will not enter into discussions about these mark schemes. Cambridge is publishing the mark schemes for the May/June 2015 series for most Cambridge IGCSE®, Cambridge International A and AS Level components and some Cambridge O Level components.
Mark scheme, page 2
Page 2 Mark Scheme Syllabus Paper Cambridge International AS/A Level – May/June 2015 9700 33 © Cambridge International Examinations 2015 Mark scheme abbreviations: ; separates marking points / alternative answers for the same point R reject A accept (for answers correctly cued by the question, or by extra guidance) AW alternative wording (where responses vary more than usual) underline actual word given must be used by candidate (grammatical variants accepted) max indicates the maximum number of marks that can be given ora or reverse argument mp marking point (with relevant number) ecf error carried forward I ignore
Mark scheme, page 3
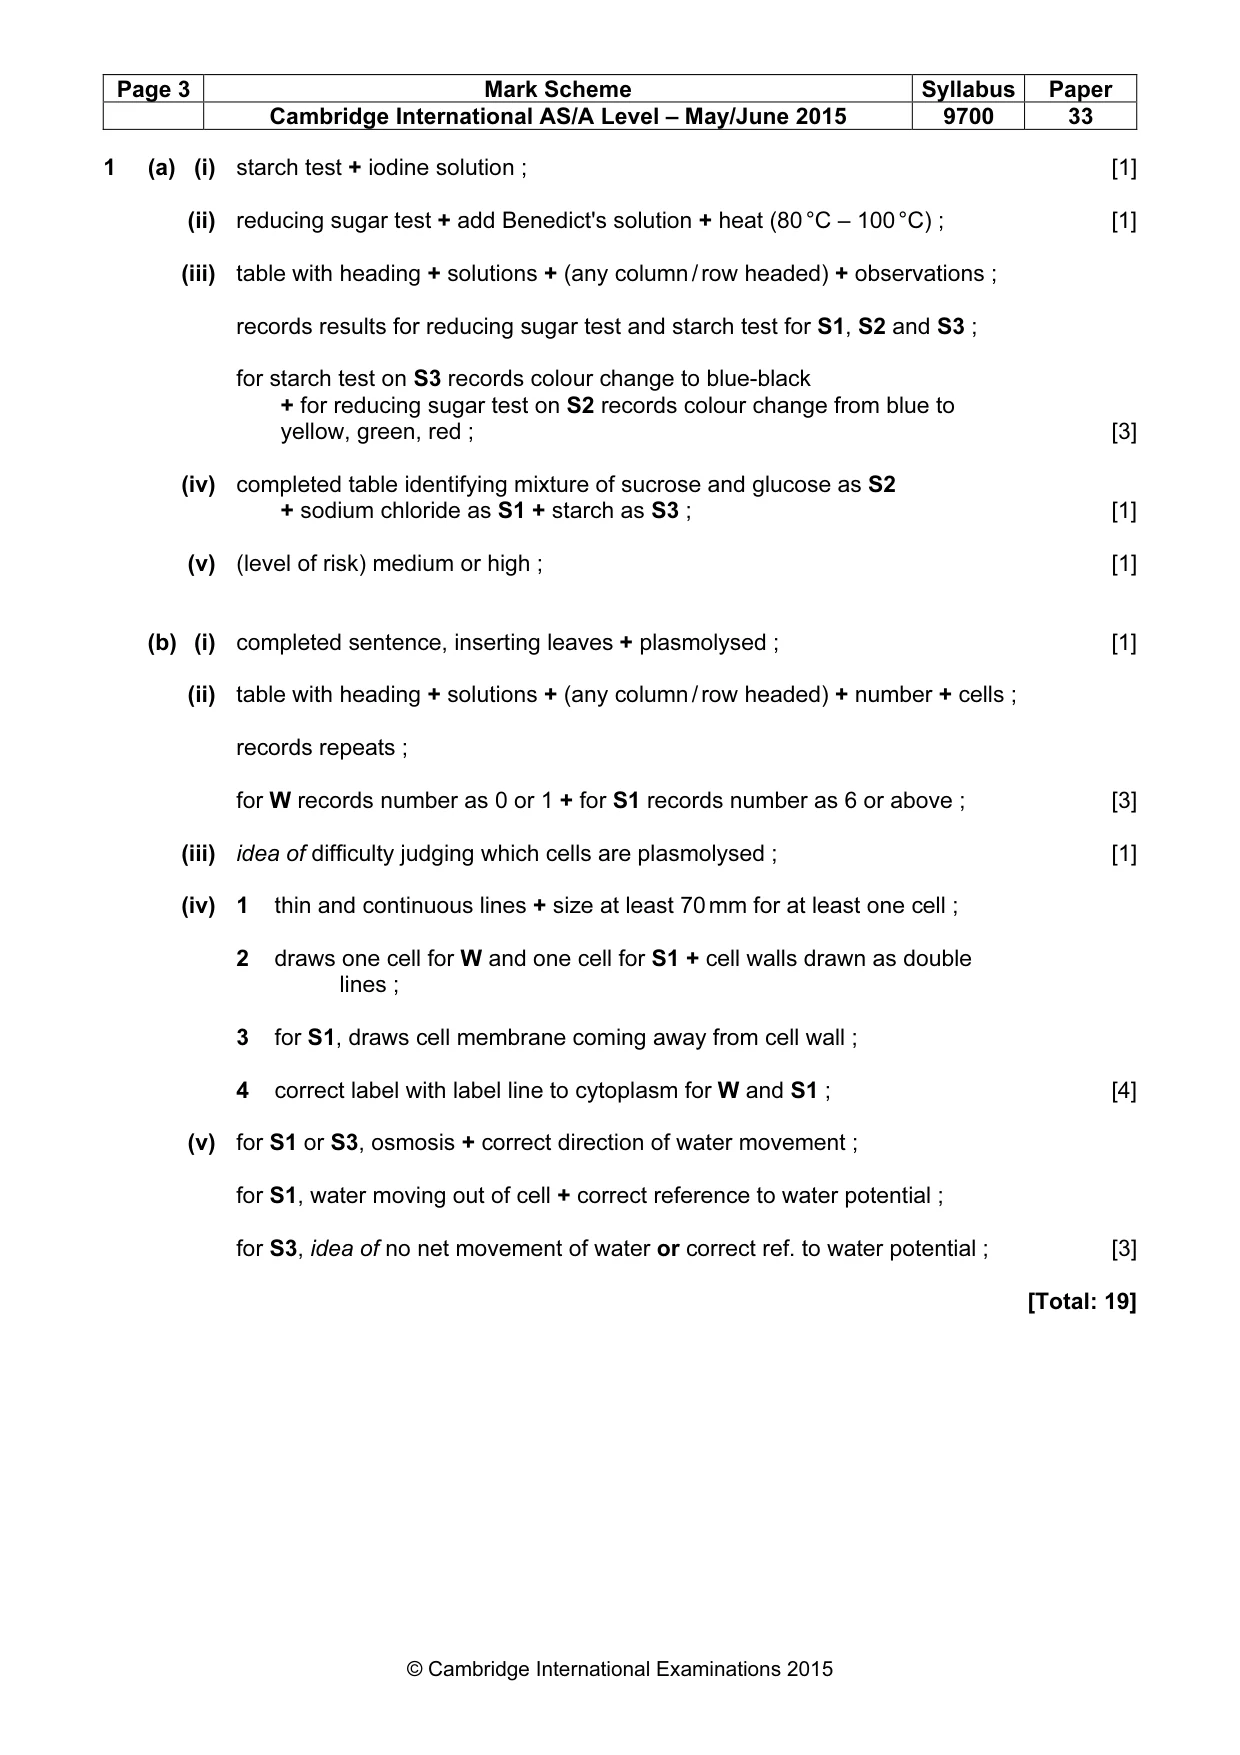
Page 3 Mark Scheme Syllabus Paper Cambridge International AS/A Level – May/June 2015 9700 33 © Cambridge International Examinations 2015 1 (a) (i) starch test + iodine solution ; [1] (ii) reducing sugar test + add Benedict's solution + heat (80 °C – 100 °C) ; [1] (iii) table with heading + solutions + (any column / row headed) + observations ; records results for reducing sugar test and starch test for S1, S2 and S3 ; for starch test on S3 records colour change to blue-black + for reducing sugar test on S2 records colour change from blue to yellow, green, red ; [3] (iv) completed table identifying mixture of sucrose and glucose as S2 + sodium chloride as S1 + starch as S3 ; [1] (v) (level of risk) medium or high ; [1] (b) (i) completed sentence, inserting leaves + plasmolysed ; [1] (ii) table with heading + solutions + (any column / row headed) + number + cells ; records repeats ; for W records number as 0 or 1 + for S1 records number as 6 or above ; [3] (iii) idea of difficulty judging which cells are plasmolysed ; [1] (iv) 1 thin and continuous lines + size at least 70 mm for at least one cell ; 2 draws one cell for W and one cell for S1 + cell walls drawn as double lines ; 3 for S1, draws cell membrane coming away from cell wall ; 4 correct label with label line to cytoplasm for W and S1 ; [4] (v) for S1 or S3, osmosis + correct direction of water movement ; for S1, water moving out of cell + correct reference to water potential ; for S3, idea of no net movement of water or correct ref. to water potential ; [3] [Total: 19]
Mark scheme, page 4
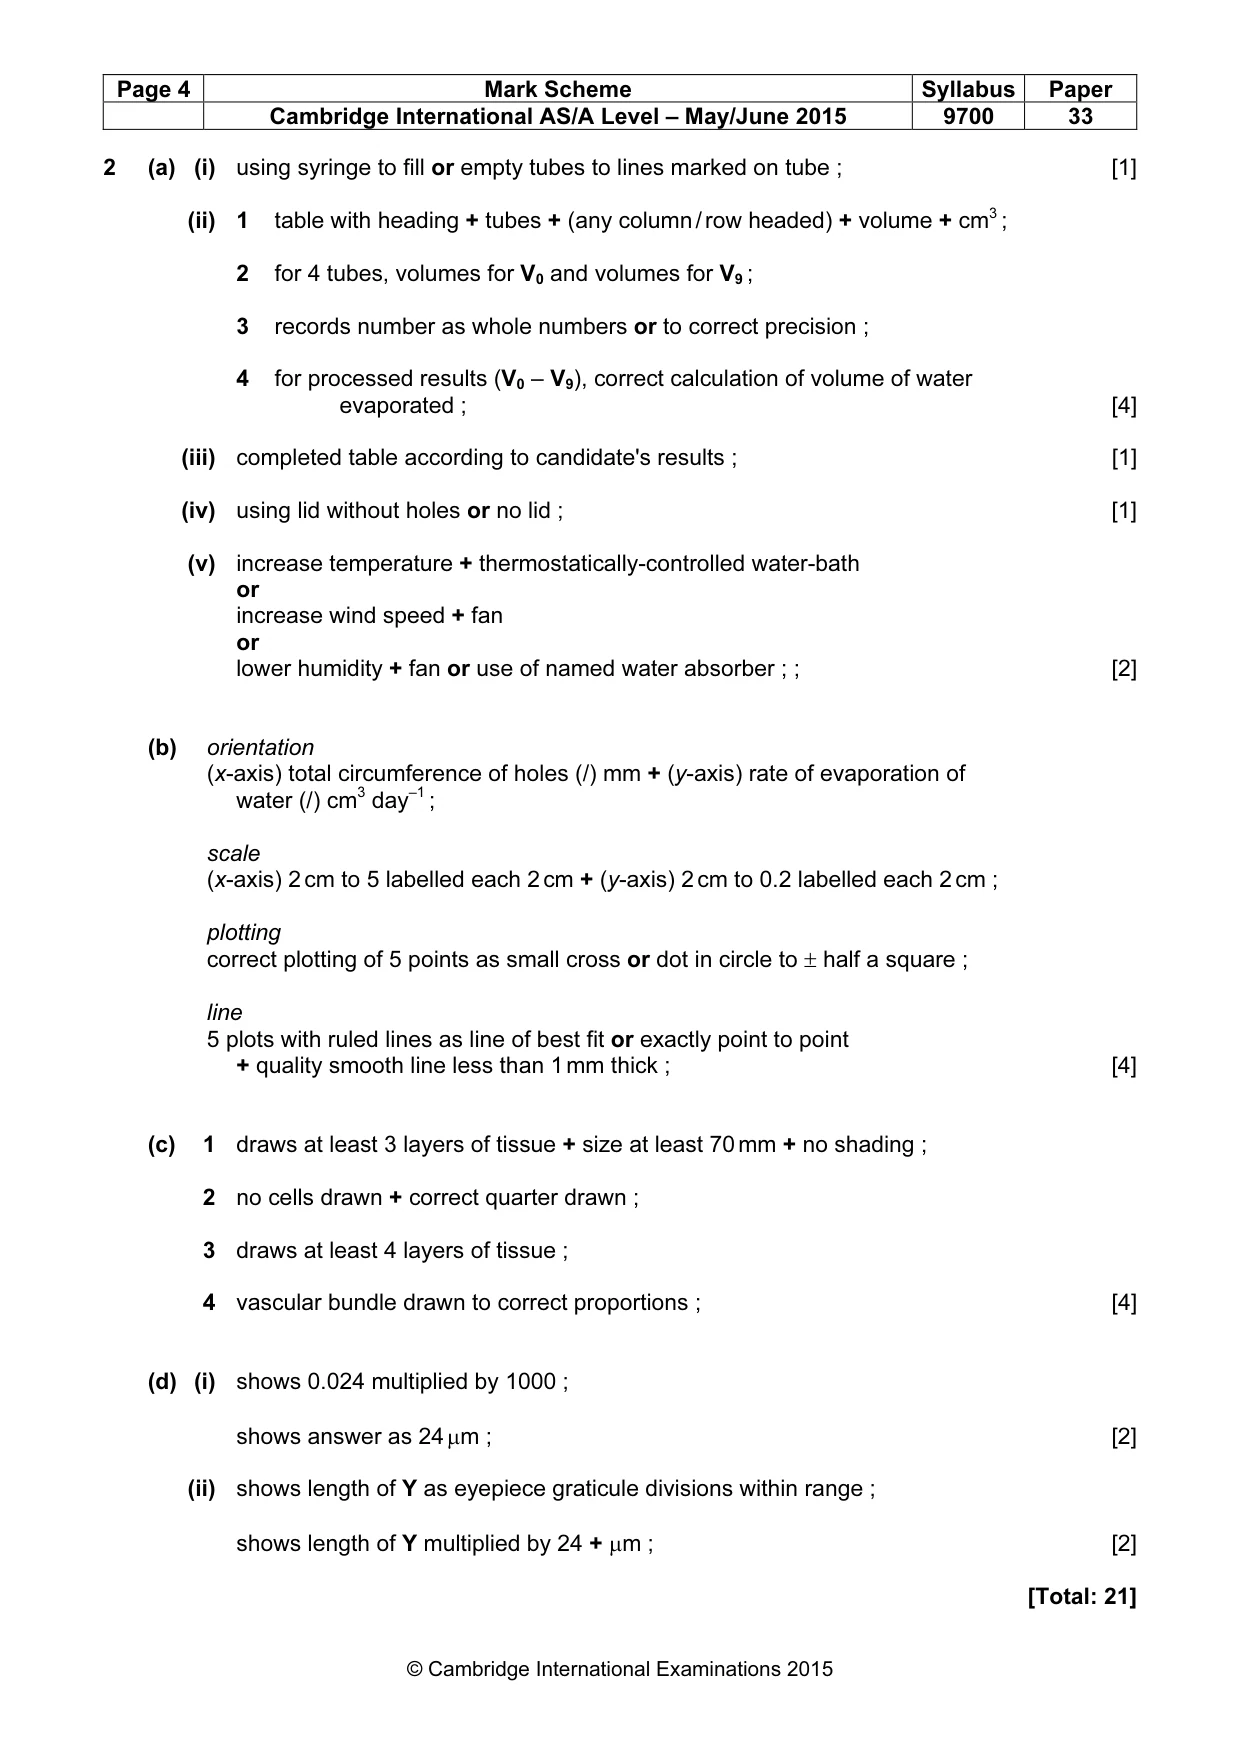
Page 4 Mark Scheme Syllabus Paper Cambridge International AS/A Level – May/June 2015 9700 33 © Cambridge International Examinations 2015 2 (a) (i) using syringe to fill or empty tubes to lines marked on tube ; [1] (ii) 1 table with heading + tubes + (any column / row headed) + volume + cm3 ; 2 for 4 tubes, volumes for V0 and volumes for V9 ; 3 records number as whole numbers or to correct precision ; 4 for processed results (V0 – V9), correct calculation of volume of water evaporated ; [4] (iii) completed table according to candidate's results ; [1] (iv) using lid without holes or no lid ; [1] (v) increase temperature + thermostatically-controlled water-bath or increase wind speed + fan or lower humidity + fan or use of named water absorber ; ; [2] (b) orientation (x-axis) total circumference of holes (/) mm + (y-axis) rate of evaporation of water (/) cm3 day–1 ; scale (x-axis) 2 cm to 5 labelled each 2 cm + (y-axis) 2 cm to 0.2 labelled each 2 cm ; plotting correct plotting of 5 points as small cross or dot in circle to ± half a square ; line 5 plots with ruled lines as line of best fit or exactly point to point + quality smooth line less than 1 mm thick ; [4] (c) 1 draws at least 3 layers of tissue + size at least 70 mm + no shading ; 2 no cells drawn + correct quarter drawn ; 3 draws at least 4 layers of tissue ; 4 vascular bundle drawn to correct proportions ; [4] (d) (i) shows 0.024 multiplied by 1000 ; shows answer as 24 µm ; [2] (ii) shows length of Y as eyepiece graticule divisions within range ; shows length of Y multiplied by 24 + µm ; [2] [Total: 21]
What you needed in this session
Cambridge’s own grade thresholds for 2015 May/June, Paper 3 · Variant 3. A higher threshold means an easier paper — the bar moves with how the cohort did.