Cambridge A Level Biology 9700 — 2013 May/June Paper 3 · Variant 5
9700/35/M/J/13 · 40 marks · ≈45 min
The question paper and its mark scheme, free to read here and free to download. This is Cambridge’s own paper, exactly as it was sat.
Question paper16 pages
Mark scheme10 pages
Answers below. Sit the paper first if you are practising.
Paper as text
Question paper, page 1
This document consists of 15 printed pages and 1 blank page. DC (LEO/SW) 52069/8 © UCLES 2013 [Turn over UNIVERSITY OF CAMBRIDGE INTERNATIONAL EXAMINATIONS General Certificate of Education Advanced Subsidiary Level and Advanced Level READ THESE INSTRUCTIONS FIRST Write your Centre number, candidate number and name on all the work you hand in. Write in dark blue or black ink. You may use a pencil for any diagrams, graphs or rough working. Do not use red ink, staples, paper clips, highlighters, glue or correction fluid. DO NOT WRITE IN ANY BARCODES. Answer all questions. Electronic calculators may be used. You may lose marks if you do not show your working or if you do not use appropriate units. At the end of the examination, fasten all your work securely together. The number of marks is given in brackets [ ] at the end of each question or part question. * 6 6 5 1 1 4 7 0 1 9 * BIOLOGY 9700/35 Advanced Practical Skills 1 May/June 2013 2 hours Candidates answer on the Question Paper. Additional Materials: As listed in the Confidential Instructions. For Examiner’s Use 1 2 Total
Question paper, page 2
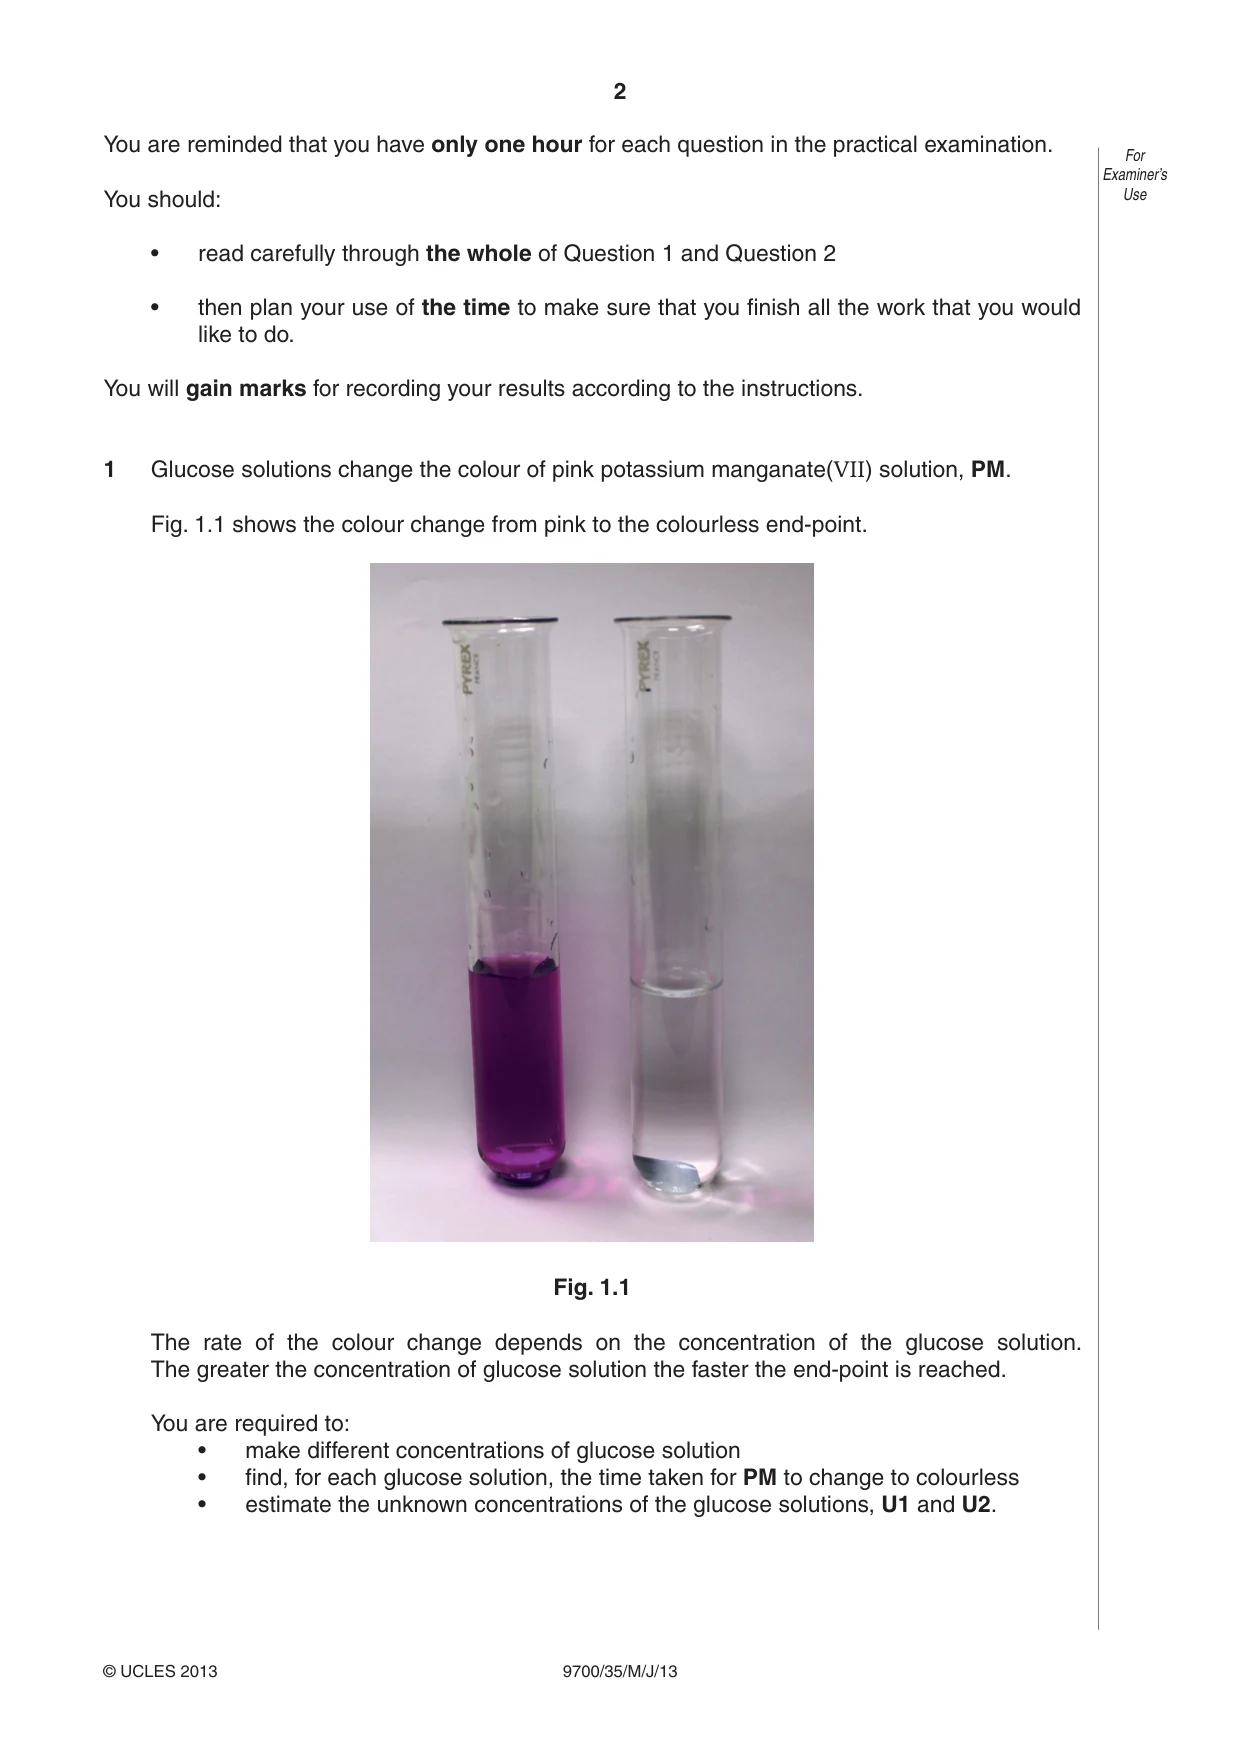
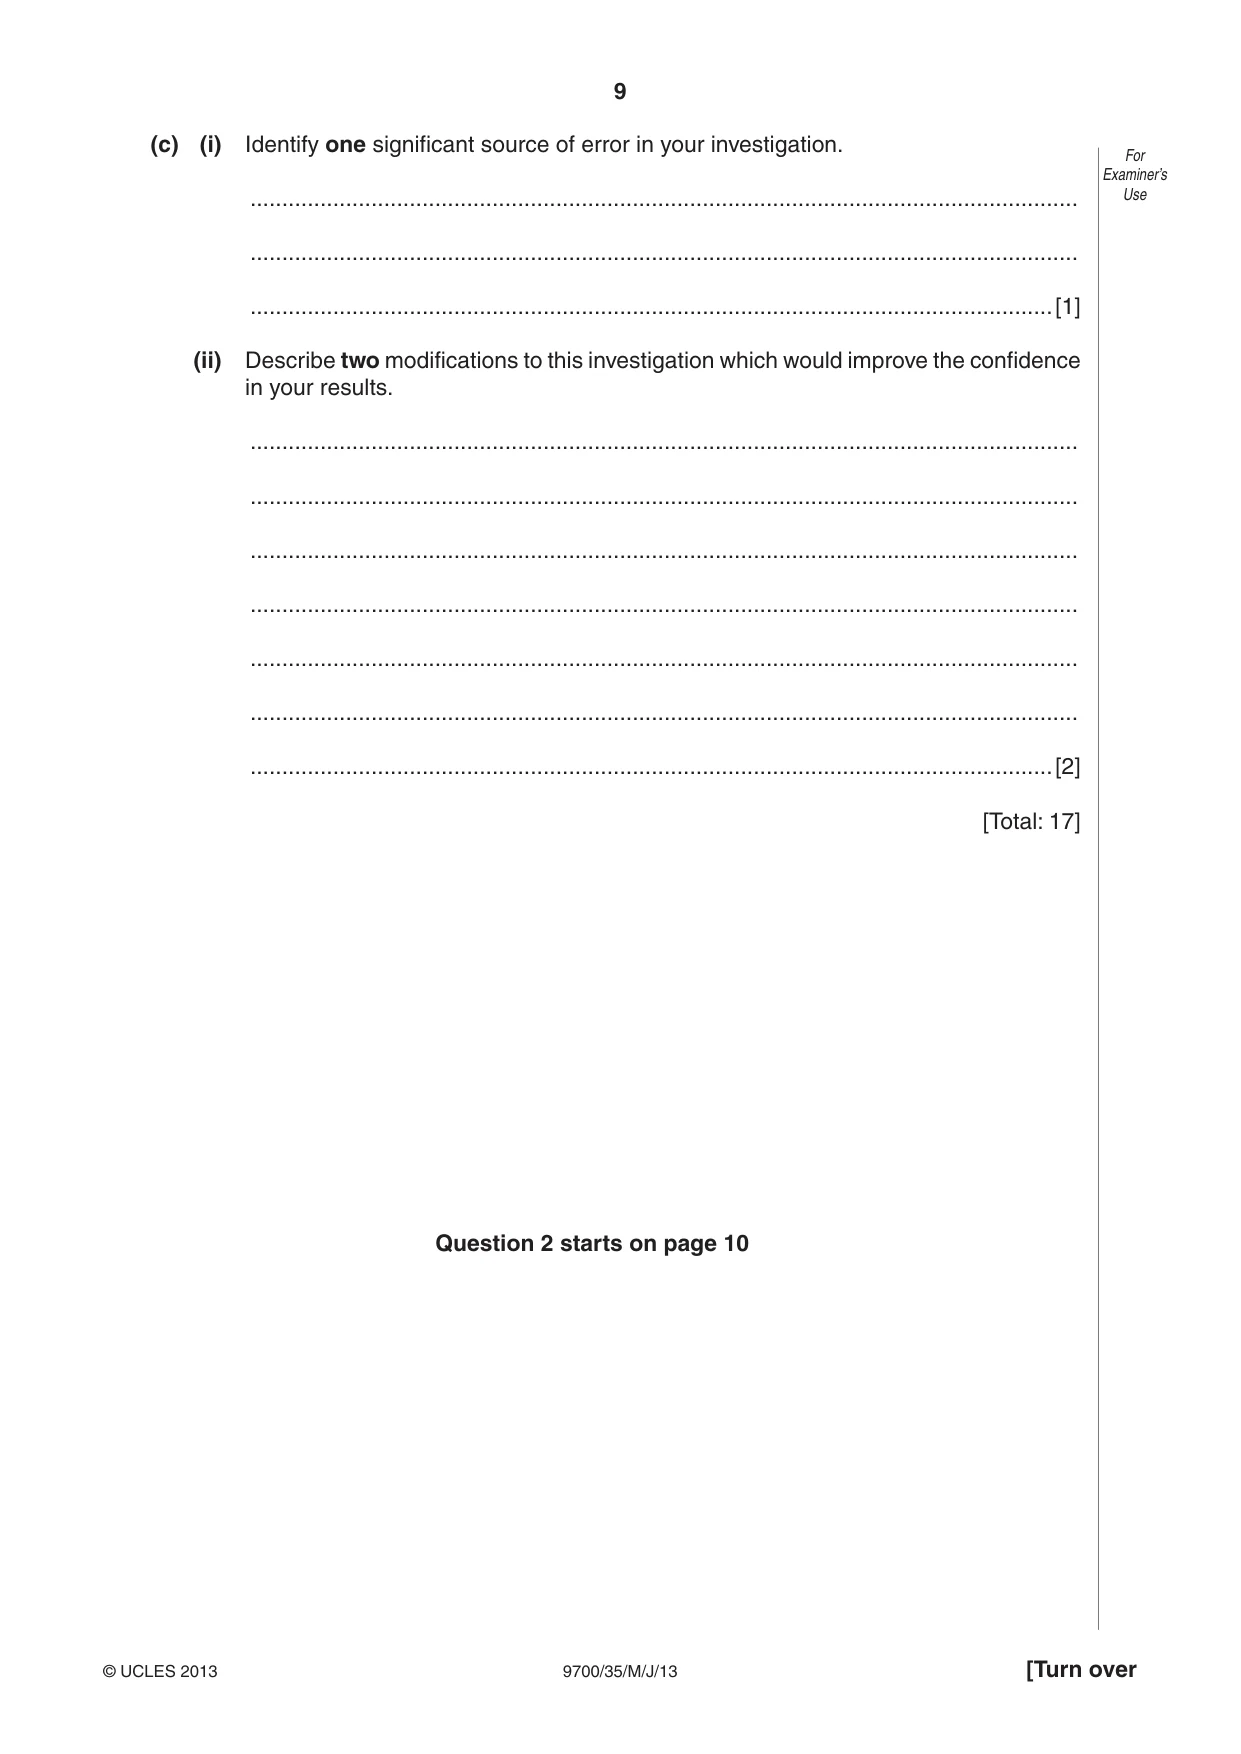
2 9700/35/M/J/13 © UCLES 2013 For Examiner’s Use You are reminded that you have only one hour for each question in the practical examination. You should: • read carefully through the whole of Question 1 and Question 2 • then plan your use of the time to make sure that you finish all the work that you would like to do. You will gain marks for recording your results according to the instructions. 1 Glucose solutions change the colour of pink potassium manganate(VII) solution, PM. Fig. 1.1 shows the colour change from pink to the colourless end-point. Fig. 1.1 The rate of the colour change depends on the concentration of the glucose solution. The greater the concentration of glucose solution the faster the end-point is reached. You are required to: • make different concentrations of glucose solution • find, for each glucose solution, the time taken for PM to change to colourless • estimate the unknown concentrations of the glucose solutions, U1 and U2.
Question paper, page 3
3 9700/35/M/J/13 © UCLES 2013 [Turn over For Examiner’s Use You are provided with: labelled contents hazard volume / cm3 G 20% glucose solution none 100 W distilled water none 200 S sulfuric acid harmful 40 PM potassium manganate(VII) solution harmful 20 U1 glucose solution none 20 U2 glucose solution none 20 Sulfuric acid and potassium manganate(VII) solution are harmful. If any comes into contact with your skin, wash immediately under cold water. It is recommended that you wear safety goggles/glasses. Proceed as follows: 1. Using the 20% glucose solution, G, as a starting concentration you are required to make up 20 cm3 of each of four different concentrations of glucose solutions, 6%, 8%, 10%, 12%. (a) (i) Complete Table 1.1 to show how you will make the four glucose solutions 6%, 8%, 10% and 20%. Table 1.1 volume of 20% glucose solution / cm3 volume of distilled water / cm3 final percentage concentration of glucose 6 8 10 12 8 12 [2] 2. Make all the glucose solutions as in Table 1.1, in the containers provided. 3. Put 10 cm3 of each glucose solution into four separate test-tubes. 4. Using the syringe labelled S, put 5 cm3 of S into each test-tube. Insert the bung and, with your finger holding the bung in place, gently mix the solution in each test-tube. Do not turn the test-tube upside-down.
Question paper, page 4
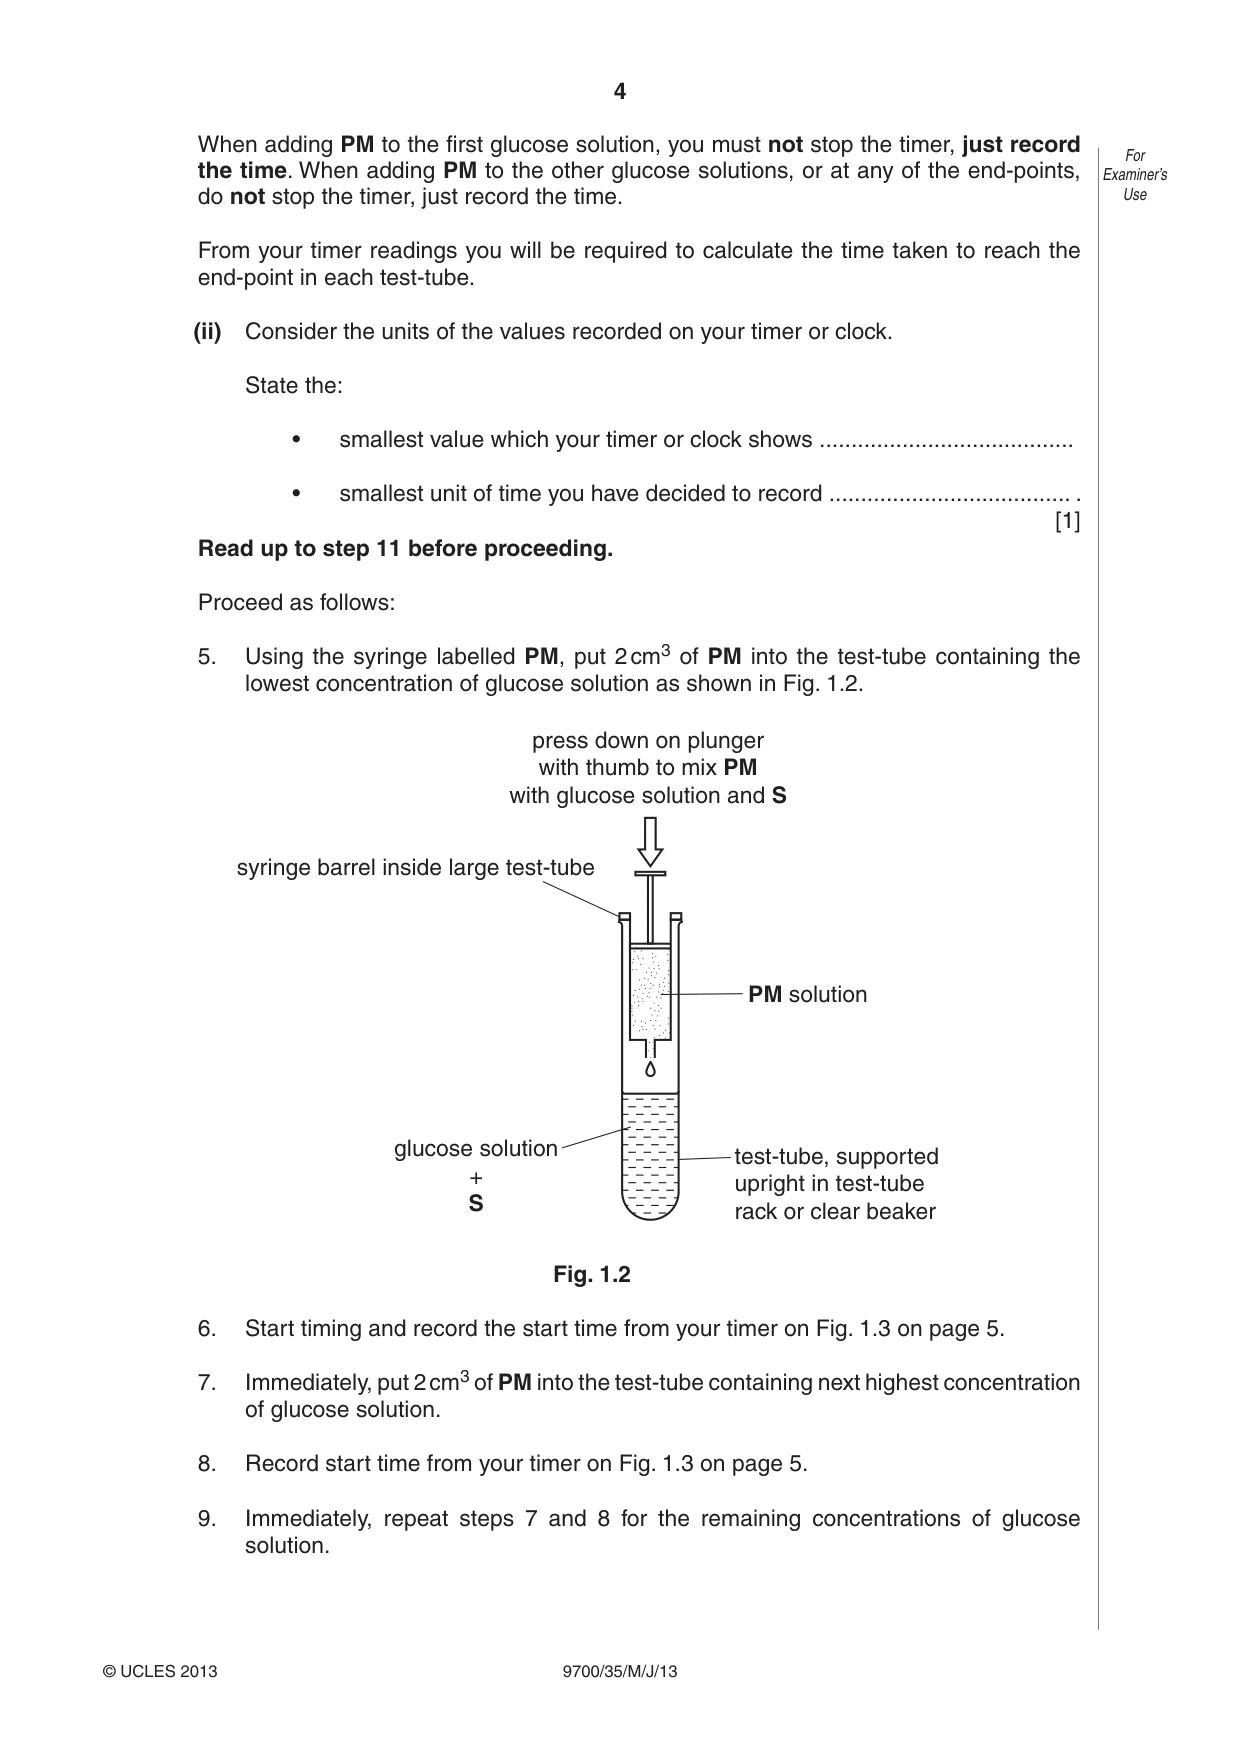
4 9700/35/M/J/13 © UCLES 2013 For Examiner’s Use When adding PM to the first glucose solution, you must not stop the timer, just record the time. When adding PM to the other glucose solutions, or at any of the end-points, do not stop the timer, just record the time. From your timer readings you will be required to calculate the time taken to reach the end-point in each test-tube. (ii) Consider the units of the values recorded on your timer or clock. State the: • smallest value which your timer or clock shows … • smallest unit of time you have decided to record … . [1] Read up to step 11 before proceeding. Proceed as follows: 5. Using the syringe labelled PM, put 2 cm3 of PM into the test-tube containing the lowest concentration of glucose solution as shown in Fig. 1.2. PM solution test-tube, supported upright in test-tube rack or clear beaker press down on plunger with thumb to mix PM with glucose solution and S syringe barrel inside large test-tube glucose solution + S Fig. 1.2 6. Start timing and record the start time from your timer on Fig. 1.3 on page 5. 7. Immediately, put 2 cm3 of PM into the test-tube containing next highest concentration of glucose solution. 8. Record start time from your timer on Fig. 1.3 on page 5. 9. Immediately, repeat steps 7 and 8 for the remaining concentrations of glucose solution.
Question paper, page 5
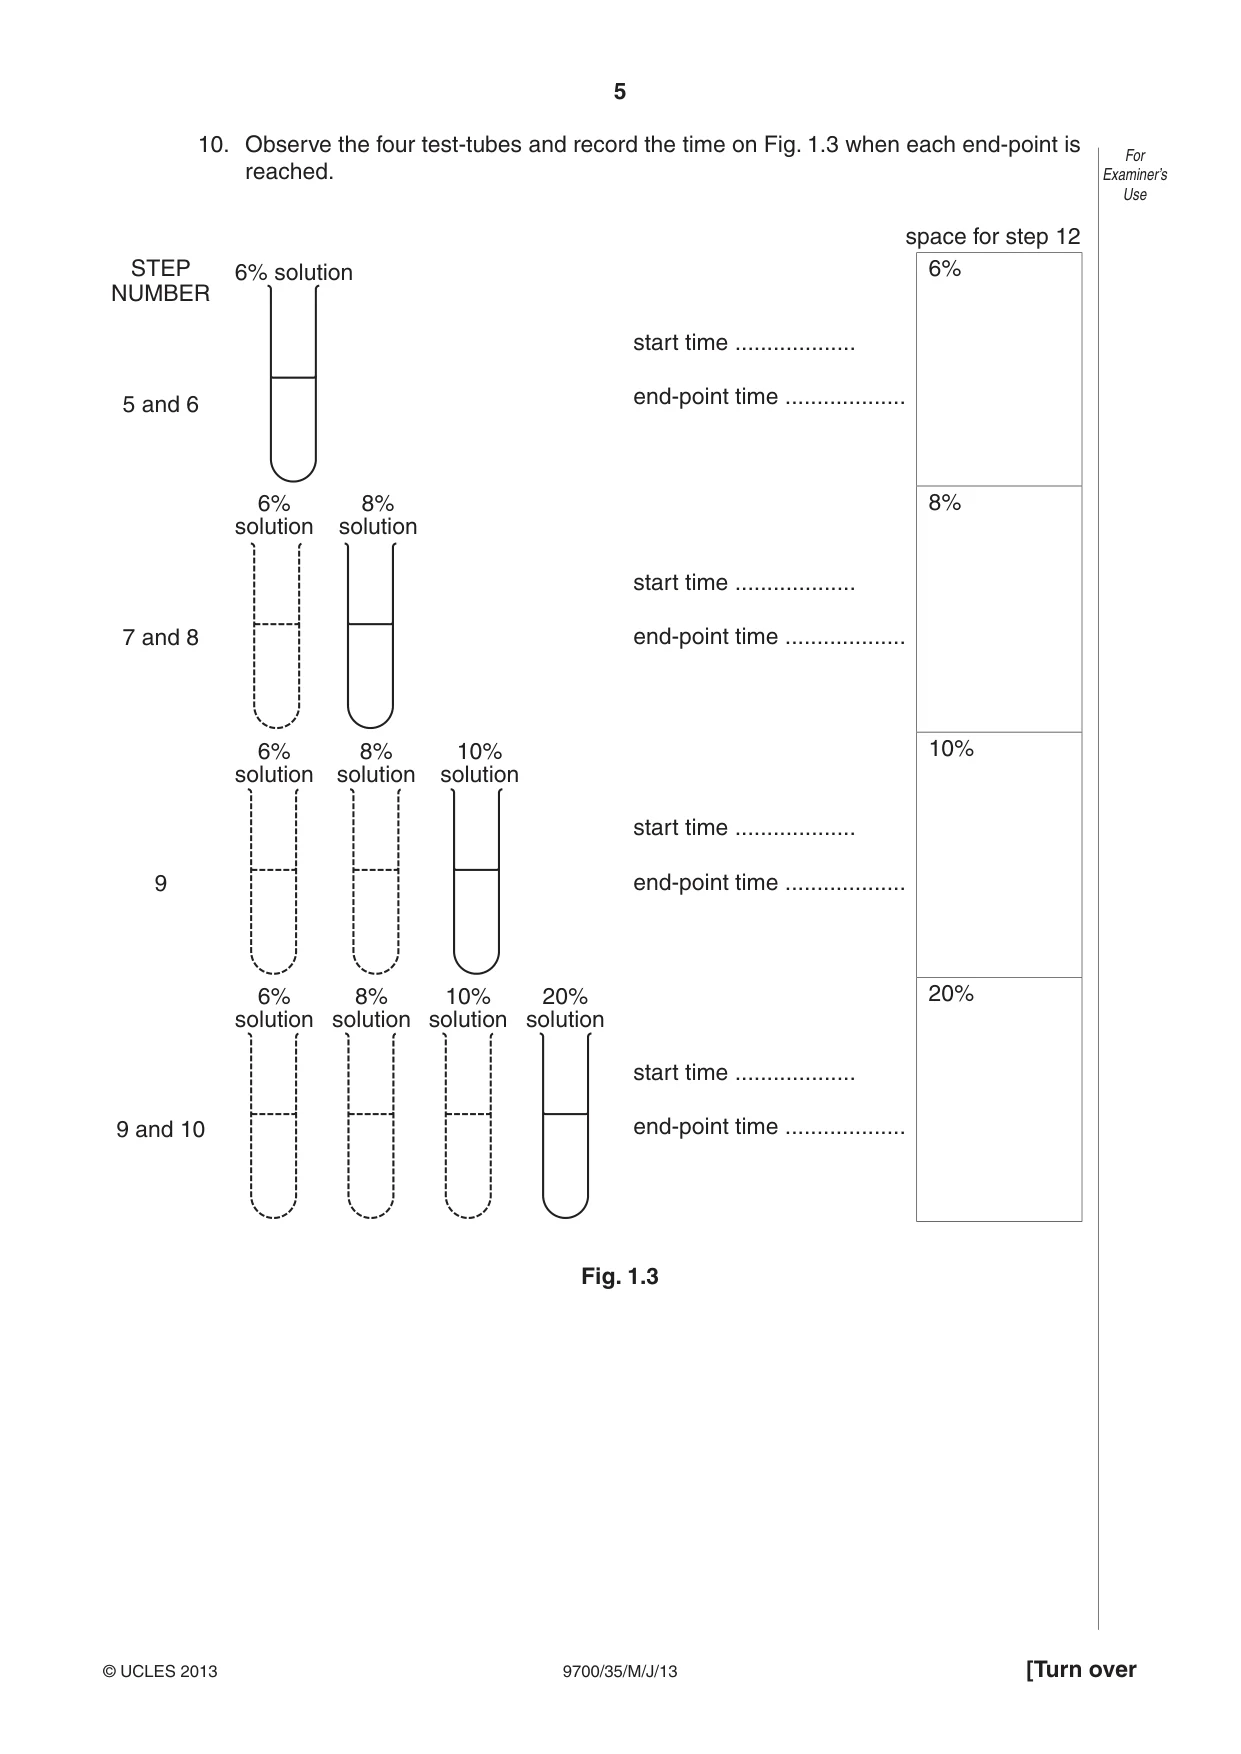
5 9700/35/M/J/13 © UCLES 2013 [Turn over For Examiner’s Use 10. Observe the four test-tubes and record the time on Fig. 1.3 when each end-point is reached. space for step 12 STEP NUMBER 5 and 6 6% solution start time … end-point time … 6% 7 and 8 6% solution 8% solution start time … end-point time … 8% 9 6% solution 8% solution 10% solution start time … end-point time … 10% 9 and 10 6% solution 8% solution 10% solution 20% solution start time … end-point time … 20% Fig. 1.3
Question paper, page 6
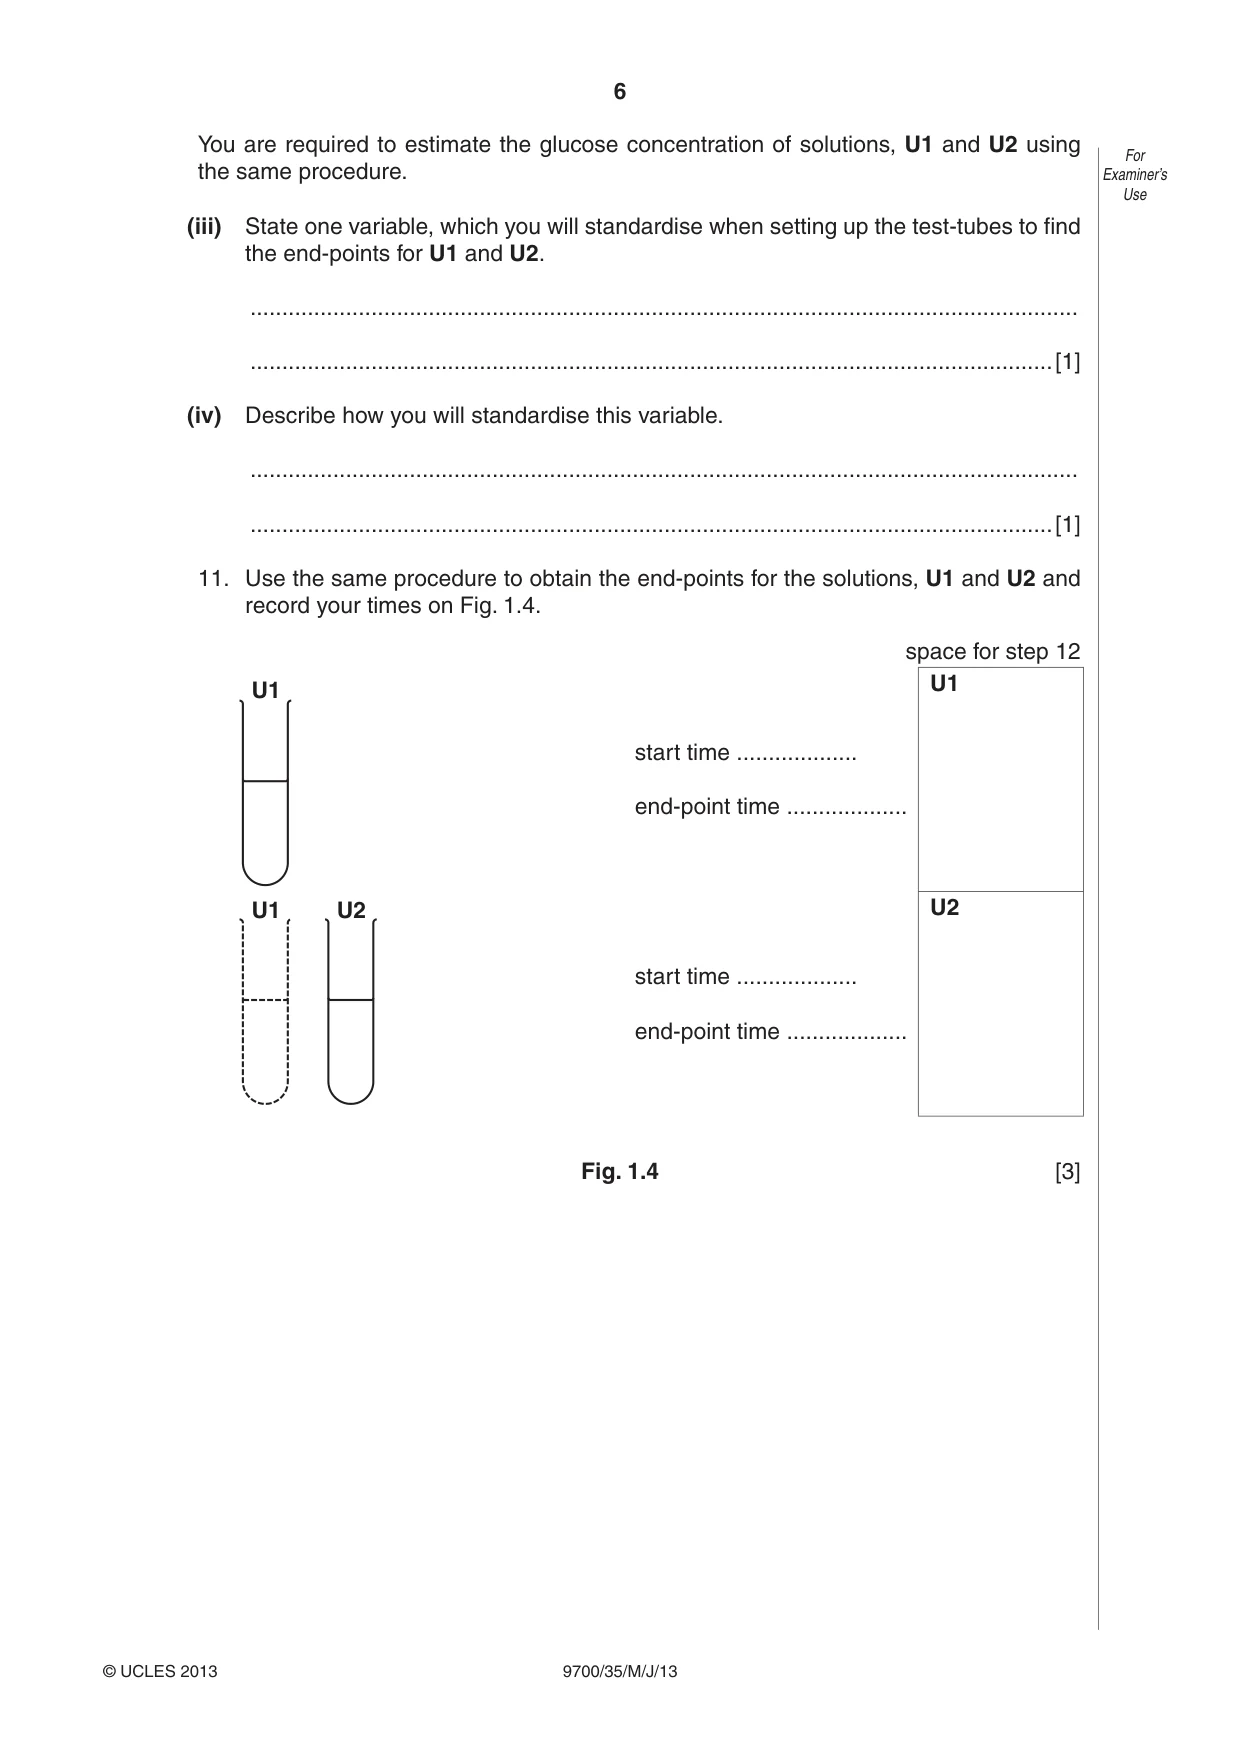
6 9700/35/M/J/13 © UCLES 2013 For Examiner’s Use You are required to estimate the glucose concentration of solutions, U1 and U2 using the same procedure. (iii) State one variable, which you will standardise when setting up the test-tubes to find the end-points for U1 and U2. … …[1] (iv) Describe how you will standardise this variable. … …[1] 11. Use the same procedure to obtain the end-points for the solutions, U1 and U2 and record your times on Fig. 1.4. space for step 12 U1 start time … end-point time … U1 U1 U2 start time … end-point time … U2 Fig. 1.4 [3]
Question paper, page 7
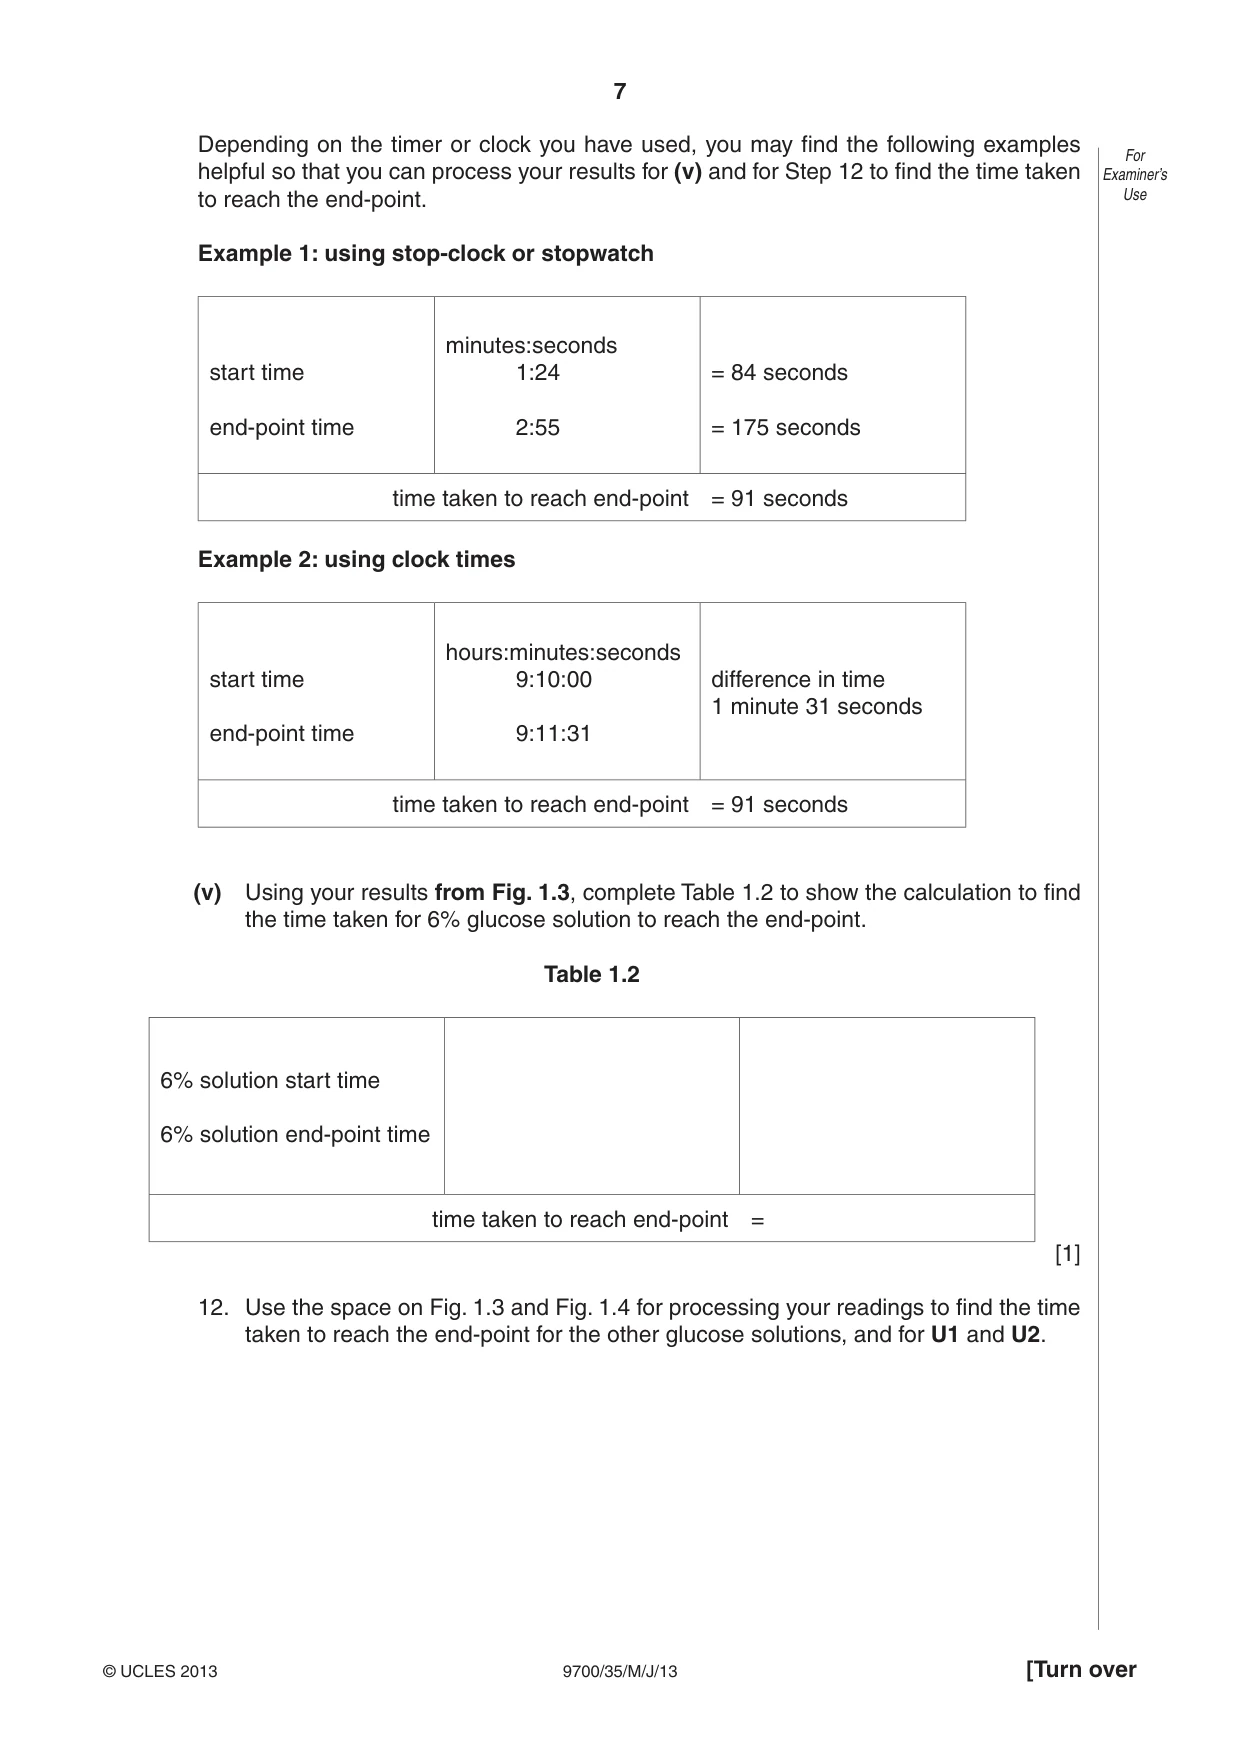
7 9700/35/M/J/13 © UCLES 2013 [Turn over For Examiner’s Use Depending on the timer or clock you have used, you may find the following examples helpful so that you can process your results for (v) and for Step 12 to find the time taken to reach the end-point. Example 1: using stop-clock or stopwatch start time end-point time minutes:seconds 1:24 2:55 = 84 seconds = 175 seconds time taken to reach end-point = 91 seconds Example 2: using clock times start time end-point time hours:minutes:seconds 9:10:00 9:11:31 difference in time 1 minute 31 seconds time taken to reach end-point = 91 seconds (v) Using your results from Fig. 1.3, complete Table 1.2 to show the calculation to find the time taken for 6% glucose solution to reach the end-point. Table 1.2 6% solution start time 6% solution end-point time time taken to reach end-point = [1] 12. Use the space on Fig. 1.3 and Fig. 1.4 for processing your readings to find the time taken to reach the end-point for the other glucose solutions, and for U1 and U2.
Question paper, page 8
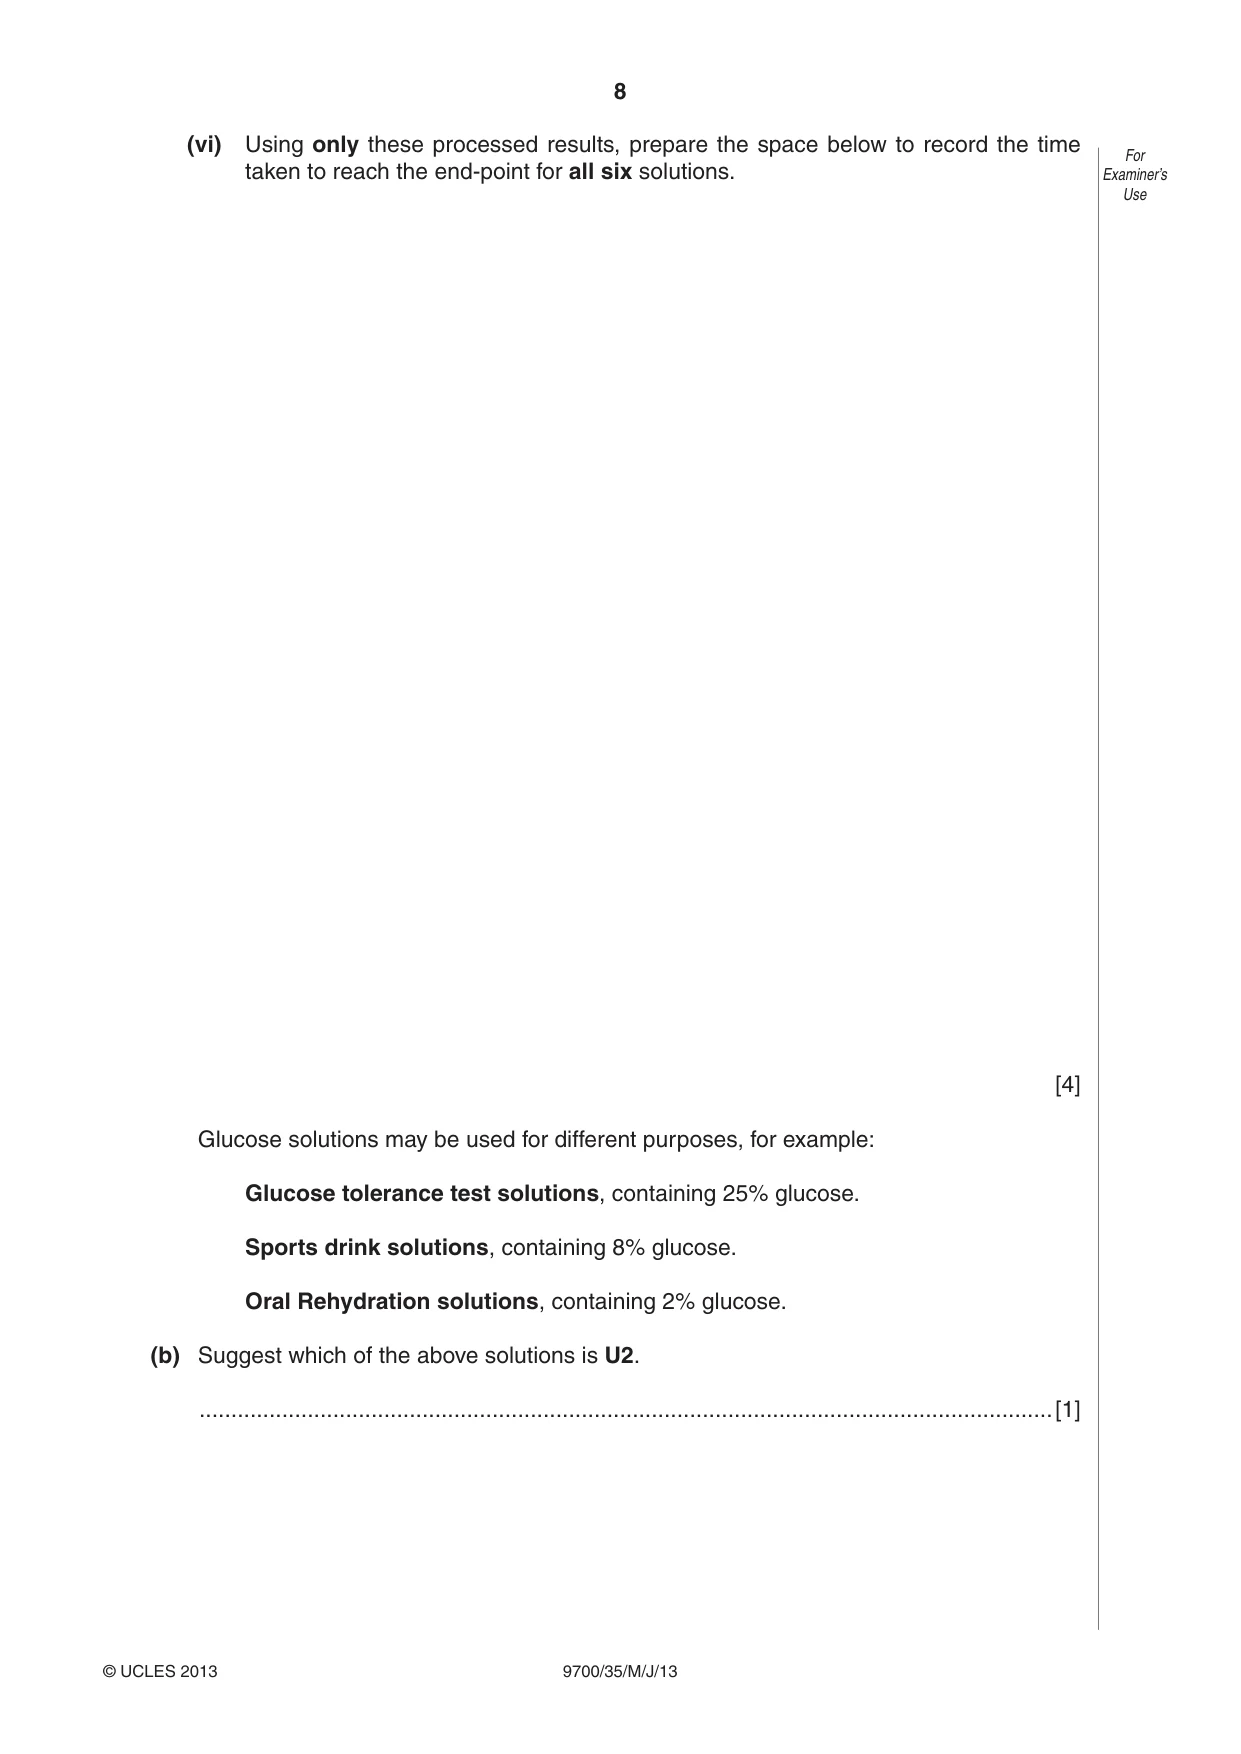
8 9700/35/M/J/13 © UCLES 2013 For Examiner’s Use (vi) Using only these processed results, prepare the space below to record the time taken to reach the end-point for all six solutions. [4] Glucose solutions may be used for different purposes, for example: Glucose tolerance test solutions, containing 25% glucose. Sports drink solutions, containing 8% glucose. Oral Rehydration solutions, containing 2% glucose. (b) Suggest which of the above solutions is U2. …[1]
Question paper, page 9
9 9700/35/M/J/13 © UCLES 2013 [Turn over For Examiner’s Use (c) (i) Identify one significant source of error in your investigation. … … …[1] (ii) Describe two modifications to this investigation which would improve the confidence in your results. … … … … … … …[2] [Total: 17] Question 2 starts on page 10
Question paper, page 10
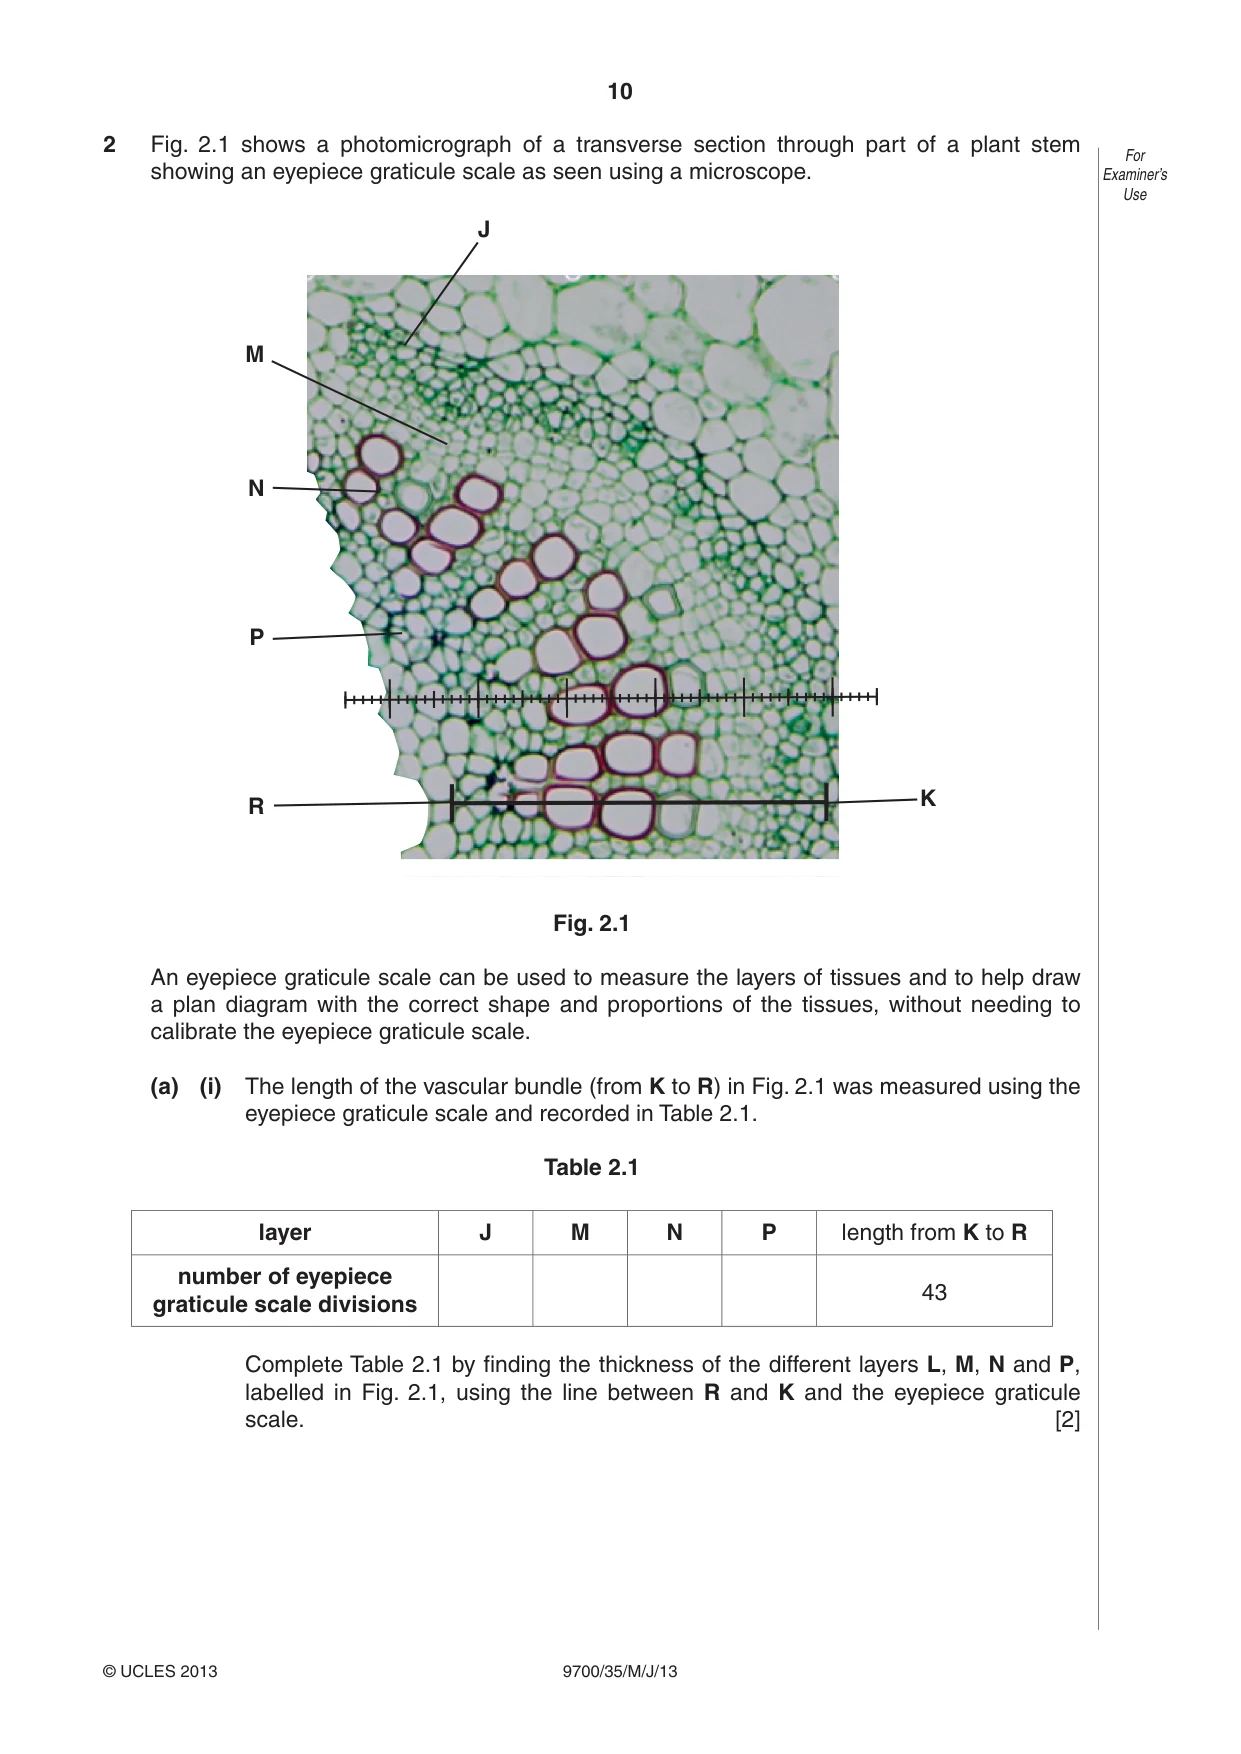
10 9700/35/M/J/13 © UCLES 2013 For Examiner’s Use 2 Fig. 2.1 shows a photomicrograph of a transverse section through part of a plant stem showing an eyepiece graticule scale as seen using a microscope. M N P R J K Fig. 2.1 An eyepiece graticule scale can be used to measure the layers of tissues and to help draw a plan diagram with the correct shape and proportions of the tissues, without needing to calibrate the eyepiece graticule scale. (a) (i) The length of the vascular bundle (from K to R) in Fig. 2.1 was measured using the eyepiece graticule scale and recorded in Table 2.1. Table 2.1 layer J M N P length from K to R number of eyepiece graticule scale divisions 43 Complete Table 2.1 by finding the thickness of the different layers L, M, N and P, labelled in Fig. 2.1, using the line between R and K and the eyepiece graticule scale. [2]
Question paper, page 11
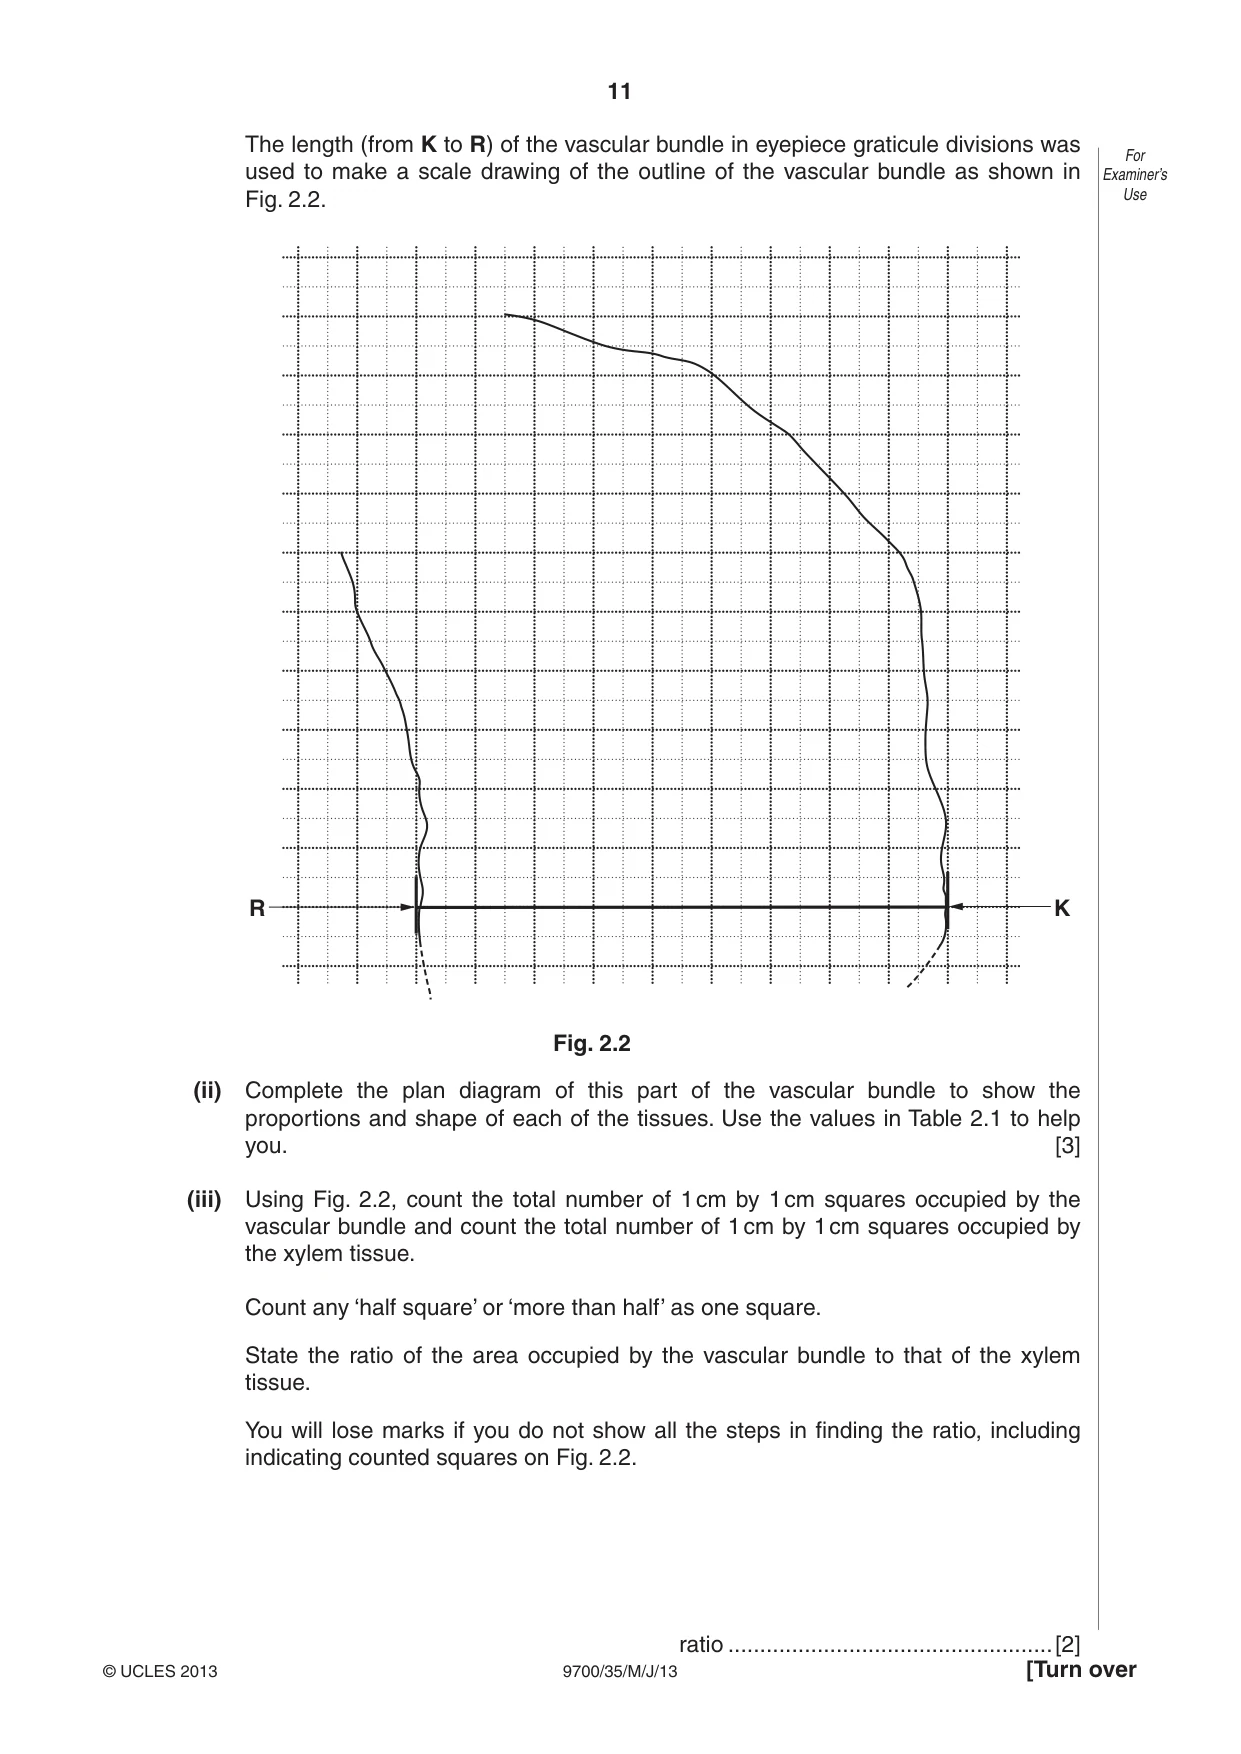
11 9700/35/M/J/13 © UCLES 2013 [Turn over For Examiner’s Use The length (from K to R) of the vascular bundle in eyepiece graticule divisions was used to make a scale drawing of the outline of the vascular bundle as shown in Fig. 2.2. R K Fig. 2.2 (ii) Complete the plan diagram of this part of the vascular bundle to show the proportions and shape of each of the tissues. Use the values in Table 2.1 to help you. [3] (iii) Using Fig. 2.2, count the total number of 1 cm by 1 cm squares occupied by the vascular bundle and count the total number of 1 cm by 1 cm squares occupied by the xylem tissue. Count any ‘half square’ or ‘more than half’ as one square. State the ratio of the area occupied by the vascular bundle to that of the xylem tissue. You will lose marks if you do not show all the steps in finding the ratio, including indicating counted squares on Fig. 2.2. ratio …[2]
Question paper, page 12
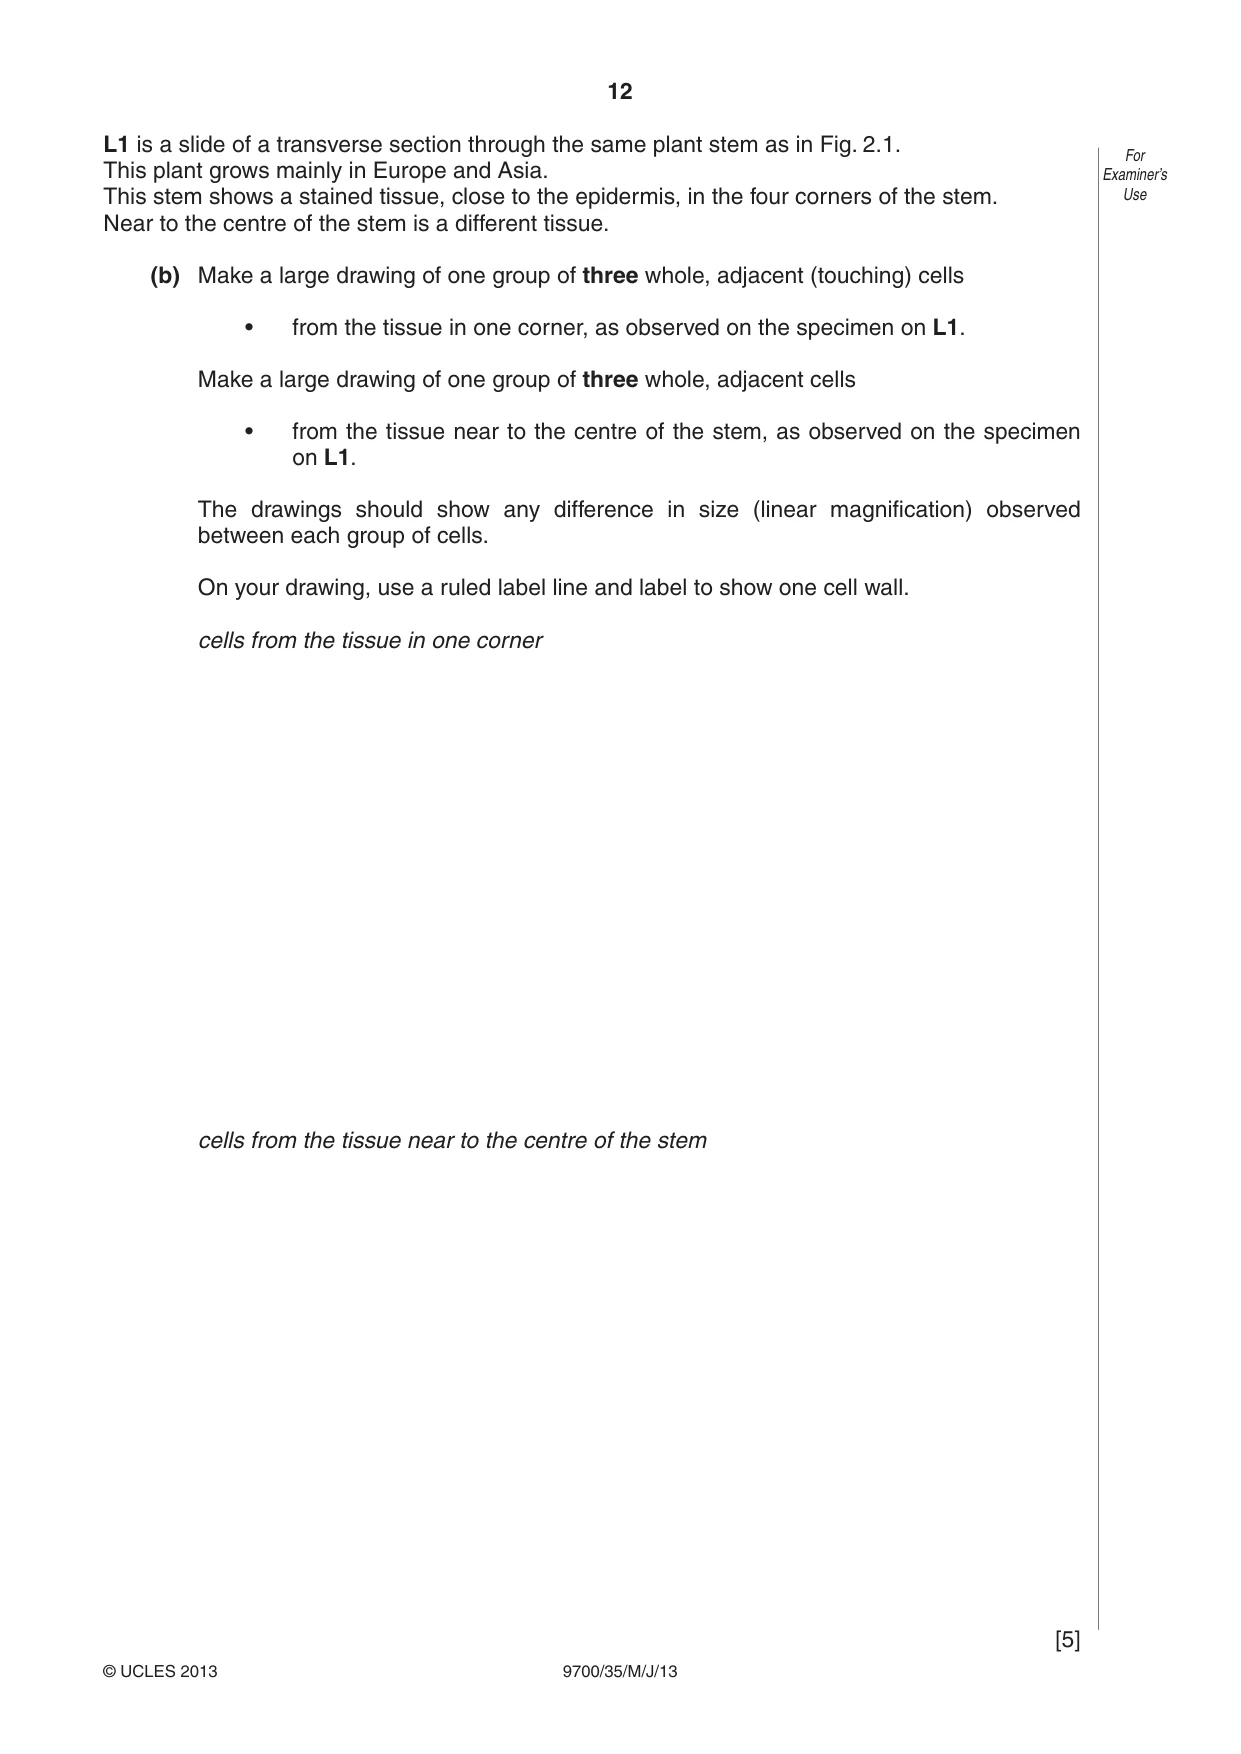
12 9700/35/M/J/13 © UCLES 2013 For Examiner’s Use L1 is a slide of a transverse section through the same plant stem as in Fig. 2.1. This plant grows mainly in Europe and Asia. This stem shows a stained tissue, close to the epidermis, in the four corners of the stem. Near to the centre of the stem is a different tissue. (b) Make a large drawing of one group of three whole, adjacent (touching) cells • from the tissue in one corner, as observed on the specimen on L1. Make a large drawing of one group of three whole, adjacent cells • from the tissue near to the centre of the stem, as observed on the specimen on L1. The drawings should show any difference in size (linear magnification) observed between each group of cells. On your drawing, use a ruled label line and label to show one cell wall. cells from the tissue in one corner cells from the tissue near to the centre of the stem [5]
Question paper, page 13
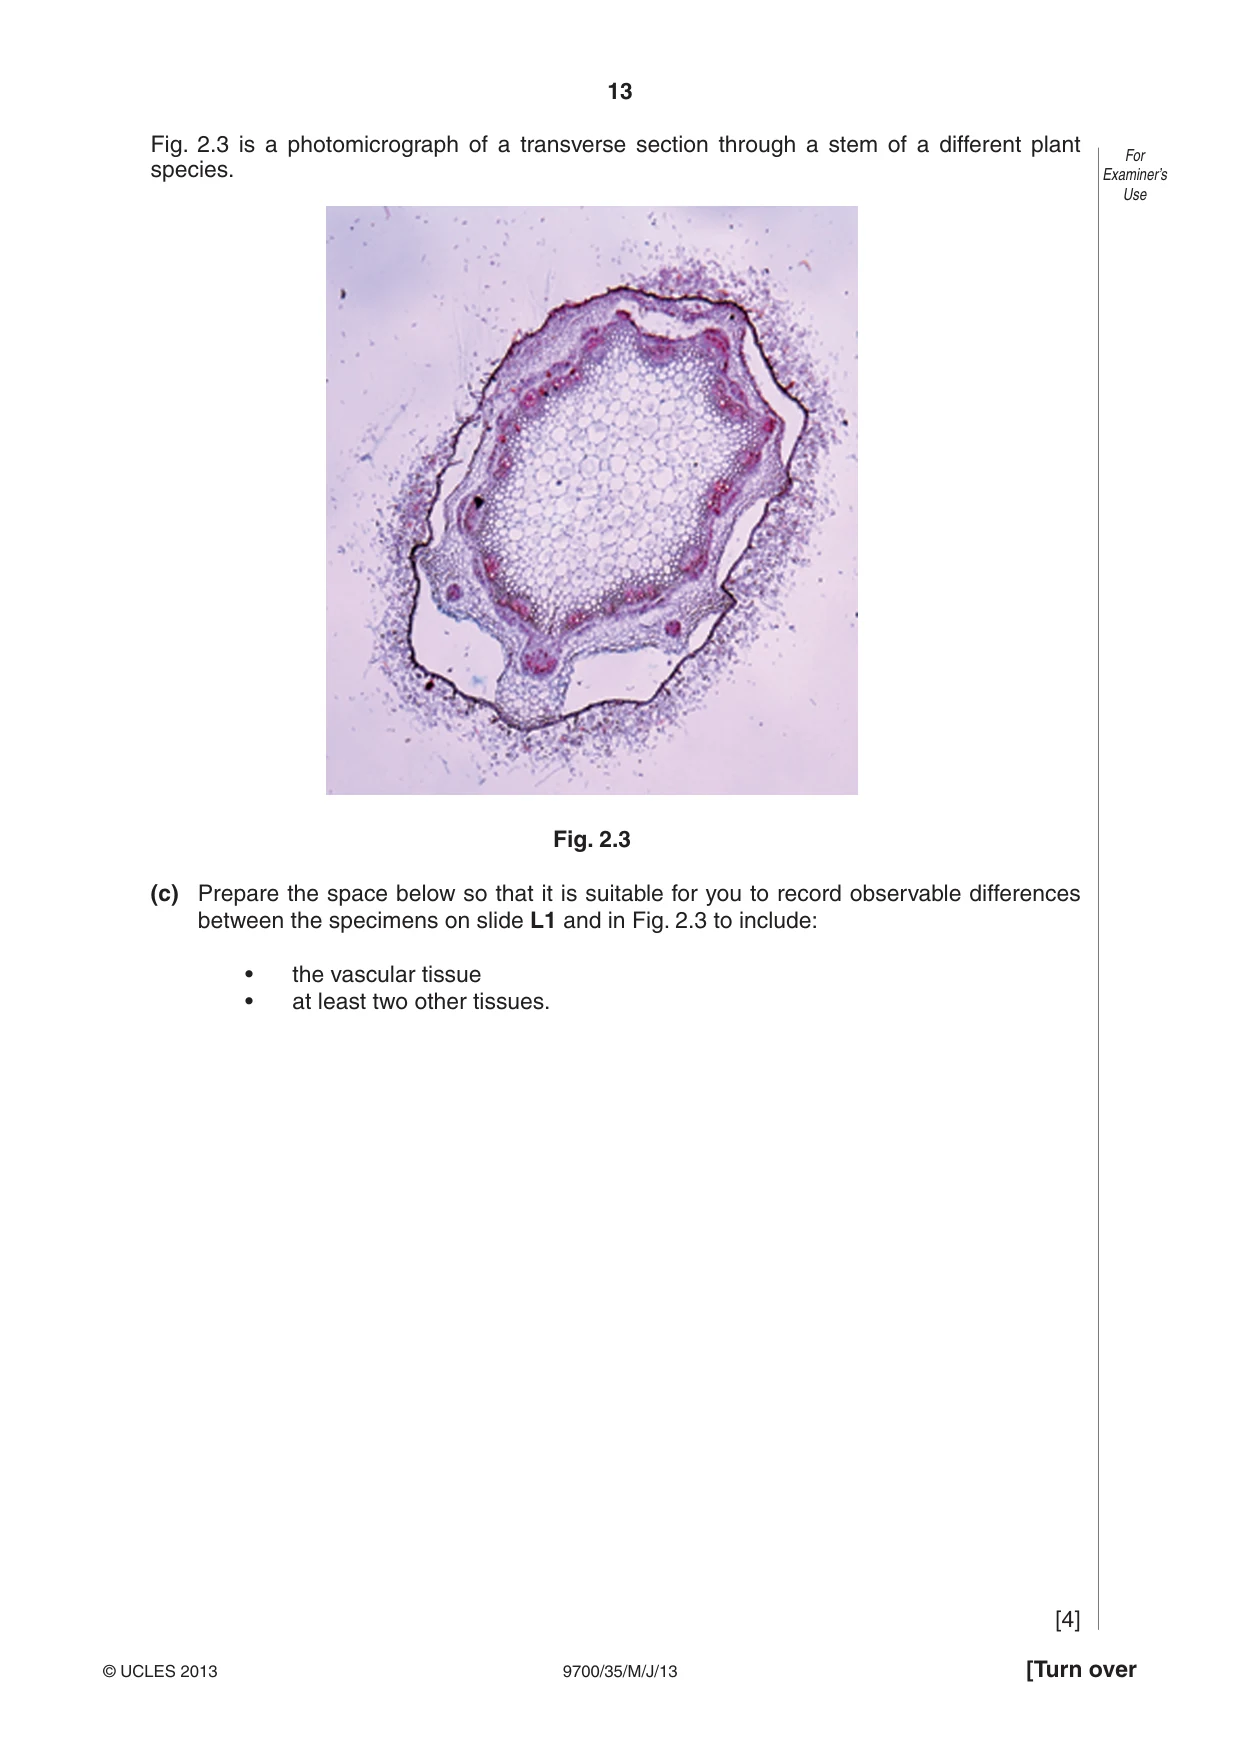
13 9700/35/M/J/13 © UCLES 2013 [Turn over For Examiner’s Use Fig. 2.3 is a photomicrograph of a transverse section through a stem of a different plant species. Fig. 2.3 (c) Prepare the space below so that it is suitable for you to record observable differences between the specimens on slide L1 and in Fig. 2.3 to include: • the vascular tissue • at least two other tissues. [4]
Question paper, page 14
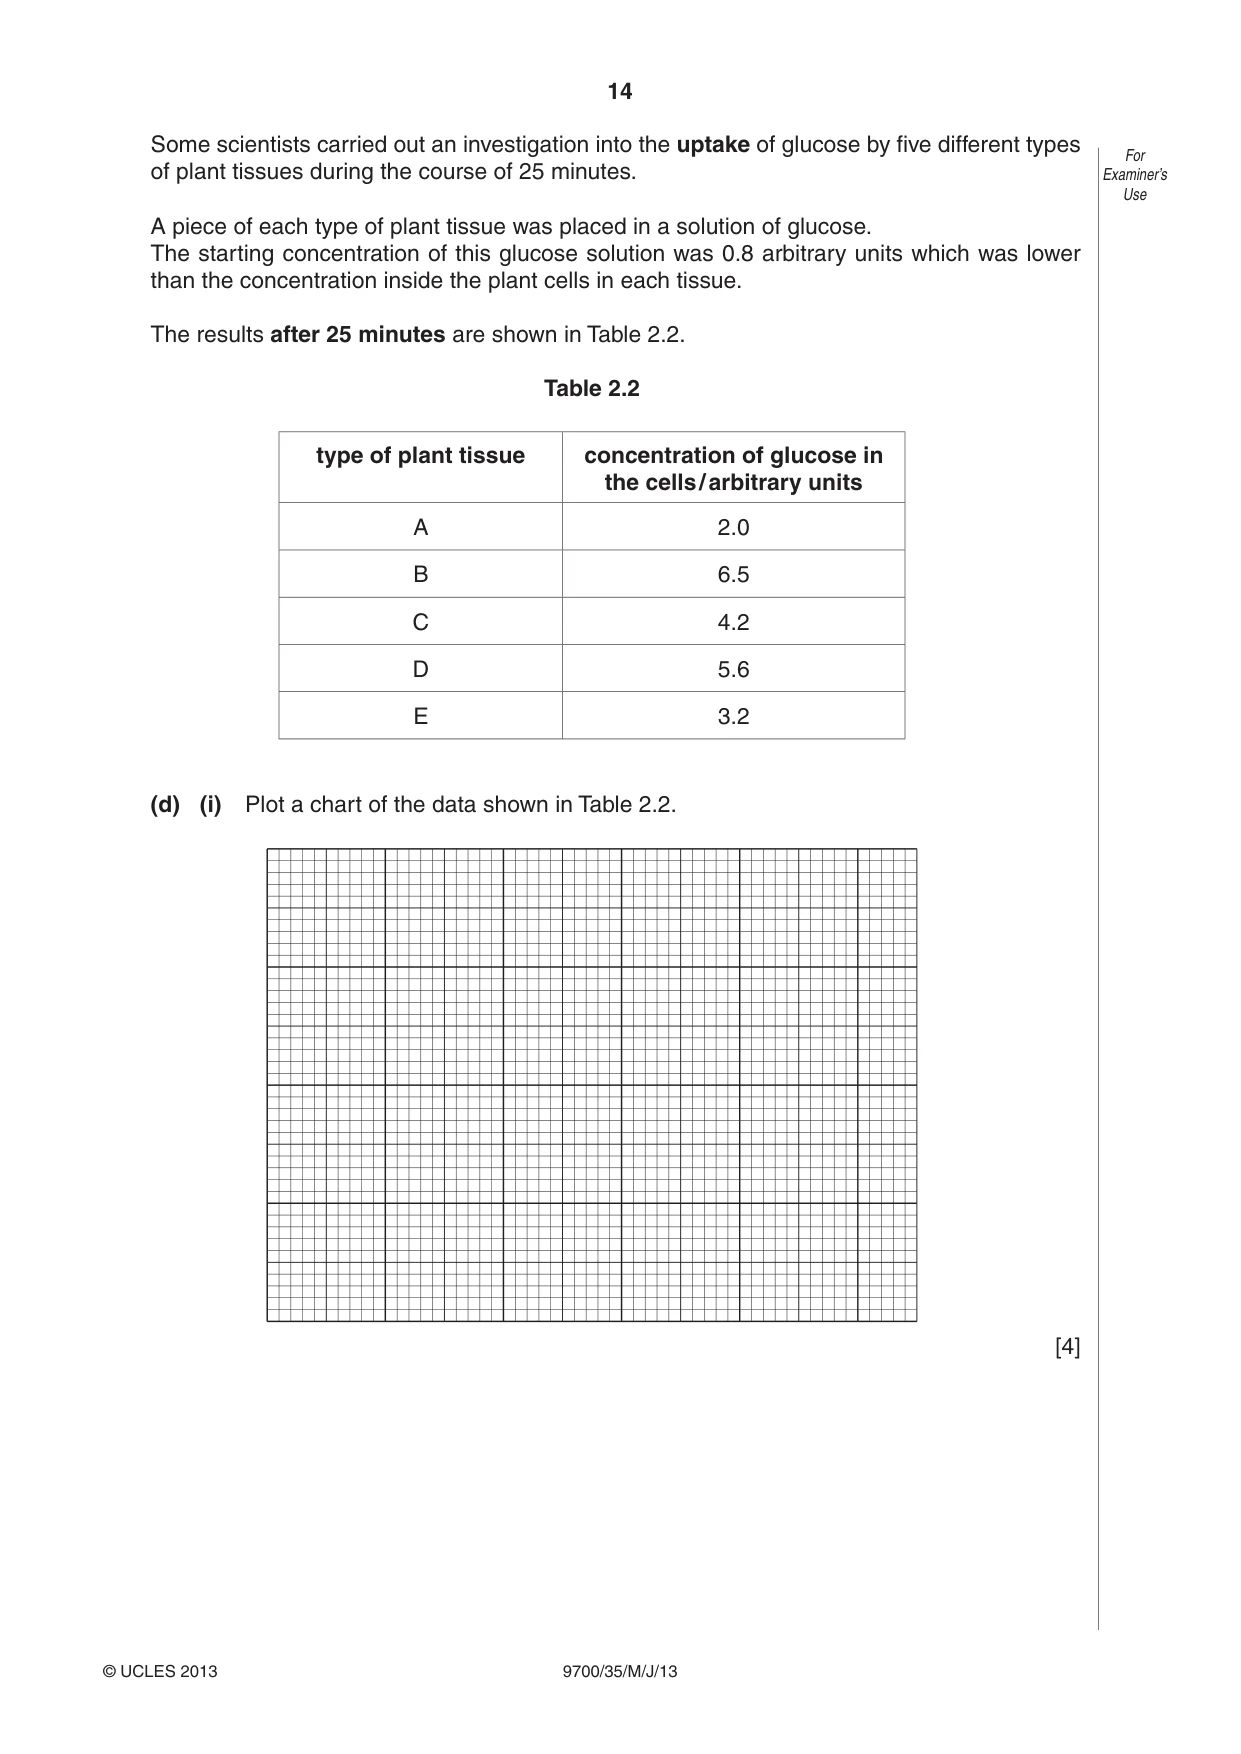
14 9700/35/M/J/13 © UCLES 2013 For Examiner’s Use Some scientists carried out an investigation into the uptake of glucose by five different types of plant tissues during the course of 25 minutes. A piece of each type of plant tissue was placed in a solution of glucose. The starting concentration of this glucose solution was 0.8 arbitrary units which was lower than the concentration inside the plant cells in each tissue. The results after 25 minutes are shown in Table 2.2. Table 2.2 type of plant tissue concentration of glucose in the cells / arbitrary units A 2.0 B 6.5 C 4.2 D 5.6 E 3.2 (d) (i) Plot a chart of the data shown in Table 2.2. [4]
Question paper, page 15
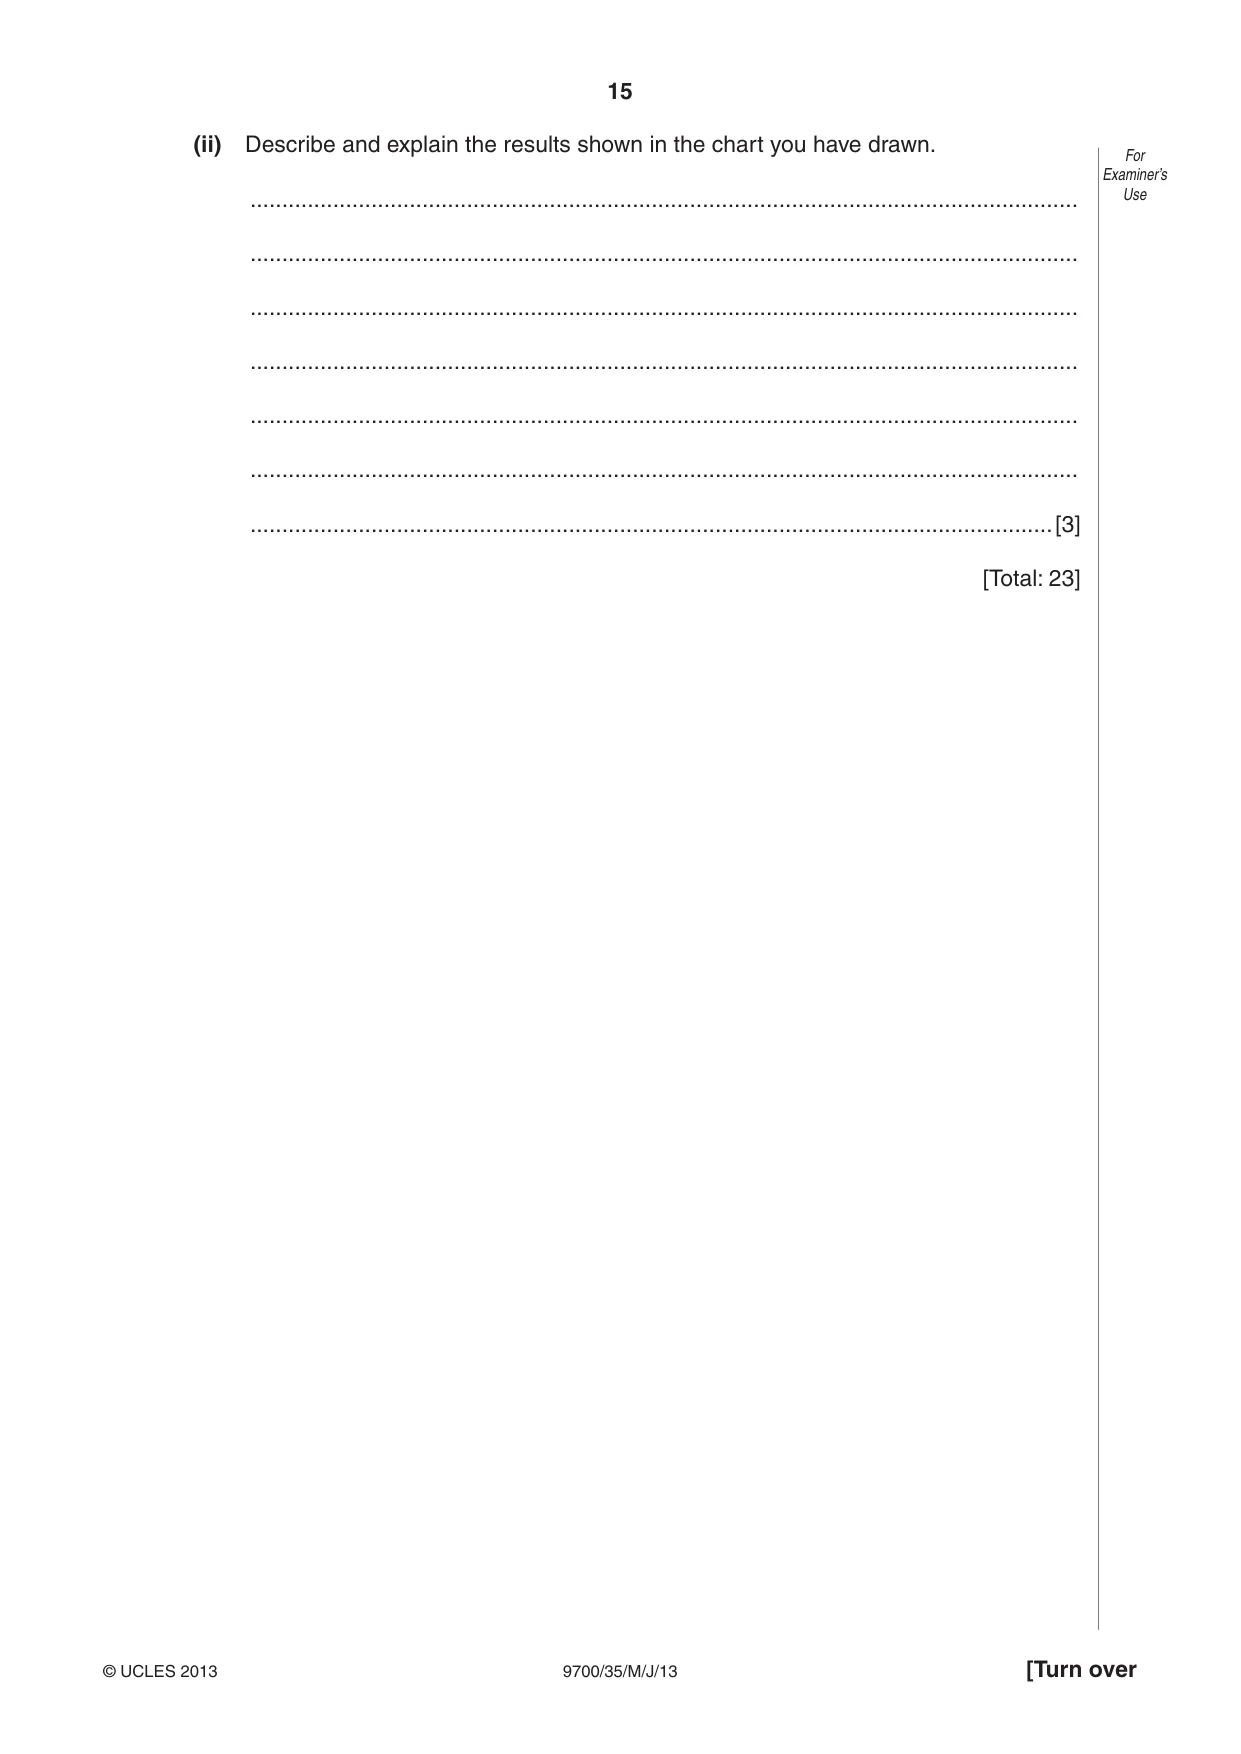
15 9700/35/M/J/13 © UCLES 2013 [Turn over For Examiner’s Use (ii) Describe and explain the results shown in the chart you have drawn. … … … … … … …[3] [Total: 23]
Question paper, page 16
16 9700/35/M/J/13 © UCLES 2013 BLANK PAGE Permission to reproduce items where third-party owned material protected by copyright is included has been sought and cleared where possible. Every reasonable effort has been made by the publisher (UCLES) to trace copyright holders, but if any items requiring clearance have unwittingly been included, the publisher will be pleased to make amends at the earliest possible opportunity. University of Cambridge International Examinations is part of the Cambridge Assessment Group. Cambridge Assessment is the brand name of University of Cambridge Local Examinations Syndicate (UCLES), which is itself a department of the University of Cambridge.
Mark scheme, page 1
CAMBRIDGE INTERNATIONAL EXAMINATIONS GCE Advanced Subsidiary Level and GCE Advanced Level MARK SCHEME for the May/June 2013 series 9700 BIOLOGY 9700/35 Paper 35 (Advanced Practical Skills 1), maximum raw mark 40 This mark scheme is published as an aid to teachers and candidates, to indicate the requirements of the examination. It shows the basis on which Examiners were instructed to award marks. It does not indicate the details of the discussions that took place at an Examiners’ meeting before marking began, which would have considered the acceptability of alternative answers. Mark schemes should be read in conjunction with the question paper and the Principal Examiner Report for Teachers. Cambridge will not enter into discussions about these mark schemes. Cambridge is publishing the mark schemes for the May/June 2013 series for most IGCSE, GCE Advanced Level and Advanced Subsidiary Level components and some Ordinary Level components.
Mark scheme, page 2
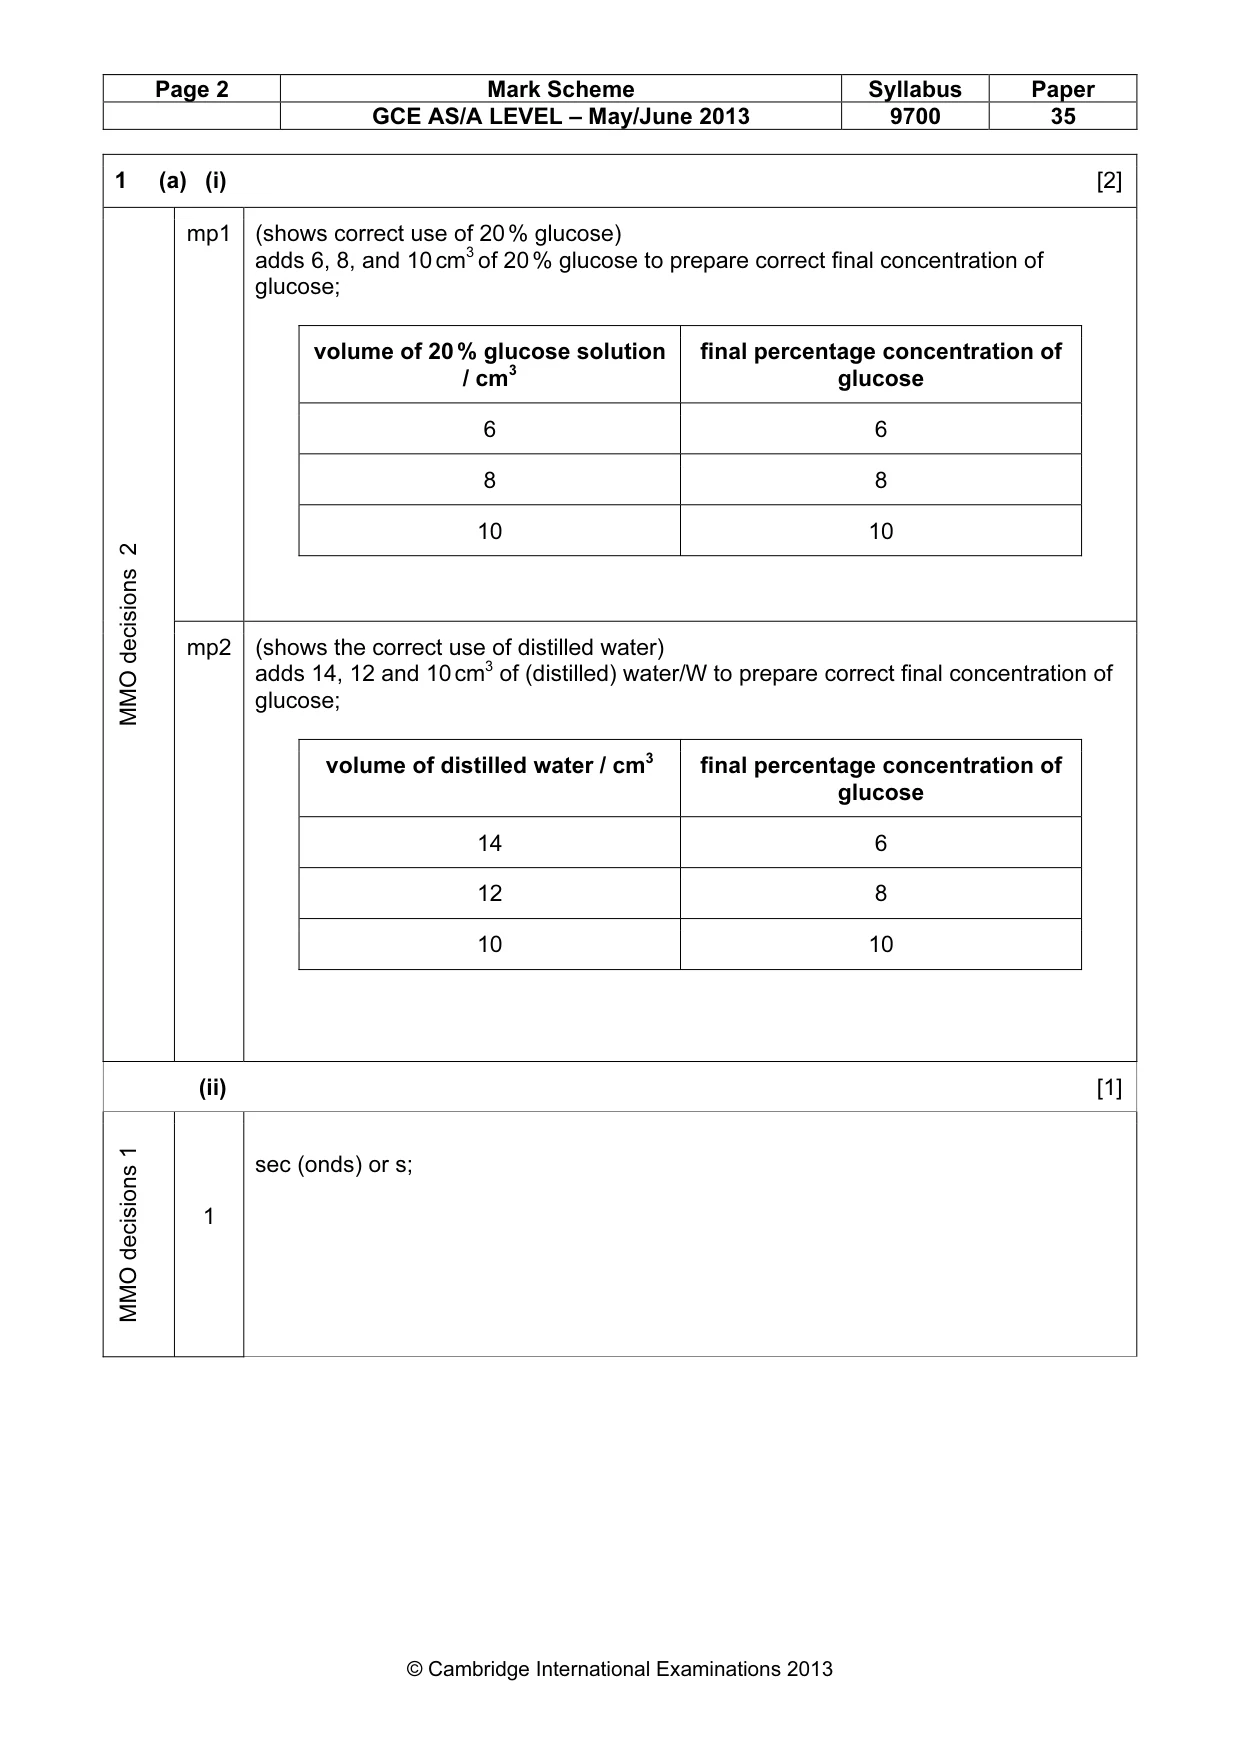
Page 2 Mark Scheme Syllabus Paper GCE AS/A LEVEL – May/June 2013 9700 35 © Cambridge International Examinations 2013 1 (a) (i) [2] MMO decisions 2 mp1 (shows correct use of 20 % glucose) adds 6, 8, and 10 cm3 of 20 % glucose to prepare correct final concentration of glucose; volume of 20 % glucose solution / cm3 final percentage concentration of glucose 6 6 8 8 10 10 mp2 (shows the correct use of distilled water) adds 14, 12 and 10 cm3 of (distilled) water/W to prepare correct final concentration of glucose; volume of distilled water / cm3 final percentage concentration of glucose 14 6 12 8 10 10 (ii) [1] MMO decisions 1 1 sec (onds) or s;
Mark scheme, page 3
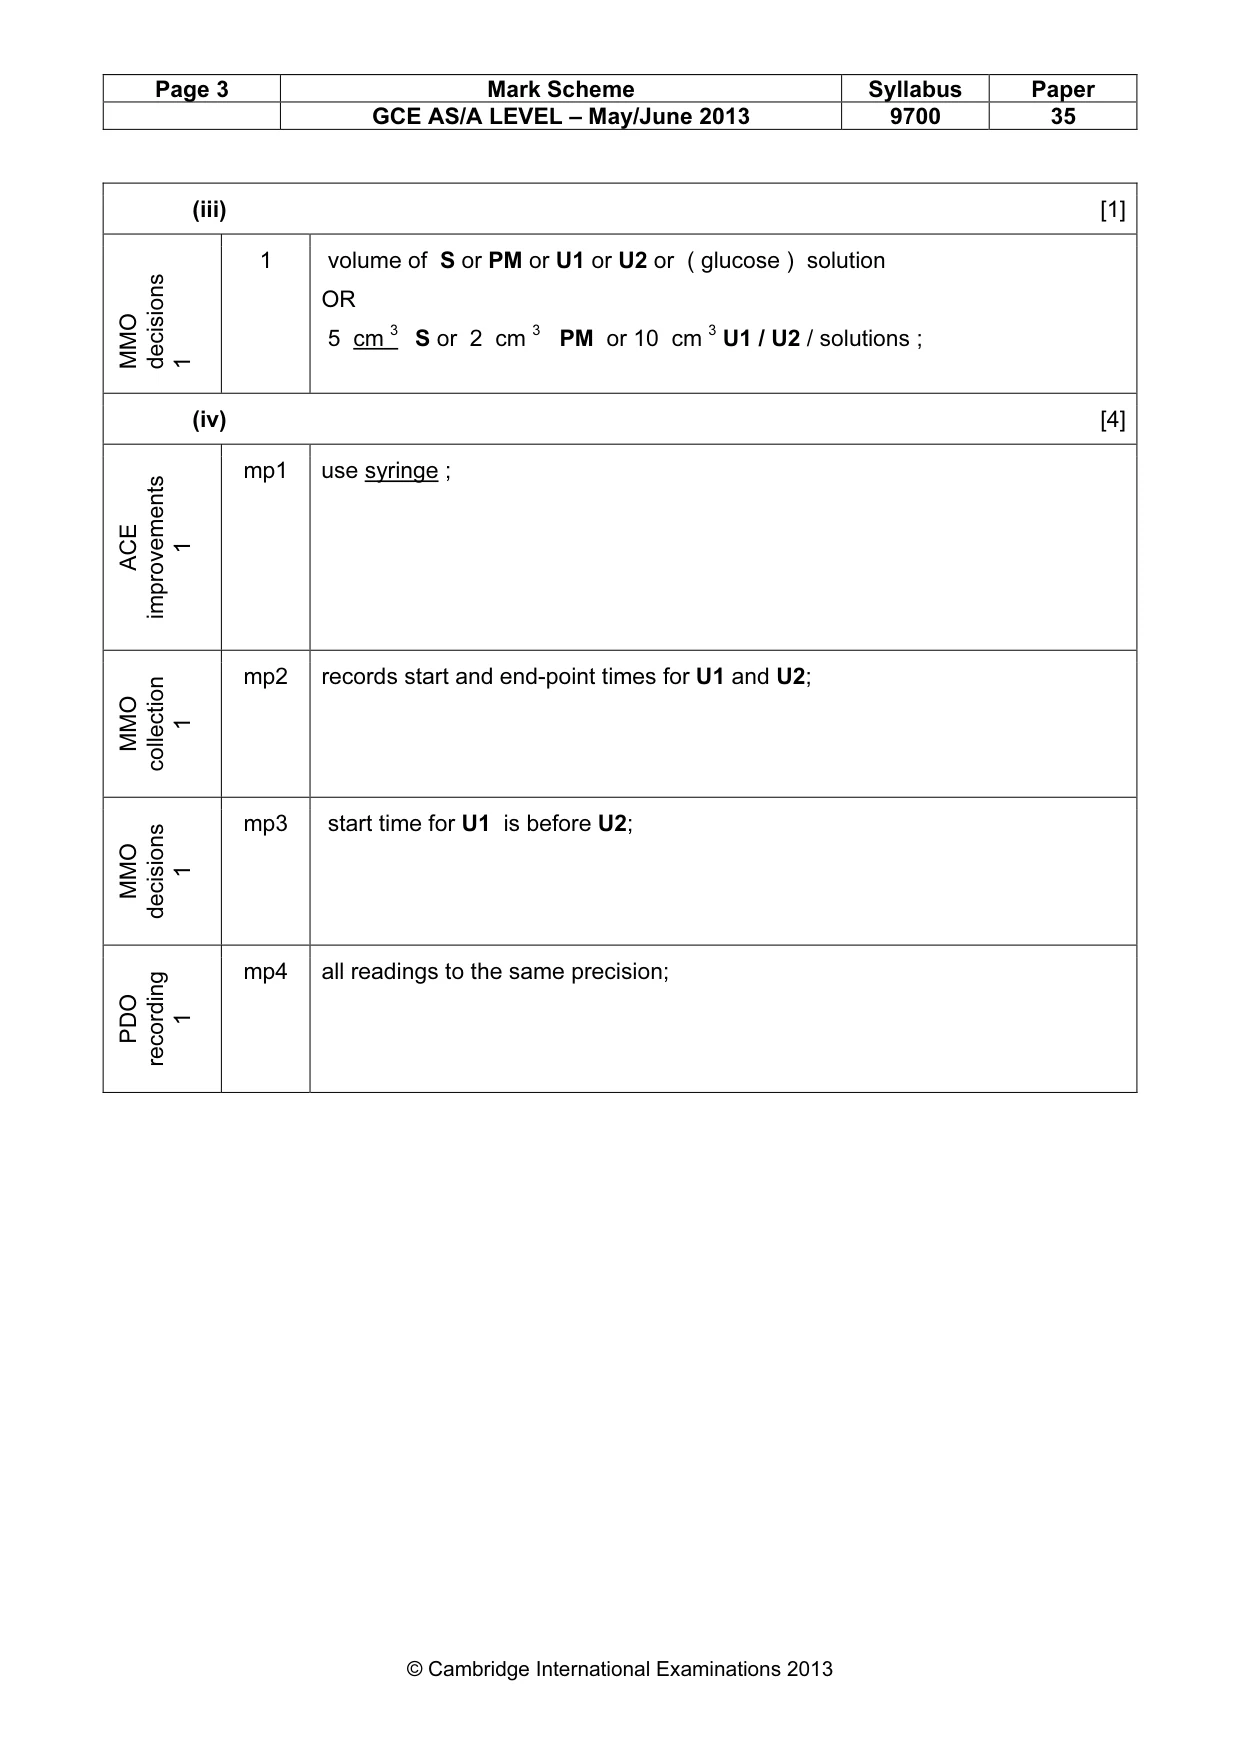
Page 3 Mark Scheme Syllabus Paper GCE AS/A LEVEL – May/June 2013 9700 35 © Cambridge International Examinations 2013 (iii) [1] MMO decisions 1 1 volume of S or PM or U1 or U2 or ( glucose ) solution OR 5 cm 3 S or 2 cm 3 PM or 10 cm 3 U1 / U2 / solutions ; (iv) [4] ACE improvements 1 mp1 use syringe ; MMO collection 1 mp2 records start and end-point times for U1 and U2; MMO decisions 1 mp3 start time for U1 is before U2; PDO recording 1 mp4 all readings to the same precision;
Mark scheme, page 4
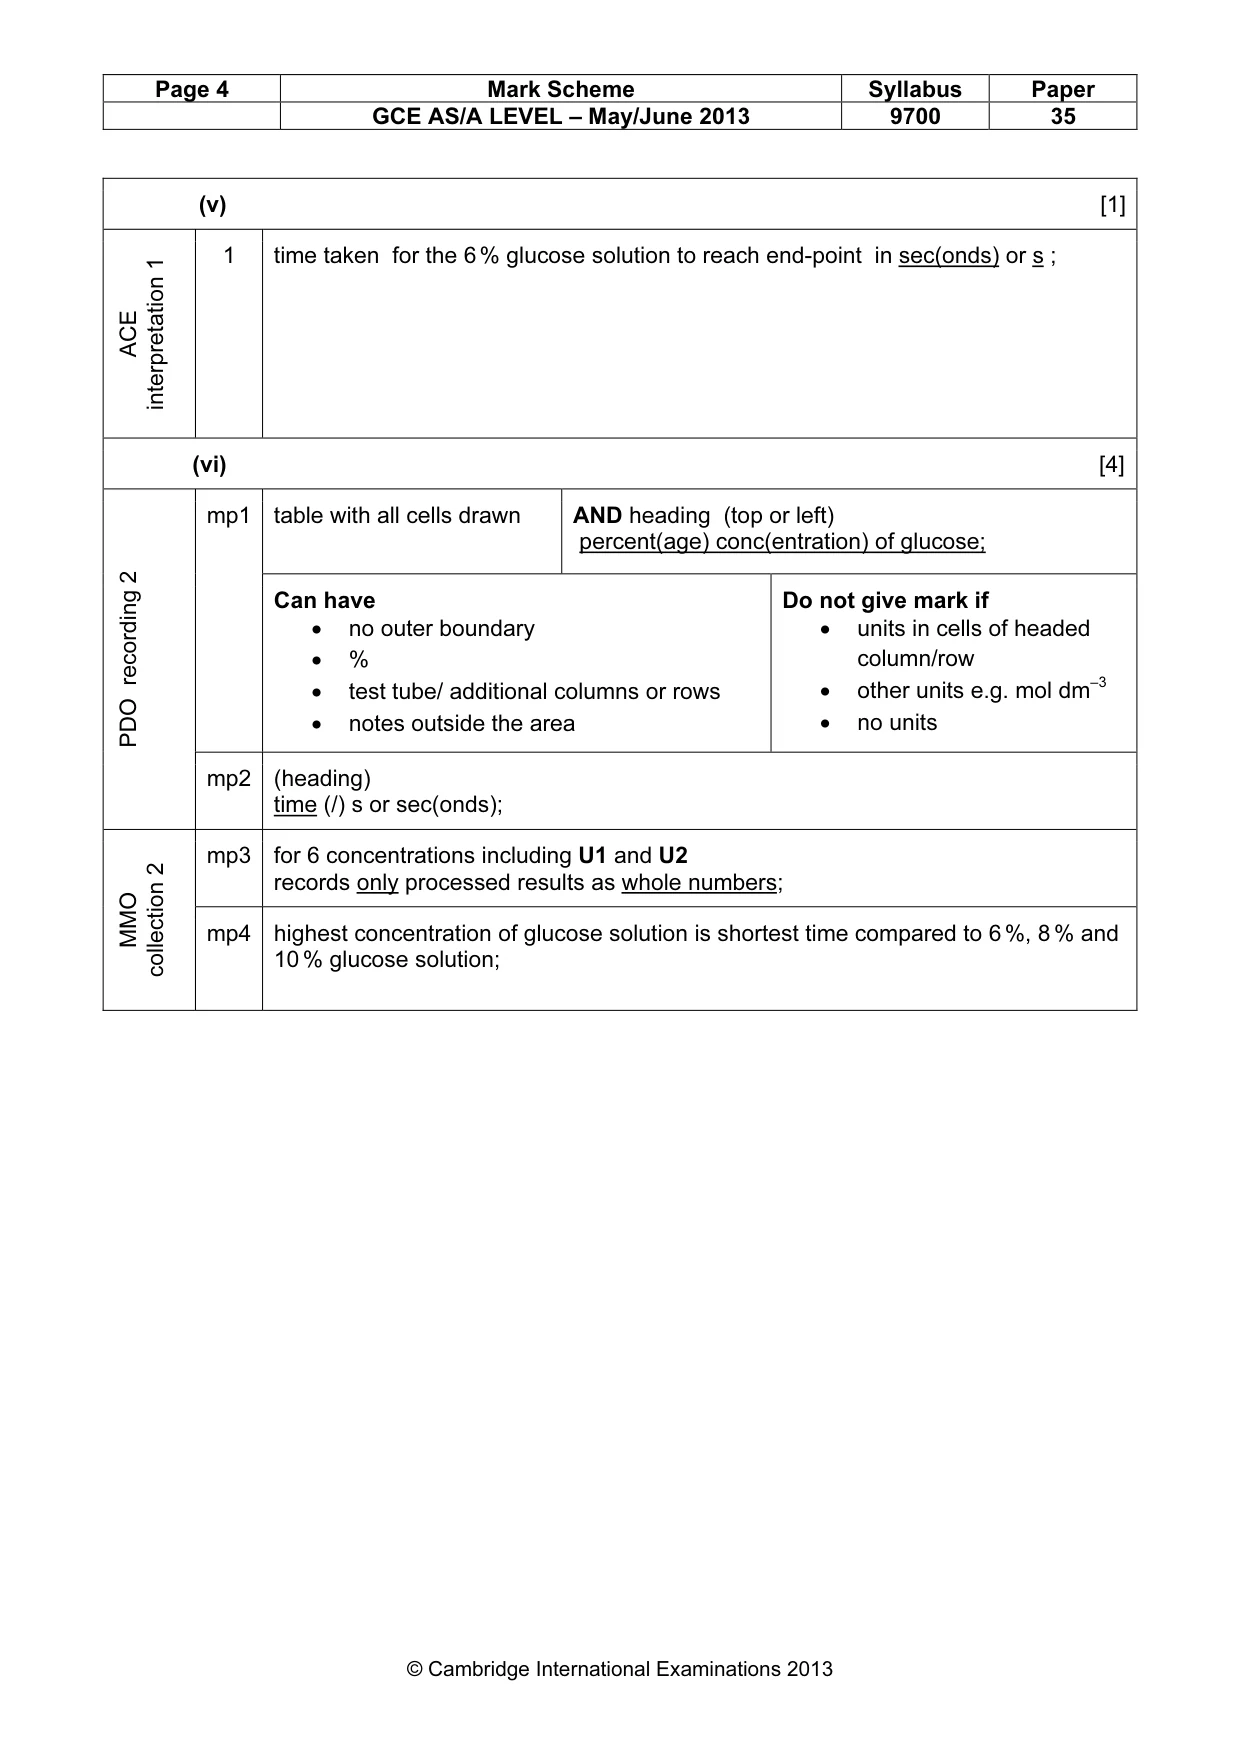
Page 4 Mark Scheme Syllabus Paper GCE AS/A LEVEL – May/June 2013 9700 35 © Cambridge International Examinations 2013 (v) [1] ACE interpretation 1 1 time taken for the 6 % glucose solution to reach end-point in sec(onds) or s ; (vi) [4] PDO recording 2 mp1 table with all cells drawn AND heading (top or left) percent(age) conc(entration) of glucose; Can have • no outer boundary • % • test tube/ additional columns or rows • notes outside the area Do not give mark if • units in cells of headed column/row • other units e.g. mol dm–3 • no units mp2 (heading) time (/) s or sec(onds); MMO collection 2 mp3 for 6 concentrations including U1 and U2 records only processed results as whole numbers; mp4 highest concentration of glucose solution is shortest time compared to 6 %, 8 % and 10 % glucose solution;
Mark scheme, page 5
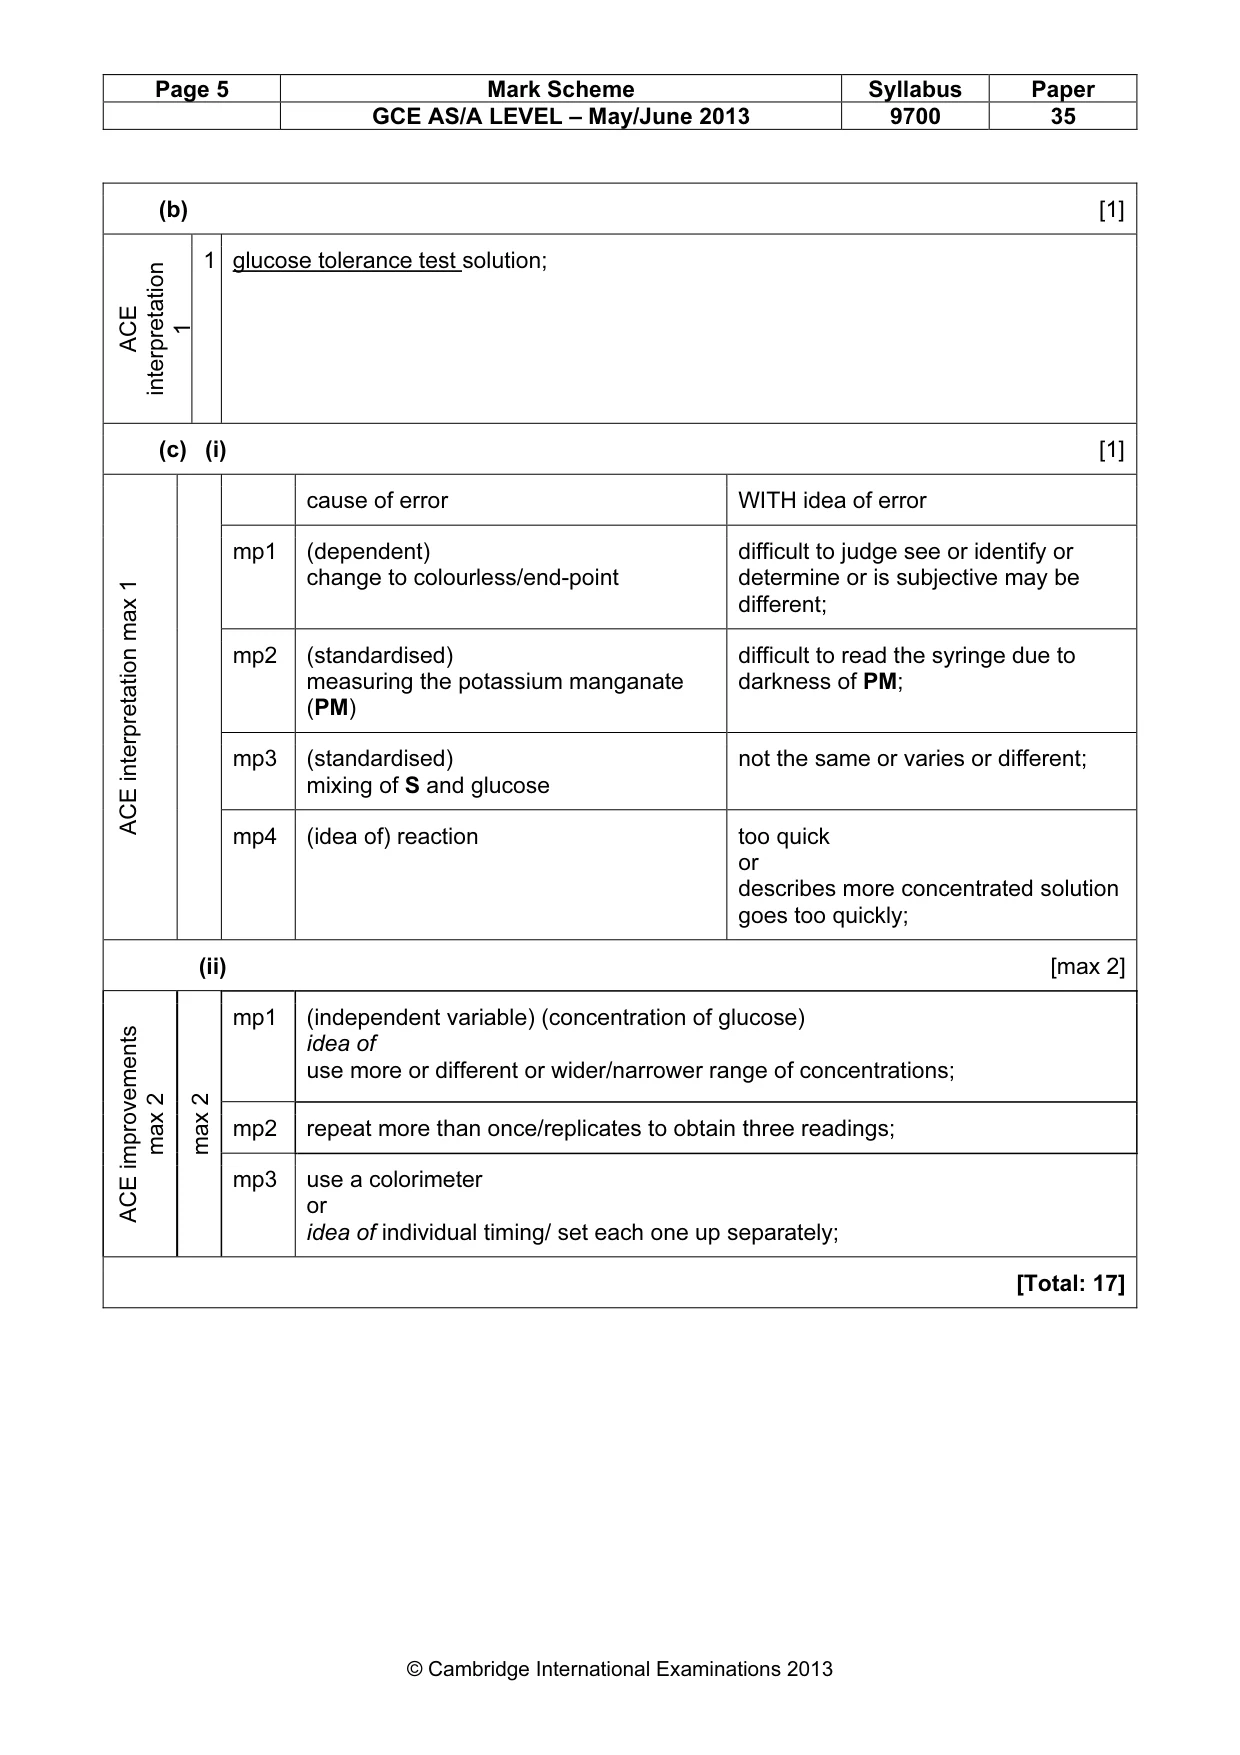
Page 5 Mark Scheme Syllabus Paper GCE AS/A LEVEL – May/June 2013 9700 35 © Cambridge International Examinations 2013 (b) [1] ACE interpretation 1 1 glucose tolerance test solution; (c) (i) [1] ACE interpretation max 1 cause of error WITH idea of error mp1 (dependent) change to colourless/end-point difficult to judge see or identify or determine or is subjective may be different; mp2 (standardised) measuring the potassium manganate (PM) difficult to read the syringe due to darkness of PM; mp3 (standardised) mixing of S and glucose not the same or varies or different; mp4 (idea of) reaction too quick or describes more concentrated solution goes too quickly; (ii) [max 2] ACE improvements max 2 max 2 mp1 (independent variable) (concentration of glucose) idea of use more or different or wider/narrower range of concentrations; mp2 repeat more than once/replicates to obtain three readings; mp3 use a colorimeter or idea of individual timing/ set each one up separately; [Total: 17]
Mark scheme, page 6
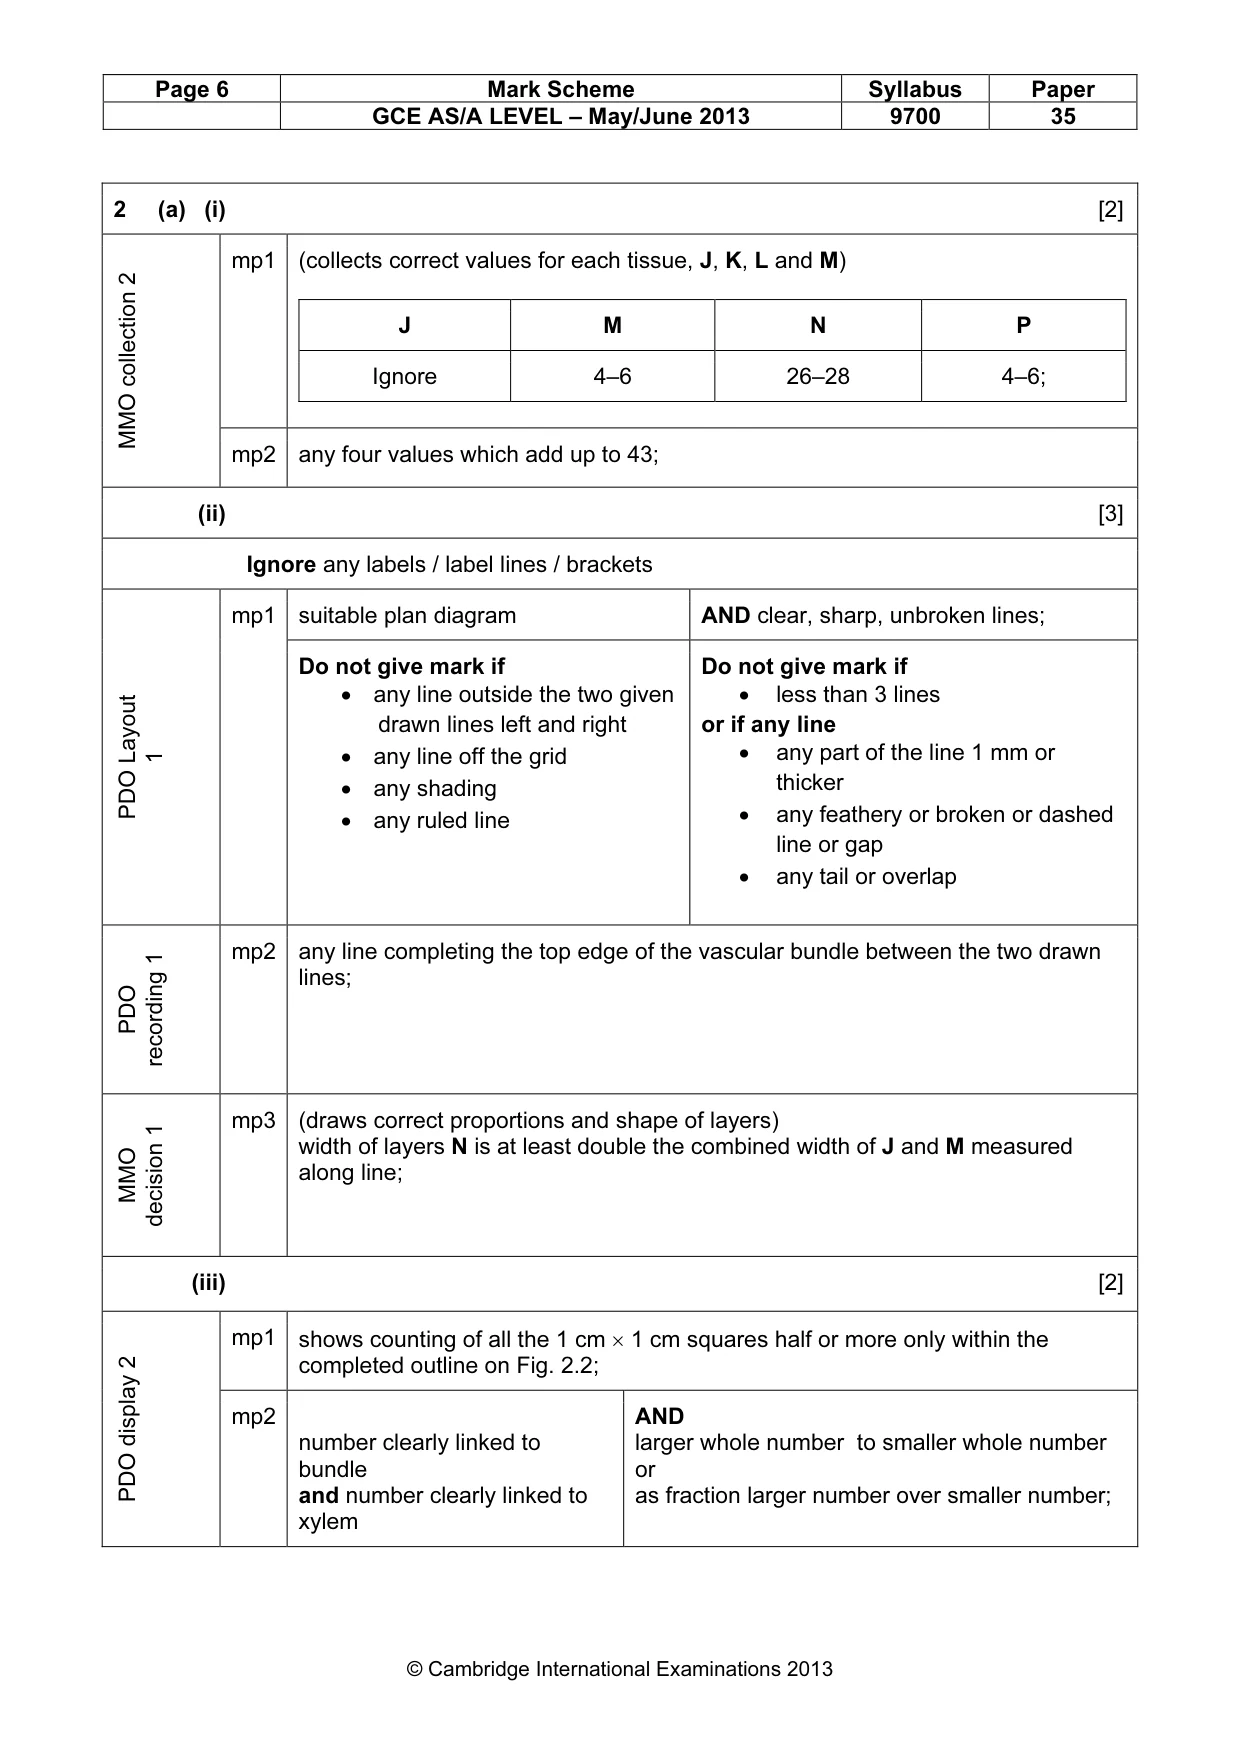
Page 6 Mark Scheme Syllabus Paper GCE AS/A LEVEL – May/June 2013 9700 35 © Cambridge International Examinations 2013 2 (a) (i) [2] MMO collection 2 mp1 (collects correct values for each tissue, J, K, L and M) J M N P Ignore 4–6 26–28 4–6; mp2 any four values which add up to 43; (ii) [3] Ignore any labels / label lines / brackets PDO Layout 1 mp1 suitable plan diagram AND clear, sharp, unbroken lines; Do not give mark if • any line outside the two given drawn lines left and right • any line off the grid • any shading • any ruled line Do not give mark if • less than 3 lines or if any line • any part of the line 1 mm or thicker • any feathery or broken or dashed line or gap • any tail or overlap PDO recording 1 mp2 any line completing the top edge of the vascular bundle between the two drawn lines; MMO decision 1 mp3 (draws correct proportions and shape of layers) width of layers N is at least double the combined width of J and M measured along line; (iii) [2] PDO display 2 mp1 shows counting of all the 1 cm × 1 cm squares half or more only within the completed outline on Fig. 2.2; mp2 number clearly linked to bundle and number clearly linked to xylem AND larger whole number to smaller whole number or as fraction larger number over smaller number;
Mark scheme, page 7
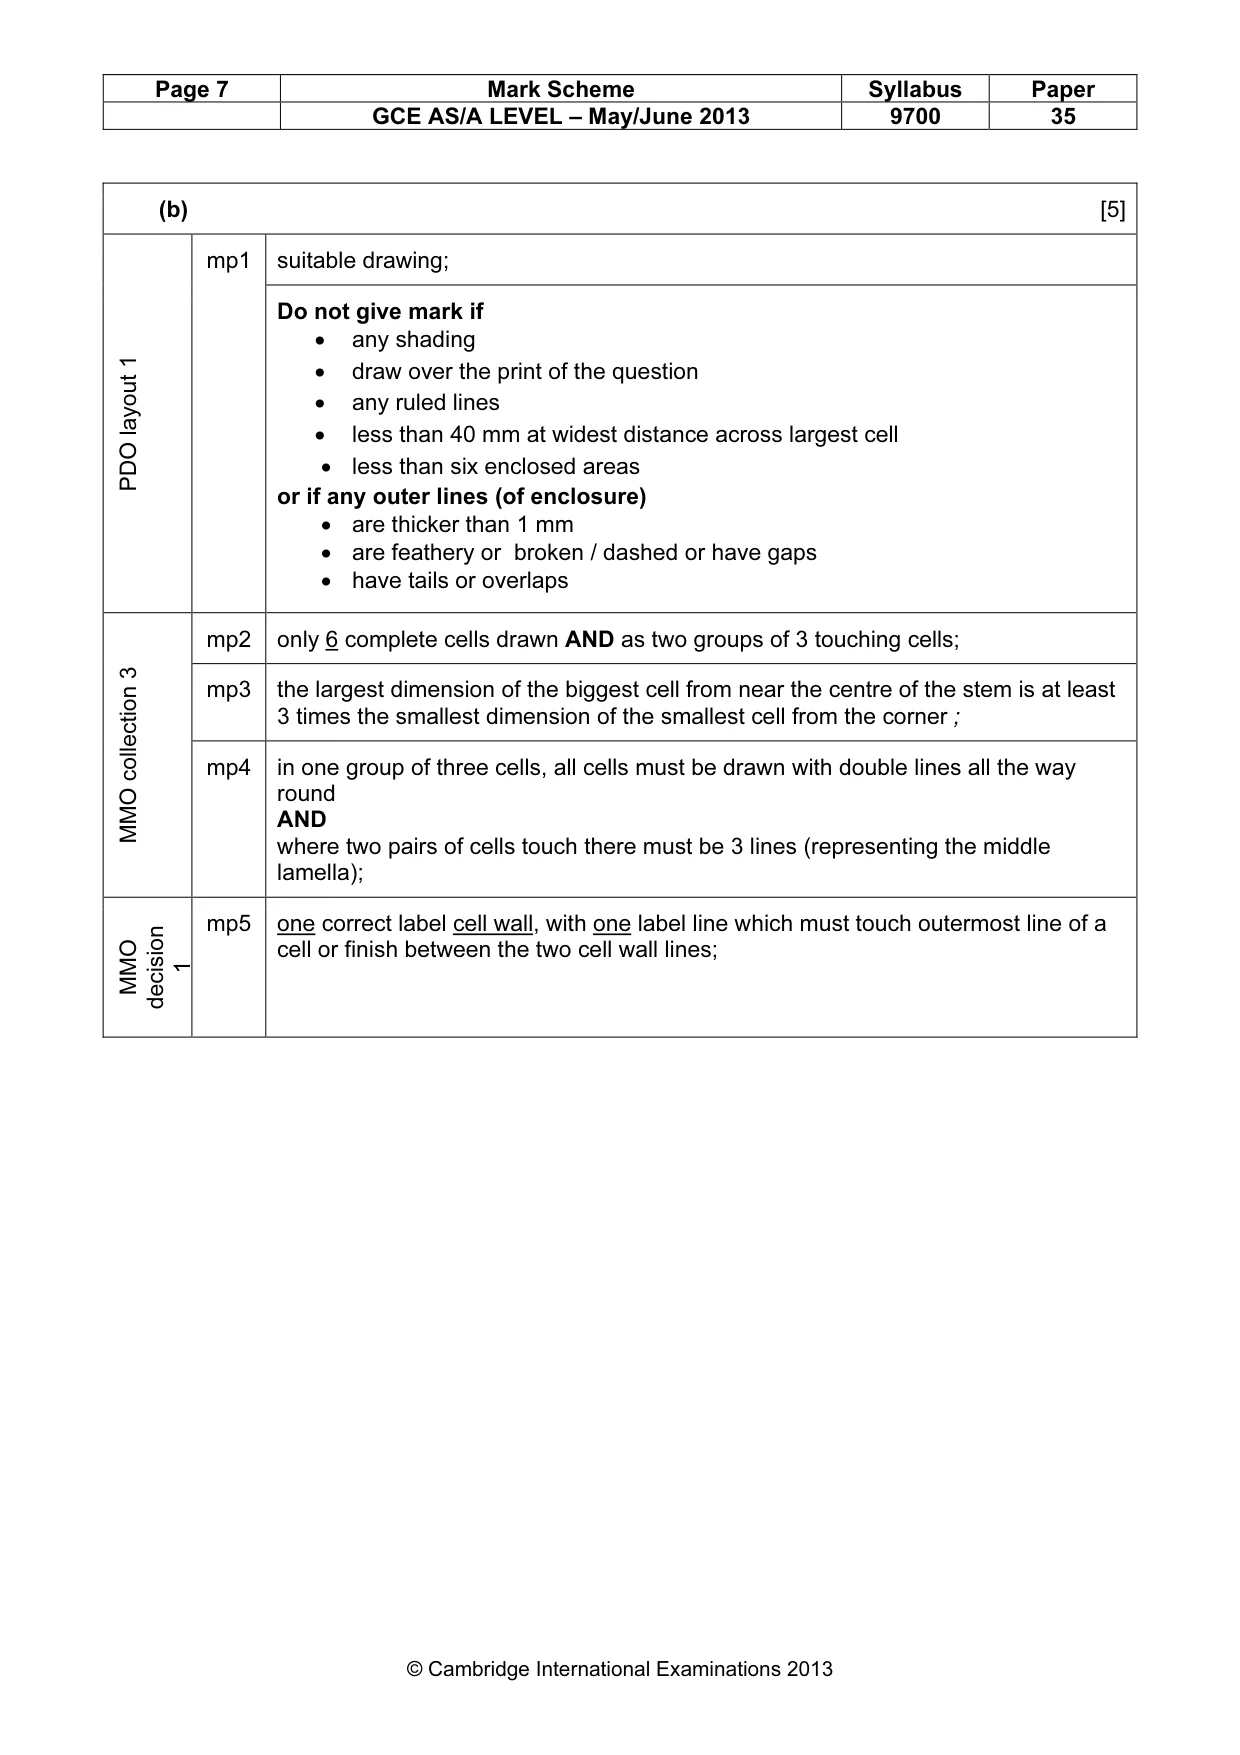
Page 7 Mark Scheme Syllabus Paper GCE AS/A LEVEL – May/June 2013 9700 35 © Cambridge International Examinations 2013 (b) [5] PDO layout 1 mp1 suitable drawing; Do not give mark if • any shading • draw over the print of the question • any ruled lines • less than 40 mm at widest distance across largest cell • less than six enclosed areas or if any outer lines (of enclosure) • are thicker than 1 mm • are feathery or broken / dashed or have gaps • have tails or overlaps MMO collection 3 mp2 only 6 complete cells drawn AND as two groups of 3 touching cells; mp3 the largest dimension of the biggest cell from near the centre of the stem is at least 3 times the smallest dimension of the smallest cell from the corner ; mp4 in one group of three cells, all cells must be drawn with double lines all the way round AND where two pairs of cells touch there must be 3 lines (representing the middle lamella); MMO decision 1 mp5 one correct label cell wall, with one label line which must touch outermost line of a cell or finish between the two cell wall lines;
Mark scheme, page 8
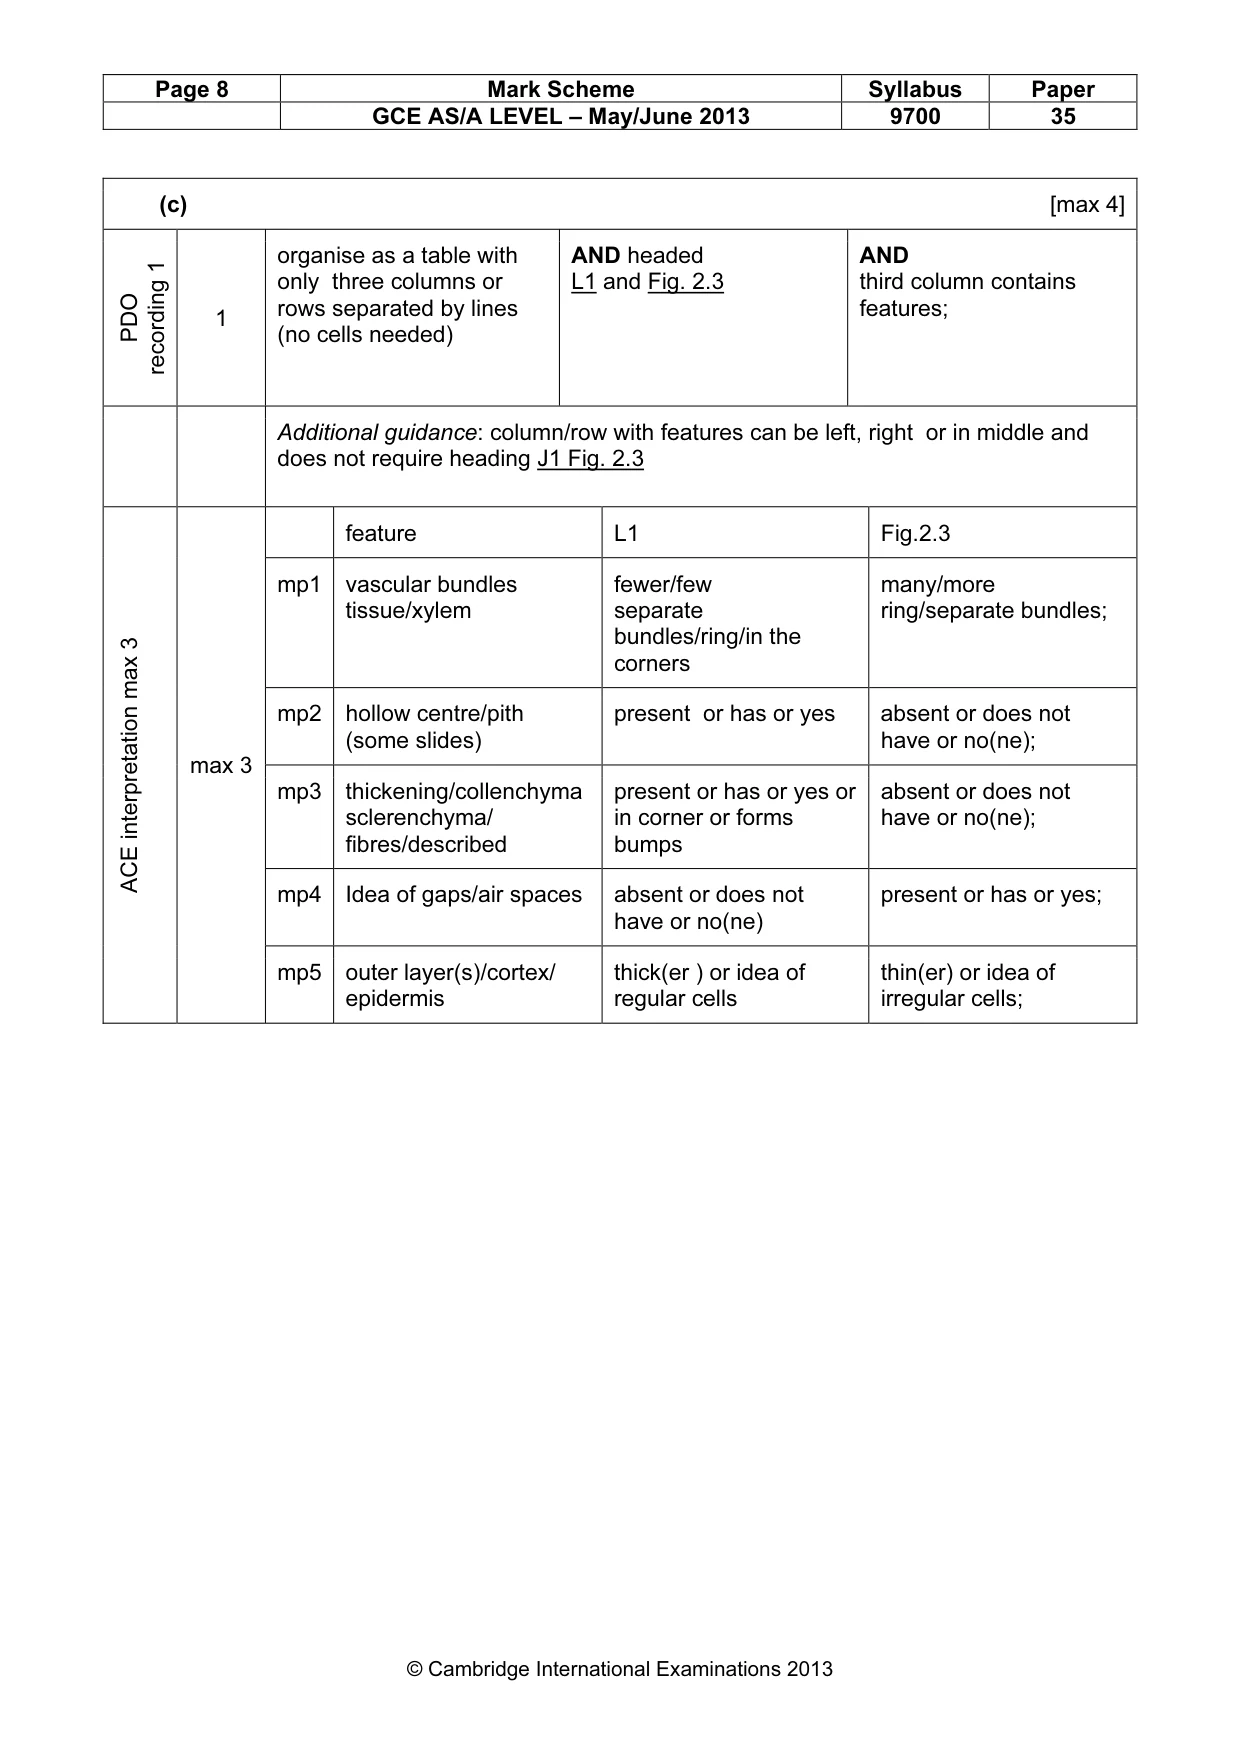
Page 8 Mark Scheme Syllabus Paper GCE AS/A LEVEL – May/June 2013 9700 35 © Cambridge International Examinations 2013 (c) [max 4] PDO recording 1 1 organise as a table with only three columns or rows separated by lines (no cells needed) AND headed L1 and Fig. 2.3 AND third column contains features; Additional guidance: column/row with features can be left, right or in middle and does not require heading J1 Fig. 2.3 ACE interpretation max 3 max 3 feature L1 Fig.2.3 mp1 vascular bundles tissue/xylem fewer/few separate bundles/ring/in the corners many/more ring/separate bundles; mp2 hollow centre/pith (some slides) present or has or yes absent or does not have or no(ne); mp3 thickening/collenchyma sclerenchyma/ fibres/described present or has or yes or in corner or forms bumps absent or does not have or no(ne); mp4 Idea of gaps/air spaces absent or does not have or no(ne) present or has or yes; mp5 outer layer(s)/cortex/ epidermis thick(er ) or idea of regular cells thin(er) or idea of irregular cells;
Mark scheme, page 9
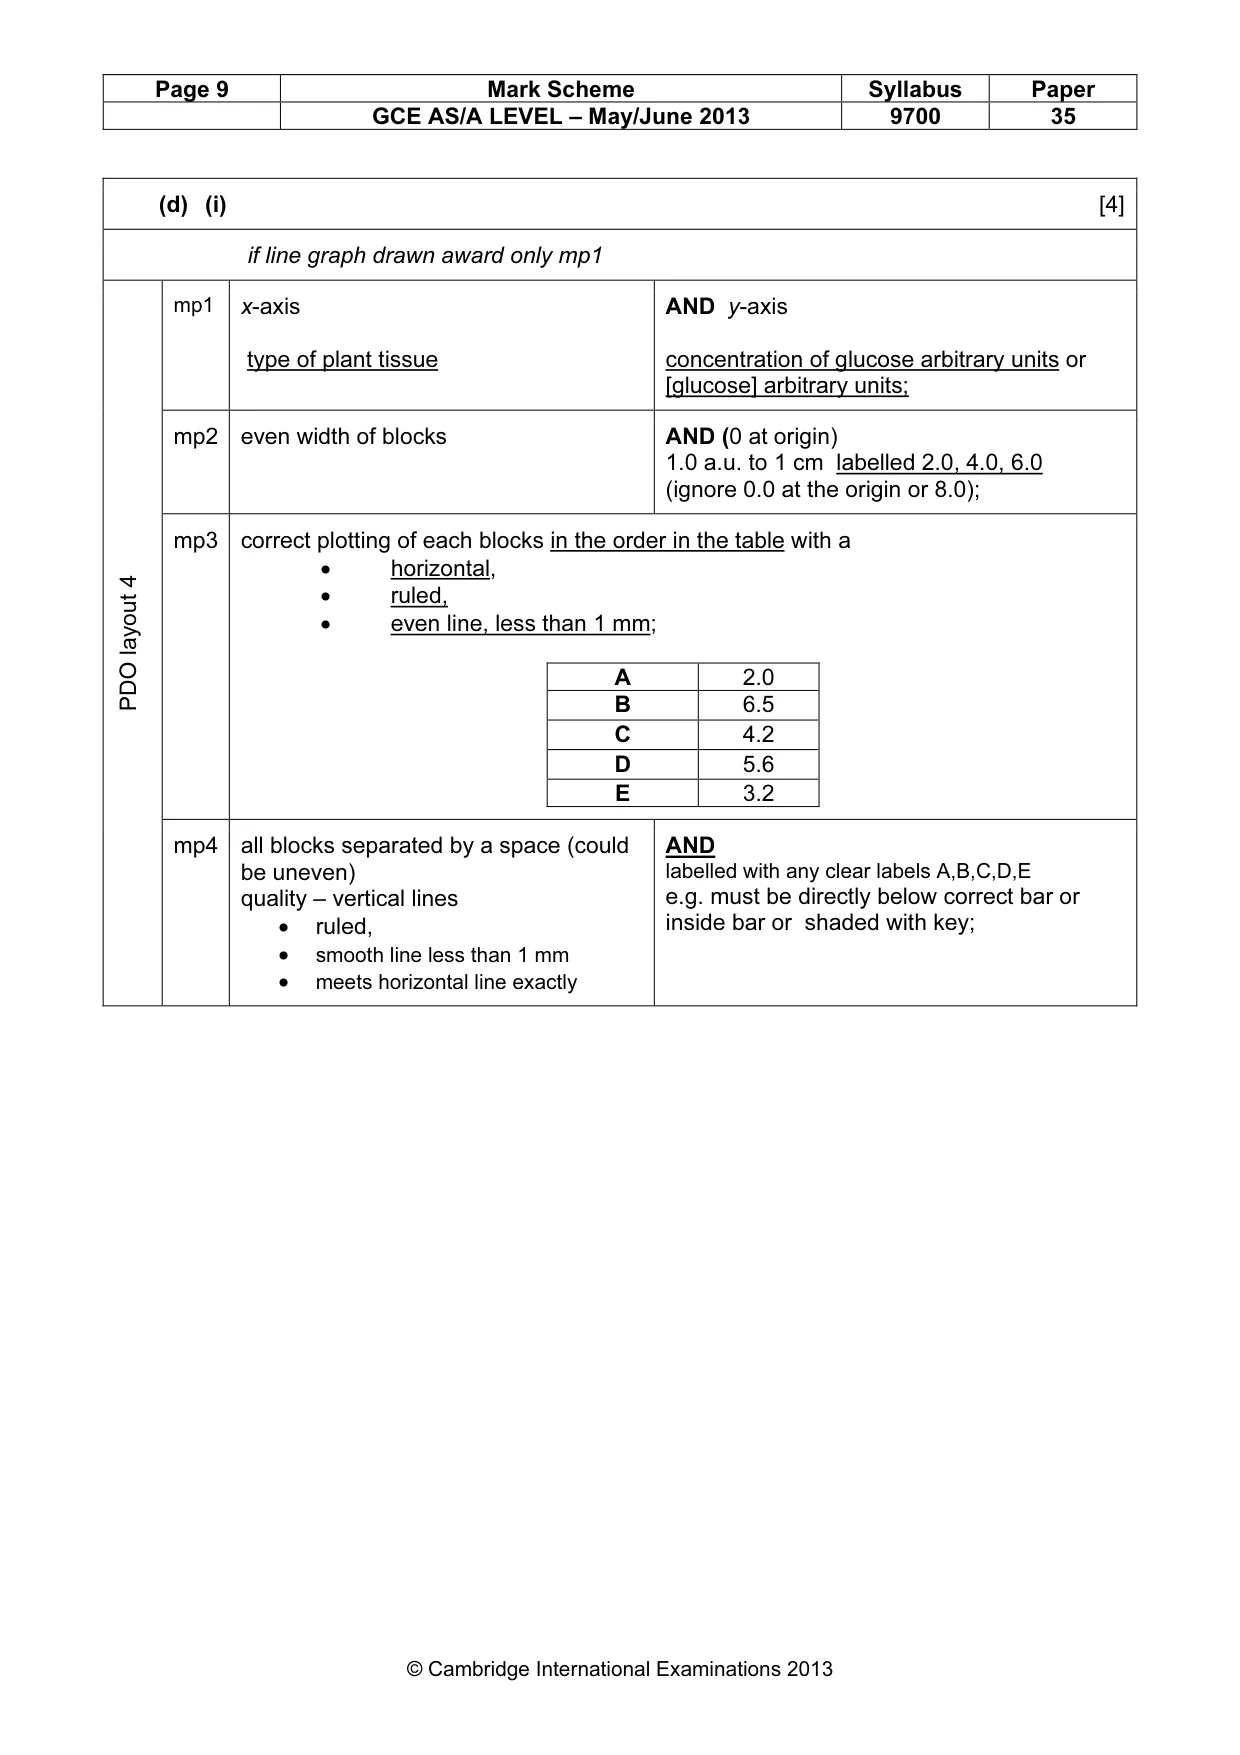
Page 9 Mark Scheme Syllabus Paper GCE AS/A LEVEL – May/June 2013 9700 35 © Cambridge International Examinations 2013 (d) (i) [4] if line graph drawn award only mp1 PDO layout 4 mp1 x-axis type of plant tissue AND y-axis concentration of glucose arbitrary units or [glucose] arbitrary units; mp2 even width of blocks AND (0 at origin) 1.0 a.u. to 1 cm labelled 2.0, 4.0, 6.0 (ignore 0.0 at the origin or 8.0); mp3 correct plotting of each blocks in the order in the table with a • horizontal, • ruled, • even line, less than 1 mm; A 2.0 B 6.5 C 4.2 D 5.6 E 3.2 mp4 all blocks separated by a space (could be uneven) quality – vertical lines • ruled, • smooth line less than 1 mm • meets horizontal line exactly AND labelled with any clear labels A,B,C,D,E e.g. must be directly below correct bar or inside bar or shaded with key;
Mark scheme, page 10
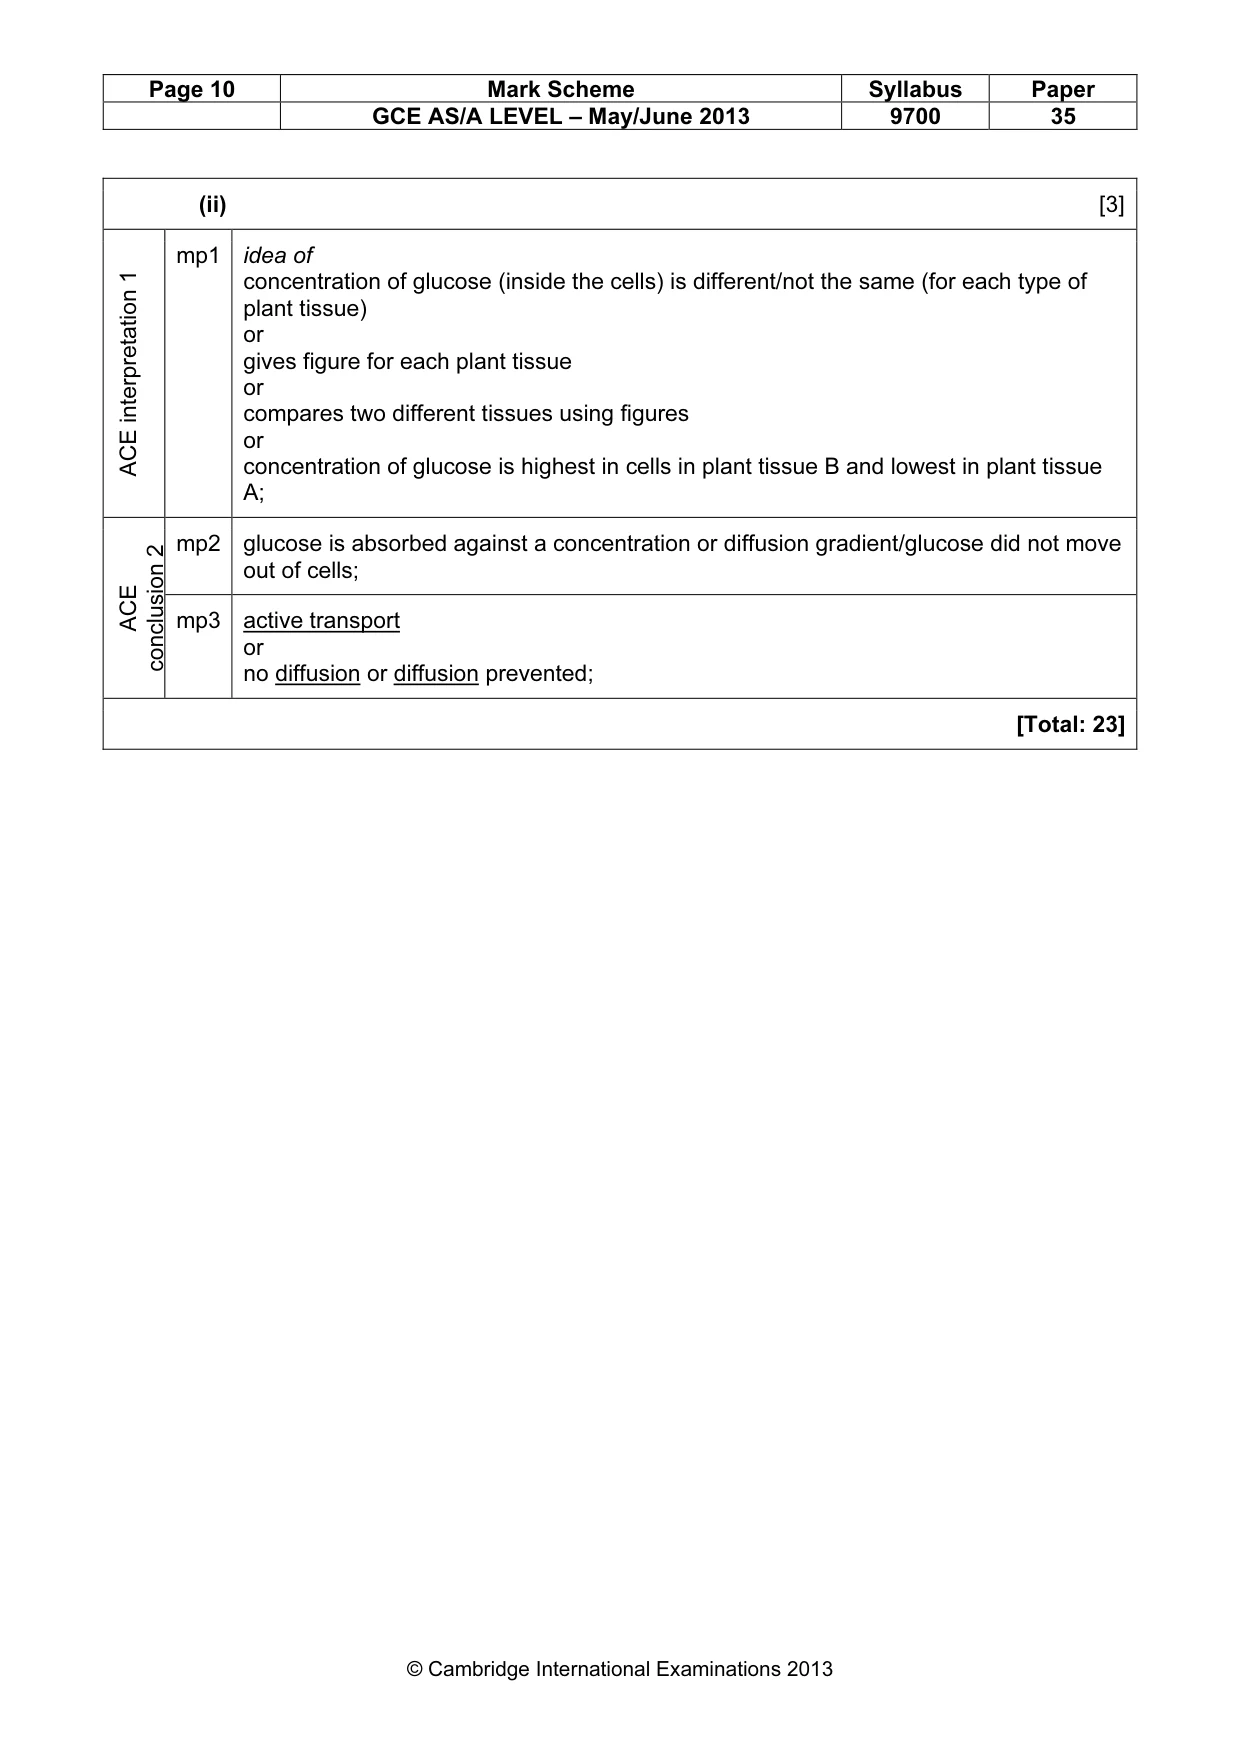
Page 10 Mark Scheme Syllabus Paper GCE AS/A LEVEL – May/June 2013 9700 35 © Cambridge International Examinations 2013 (ii) [3] ACE interpretation 1 mp1 idea of concentration of glucose (inside the cells) is different/not the same (for each type of plant tissue) or gives figure for each plant tissue or compares two different tissues using figures or concentration of glucose is highest in cells in plant tissue B and lowest in plant tissue A; ACE conclusion 2 mp2 glucose is absorbed against a concentration or diffusion gradient/glucose did not move out of cells; mp3 active transport or no diffusion or diffusion prevented; [Total: 23]
What you needed in this session
Cambridge’s own grade thresholds for 2013 May/June, Paper 3 · Variant 5. A higher threshold means an easier paper — the bar moves with how the cohort did.