Cambridge A Level Biology 9700 — 2010 Oct/Nov Paper 3 · Variant 5
9700/35/O/N/10 · 40 marks · ≈45 min
The question paper and its mark scheme, free to read here and free to download. This is Cambridge’s own paper, exactly as it was sat.
Question paper12 pages


Mark scheme10 pages
Answers below. Sit the paper first if you are practising.
Paper as text
Question paper, page 1
This document consists of 10 printed pages and 2 blank pages. DC (NF/SW) 24034/3 © UCLES 2010 [Turn over UNIVERSITY OF CAMBRIDGE INTERNATIONAL EXAMINATIONS General Certificate of Education Advanced Subsidiary Level and Advanced Level * 0 8 3 9 0 7 3 3 5 3 * BIOLOGY 9700/35 Advanced Practical Skills 1 October/November 2010 2 hours Candidates answer on the Question Paper. Additional Materials: As listed in the Confidential Instructions. READ THESE INSTRUCTIONS FIRST Write your Centre number, candidate number and name on all the work you hand in. Write in dark blue or black ink. You may use a pencil for any diagrams, graphs or rough working. Do not use red ink, staples, paper clips, highlighters, glue or correction fluid. DO NOT WRITE IN ANY BARCODES. Answer all questions. You may lose marks if you do not show your working or if you do not use appropriate units. At the end of the examination, fasten all your work securely together. The number of marks is given in brackets [ ] at the end of each question or part question. For Examiner’s Use 1 2 Total
Question paper, page 2
2 9700/35/O/N/10 © UCLES 2010 BLANK PAGE
Question paper, page 3
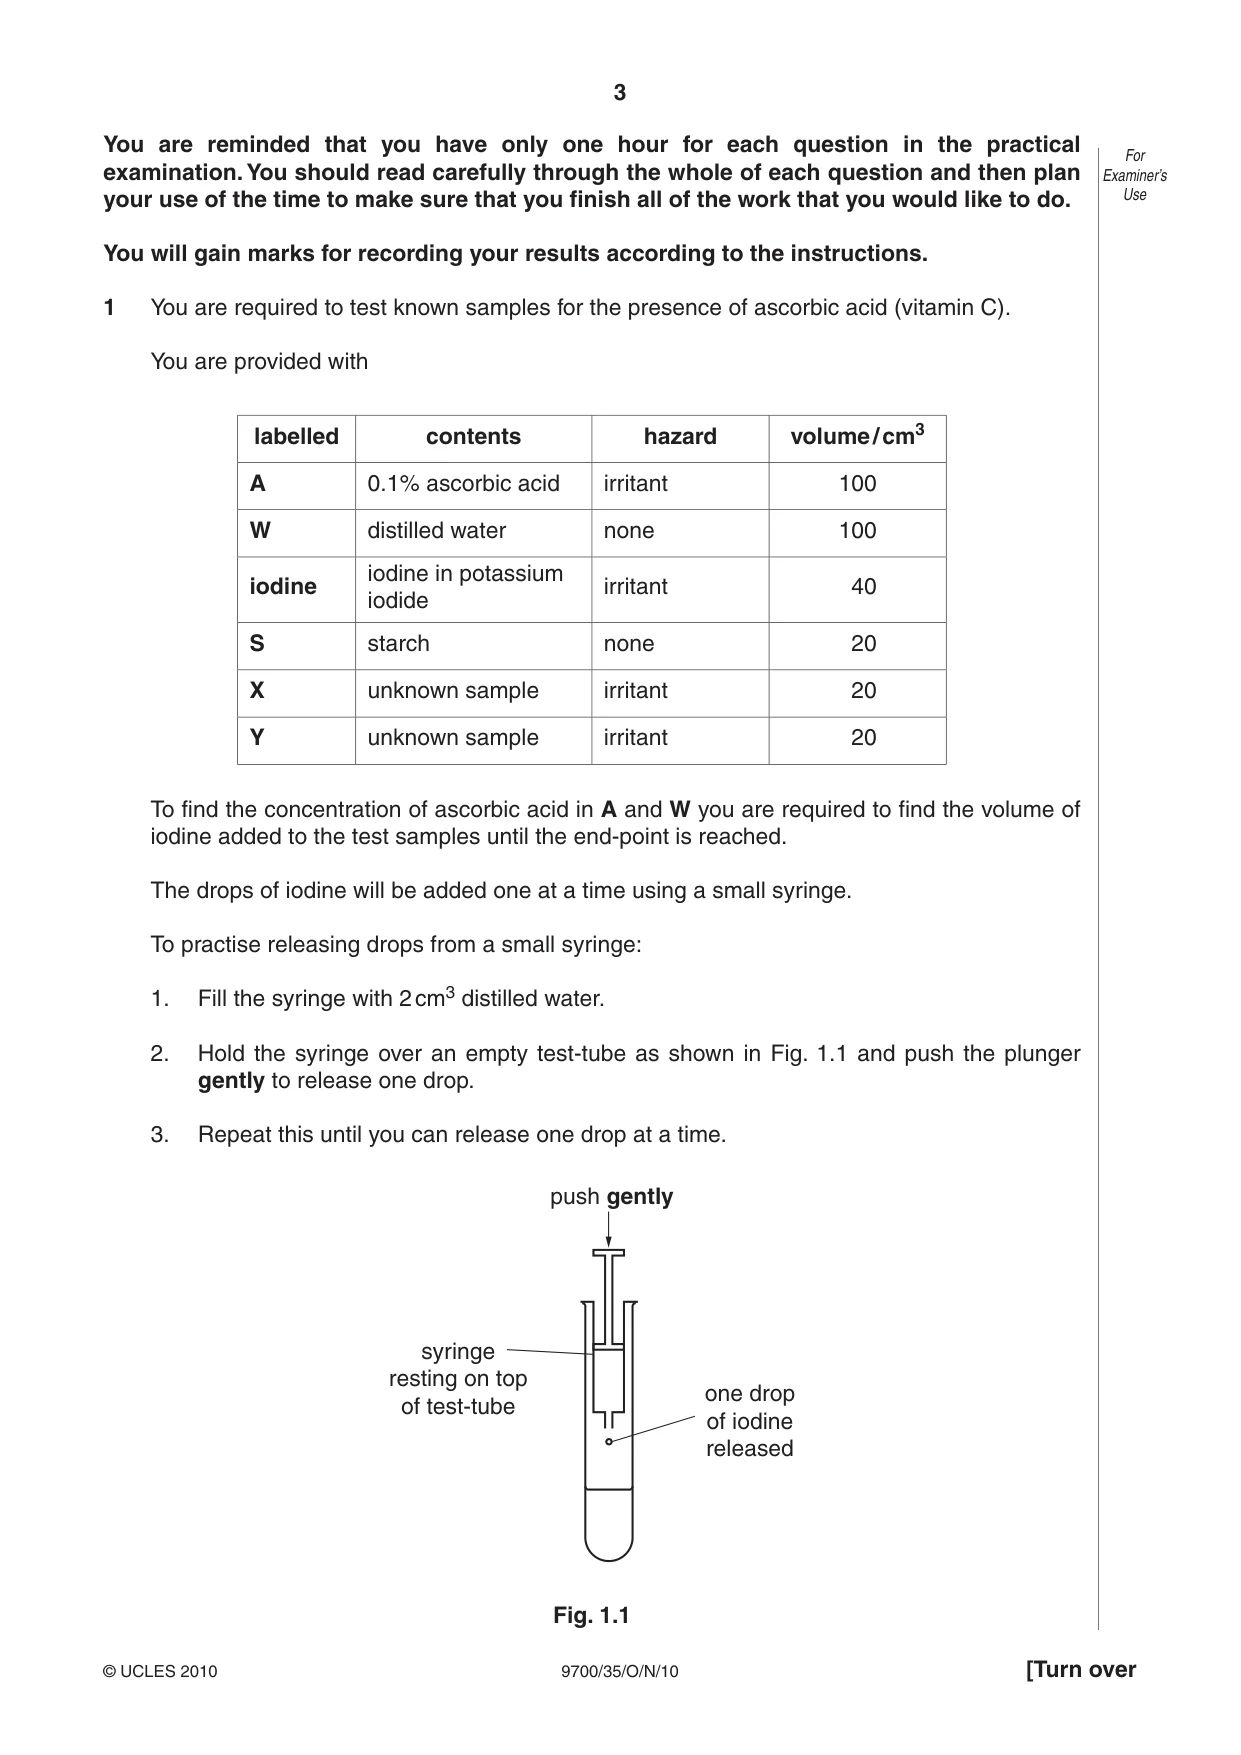
3 9700/35/O/N/10 © UCLES 2010 [Turn over For Examiner’s Use You are reminded that you have only one hour for each question in the practical examination. You should read carefully through the whole of each question and then plan your use of the time to make sure that you finish all of the work that you would like to do. You will gain marks for recording your results according to the instructions. 1 You are required to test known samples for the presence of ascorbic acid (vitamin C). You are provided with labelled contents hazard volume / cm3 A 0.1% ascorbic acid irritant 100 W distilled water none 100 iodine iodine in potassium iodide irritant 40 S starch none 20 X unknown sample irritant 20 Y unknown sample irritant 20 To find the concentration of ascorbic acid in A and W you are required to find the volume of iodine added to the test samples until the end-point is reached. The drops of iodine will be added one at a time using a small syringe. To practise releasing drops from a small syringe: 1. Fill the syringe with 2 cm3 distilled water. 2. Hold the syringe over an empty test-tube as shown in Fig. 1.1 and push the plunger gently to release one drop. 3. Repeat this until you can release one drop at a time. push gently syringe resting on top of test-tube one drop of iodine released Fig. 1.1
Question paper, page 4
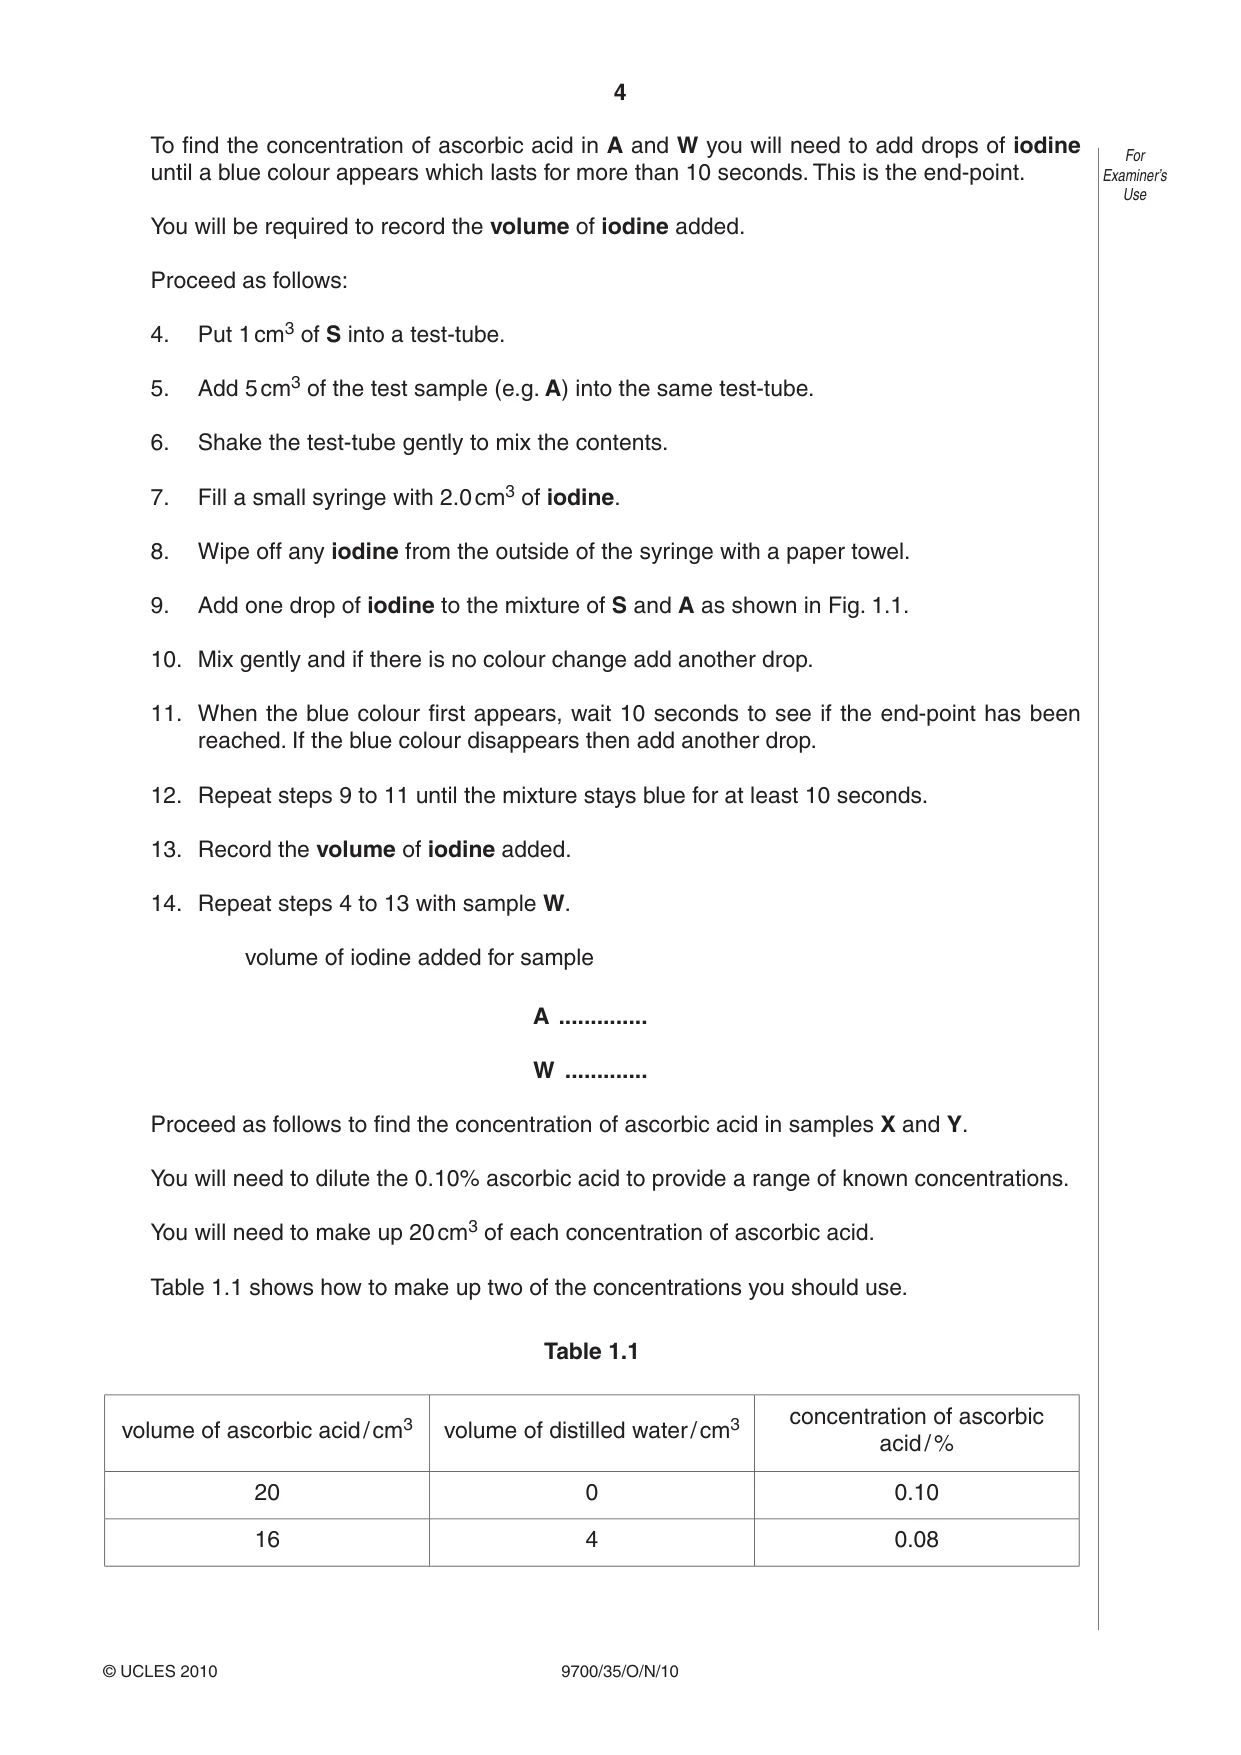
4 9700/35/O/N/10 © UCLES 2010 For Examiner’s Use To find the concentration of ascorbic acid in A and W you will need to add drops of iodine until a blue colour appears which lasts for more than 10 seconds. This is the end-point. You will be required to record the volume of iodine added. Proceed as follows: 4. Put 1 cm3 of S into a test-tube. 5. Add 5 cm3 of the test sample (e.g. A) into the same test-tube. 6. Shake the test-tube gently to mix the contents. 7. Fill a small syringe with 2.0 cm3 of iodine. 8. Wipe off any iodine from the outside of the syringe with a paper towel. 9. Add one drop of iodine to the mixture of S and A as shown in Fig. 1.1. 10. Mix gently and if there is no colour change add another drop. 11. When the blue colour first appears, wait 10 seconds to see if the end-point has been reached. If the blue colour disappears then add another drop. 12. Repeat steps 9 to 11 until the mixture stays blue for at least 10 seconds. 13. Record the volume of iodine added. 14. Repeat steps 4 to 13 with sample W. volume of iodine added for sample A … W … Proceed as follows to find the concentration of ascorbic acid in samples X and Y. You will need to dilute the 0.10% ascorbic acid to provide a range of known concentrations. You will need to make up 20 cm3 of each concentration of ascorbic acid. Table 1.1 shows how to make up two of the concentrations you should use. Table 1.1 volume of ascorbic acid / cm3 volume of distilled water / cm3 concentration of ascorbic acid / % 20 0 0.10 16 4 0.08
Question paper, page 5
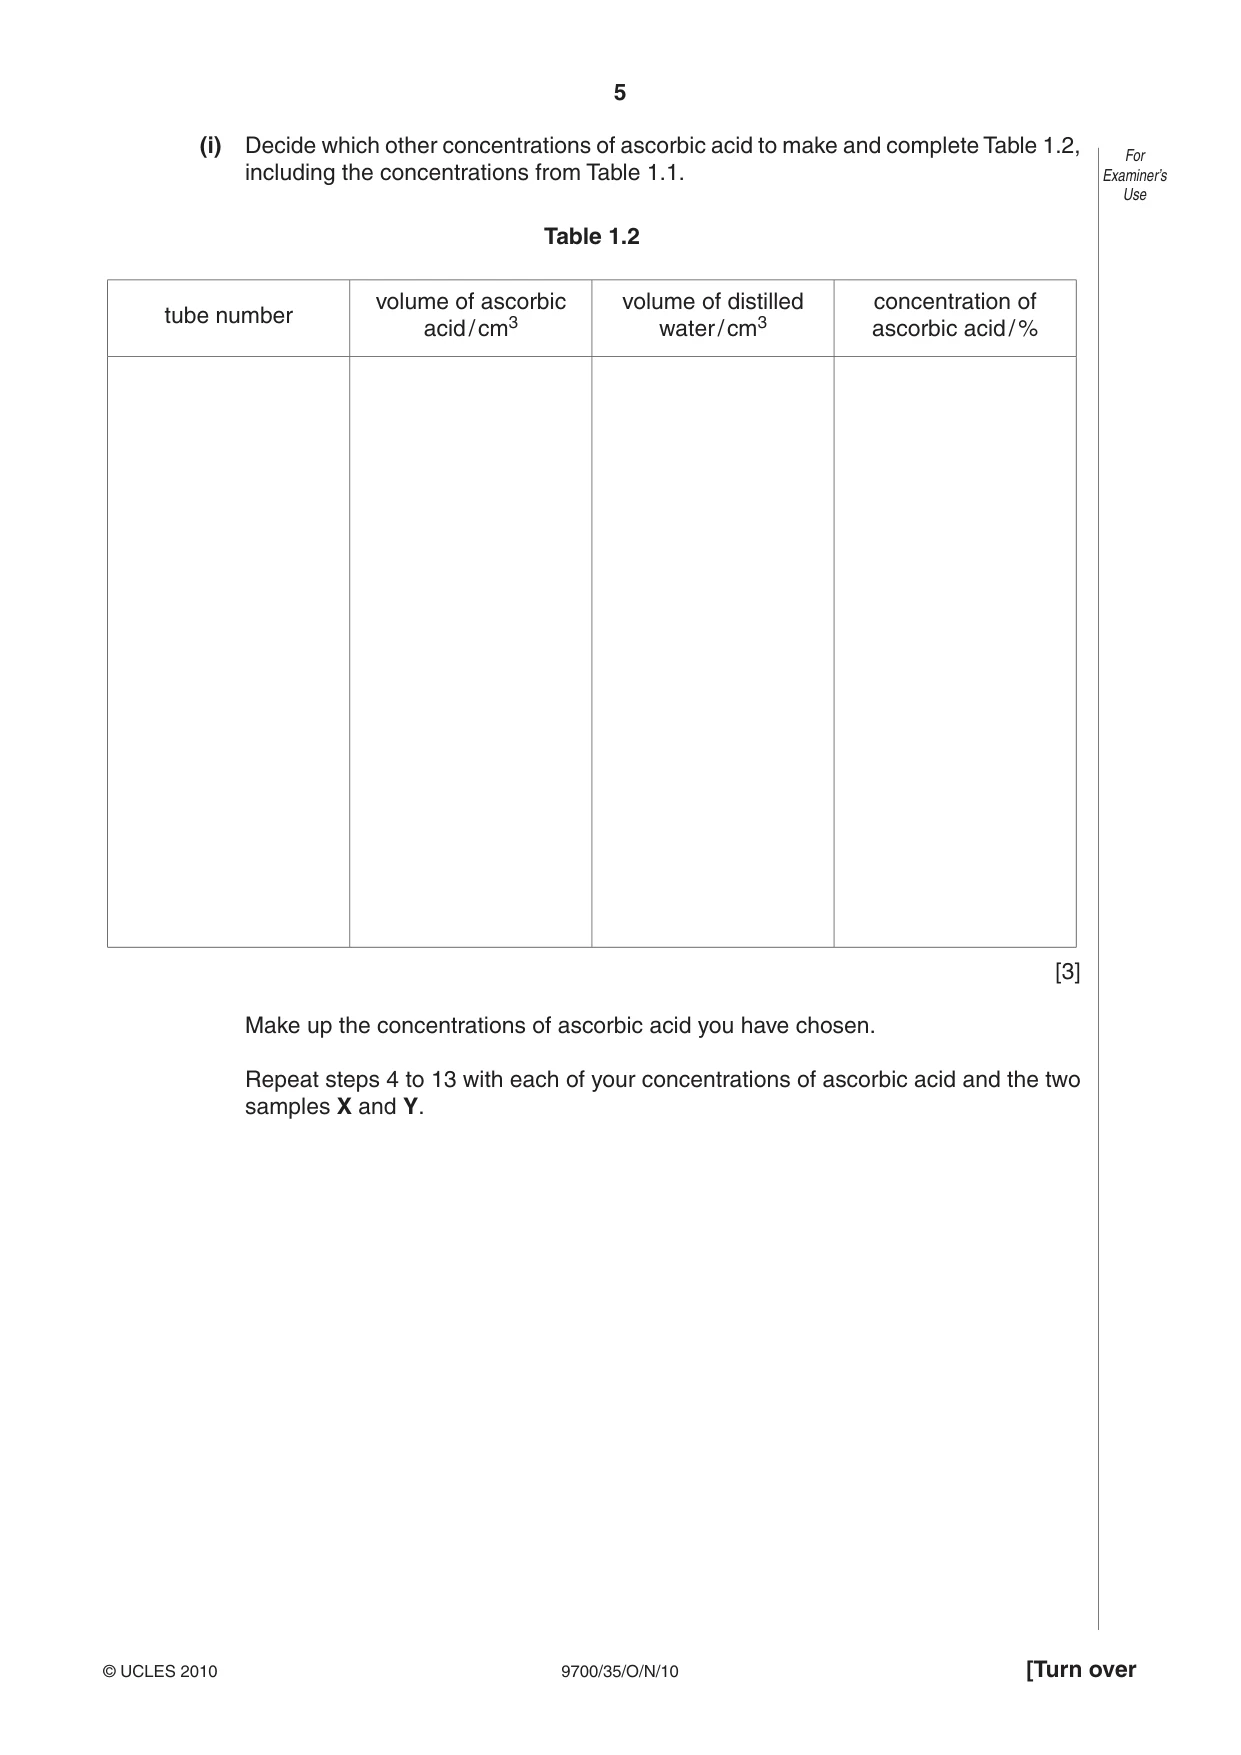
5 9700/35/O/N/10 © UCLES 2010 [Turn over For Examiner’s Use (i) Decide which other concentrations of ascorbic acid to make and complete Table 1.2, including the concentrations from Table 1.1. Table 1.2 tube number volume of ascorbic acid / cm3 volume of distilled water / cm3 concentration of ascorbic acid / % [3] Make up the concentrations of ascorbic acid you have chosen. Repeat steps 4 to 13 with each of your concentrations of ascorbic acid and the two samples X and Y.
Question paper, page 6
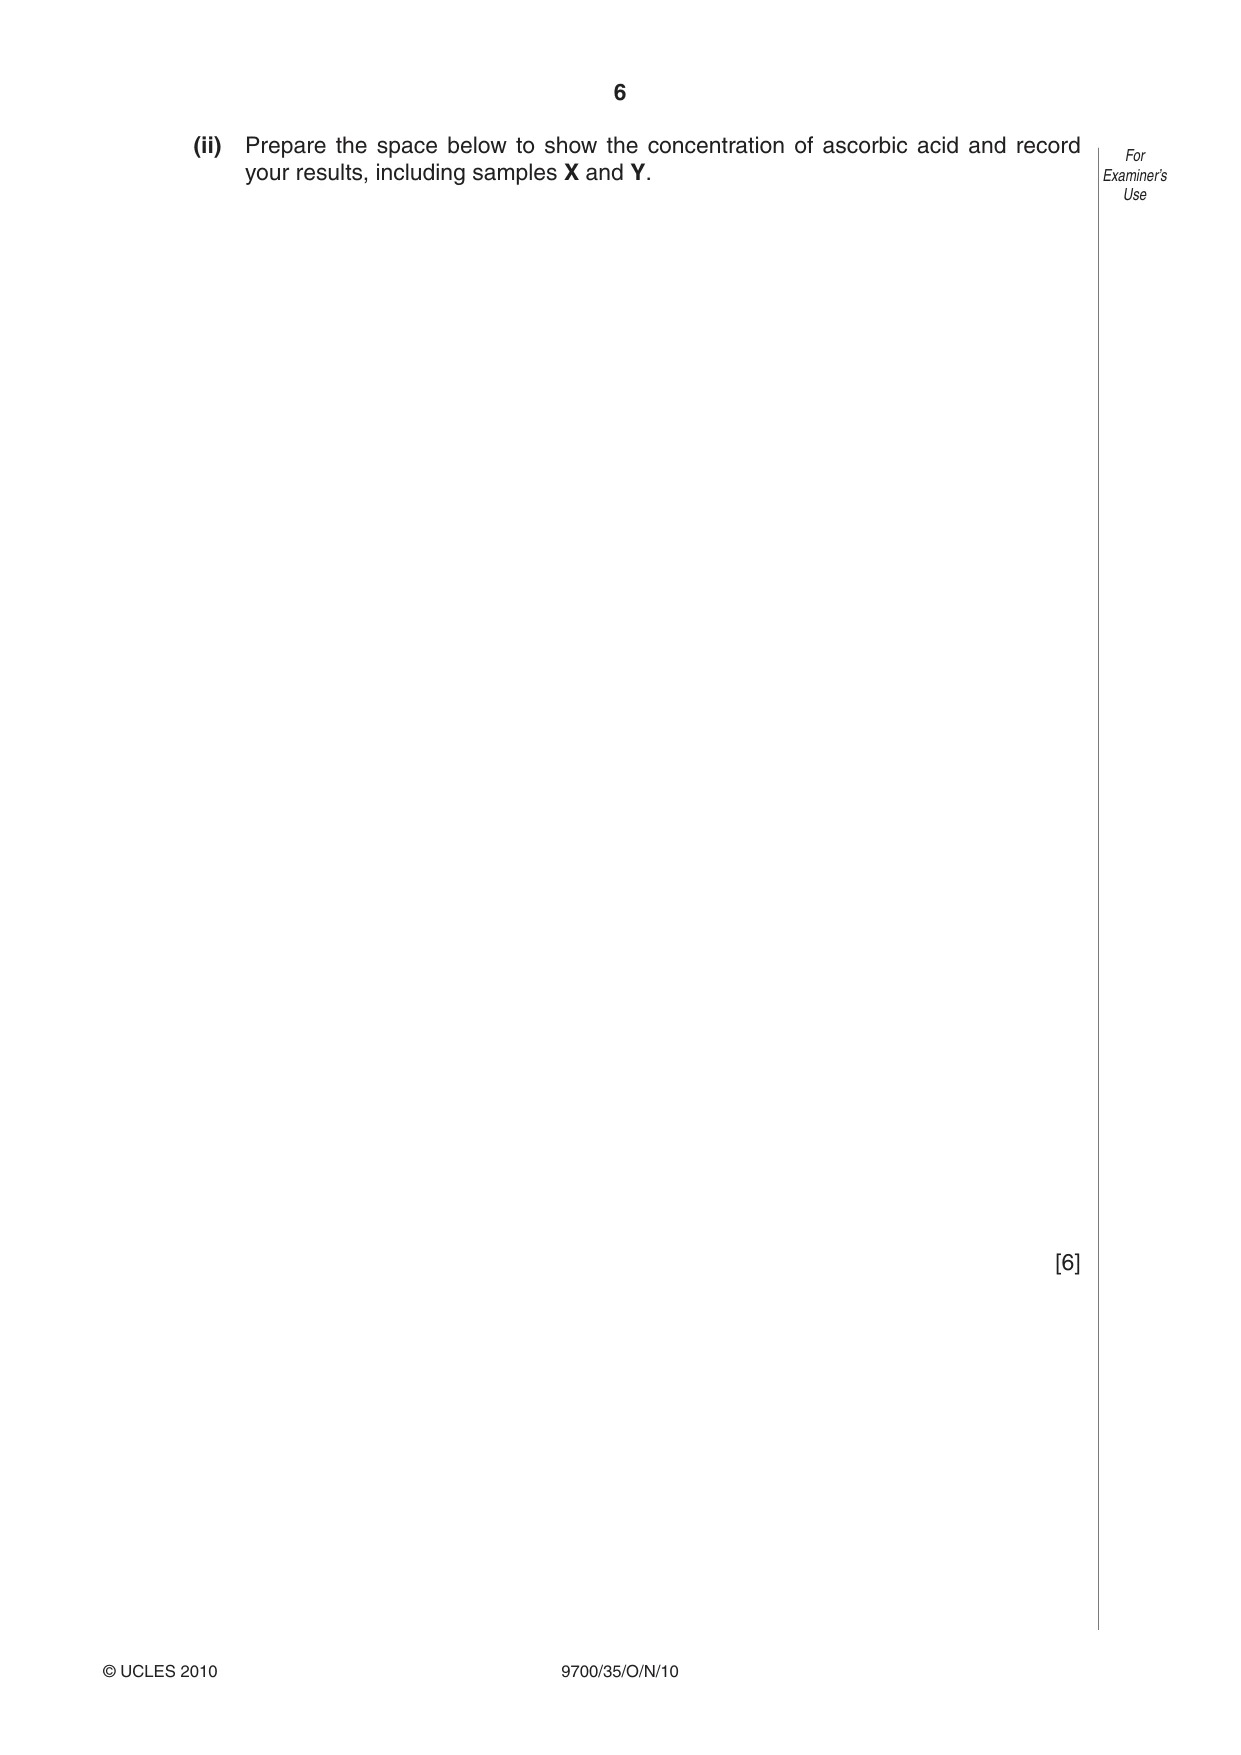
6 9700/35/O/N/10 © UCLES 2010 For Examiner’s Use (ii) Prepare the space below to show the concentration of ascorbic acid and record your results, including samples X and Y. [6]
Question paper, page 7
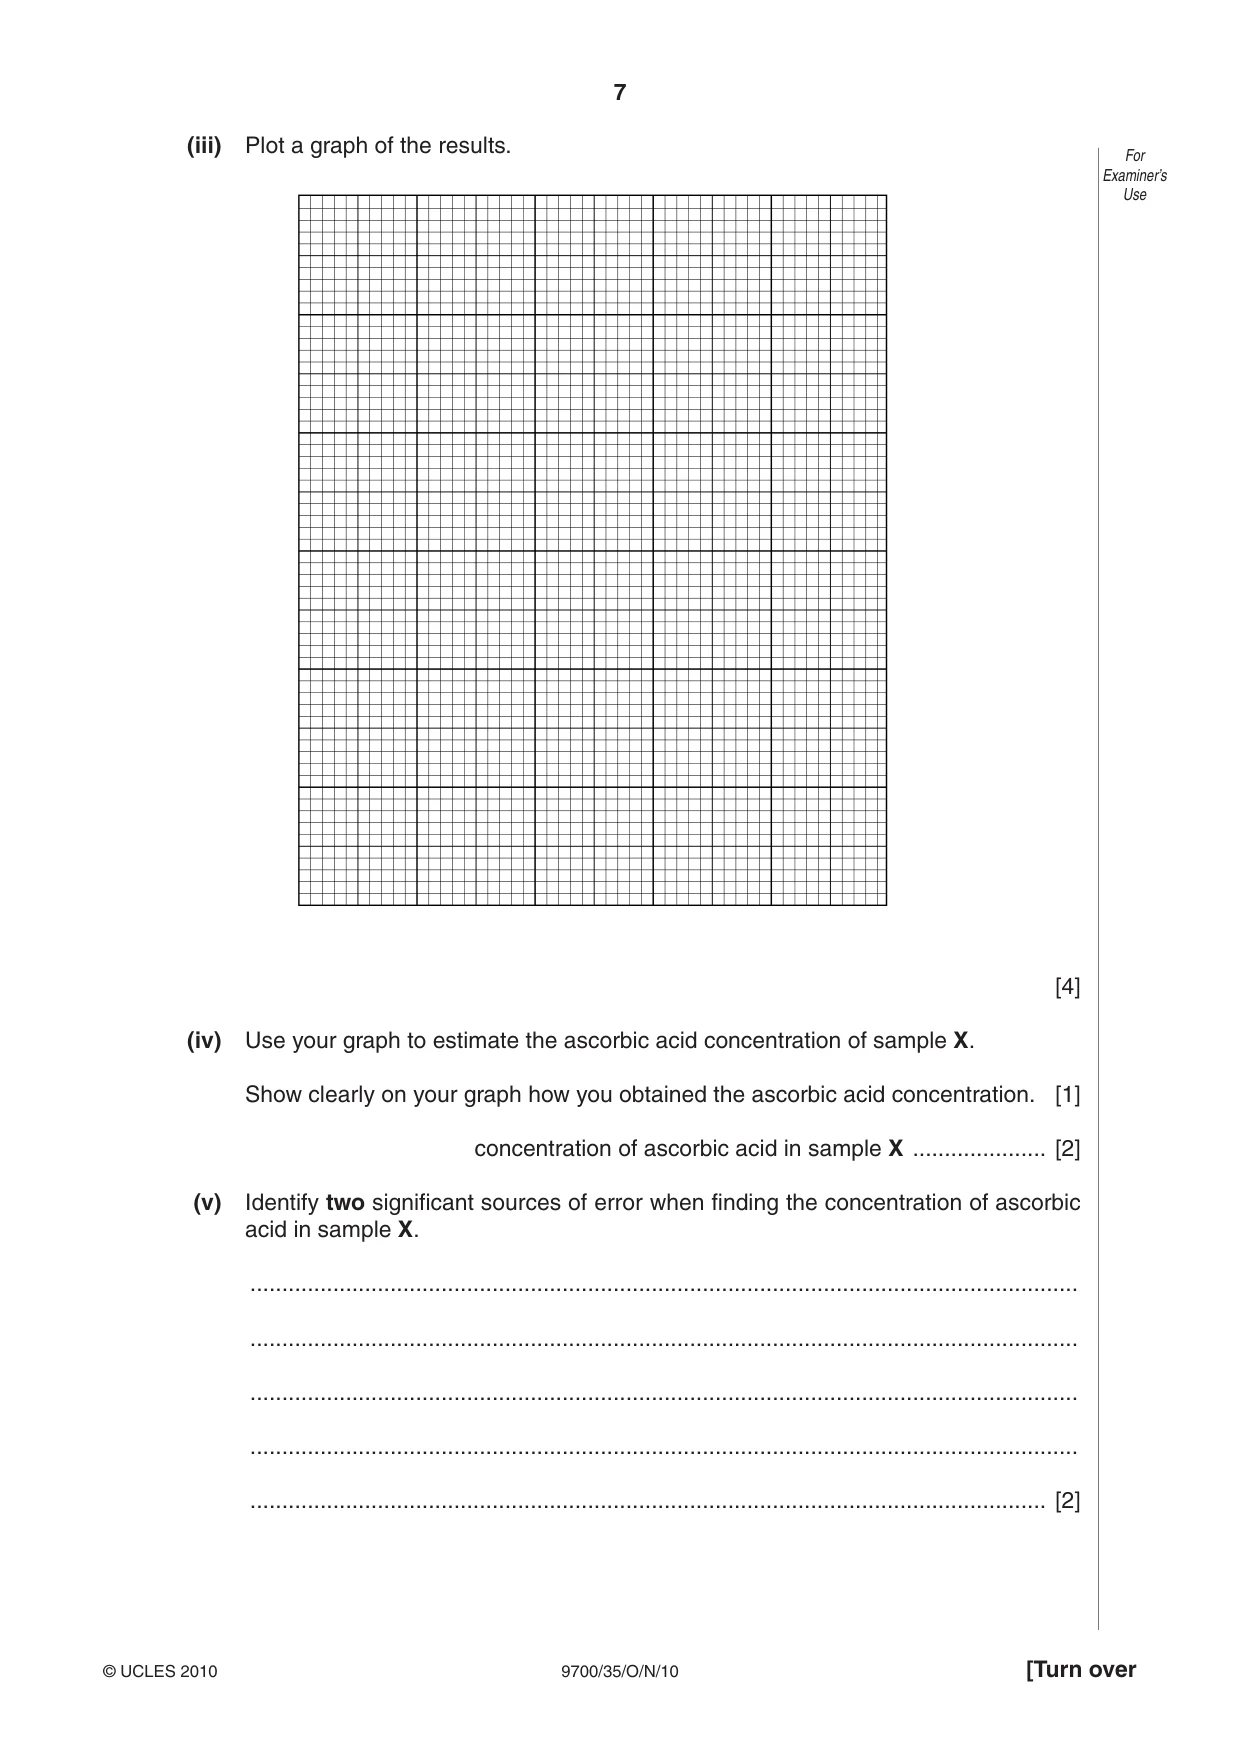
7 9700/35/O/N/10 © UCLES 2010 [Turn over For Examiner’s Use (iii) Plot a graph of the results. [4] (iv) Use your graph to estimate the ascorbic acid concentration of sample X. Show clearly on your graph how you obtained the ascorbic acid concentration. [1] concentration of ascorbic acid in sample X … [2] (v) Identify two significant sources of error when finding the concentration of ascorbic acid in sample X. … … … … … [2]
Question paper, page 8
8 9700/35/O/N/10 © UCLES 2010 For Examiner’s Use (vi) Suggest how you would make three improvements to this investigation. … … … … … … … [3] [Total: 21]
Question paper, page 9
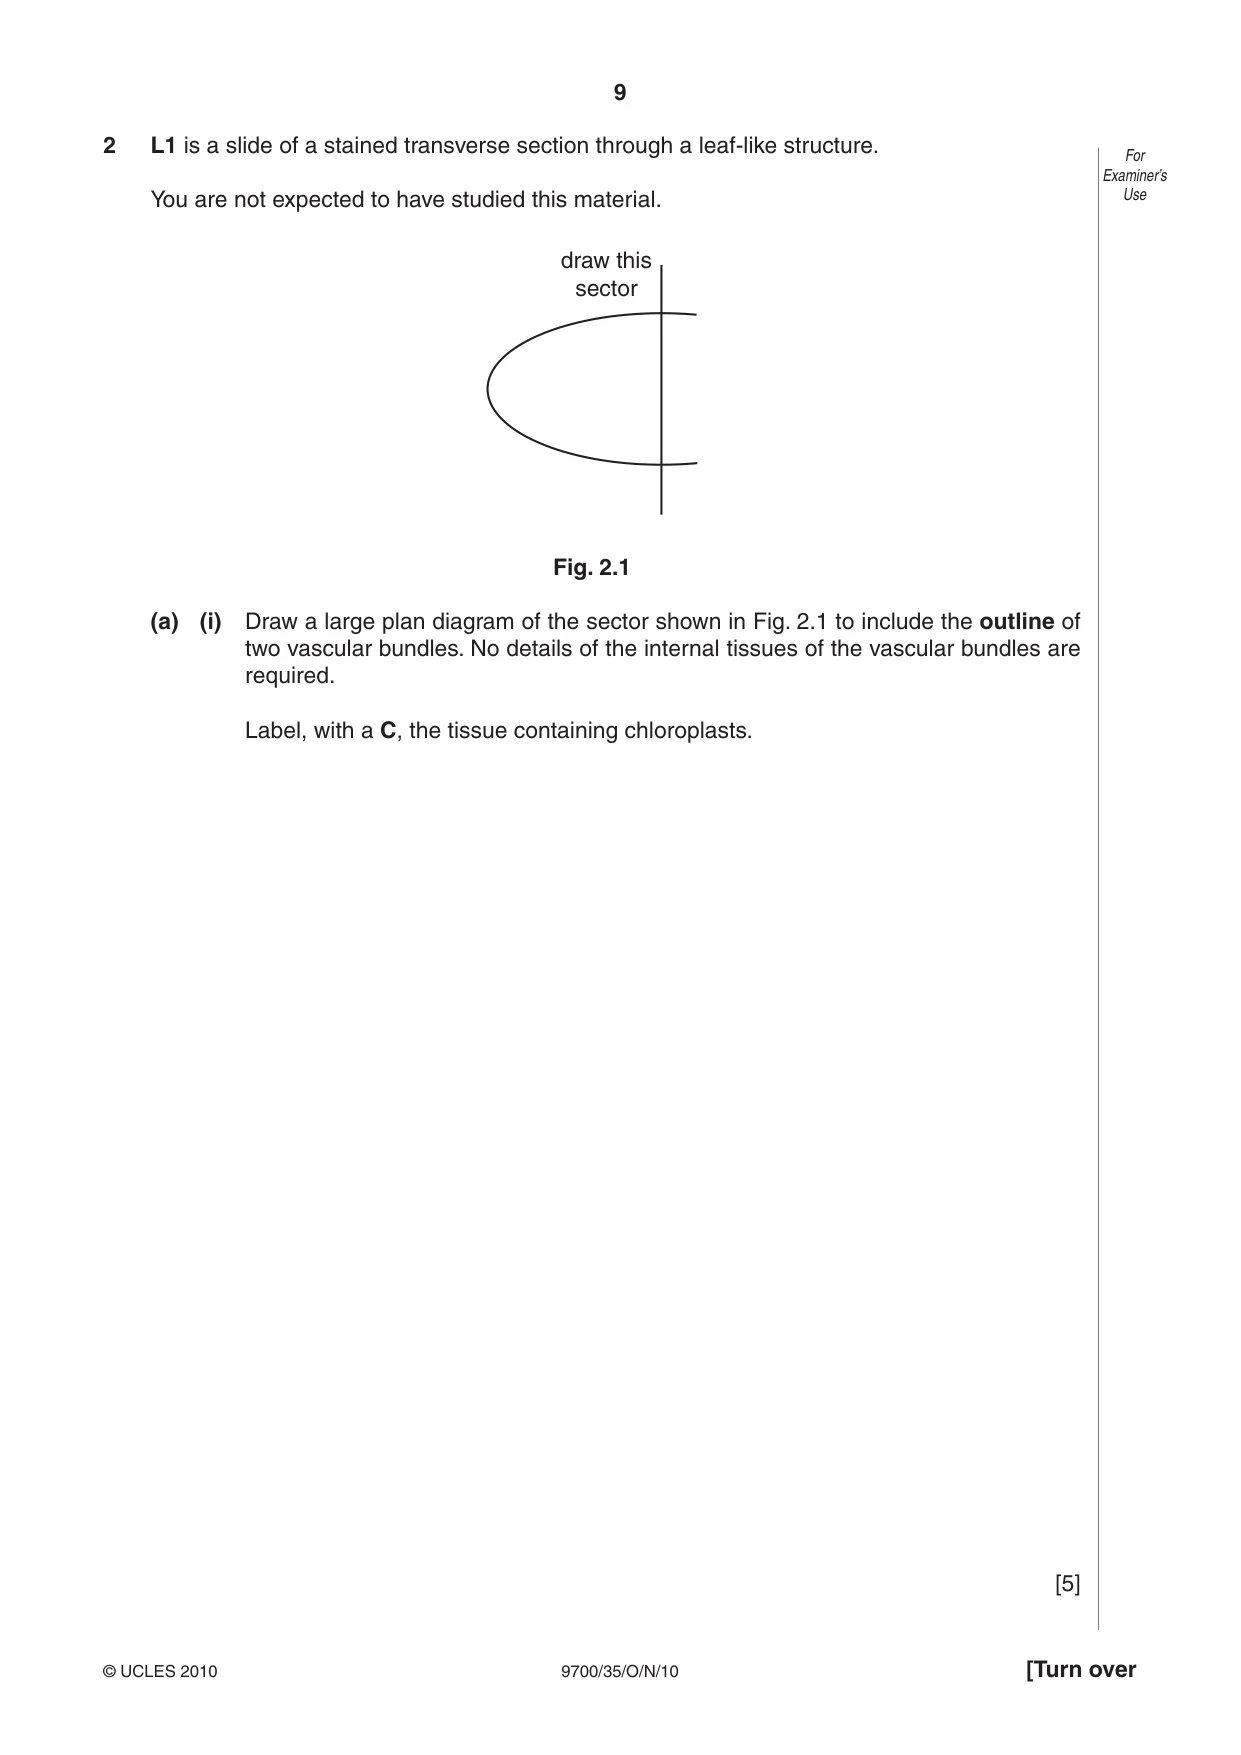
9 9700/35/O/N/10 © UCLES 2010 [Turn over For Examiner’s Use 2 L1 is a slide of a stained transverse section through a leaf-like structure. You are not expected to have studied this material. draw this sector Fig. 2.1 (a) (i) Draw a large plan diagram of the sector shown in Fig. 2.1 to include the outline of two vascular bundles. No details of the internal tissues of the vascular bundles are required. Label, with a C, the tissue containing chloroplasts. [5]
Question paper, page 10
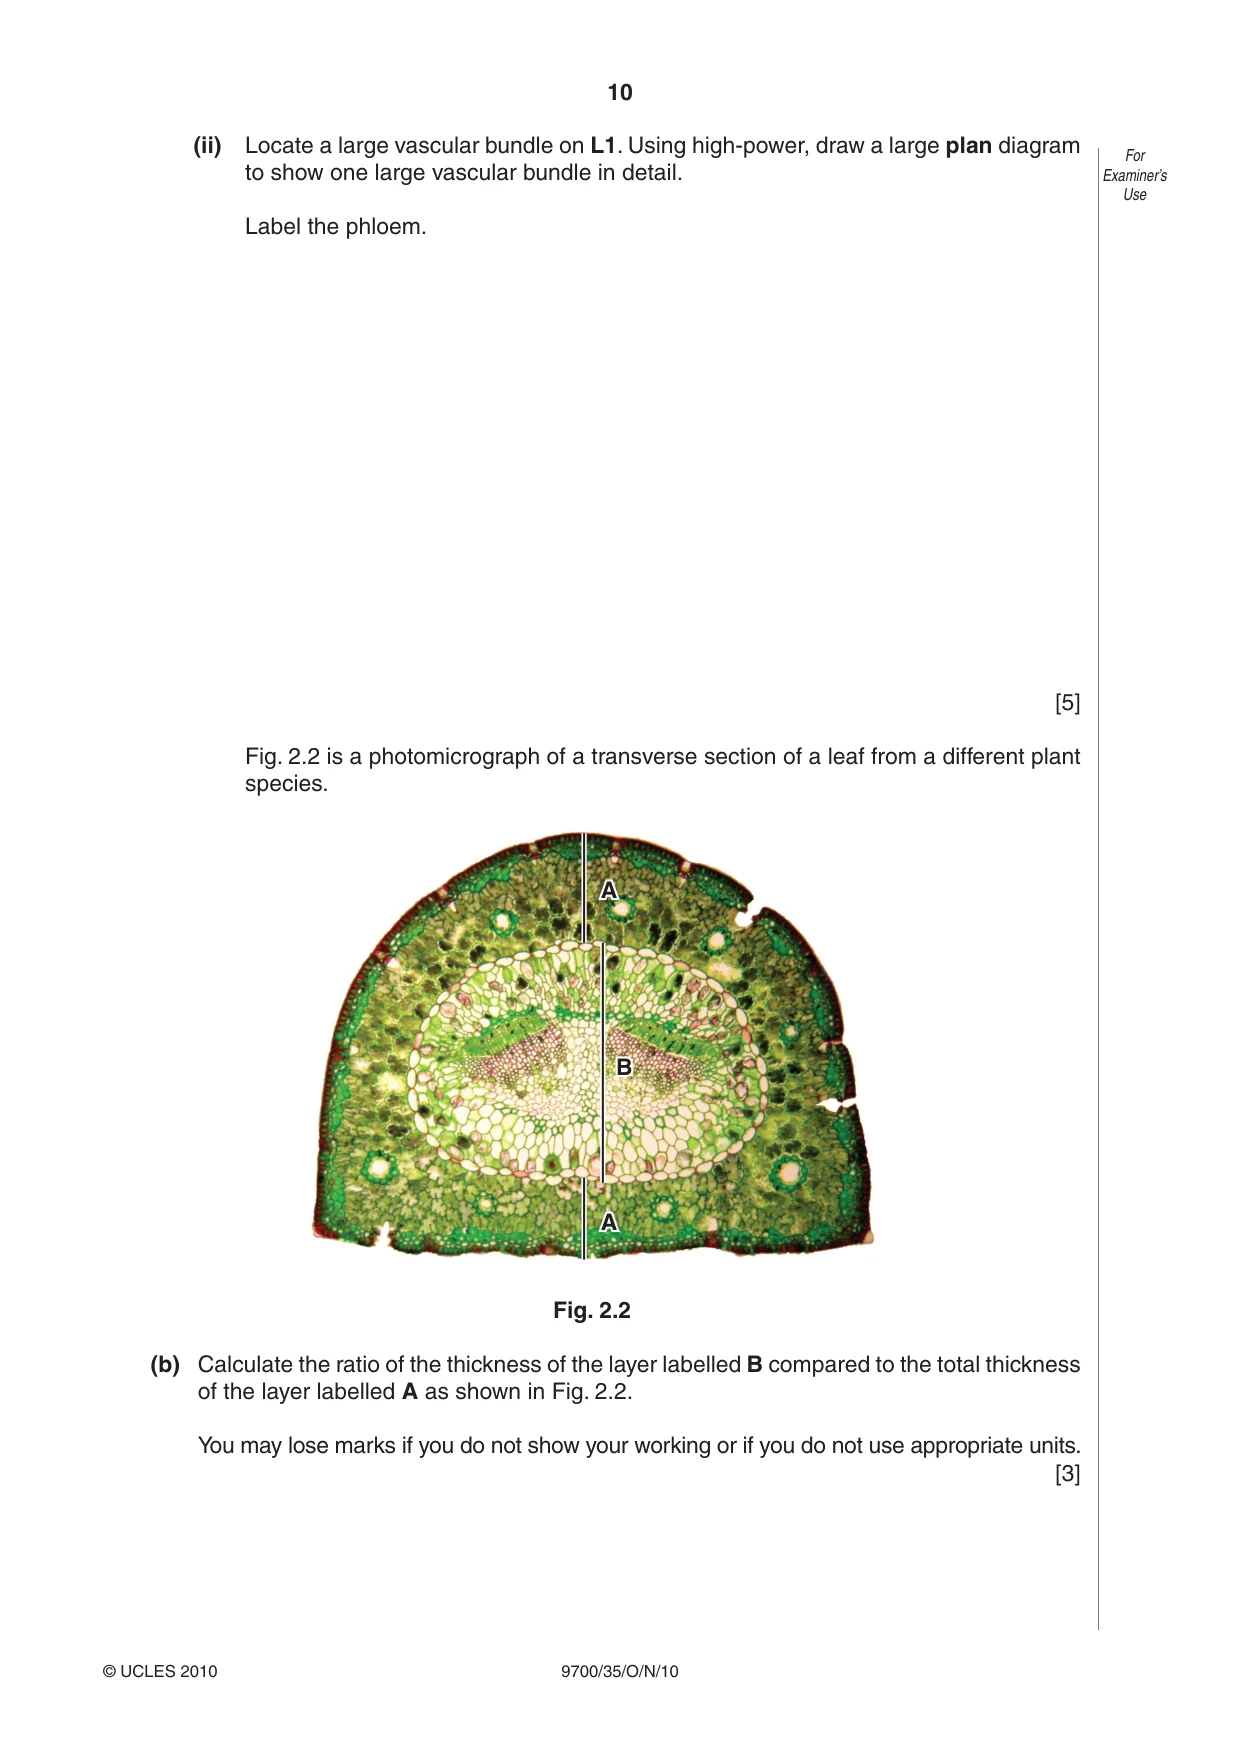
10 9700/35/O/N/10 © UCLES 2010 For Examiner’s Use (ii) Locate a large vascular bundle on L1. Using high-power, draw a large plan diagram to show one large vascular bundle in detail. Label the phloem. [5] Fig. 2.2 is a photomicrograph of a transverse section of a leaf from a different plant species. A A B A A B Fig. 2.2 (b) Calculate the ratio of the thickness of the layer labelled B compared to the total thickness of the layer labelled A as shown in Fig. 2.2. You may lose marks if you do not show your working or if you do not use appropriate units. [3]
Question paper, page 11
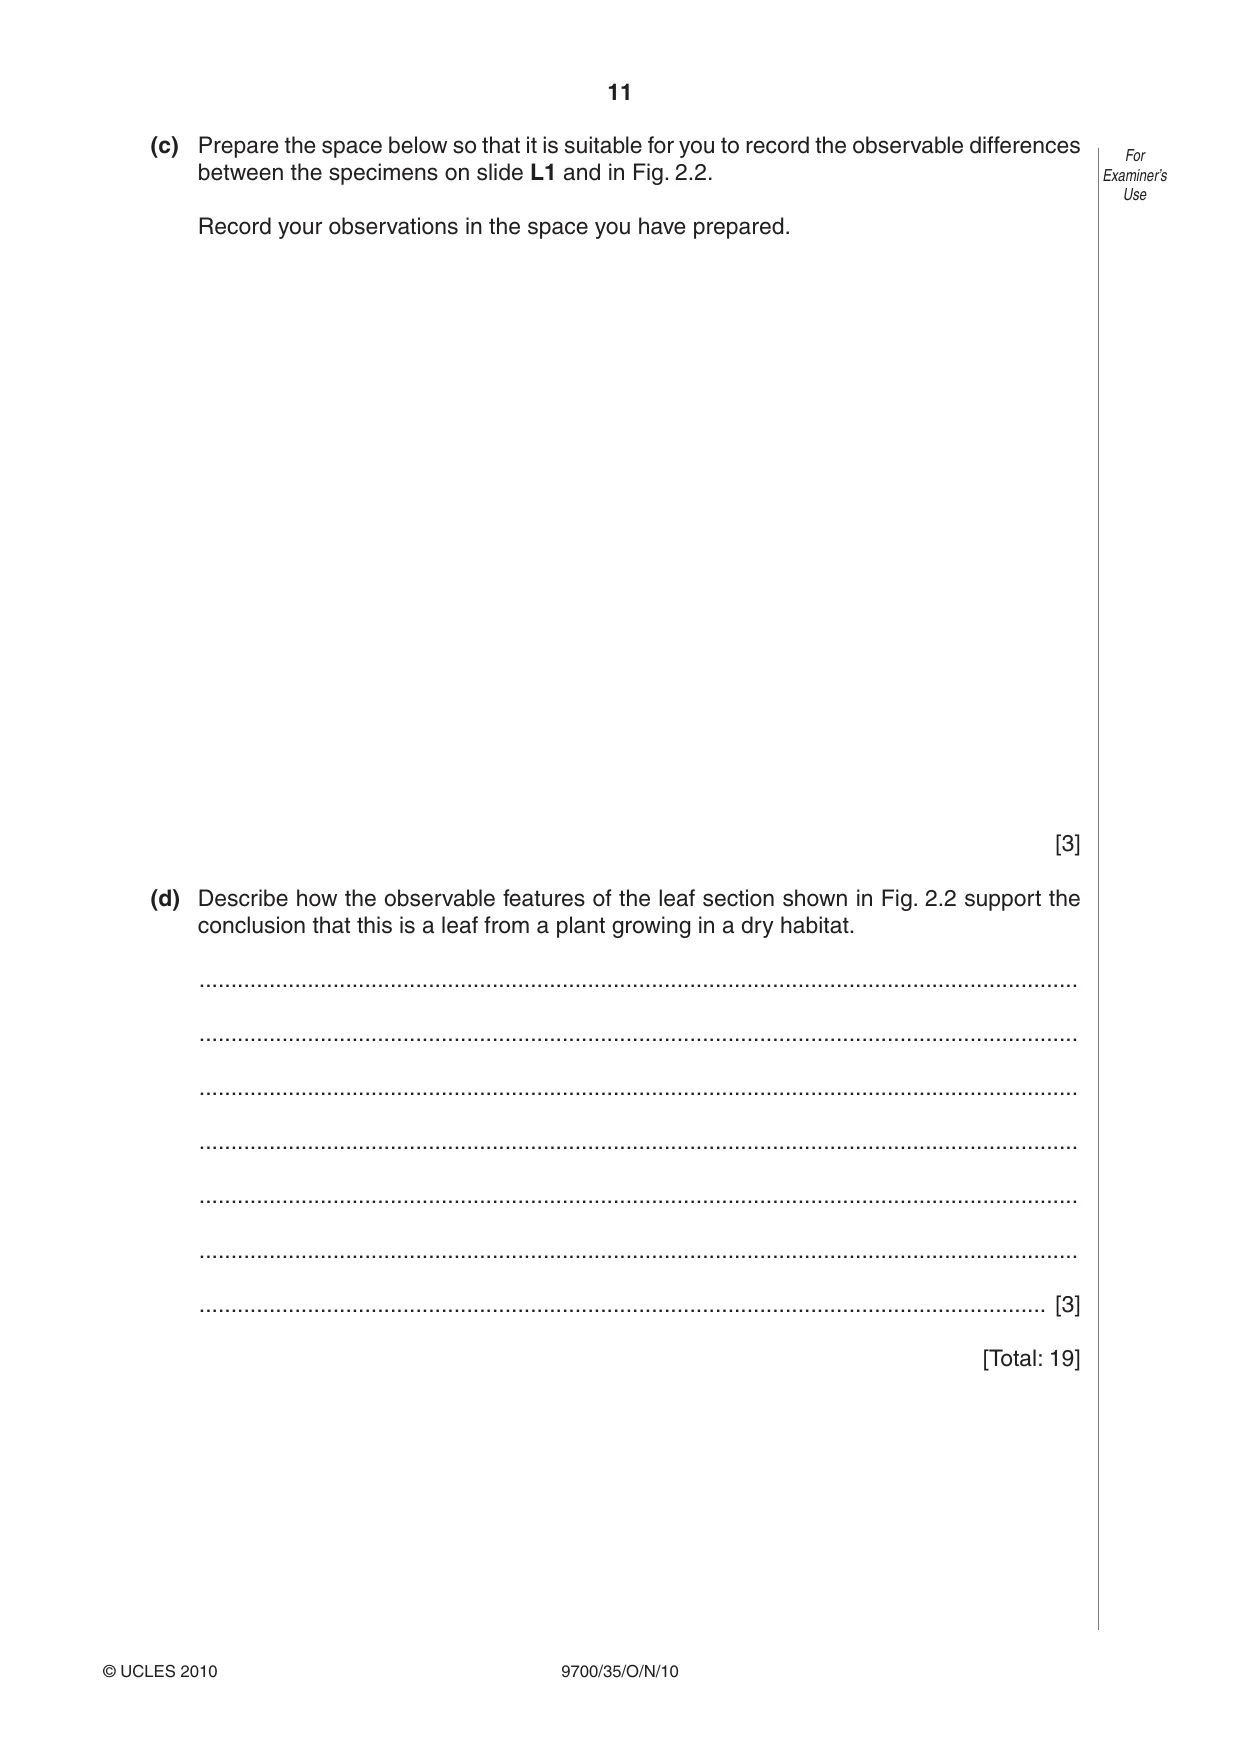
11 9700/35/O/N/10 © UCLES 2010 For Examiner’s Use (c) Prepare the space below so that it is suitable for you to record the observable differences between the specimens on slide L1 and in Fig. 2.2. Record your observations in the space you have prepared. [3] (d) Describe how the observable features of the leaf section shown in Fig. 2.2 support the conclusion that this is a leaf from a plant growing in a dry habitat. … … … … … … … [3] [Total: 19]
Question paper, page 12
12 9700/35/O/N/10 © UCLES 2010 Permission to reproduce items where third-party owned material protected by copyright is included has been sought and cleared where possible. Every reasonable effort has been made by the publisher (UCLES) to trace copyright holders, but if any items requiring clearance have unwittingly been included, the publisher will be pleased to make amends at the earliest possible opportunity. University of Cambridge International Examinations is part of the Cambridge Assessment Group. Cambridge Assessment is the brand name of University of Cambridge Local Examinations Syndicate (UCLES), which is itself a department of the University of Cambridge. BLANK PAGE
Mark scheme, page 1
UNIVERSITY OF CAMBRIDGE INTERNATIONAL EXAMINATIONS GCE Advanced Subsidiary Level and GCE Advanced Level MARK SCHEME for the October/November 2010 question paper for the guidance of teachers 9700 BIOLOGY 9700/35 Paper 31 (Advanced Practical Skills 1), maximum raw mark 40 This mark scheme is published as an aid to teachers and candidates, to indicate the requirements of the examination. It shows the basis on which Examiners were instructed to award marks. It does not indicate the details of the discussions that took place at an Examiners’ meeting before marking began, which would have considered the acceptability of alternative answers. Mark schemes must be read in conjunction with the question papers and the report on the examination. • CIE will not enter into discussions or correspondence in connection with these mark schemes. CIE is publishing the mark schemes for the October/November 2010 question papers for most IGCSE, GCE Advanced Level and Advanced Subsidiary Level syllabuses and some Ordinary Level syllabuses.
Mark scheme, page 2
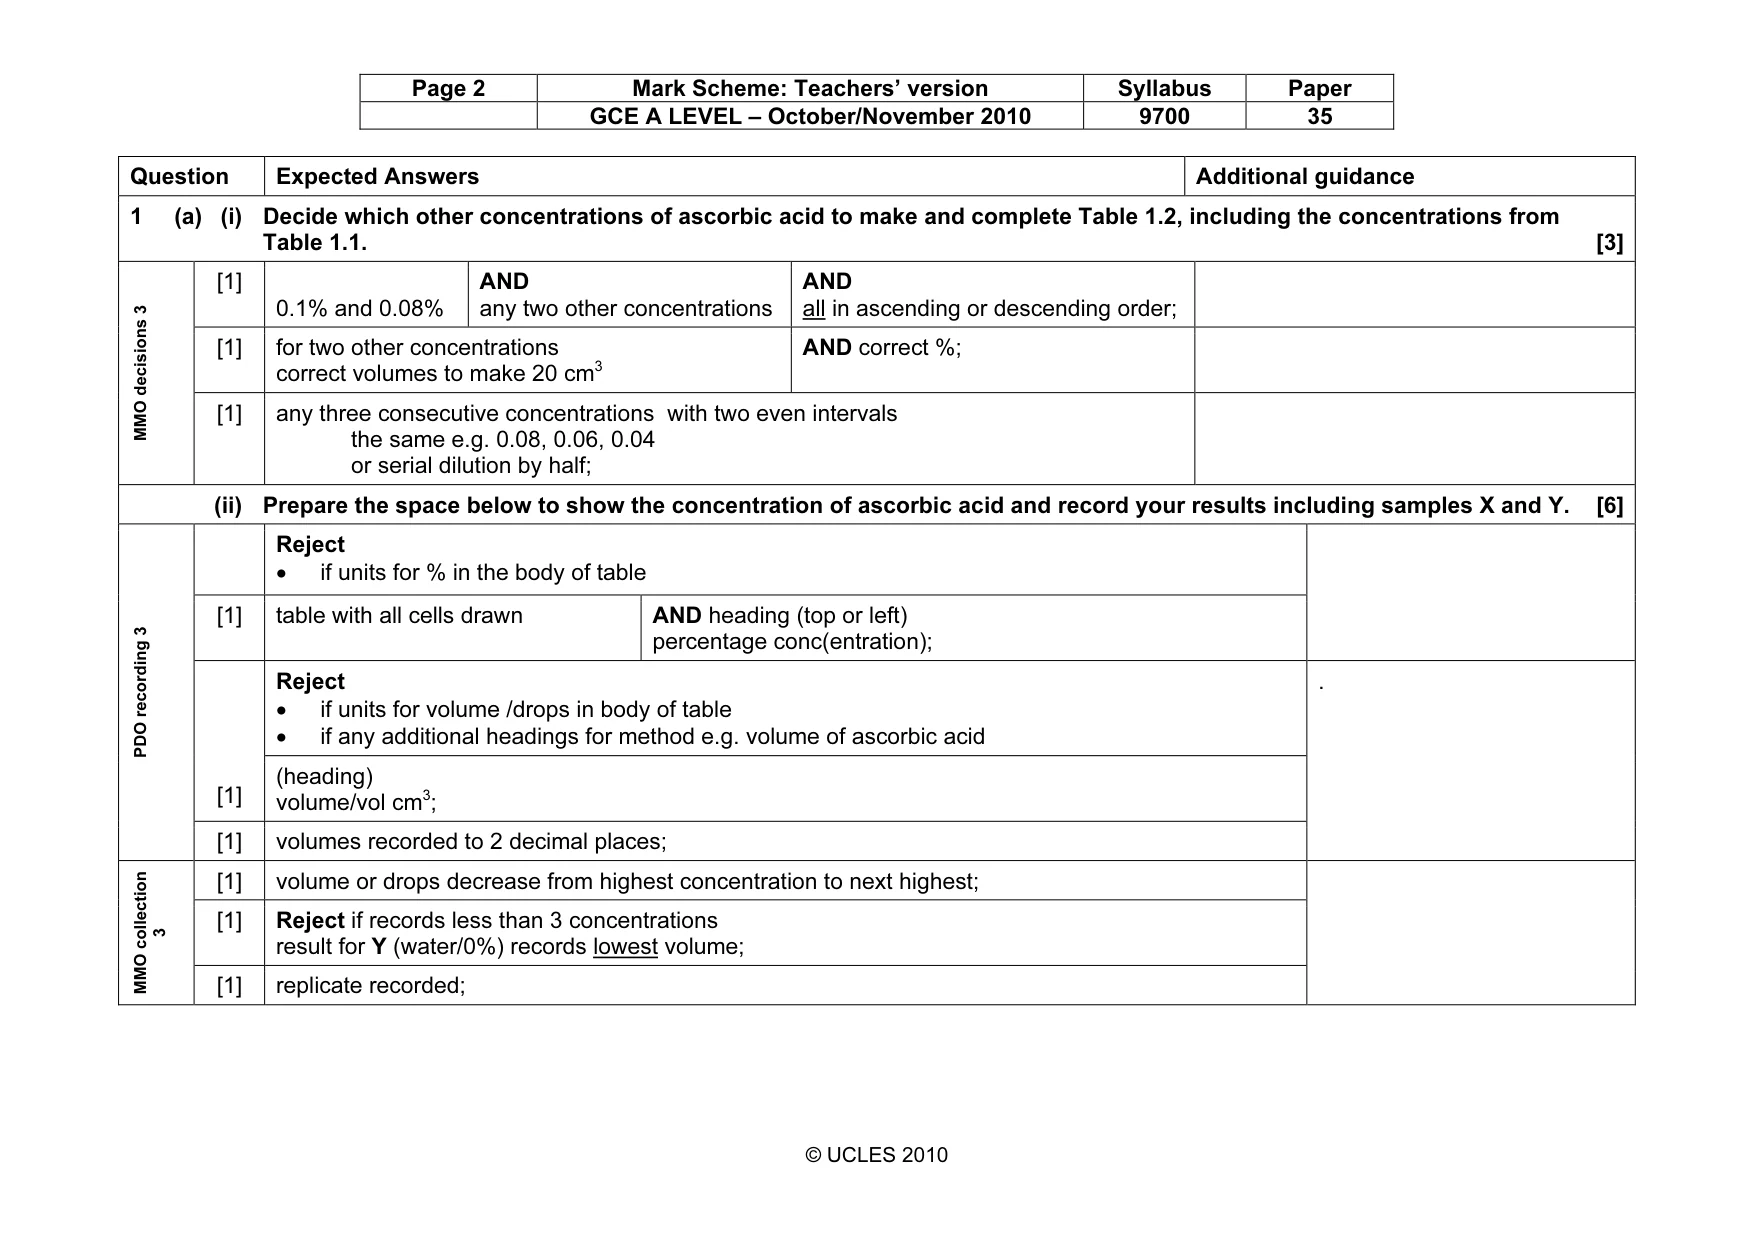
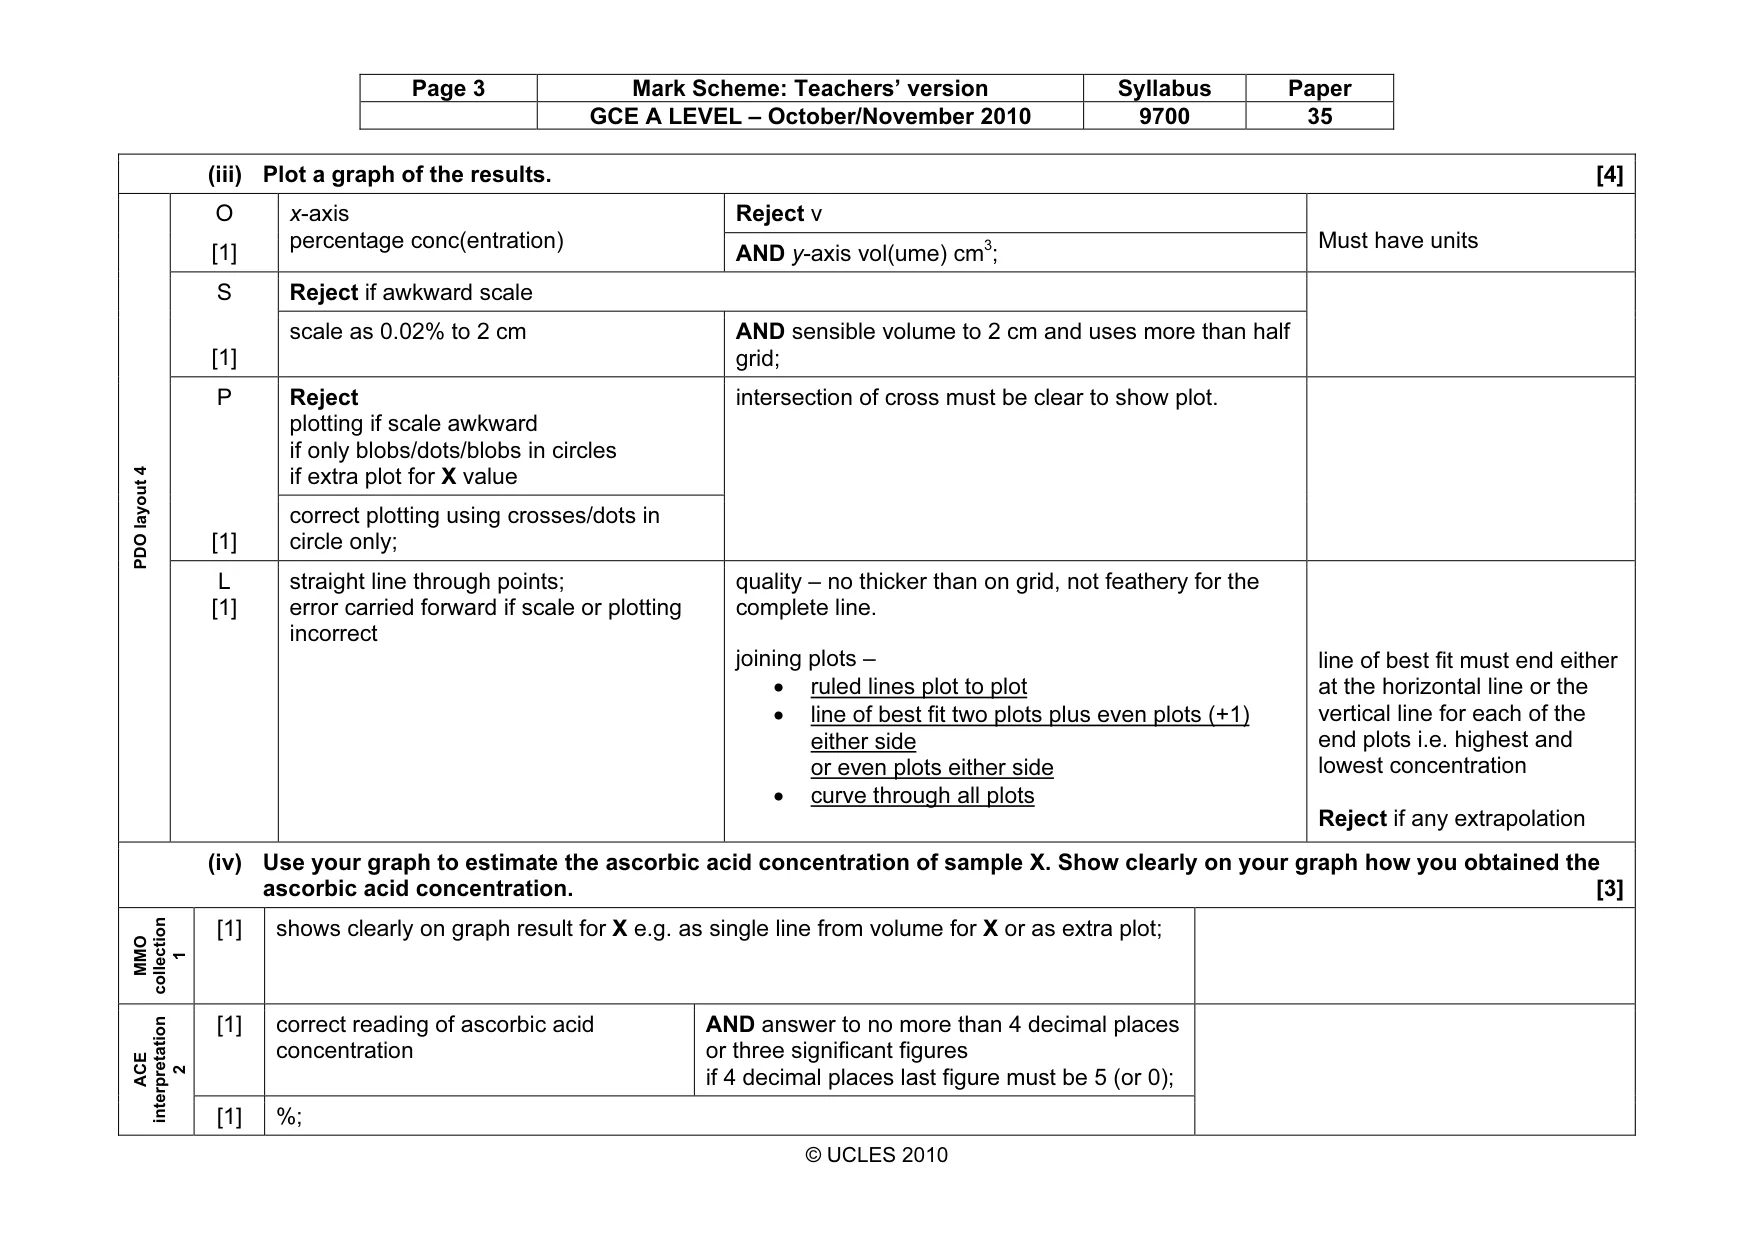
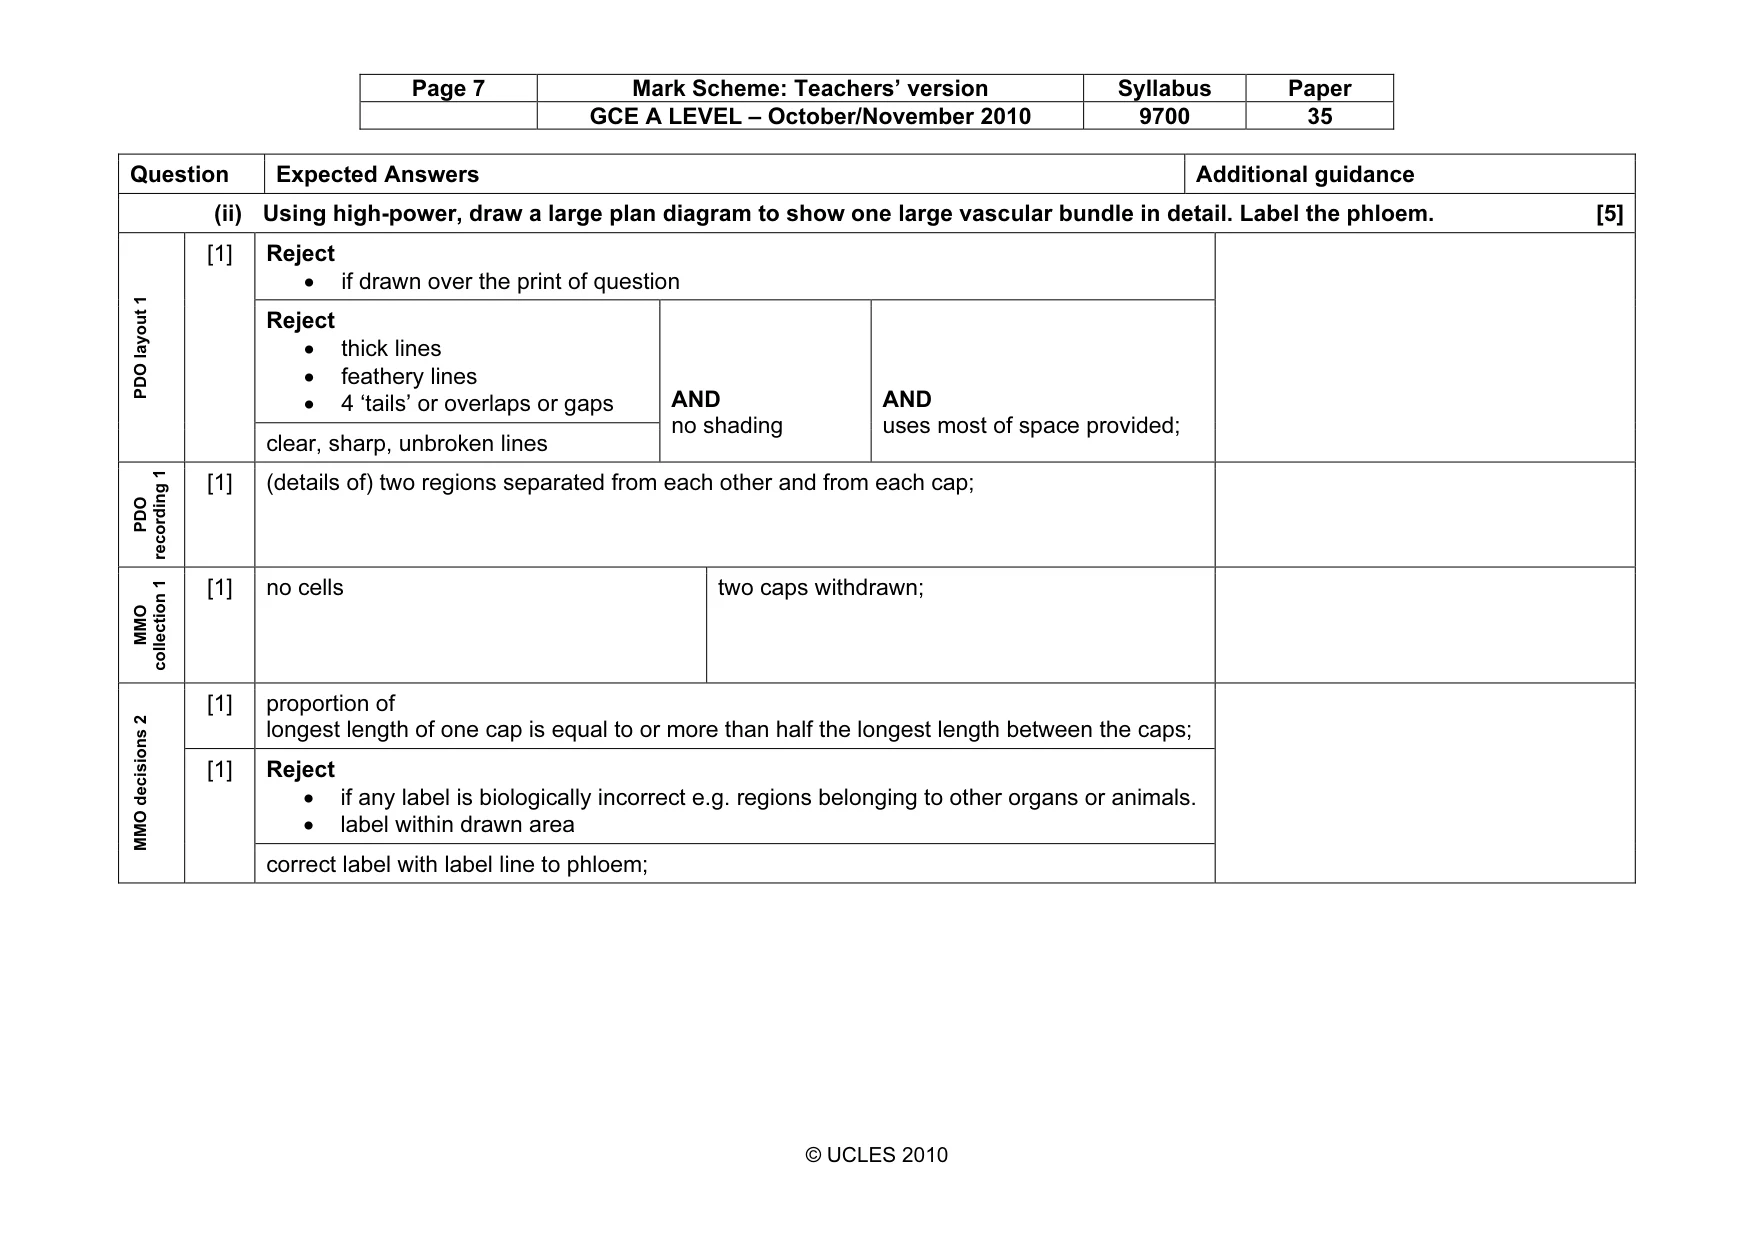
Page 2 Mark Scheme: Teachers’ version Syllabus Paper GCE A LEVEL – October/November 2010 9700 35 © UCLES 2010 Question Expected Answers Additional guidance 1 (a) (i) Decide which other concentrations of ascorbic acid to make and complete Table 1.2, including the concentrations from Table 1.1. [3] [1] 0.1% and 0.08% AND any two other concentrations AND all in ascending or descending order; [1] for two other concentrations correct volumes to make 20 cm3 AND correct %; MMO decisions 3 [1] any three consecutive concentrations with two even intervals the same e.g. 0.08, 0.06, 0.04 or serial dilution by half; (ii) Prepare the space below to show the concentration of ascorbic acid and record your results including samples X and Y. [6] Reject • if units for % in the body of table [1] table with all cells drawn AND heading (top or left) percentage conc(entration); Reject • if units for volume /drops in body of table • if any additional headings for method e.g. volume of ascorbic acid [1] (heading) volume/vol cm3; PDO recording 3 [1] volumes recorded to 2 decimal places; . [1] volume or drops decrease from highest concentration to next highest; [1] Reject if records less than 3 concentrations result for Y (water/0%) records lowest volume; MMO collection 3 [1] replicate recorded;
Mark scheme, page 3
Page 3 Mark Scheme: Teachers’ version Syllabus Paper GCE A LEVEL – October/November 2010 9700 35 © UCLES 2010 (iii) Plot a graph of the results. [4] Reject v O [1] x-axis percentage conc(entration) AND y-axis vol(ume) cm3; Must have units Reject if awkward scale S [1] scale as 0.02% to 2 cm AND sensible volume to 2 cm and uses more than half grid; Reject plotting if scale awkward if only blobs/dots/blobs in circles if extra plot for X value P [1] correct plotting using crosses/dots in circle only; intersection of cross must be clear to show plot. PDO layout 4 L [1] straight line through points; error carried forward if scale or plotting incorrect quality – no thicker than on grid, not feathery for the complete line. joining plots – • ruled lines plot to plot • line of best fit two plots plus even plots (+1) either side or even plots either side • curve through all plots line of best fit must end either at the horizontal line or the vertical line for each of the end plots i.e. highest and lowest concentration Reject if any extrapolation (iv) Use your graph to estimate the ascorbic acid concentration of sample X. Show clearly on your graph how you obtained the ascorbic acid concentration. [3] MMO collection 1 [1] shows clearly on graph result for X e.g. as single line from volume for X or as extra plot; [1] correct reading of ascorbic acid concentration AND answer to no more than 4 decimal places or three significant figures if 4 decimal places last figure must be 5 (or 0); ACE interpretation 2 [1] %;
Mark scheme, page 4
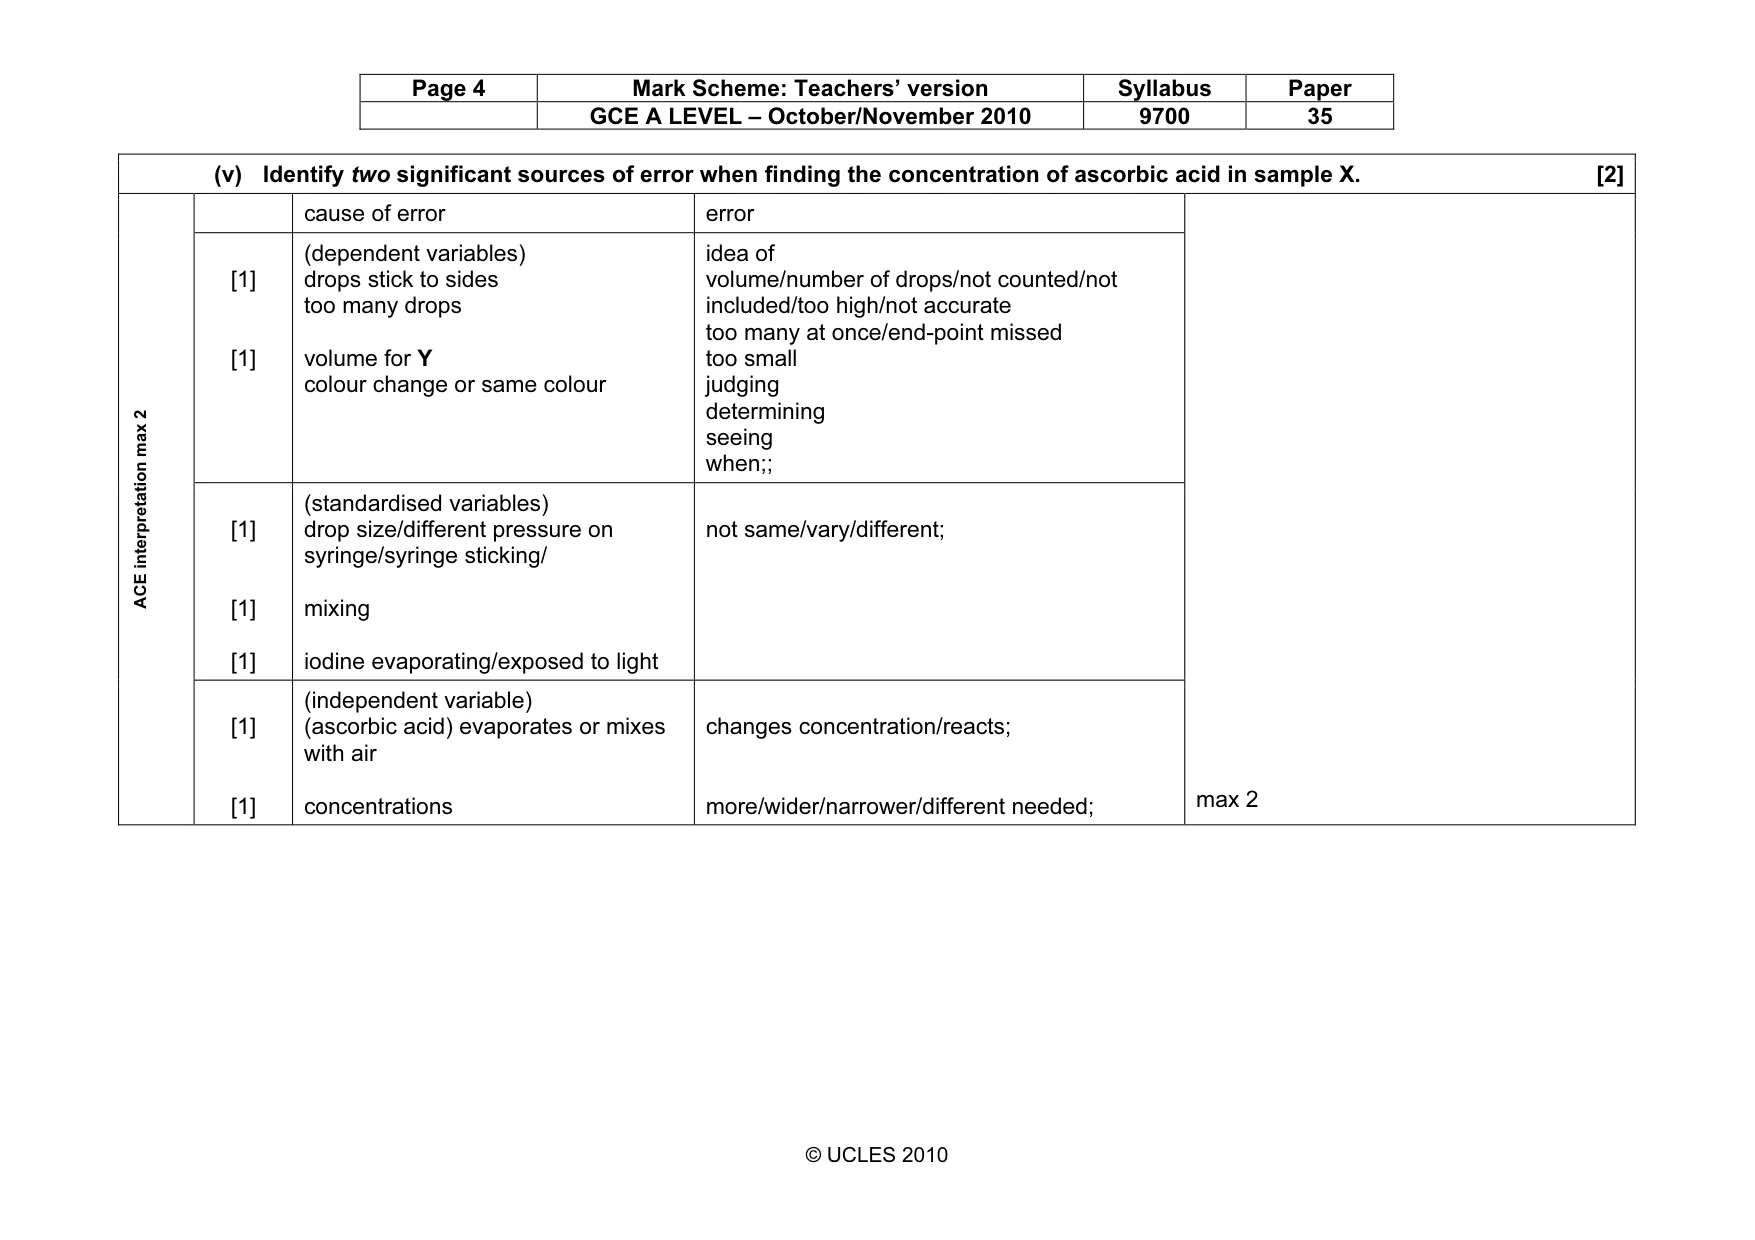
Page 4 Mark Scheme: Teachers’ version Syllabus Paper GCE A LEVEL – October/November 2010 9700 35 © UCLES 2010 (v) Identify two significant sources of error when finding the concentration of ascorbic acid in sample X. [2] cause of error error [1] [1] (dependent variables) drops stick to sides too many drops volume for Y colour change or same colour idea of volume/number of drops/not counted/not included/too high/not accurate too many at once/end-point missed too small judging determining seeing when;; [1] [1] [1] (standardised variables) drop size/different pressure on syringe/syringe sticking/ mixing iodine evaporating/exposed to light not same/vary/different; ACE interpretation max 2 [1] [1] (independent variable) (ascorbic acid) evaporates or mixes with air concentrations changes concentration/reacts; more/wider/narrower/different needed; max 2
Mark scheme, page 5
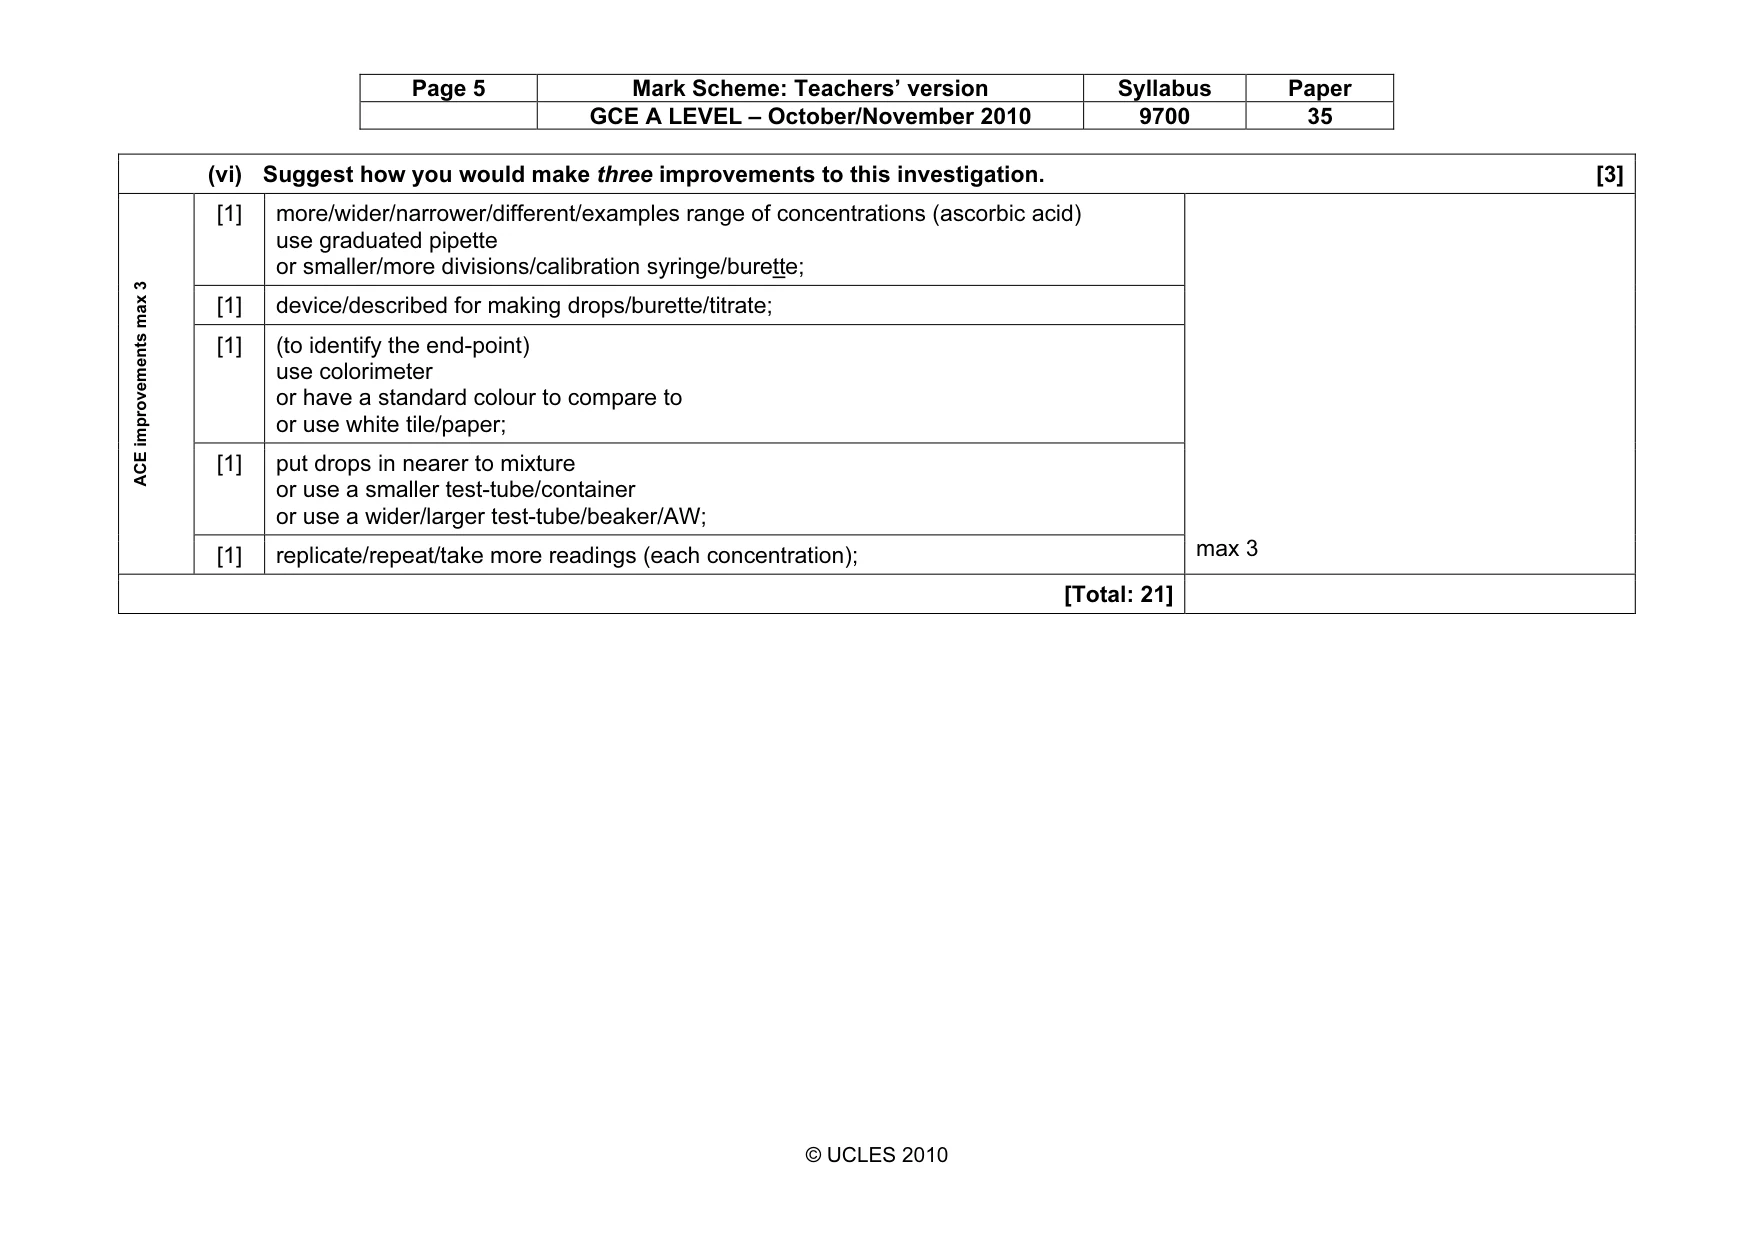
Page 5 Mark Scheme: Teachers’ version Syllabus Paper GCE A LEVEL – October/November 2010 9700 35 © UCLES 2010 (vi) Suggest how you would make three improvements to this investigation. [3] [1] more/wider/narrower/different/examples range of concentrations (ascorbic acid) use graduated pipette or smaller/more divisions/calibration syringe/burette; [1] device/described for making drops/burette/titrate; [1] (to identify the end-point) use colorimeter or have a standard colour to compare to or use white tile/paper; [1] put drops in nearer to mixture or use a smaller test-tube/container or use a wider/larger test-tube/beaker/AW; ACE improvements max 3 [1] replicate/repeat/take more readings (each concentration); max 3 [Total: 21]
Mark scheme, page 6
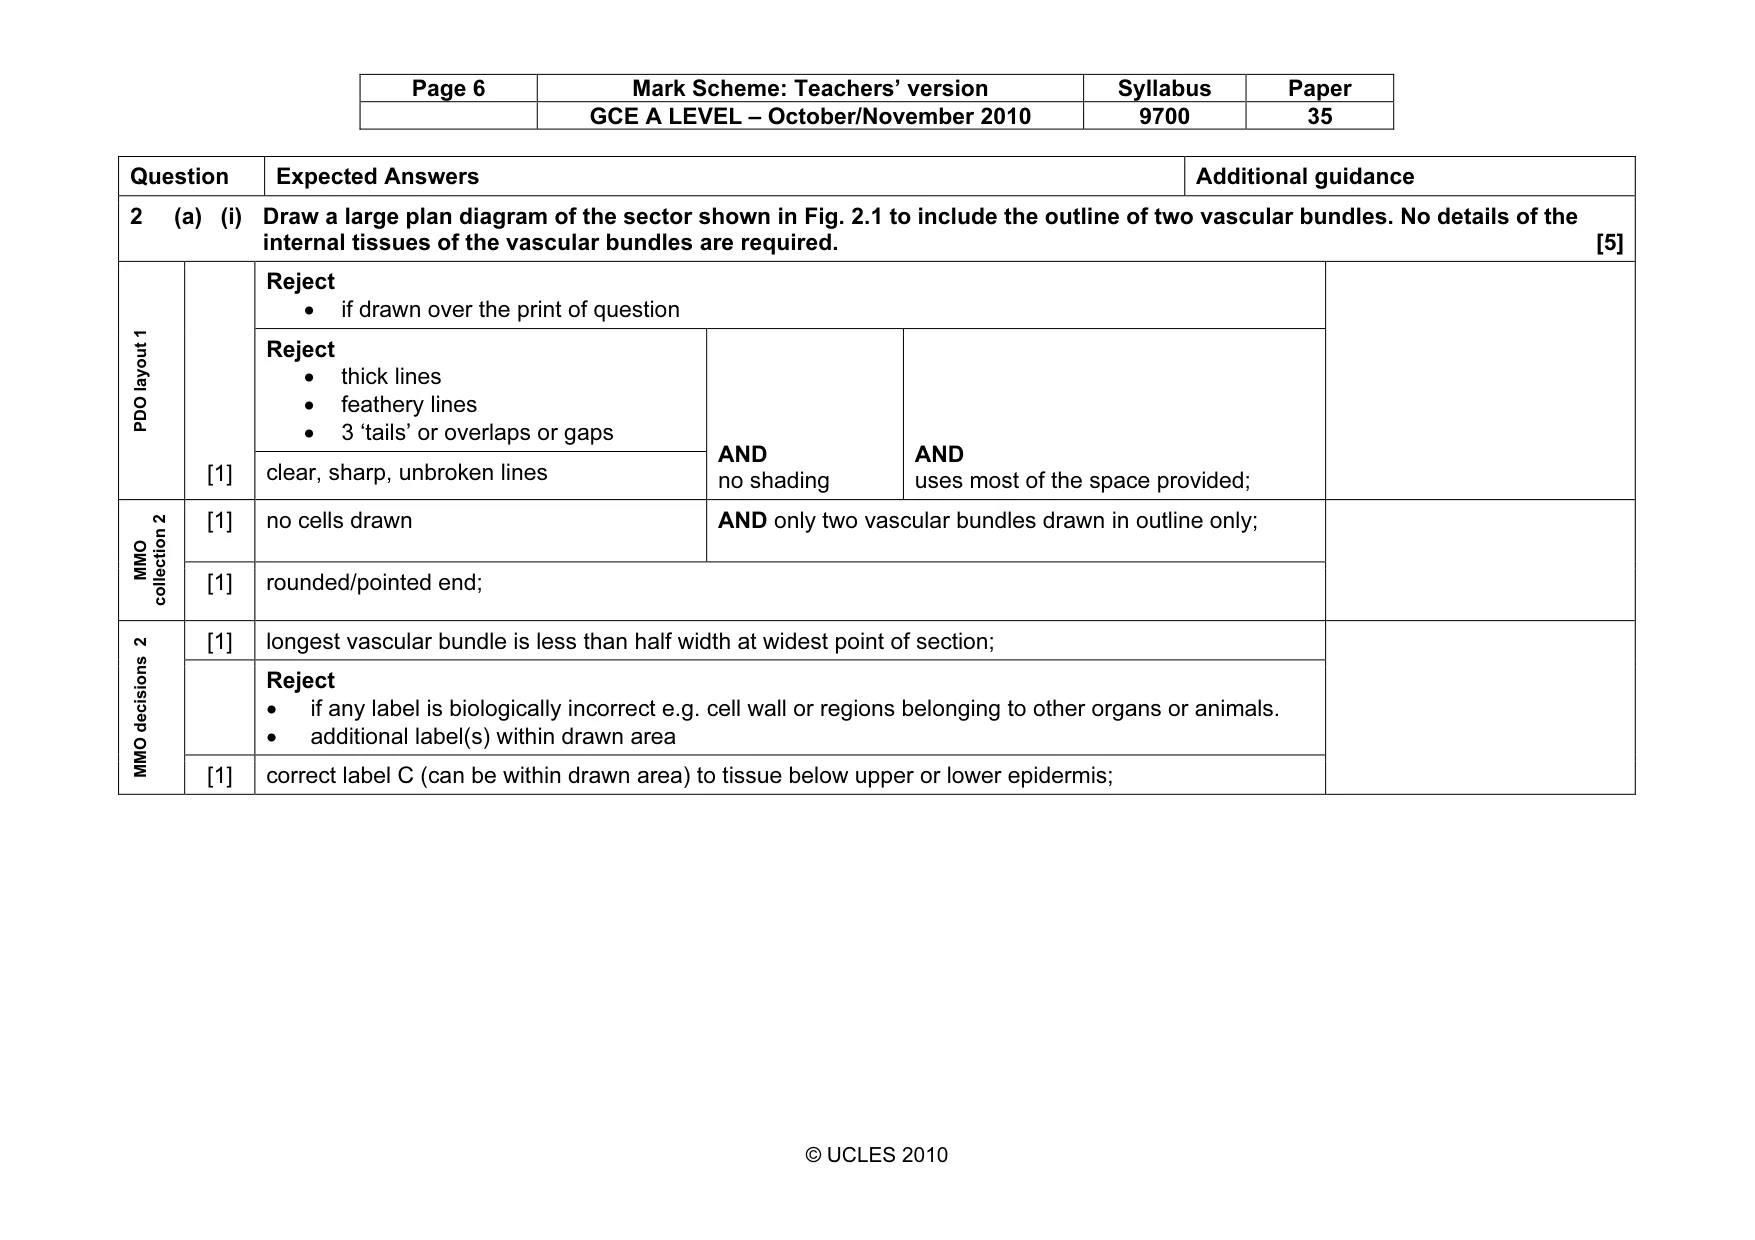
Page 6 Mark Scheme: Teachers’ version Syllabus Paper GCE A LEVEL – October/November 2010 9700 35 © UCLES 2010 Question Expected Answers Additional guidance 2 (a) (i) Draw a large plan diagram of the sector shown in Fig. 2.1 to include the outline of two vascular bundles. No details of the internal tissues of the vascular bundles are required. [5] Reject • if drawn over the print of question Reject • thick lines • feathery lines • 3 ‘tails’ or overlaps or gaps PDO layout 1 [1] clear, sharp, unbroken lines AND no shading AND uses most of the space provided; [1] no cells drawn AND only two vascular bundles drawn in outline only; MMO collection 2 [1] rounded/pointed end; [1] longest vascular bundle is less than half width at widest point of section; Reject • if any label is biologically incorrect e.g. cell wall or regions belonging to other organs or animals. • additional label(s) within drawn area MMO decisions 2 [1] correct label C (can be within drawn area) to tissue below upper or lower epidermis;
Mark scheme, page 7
Page 7 Mark Scheme: Teachers’ version Syllabus Paper GCE A LEVEL – October/November 2010 9700 35 © UCLES 2010 Question Expected Answers Additional guidance (ii) Using high-power, draw a large plan diagram to show one large vascular bundle in detail. Label the phloem. [5] Reject • if drawn over the print of question Reject • thick lines • feathery lines • 4 ‘tails’ or overlaps or gaps PDO layout 1 [1] clear, sharp, unbroken lines AND no shading AND uses most of space provided; PDO recording 1 [1] (details of) two regions separated from each other and from each cap; MMO collection 1 [1] no cells two caps withdrawn; [1] proportion of longest length of one cap is equal to or more than half the longest length between the caps; Reject • if any label is biologically incorrect e.g. regions belonging to other organs or animals. • label within drawn area MMO decisions 2 [1] correct label with label line to phloem;
Mark scheme, page 8
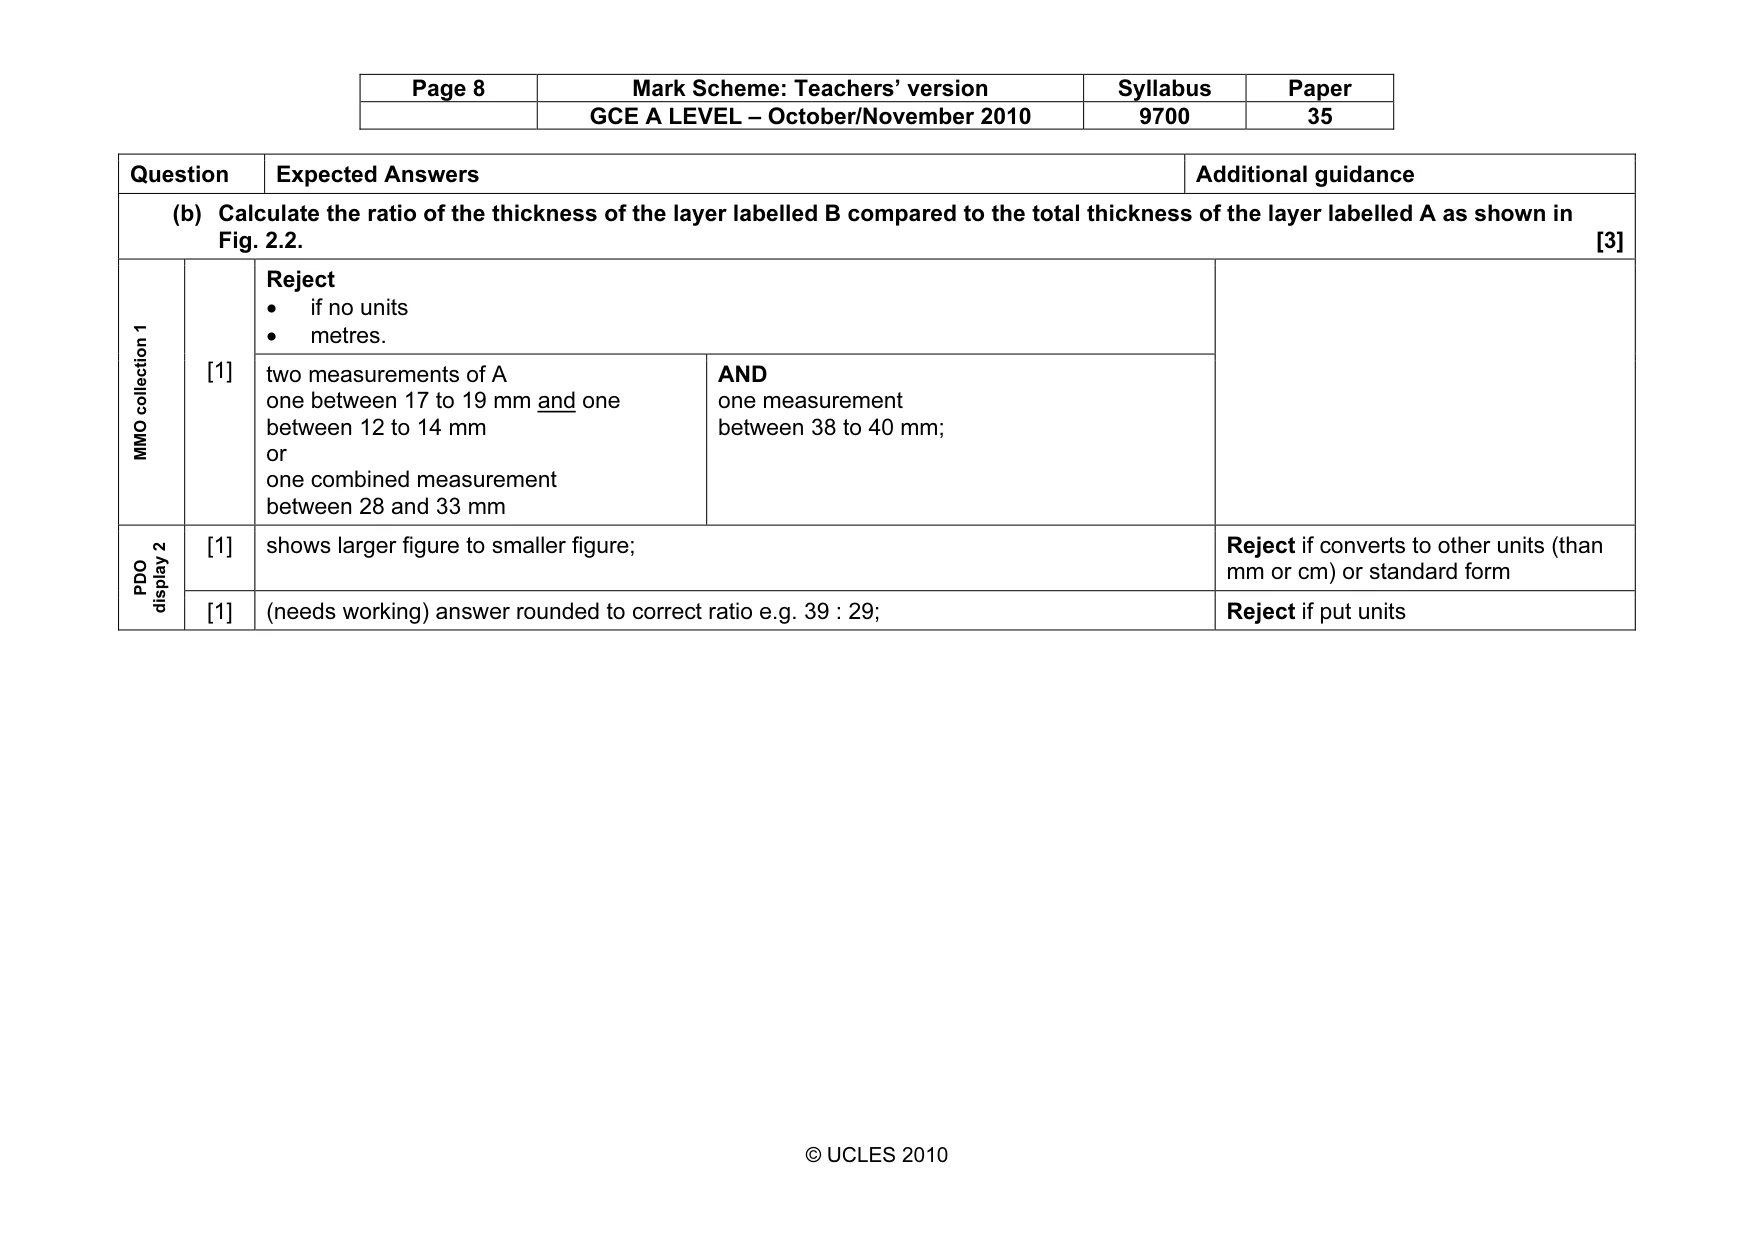
Page 8 Mark Scheme: Teachers’ version Syllabus Paper GCE A LEVEL – October/November 2010 9700 35 © UCLES 2010 Question Expected Answers Additional guidance (b) Calculate the ratio of the thickness of the layer labelled B compared to the total thickness of the layer labelled A as shown in Fig. 2.2. [3] Reject • if no units • metres. MMO collection 1 [1] two measurements of A one between 17 to 19 mm and one between 12 to 14 mm or one combined measurement between 28 and 33 mm AND one measurement between 38 to 40 mm; [1] shows larger figure to smaller figure; Reject if converts to other units (than mm or cm) or standard form PDO display 2 [1] (needs working) answer rounded to correct ratio e.g. 39 : 29; Reject if put units
Mark scheme, page 9
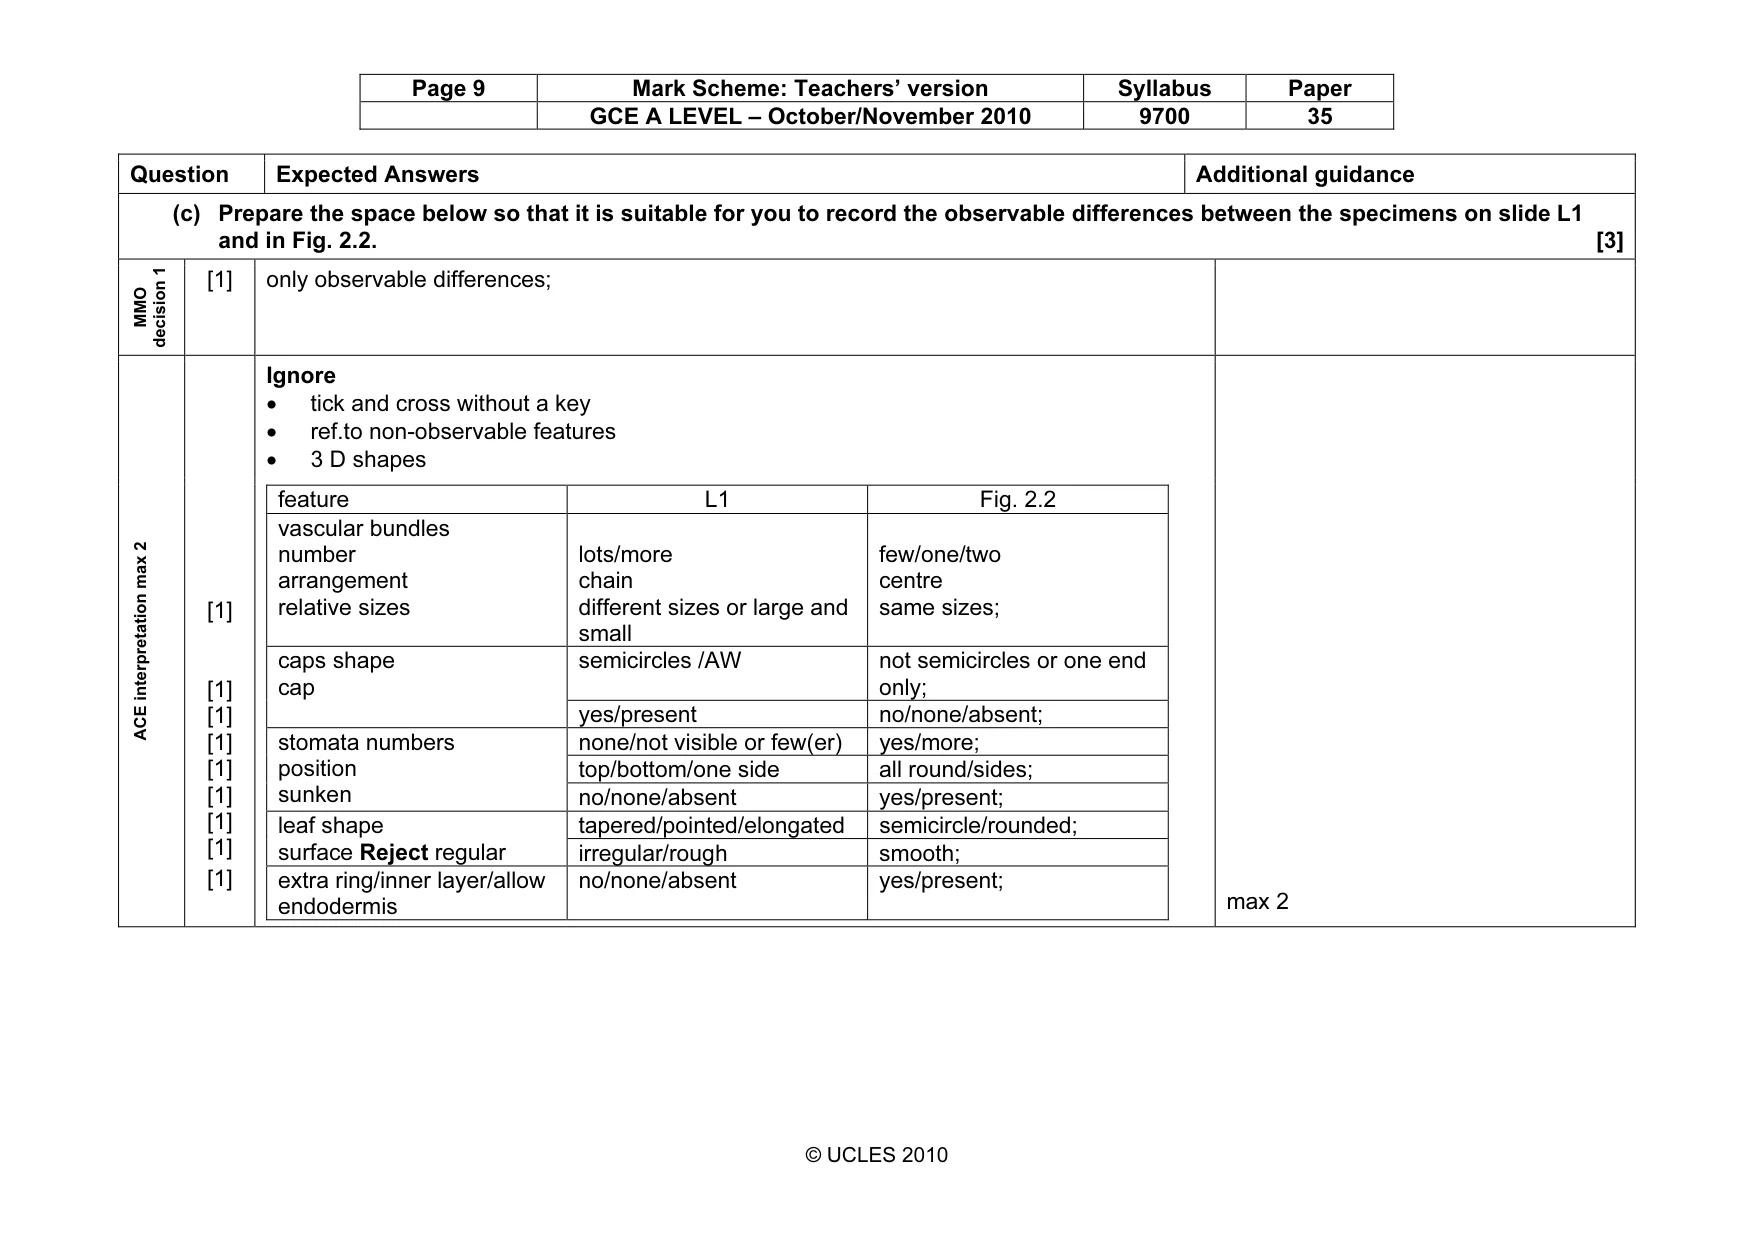
Page 9 Mark Scheme: Teachers’ version Syllabus Paper GCE A LEVEL – October/November 2010 9700 35 © UCLES 2010 Question Expected Answers Additional guidance (c) Prepare the space below so that it is suitable for you to record the observable differences between the specimens on slide L1 and in Fig. 2.2. [3] MMO decision 1 [1] only observable differences; Ignore • tick and cross without a key • ref.to non-observable features • 3 D shapes ACE interpretation max 2 [1] [1] [1] [1] [1] [1] [1] [1] [1] feature L1 Fig. 2.2 vascular bundles number arrangement relative sizes lots/more chain different sizes or large and small few/one/two centre same sizes; semicircles /AW not semicircles or one end only; caps shape cap yes/present no/none/absent; none/not visible or few(er) yes/more; top/bottom/one side all round/sides; stomata numbers position sunken no/none/absent yes/present; tapered/pointed/elongated semicircle/rounded; leaf shape surface Reject regular irregular/rough smooth; extra ring/inner layer/allow endodermis no/none/absent yes/present; max 2
Mark scheme, page 10
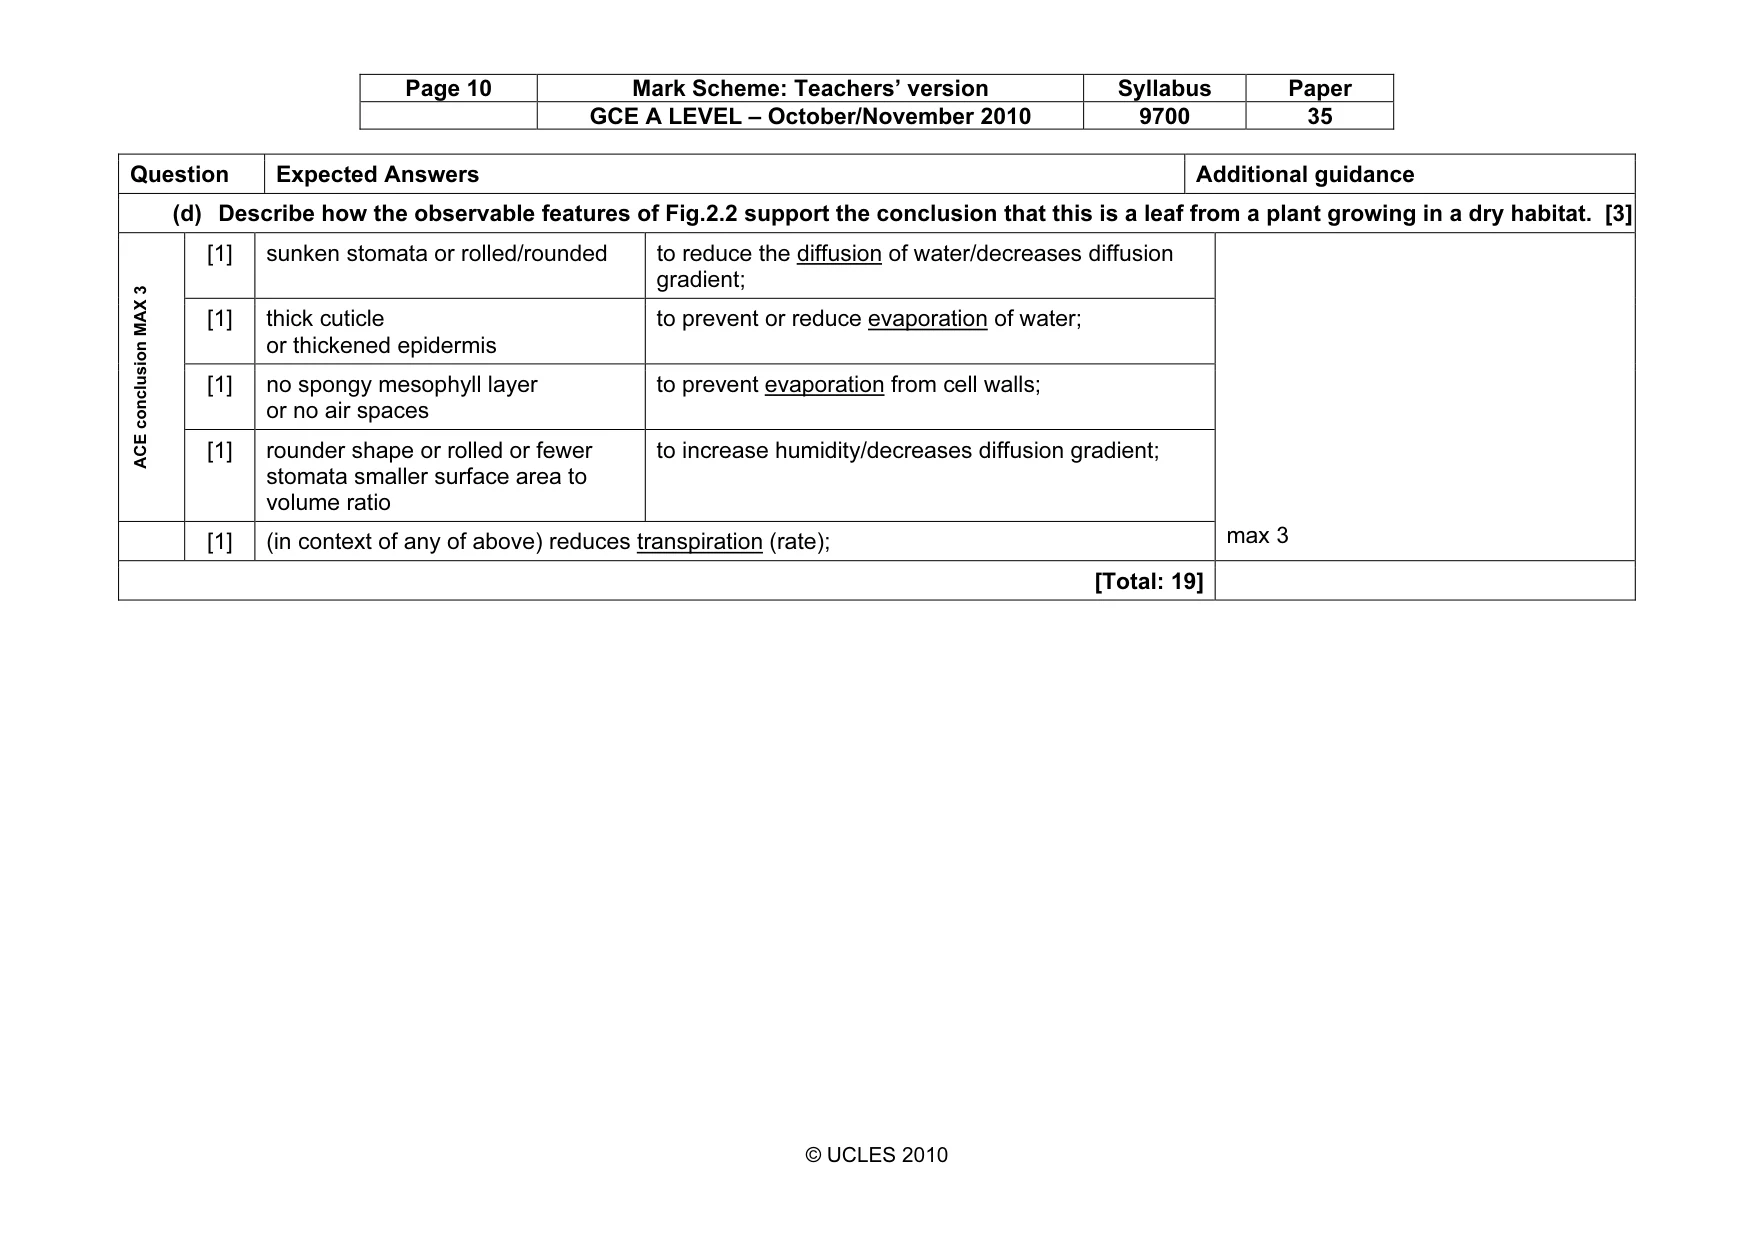
Page 10 Mark Scheme: Teachers’ version Syllabus Paper GCE A LEVEL – October/November 2010 9700 35 © UCLES 2010 Question Expected Answers Additional guidance (d) Describe how the observable features of Fig.2.2 support the conclusion that this is a leaf from a plant growing in a dry habitat. [3] [1] sunken stomata or rolled/rounded to reduce the diffusion of water/decreases diffusion gradient; [1] thick cuticle or thickened epidermis to prevent or reduce evaporation of water; [1] no spongy mesophyll layer or no air spaces to prevent evaporation from cell walls; ACE conclusion MAX 3 [1] rounder shape or rolled or fewer stomata smaller surface area to volume ratio to increase humidity/decreases diffusion gradient; [1] (in context of any of above) reduces transpiration (rate); max 3 [Total: 19]
What you needed in this session
Cambridge’s own grade thresholds for 2010 Oct/Nov, Paper 3 · Variant 5. A higher threshold means an easier paper — the bar moves with how the cohort did.