Cambridge IGCSE Sciences - Co-ordinated (Double) 0654 — 2023 Feb/March Paper 5 · Variant 2
0654/52/F/M/23 · 6 questions · 60 marks · ≈68 min
The question paper and its mark scheme, free to read here and free to download. This is Cambridge’s own paper, exactly as it was sat.
Question paper16 pages

Mark scheme9 pages
Answers below. Sit the paper first if you are practising.
Questions as text
Q1 · You are going to investigate the nutrient content of two solutions, A and B
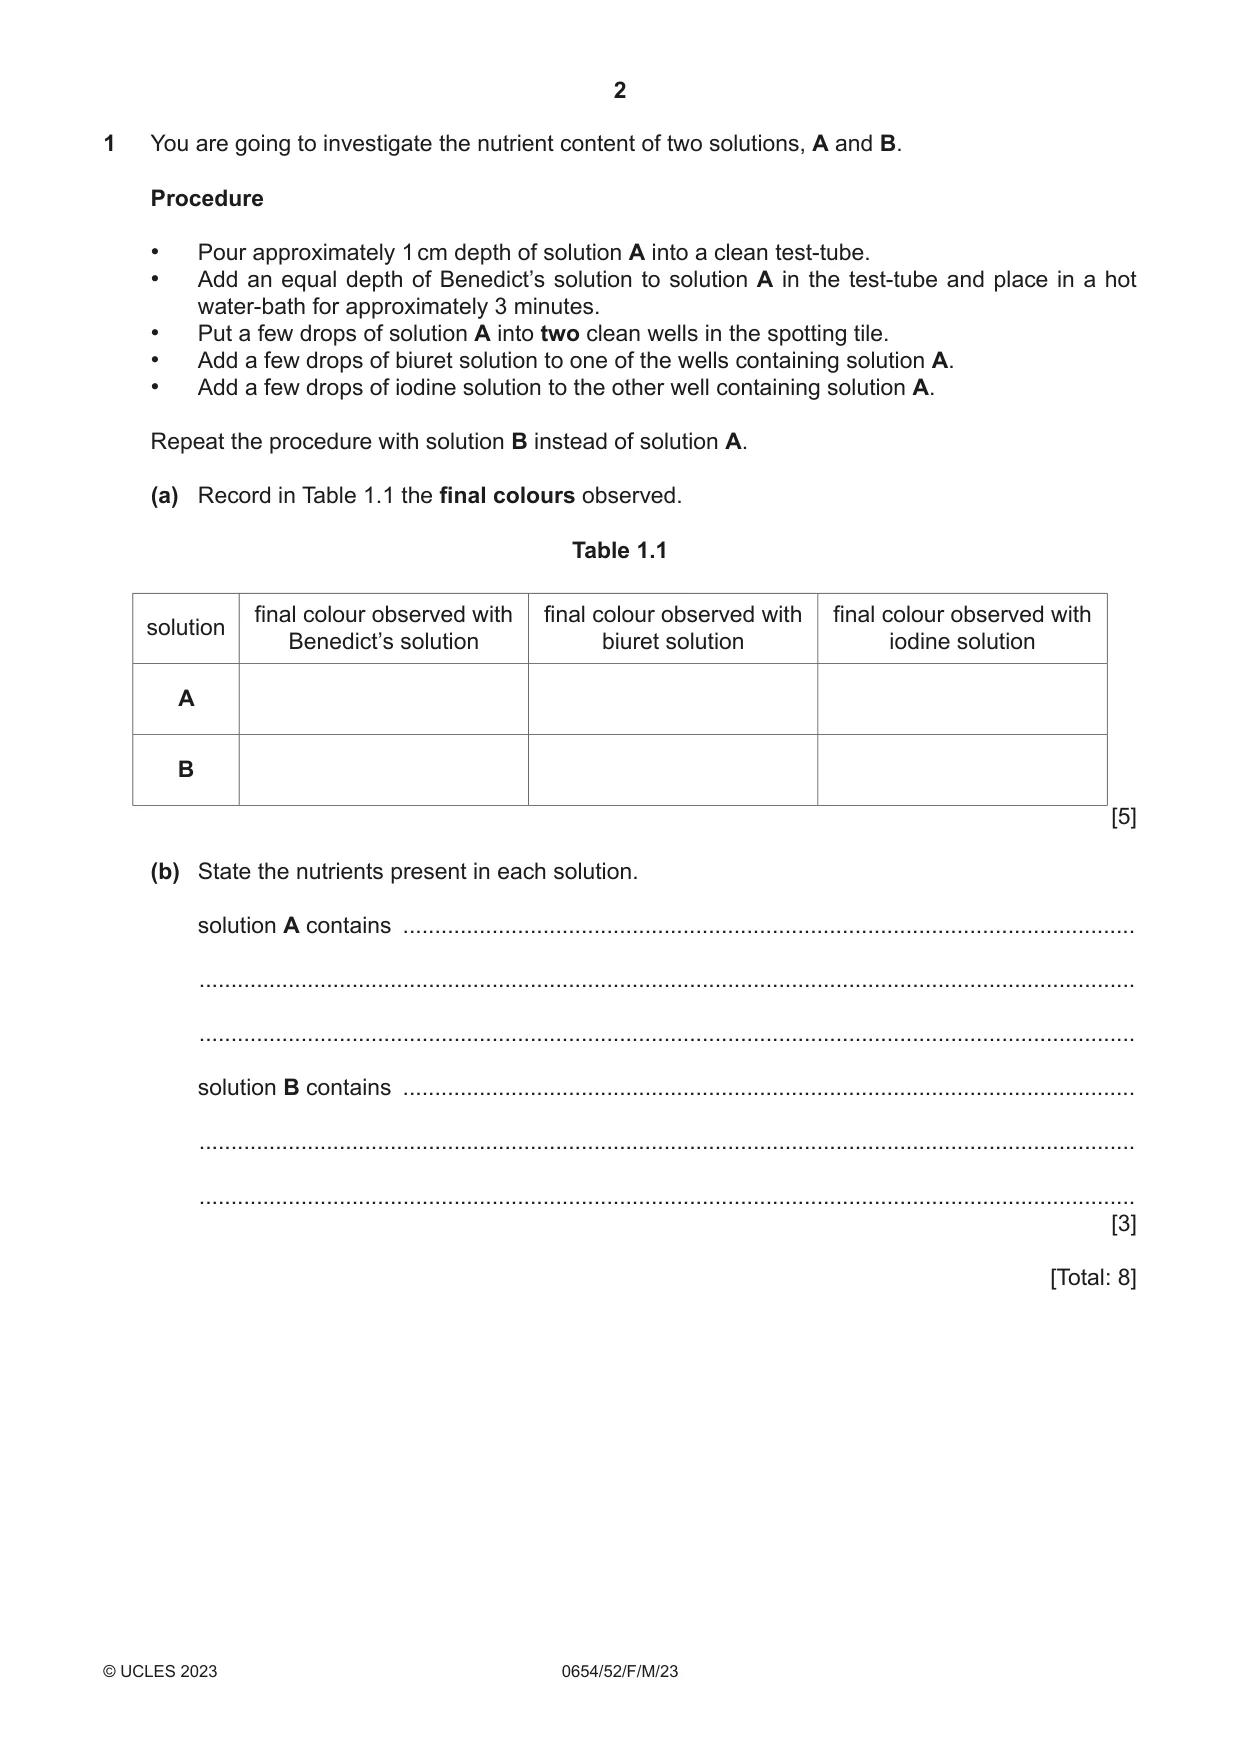
1 You are going to investigate the nutrient content of two solutions, A and B. Procedure • Pour approximately 1 cm depth of solution A into a clean test-tube. • Add an equal depth of Benedict’s solution to solution A in the test-tube and place in a hot water-bath for approximately 3 minutes. • Put a few drops of solution A into two clean wells in the spotting tile. • Add a few drops of biuret solution to one of the wells containing solution A. • Add a few drops of iodine solution to the other well containing solution A. Repeat the procedure with solution B instead of solution A. (a) Record in Table 1.1 the final colours observed. Table 1.1 final colour observed with final colour observed with final colour observed with solution Benedict’s solution biuret solution iodine solution A B [5] (b) State the nutrients present in each solution. solution A contains ................................................................................................................... ................................................................................................................................................... ................................................................................................................................................... solution B contains ................................................................................................................... ................................................................................................................................................... ................................................................................................................................................... [3] [Total: 8]
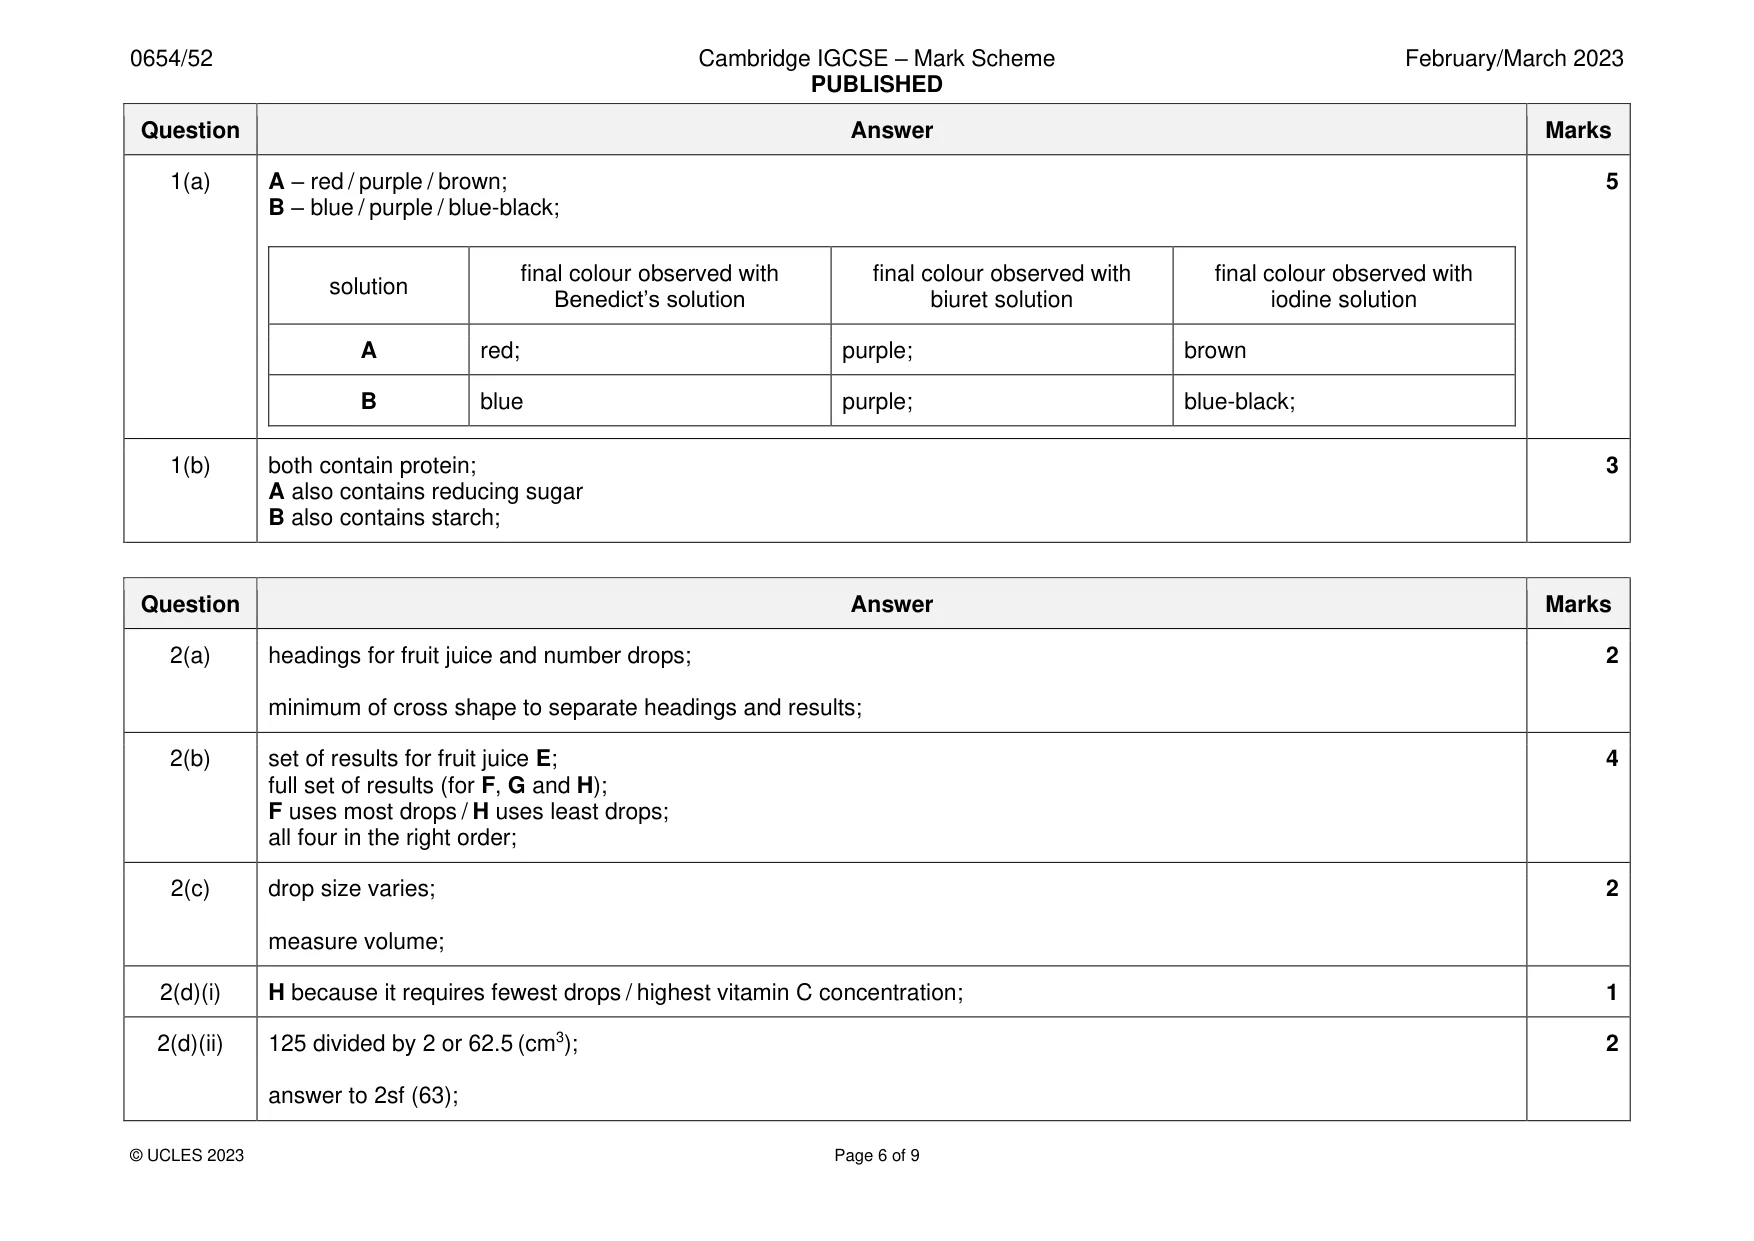
Mark scheme: Question Answer Marks 1(a) A – red / purple / brown; 5 B – blue / purple / blue-black; final colour observed with final colour observed with final colour observed with solution Benedict’s solution biuret solution iodine solution A red; purple; brown B blue purple; blue-black; 1(b) both contain protein; 3 A also contains reducing sugar B also contains starch;
Q2 · You are going to investigate the vitamin C content of four different fruit juices, E, F…
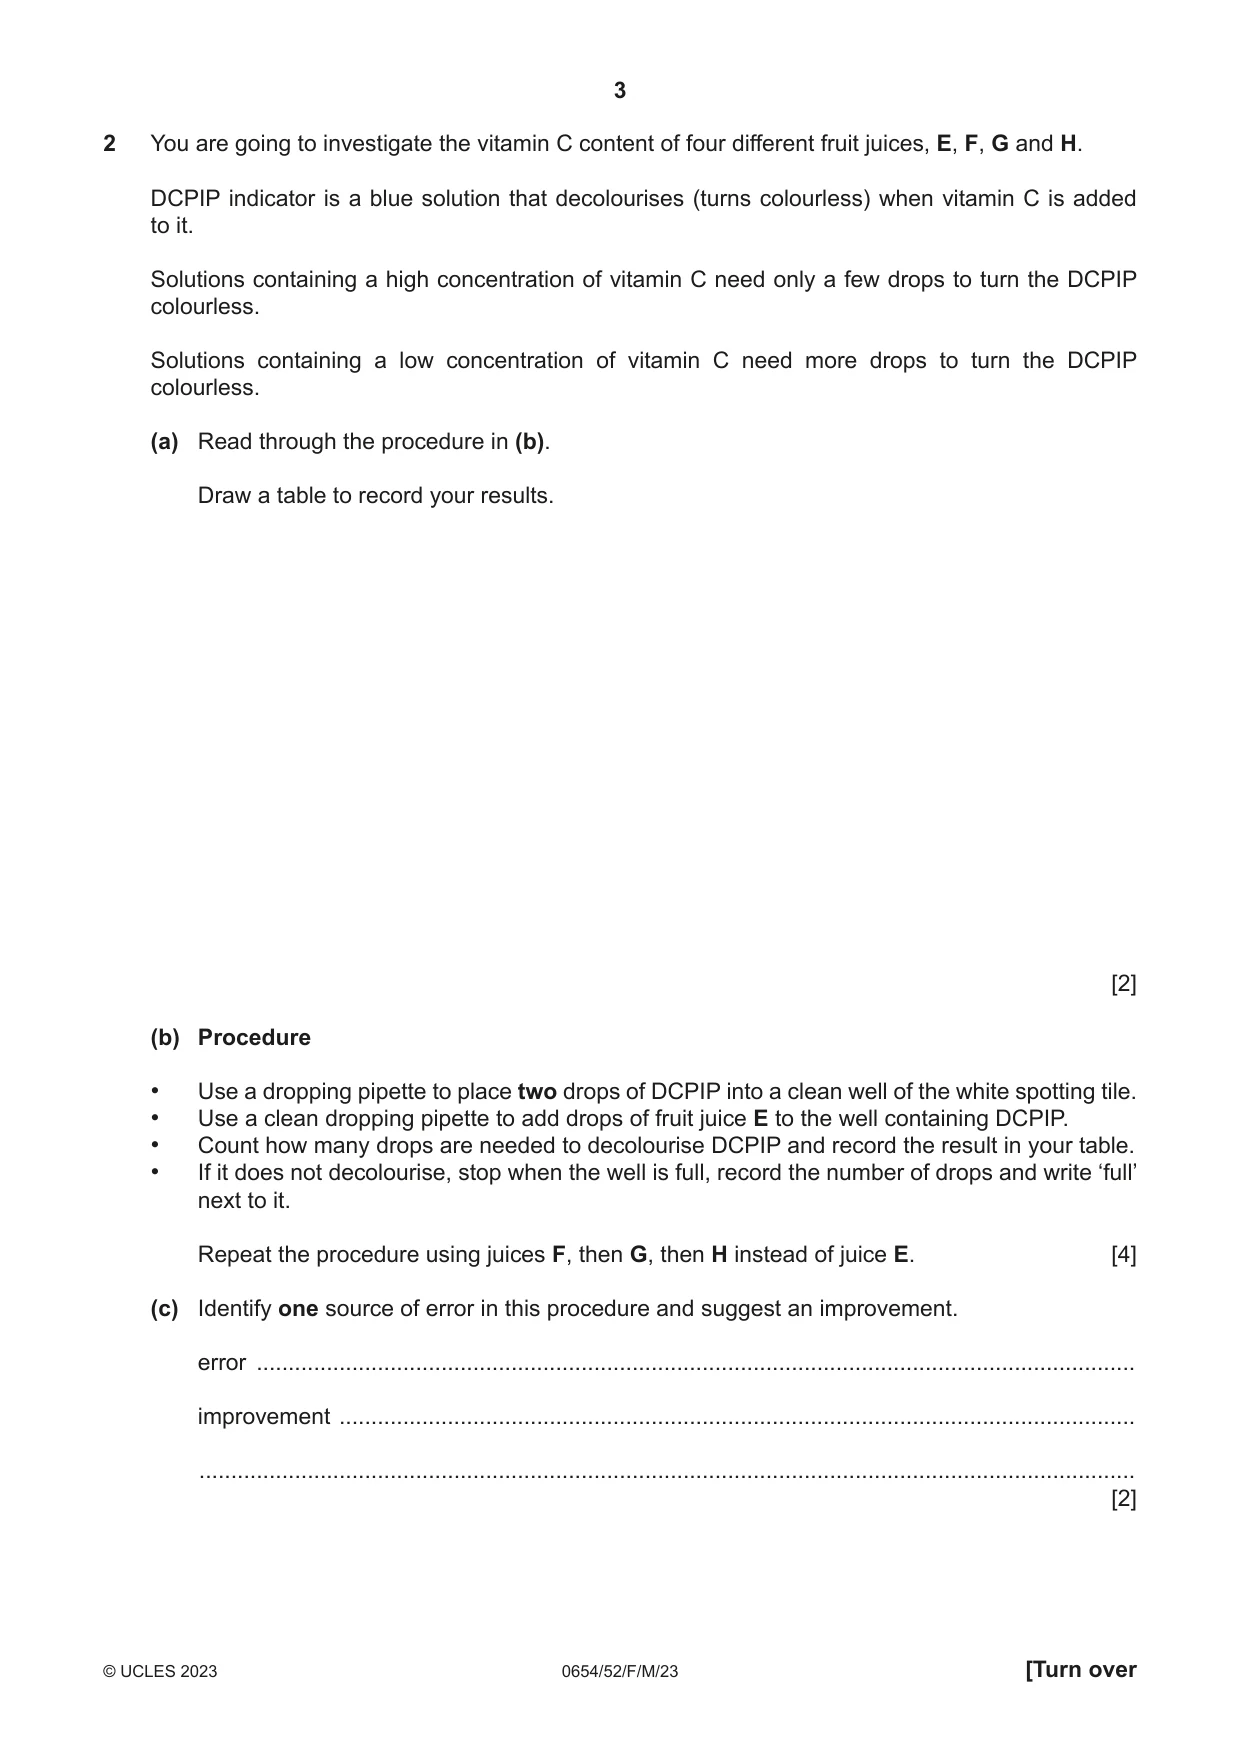
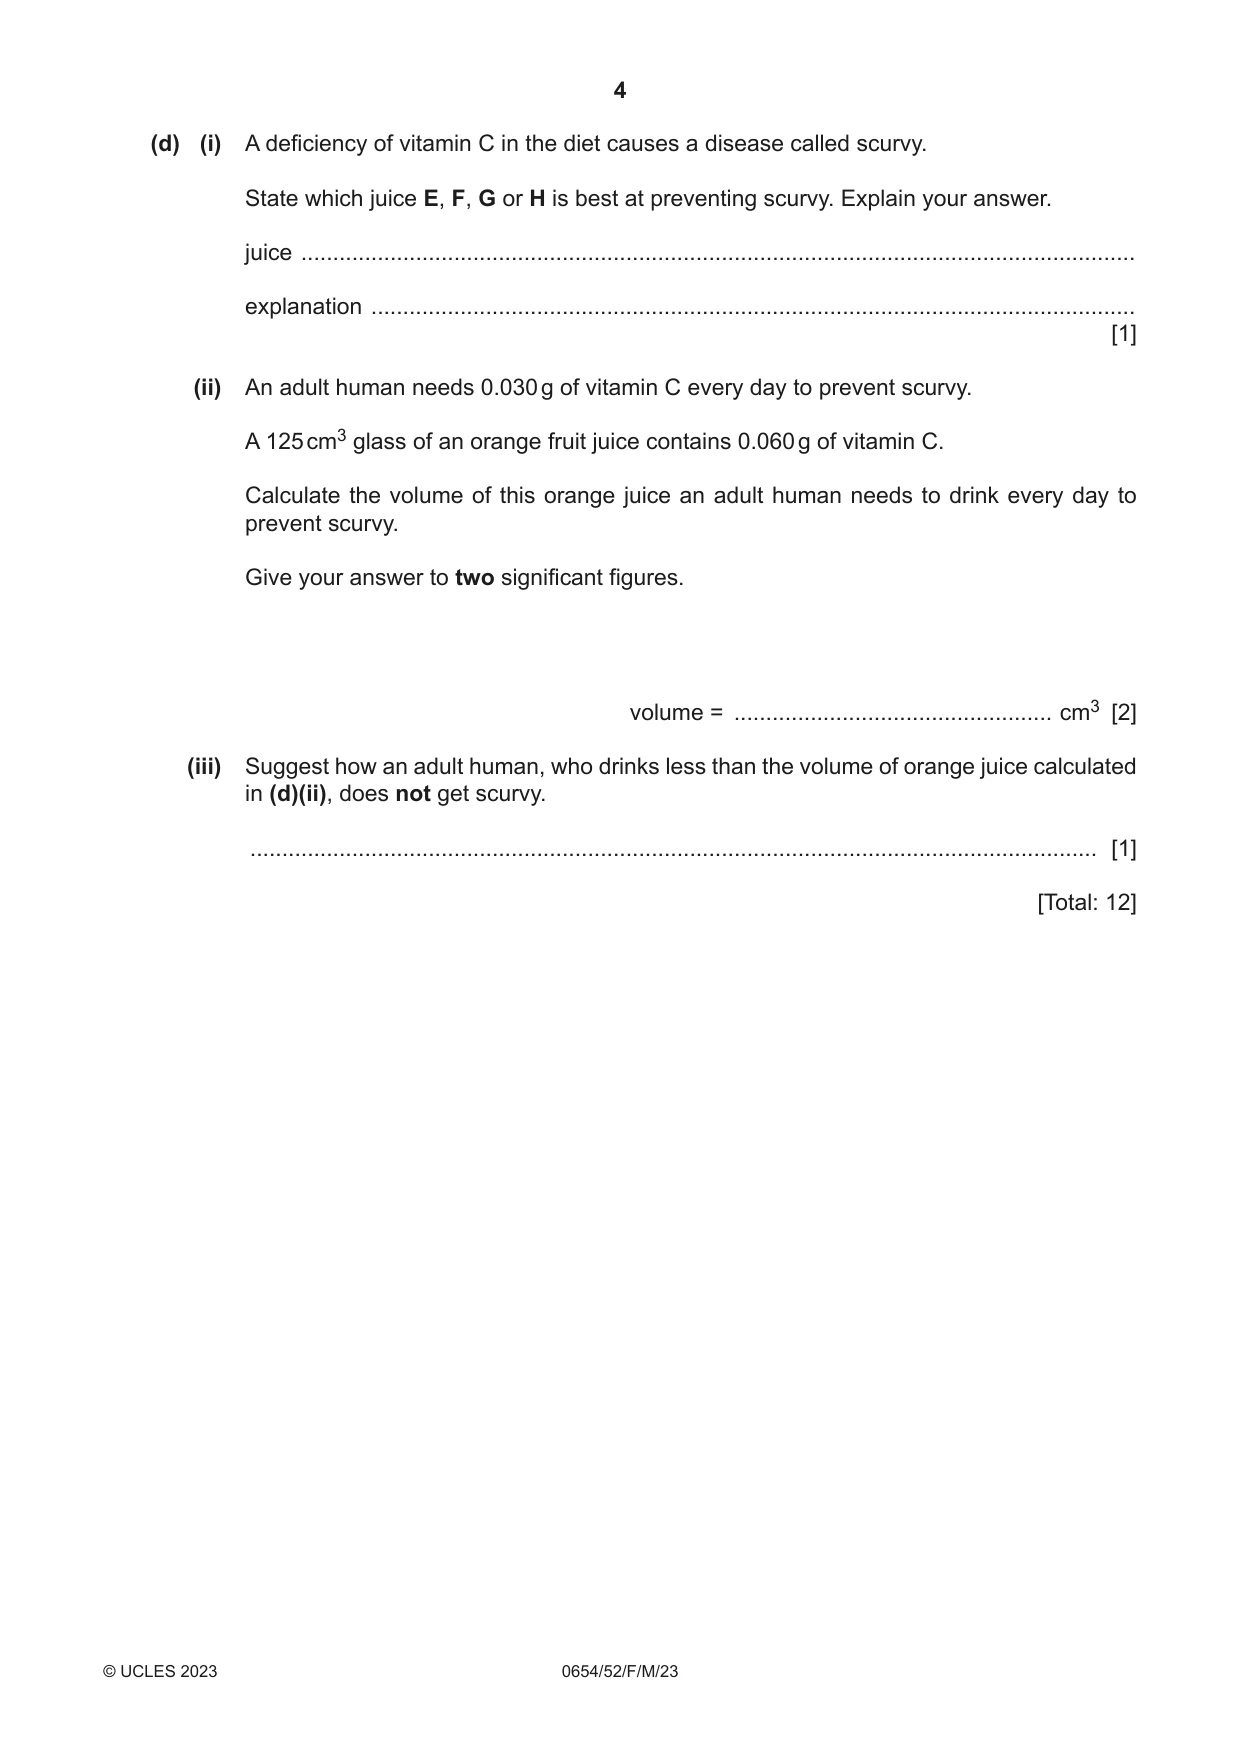
2 You are going to investigate the vitamin C content of four different fruit juices, E, F, G and H. DCPIP indicator is a blue solution that decolourises (turns colourless) when vitamin C is added to it. Solutions containing a high concentration of vitamin C need only a few drops to turn the DCPIP colourless. Solutions containing a low concentration of vitamin C need more drops to turn the DCPIP colourless. (a) Read through the procedure in (b). Draw a table to record your results. [2] (b) Procedure • Use a dropping pipette to place two drops of DCPIP into a clean well of the white spotting tile. • Use a clean dropping pipette to add drops of fruit juice E to the well containing DCPIP. • Count how many drops are needed to decolourise DCPIP and record the result in your table. • If it does not decolourise, stop when the well is full, record the number of drops and write ‘full’ next to it. Repeat the procedure using juices F, then G, then H instead of juice E. [4] (c) Identify one source of error in this procedure and suggest an improvement. error .......................................................................................................................................... improvement ............................................................................................................................. ................................................................................................................................................... [2] (d) (i) A deficiency of vitamin C in the diet causes a disease called scurvy. State which juice E, F, G or H is best at preventing scurvy. Explain your answer. juice ................................................................................................................................... explanation ........................................................................................................................ [1] (ii) An adult human needs 0.030 g of vitamin C every day to prevent scurvy. A 125 cm3 glass of an orange fruit juice contains 0.060 g of vitamin C. Calculate the volume of this orange juice an adult human needs to drink every day to prevent scurvy. Give your answer to two significant figures. volume = .................................................. cm3 [2] (iii) Suggest how an adult human, who drinks less than the volume of orange juice calculated in (d)(ii), does not get scurvy. ..................................................................................................................................... [1] [Total: 12]
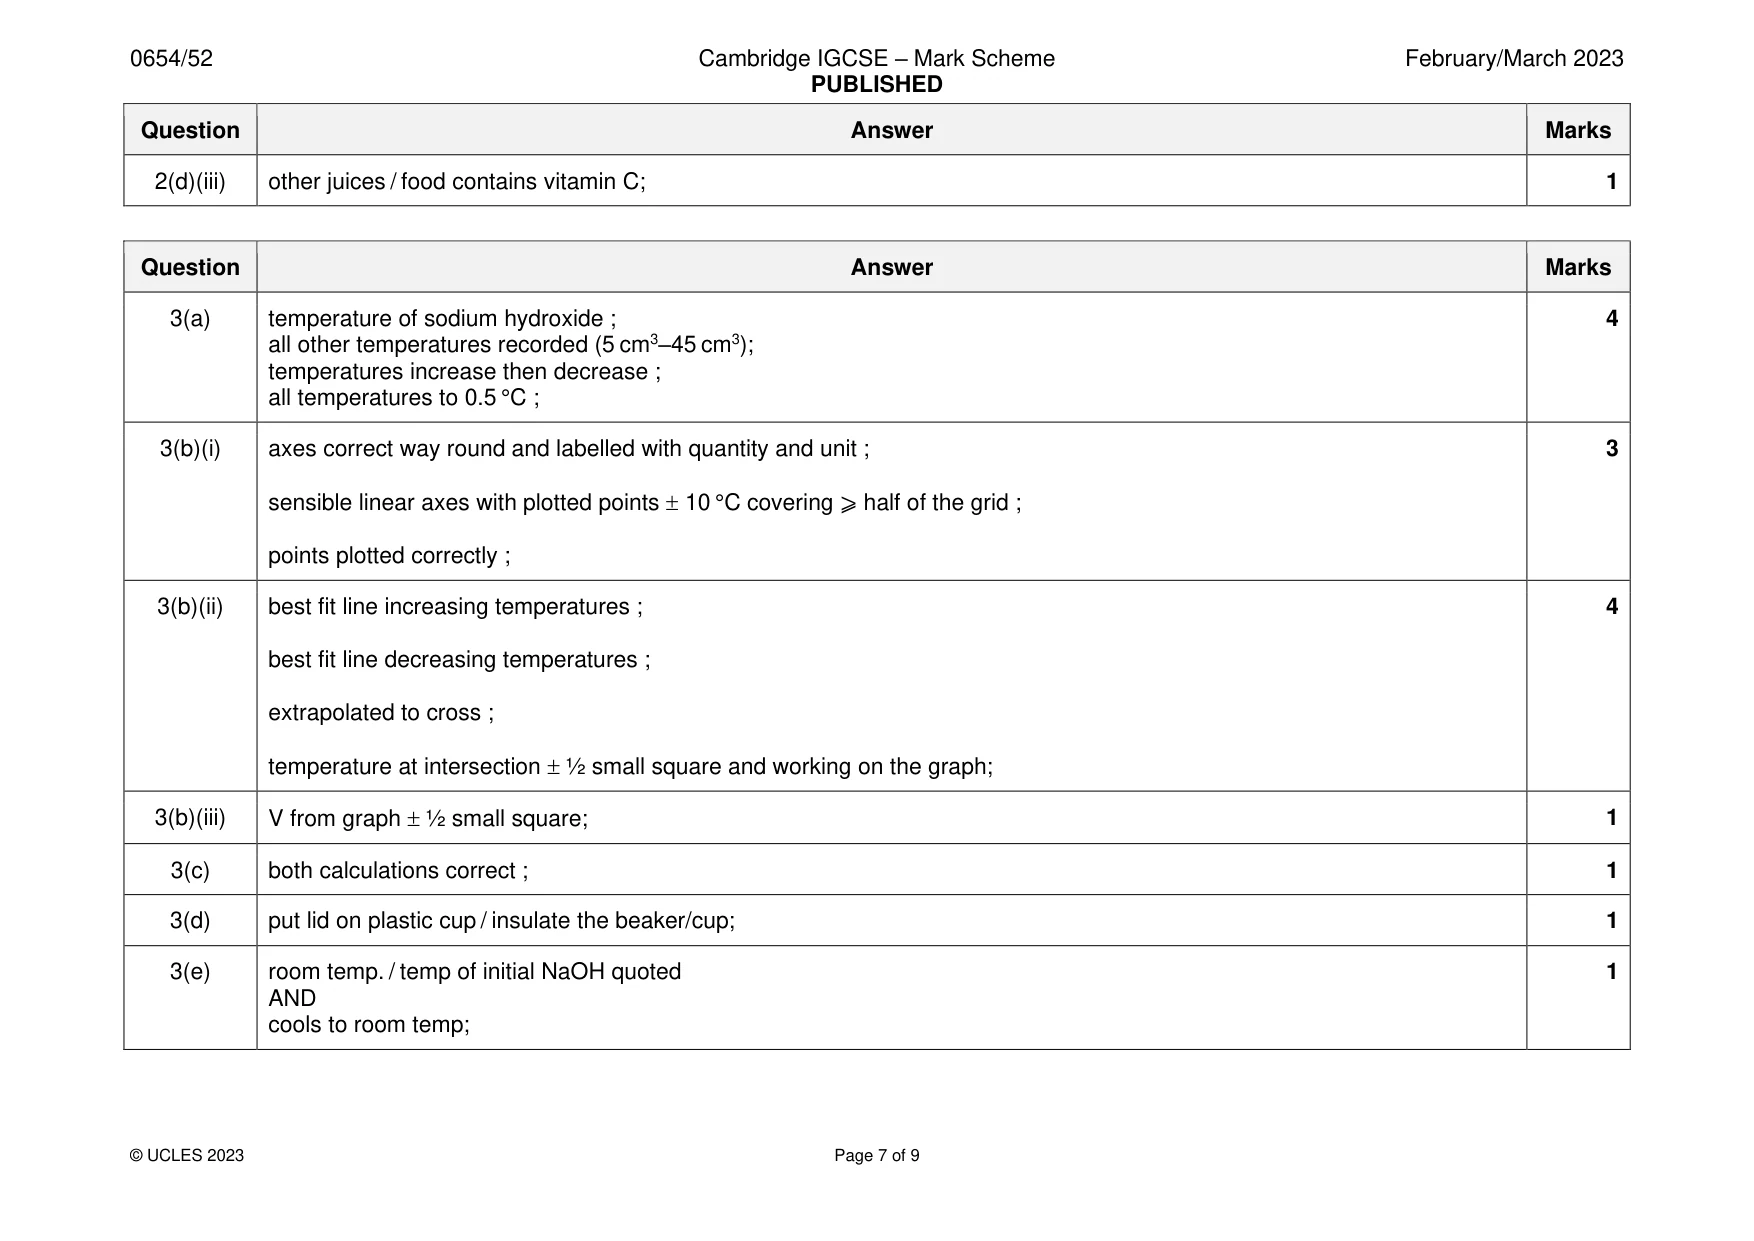
Mark scheme: 2(a) headings for fruit juice and number drops; 2 minimum of cross shape to separate headings and results; 2(b) set of results for fruit juice E; 4 full set of results (for F, G and H); F uses most drops / H uses least drops; all four in the right order; 2(c) drop size varies; 2 measure volume; 2(d)(i) H because it requires fewest drops / highest vitamin C concentration; 1 2(d)(ii) 125 divided by 2 or 62.5 (cm3); 2 answer to 2sf (63); 2(d)(iii) other juices / food contains vitamin C; 1
Q3 · You are going to investigate the neutralisation reaction of dilute hydrochloric acid and…
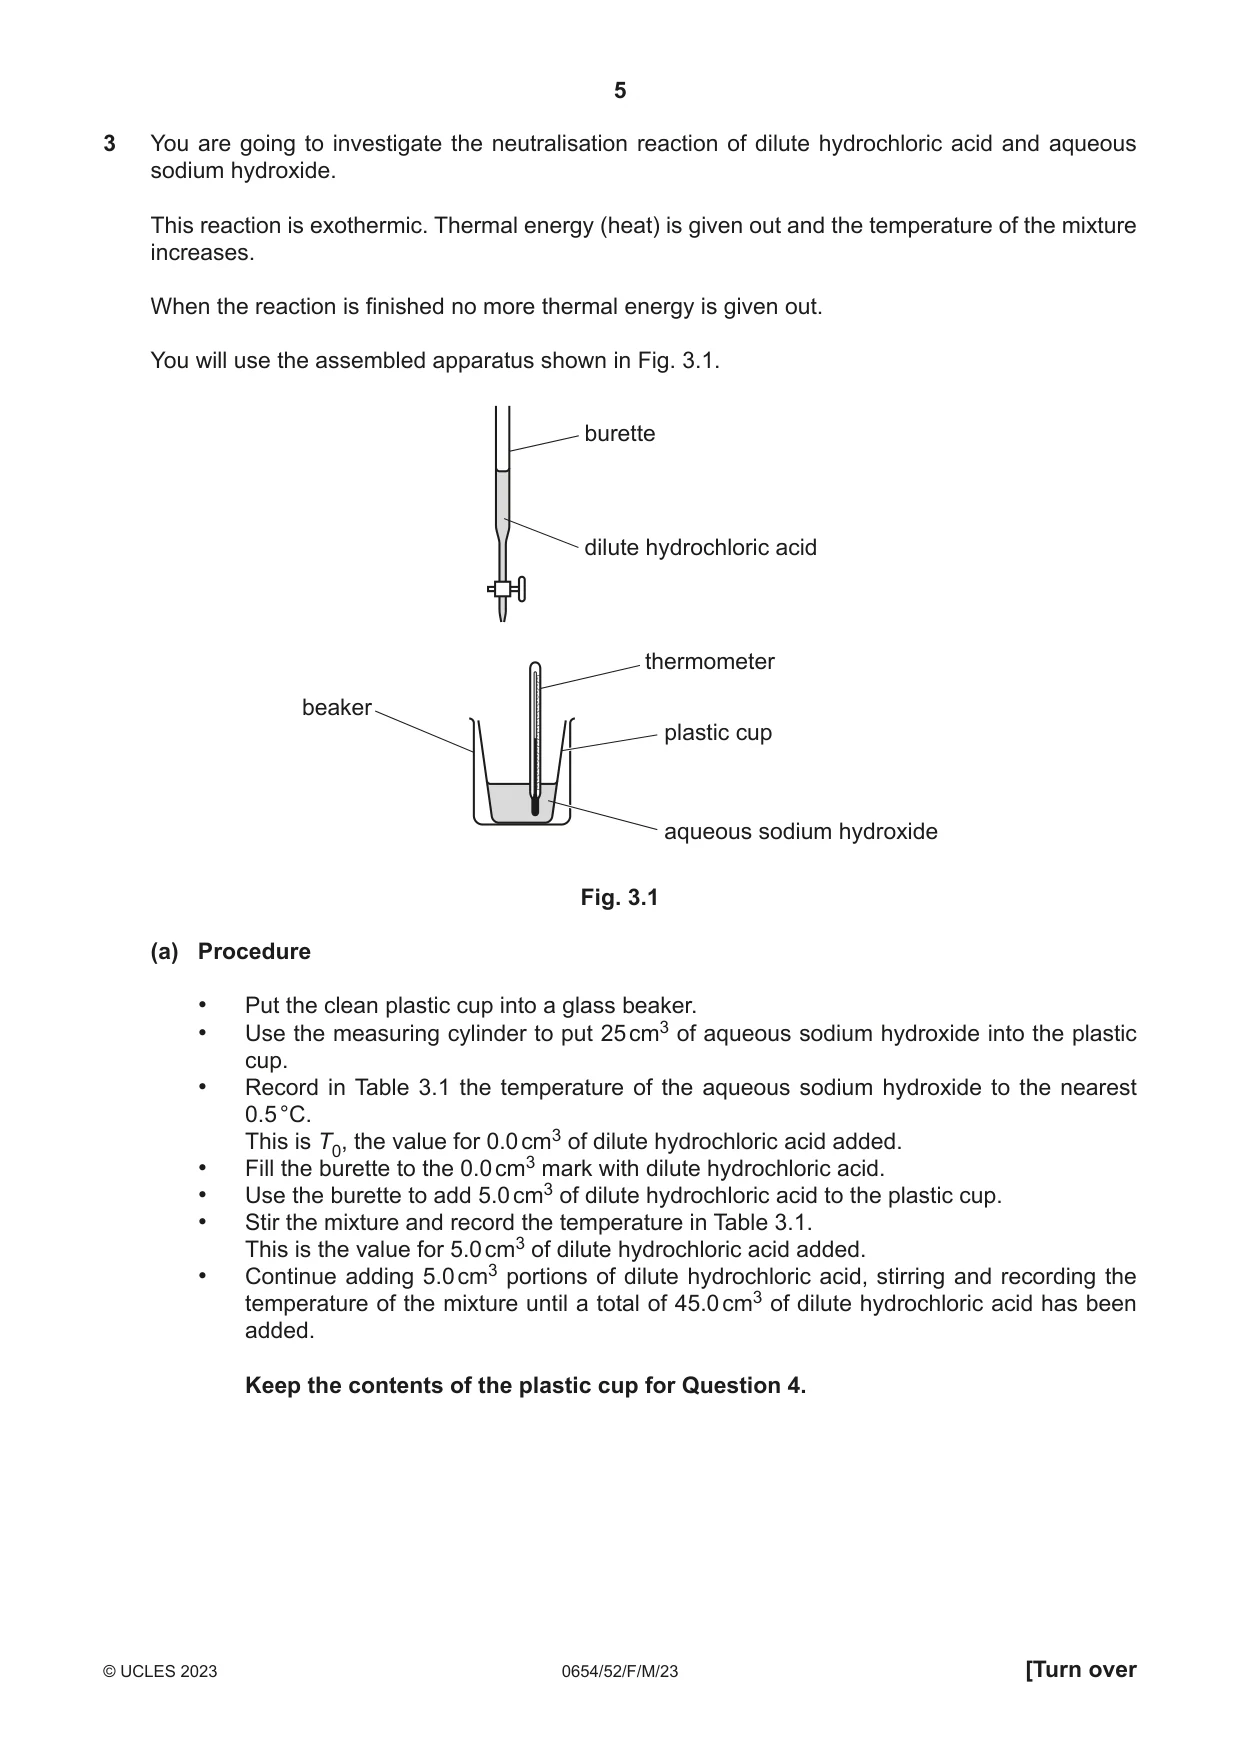
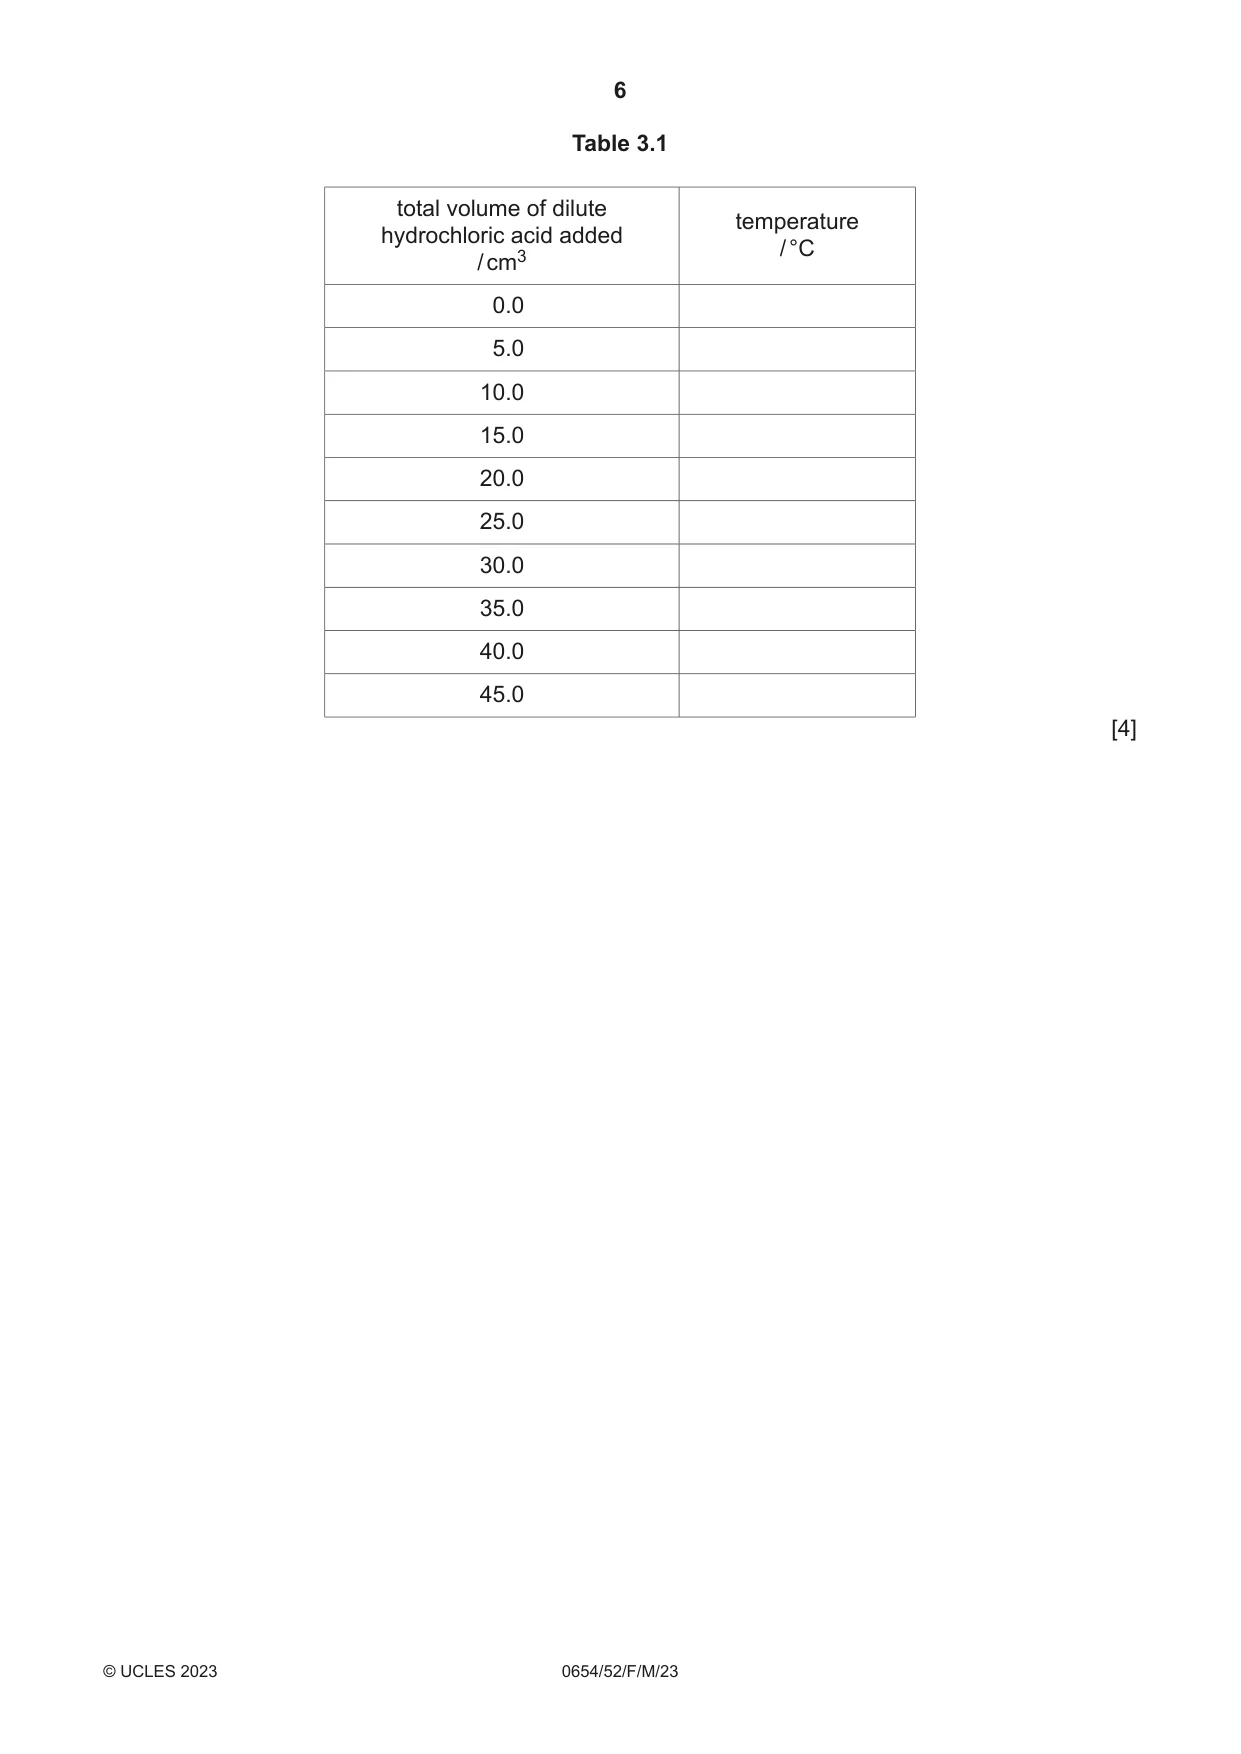
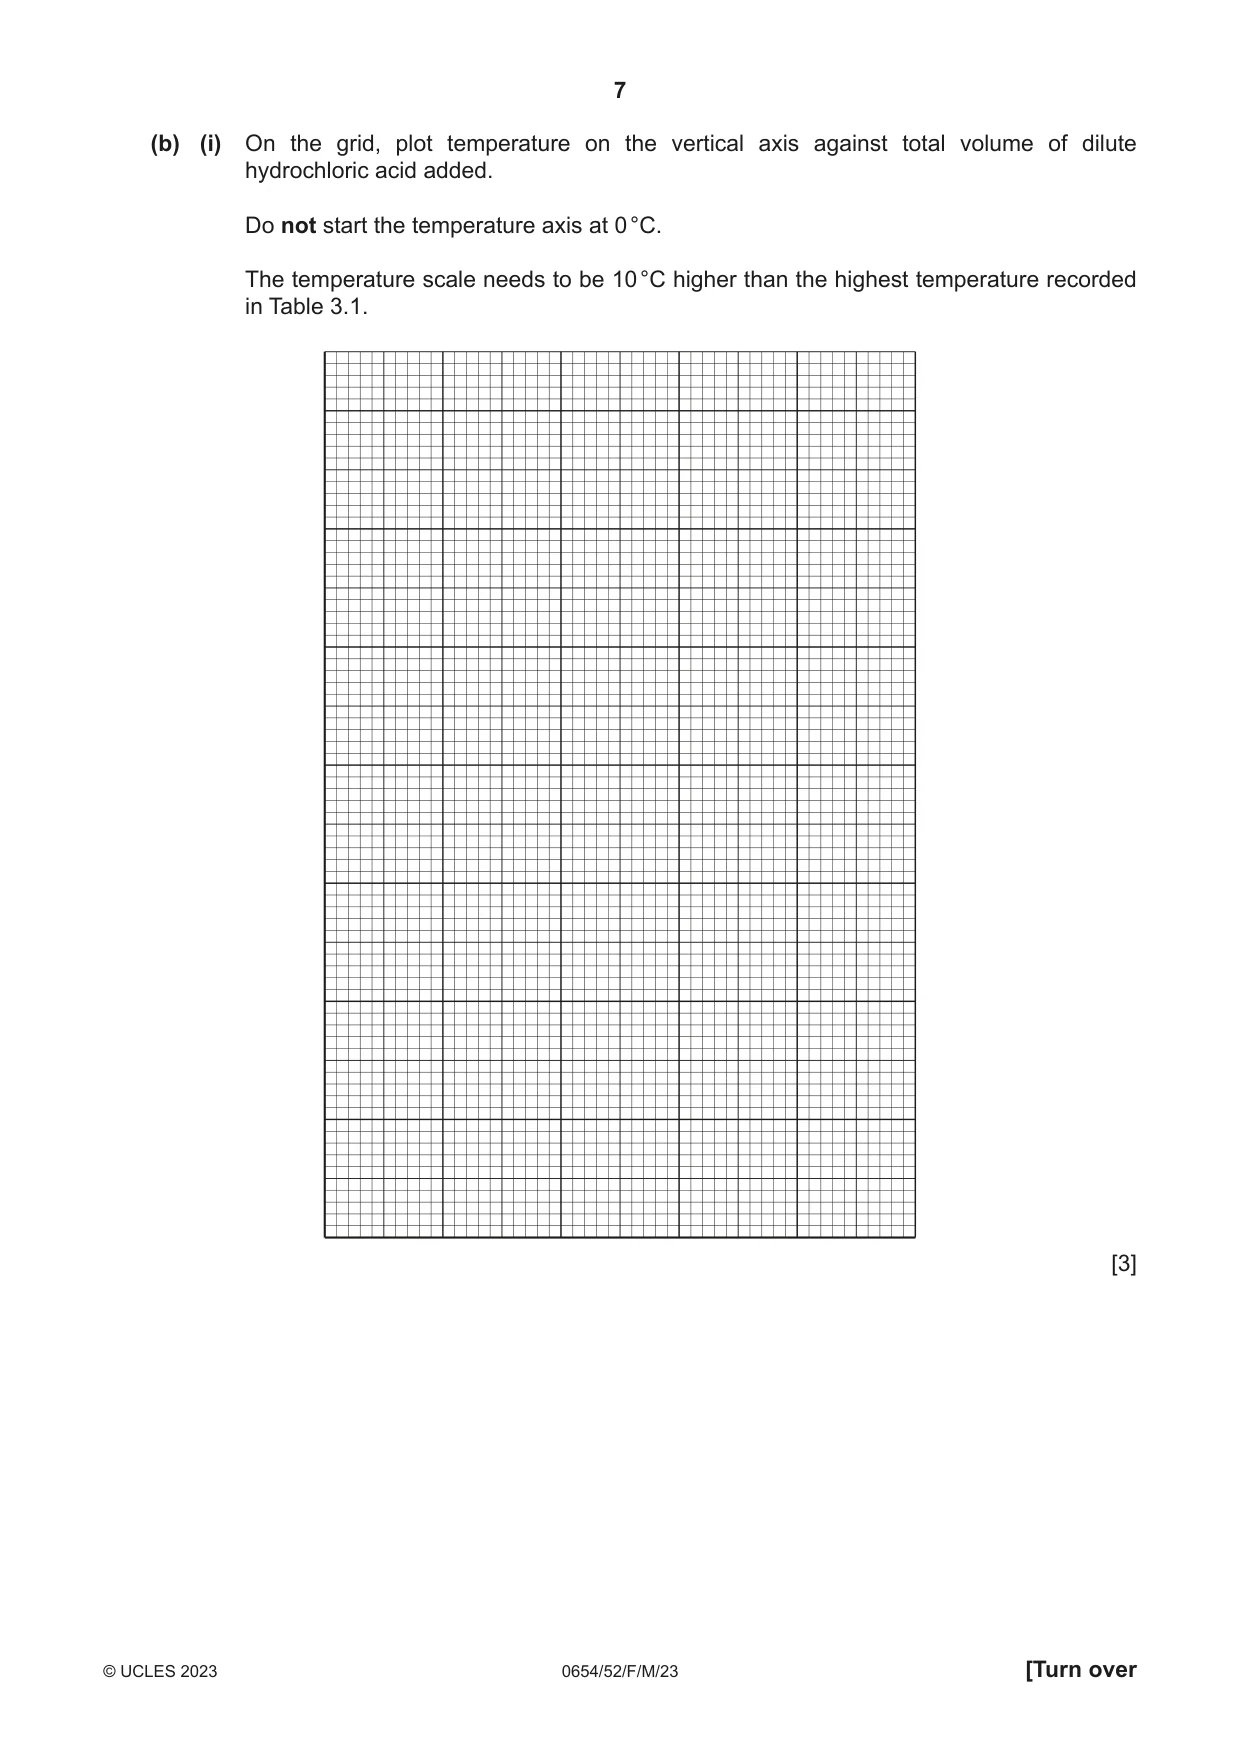
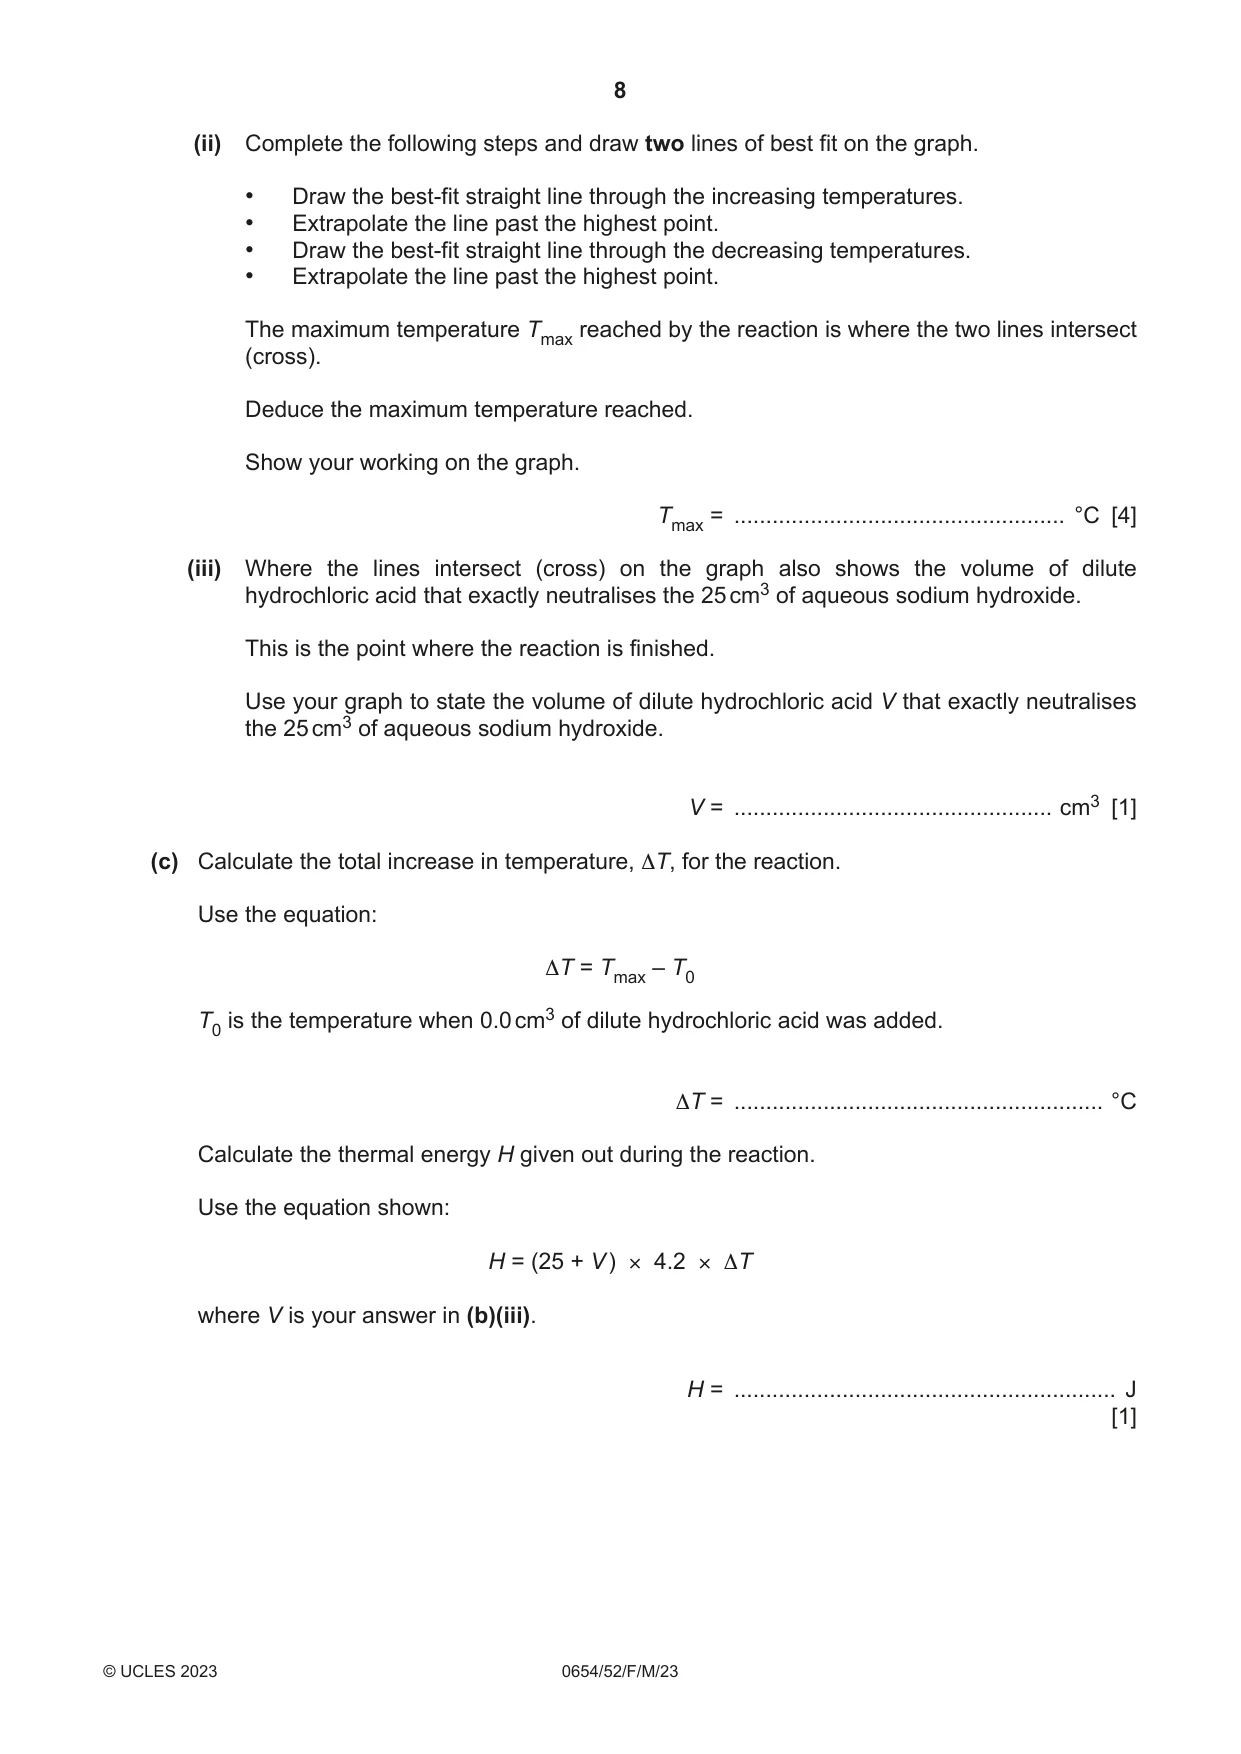
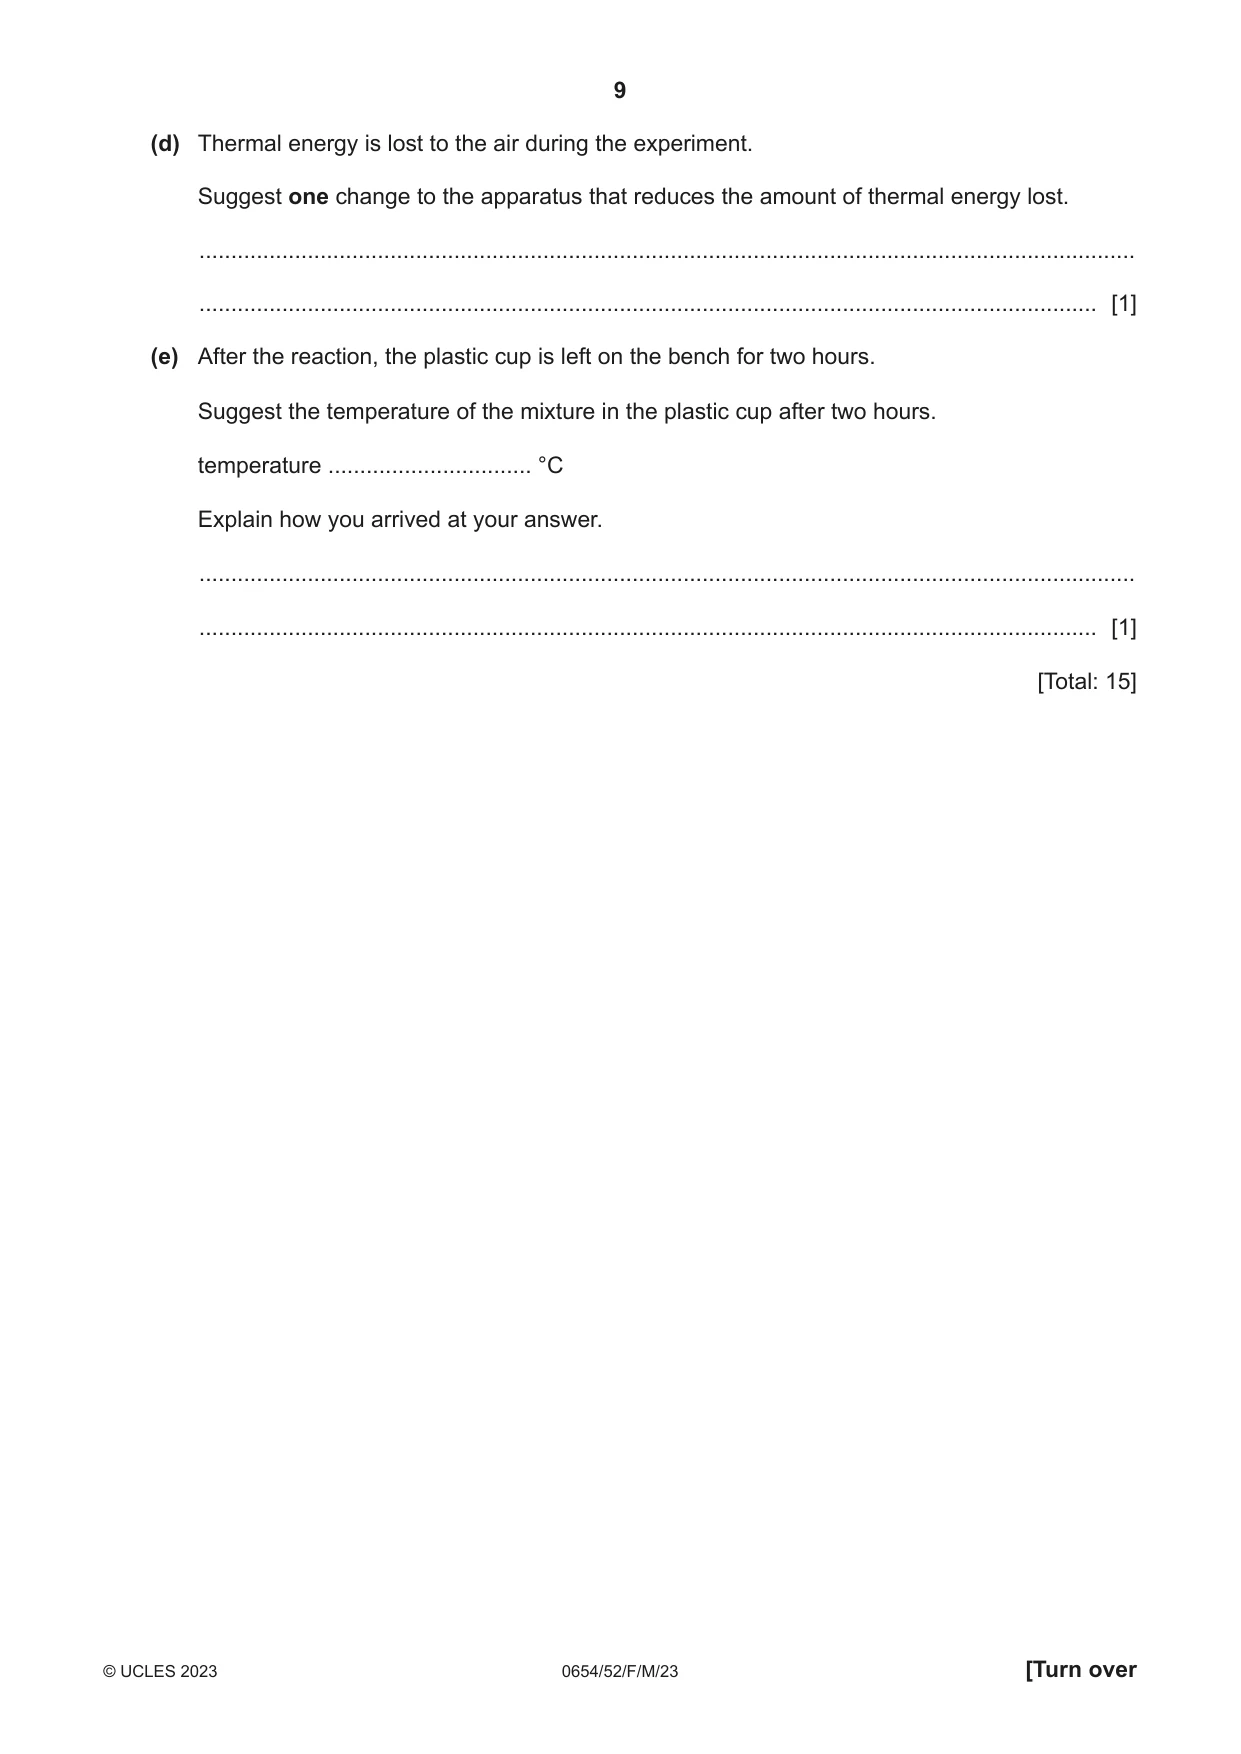
3 You are going to investigate the neutralisation reaction of dilute hydrochloric acid and aqueous sodium hydroxide. This reaction is exothermic. Thermal energy (heat) is given out and the temperature of the mixture increases. When the reaction is finished no more thermal energy is given out. You will use the assembled apparatus shown in Fig. 3.1. burette dilute hydrochloric acid thermometer beaker plastic cup aqueous sodium hydroxide Fig. 3.1 (a) Procedure • Put the clean plastic cup into a glass beaker. • Use the measuring cylinder to put 25 cm3 of aqueous sodium hydroxide into the plastic cup. • Record in Table 3.1 the temperature of the aqueous sodium hydroxide to the nearest 0.5 °C. This is T0, the value for 0.0 cm3 of dilute hydrochloric acid added. • Fill the burette to the 0.0 cm3 mark with dilute hydrochloric acid. • Use the burette to add 5.0 cm3 of dilute hydrochloric acid to the plastic cup. • Stir the mixture and record the temperature in Table 3.1. This is the value for 5.0 cm3 of dilute hydrochloric acid added. • Continue adding 5.0 cm3 portions of dilute hydrochloric acid, stirring and recording the temperature of the mixture until a total of 45.0 cm3 of dilute hydrochloric acid has been added. Keep the contents of the plastic cup for Question 4. Table 3.1 total volume of dilute temperaturehydrochloric acid added / °C / cm3 0.0 5.0 10.0 15.0 20.0 25.0 30.0 35.0 40.0 45.0 [4] (b) (i) On the grid, plot temperature on the vertical axis against total volume of dilute hydrochloric acid added. Do not start the temperature axis at 0 °C. The temperature scale needs to be 10 °C higher than the highest temperature recorded in Table 3.1. [3] (ii) Complete the following steps and draw two lines of best fit on the graph. • Draw the best-fit straight line through the increasing temperatures. • Extrapolate the line past the highest point. • Draw the best-fit straight line through the decreasing temperatures. • Extrapolate the line past the highest point. The maximum temperature Tmax reached by the reaction is where the two lines intersect (cross). Deduce the maximum temperature reached. Show your working on the graph. Tmax = .................................................... °C [4] (iii) Where the lines intersect (cross) on the graph also shows the volume of dilute hydrochloric acid that exactly neutralises the 25 cm3 of aqueous sodium hydroxide. This is the point where the reaction is finished. Use your graph to state the volume of dilute hydrochloric acid V that exactly neutralises the 25 cm3 of aqueous sodium hydroxide. V = .................................................. cm3 [1] (c) Calculate the total increase in temperature, ΔT, for the reaction. Use the equation: ΔT = Tmax – T0 T0 is the temperature when 0.0 cm3 of dilute hydrochloric acid was added. ΔT = .......................................................... °C Calculate the thermal energy H given out during the reaction. Use the equation shown: H = (25 + V ) × 4.2 × ΔT where V is your answer in (b)(iii). H = ............................................................ J [1] (d) Thermal energy is lost to the air during the experiment. Suggest one change to the apparatus that reduces the amount of thermal energy lost. ................................................................................................................................................... ............................................................................................................................................. [1] (e) After the reaction, the plastic cup is left on the bench for two hours. Suggest the temperature of the mixture in the plastic cup after two hours. temperature ................................ °C Explain how you arrived at your answer. ................................................................................................................................................... ............................................................................................................................................. [1] [Total: 15]
Mark scheme: 3(a) temperature of sodium hydroxide ; 4 all other temperatures recorded (5 cm3–45 cm3); temperatures increase then decrease ; all temperatures to 0.5 °C ; 3(b)(i) axes correct way round and labelled with quantity and unit ; 3 sensible linear axes with plotted points 10 °C covering ⩾ half of the grid ; points plotted correctly ; 3(b)(ii) best fit line increasing temperatures ; 4 best fit line decreasing temperatures ; extrapolated to cross ; temperature at intersection ½ small square and working on the graph; 3(b)(iii) V from graph ½ small square; 1 3(c) both calculations correct ; 1 3(d) put lid on plastic cup / insulate the beaker/cup; 1 3(e) room temp. / temp of initial NaOH quoted 1 AND cools to room temp;
Q4 · You are going to test the substances from Question 3
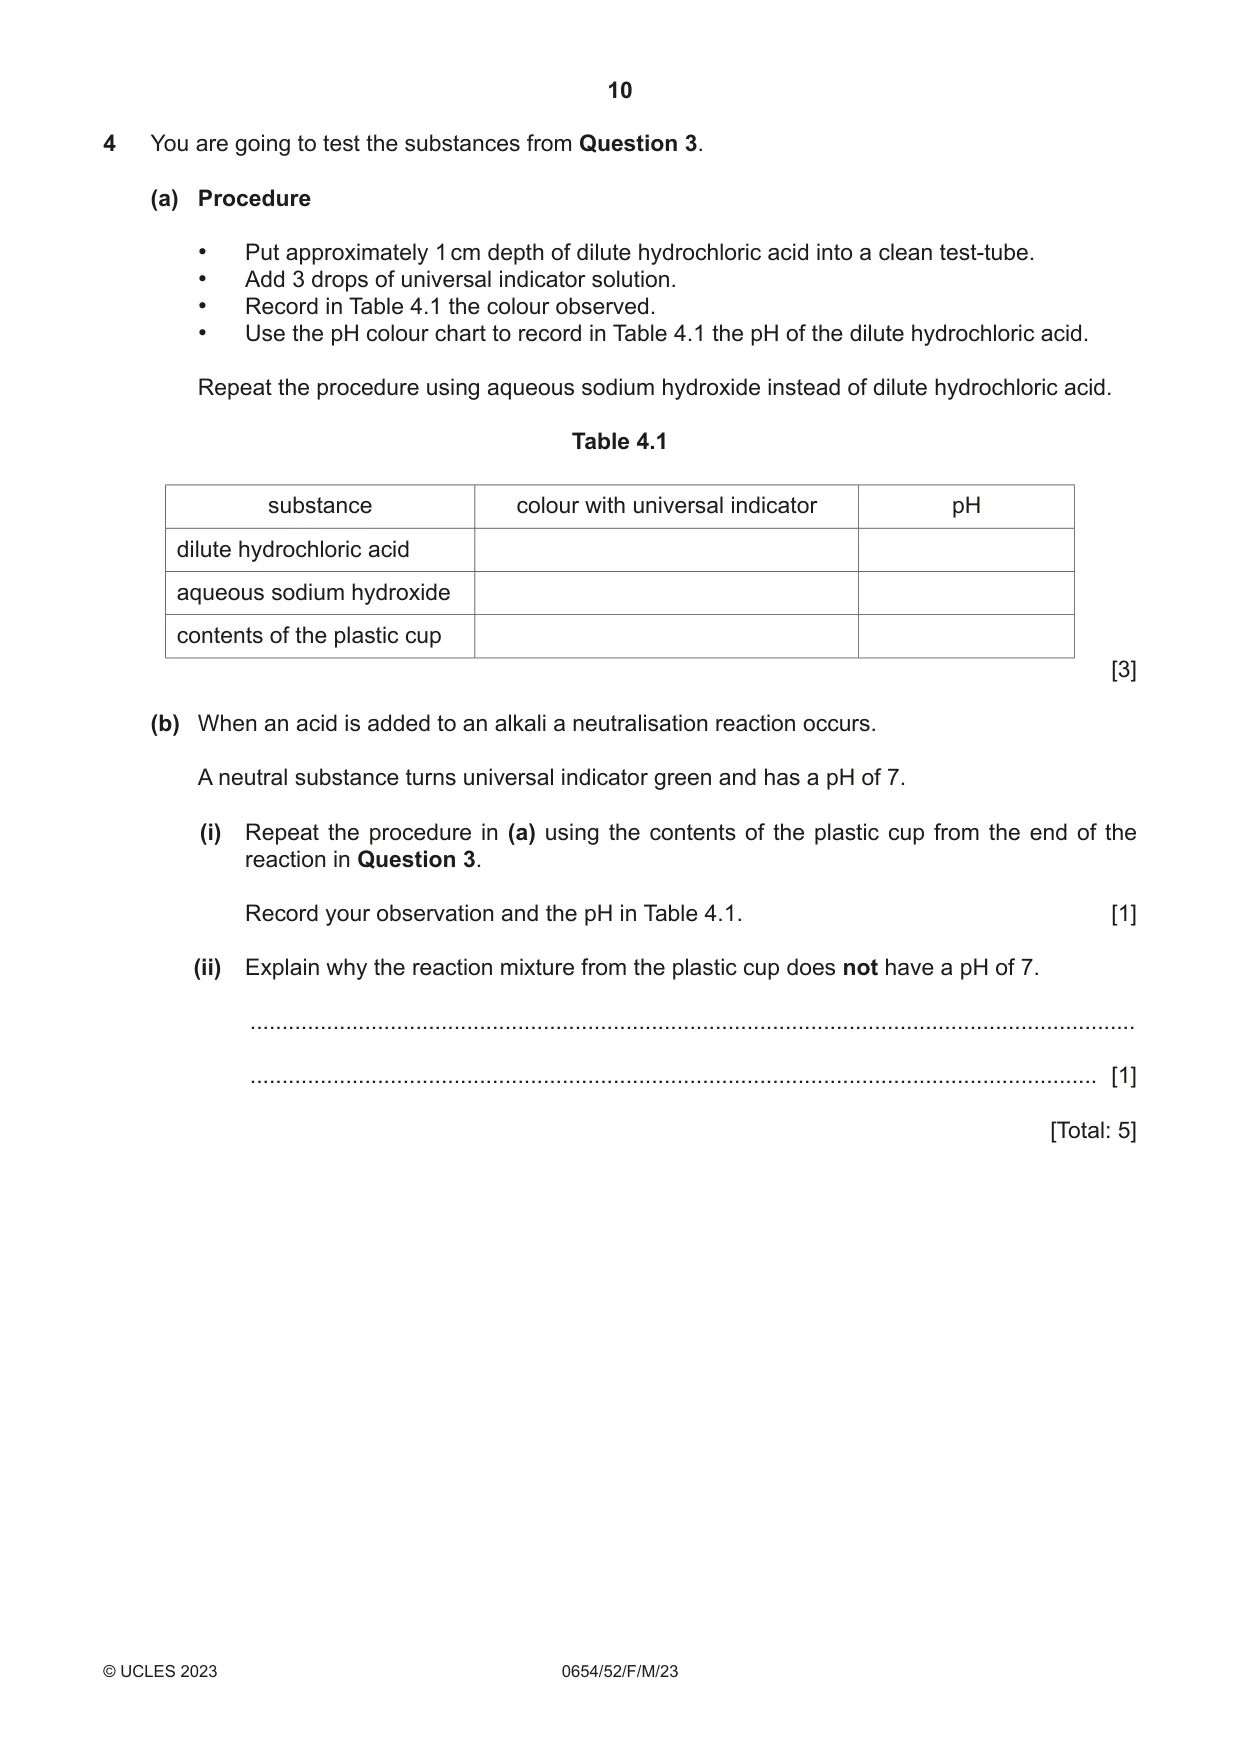
4 You are going to test the substances from Question 3. (a) Procedure • Put approximately 1 cm depth of dilute hydrochloric acid into a clean test-tube. • Add 3 drops of universal indicator solution. • Record in Table 4.1 the colour observed. • Use the pH colour chart to record in Table 4.1 the pH of the dilute hydrochloric acid. Repeat the procedure using aqueous sodium hydroxide instead of dilute hydrochloric acid. Table 4.1 substance colour with universal indicator pH dilute hydrochloric acid aqueous sodium hydroxide contents of the plastic cup [3] (b) When an acid is added to an alkali a neutralisation reaction occurs. A neutral substance turns universal indicator green and has a pH of 7. (i) Repeat the procedure in (a) using the contents of the plastic cup from the end of the reaction in Question 3. Record your observation and the pH in Table 4.1. [1] (ii) Explain why the reaction mixture from the plastic cup does not have a pH of 7. ........................................................................................................................................... ..................................................................................................................................... [1] [Total: 5]
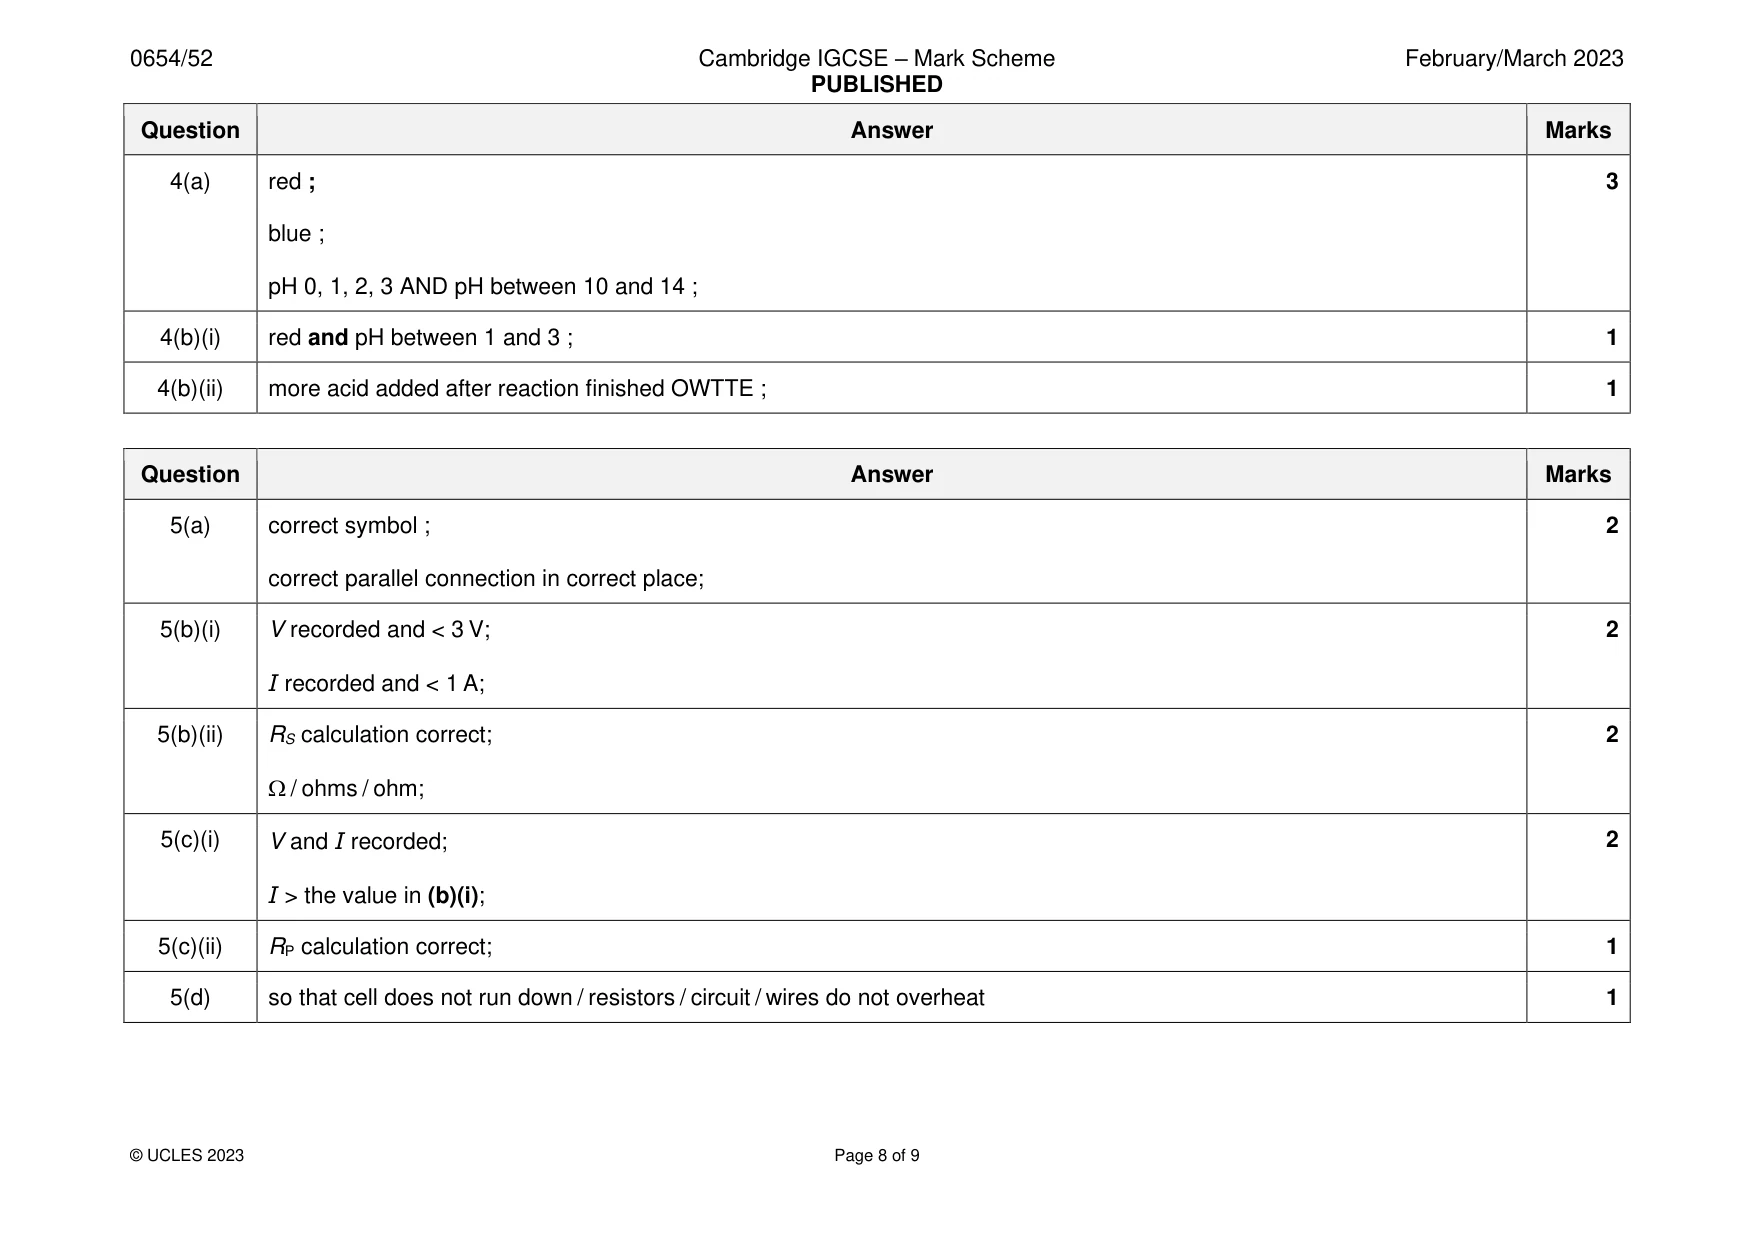
Mark scheme: 4(a) red ; 3 blue ; pH 0, 1, 2, 3 AND pH between 10 and 14 ; 4(b)(i) red and pH between 1 and 3 ; 1 4(b)(ii) more acid added after reaction finished OWTTE ; 1
More questions on The characteristic properties of acids and bases
Q5 · You are going to investigate the resistance of series and parallel combinations of…
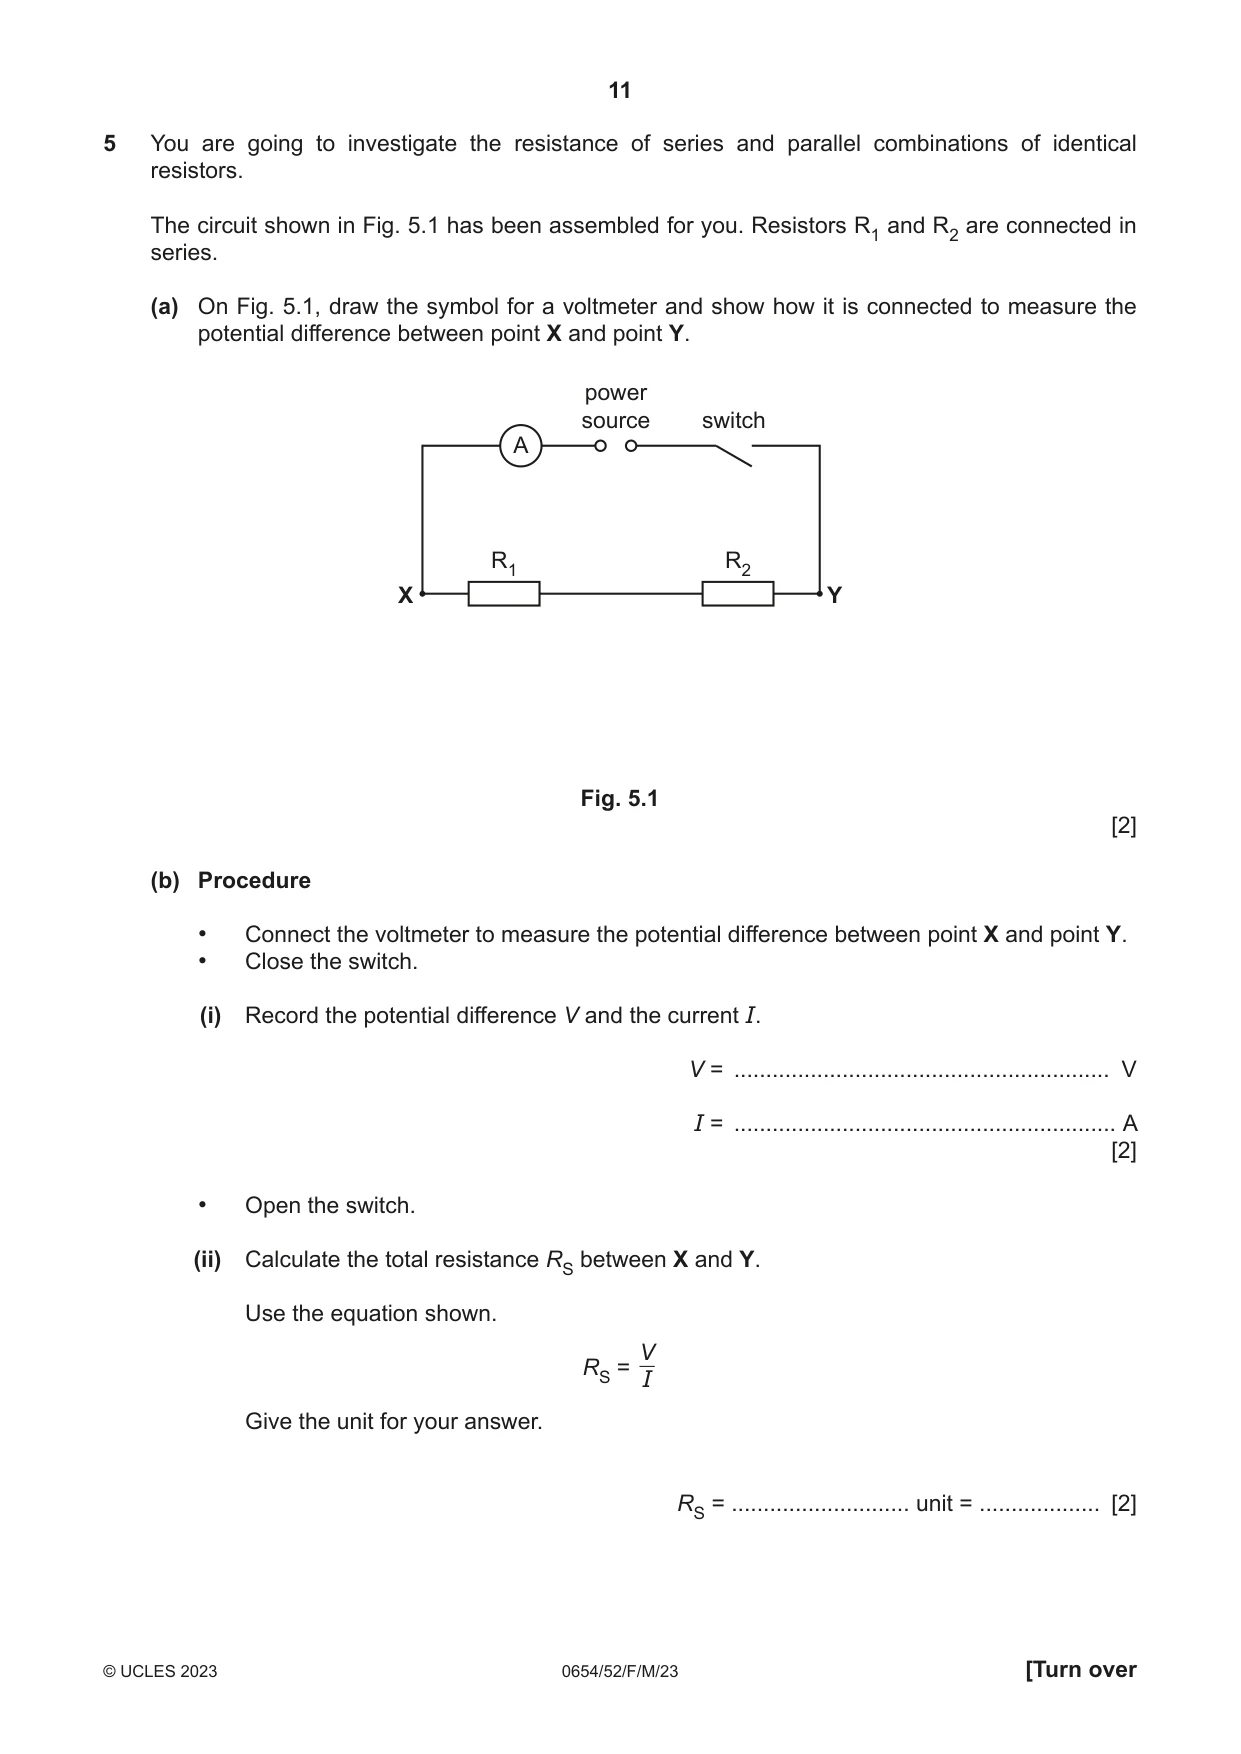
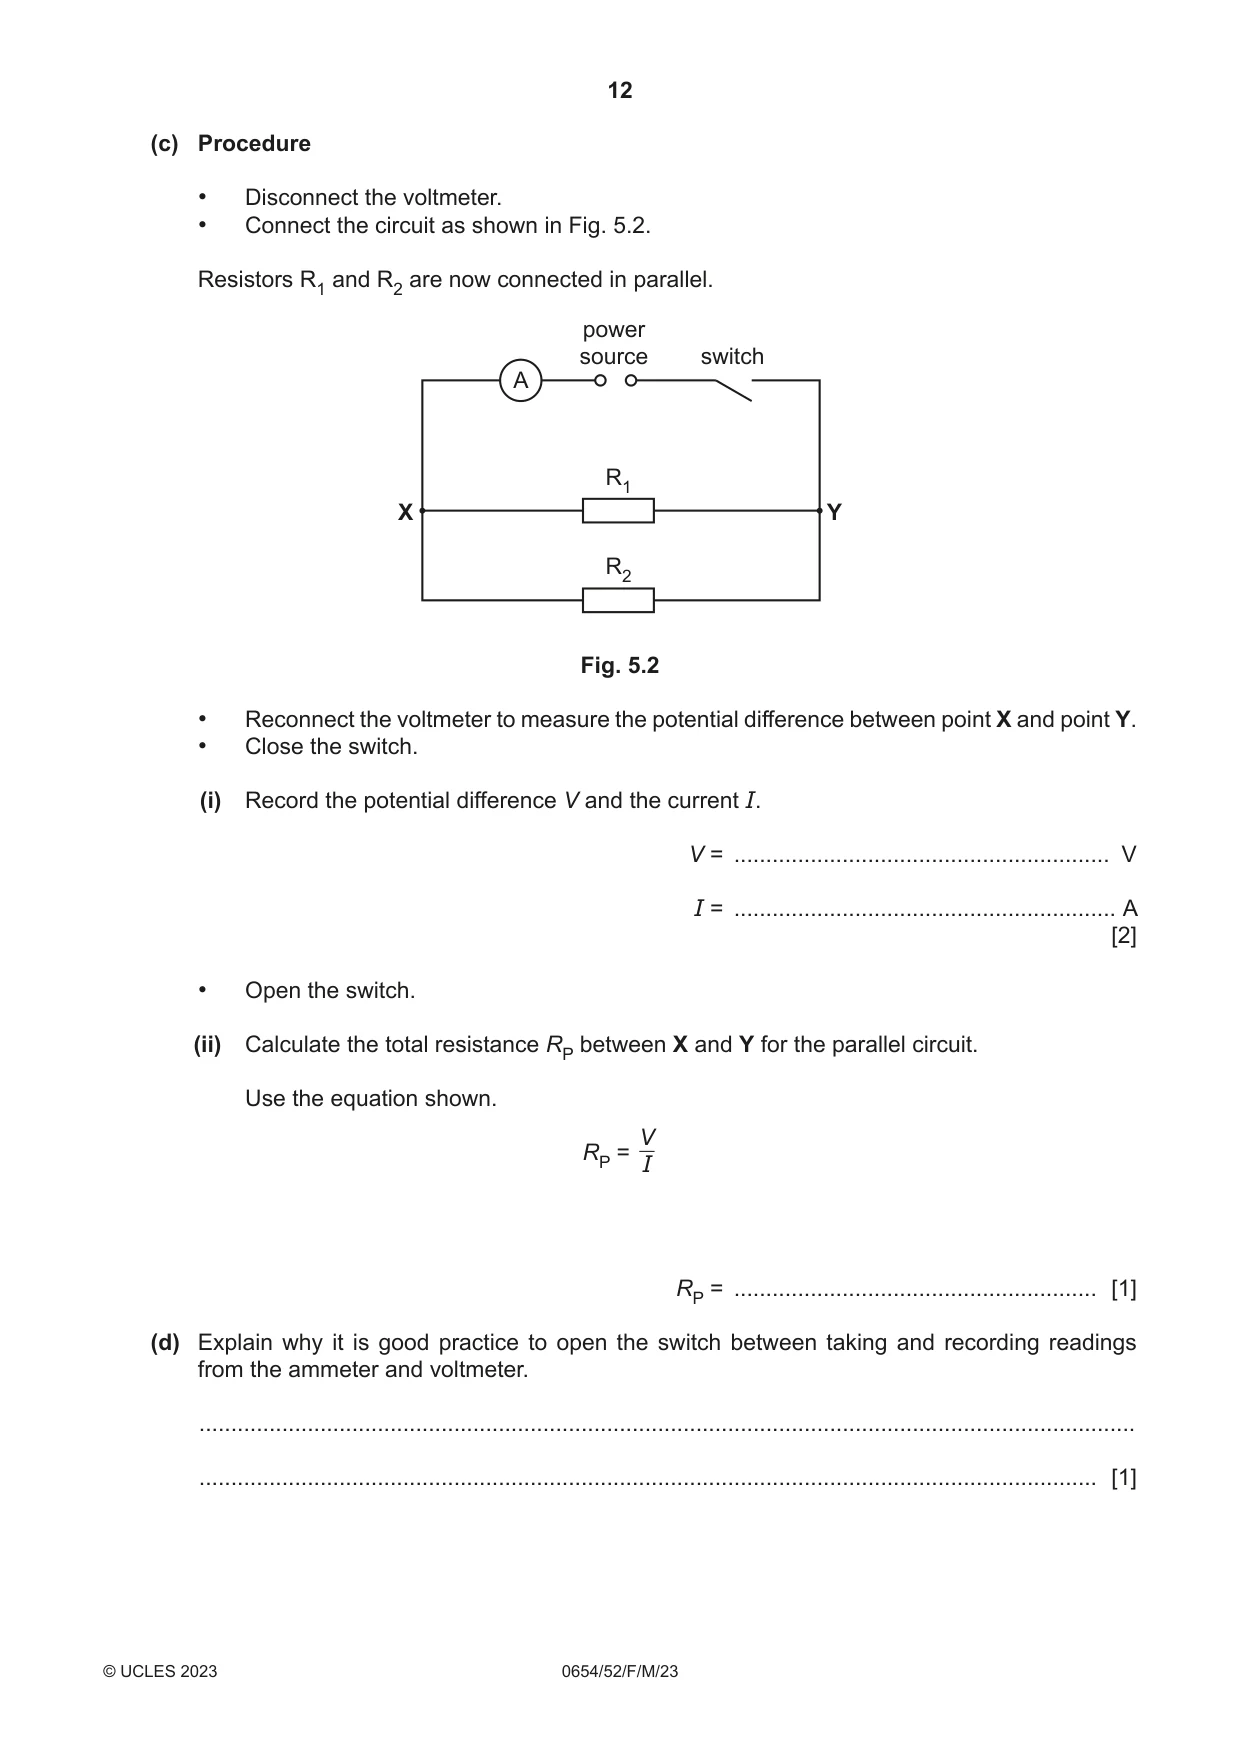
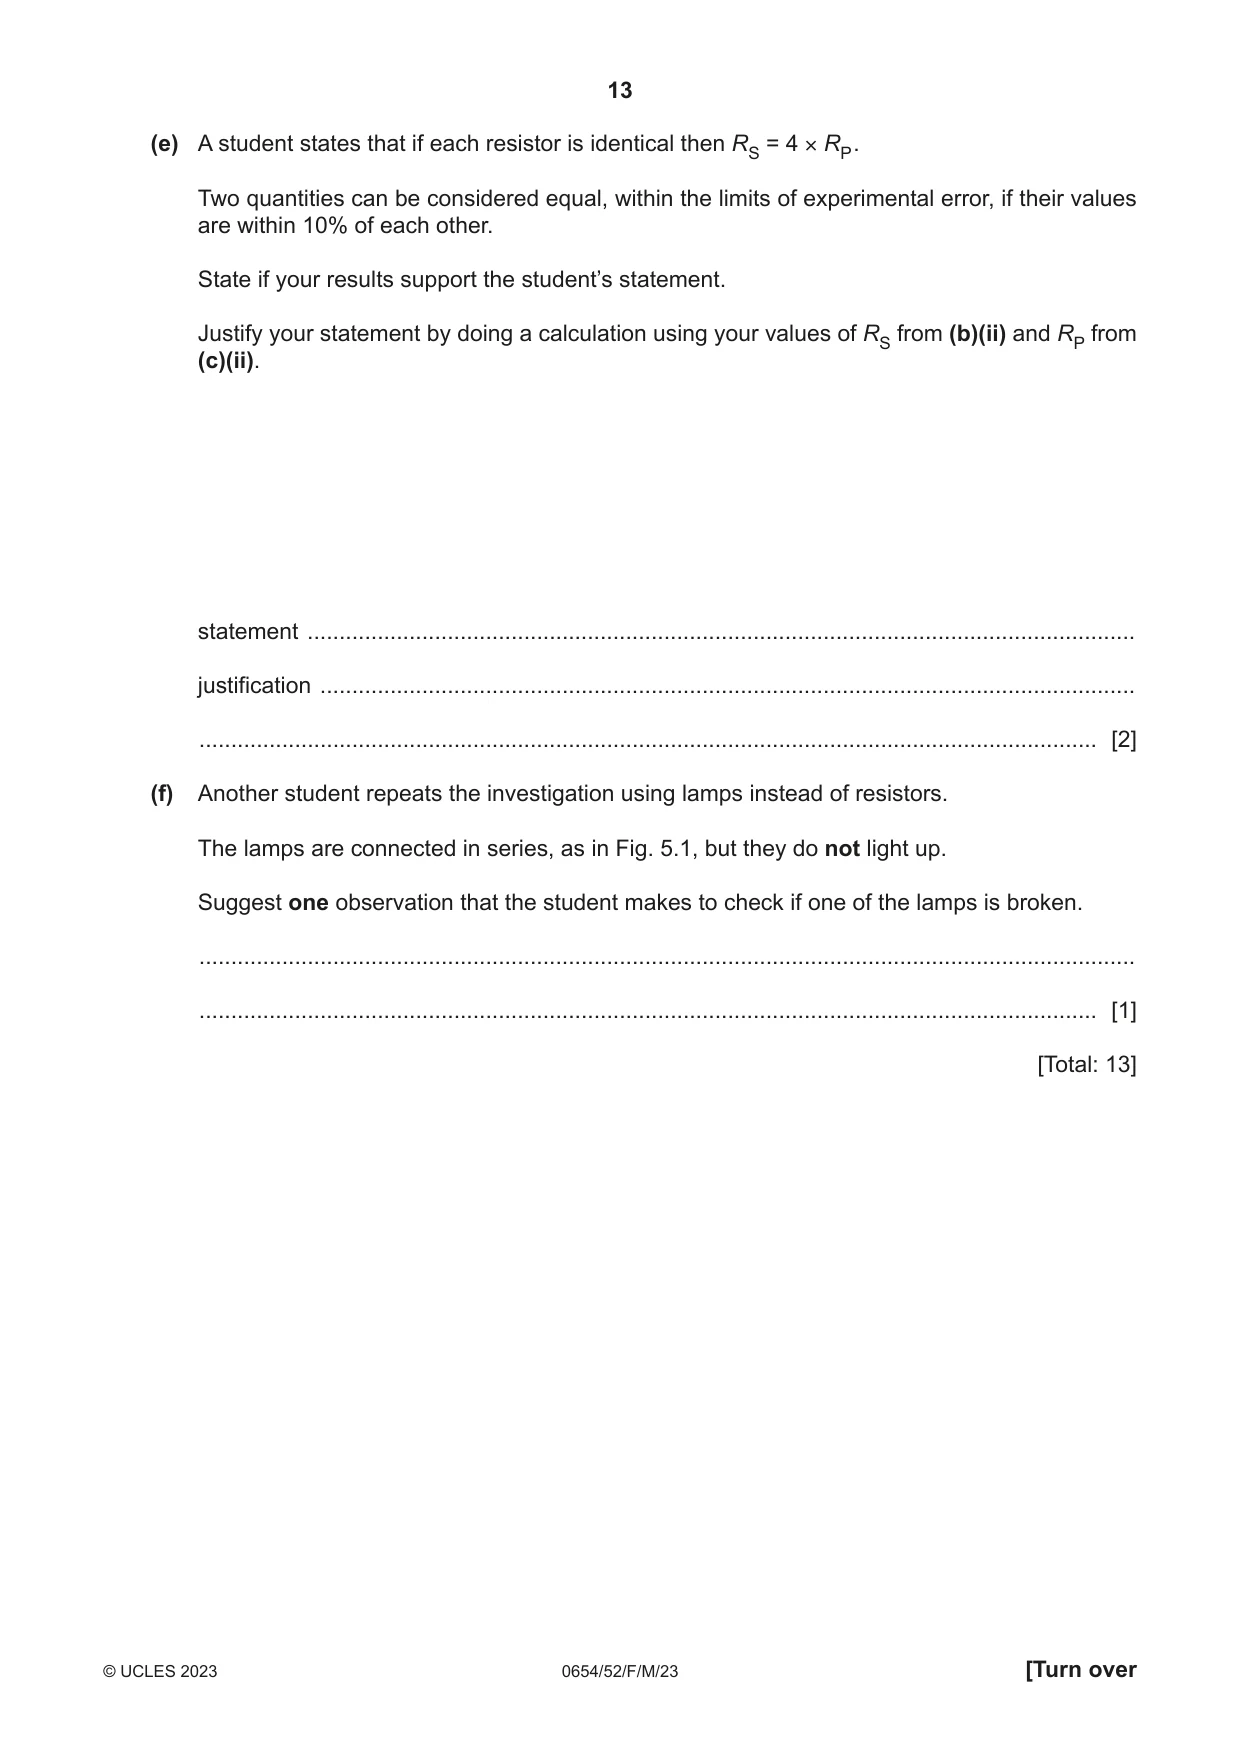
5 You are going to investigate the resistance of series and parallel combinations of identical resistors. The circuit shown in Fig. 5.1 has been assembled for you. Resistors R1 and R2 are connected in series. (a) On Fig. 5.1, draw the symbol for a voltmeter and show how it is connected to measure the potential difference between point X and point Y. power source switch A R1 R2 X Y Fig. 5.1 [2] (b) Procedure • Connect the voltmeter to measure the potential difference between point X and point Y. • Close the switch. (i) Record the potential difference V and the current I. V = ........................................................... V I = ............................................................ A [2] • Open the switch. (ii) Calculate the total resistance RS between X and Y. Use the equation shown. V RS = I Give the unit for your answer. RS = ............................ unit = ................... [2] (c) Procedure • Disconnect the voltmeter. • Connect the circuit as shown in Fig. 5.2. Resistors R1 and R2 are now connected in parallel. power source switch A R1 X Y R2 Fig. 5.2 • Reconnect the voltmeter to measure the potential difference between point X and point Y. • Close the switch. (i) Record the potential difference V and the current I. V = ........................................................... V I = ............................................................ A [2] • Open the switch. (ii) Calculate the total resistance RP between X and Y for the parallel circuit. Use the equation shown. V RP = I RP = ......................................................... [1] (d) Explain why it is good practice to open the switch between taking and recording readings from the ammeter and voltmeter. ................................................................................................................................................... ............................................................................................................................................. [1] (e) A student states that if each resistor is identical then RS = 4 × RP . Two quantities can be considered equal, within the limits of experimental error, if their values are within 10% of each other. State if your results support the student’s statement. Justify your statement by doing a calculation using your values of RS from (b)(ii) and RP from (c)(ii). statement .................................................................................................................................. justification ................................................................................................................................ ............................................................................................................................................. [2] (f) Another student repeats the investigation using lamps instead of resistors. The lamps are connected in series, as in Fig. 5.1, but they do not light up. Suggest one observation that the student makes to check if one of the lamps is broken. ................................................................................................................................................... ............................................................................................................................................. [1] [Total: 13]
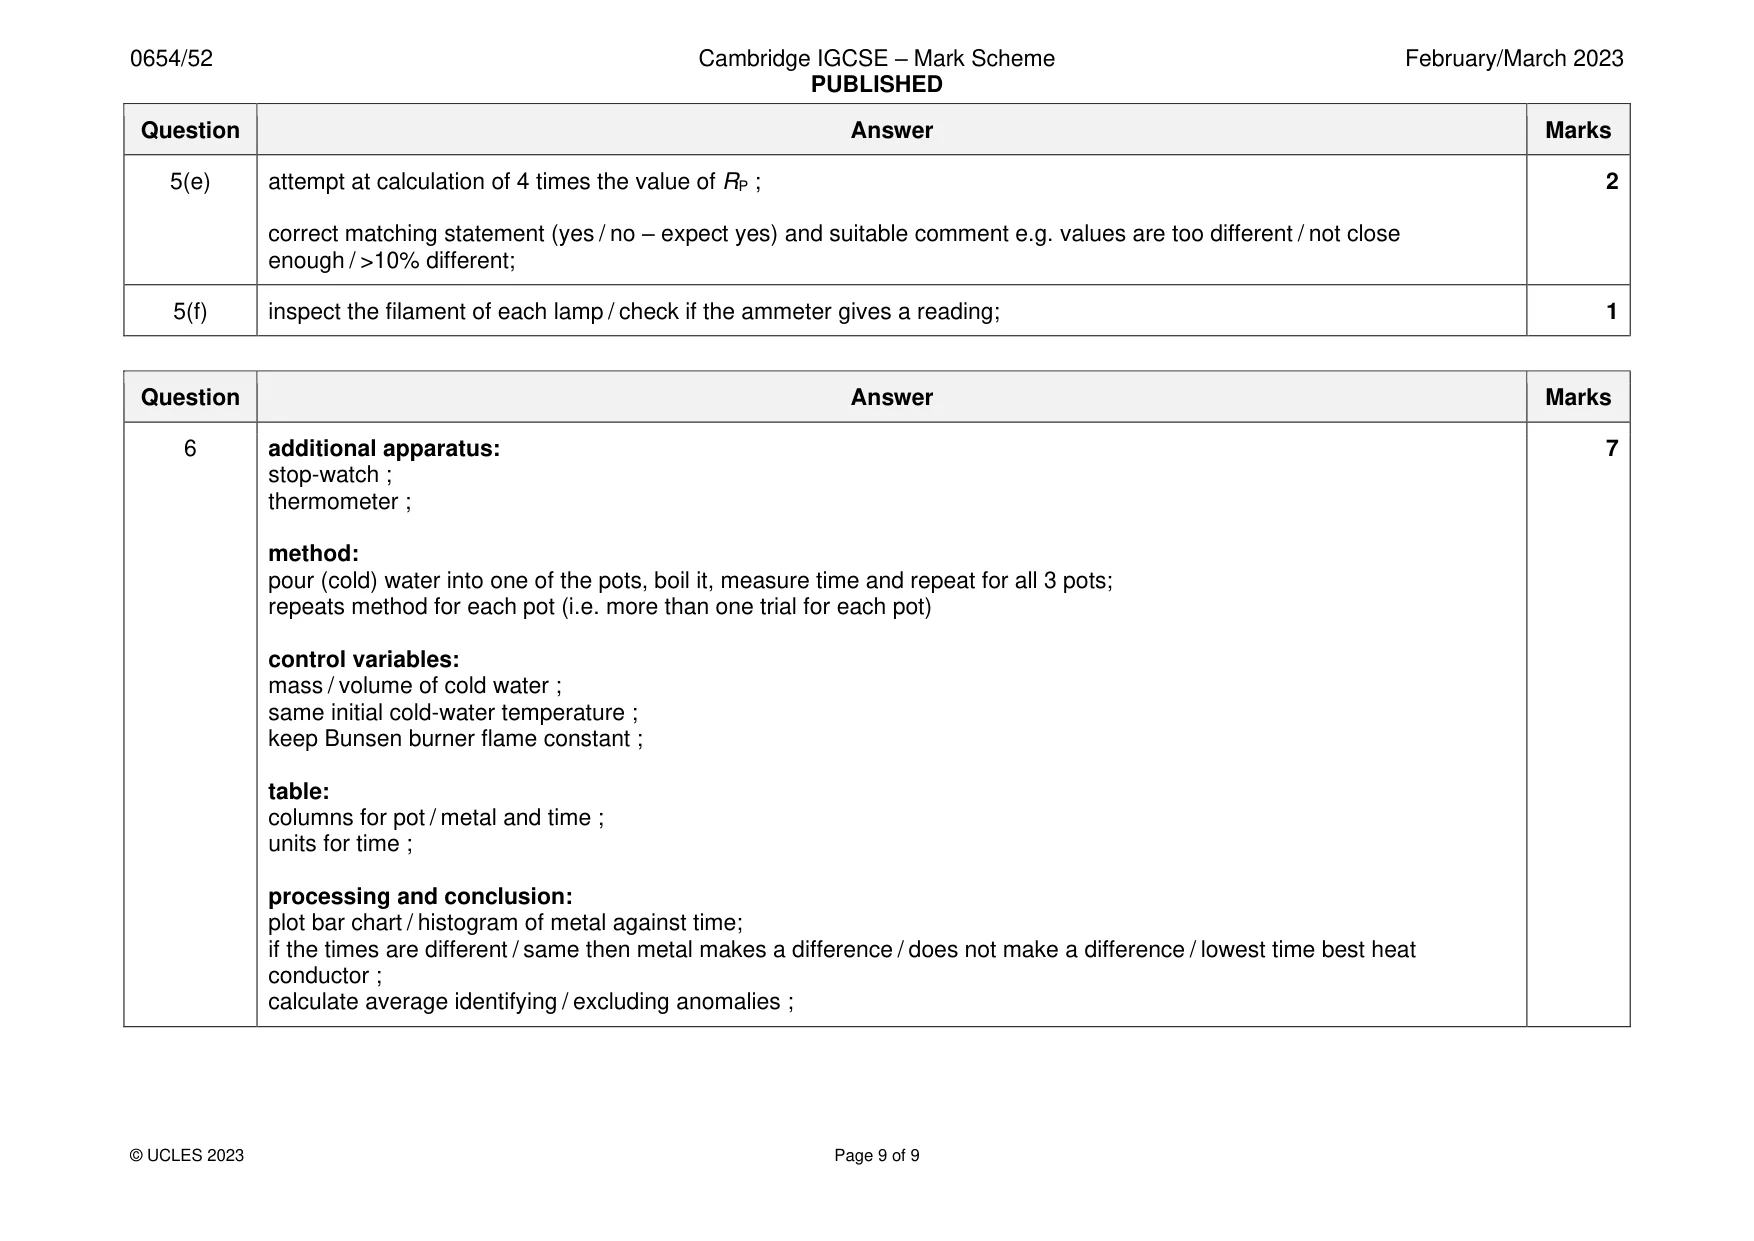
Mark scheme: 5(a) correct symbol ; 2 correct parallel connection in correct place; 5(b)(i) V recorded and < 3 V; 2 I recorded and < 1 A; 5(b)(ii) RS calculation correct; 2 / ohms / ohm; 5(c)(i) V and I recorded; 2 I > the value in (b)(i); 5(c)(ii) RP calculation correct; 1 5(d) so that cell does not run down / resistors / circuit / wires do not overheat 1 5(e) attempt at calculation of 4 times the value of RP ; 2 correct matching statement (yes / no – expect yes) and suitable comment e.g. values are too different / not close enough / >10% different; 5(f) inspect the filament of each lamp / check if the ammeter gives a reading; 1
Q6 · Water is heated from room temperature to its boiling point in a metal cooking pot
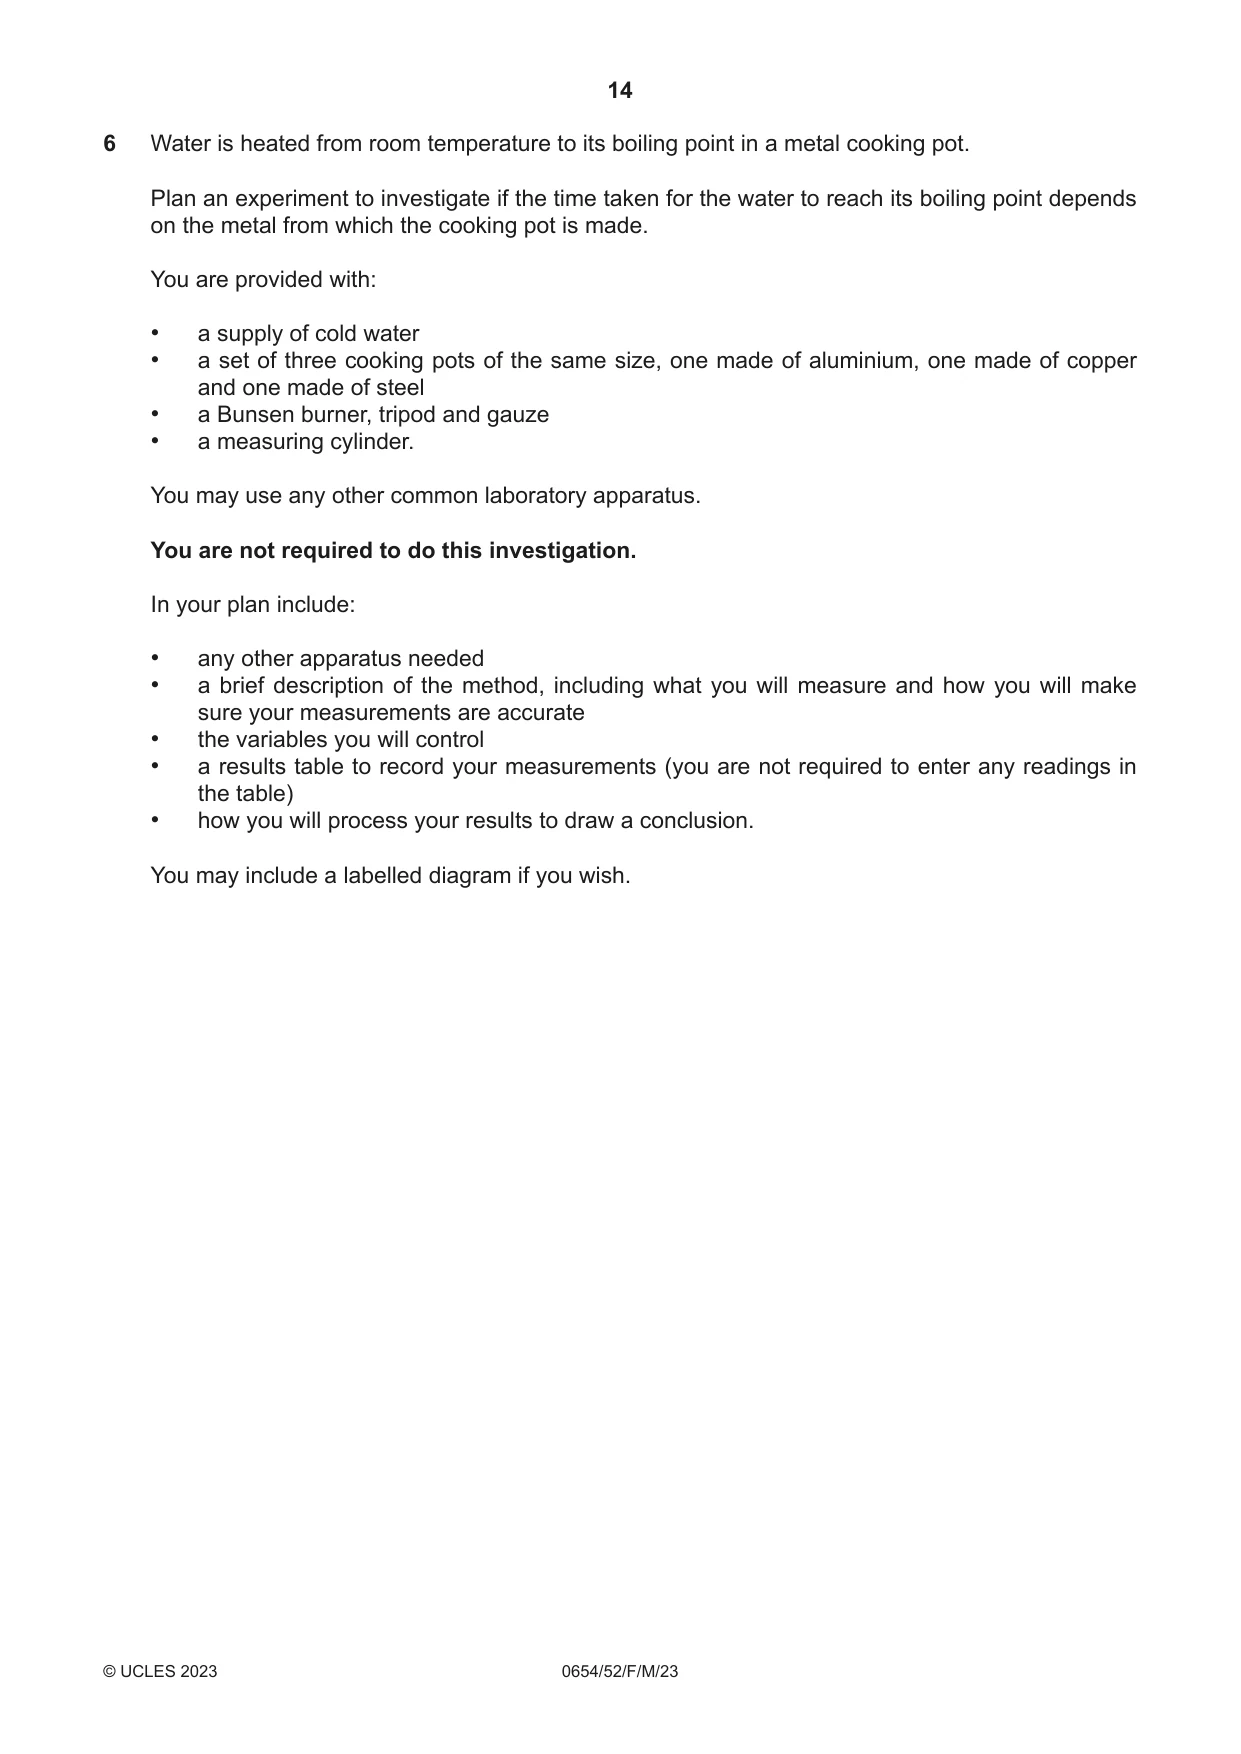
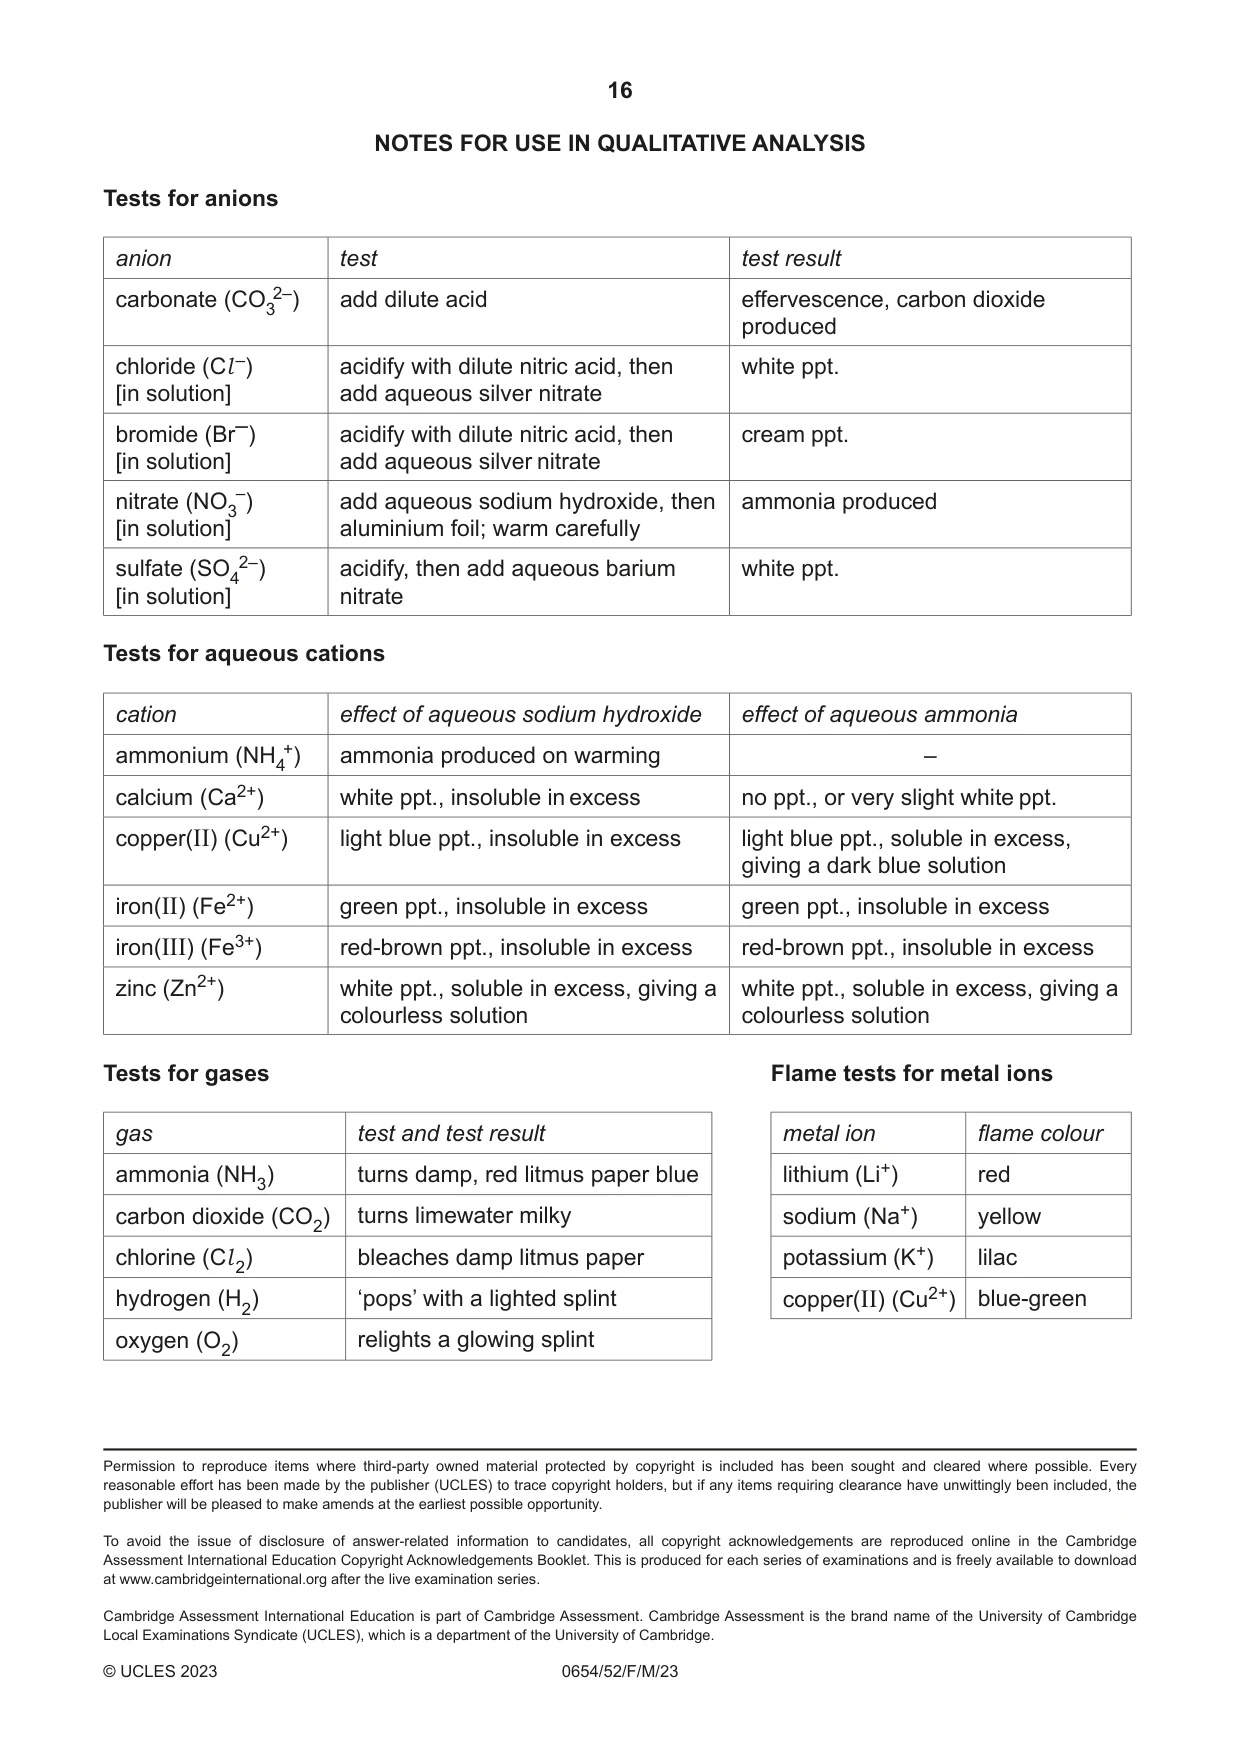
6 Water is heated from room temperature to its boiling point in a metal cooking pot. Plan an experiment to investigate if the time taken for the water to reach its boiling point depends on the metal from which the cooking pot is made. You are provided with: • a supply of cold water • a set of three cooking pots of the same size, one made of aluminium, one made of copper and one made of steel • a Bunsen burner, tripod and gauze • a measuring cylinder. You may use any other common laboratory apparatus. You are not required to do this investigation. In your plan include: • any other apparatus needed • a brief description of the method, including what you will measure and how you will make sure your measurements are accurate • the variables you will control • a results table to record your measurements (you are not required to enter any readings in the table) • how you will process your results to draw a conclusion. You may include a labelled diagram if you wish. .......................................................................................................................................................... .......................................................................................................................................................... .......................................................................................................................................................... .......................................................................................................................................................... .......................................................................................................................................................... .......................................................................................................................................................... .......................................................................................................................................................... .......................................................................................................................................................... .......................................................................................................................................................... .......................................................................................................................................................... .......................................................................................................................................................... .......................................................................................................................................................... .......................................................................................................................................................... .......................................................................................................................................................... .......................................................................................................................................................... .......................................................................................................................................................... .......................................................................................................................................................... .......................................................................................................................................................... .......................................................................................................................................................... .......................................................................................................................................................... .......................................................................................................................................................... .......................................................................................................................................................... .......................................................................................................................................................... .......................................................................................................................................................... .......................................................................................................................................................... .......................................................................................................................................................... .......................................................................................................................................................... .................................................................................................................................................... [7] NOTES FOR USE IN QUALITATIVE ANALYSIS Tests for anions anion test test result carbonate (CO32–) add dilute acid effervescence, carbon dioxide produced chloride (Cl –) acidify with dilute nitric acid, then white ppt. [in solution] add aqueous silver nitrate bromide (Br–) acidify with dilute nitric acid, then cream ppt. [in solution] add aqueous silver nitrate nitrate (NO3–) add aqueous sodium hydroxide, then ammonia produced [in solution] aluminium foil; warm carefully sulfate (SO42–) acidify, then add aqueous barium white ppt. [in solution] nitrate Tests for aqueous cations cation effect of aqueous sodium hydroxide effect of aqueous ammonia ammonium (NH4+) ammonia produced on warming – calcium (Ca2+) white ppt., insoluble in excess no ppt., or very slight white ppt. copper(II) (Cu2+) light blue ppt., insoluble in excess light blue ppt., soluble in excess, giving a dark blue solution iron(II) (Fe2+) green ppt., insoluble in excess green ppt., insoluble in excess iron(III) (Fe3+) red-brown ppt., insoluble in excess red-brown ppt., insoluble in excess zinc (Zn2+) white ppt., soluble in excess, giving a white ppt., soluble in excess, giving a colourless solution colourless solution Tests for gases Flame tests for metal ions gas test and test result metal ion flame colour ammonia (NH3) turns damp, red litmus paper blue lithium (Li+) red carbon dioxide (CO2) turns limewater milky sodium (Na+) yellow chlorine (Cl 2) bleaches damp litmus paper potassium (K+) lilac hydrogen (H2) ‘pops’ with a lighted splint copper(II) (Cu2+) blue-green oxygen (O2) relights a glowing splint
Mark scheme: 6 additional apparatus: 7 stop-watch ; thermometer ; method: pour (cold) water into one of the pots, boil it, measure time and repeat for all 3 pots; repeats method for each pot (i.e. more than one trial for each pot) control variables: mass / volume of cold water ; same initial cold-water temperature ; keep Bunsen burner flame constant ; table: columns for pot / metal and time ; units for time ; processing and conclusion: plot bar chart / histogram of metal against time; if the times are different / same then metal makes a difference / does not make a difference / lowest time best heat conductor ; calculate average identifying / excluding anomalies ;
More questions on Physical quantities and measurement techniques
What was in this paper
The subtopics covered by these 6 questions, and how many questions each got. Open one in a new tab to see every Cambridge question on it.
What you needed in this session
Cambridge’s own grade thresholds for 2023 Feb/March, Paper 5 · Variant 2. A higher threshold means an easier paper — the bar moves with how the cohort did.