Cambridge IGCSE Sciences - Co-ordinated (Double) 0654 — 2023 Oct/Nov Paper 5 · Variant 2
0654/52/O/N/23 · 6 questions · 60 marks · ≈68 min
The question paper and its mark scheme, free to read here and free to download. This is Cambridge’s own paper, exactly as it was sat.
Question paper20 pages





Mark scheme10 pages
Answers below. Sit the paper first if you are practising.
Questions as text
Q1 · You are going to test milk and rice for their nutrient content
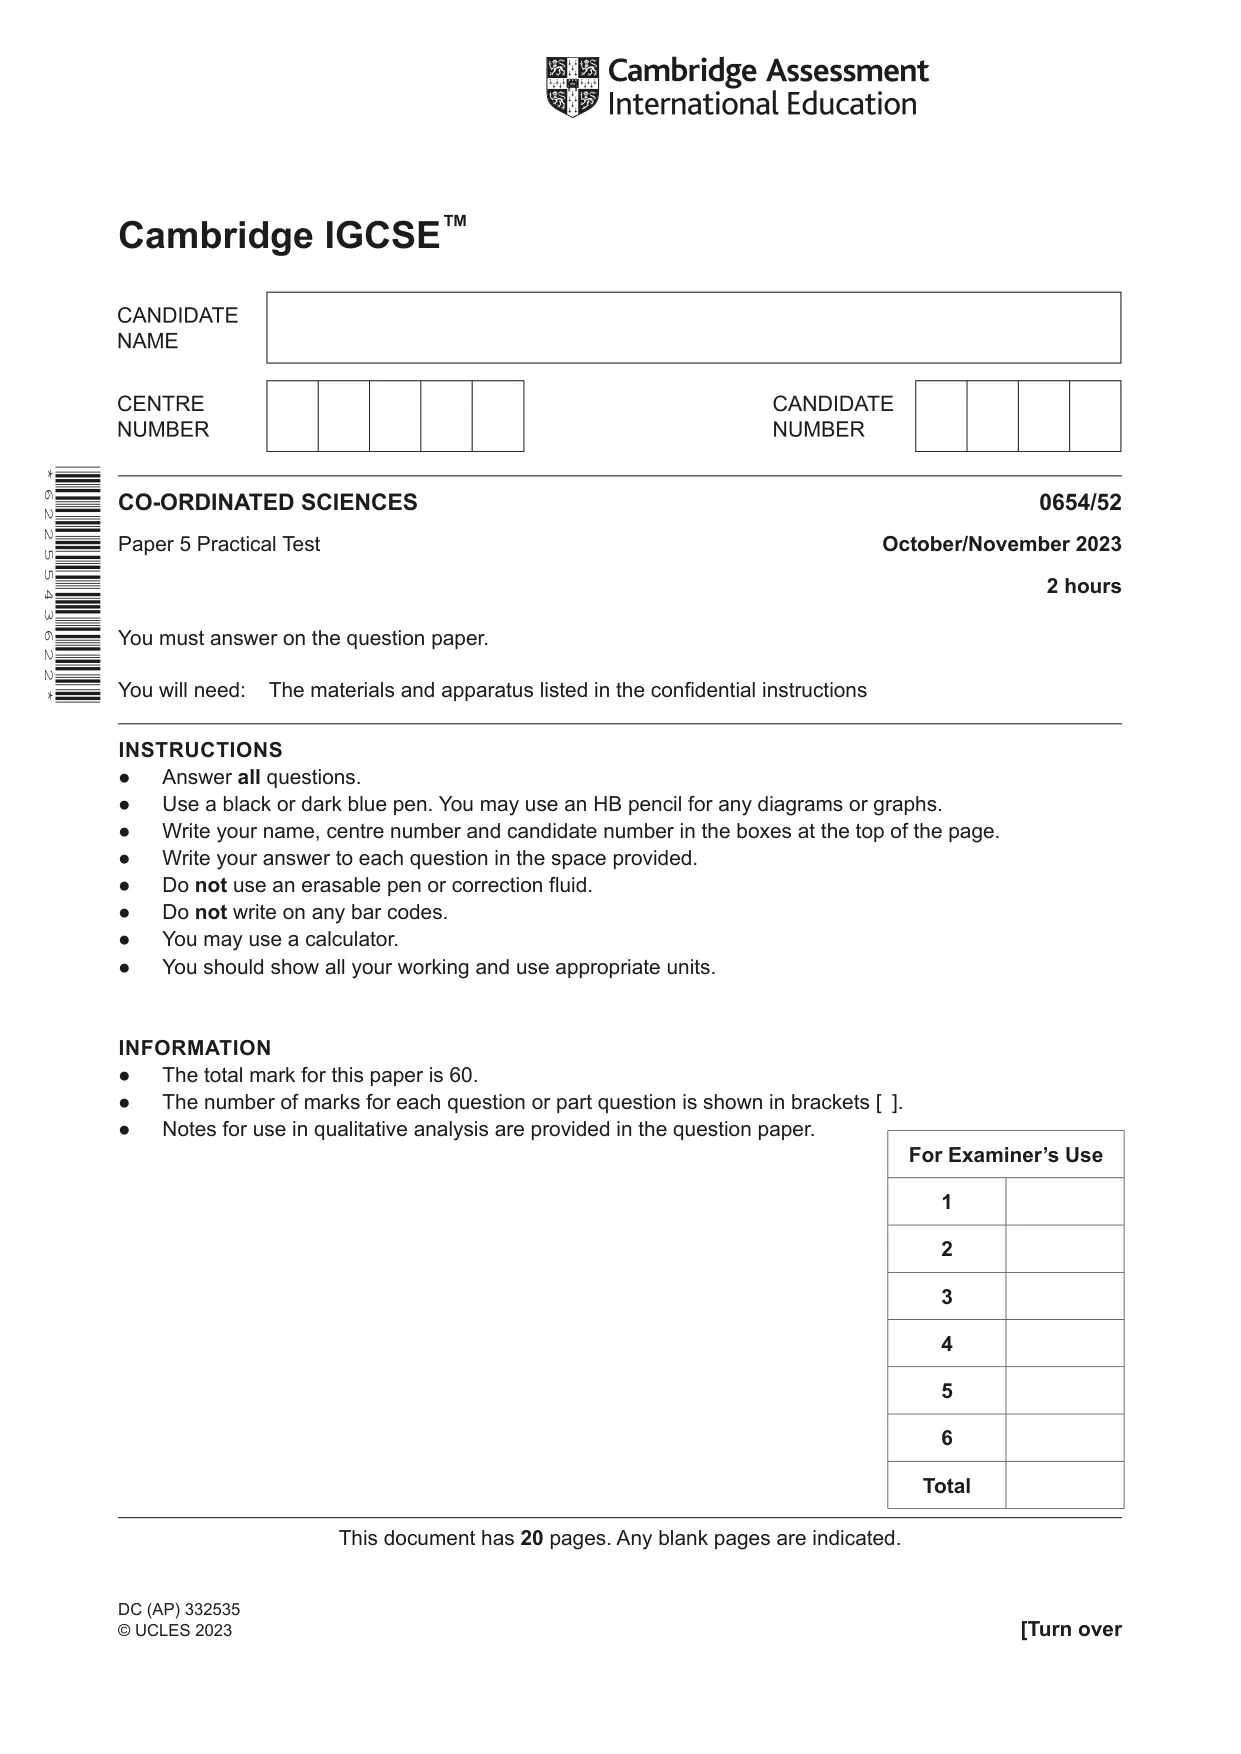
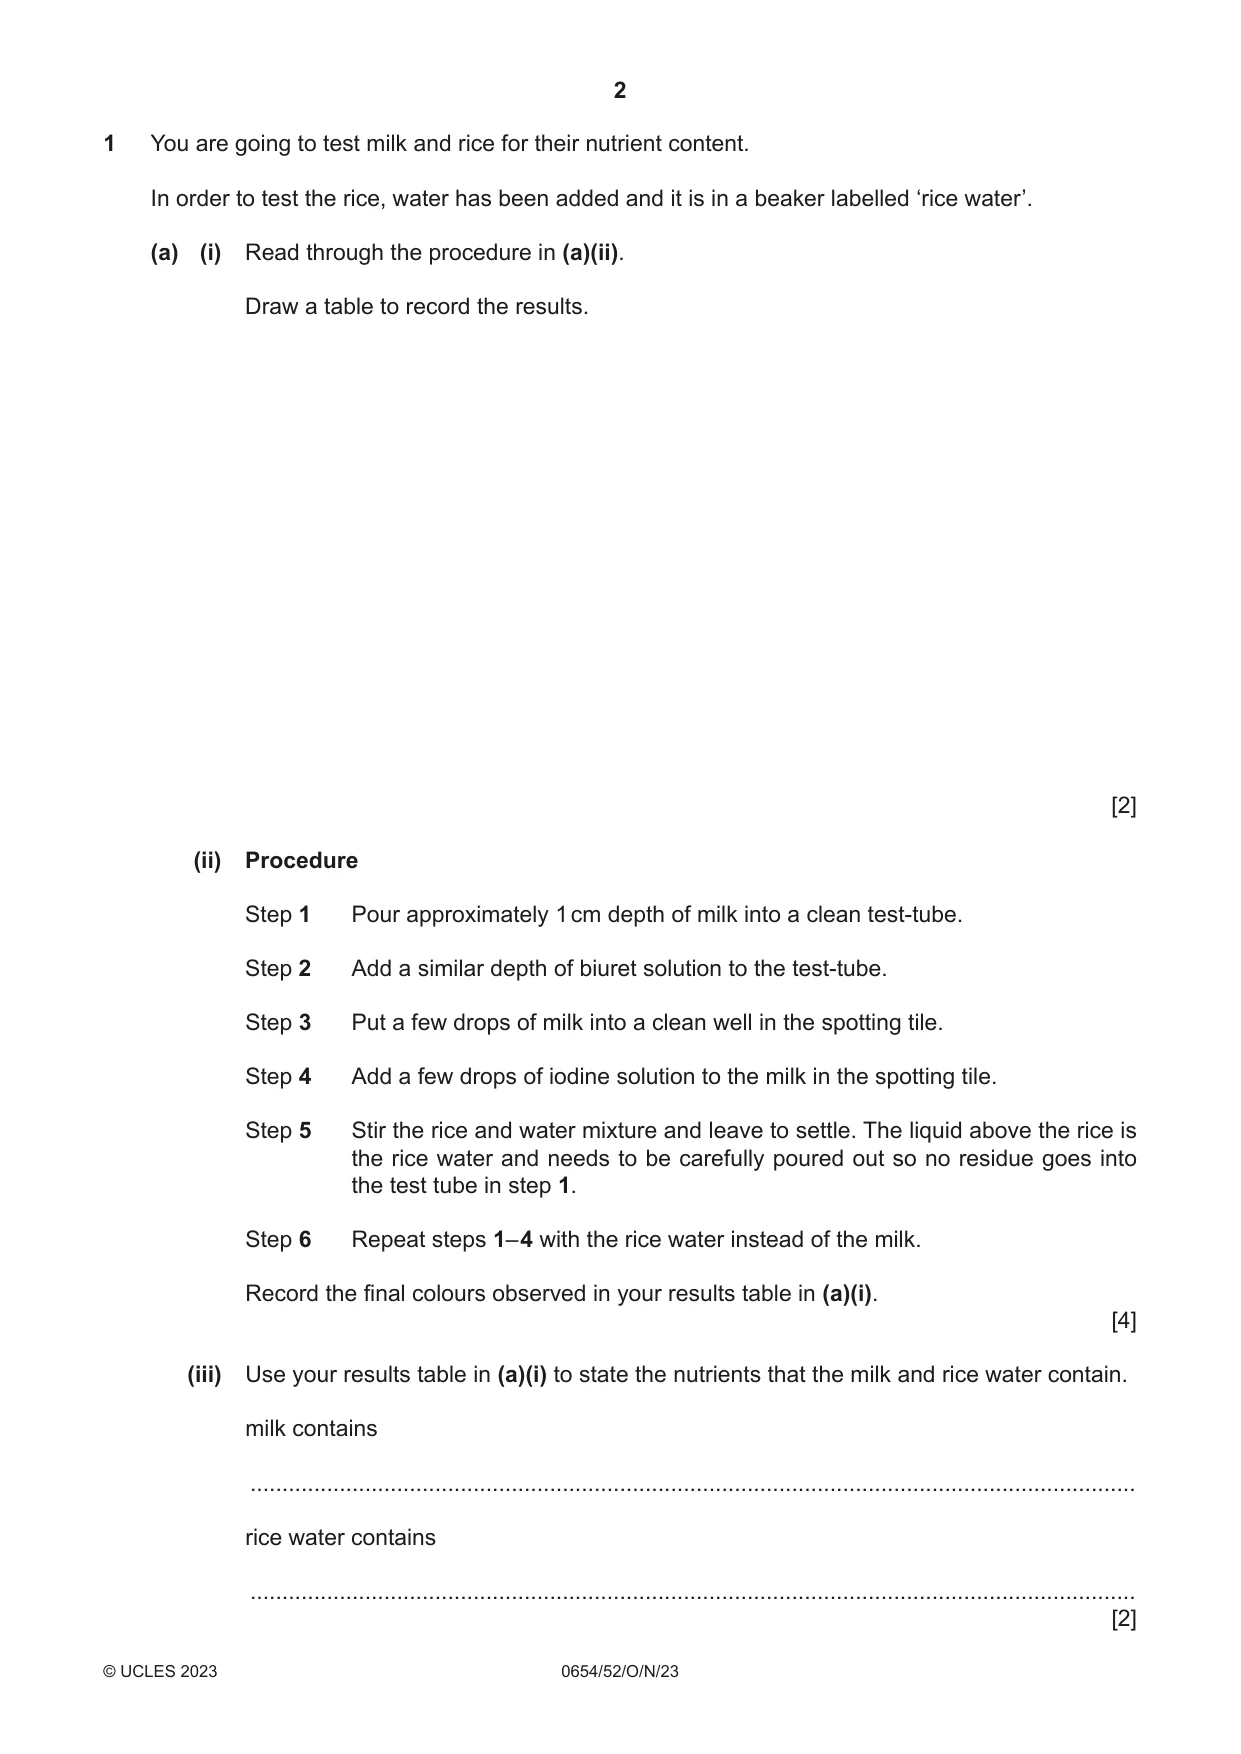
1 You are going to test milk and rice for their nutrient content. In order to test the rice, water has been added and it is in a beaker labelled ‘rice water’. (a) (i) Read through the procedure in (a)(ii). Draw a table to record the results. [2] (ii) Procedure Step 1 Pour approximately 1 cm depth of milk into a clean test‑tube. Step 2 Add a similar depth of biuret solution to the test‑tube. Step 3 Put a few drops of milk into a clean well in the spotting tile. Step 4 Add a few drops of iodine solution to the milk in the spotting tile. Step 5 Stir the rice and water mixture and leave to settle. The liquid above the rice is the rice water and needs to be carefully poured out so no residue goes into the test tube in step 1. Step 6 Repeat steps 1– 4 with the rice water instead of the milk. Record the final colours observed in your results table in (a)(i). [4] (iii) Use your results table in (a)(i) to state the nutrients that the milk and rice water contain. milk contains ........................................................................................................................................... rice water contains ........................................................................................................................................... [2] (b) (i) Suggest why it is important to soak the rice in water before testing for the nutrients. ........................................................................................................................................... ........................................................................................................................................... ..................................................................................................................................... [1] (ii) Suggest why iodine solution is used to determine the presence of the nutrient but not the concentration of the nutrient in the investigation. ........................................................................................................................................... ........................................................................................................................................... ..................................................................................................................................... [1] [Total: 10]
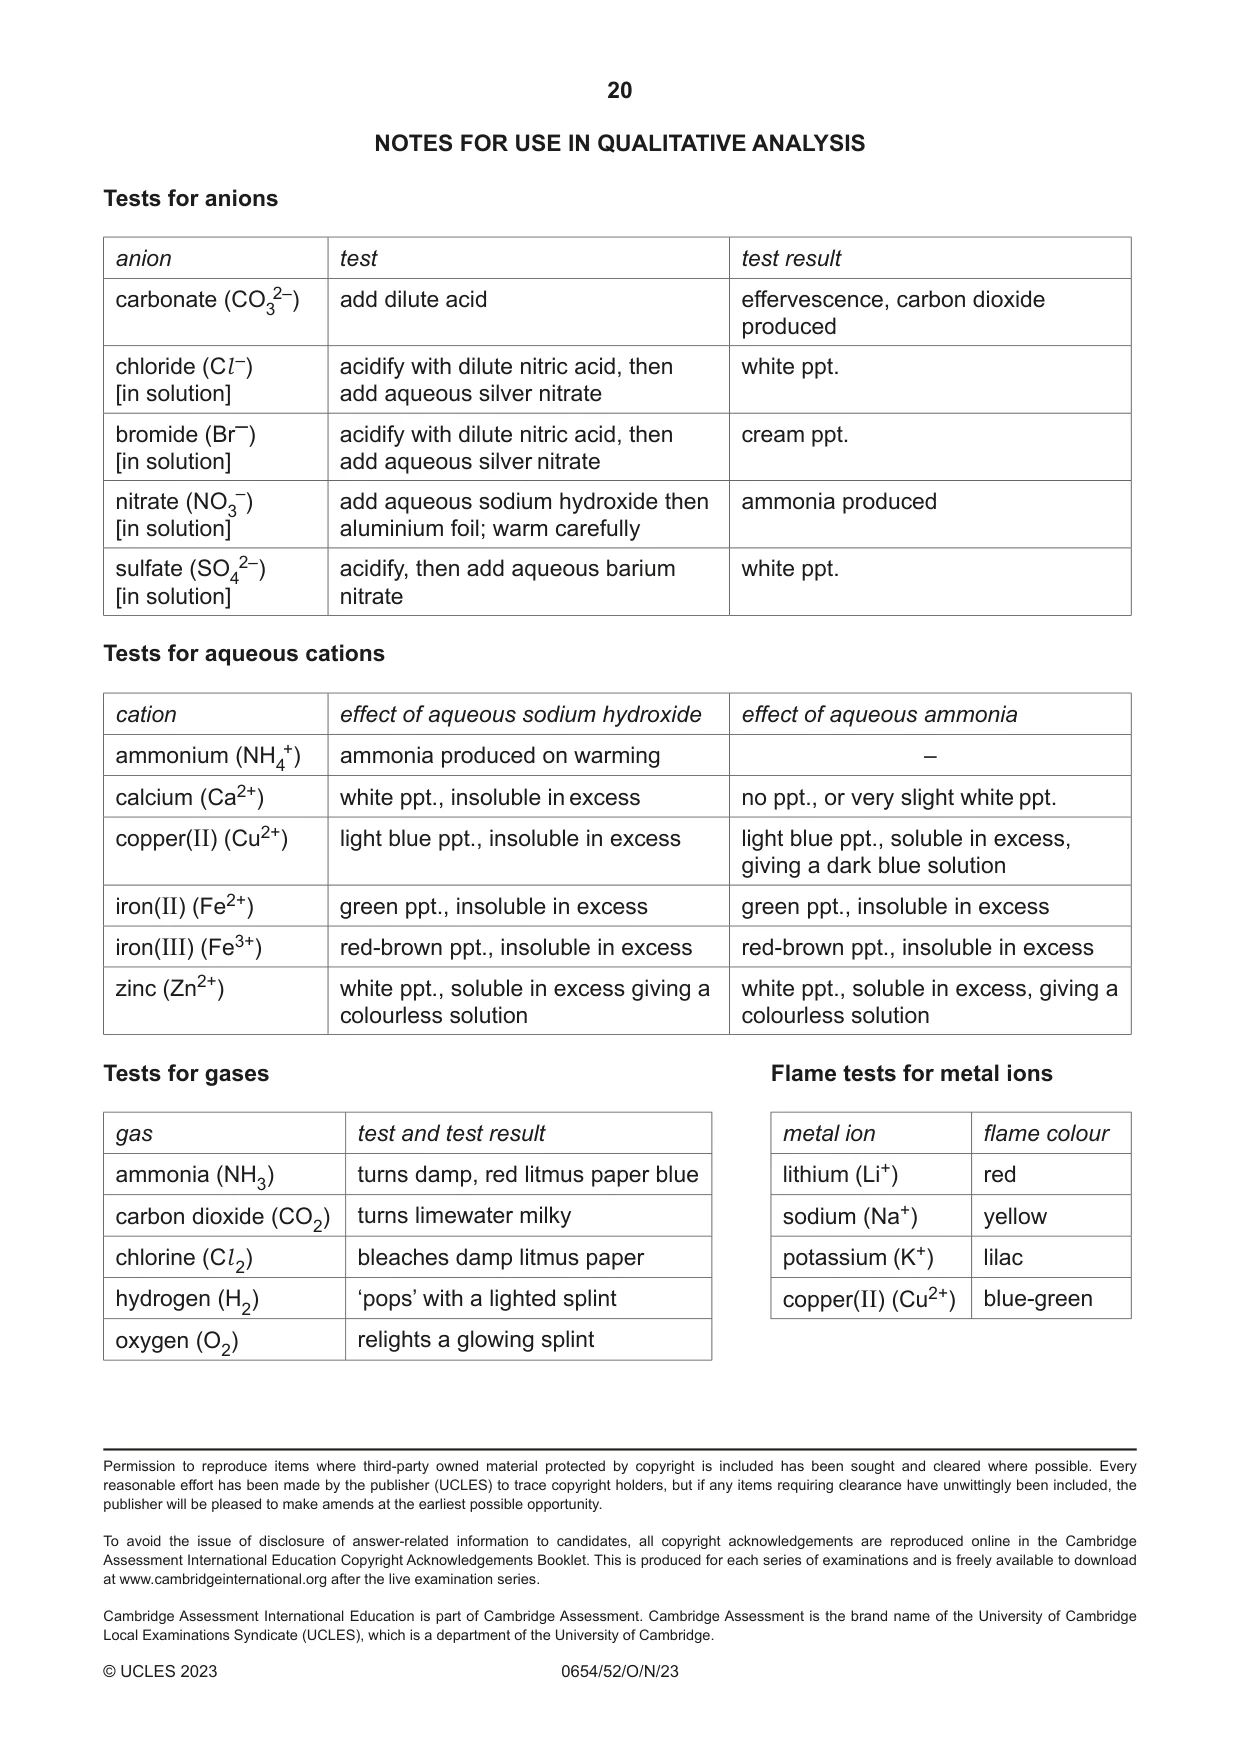
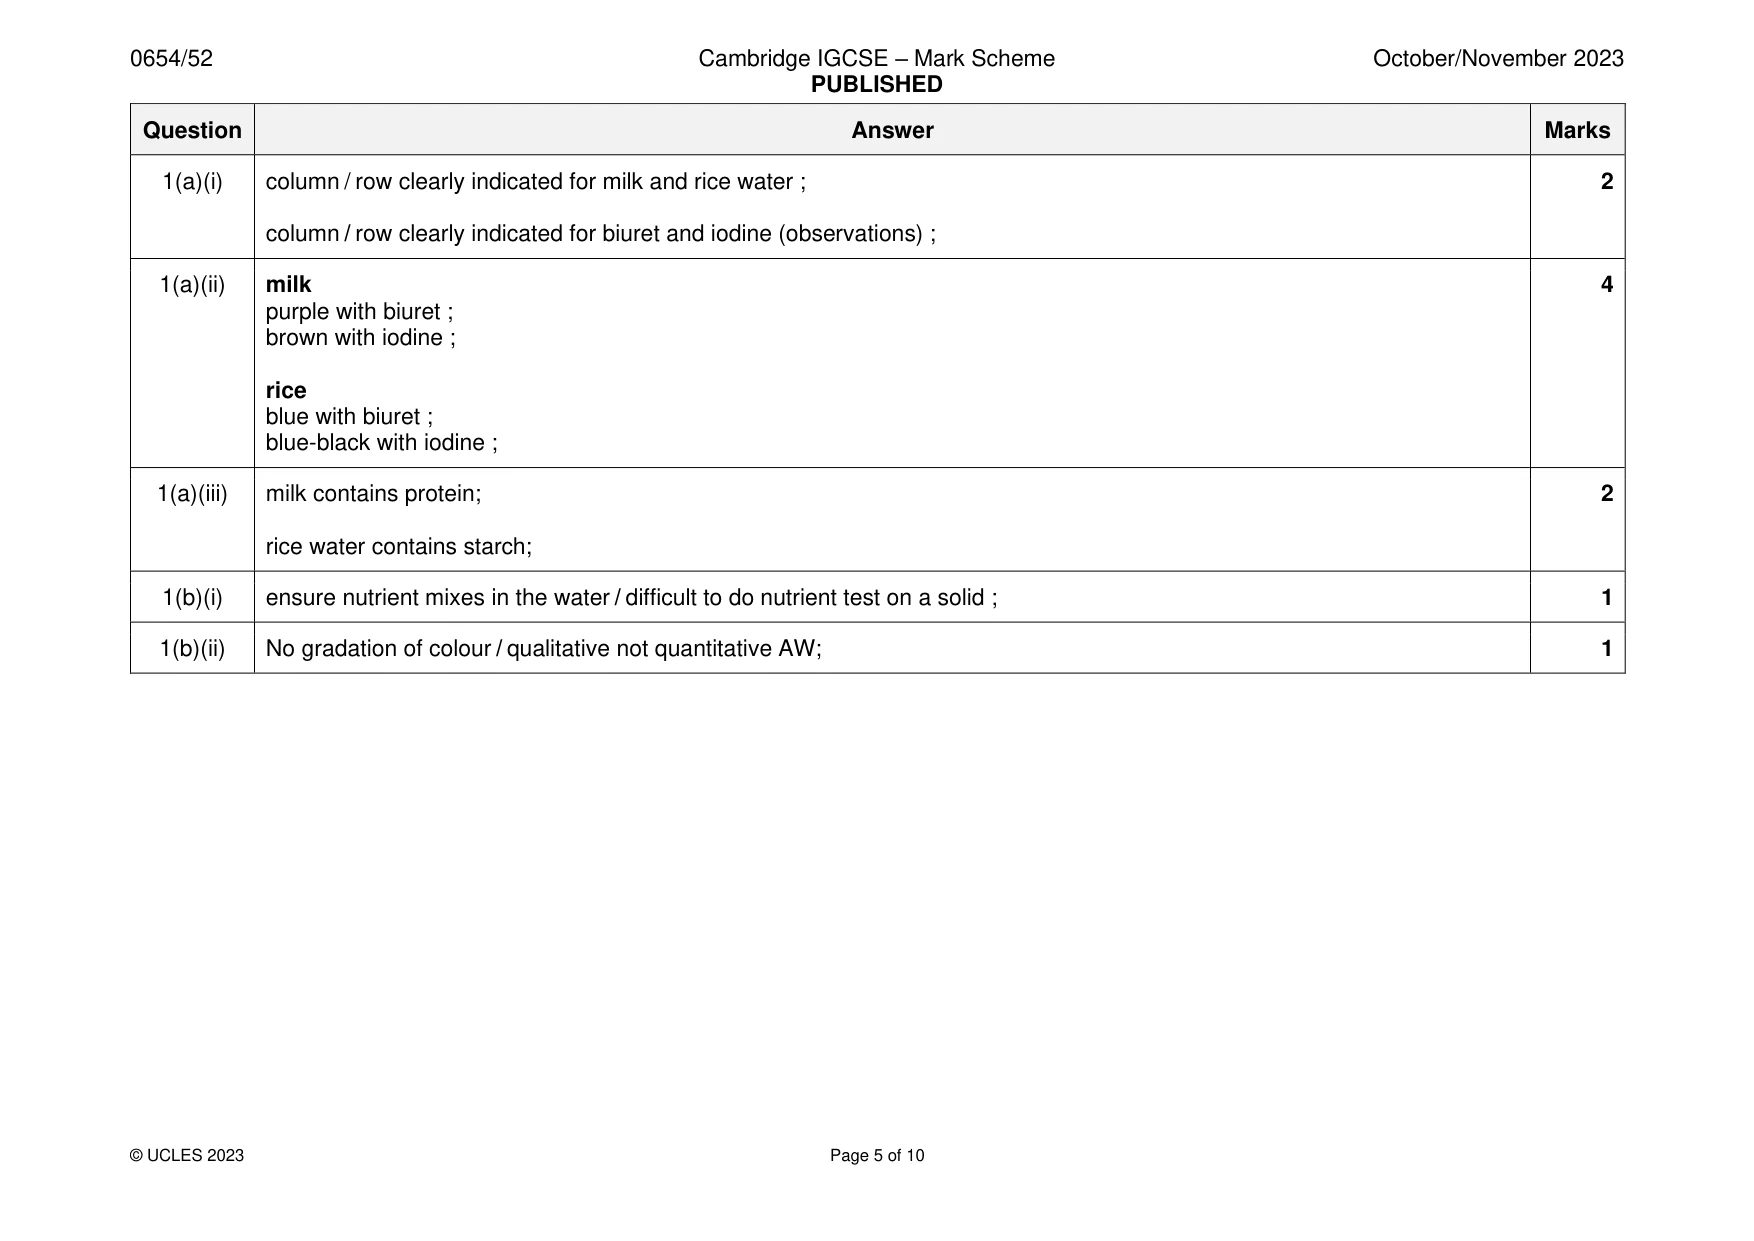
Mark scheme: Question Answer Marks 1(a)(i) column / row clearly indicated for milk and rice water ; 2 column / row clearly indicated for biuret and iodine (observations) ; 1(a)(ii) milk 4 purple with biuret ; brown with iodine ; rice blue with biuret ; blue-black with iodine ; 1(a)(iii) milk contains protein; 2 rice water contains starch; 1(b)(i) ensure nutrient mixes in the water / difficult to do nutrient test on a solid ; 1 1(b)(ii) No gradation of colour / qualitative not quantitative AW; 1
Q2 · A photomicrograph of a single celled organism called Euglena
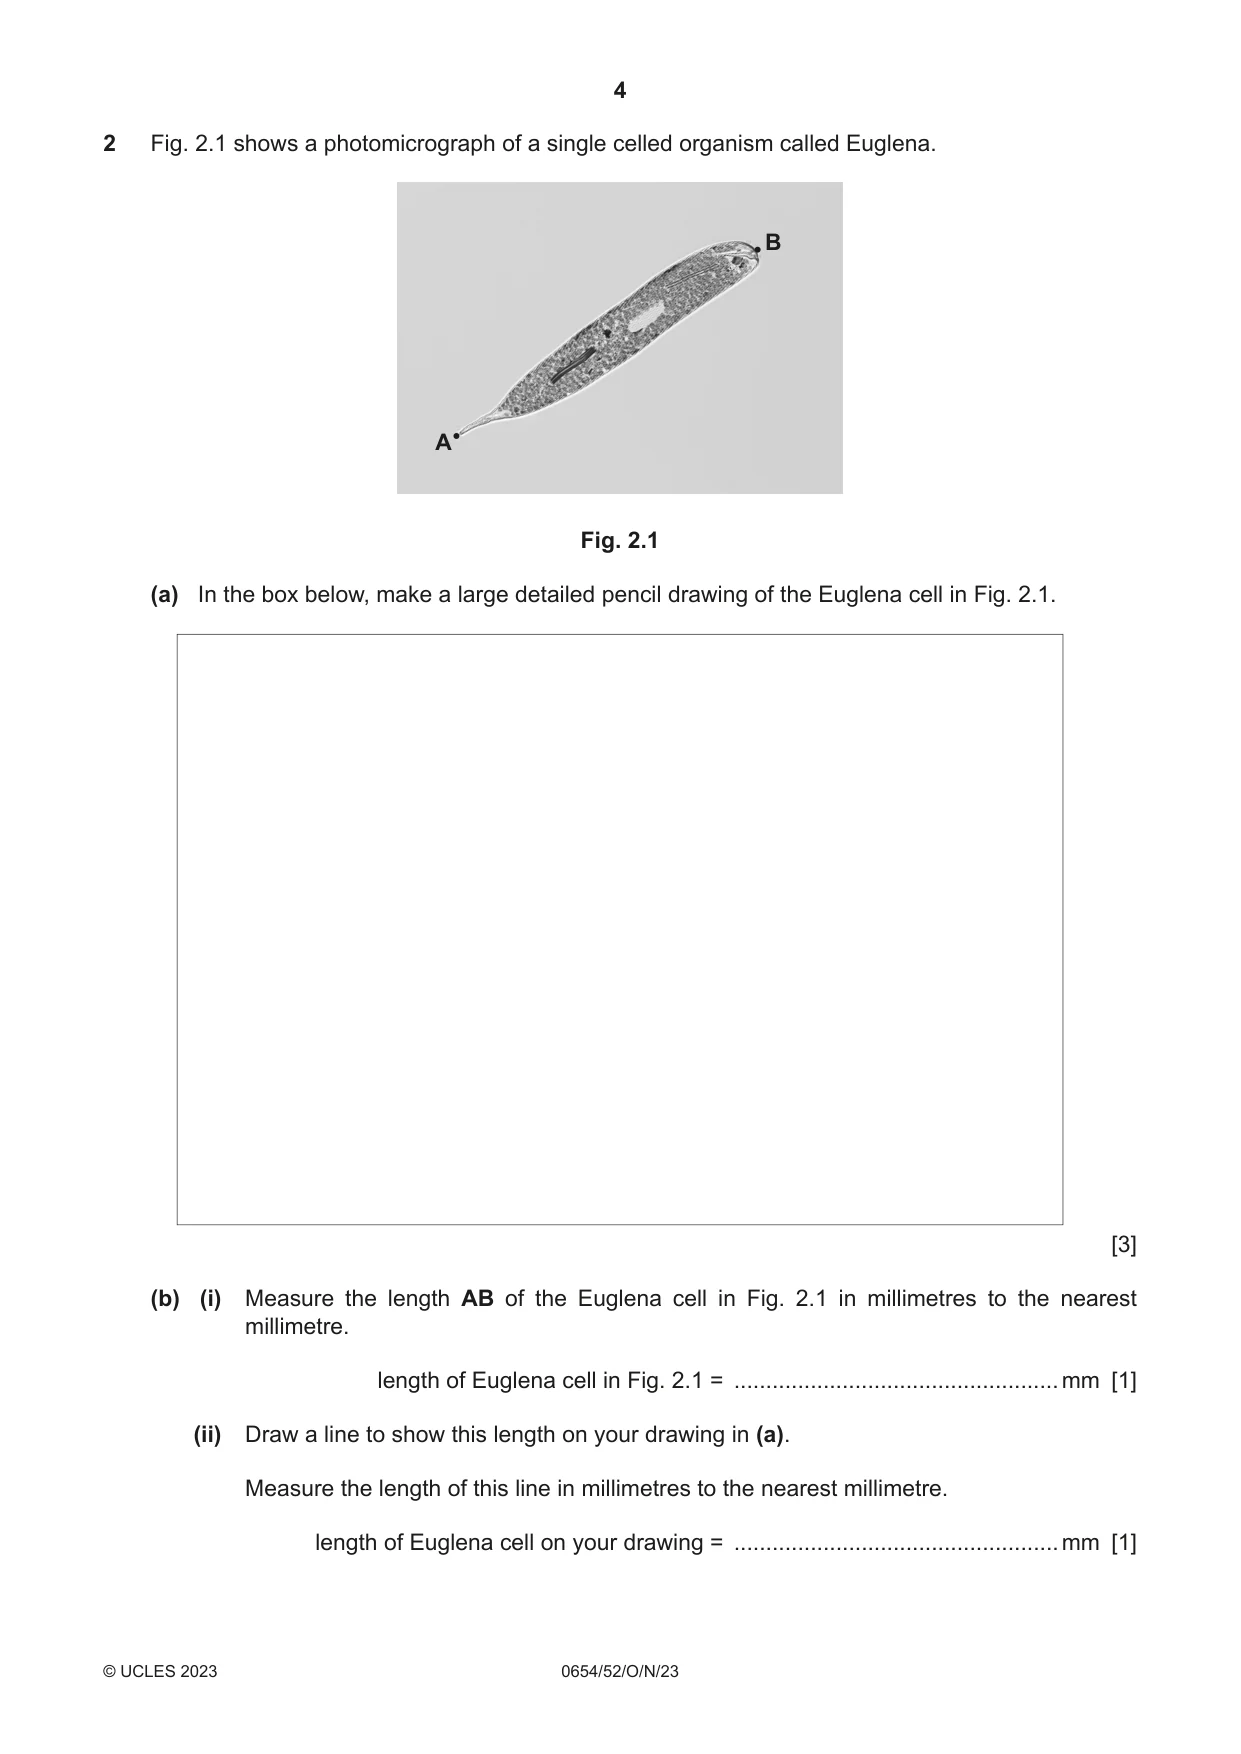
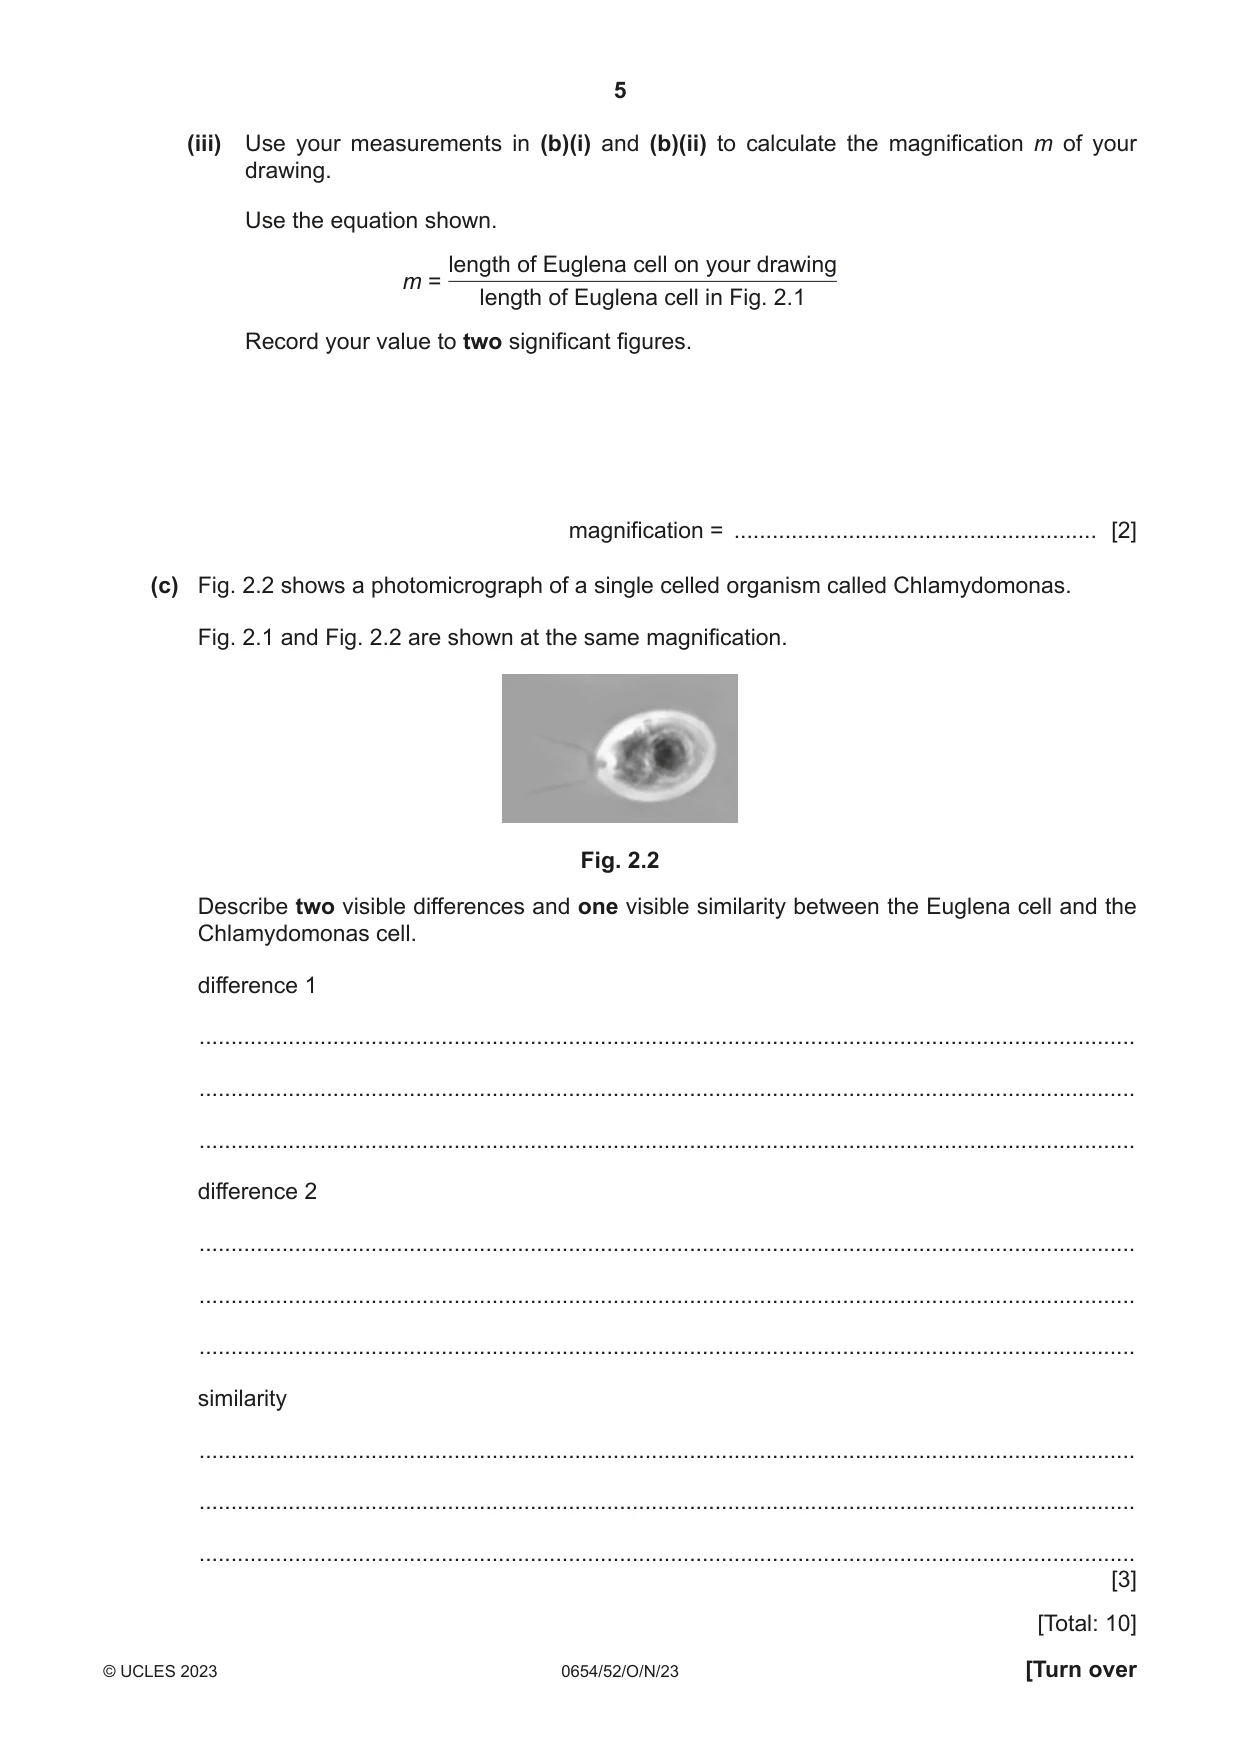
2 Fig. 2.1 shows a photomicrograph of a single celled organism called Euglena. B A Fig. 2.1 (a) In the box below, make a large detailed pencil drawing of the Euglena cell in Fig. 2.1. [3] (b) (i) Measure the length AB of the Euglena cell in Fig. 2.1 in millimetres to the nearest millimetre. length of Euglena cell in Fig. 2.1 = ................................................... mm [1] (ii) Draw a line to show this length on your drawing in (a). Measure the length of this line in millimetres to the nearest millimetre. length of Euglena cell on your drawing = ................................................... mm [1] (iii) Use your measurements in (b)(i) and (b)(ii) to calculate the magnification m of your drawing. Use the equation shown. length of Euglena cell on your drawing m = length of Euglena cell in Fig. 2.1 Record your value to two significant figures. magnification = ......................................................... [2] (c) Fig. 2.2 shows a photomicrograph of a single celled organism called Chlamydomonas. Fig. 2.1 and Fig. 2.2 are shown at the same magnification. Fig. 2.2 Describe two visible differences and one visible similarity between the Euglena cell and the Chlamydomonas cell. difference 1 ................................................................................................................................................... ................................................................................................................................................... ................................................................................................................................................... difference 2 ................................................................................................................................................... ................................................................................................................................................... ................................................................................................................................................... similarity ................................................................................................................................................... ................................................................................................................................................... ................................................................................................................................................... [3] [Total: 10]
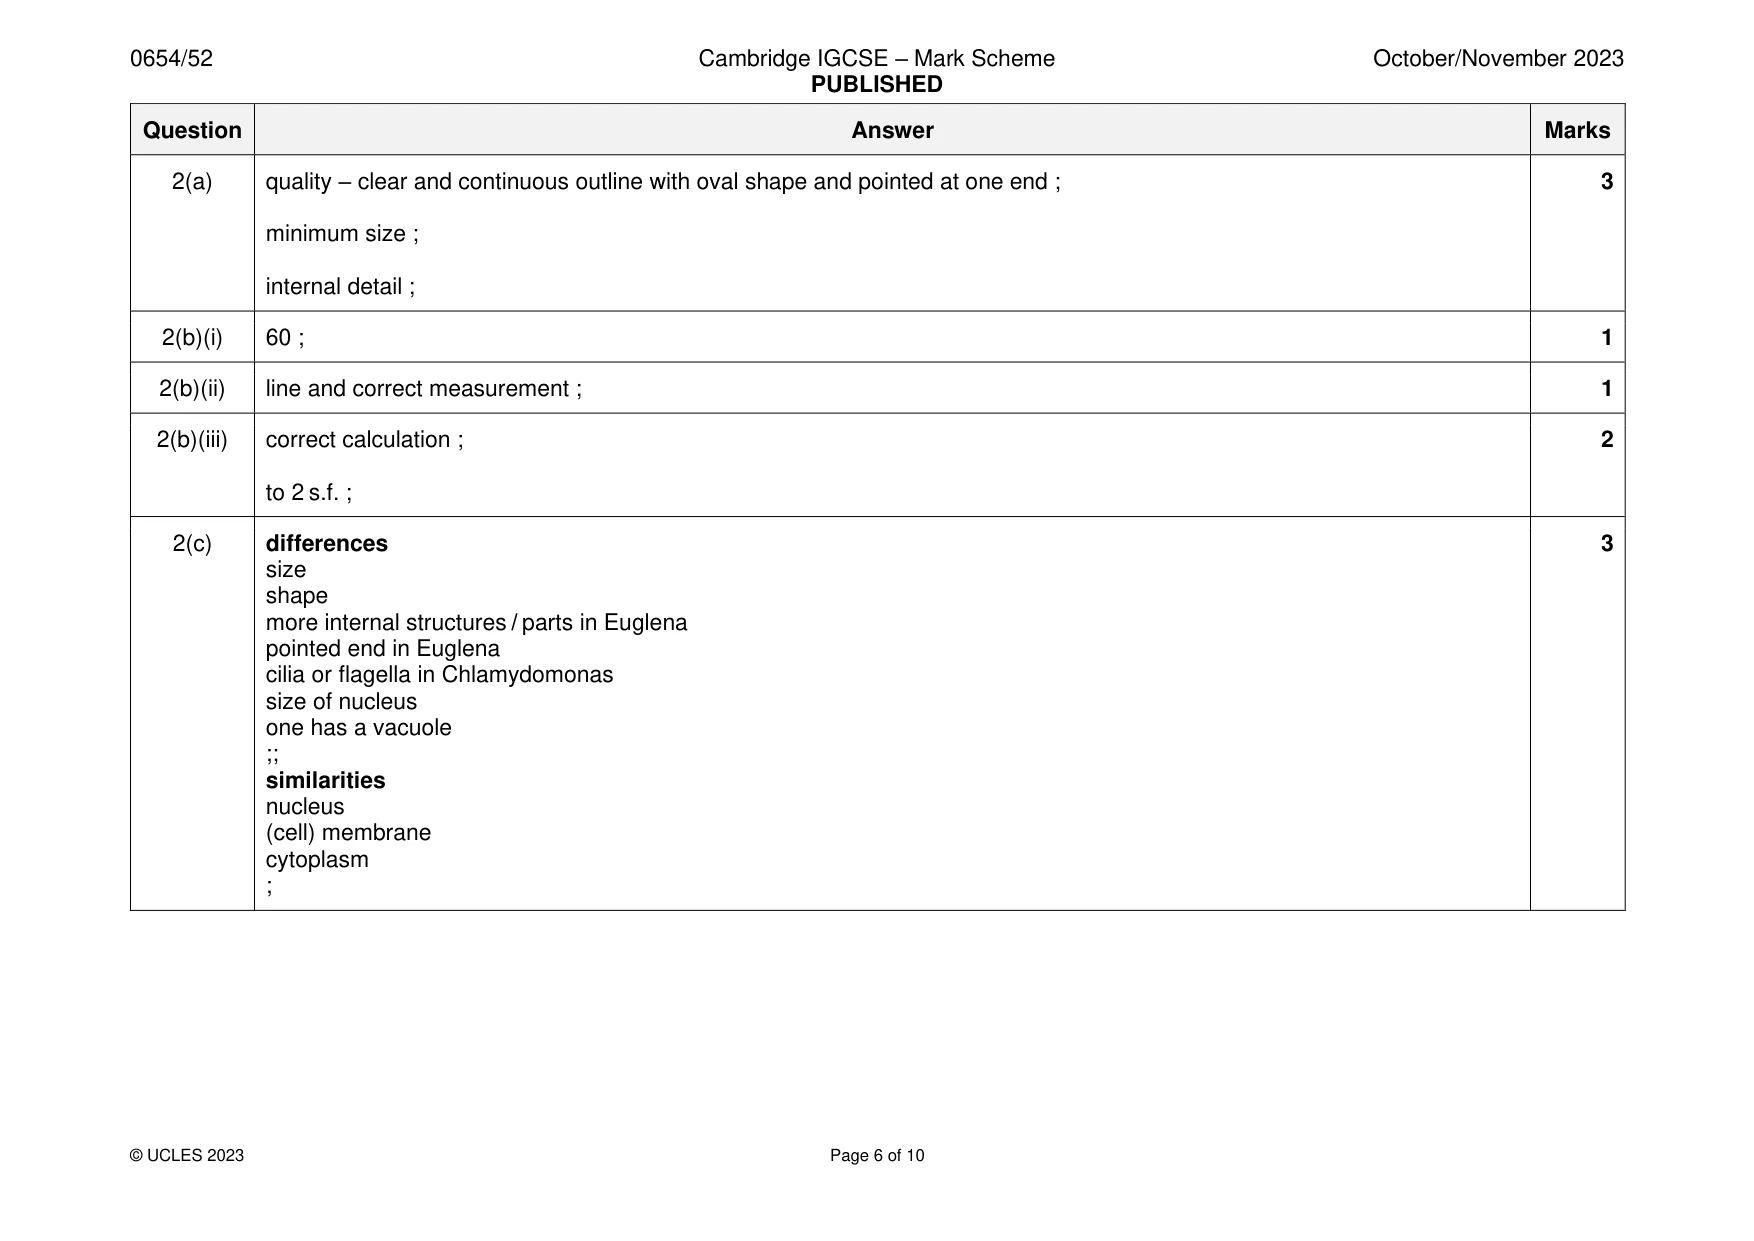
Mark scheme: 2(a) quality – clear and continuous outline with oval shape and pointed at one end ; 3 minimum size ; internal detail ; 2(b)(i) 60 ; 1 2(b)(ii) line and correct measurement ; 1 2(b)(iii) correct calculation ; 2 to 2 s.f. ; 2(c) differences 3 size shape more internal structures / parts in Euglena pointed end in Euglena cilia or flagella in Chlamydomonas size of nucleus one has a vacuole ;; similarities nucleus (cell) membrane cytoplasm ;
Q3 · You are going to investigate the effect of light on three silver salts
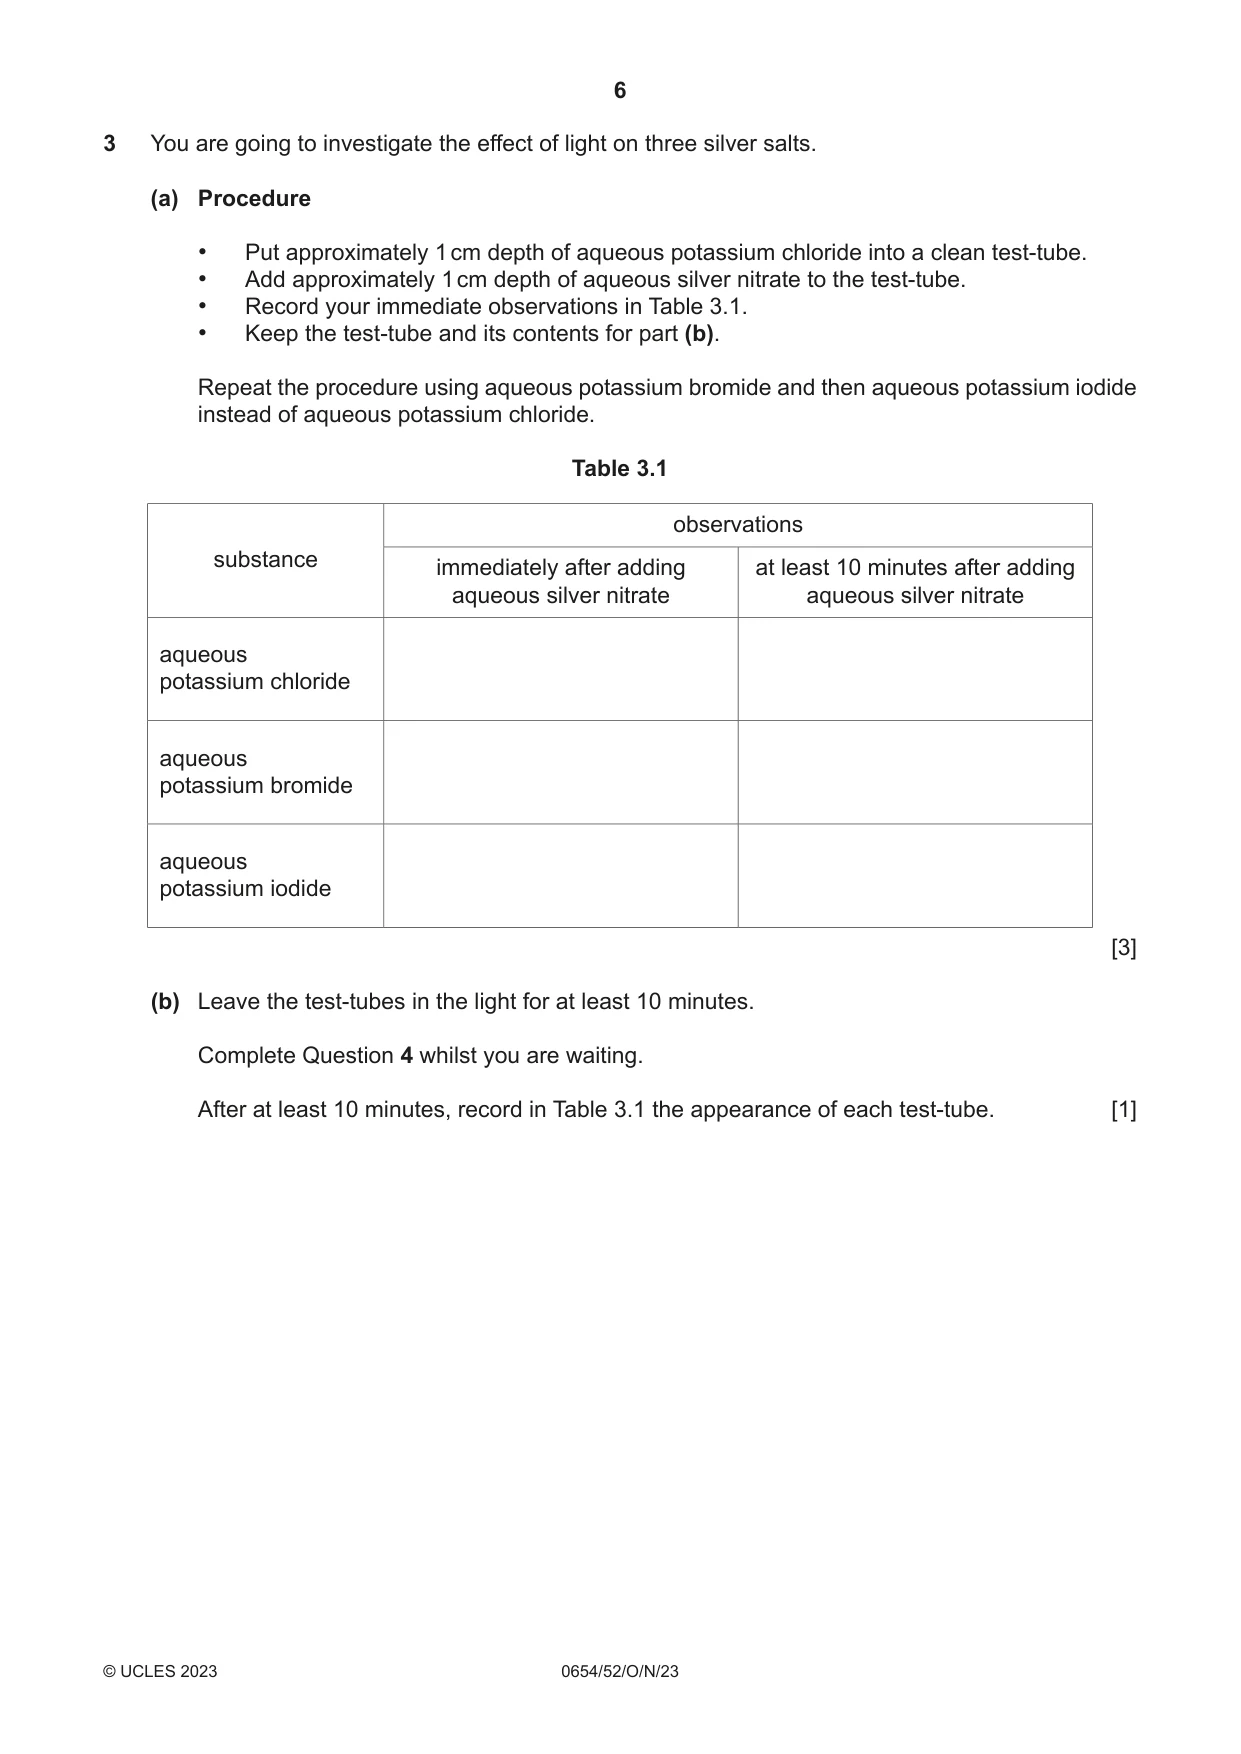
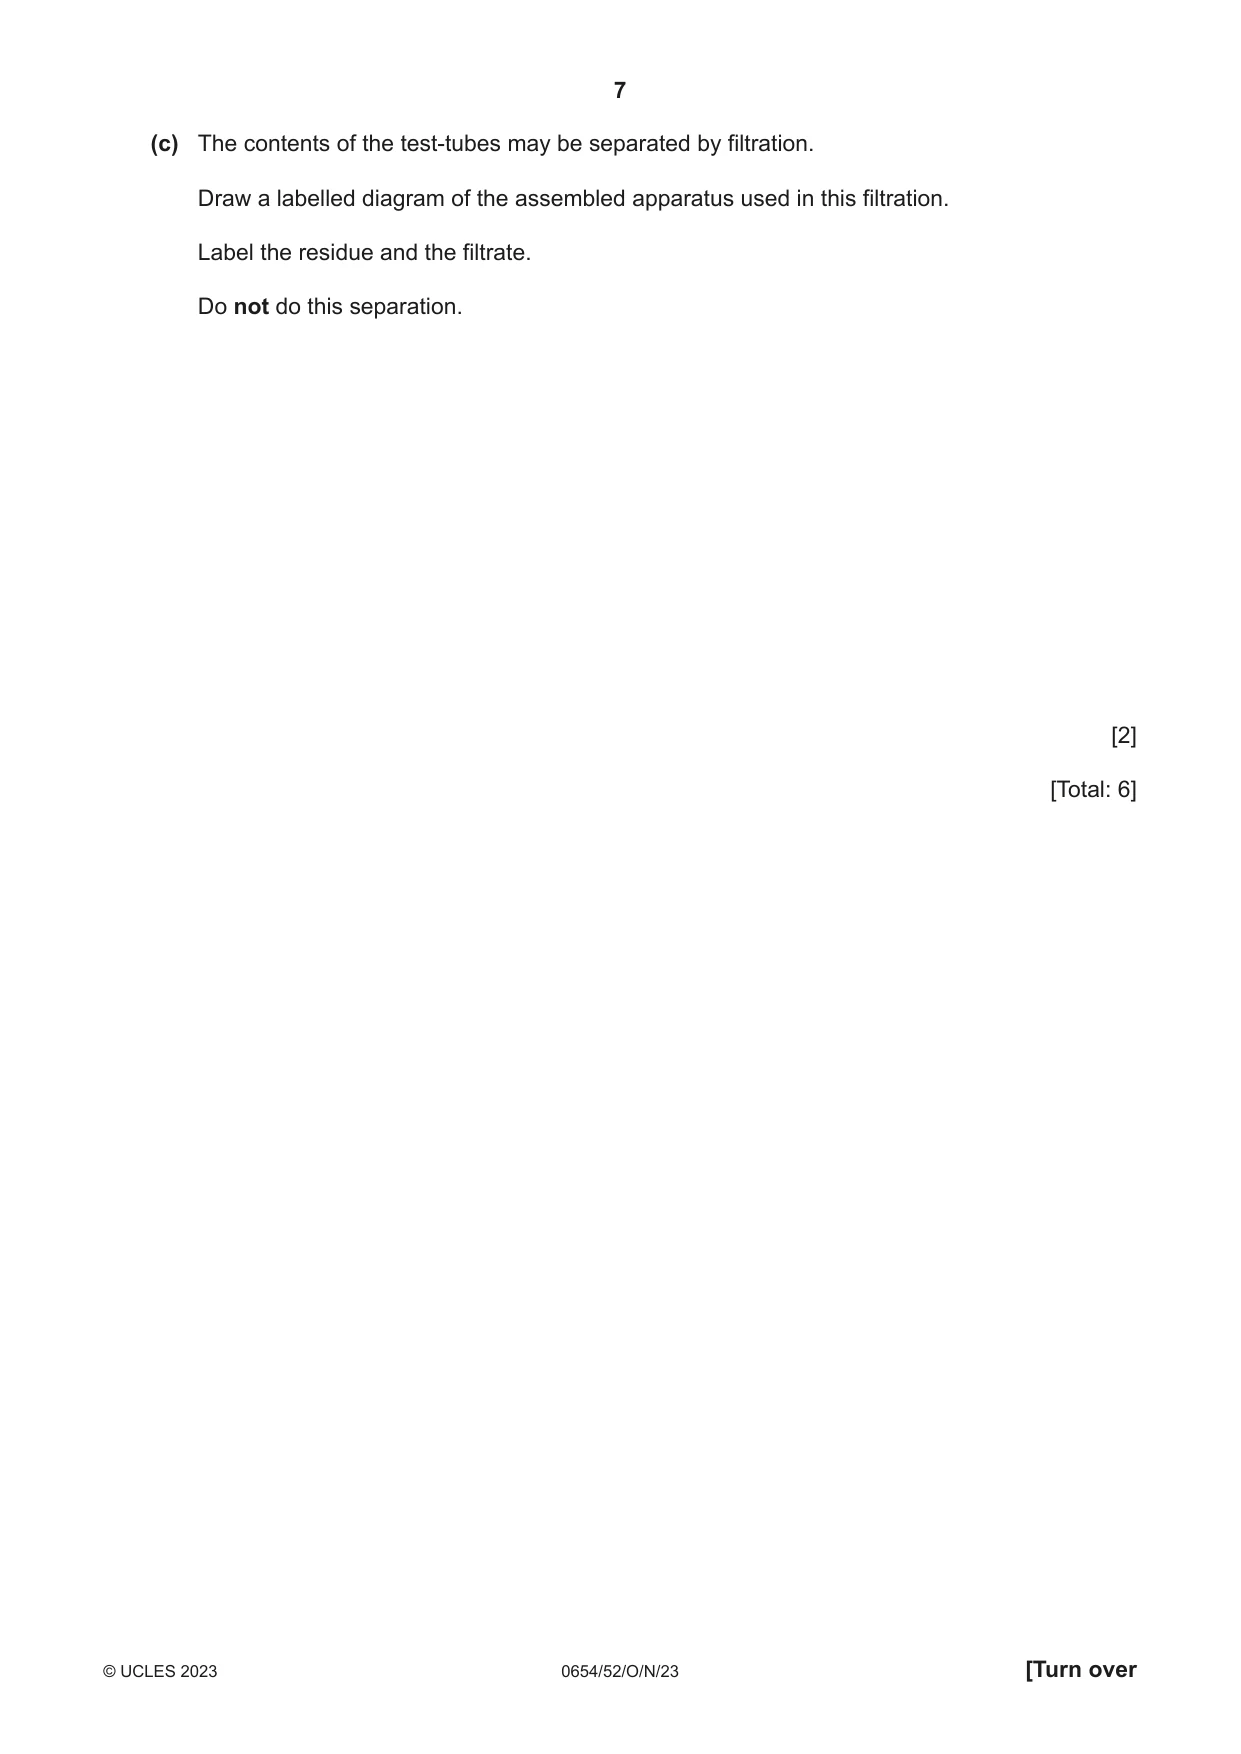
3 You are going to investigate the effect of light on three silver salts. (a) Procedure • Put approximately 1 cm depth of aqueous potassium chloride into a clean test‑tube. • Add approximately 1 cm depth of aqueous silver nitrate to the test‑tube. • Record your immediate observations in Table 3.1. • Keep the test‑tube and its contents for part (b). Repeat the procedure using aqueous potassium bromide and then aqueous potassium iodide instead of aqueous potassium chloride. Table 3.1 observations substance immediately after adding at least 10 minutes after adding aqueous silver nitrate aqueous silver nitrate aqueous potassium chloride aqueous potassium bromide aqueous potassium iodide [3] (b) Leave the test‑tubes in the light for at least 10 minutes. Complete Question 4 whilst you are waiting. After at least 10 minutes, record in Table 3.1 the appearance of each test‑tube. [1] (c) The contents of the test‑tubes may be separated by filtration. Draw a labelled diagram of the assembled apparatus used in this filtration. Label the residue and the filtrate. Do not do this separation. [2] [Total: 6]
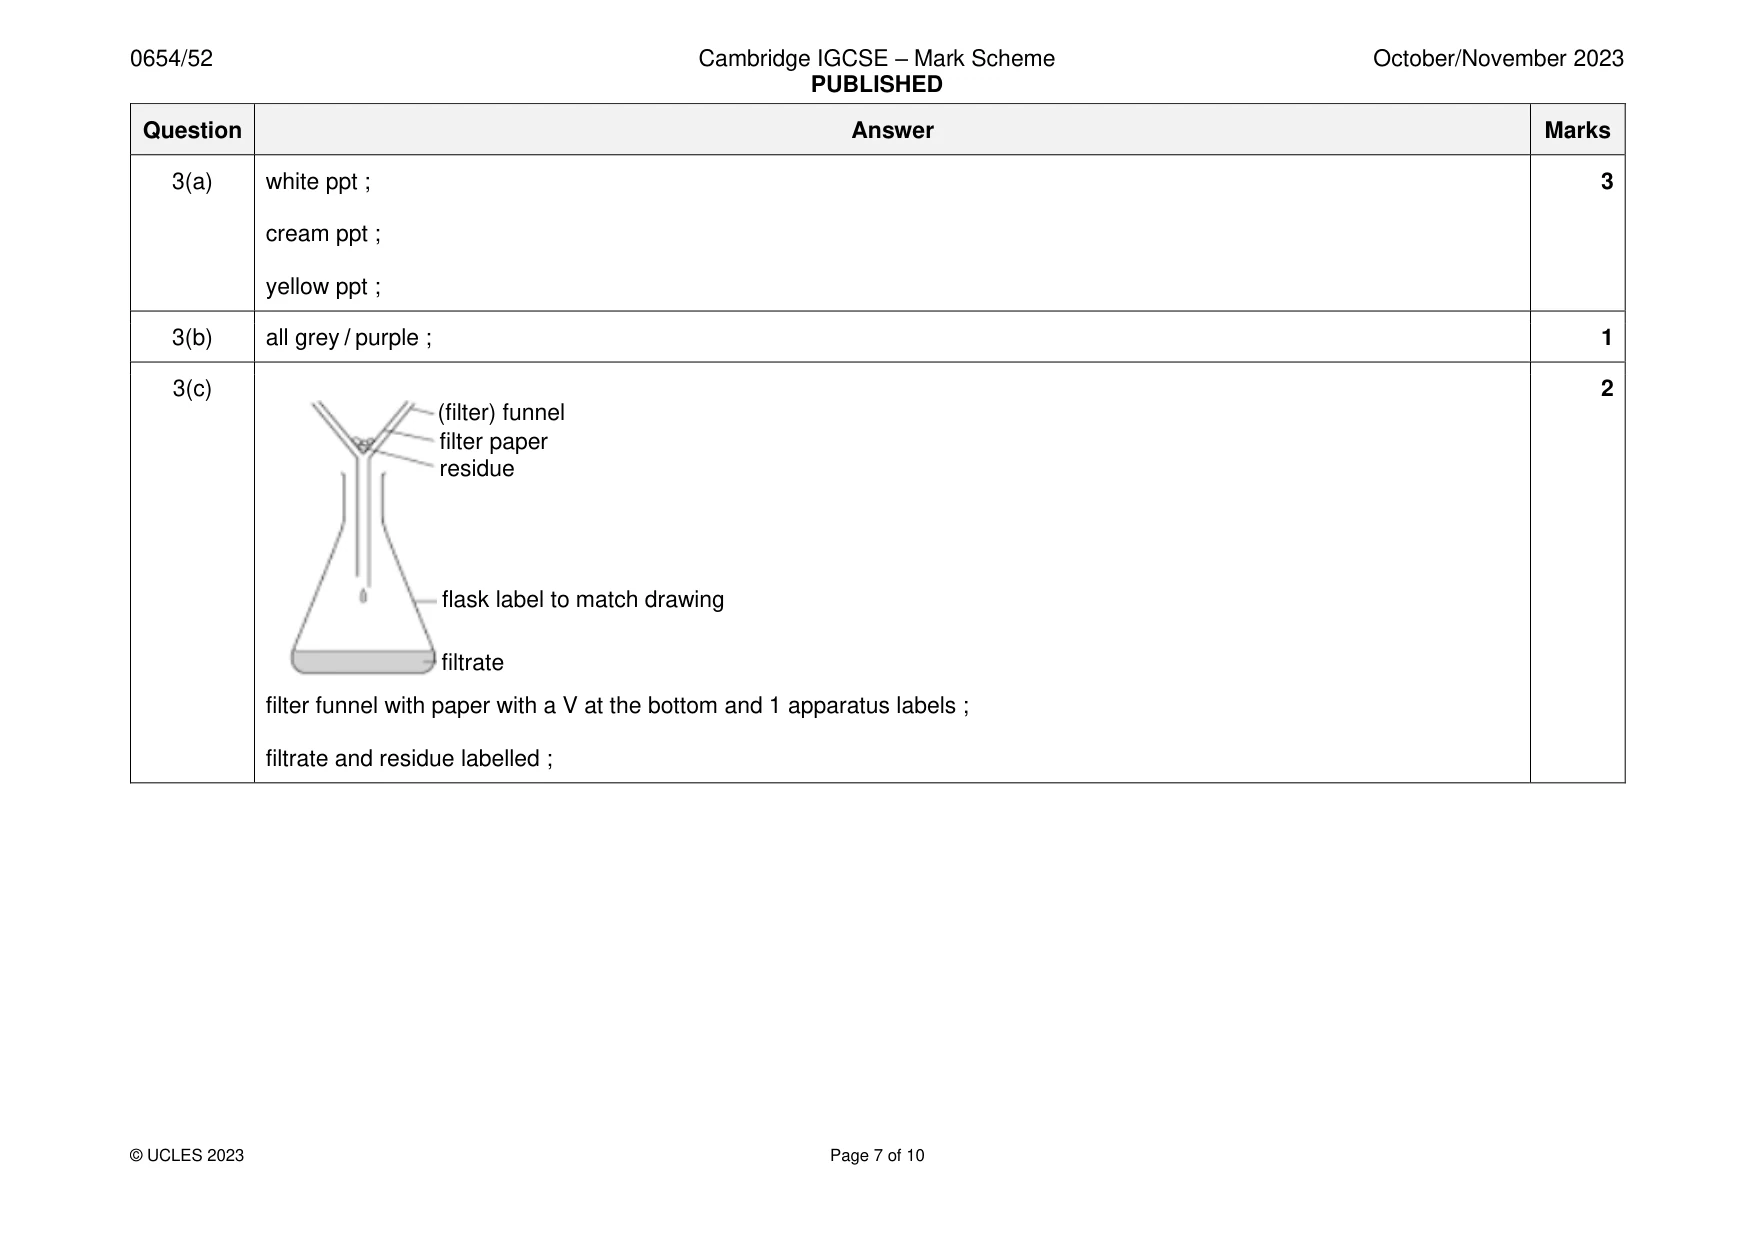
Mark scheme: 3(a) white ppt ; 3 cream ppt ; yellow ppt ; 3(b) all grey / purple ; 1 3(c) 2 (filter) funnel filter paper residue flask label to match drawing filtrate filter funnel with paper with a V at the bottom and 1 apparatus labels ; filtrate and residue labelled ;
Q4 · You are going to investigate the neutralisation of dilute hydrochloric acid with aqueous…
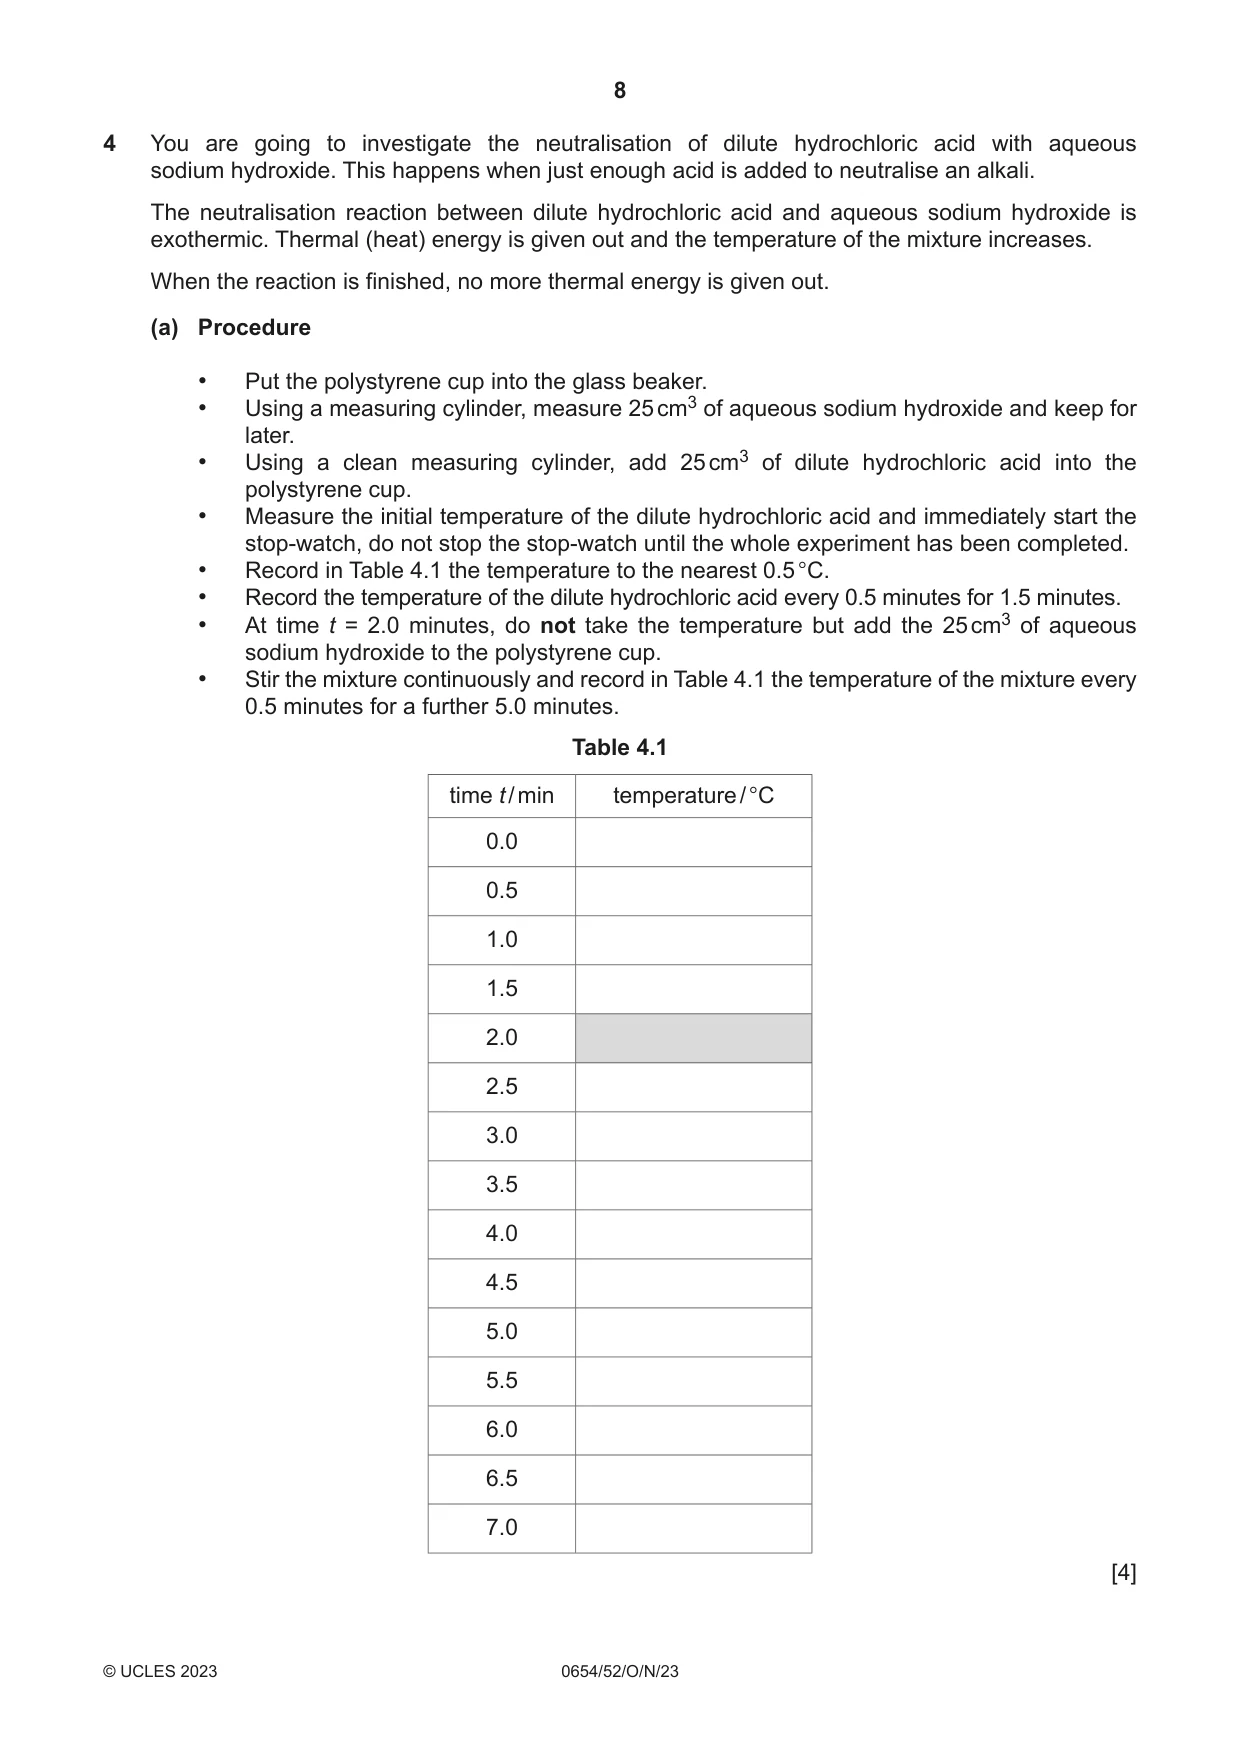
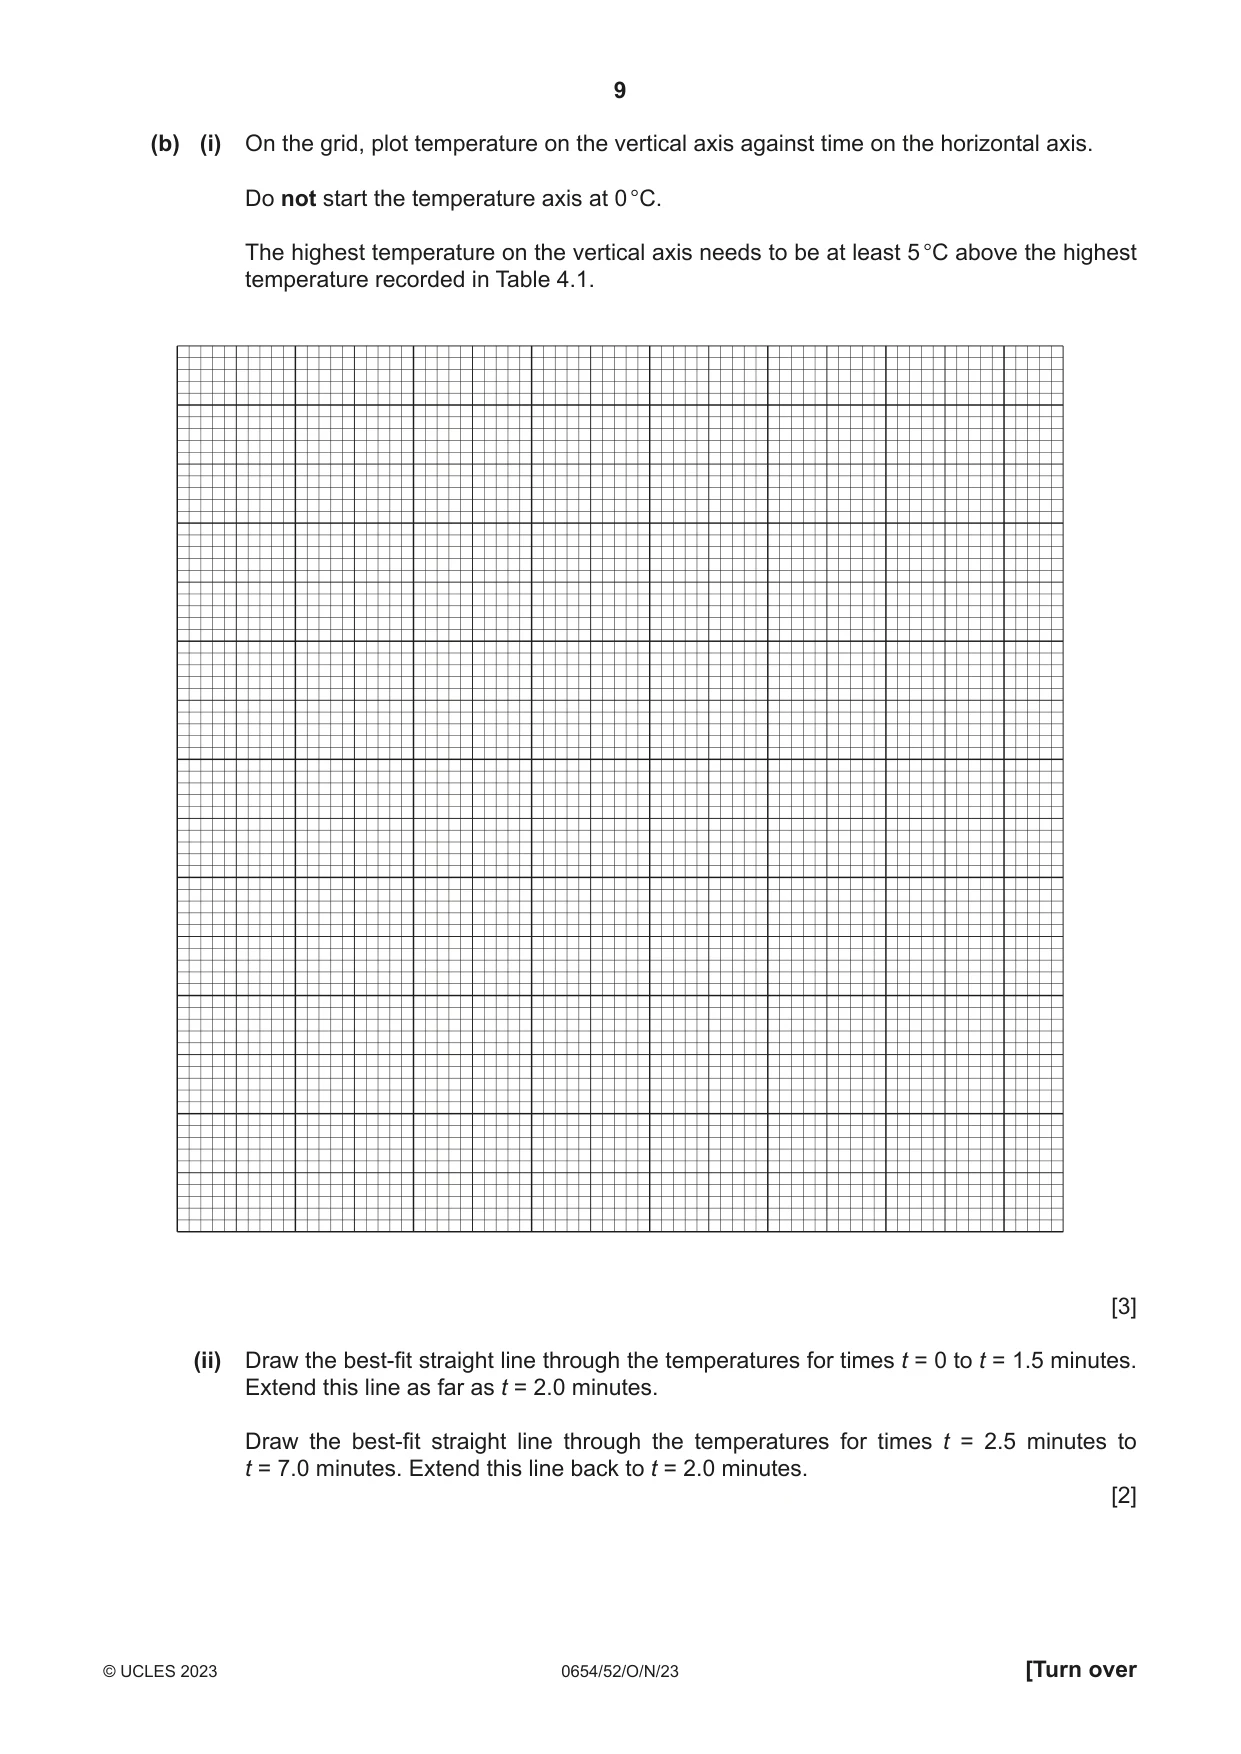
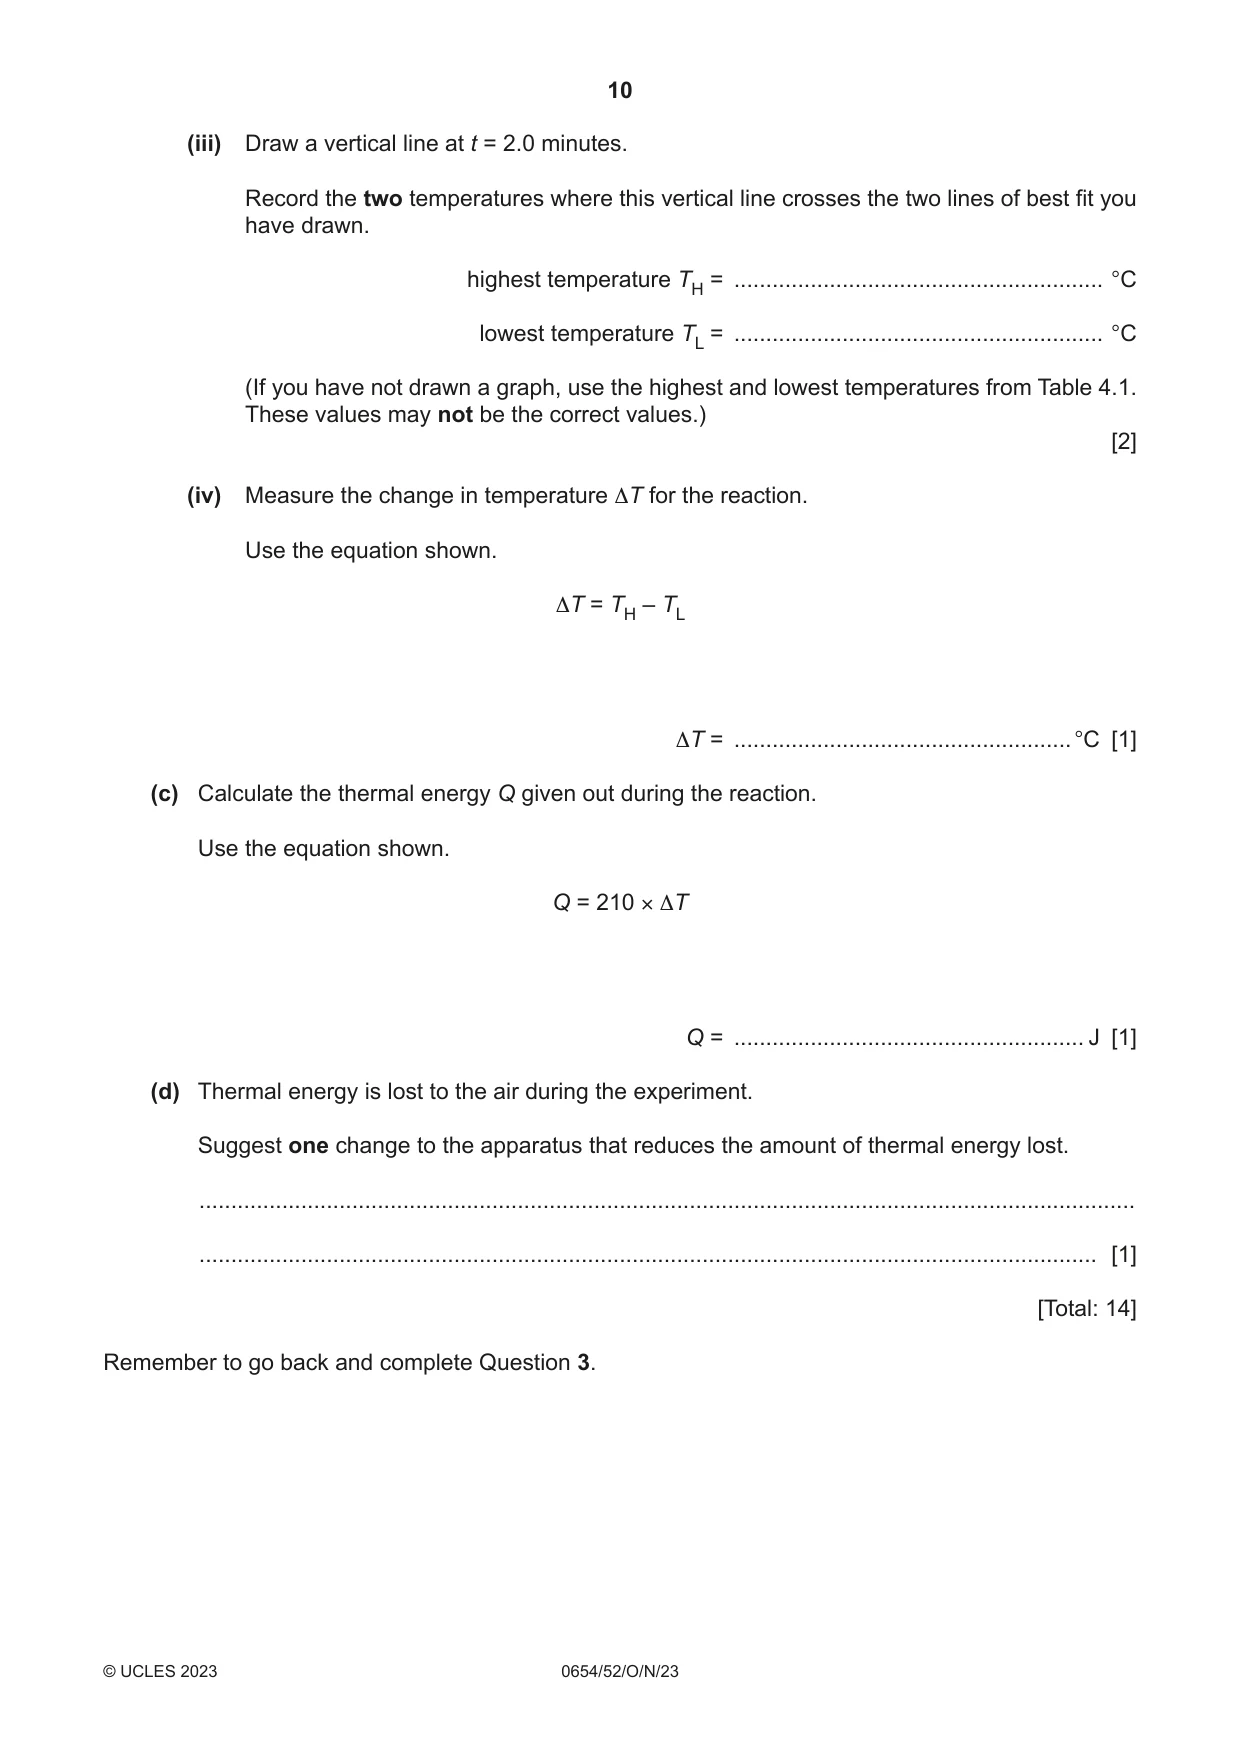
4 You are going to investigate the neutralisation of dilute hydrochloric acid with aqueous sodium hydroxide. This happens when just enough acid is added to neutralise an alkali. The neutralisation reaction between dilute hydrochloric acid and aqueous sodium hydroxide is exothermic. Thermal (heat) energy is given out and the temperature of the mixture increases. When the reaction is finished, no more thermal energy is given out. (a) Procedure • Put the polystyrene cup into the glass beaker. • Using a measuring cylinder, measure 25 cm3 of aqueous sodium hydroxide and keep for later. • Using a clean measuring cylinder, add 25 cm3 of dilute hydrochloric acid into the polystyrene cup. • Measure the initial temperature of the dilute hydrochloric acid and immediately start the stop‑watch, do not stop the stop‑watch until the whole experiment has been completed. • Record in Table 4.1 the temperature to the nearest 0.5 °C. • Record the temperature of the dilute hydrochloric acid every 0.5 minutes for 1.5 minutes. • At time t = 2.0 minutes, do not take the temperature but add the 25 cm3 of aqueous sodium hydroxide to the polystyrene cup. • Stir the mixture continuously and record in Table 4.1 the temperature of the mixture every 0.5 minutes for a further 5.0 minutes. Table 4.1 time t / min temperature / °C 0.0 0.5 1.0 1.5 2.0 2.5 3.0 3.5 4.0 4.5 5.0 5.5 6.0 6.5 7.0 [4] (b) (i) On the grid, plot temperature on the vertical axis against time on the horizontal axis. Do not start the temperature axis at 0 °C. The highest temperature on the vertical axis needs to be at least 5 °C above the highest temperature recorded in Table 4.1. [3] (ii) Draw the best‑fit straight line through the temperatures for times t = 0 to t = 1.5 minutes. Extend this line as far as t = 2.0 minutes. Draw the best‑fit straight line through the temperatures for times t = 2.5 minutes to t = 7.0 minutes. Extend this line back to t = 2.0 minutes. [2] (iii) Draw a vertical line at t = 2.0 minutes. Record the two temperatures where this vertical line crosses the two lines of best fit you have drawn. highest temperature TH = .......................................................... °C lowest temperature TL = .......................................................... °C (If you have not drawn a graph, use the highest and lowest temperatures from Table 4.1. These values may not be the correct values.) [2] (iv) Measure the change in temperature ΔT for the reaction. Use the equation shown. ΔT = TH – TL ΔT = ..................................................... °C [1] (c) Calculate the thermal energy Q given out during the reaction. Use the equation shown. Q = 210 × ΔT Q = ....................................................... J [1] (d) Thermal energy is lost to the air during the experiment. Suggest one change to the apparatus that reduces the amount of thermal energy lost. ................................................................................................................................................... ............................................................................................................................................. [1] [Total: 14] Remember to go back and complete Question 3.
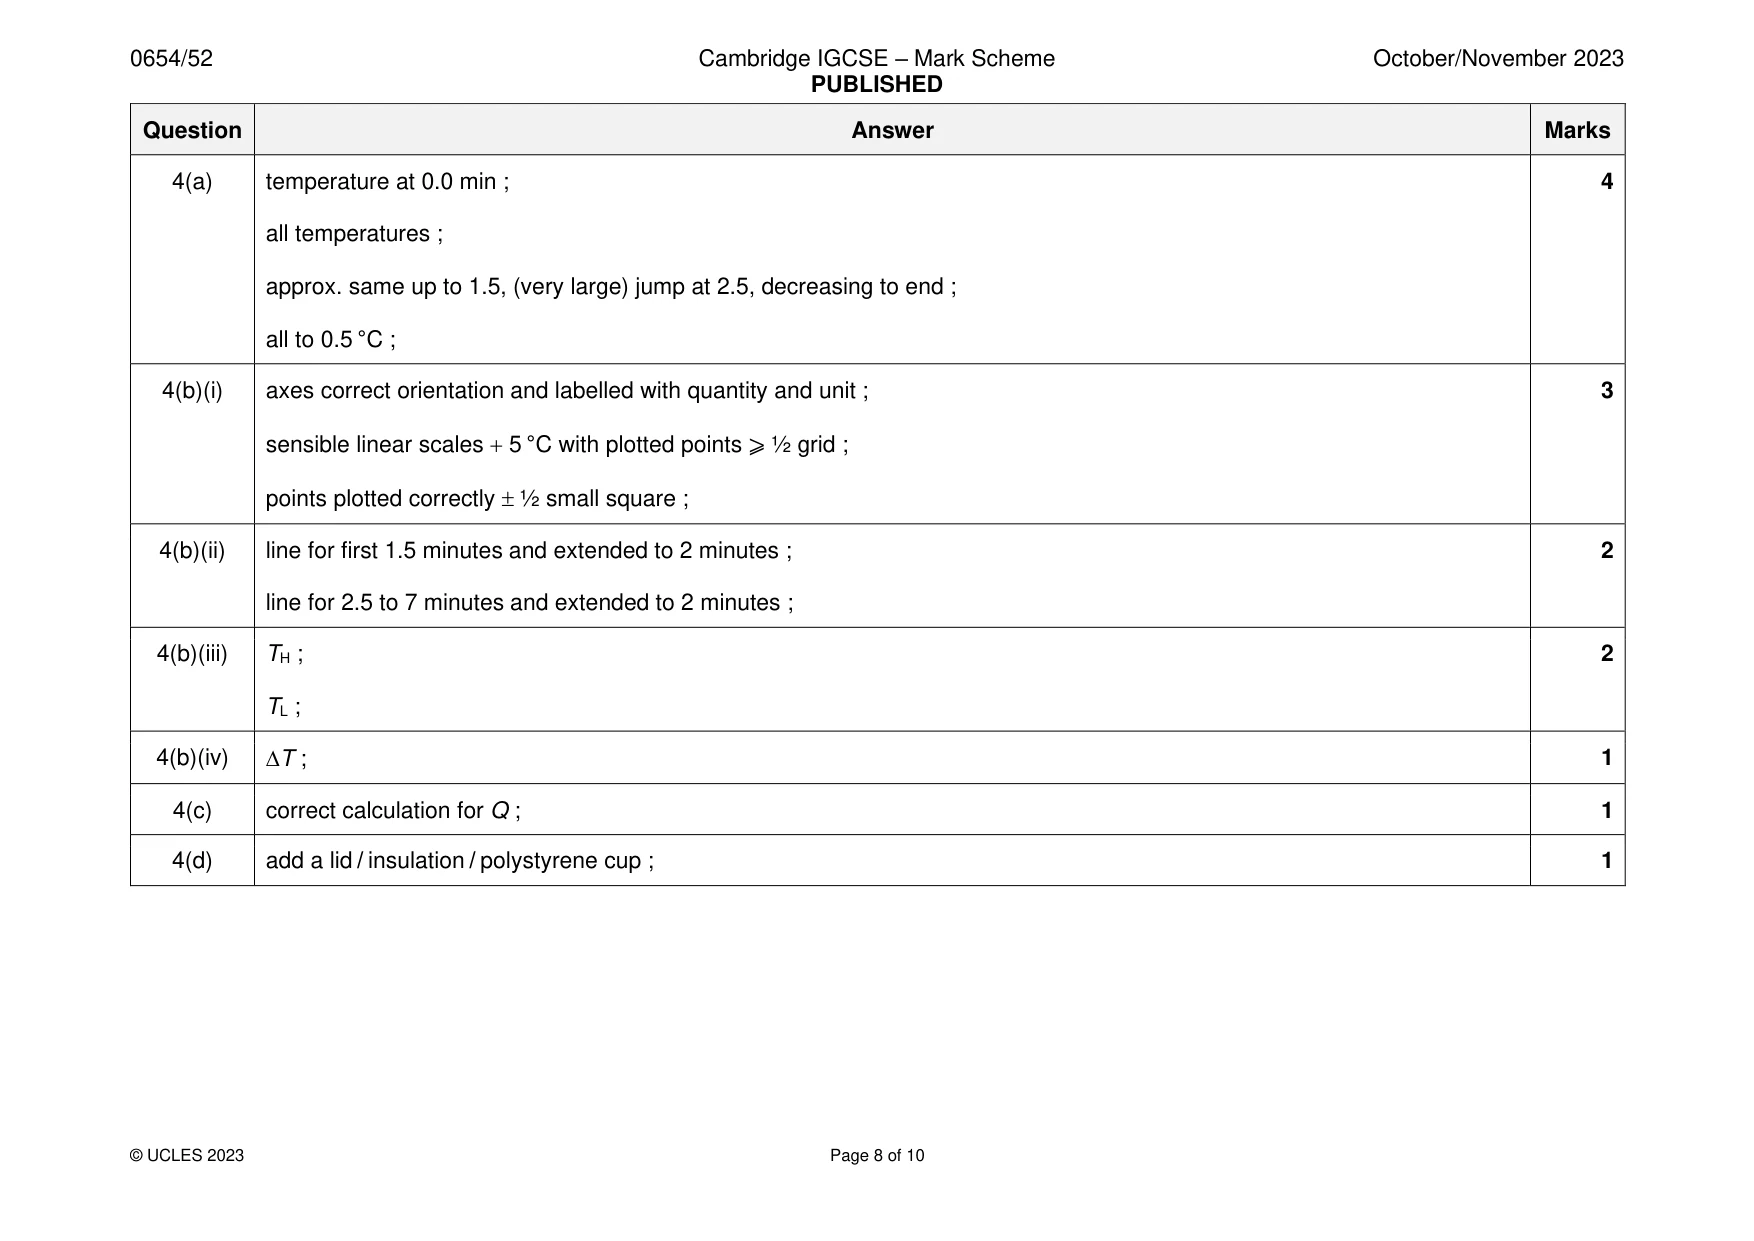
Mark scheme: 4(a) temperature at 0.0 min ; 4 all temperatures ; approx. same up to 1.5, (very large) jump at 2.5, decreasing to end ; all to 0.5 °C ; 4(b)(i) axes correct orientation and labelled with quantity and unit ; 3 sensible linear scales + 5 °C with plotted points ⩾ ½ grid ; points plotted correctly ½ small square ; 4(b)(ii) line for first 1.5 minutes and extended to 2 minutes ; 2 line for 2.5 to 7 minutes and extended to 2 minutes ; 4(b)(iii) TH ; 2 TL ; 4(b)(iv) T ; 1 4(c) correct calculation for Q ; 1 4(d) add a lid / insulation / polystyrene cup ; 1
Q5 · You are going to investigate the resistance of different lamp combinations
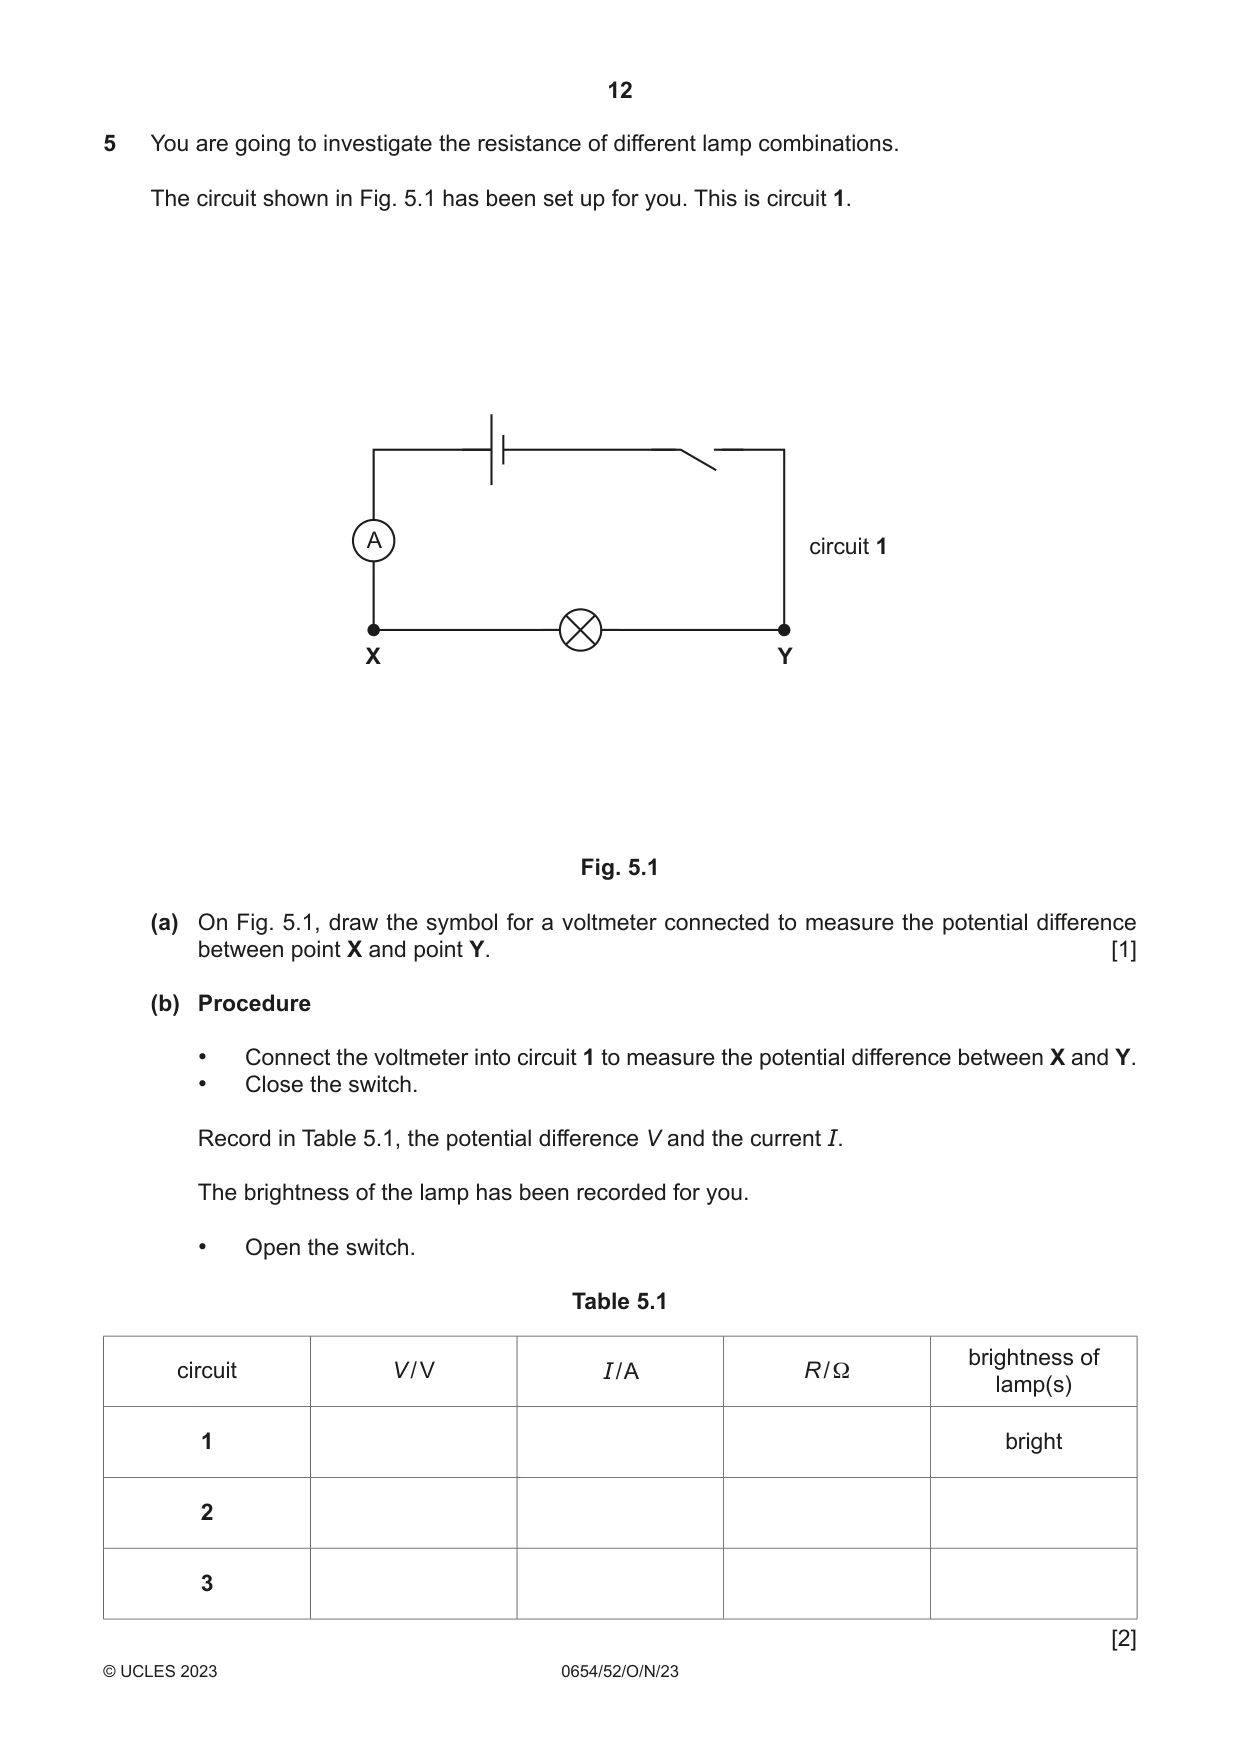
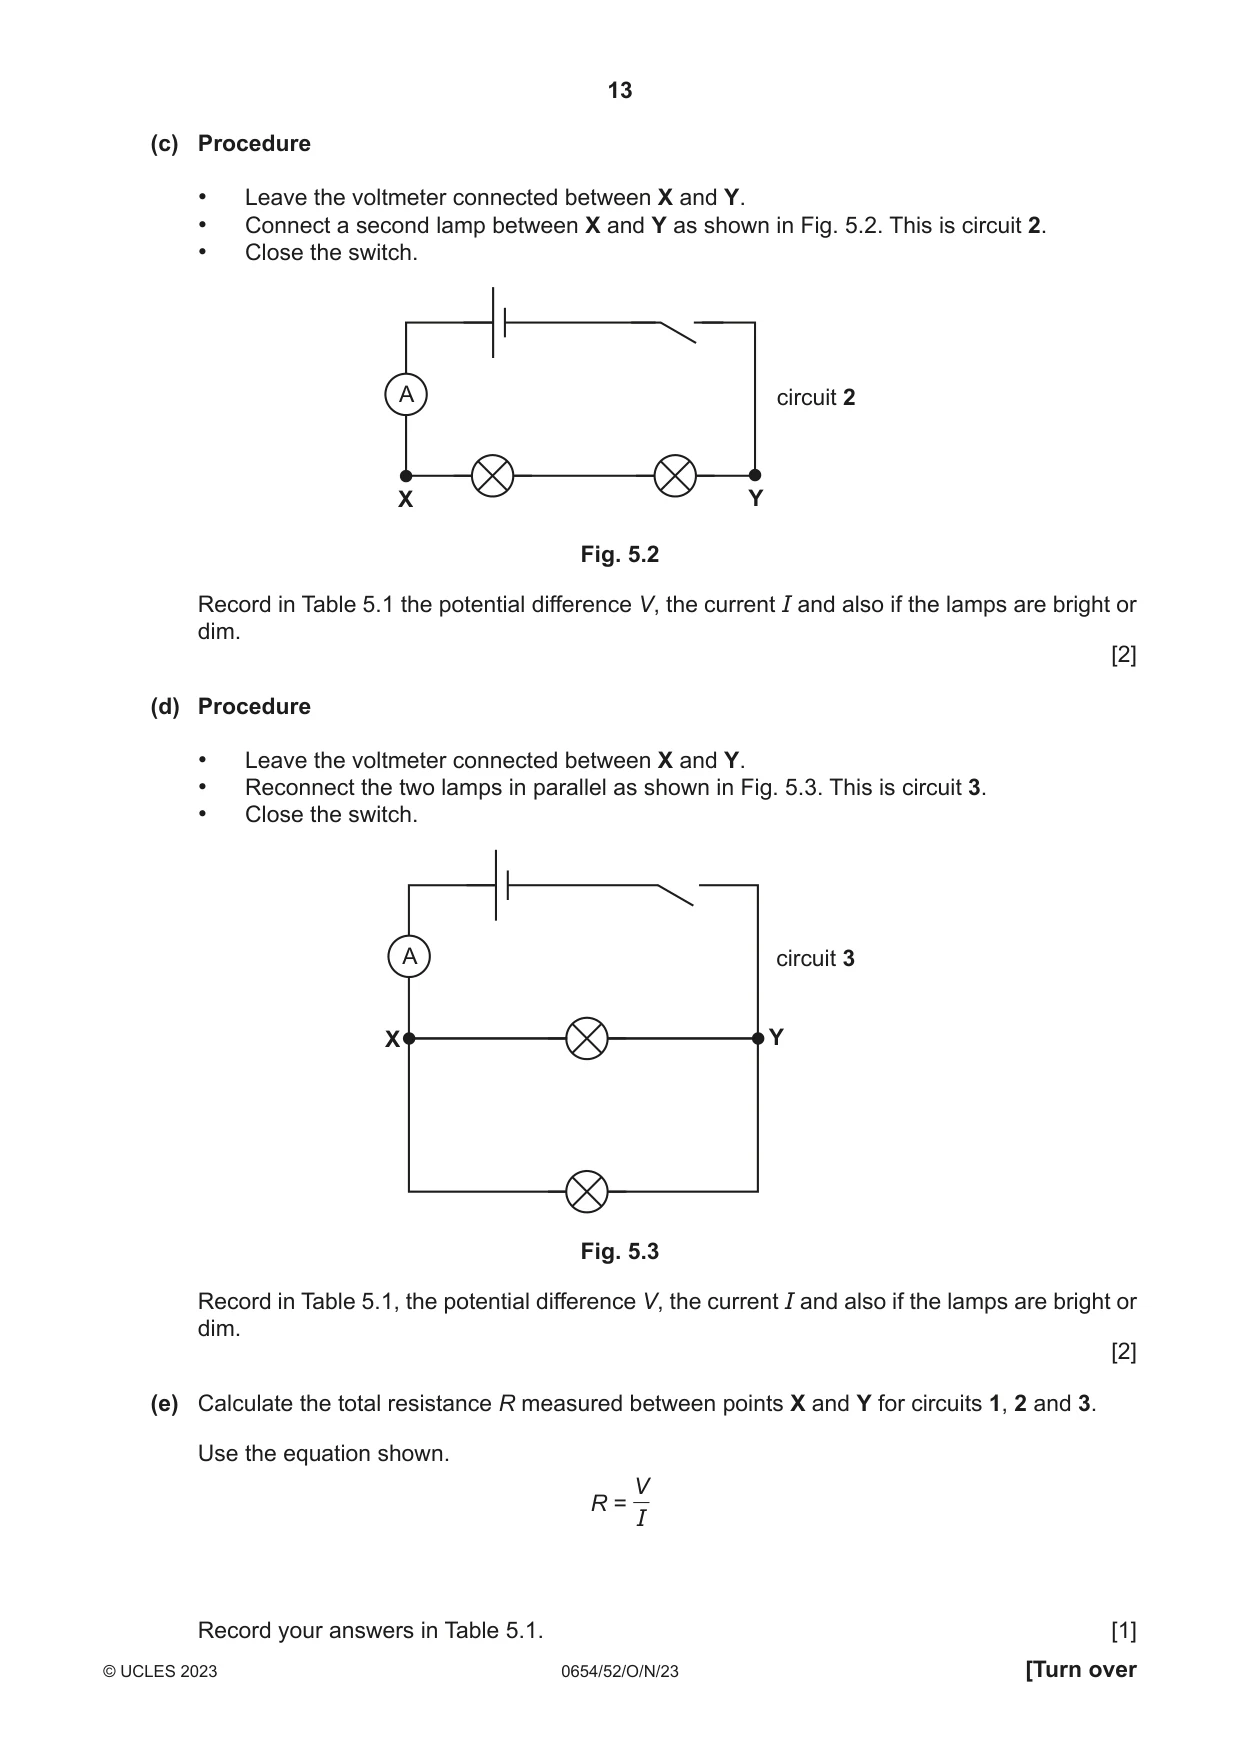
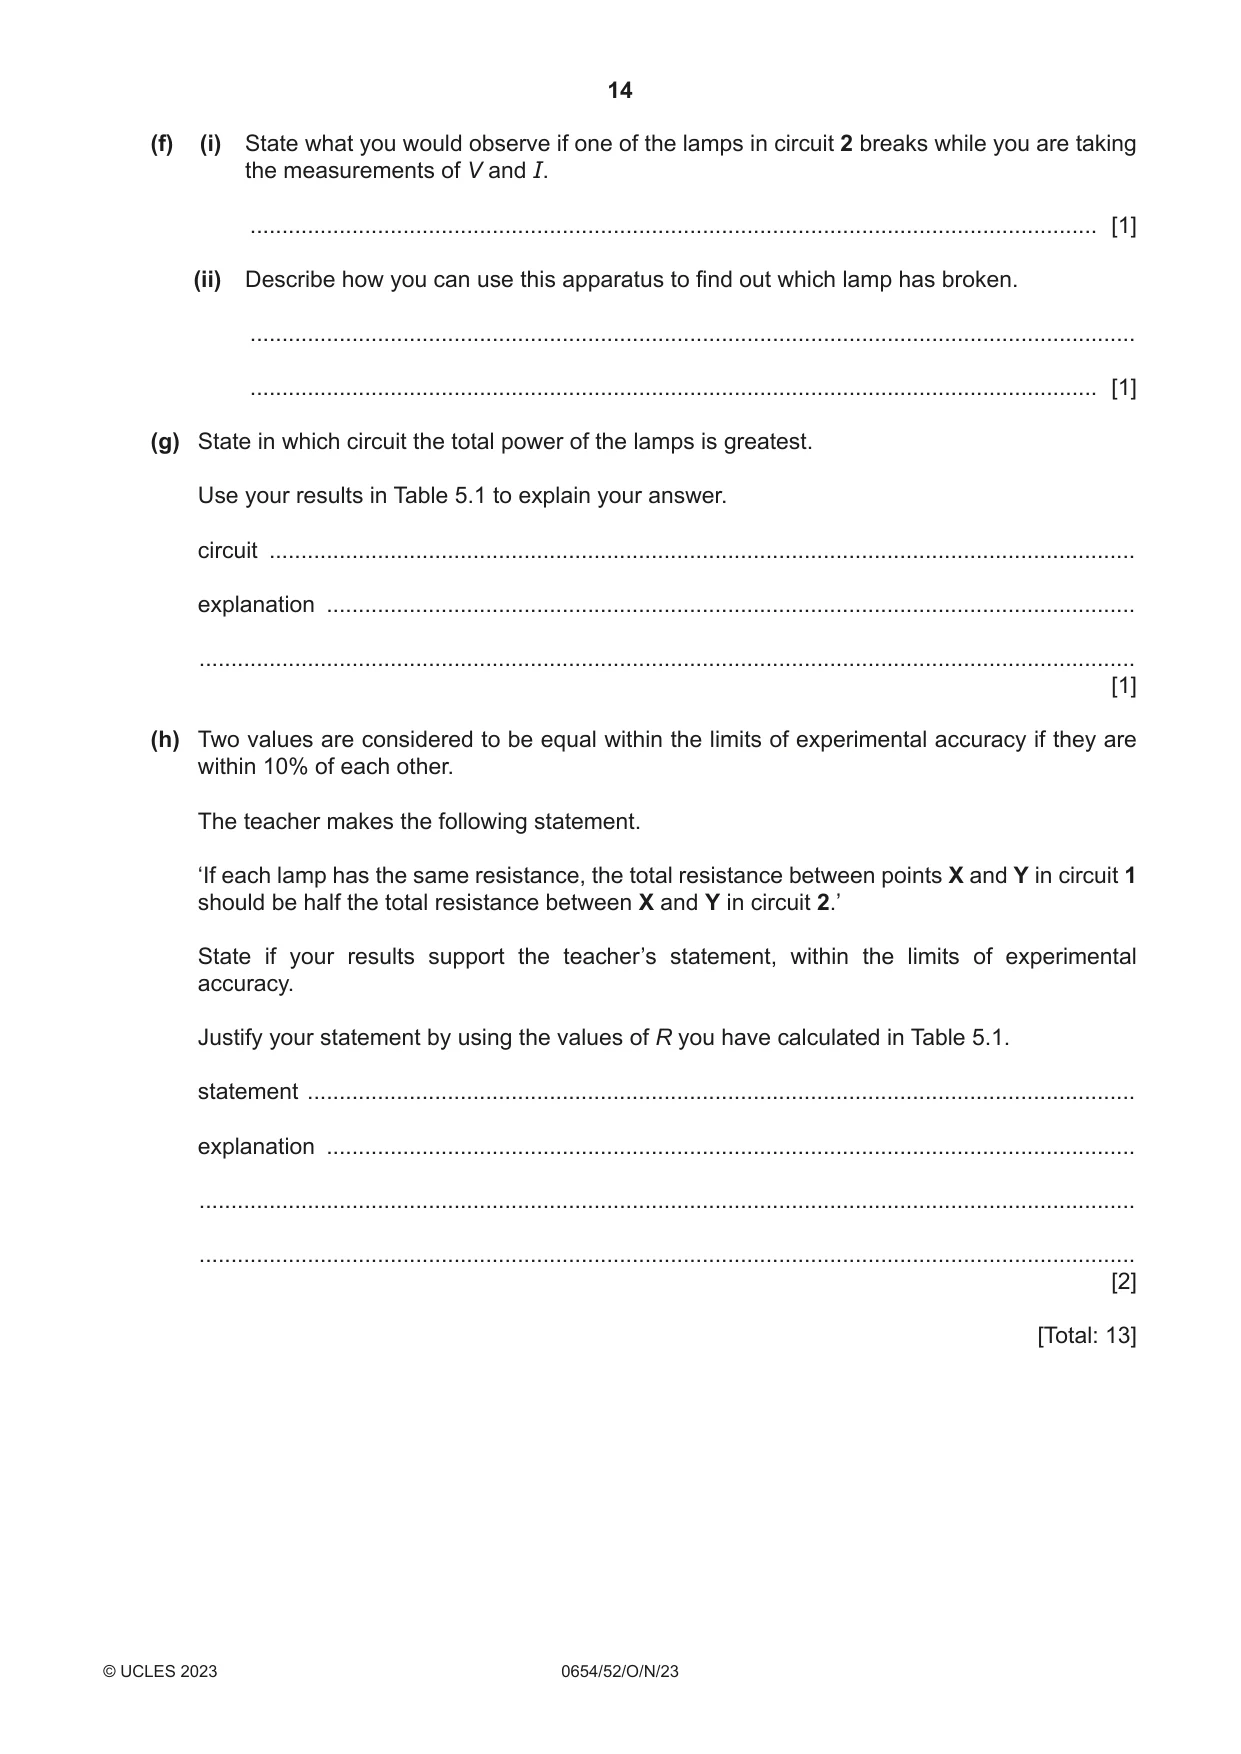
5 You are going to investigate the resistance of different lamp combinations. The circuit shown in Fig. 5.1 has been set up for you. This is circuit 1. A circuit 1 X Y Fig. 5.1 (a) On Fig. 5.1, draw the symbol for a voltmeter connected to measure the potential difference between point X and point Y. [1] (b) Procedure • Connect the voltmeter into circuit 1 to measure the potential difference between X and Y. • Close the switch. Record in Table 5.1, the potential difference V and the current I. The brightness of the lamp has been recorded for you. • Open the switch. Table 5.1 brightness of circuit V / V I / A R / Ω lamp(s) 1 bright 2 3 [2] (c) Procedure • Leave the voltmeter connected between X and Y. • Connect a second lamp between X and Y as shown in Fig. 5.2. This is circuit 2. • Close the switch. A circuit 2 X Y Fig. 5.2 Record in Table 5.1 the potential difference V, the current I and also if the lamps are bright or dim. [2] (d) Procedure • Leave the voltmeter connected between X and Y. • Reconnect the two lamps in parallel as shown in Fig. 5.3. This is circuit 3. • Close the switch. A circuit 3 X Y Fig. 5.3 Record in Table 5.1, the potential difference V, the current I and also if the lamps are bright or dim. [2] (e) Calculate the total resistance R measured between points X and Y for circuits 1, 2 and 3. Use the equation shown. V R = I Record your answers in Table 5.1. [1] (f) (i) State what you would observe if one of the lamps in circuit 2 breaks while you are taking the measurements of V and I. ..................................................................................................................................... [1] (ii) Describe how you can use this apparatus to find out which lamp has broken. ........................................................................................................................................... ..................................................................................................................................... [1] (g) State in which circuit the total power of the lamps is greatest. Use your results in Table 5.1 to explain your answer. circuit ........................................................................................................................................ explanation ............................................................................................................................... ................................................................................................................................................... [1] (h) Two values are considered to be equal within the limits of experimental accuracy if they are within 10% of each other. The teacher makes the following statement. ‘If each lamp has the same resistance, the total resistance between points X and Y in circuit 1 should be half the total resistance between X and Y in circuit 2.’ State if your results support the teacher’s statement, within the limits of experimental accuracy. Justify your statement by using the values of R you have calculated in Table 5.1. statement .................................................................................................................................. explanation ............................................................................................................................... ................................................................................................................................................... ................................................................................................................................................... [2] [Total: 13]
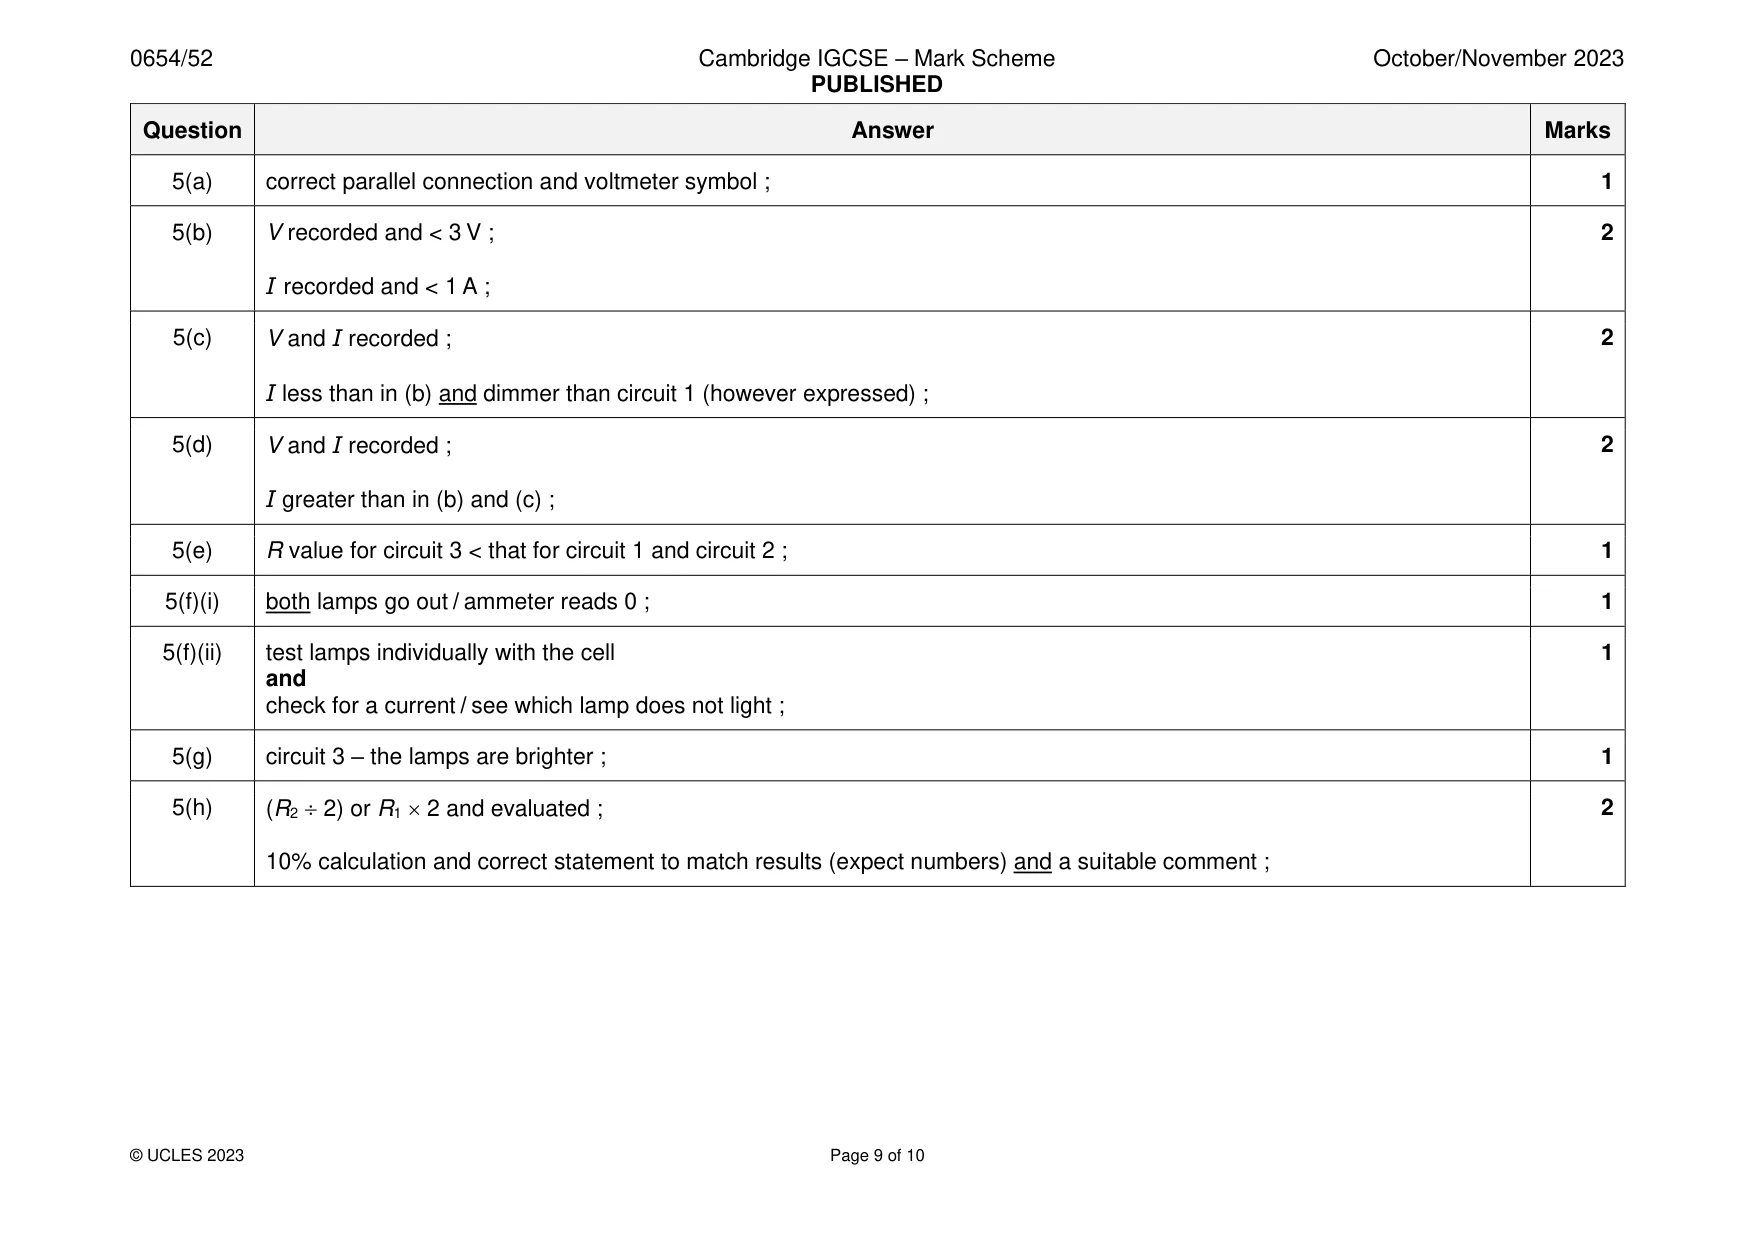
Mark scheme: 5(a) correct parallel connection and voltmeter symbol ; 1 5(b) V recorded and < 3 V ; 2 I recorded and < 1 A ; 5(c) V and I recorded ; 2 I less than in (b) and dimmer than circuit 1 (however expressed) ; 5(d) V and I recorded ; 2 I greater than in (b) and (c) ; 5(e) R value for circuit 3 < that for circuit 1 and circuit 2 ; 1 5(f)(i) both lamps go out / ammeter reads 0 ; 1 5(f)(ii) test lamps individually with the cell 1 and check for a current / see which lamp does not light ; 5(g) circuit 3 – the lamps are brighter ; 1 5(h) (R2 2) or R1 2 and evaluated ; 2 10% calculation and correct statement to match results (expect numbers) and a suitable comment ;
Q6 · Plan an experiment to investigate whether the material a wire is made from, affects the…
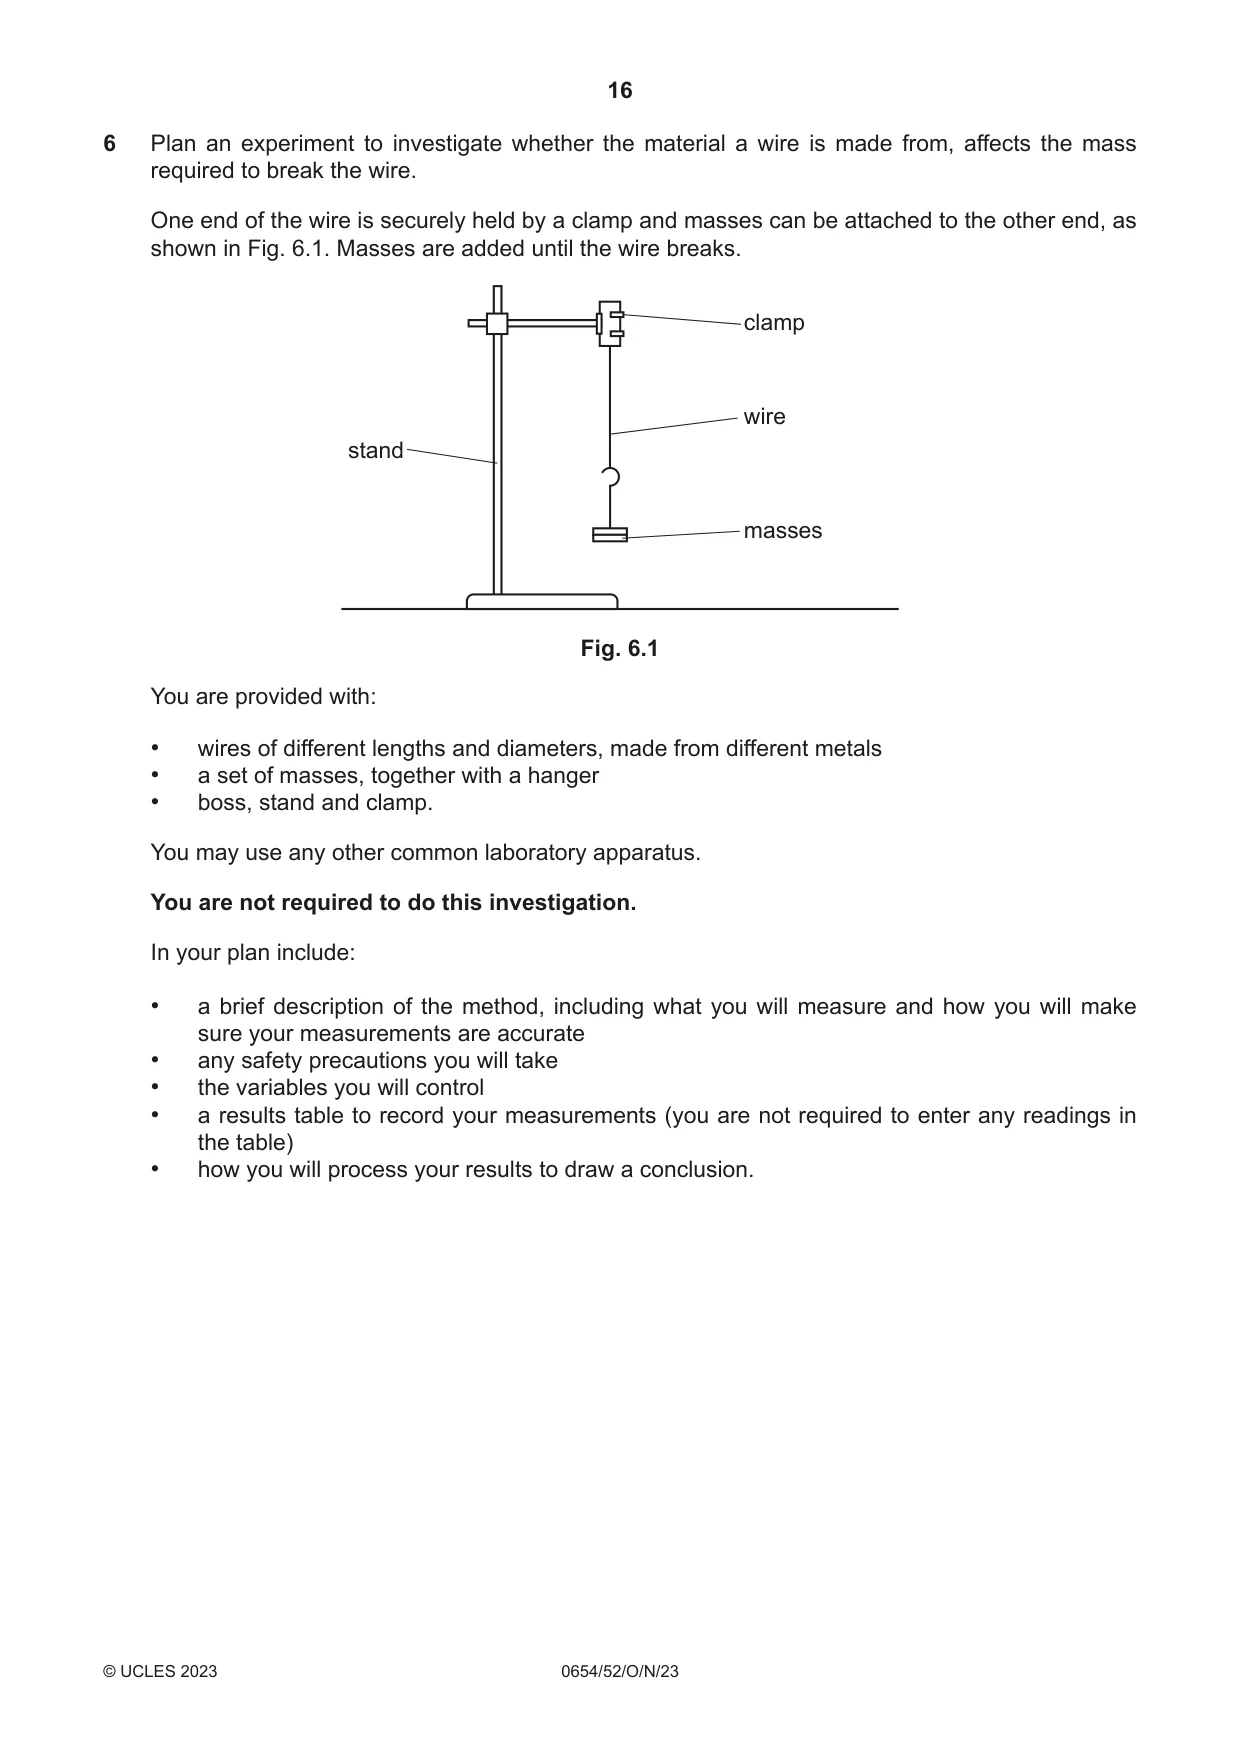
6 Plan an experiment to investigate whether the material a wire is made from, affects the mass required to break the wire. One end of the wire is securely held by a clamp and masses can be attached to the other end, as shown in Fig. 6.1. Masses are added until the wire breaks. clamp wire stand masses Fig. 6.1 You are provided with: • wires of different lengths and diameters, made from different metals • a set of masses, together with a hanger • boss, stand and clamp. You may use any other common laboratory apparatus. You are not required to do this investigation. In your plan include: • a brief description of the method, including what you will measure and how you will make sure your measurements are accurate • any safety precautions you will take • the variables you will control • a results table to record your measurements (you are not required to enter any readings in the table) • how you will process your results to draw a conclusion. .......................................................................................................................................................... .......................................................................................................................................................... .......................................................................................................................................................... .......................................................................................................................................................... .......................................................................................................................................................... .......................................................................................................................................................... .......................................................................................................................................................... .......................................................................................................................................................... .......................................................................................................................................................... .......................................................................................................................................................... .......................................................................................................................................................... .......................................................................................................................................................... .......................................................................................................................................................... .......................................................................................................................................................... .......................................................................................................................................................... .......................................................................................................................................................... .......................................................................................................................................................... .......................................................................................................................................................... .......................................................................................................................................................... .......................................................................................................................................................... .......................................................................................................................................................... .......................................................................................................................................................... .......................................................................................................................................................... .......................................................................................................................................................... .......................................................................................................................................................... .......................................................................................................................................................... ..........................................................................................................................................................
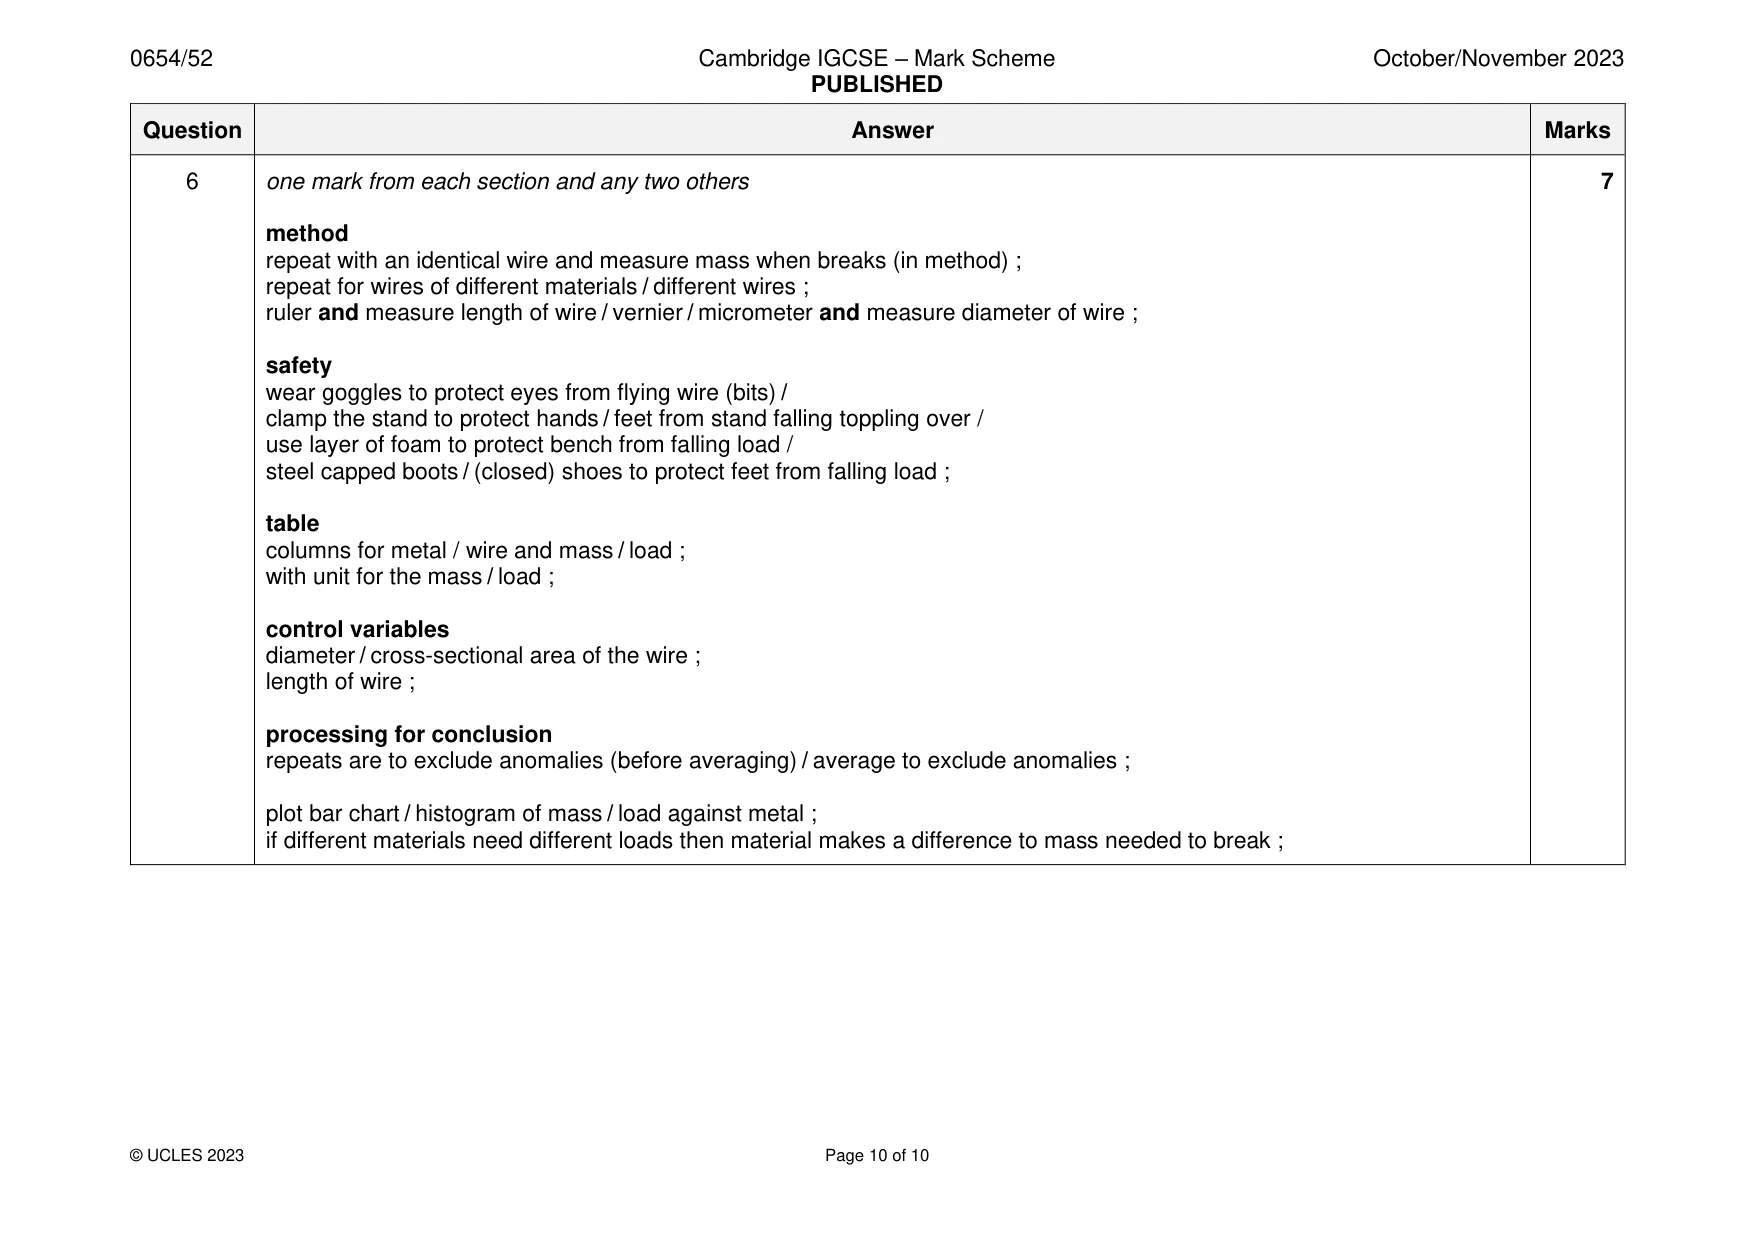
Mark scheme: Question Answer Marks 6 one mark from each section and any two others 7 method repeat with an identical wire and measure mass when breaks (in method) ; repeat for wires of different materials / different wires ; ruler and measure length of wire / vernier / micrometer and measure diameter of wire ; safety wear goggles to protect eyes from flying wire (bits) / clamp the stand to protect hands / feet from stand falling toppling over / use layer of foam to protect bench from falling load / steel capped boots / (closed) shoes to protect feet from falling load ; table columns for metal / wire and mass / load ; with unit for the mass / load ; control variables diameter / cross-sectional area of the wire ; length of wire ; processing for conclusion repeats are to exclude anomalies (before averaging) / average to exclude anomalies ; plot bar chart / histogram of mass / load against metal ; if different materials need different loads then material makes a difference to mass needed to break ;
More questions on Physical quantities and measurement techniques
What was in this paper
The subtopics covered by these 6 questions, and how many questions each got. Open one in a new tab to see every Cambridge question on it.
What you needed in this session
Cambridge’s own grade thresholds for 2023 Oct/Nov, Paper 5 · Variant 2. A higher threshold means an easier paper — the bar moves with how the cohort did.