Cambridge IGCSE Sciences - Co-ordinated (Double) 0654 — 2022 Oct/Nov Paper 5 · Variant 1
0654/51/O/N/22 · 6 questions · 60 marks · ≈68 min
The question paper and its mark scheme, free to read here and free to download. This is Cambridge’s own paper, exactly as it was sat.
Question paper20 pages



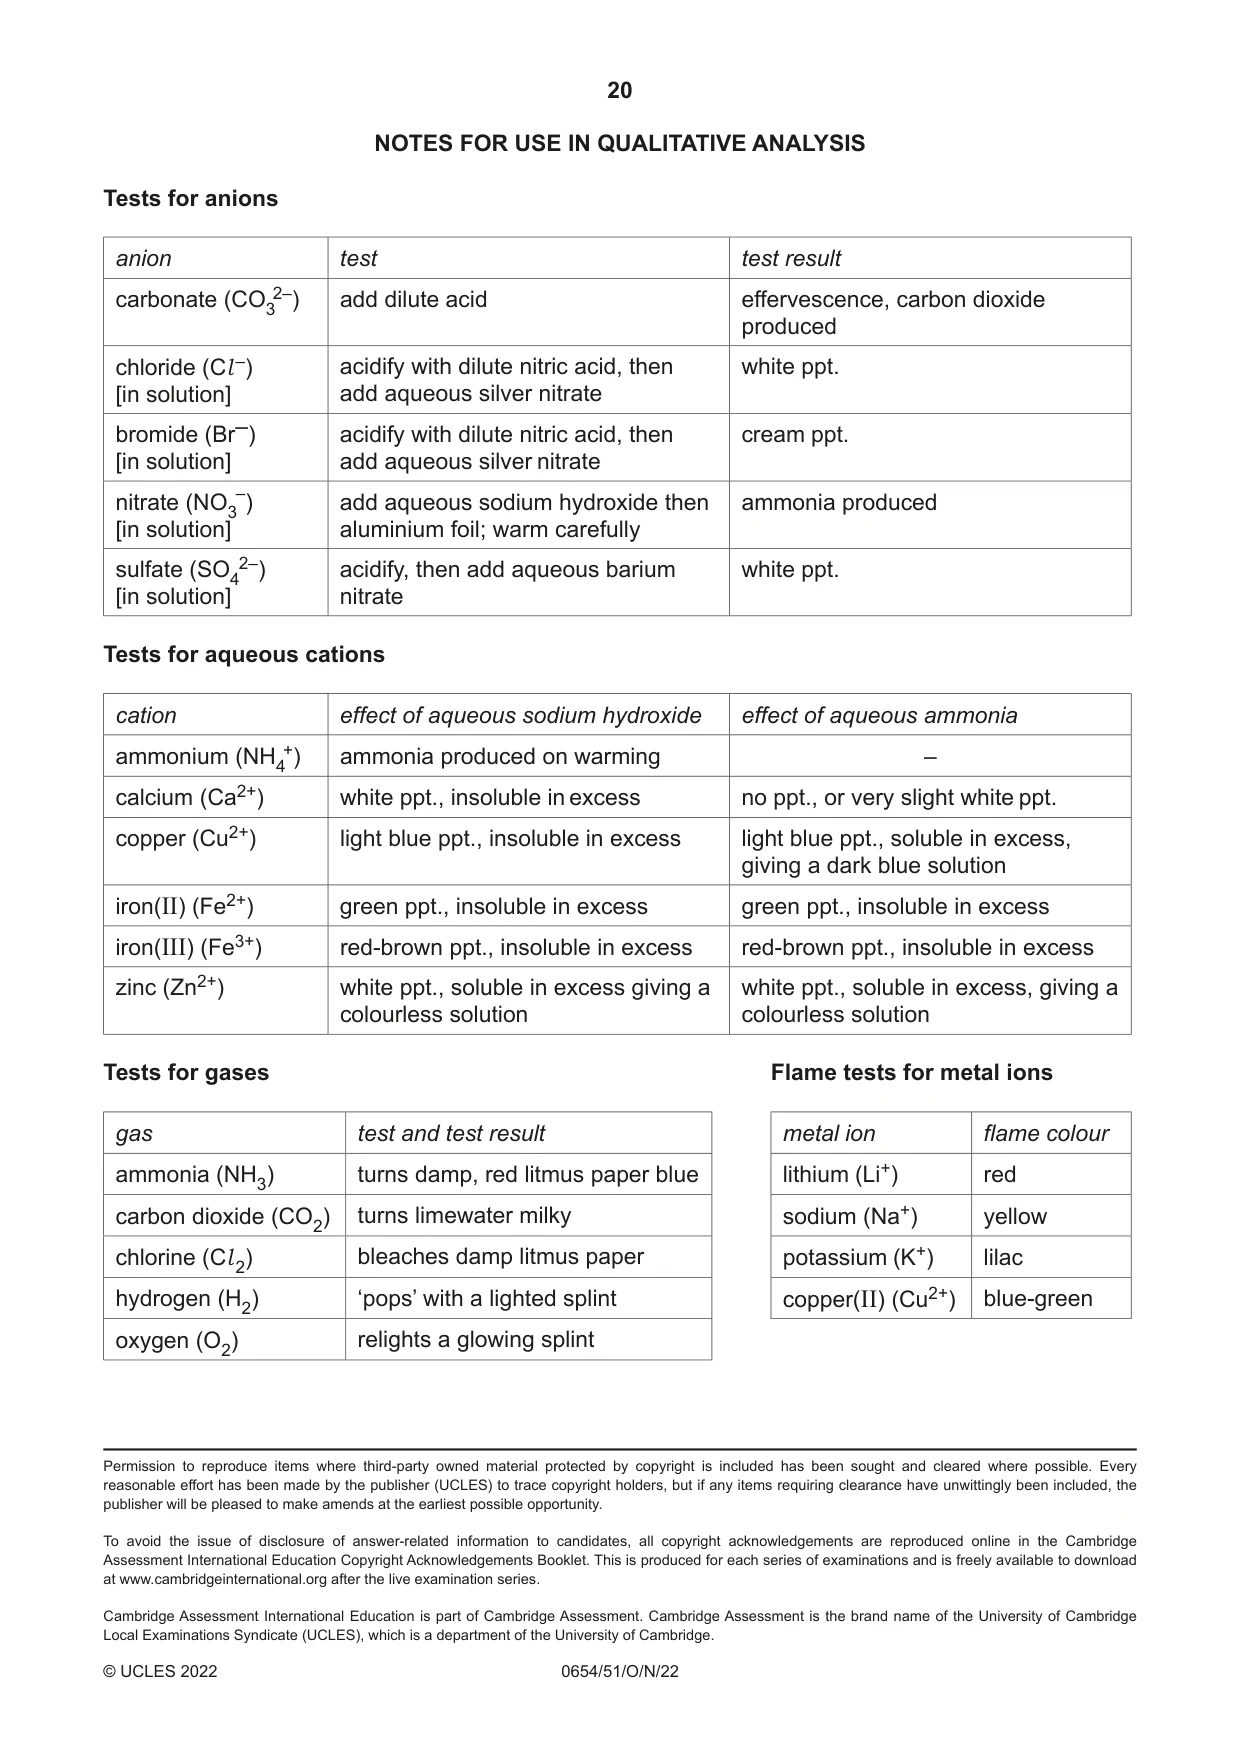
Mark scheme9 pages
Answers below. Sit the paper first if you are practising.
Questions as text
Q1 · You are going to investigate the effect of temperature on the release of a red pigment…
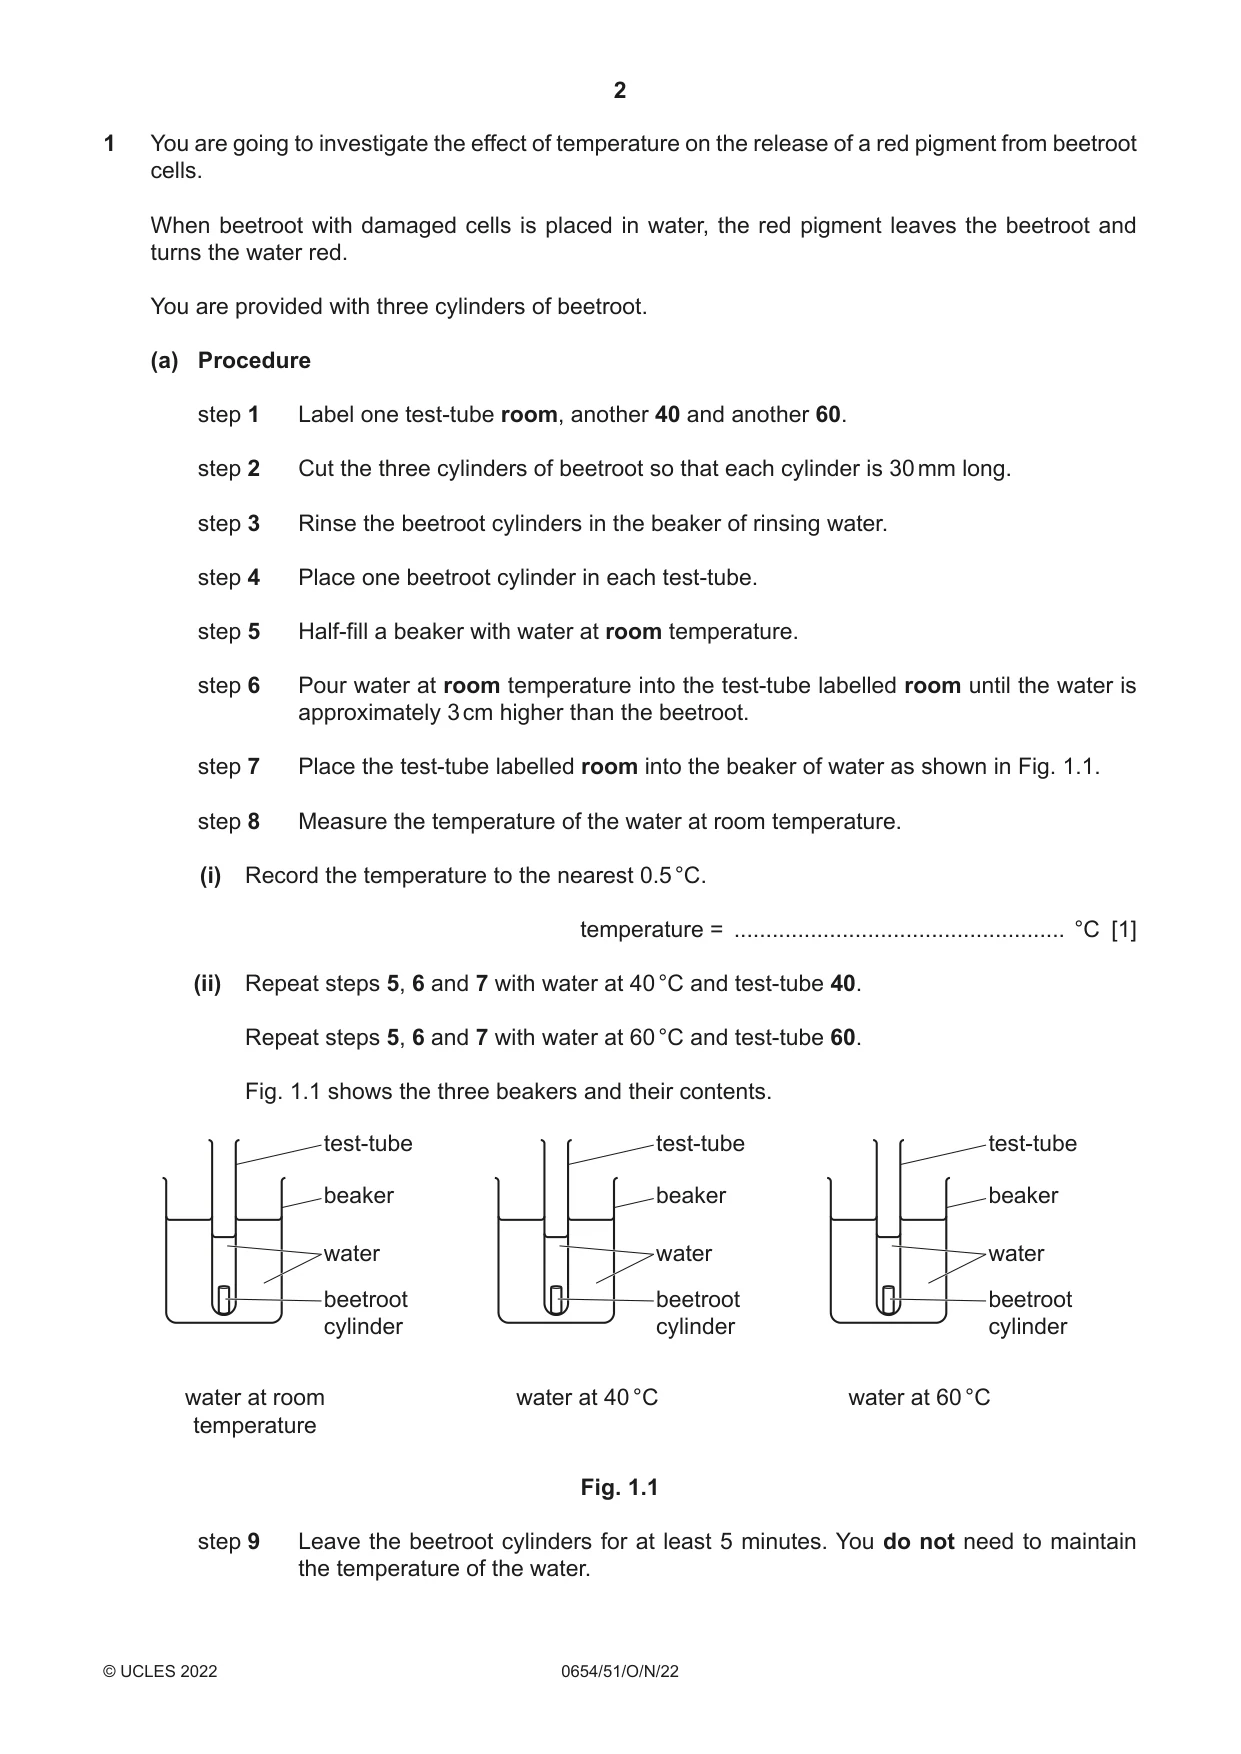
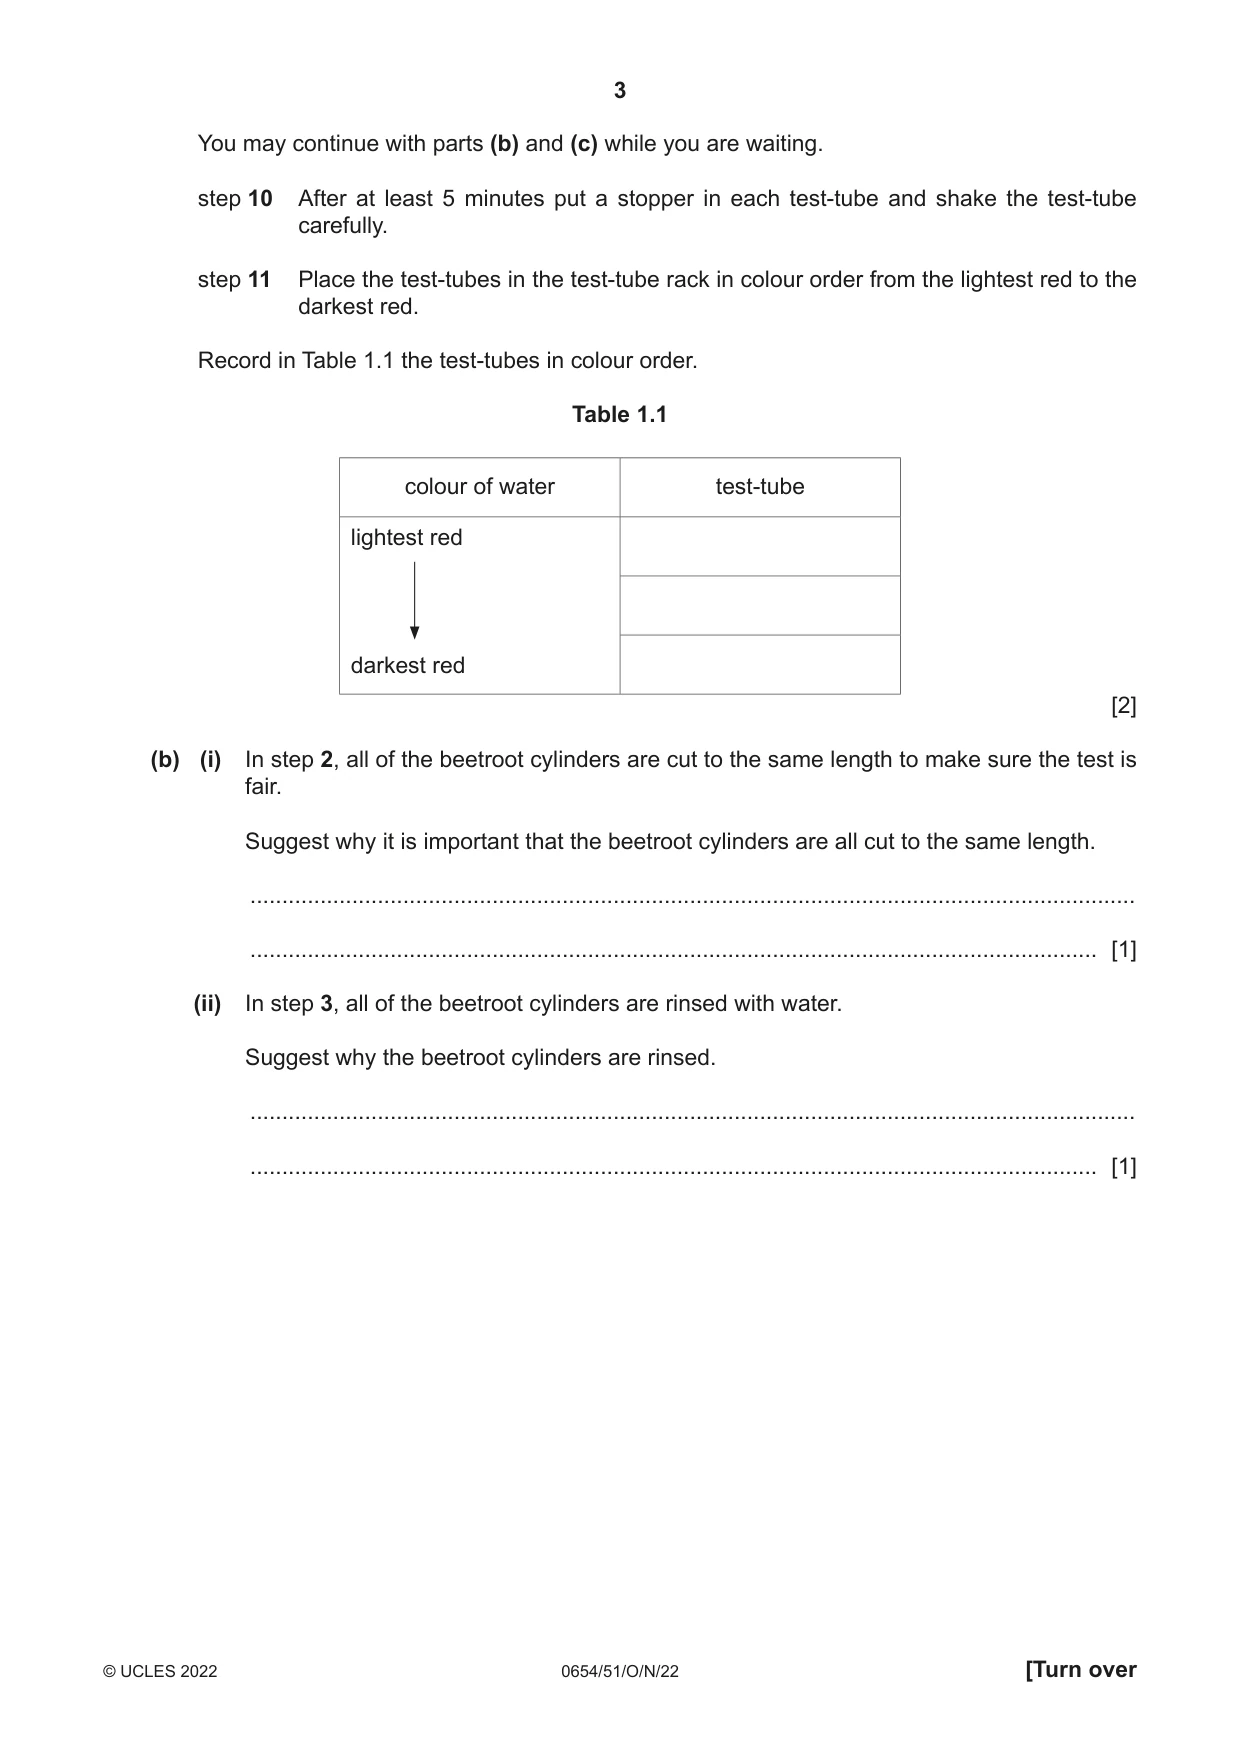
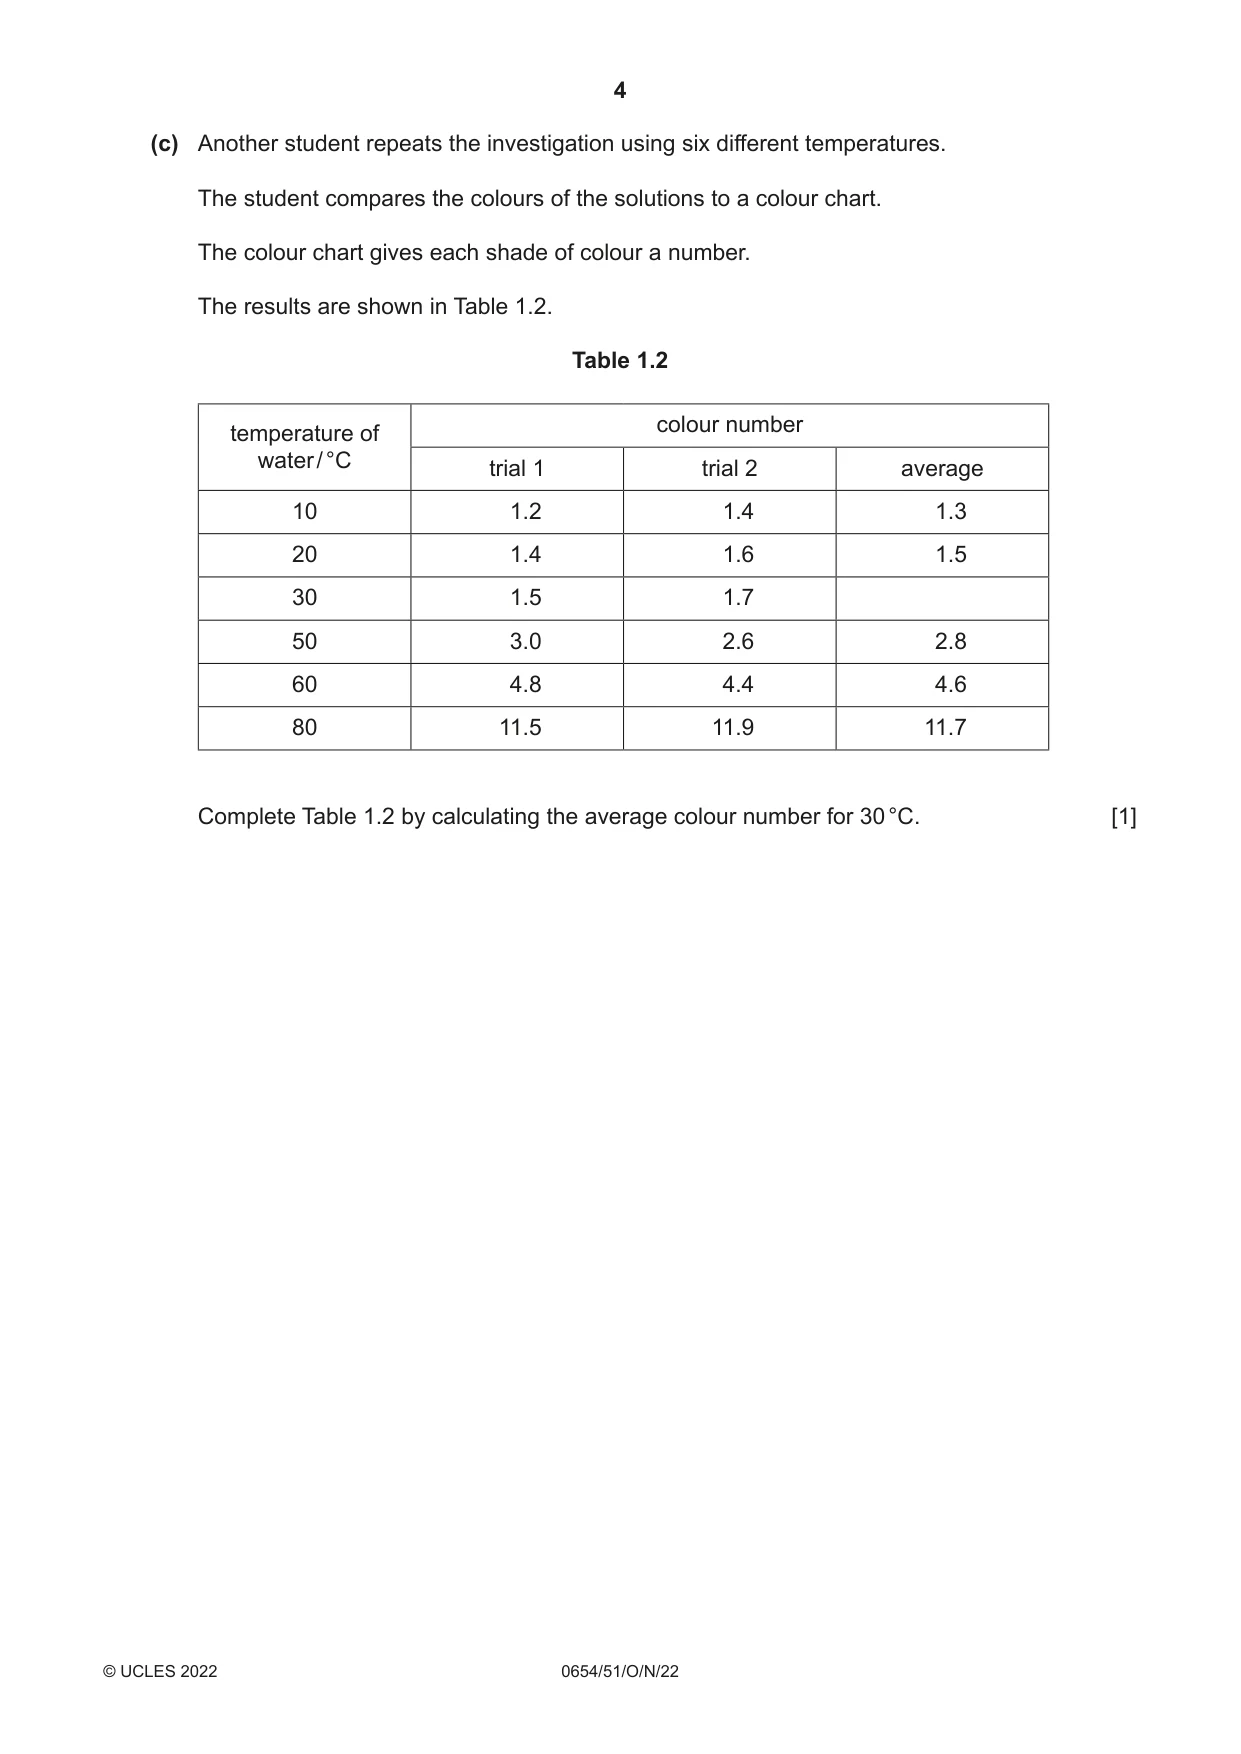
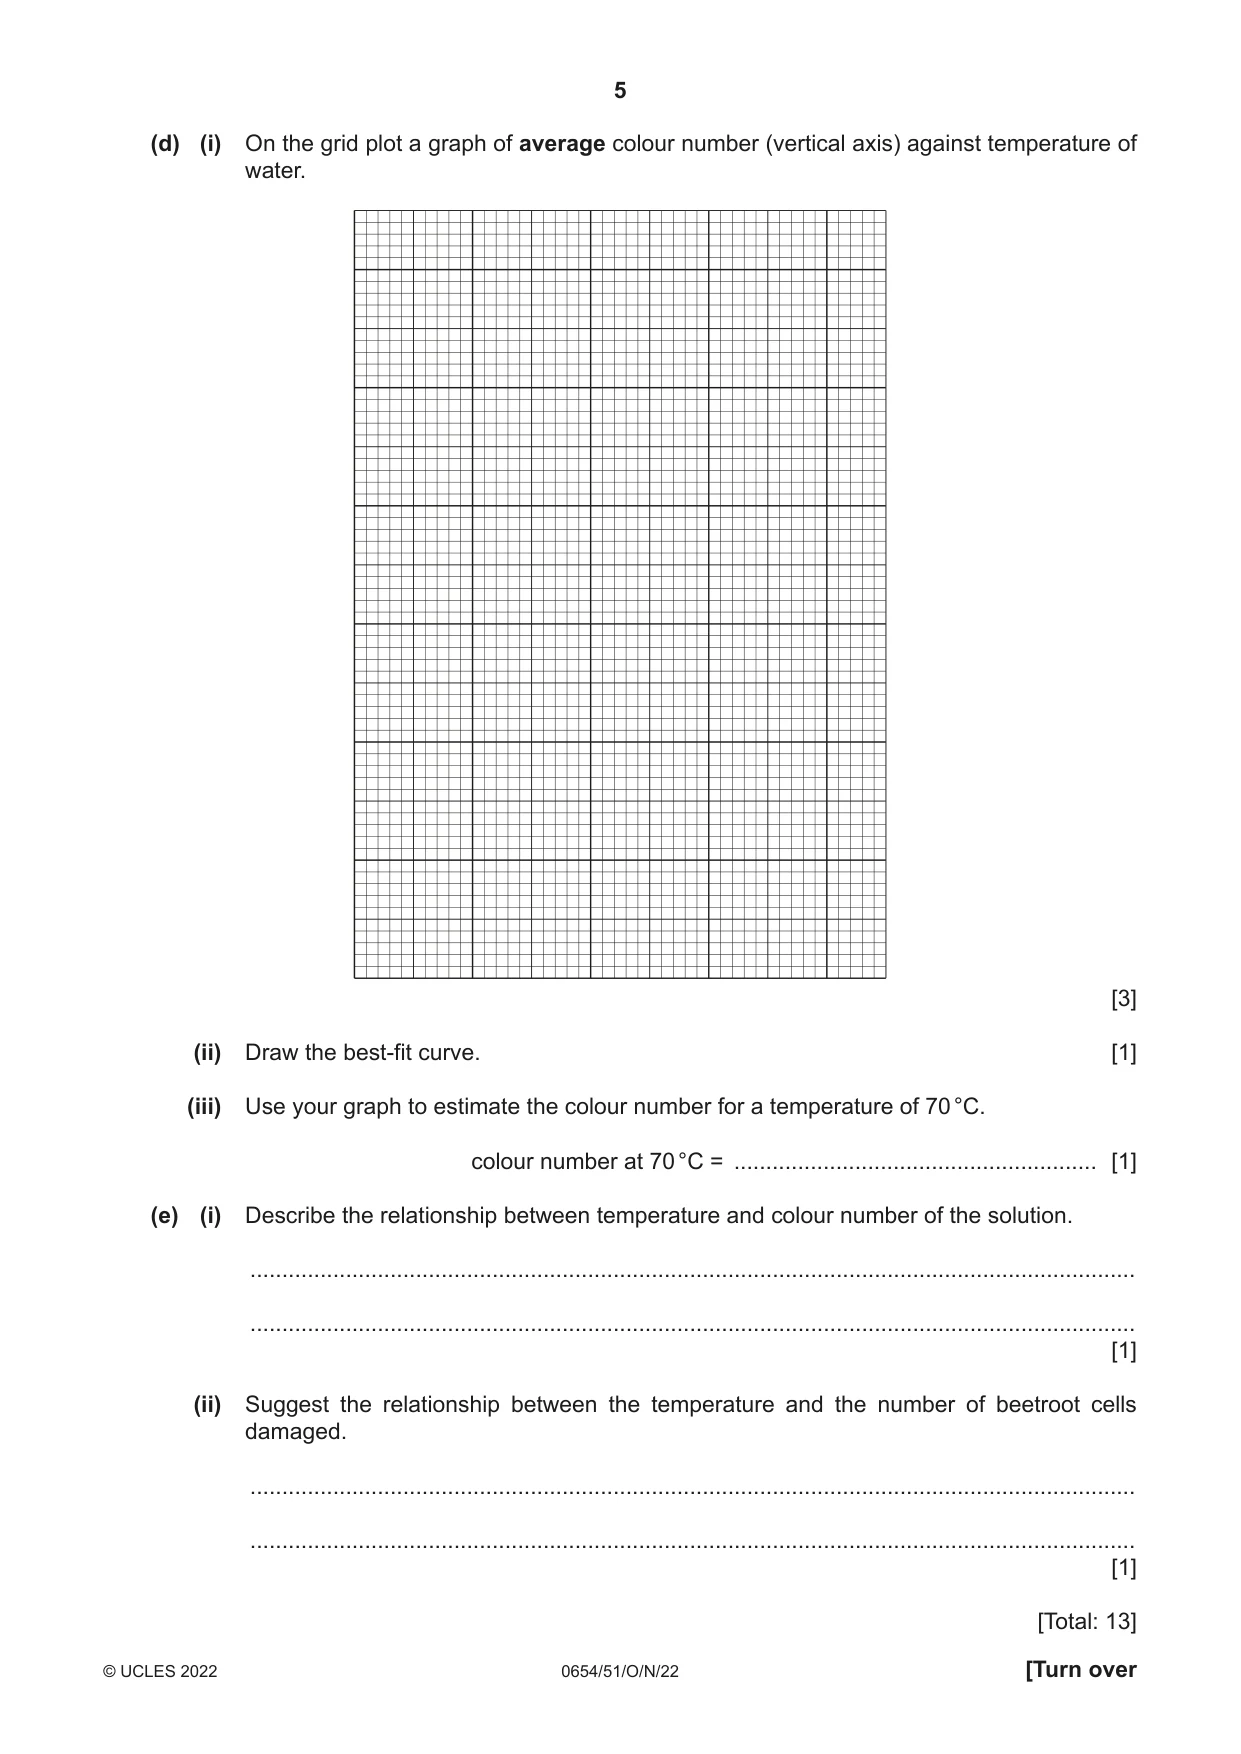
1 You are going to investigate the effect of temperature on the release of a red pigment from beetroot cells. When beetroot with damaged cells is placed in water, the red pigment leaves the beetroot and turns the water red. You are provided with three cylinders of beetroot. (a) Procedure step 1 Label one test-tube room, another 40 and another 60. step 2 Cut the three cylinders of beetroot so that each cylinder is 30 mm long. step 3 Rinse the beetroot cylinders in the beaker of rinsing water. step 4 Place one beetroot cylinder in each test-tube. step 5 Half-fill a beaker with water at room temperature. step 6 Pour water at room temperature into the test-tube labelled room until the water is approximately 3 cm higher than the beetroot. step 7 Place the test-tube labelled room into the beaker of water as shown in Fig. 1.1. step 8 Measure the temperature of the water at room temperature. (i) Record the temperature to the nearest 0.5 °C. temperature = .................................................... °C [1] (ii) Repeat steps 5, 6 and 7 with water at 40 °C and test-tube 40. Repeat steps 5, 6 and 7 with water at 60 °C and test-tube 60. Fig. 1.1 shows the three beakers and their contents. test-tube test-tube test-tube beaker beaker beaker water water water beetroot beetroot beetroot cylinder cylinder cylinder water at room water at 40 °C water at 60 °C temperature Fig. 1.1 step 9 Leave the beetroot cylinders for at least 5 minutes. You do not need to maintain the temperature of the water. You may continue with parts (b) and (c) while you are waiting. step 10 After at least 5 minutes put a stopper in each test-tube and shake the test-tube carefully. step 11 Place the test-tubes in the test-tube rack in colour order from the lightest red to the darkest red. Record in Table 1.1 the test-tubes in colour order. Table 1.1 colour of water test-tube lightest red darkest red [2] (b) (i) In step 2, all of the beetroot cylinders are cut to the same length to make sure the test is fair. Suggest why it is important that the beetroot cylinders are all cut to the same length. ........................................................................................................................................... ..................................................................................................................................... [1] (ii) In step 3, all of the beetroot cylinders are rinsed with water. Suggest why the beetroot cylinders are rinsed. ........................................................................................................................................... ..................................................................................................................................... [1] (c) Another student repeats the investigation using six different temperatures. The student compares the colours of the solutions to a colour chart. The colour chart gives each shade of colour a number. The results are shown in Table 1.2. Table 1.2 colour number temperature of water / °C trial 1 trial 2 average 10 1.2 1.4 1.3 20 1.4 1.6 1.5 30 1.5 1.7 50 3.0 2.6 2.8 60 4.8 4.4 4.6 80 11.5 11.9 11.7 Complete Table 1.2 by calculating the average colour number for 30 °C. [1] (d) (i) On the grid plot a graph of average colour number (vertical axis) against temperature of water. [3] (ii) Draw the best-fit curve. [1] (iii) Use your graph to estimate the colour number for a temperature of 70 °C. colour number at 70 °C = ......................................................... [1] (e) (i) Describe the relationship between temperature and colour number of the solution. ........................................................................................................................................... ........................................................................................................................................... [1] (ii) Suggest the relationship between the temperature and the number of beetroot cells damaged. ........................................................................................................................................... ........................................................................................................................................... [1] [Total: 13]
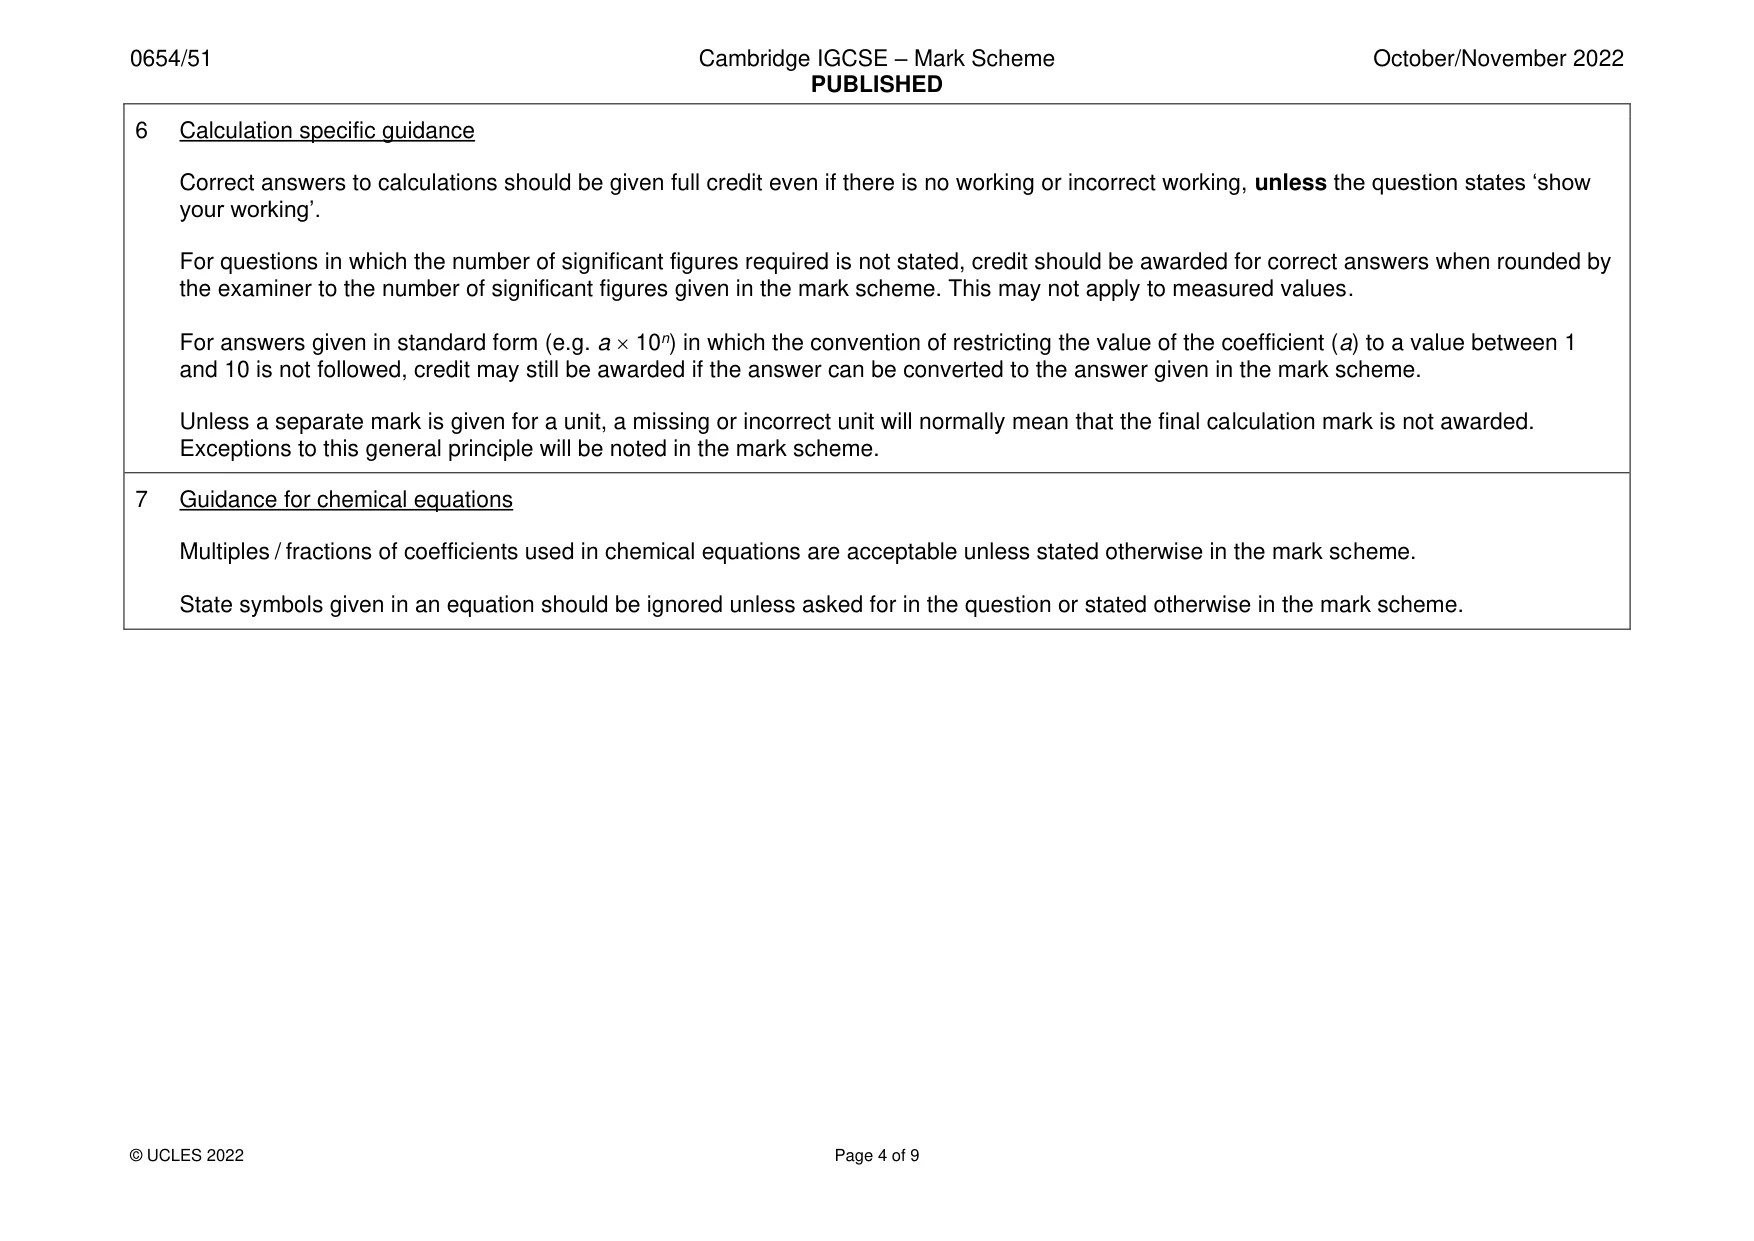
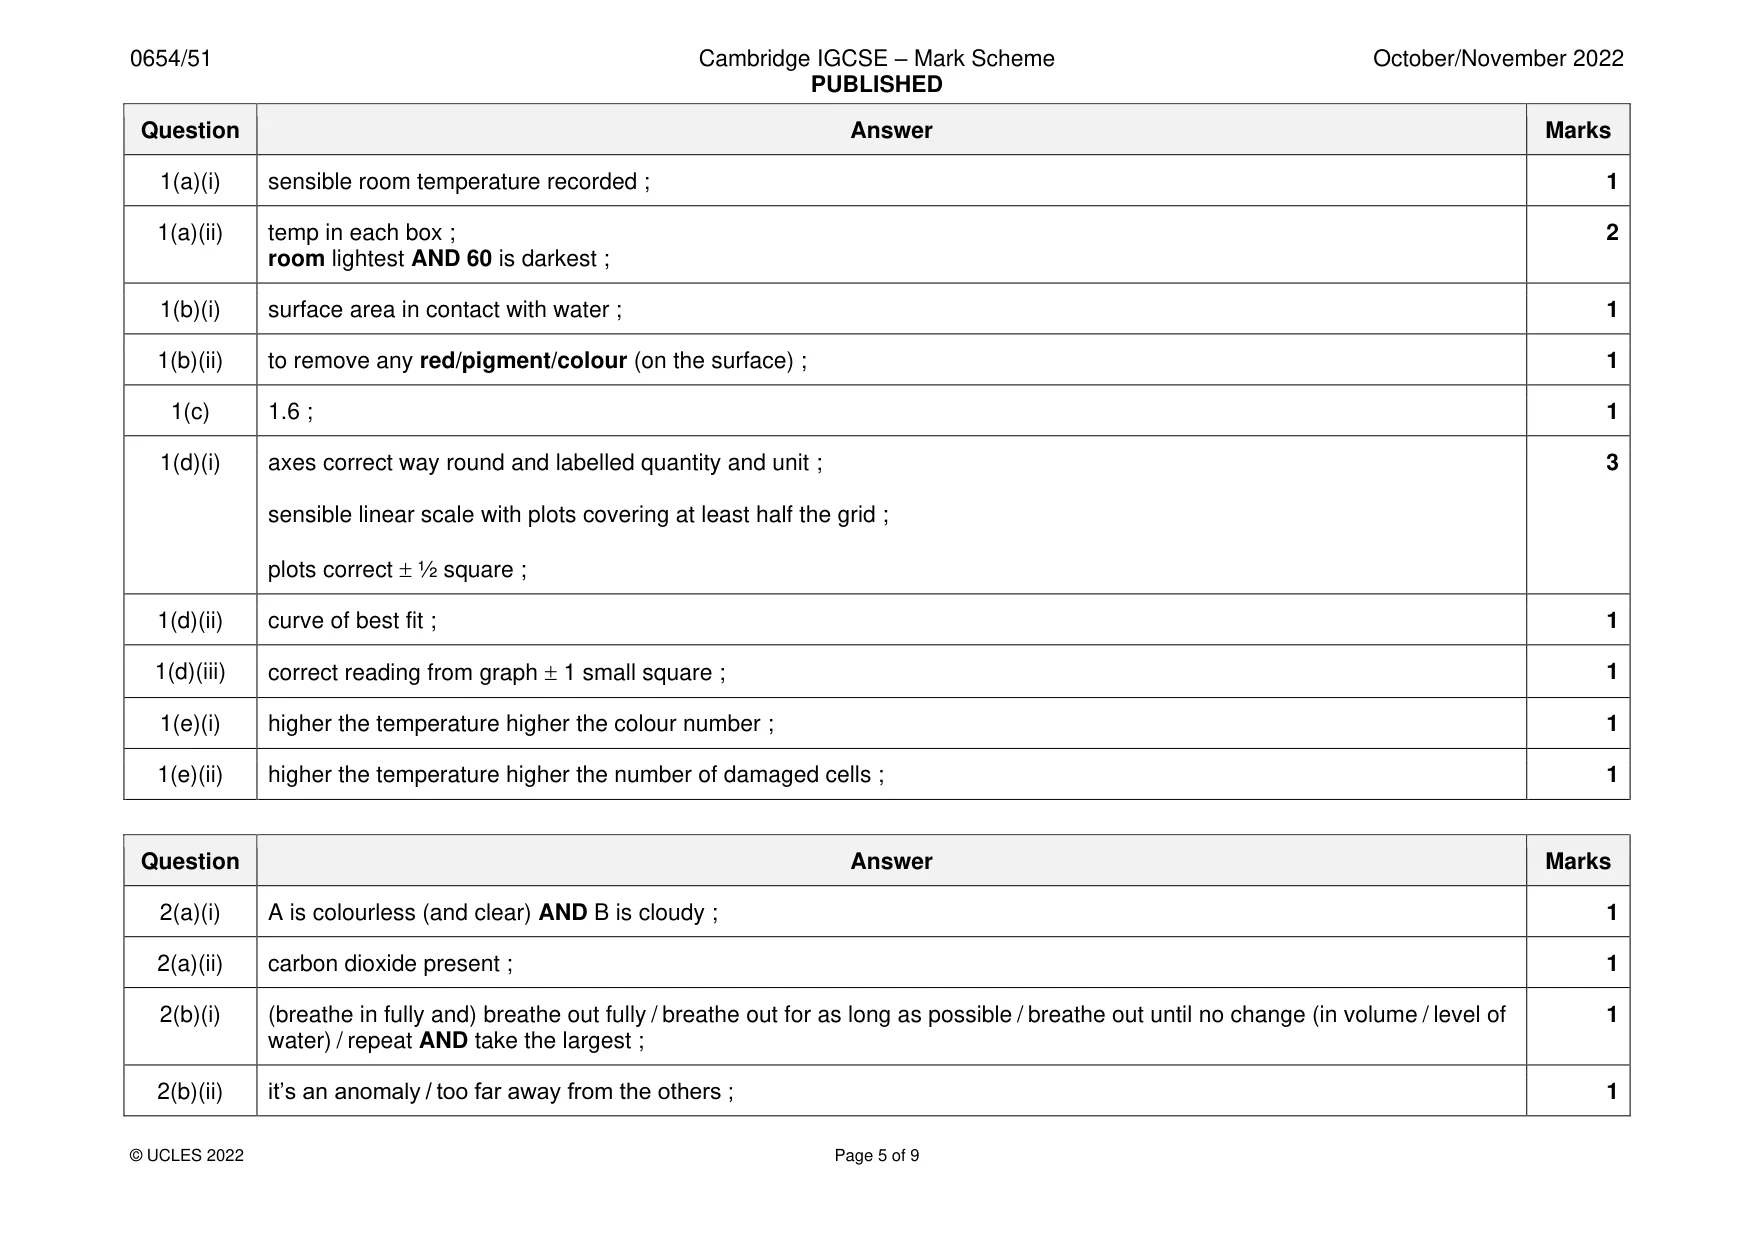
Mark scheme: Question Answer Marks 1(a)(i) sensible room temperature recorded ; 1 1(a)(ii) temp in each box ; 2 room lightest AND 60 is darkest ; 1(b)(i) surface area in contact with water ; 1 1(b)(ii) to remove any red/pigment/colour (on the surface) ; 1 1(c) 1.6 ; 1 1(d)(i) axes correct way round and labelled quantity and unit ; 3 sensible linear scale with plots covering at least half the grid ; plots correct ½ square ; 1(d)(ii) curve of best fit ; 1 1(d)(iii) correct reading from graph 1 small square ; 1 1(e)(i) higher the temperature higher the colour number ; 1 1(e)(ii) higher the temperature higher the number of damaged cells ; 1
Q2 · You are going to investigate the lungs and breathing
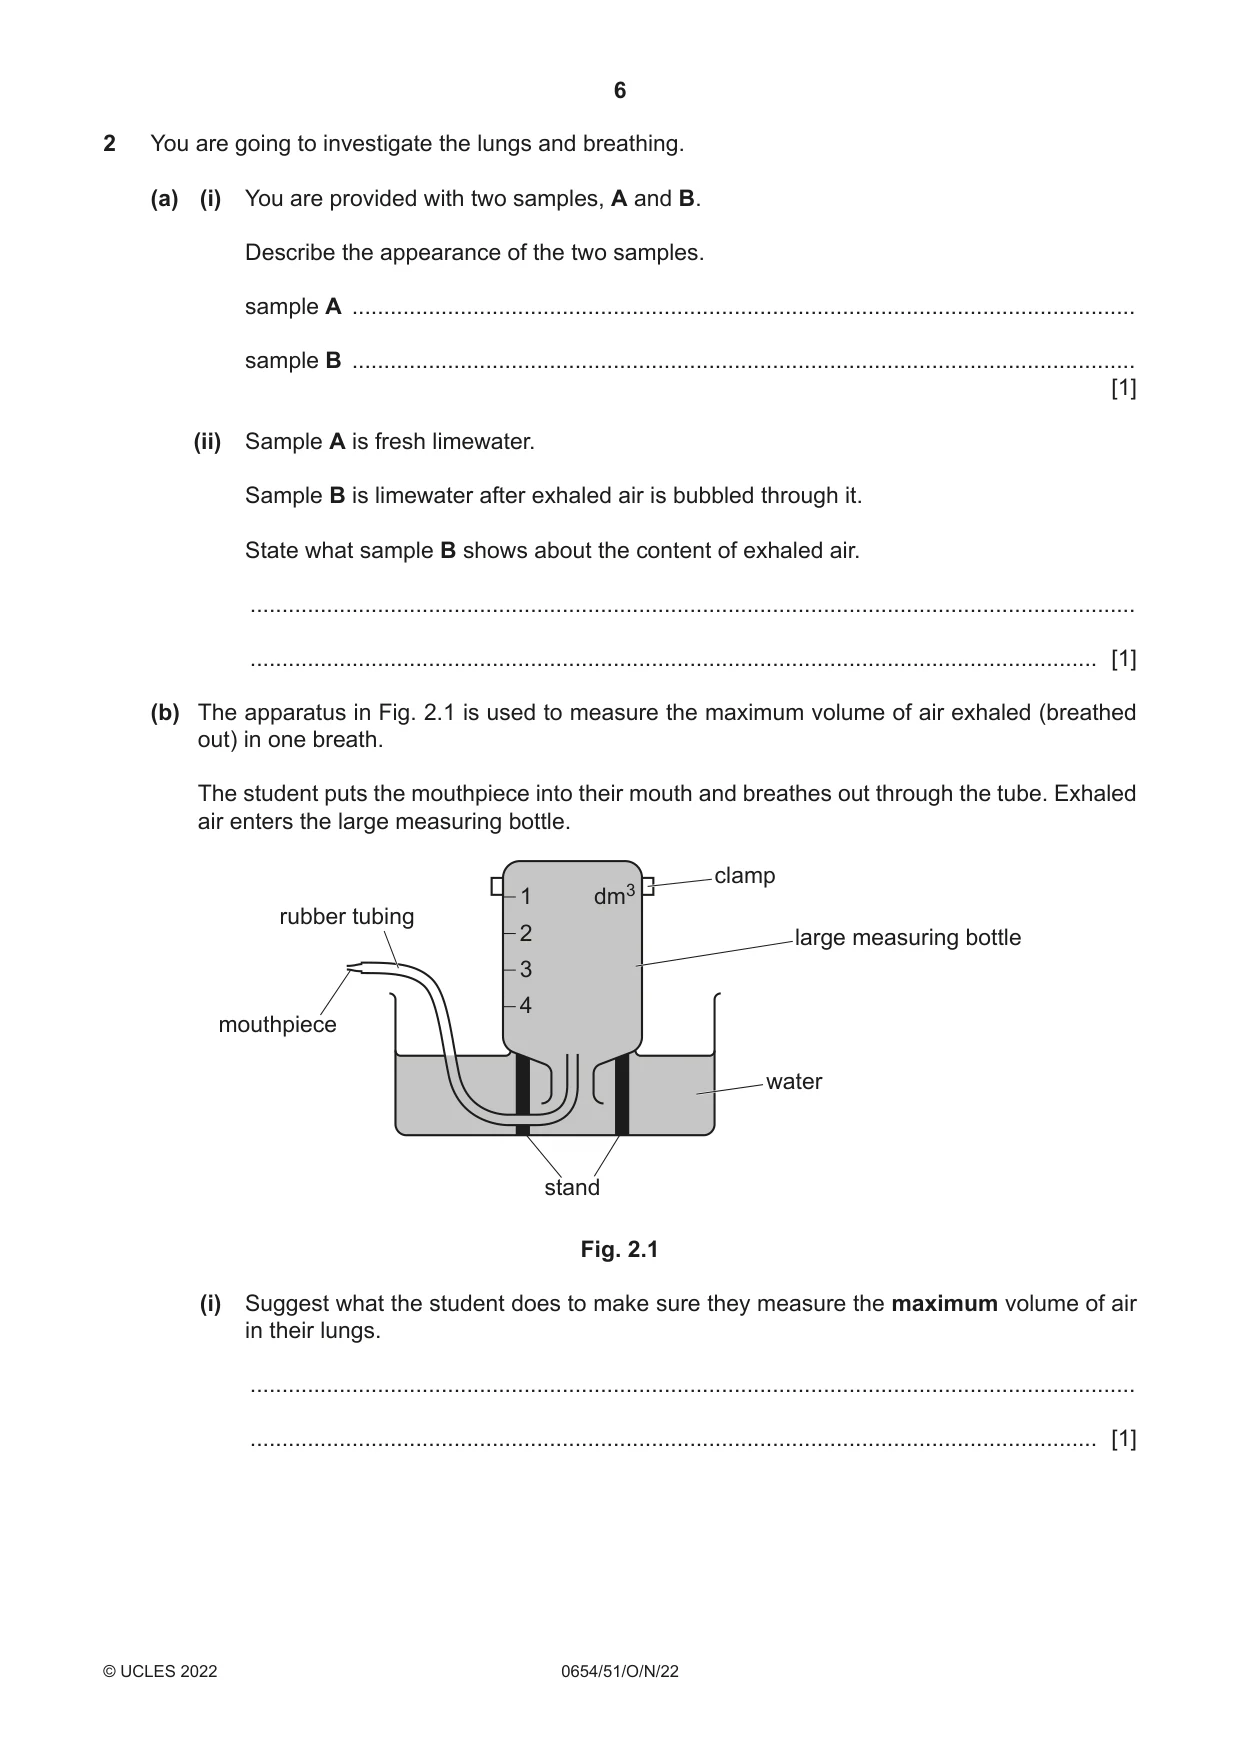
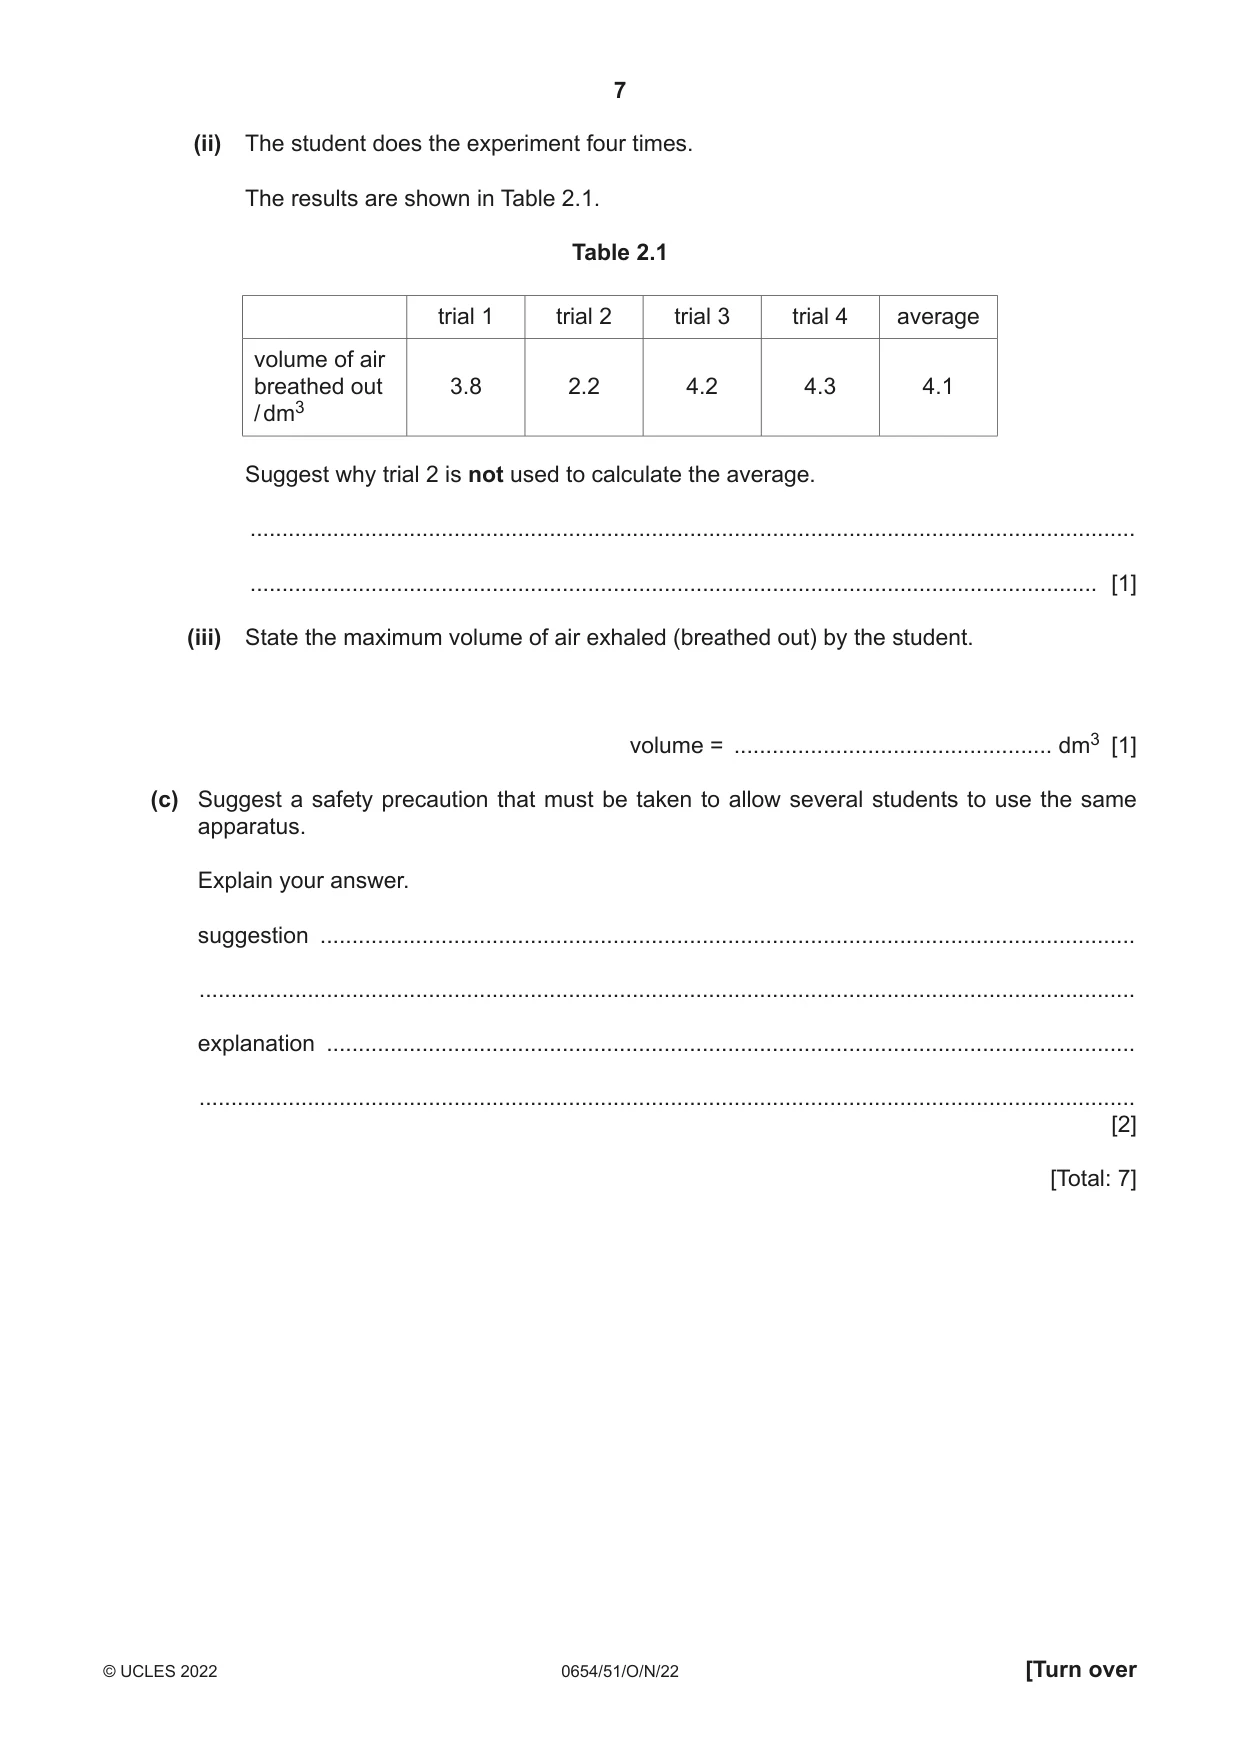
2 You are going to investigate the lungs and breathing. (a) (i) You are provided with two samples, A and B. Describe the appearance of the two samples. sample A ........................................................................................................................... sample B ........................................................................................................................... [1] (ii) Sample A is fresh limewater. Sample B is limewater after exhaled air is bubbled through it. State what sample B shows about the content of exhaled air. ........................................................................................................................................... ..................................................................................................................................... [1] (b) The apparatus in Fig. 2.1 is used to measure the maximum volume of air exhaled (breathed out) in one breath. The student puts the mouthpiece into their mouth and breathes out through the tube. Exhaled air enters the large measuring bottle. clamp 1 dm3 rubber tubing 2 large measuring bottle 3 4 mouthpiece water stand Fig. 2.1 (i) Suggest what the student does to make sure they measure the maximum volume of air in their lungs. ........................................................................................................................................... ..................................................................................................................................... [1] (ii) The student does the experiment four times. The results are shown in Table 2.1. Table 2.1 trial 1 trial 2 trial 3 trial 4 average volume of air breathed out 3.8 2.2 4.2 4.3 4.1 / dm3 Suggest why trial 2 is not used to calculate the average. ........................................................................................................................................... ..................................................................................................................................... [1] (iii) State the maximum volume of air exhaled (breathed out) by the student. volume = .................................................. dm3 [1] (c) Suggest a safety precaution that must be taken to allow several students to use the same apparatus. Explain your answer. suggestion ................................................................................................................................ ................................................................................................................................................... explanation ............................................................................................................................... ................................................................................................................................................... [2] [Total: 7]
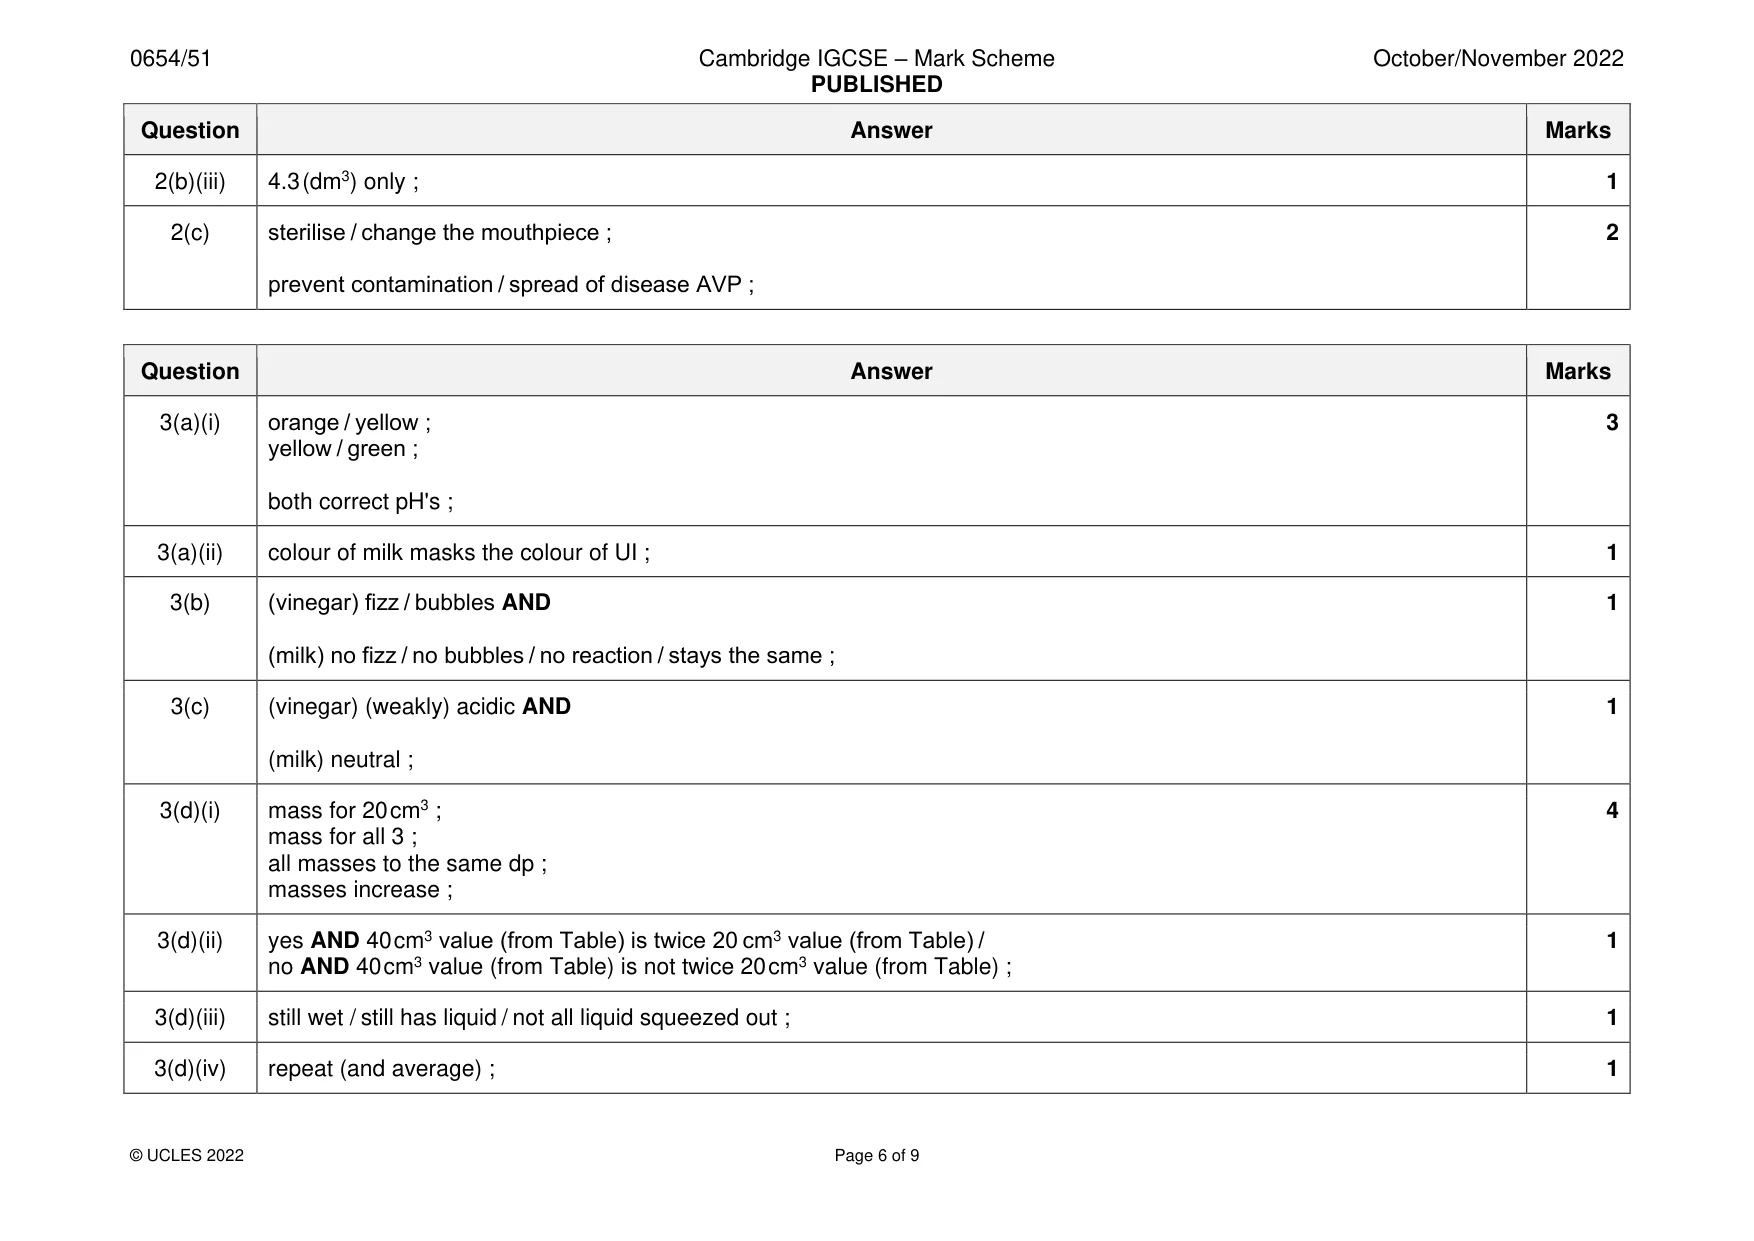
Mark scheme: 2(a)(i) A is colourless (and clear) AND B is cloudy ; 1 2(a)(ii) carbon dioxide present ; 1 2(b)(i) (breathe in fully and) breathe out fully / breathe out for as long as possible / breathe out until no change (in volume / level of 1 water) / repeat AND take the largest ; 2(b)(ii) it’s an anomaly / too far away from the others ; 1 2(b)(iii) 4.3 (dm3) only ; 1 2(c) sterilise / change the mouthpiece ; 2 prevent contamination / spread of disease AVP ;
Q3 · You are going to investigate the pH of milk and vinegar
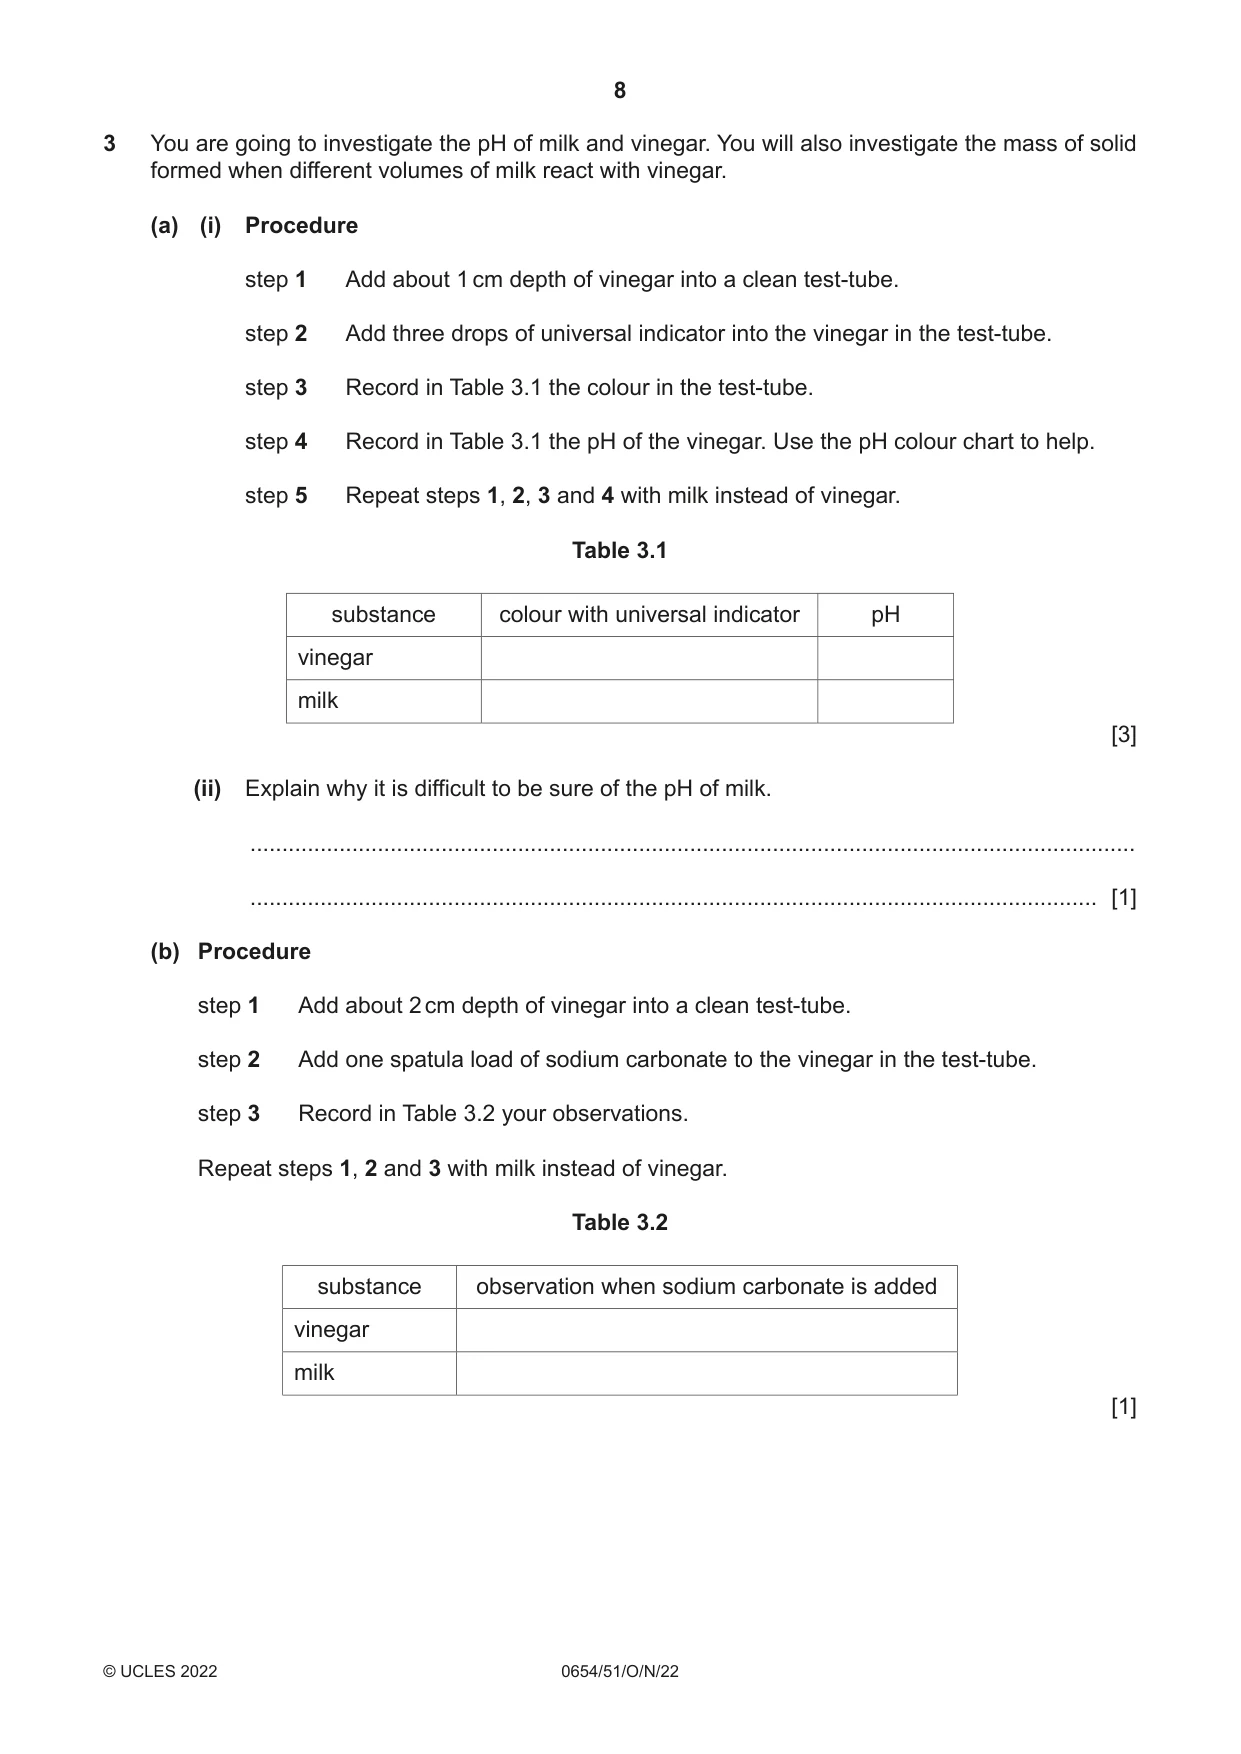
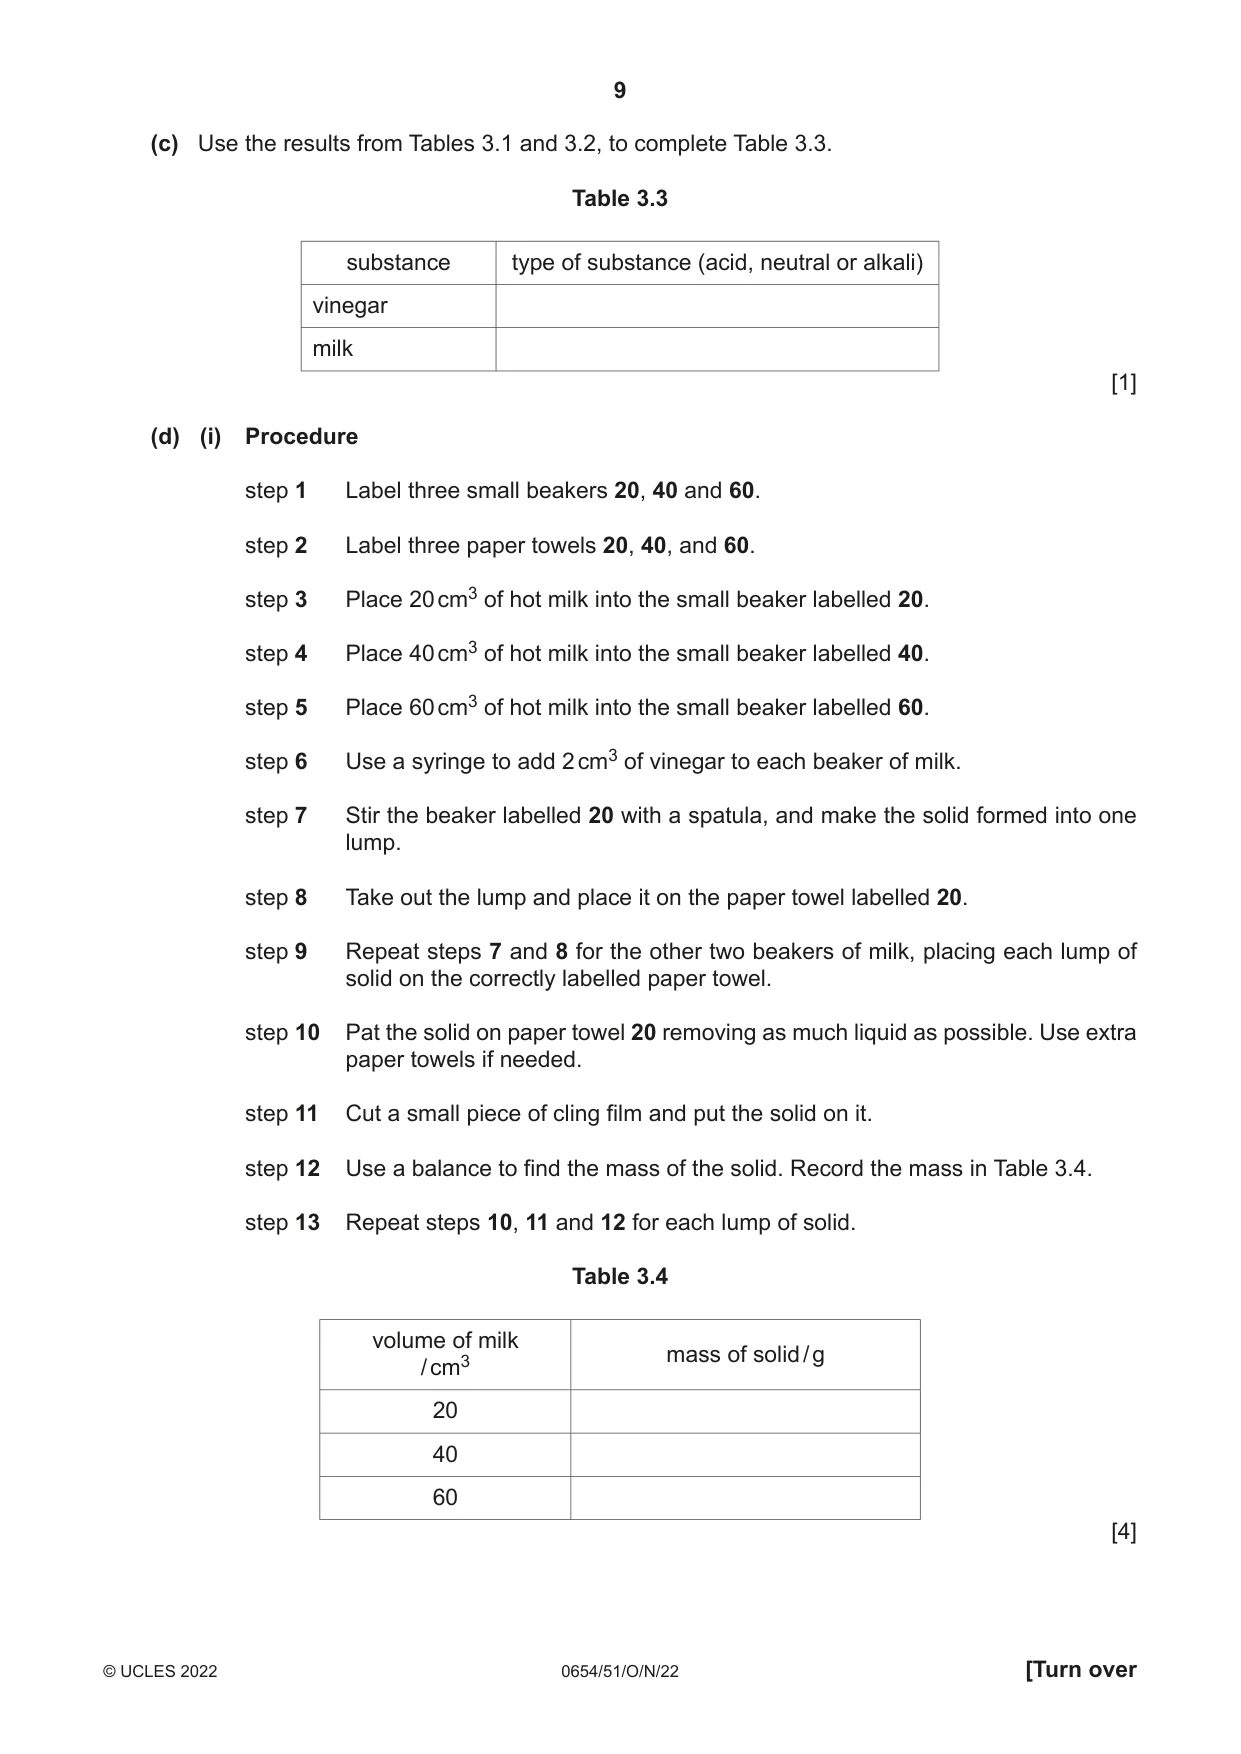
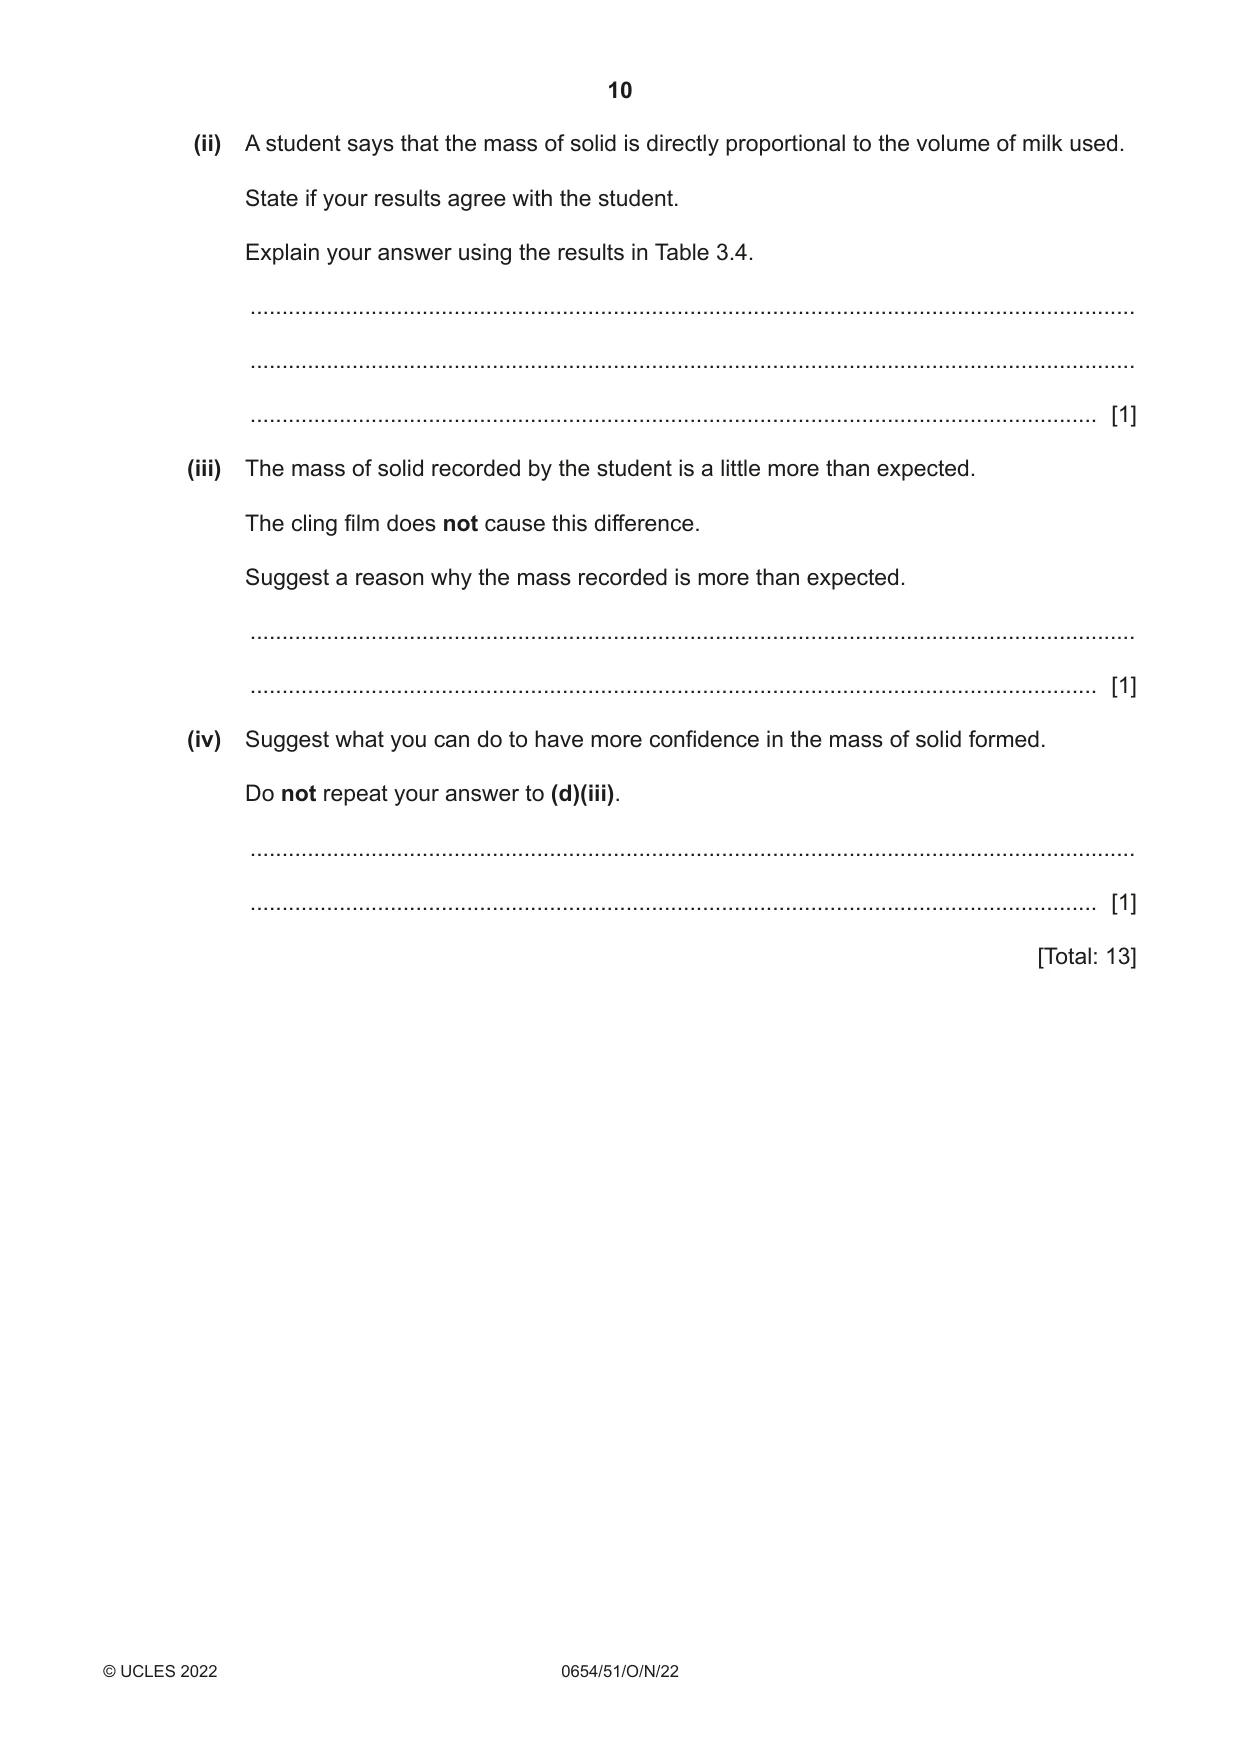
3 You are going to investigate the pH of milk and vinegar. You will also investigate the mass of solid formed when different volumes of milk react with vinegar. (a) (i) Procedure step 1 Add about 1 cm depth of vinegar into a clean test-tube. step 2 Add three drops of universal indicator into the vinegar in the test-tube. step 3 Record in Table 3.1 the colour in the test-tube. step 4 Record in Table 3.1 the pH of the vinegar. Use the pH colour chart to help. step 5 Repeat steps 1, 2, 3 and 4 with milk instead of vinegar. Table 3.1 substance colour with universal indicator pH vinegar milk [3] (ii) Explain why it is difficult to be sure of the pH of milk. ........................................................................................................................................... ..................................................................................................................................... [1] (b) Procedure step 1 Add about 2 cm depth of vinegar into a clean test-tube. step 2 Add one spatula load of sodium carbonate to the vinegar in the test-tube. step 3 Record in Table 3.2 your observations. Repeat steps 1, 2 and 3 with milk instead of vinegar. Table 3.2 substance observation when sodium carbonate is added vinegar milk [1] (c) Use the results from Tables 3.1 and 3.2, to complete Table 3.3. Table 3.3 substance type of substance (acid, neutral or alkali) vinegar milk [1] (d) (i) Procedure step 1 Label three small beakers 20, 40 and 60. step 2 Label three paper towels 20, 40, and 60. step 3 Place 20 cm3 of hot milk into the small beaker labelled 20. step 4 Place 40 cm3 of hot milk into the small beaker labelled 40. step 5 Place 60 cm3 of hot milk into the small beaker labelled 60. step 6 Use a syringe to add 2 cm3 of vinegar to each beaker of milk. step 7 Stir the beaker labelled 20 with a spatula, and make the solid formed into one lump. step 8 Take out the lump and place it on the paper towel labelled 20. step 9 Repeat steps 7 and 8 for the other two beakers of milk, placing each lump of solid on the correctly labelled paper towel. step 10 Pat the solid on paper towel 20 removing as much liquid as possible. Use extra paper towels if needed. step 11 Cut a small piece of cling film and put the solid on it. step 12 Use a balance to find the mass of the solid. Record the mass in Table 3.4. step 13 Repeat steps 10, 11 and 12 for each lump of solid. Table 3.4 volume of milk mass of solid / g / cm3 20 40 60 [4] (ii) A student says that the mass of solid is directly proportional to the volume of milk used. State if your results agree with the student. Explain your answer using the results in Table 3.4. ........................................................................................................................................... ........................................................................................................................................... ..................................................................................................................................... [1] (iii) The mass of solid recorded by the student is a little more than expected. The cling film does not cause this difference. Suggest a reason why the mass recorded is more than expected. ........................................................................................................................................... ..................................................................................................................................... [1] (iv) Suggest what you can do to have more confidence in the mass of solid formed. Do not repeat your answer to (d)(iii). ........................................................................................................................................... ..................................................................................................................................... [1] [Total: 13]
Mark scheme: 3(a)(i) orange / yellow ; 3 yellow / green ; both correct pH's ; 3(a)(ii) colour of milk masks the colour of UI ; 1 3(b) (vinegar) fizz / bubbles AND 1 (milk) no fizz / no bubbles / no reaction / stays the same ; 3(c) (vinegar) (weakly) acidic AND 1 (milk) neutral ; 3(d)(i) mass for 20 cm3 ; 4 mass for all 3 ; all masses to the same dp ; masses increase ; 3(d)(ii) yes AND 40 cm3 value (from Table) is twice 20 cm3 value (from Table) / 1 no AND 40 cm3 value (from Table) is not twice 20 cm3 value (from Table) ; 3(d)(iii) still wet / still has liquid / not all liquid squeezed out ; 1 3(d)(iv) repeat (and average) ; 1
Q4 · Copper is an unreactive metal
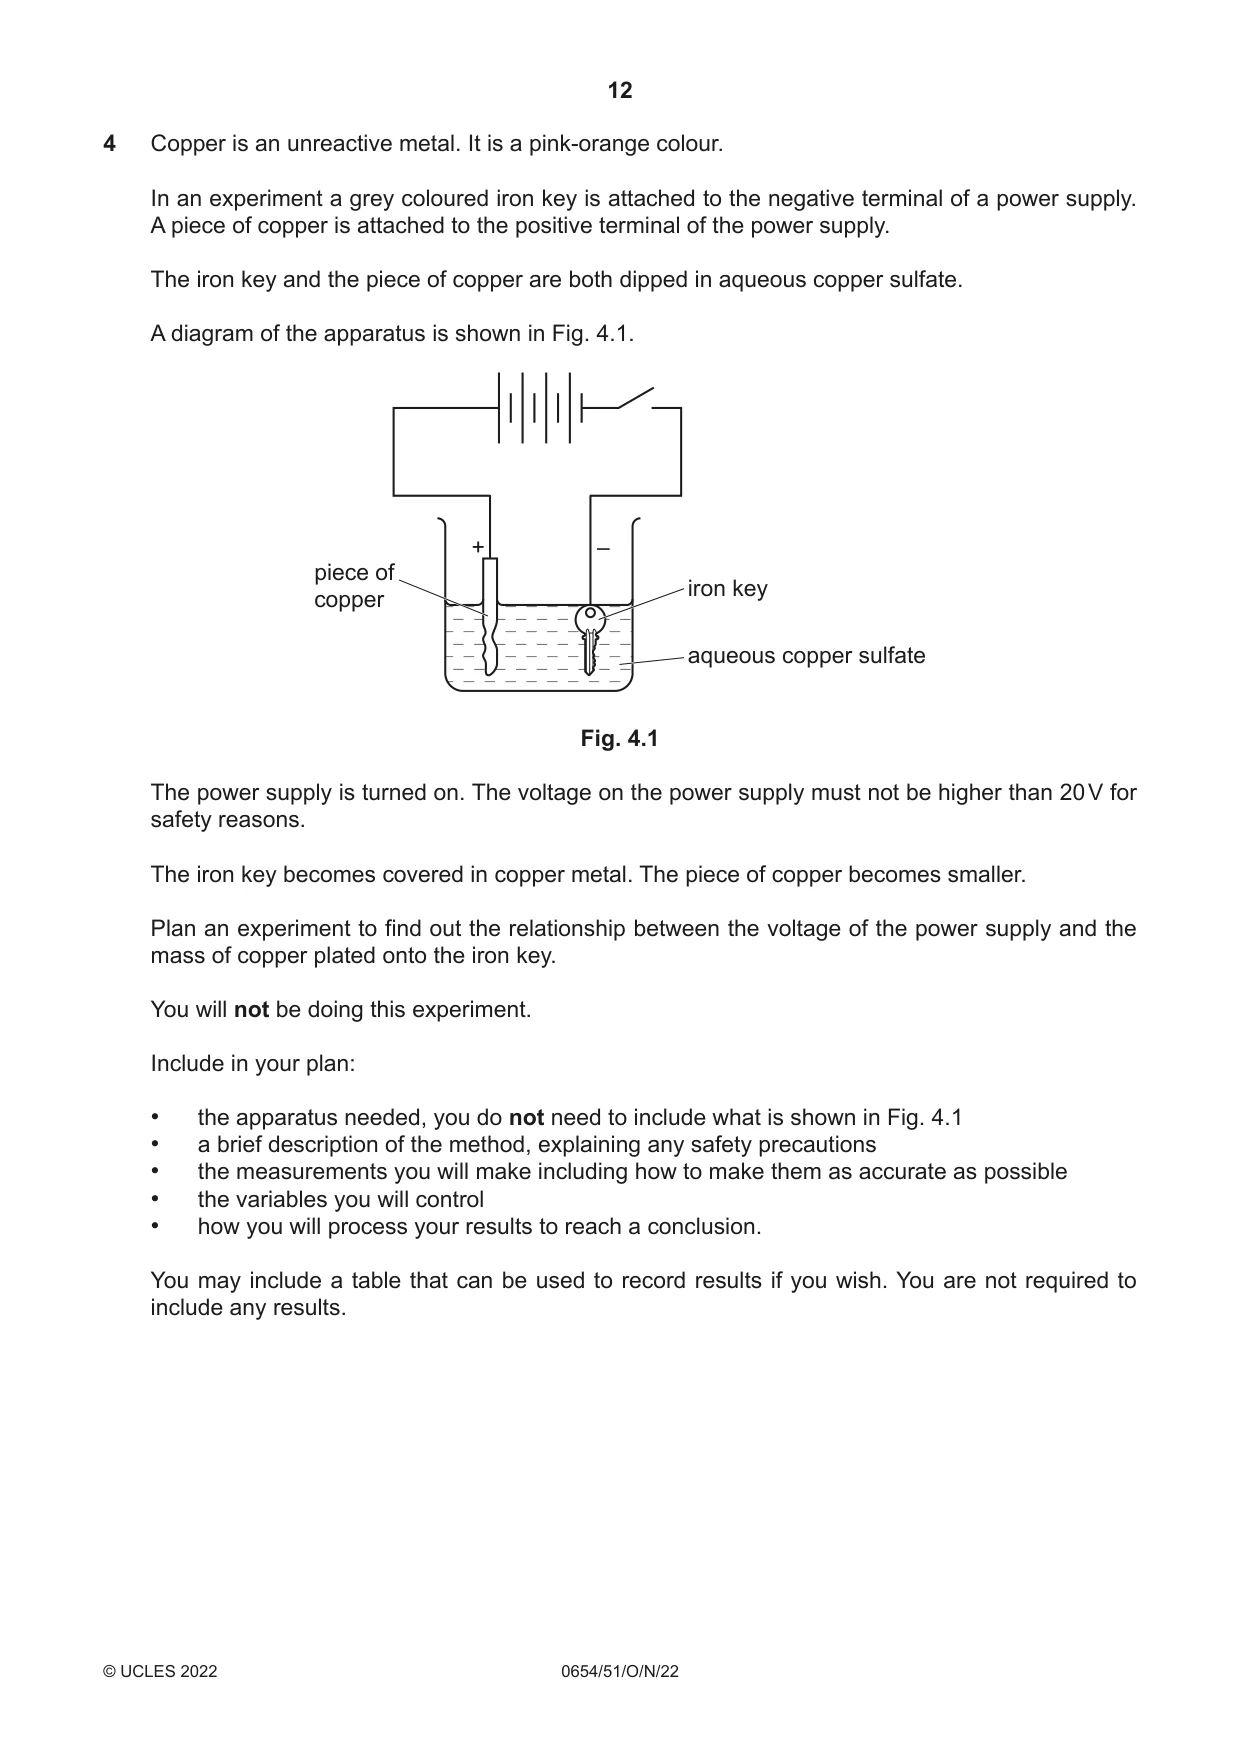
4 Copper is an unreactive metal. It is a pink-orange colour. In an experiment a grey coloured iron key is attached to the negative terminal of a power supply. A piece of copper is attached to the positive terminal of the power supply. The iron key and the piece of copper are both dipped in aqueous copper sulfate. A diagram of the apparatus is shown in Fig. 4.1. + – piece of iron key copper aqueous copper sulfate Fig. 4.1 The power supply is turned on. The voltage on the power supply must not be higher than 20 V for safety reasons. The iron key becomes covered in copper metal. The piece of copper becomes smaller. Plan an experiment to find out the relationship between the voltage of the power supply and the mass of copper plated onto the iron key. You will not be doing this experiment. Include in your plan: • the apparatus needed, you do not need to include what is shown in Fig. 4.1 • a brief description of the method, explaining any safety precautions • the measurements you will make including how to make them as accurate as possible • the variables you will control • how you will process your results to reach a conclusion. You may include a table that can be used to record results if you wish. You are not required to include any results. .................................................................................................................................................................. .................................................................................................................................................................. .................................................................................................................................................................. .................................................................................................................................................................. .................................................................................................................................................................. .................................................................................................................................................................. .................................................................................................................................................................. .................................................................................................................................................................. .................................................................................................................................................................. .................................................................................................................................................................. .................................................................................................................................................................. .................................................................................................................................................................. .................................................................................................................................................................. .................................................................................................................................................................. .................................................................................................................................................................. .................................................................................................................................................................. .................................................................................................................................................................. .................................................................................................................................................................. .................................................................................................................................................................. .................................................................................................................................................................. .................................................................................................................................................................. .................................................................................................................................................................. .................................................................................................................................................................. .................................................................................................................................................................. .................................................................................................................................................................. .................................................................................................................................................................. .................................................................................................................................................................. .................................................................................................................................................................. [7]
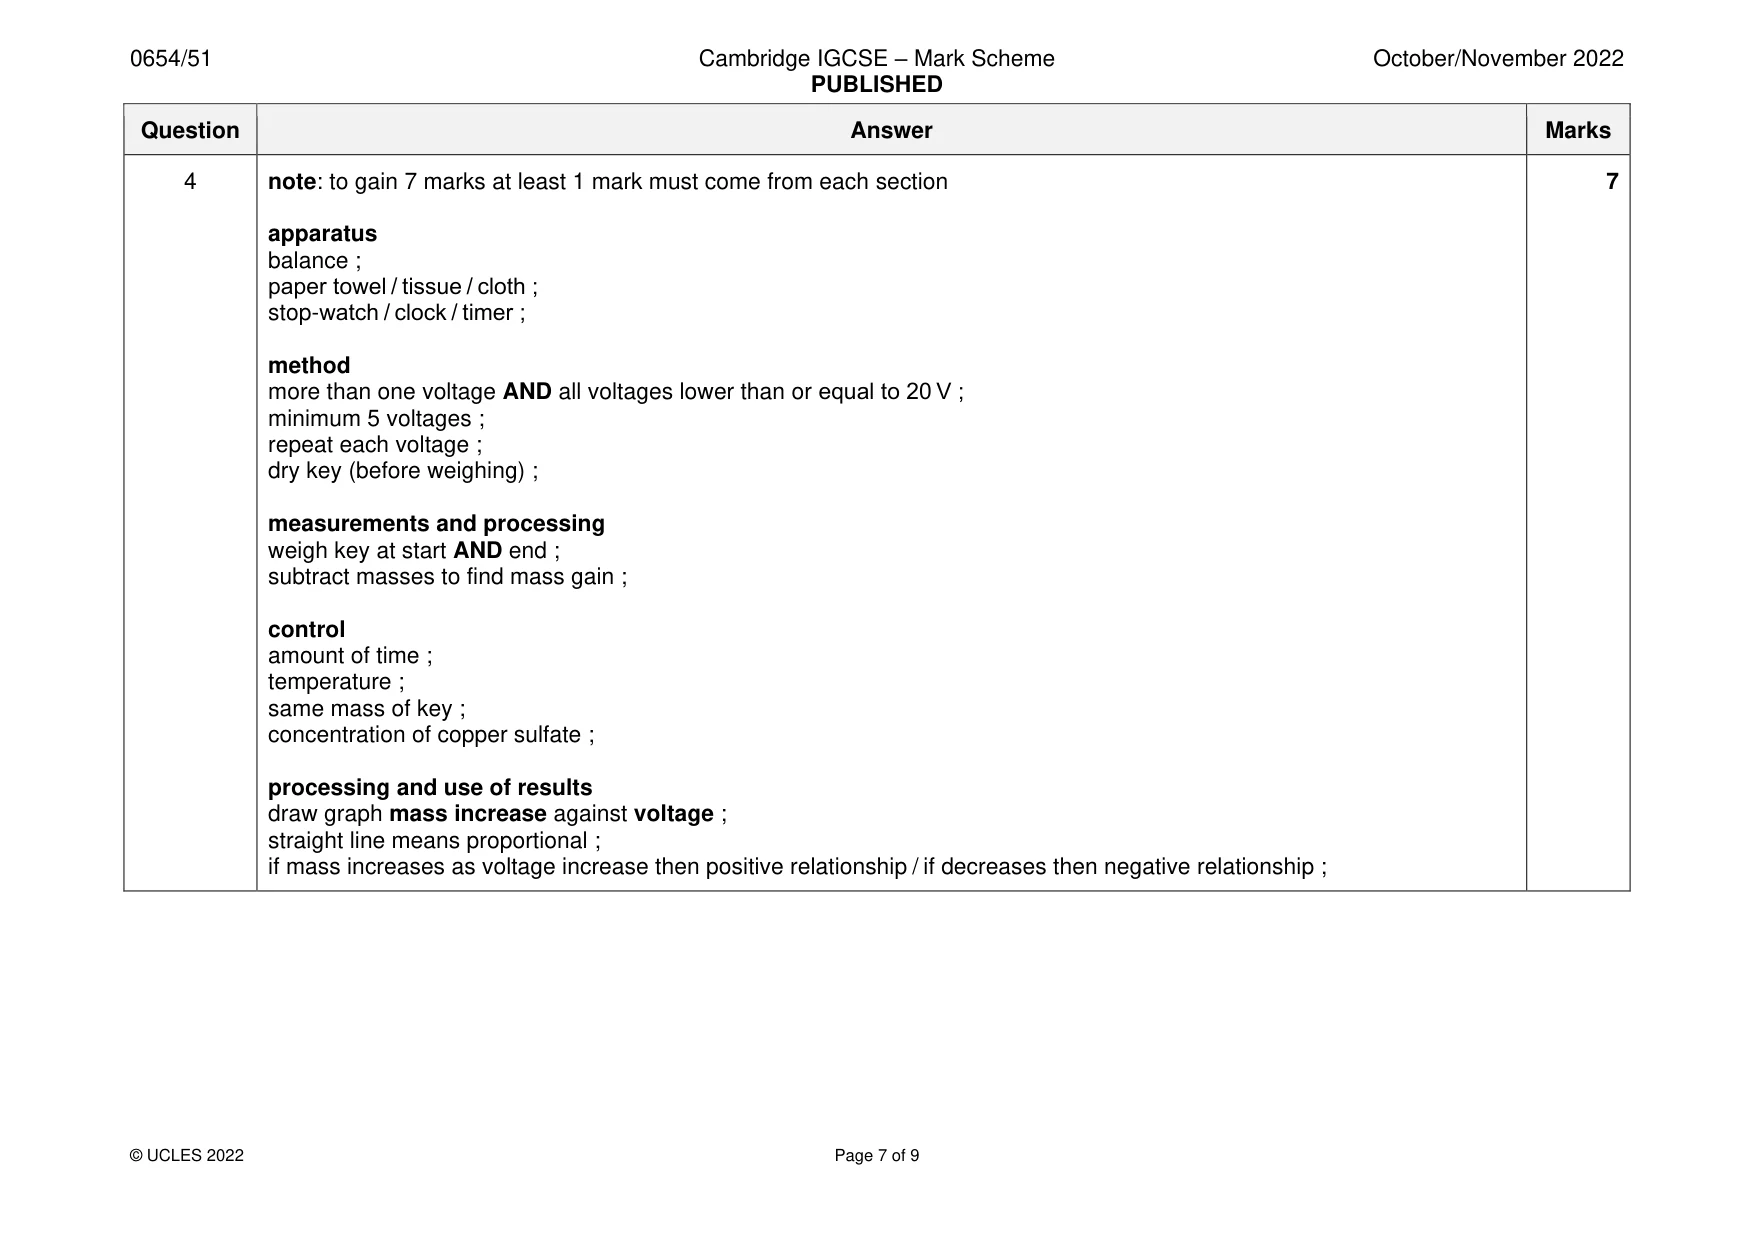
Mark scheme: 4 note: to gain 7 marks at least 1 mark must come from each section 7 apparatus balance ; paper towel / tissue / cloth ; stop-watch / clock / timer ; method more than one voltage AND all voltages lower than or equal to 20 V ; minimum 5 voltages ; repeat each voltage ; dry key (before weighing) ; measurements and processing weigh key at start AND end ; subtract masses to find mass gain ; control amount of time ; temperature ; same mass of key ; concentration of copper sulfate ; processing and use of results draw graph mass increase against voltage ; straight line means proportional ; if mass increases as voltage increase then positive relationship / if decreases then negative relationship ;
Q5 · You are going to investigate different methods of thermally insulating two beakers, X and…
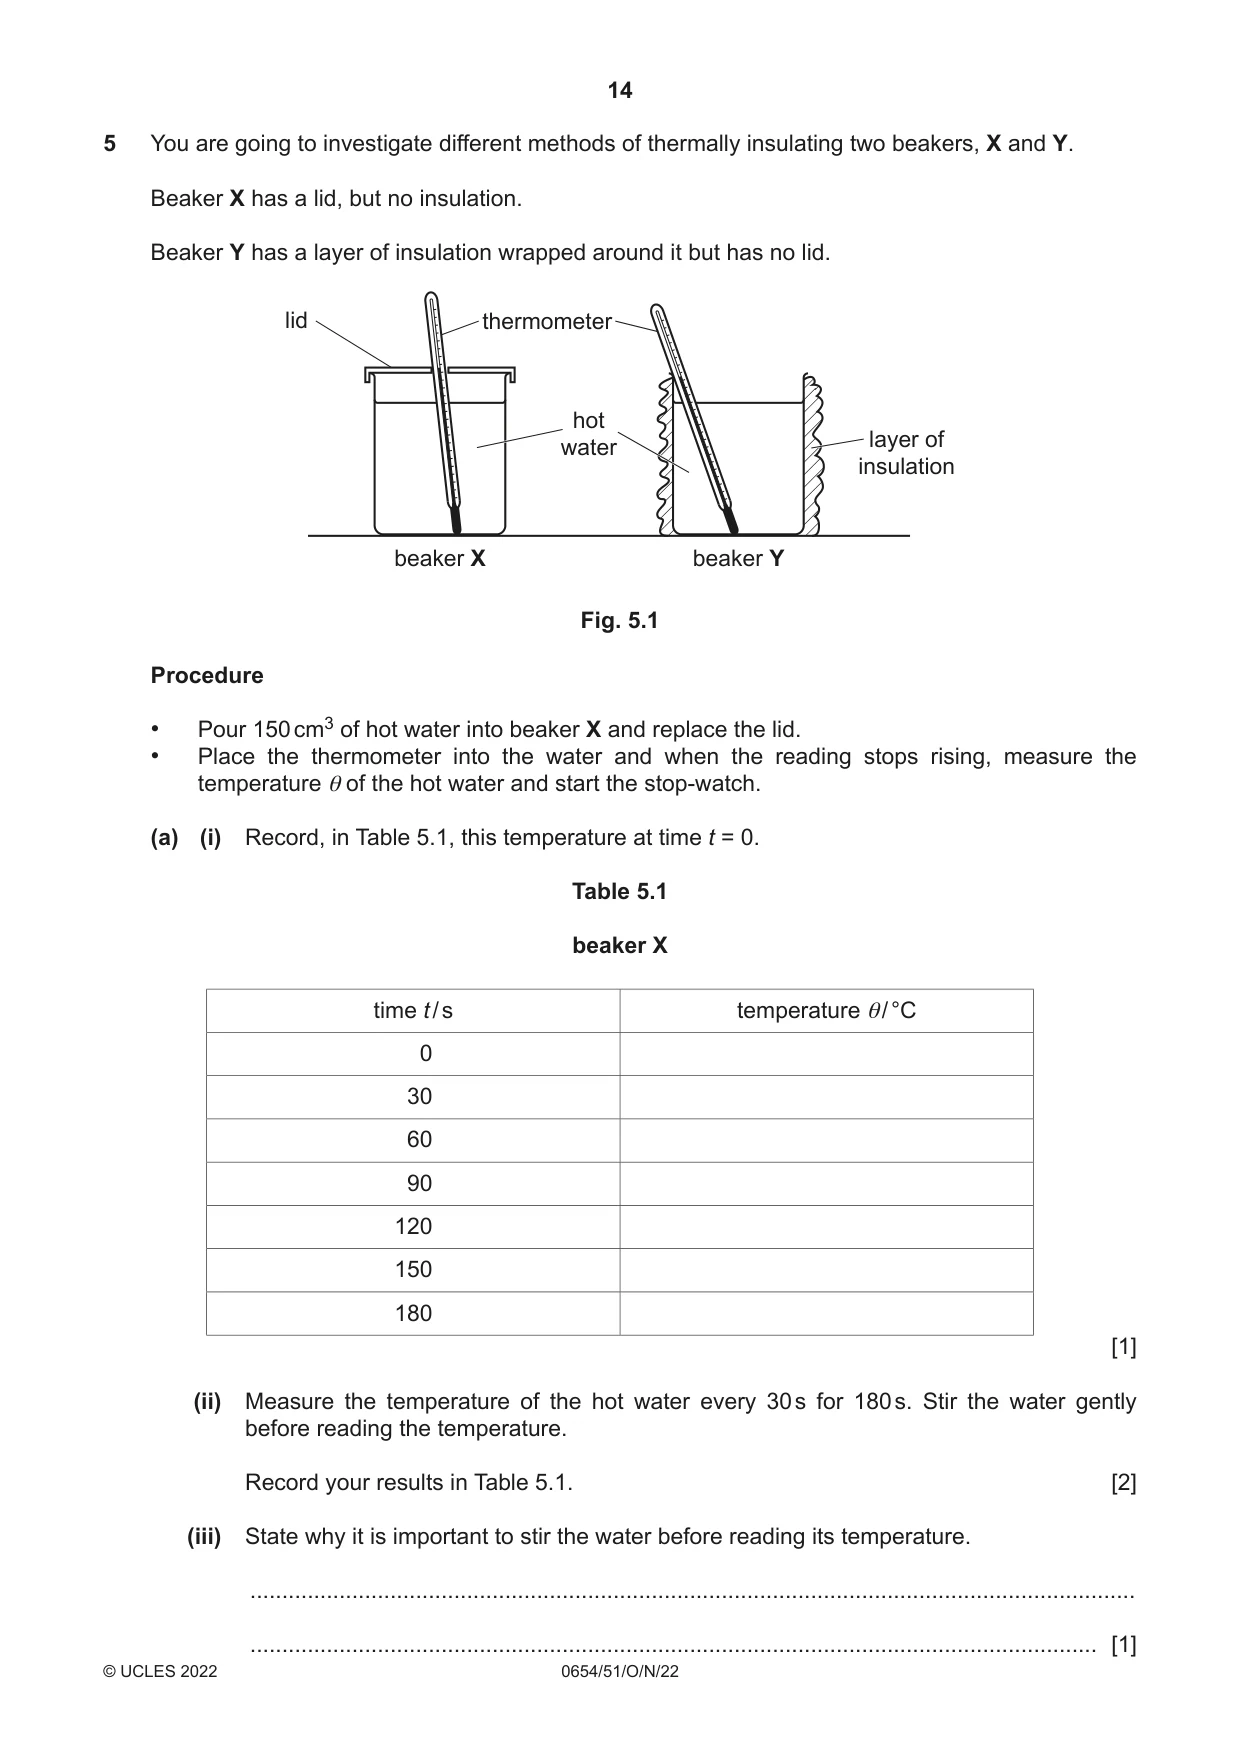
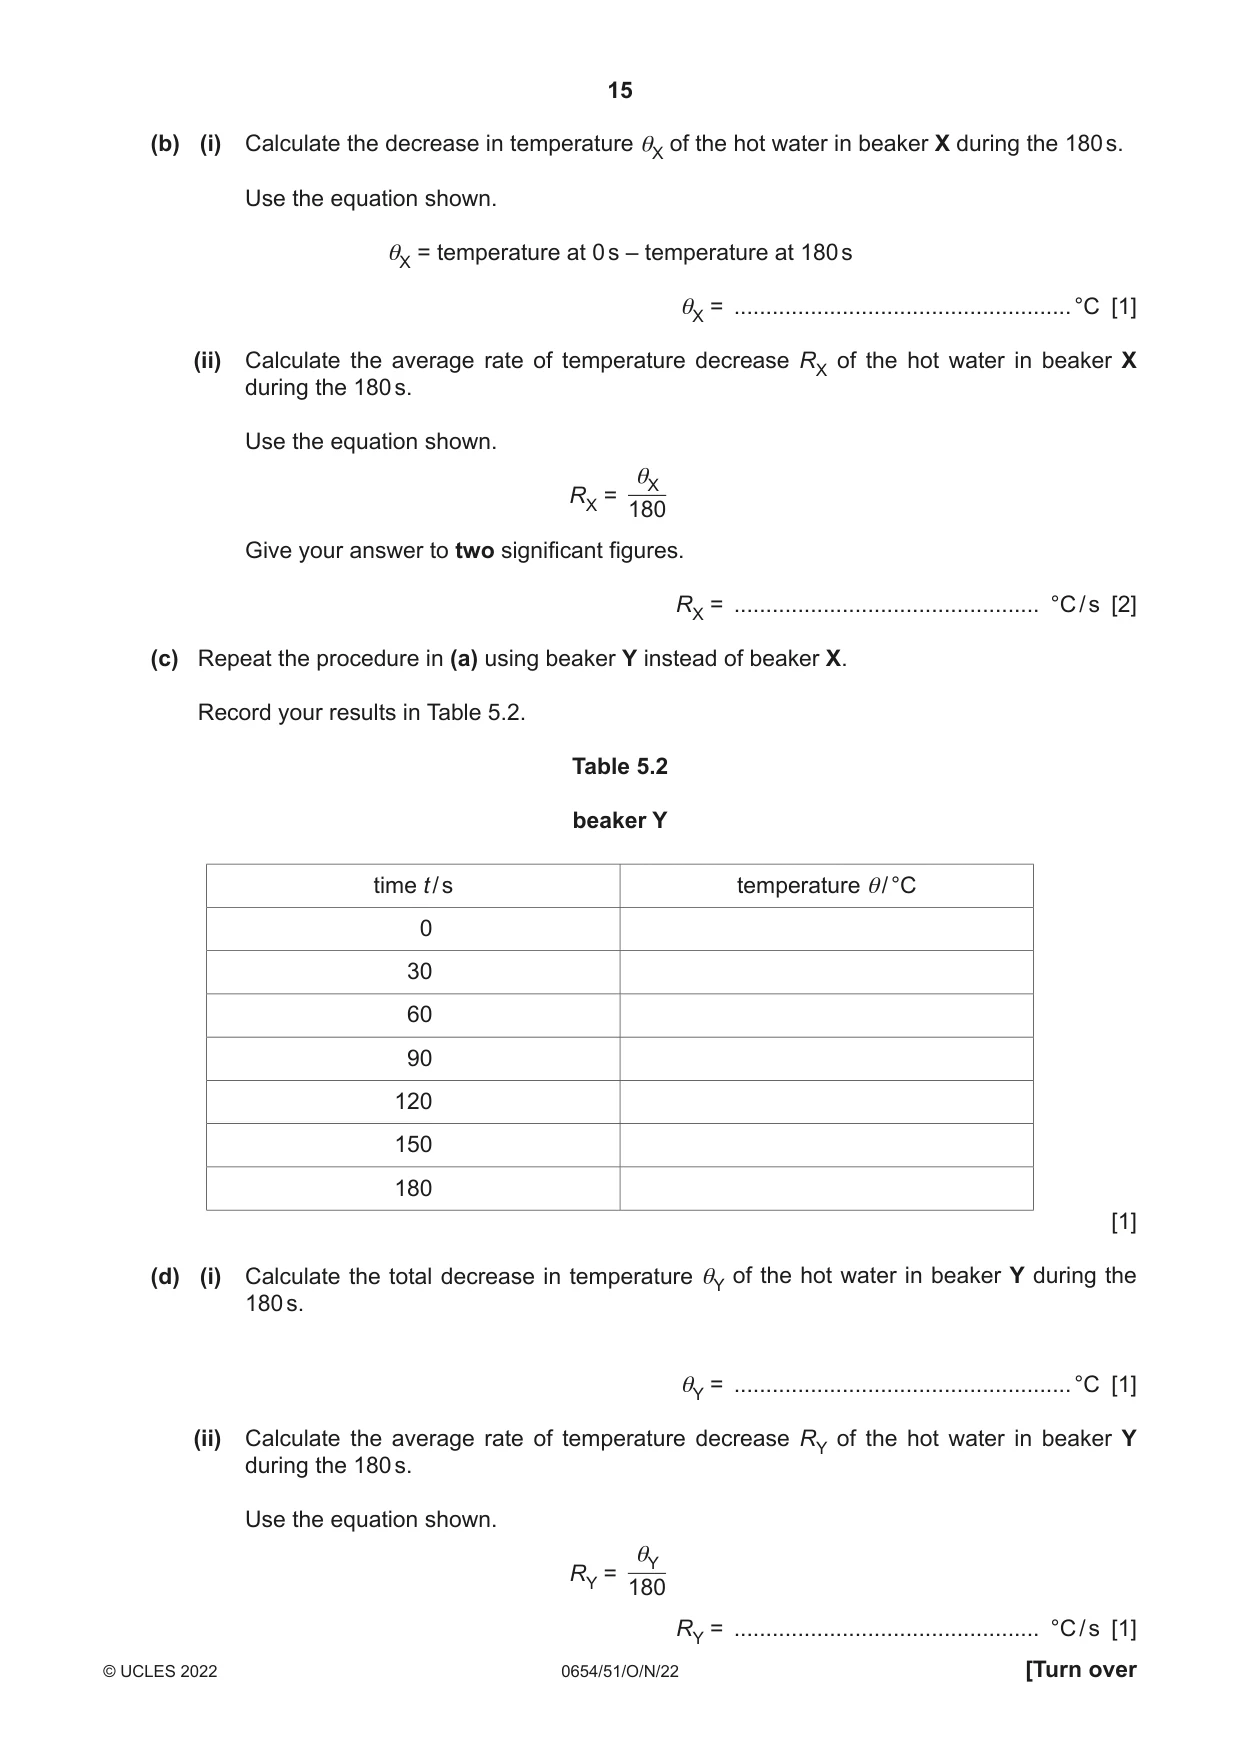
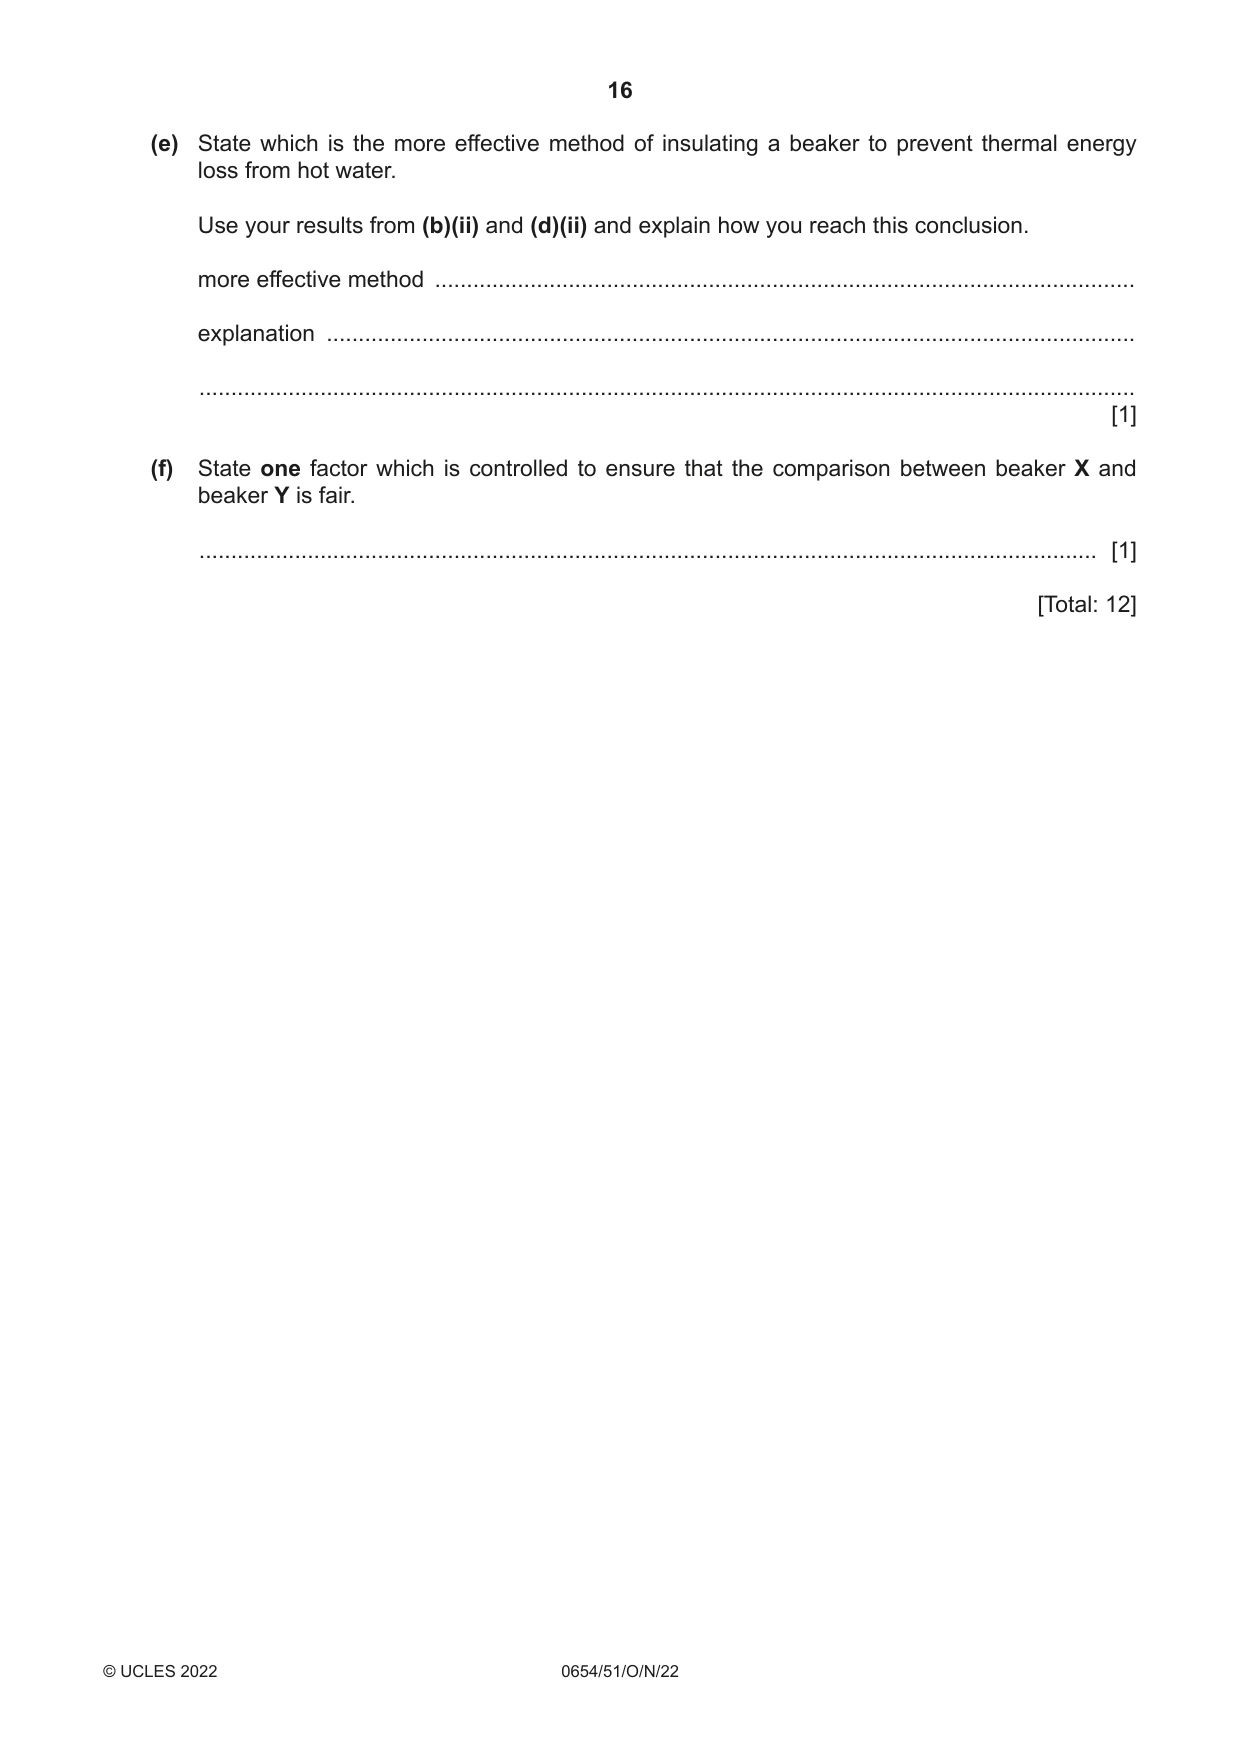
5 You are going to investigate different methods of thermally insulating two beakers, X and Y. Beaker X has a lid, but no insulation. Beaker Y has a layer of insulation wrapped around it but has no lid. lid thermometer hot layer of water insulation beaker X beaker Y Fig. 5.1 Procedure • Pour 150 cm3 of hot water into beaker X and replace the lid. • Place the thermometer into the water and when the reading stops rising, measure the temperature θ of the hot water and start the stop-watch. (a) (i) Record, in Table 5.1, this temperature at time t = 0. Table 5.1 beaker X time t / s temperature θ/ °C 0 30 60 90 120 150 180 [1] (ii) Measure the temperature of the hot water every 30 s for 180 s. Stir the water gently before reading the temperature. Record your results in Table 5.1. [2] (iii) State why it is important to stir the water before reading its temperature. ........................................................................................................................................... ..................................................................................................................................... [1] (b) (i) Calculate the decrease in temperature θX of the hot water in beaker X during the 180 s. Use the equation shown. θX = temperature at 0 s – temperature at 180 s θX = .....................................................°C [1] (ii) Calculate the average rate of temperature decrease RX of the hot water in beaker X during the 180 s. Use the equation shown. θX RX = 180 Give your answer to two significant figures. RX = ................................................ °C / s [2] (c) Repeat the procedure in (a) using beaker Y instead of beaker X. Record your results in Table 5.2. Table 5.2 beaker Y time t / s temperature θ/ °C 0 30 60 90 120 150 180 [1] (d) (i) Calculate the total decrease in temperature θY of the hot water in beaker Y during the 180 s. θY = .....................................................°C [1] (ii) Calculate the average rate of temperature decrease RY of the hot water in beaker Y during the 180 s. Use the equation shown. θY RY = 180 RY = ................................................ °C / s [1] (e) State which is the more effective method of insulating a beaker to prevent thermal energy loss from hot water. Use your results from (b)(ii) and (d)(ii) and explain how you reach this conclusion. more effective method .............................................................................................................. explanation ............................................................................................................................... ................................................................................................................................................... [1] (f) State one factor which is controlled to ensure that the comparison between beaker X and beaker Y is fair. ............................................................................................................................................. [1] [Total: 12]
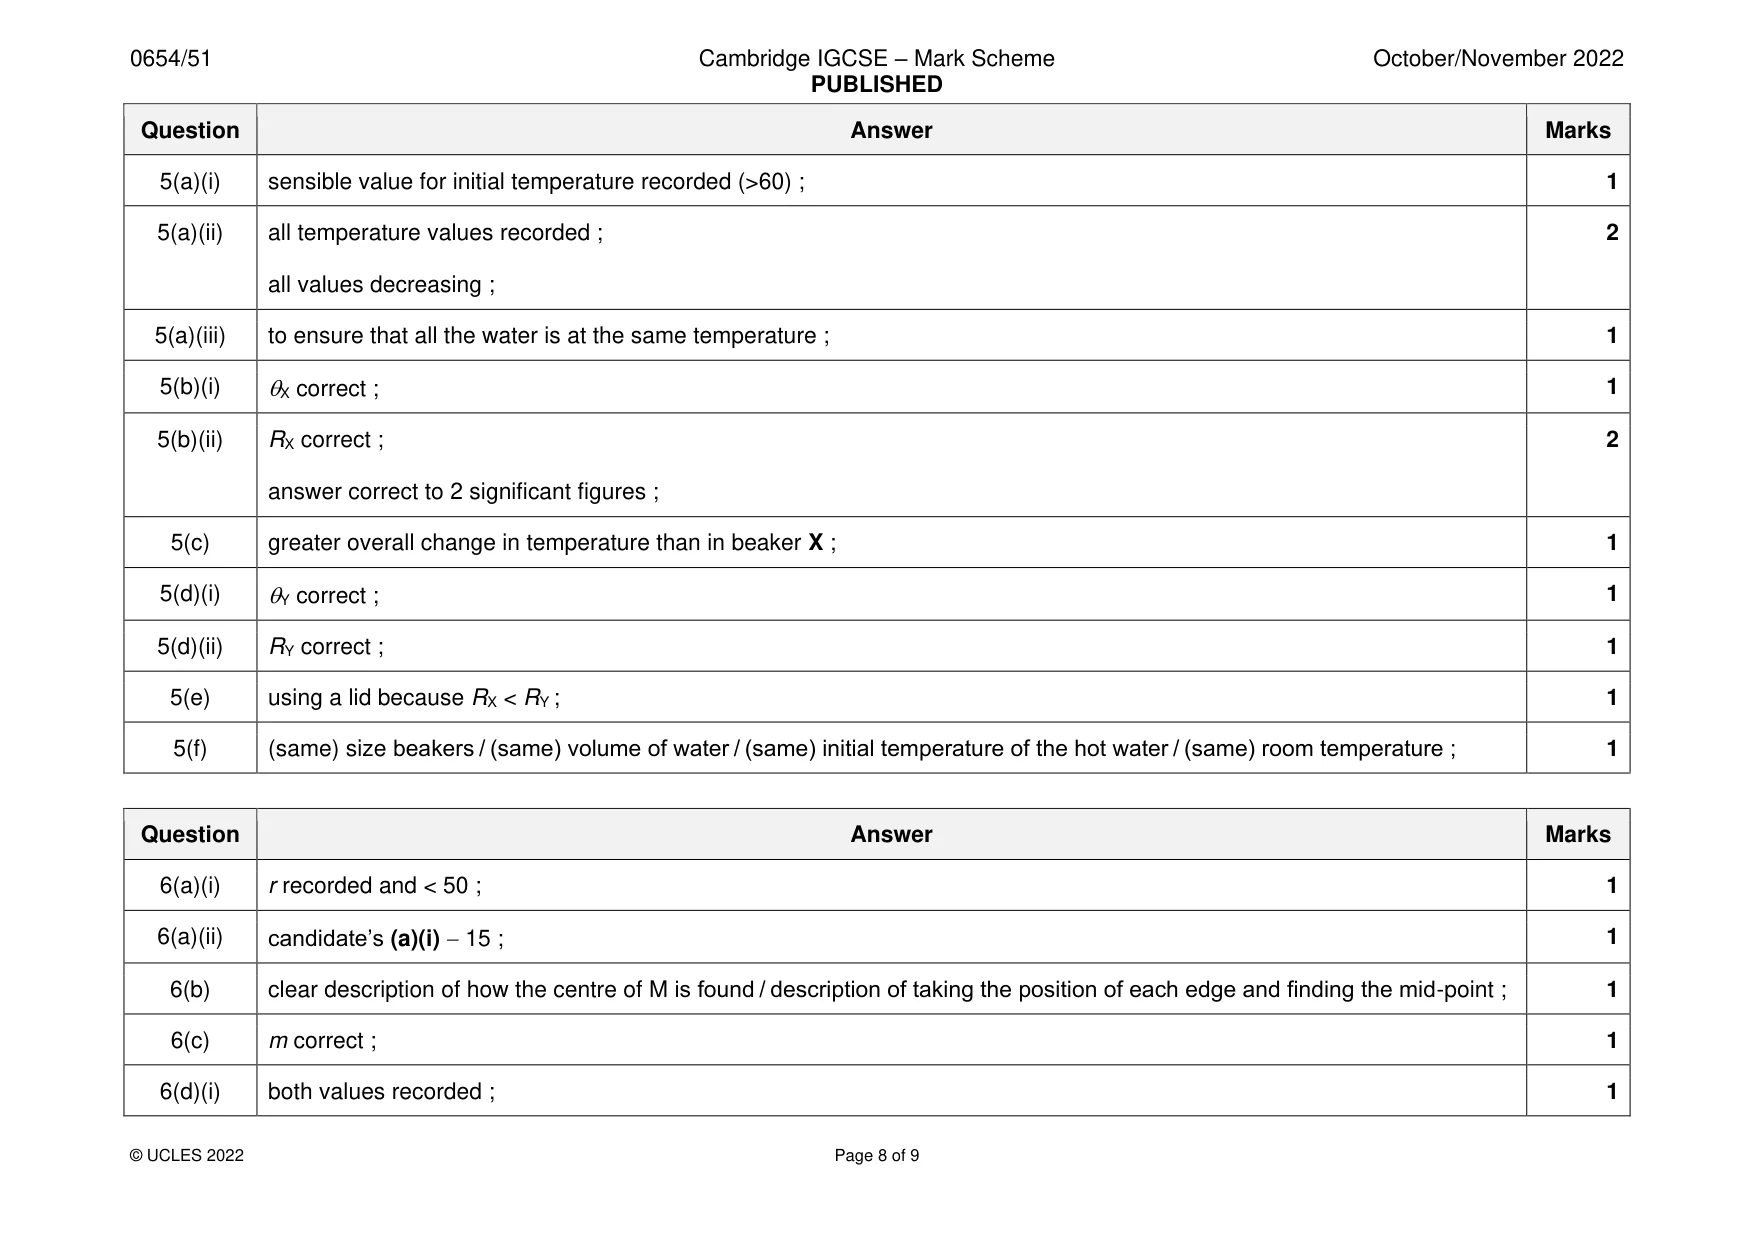
Mark scheme: 5(a)(i) sensible value for initial temperature recorded (>60) ; 1 5(a)(ii) all temperature values recorded ; 2 all values decreasing ; 5(a)(iii) to ensure that all the water is at the same temperature ; 1 5(b)(i) X correct ; 1 5(b)(ii) RX correct ; 2 answer correct to 2 significant figures ; 5(c) greater overall change in temperature than in beaker X ; 1 5(d)(i) Y correct ; 1 5(d)(ii) RY correct ; 1 5(e) using a lid because RX < RY ; 1 5(f) (same) size beakers / (same) volume of water / (same) initial temperature of the hot water / (same) room temperature ; 1
Q6 · You are going to measure the density of the material from which a metre rule is made
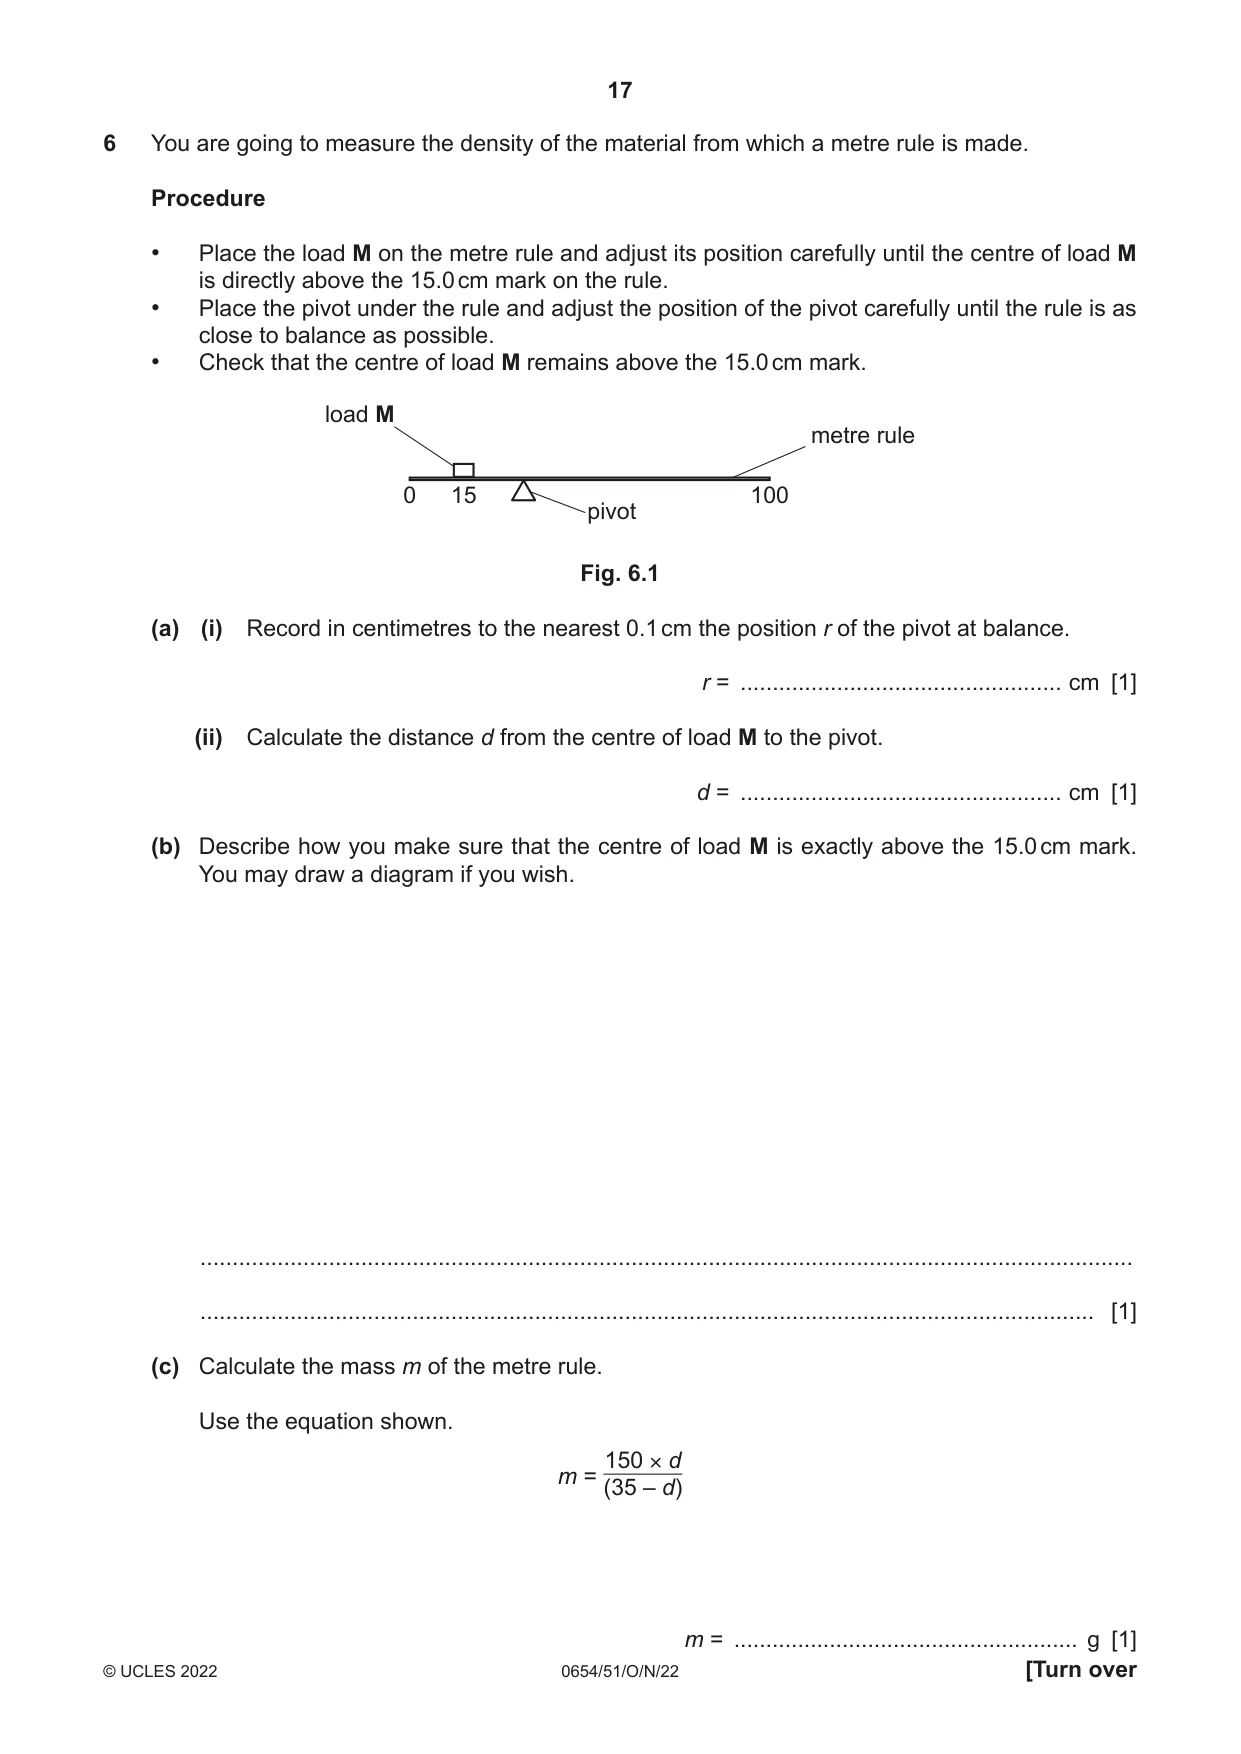
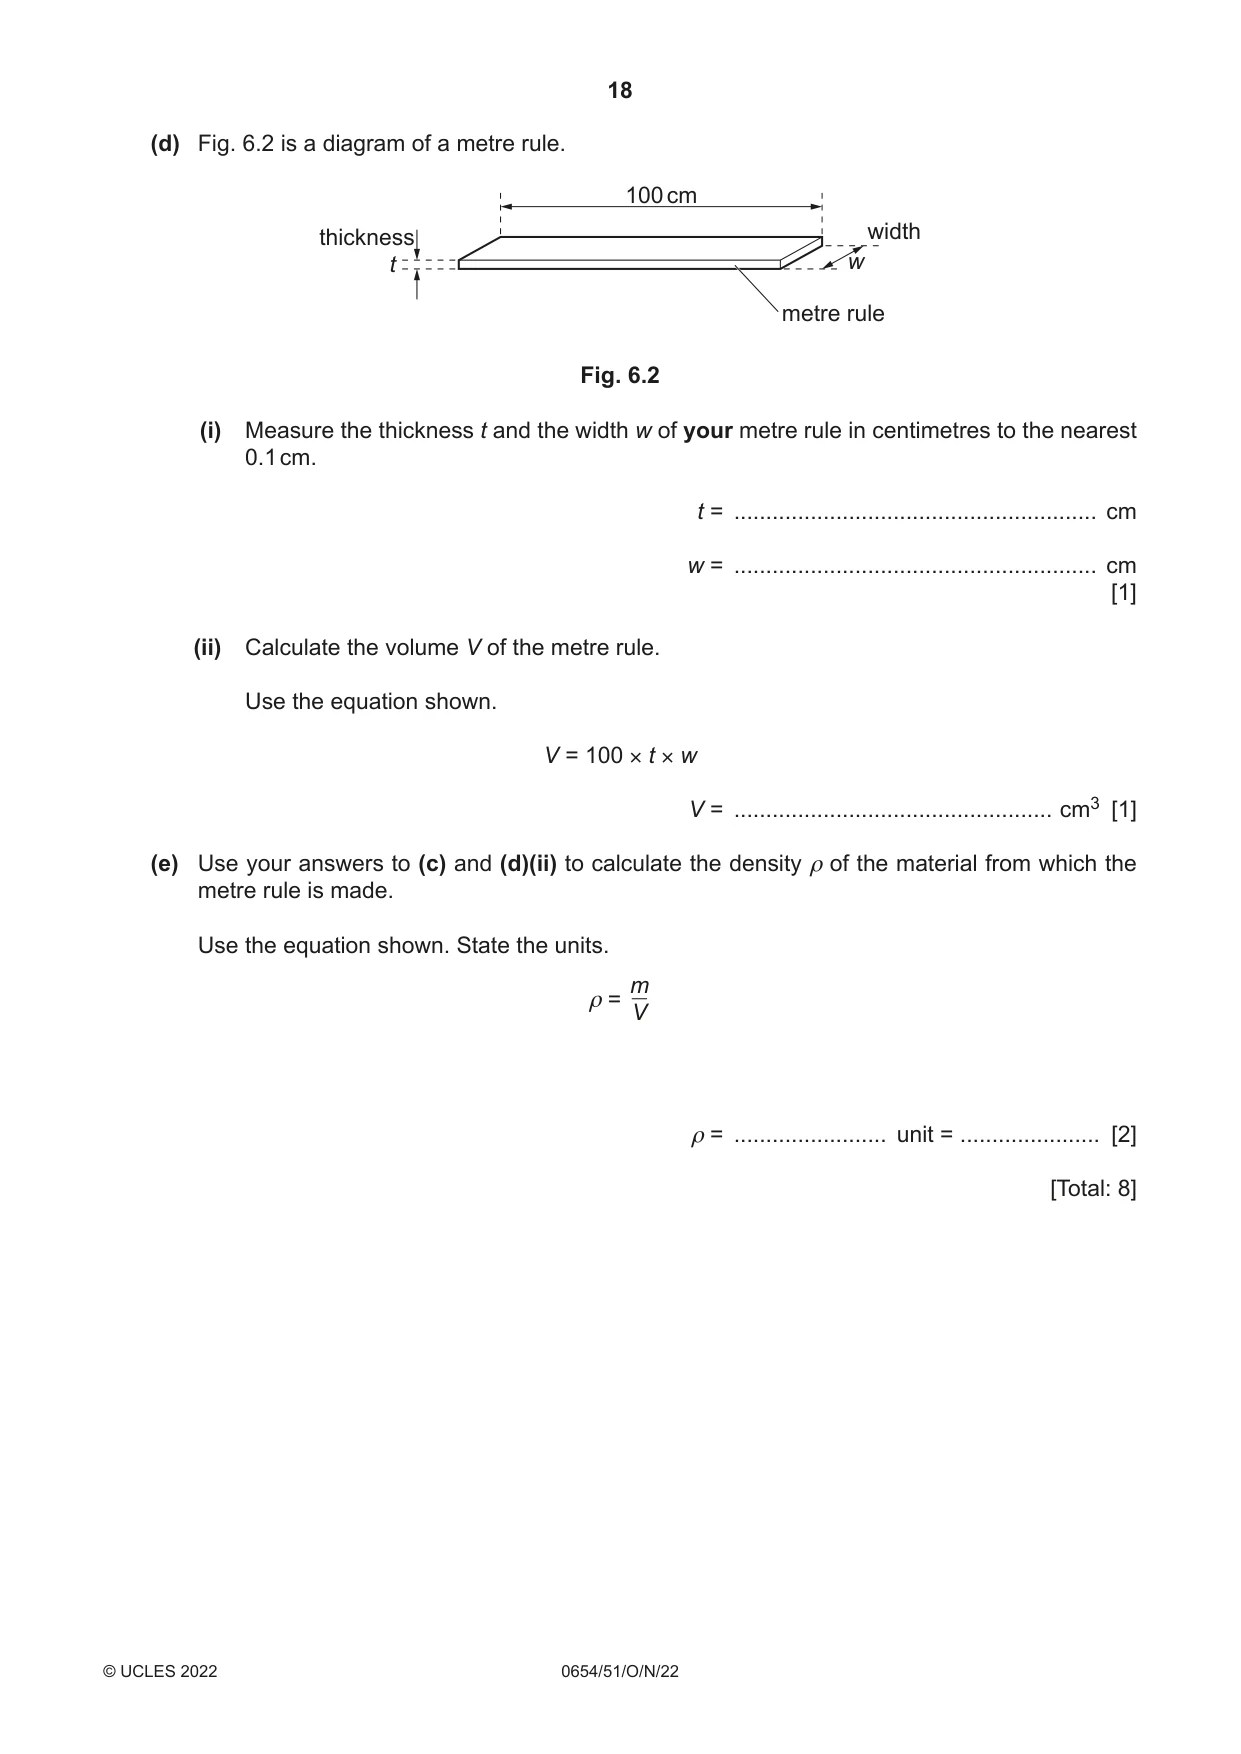
6 You are going to measure the density of the material from which a metre rule is made. Procedure • Place the load M on the metre rule and adjust its position carefully until the centre of load M is directly above the 15.0 cm mark on the rule. • Place the pivot under the rule and adjust the position of the pivot carefully until the rule is as close to balance as possible. • Check that the centre of load M remains above the 15.0 cm mark. load M metre rule 0 15 100 pivot Fig. 6.1 (a) (i) Record in centimetres to the nearest 0.1 cm the position r of the pivot at balance. r = .................................................. cm [1] (ii) Calculate the distance d from the centre of load M to the pivot. d = .................................................. cm [1] (b) Describe how you make sure that the centre of load M is exactly above the 15.0 cm mark. You may draw a diagram if you wish. ................................................................................................................................................. ........................................................................................................................................... [1] (c) Calculate the mass m of the metre rule. Use the equation shown. 150 × d m = (35 – d) m = ...................................................... g [1] (d) Fig. 6.2 is a diagram of a metre rule. 100 cm thickness width t w metre rule Fig. 6.2 (i) Measure the thickness t and the width w of your metre rule in centimetres to the nearest 0.1 cm. t = ......................................................... cm w = ......................................................... cm [1] (ii) Calculate the volume V of the metre rule. Use the equation shown. V = 100 × t × w V = .................................................. cm3 [1] (e) Use your answers to (c) and (d)(ii) to calculate the density ρ of the material from which the metre rule is made. Use the equation shown. State the units. m ρ = V ρ = ........................ unit = ...................... [2] [Total: 8]
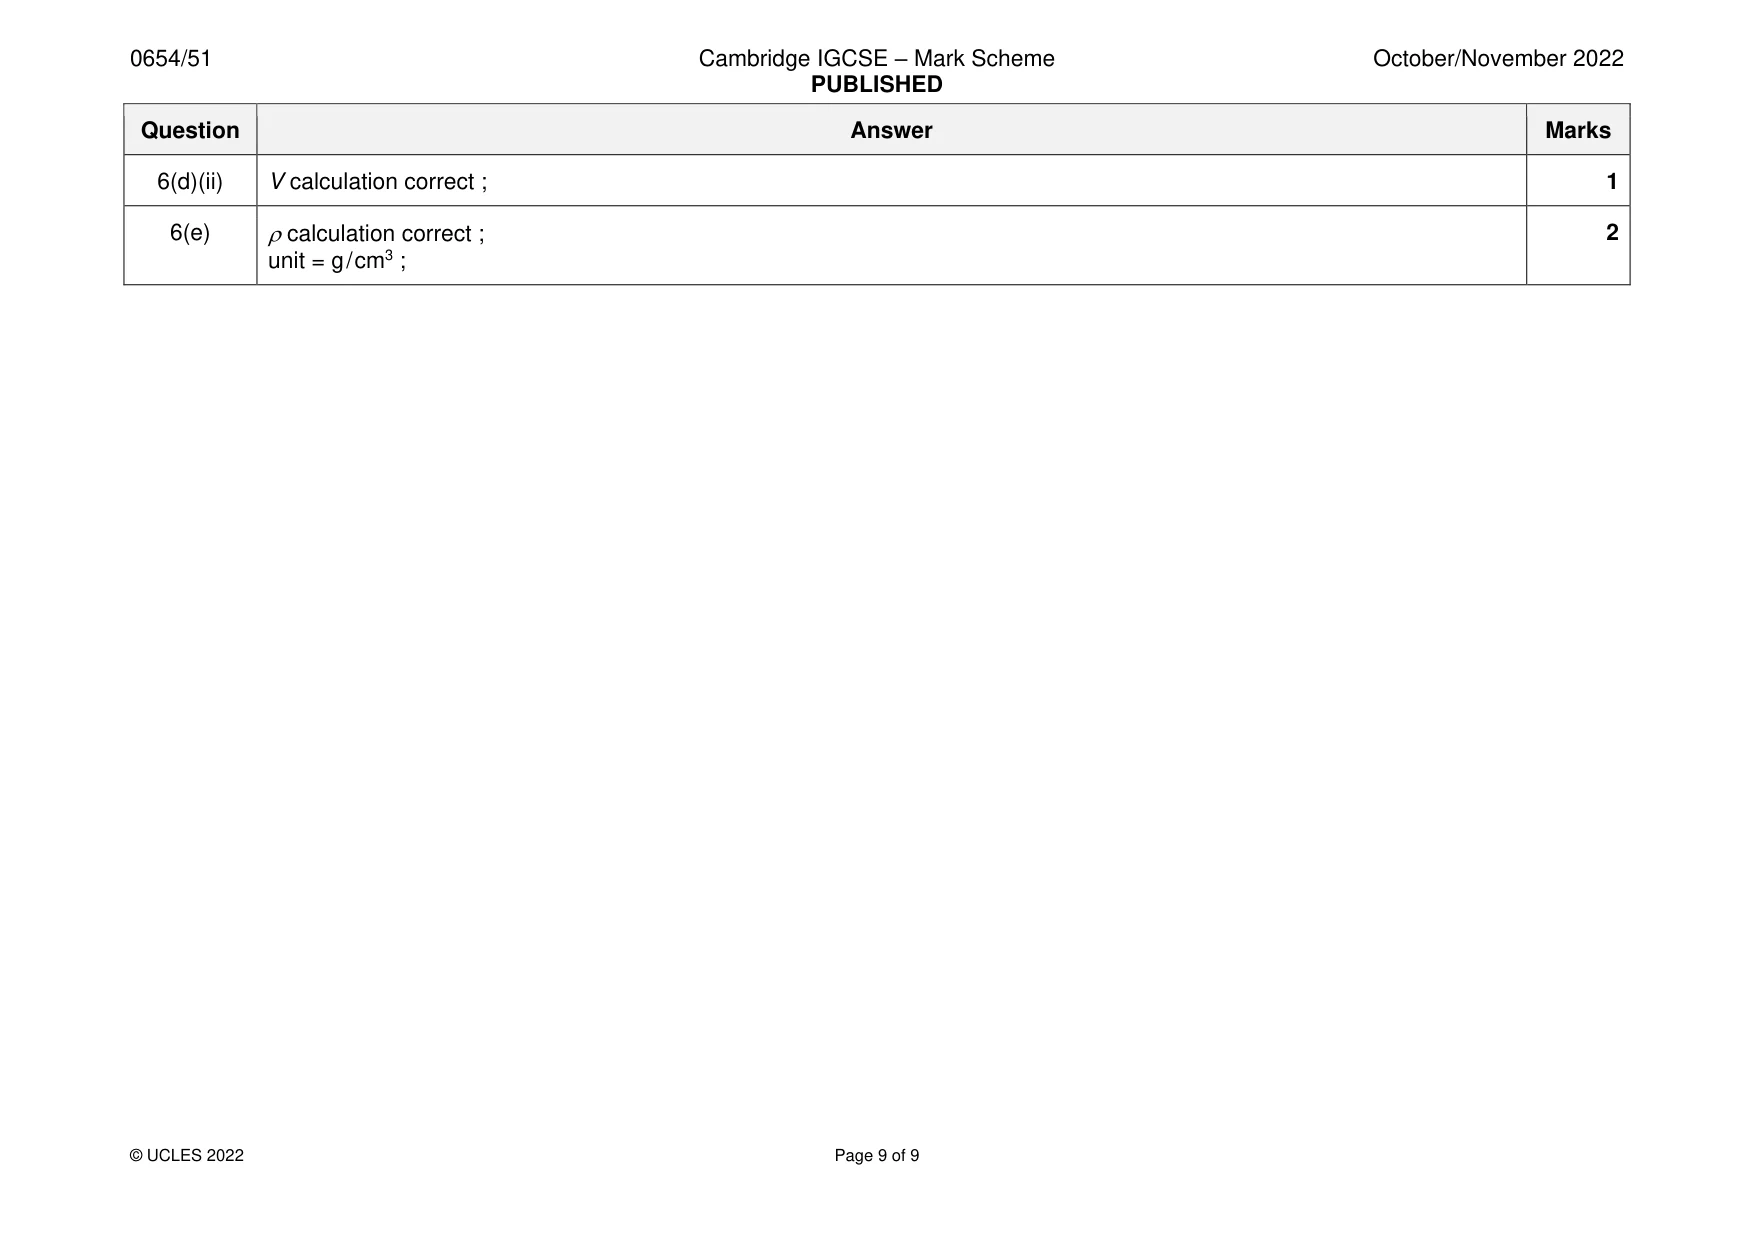
Mark scheme: 6(a)(i) r recorded and < 50 ; 1 6(a)(ii) candidate’s (a)(i) − 15 ; 1 6(b) clear description of how the centre of M is found / description of taking the position of each edge and finding the mid-point ; 1 6(c) m correct ; 1 6(d)(i) both values recorded ; 1 6(d)(ii) V calculation correct ; 1 6(e) calculation correct ; 2 unit = g / cm3 ;
More questions on Physical quantities and measurement techniques
What was in this paper
The subtopics covered by these 6 questions, and how many questions each got. Open one in a new tab to see every Cambridge question on it.
What you needed in this session
Cambridge’s own grade thresholds for 2022 Oct/Nov, Paper 5 · Variant 1. A higher threshold means an easier paper — the bar moves with how the cohort did.