Cambridge IGCSE Sciences - Co-ordinated (Double) 0654 — 2021 Oct/Nov Paper 5 · Variant 1
0654/51/O/N/21 · 6 questions · 60 marks · ≈68 min
The question paper and its mark scheme, free to read here and free to download. This is Cambridge’s own paper, exactly as it was sat.
Question paper16 pages



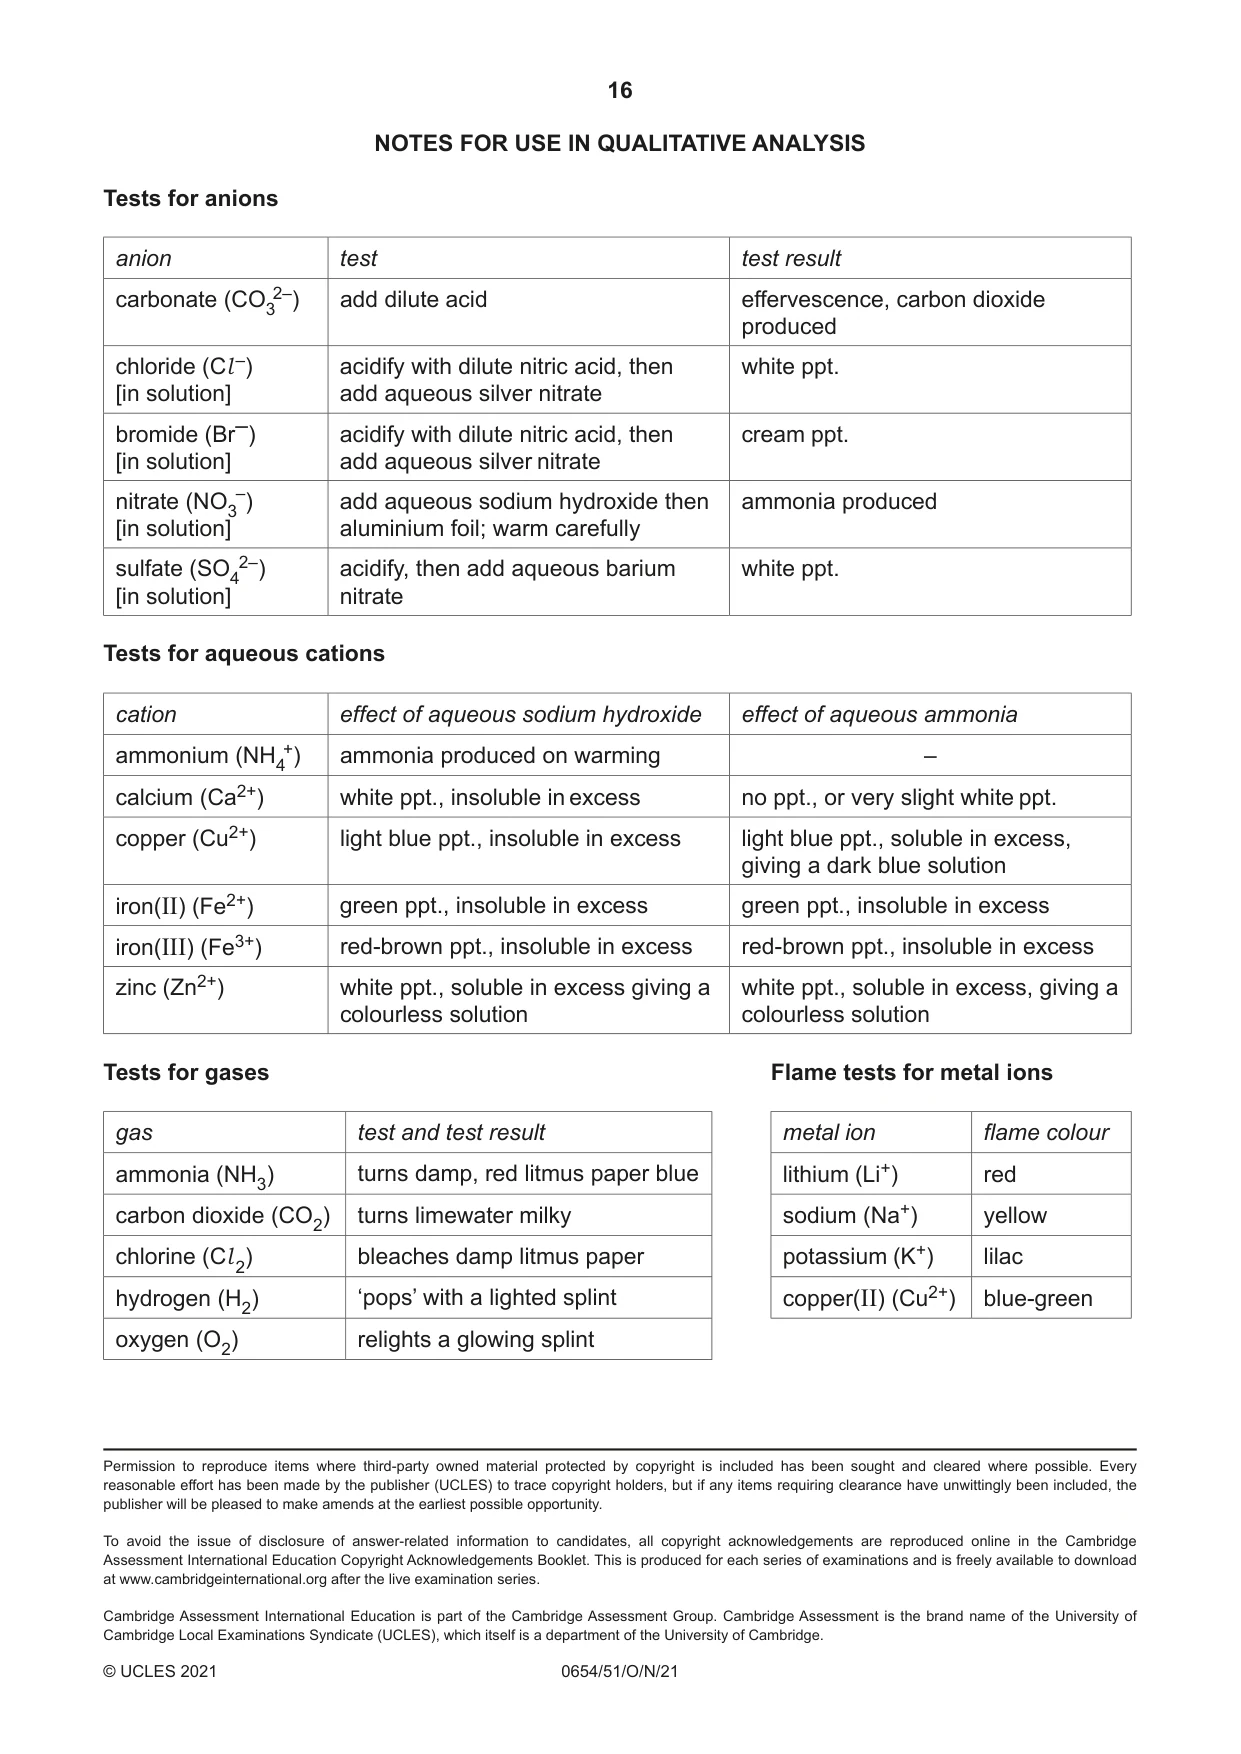
Mark scheme9 pages
Answers below. Sit the paper first if you are practising.
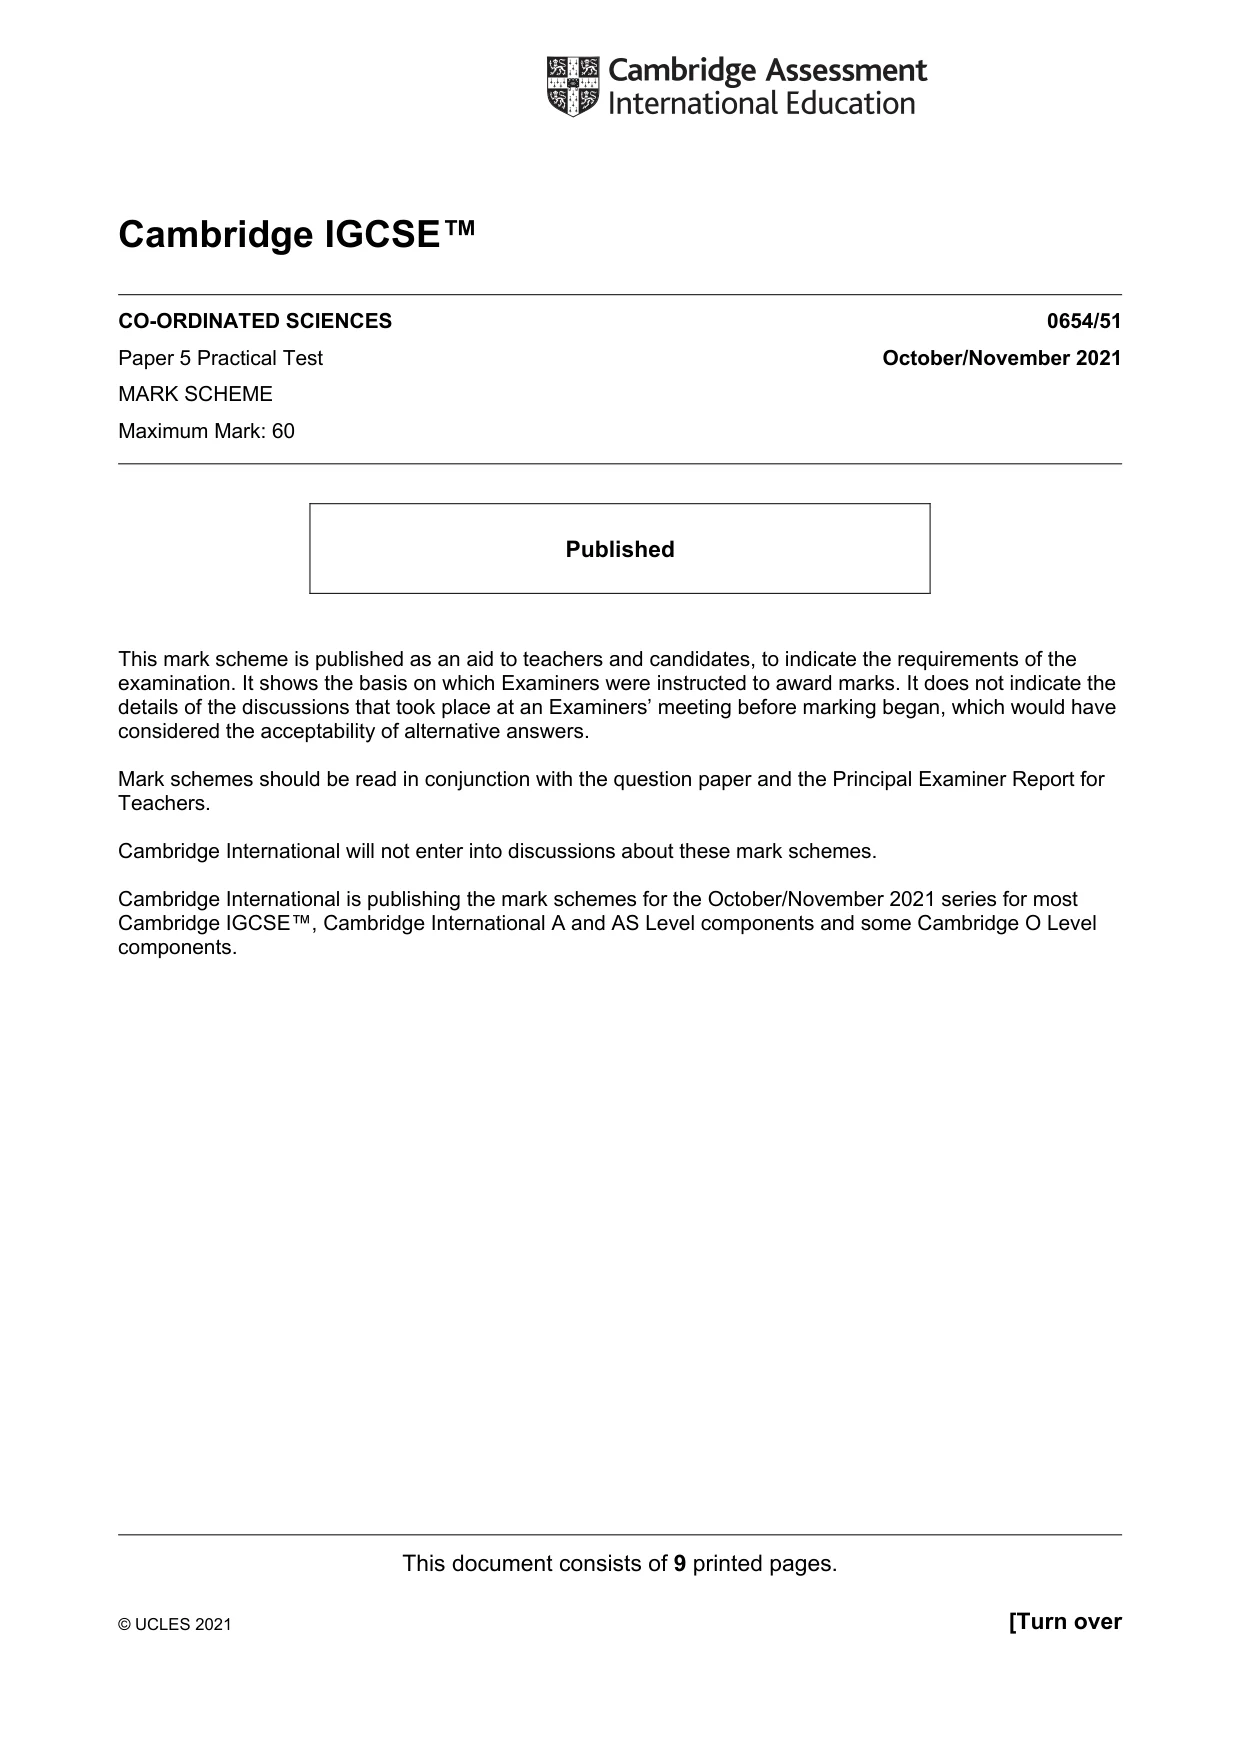
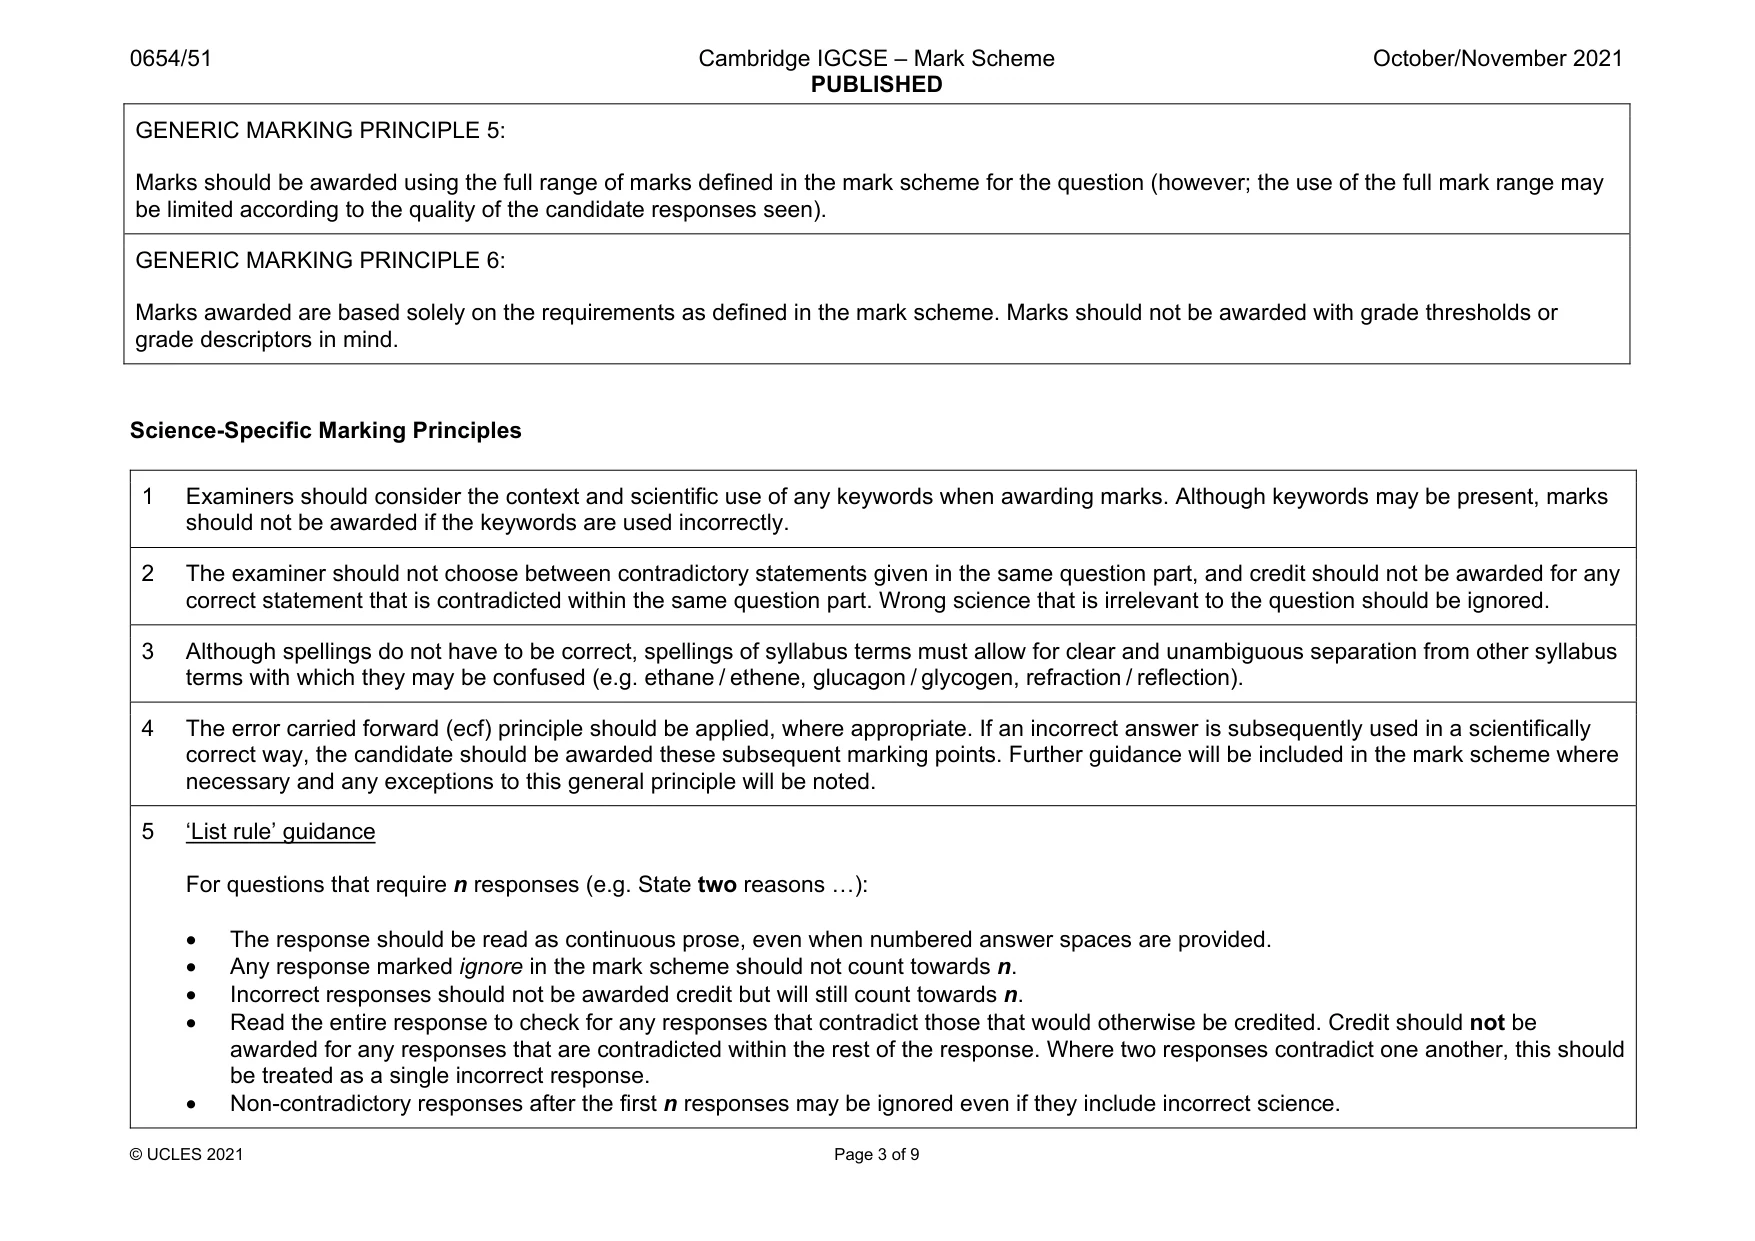
Questions as text
Q1 · You are provided with a flower
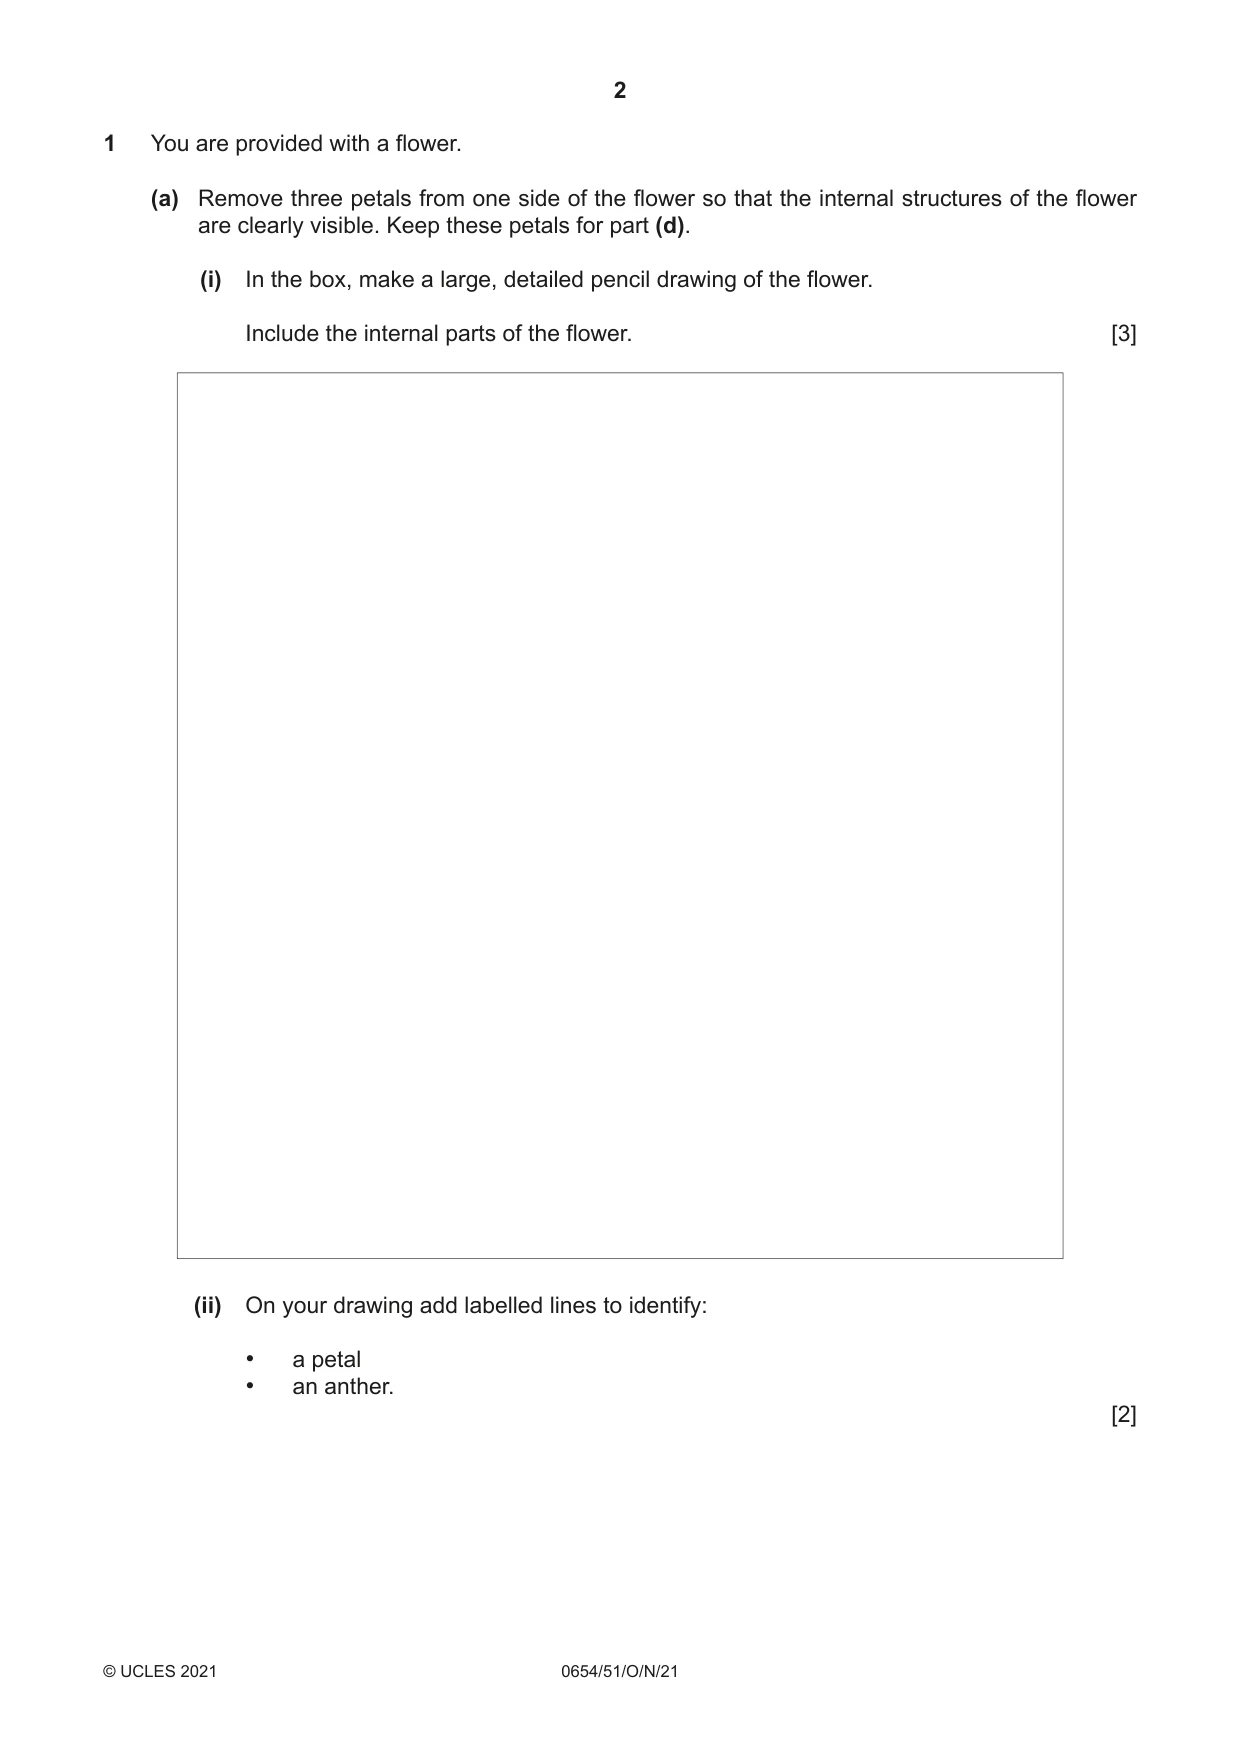
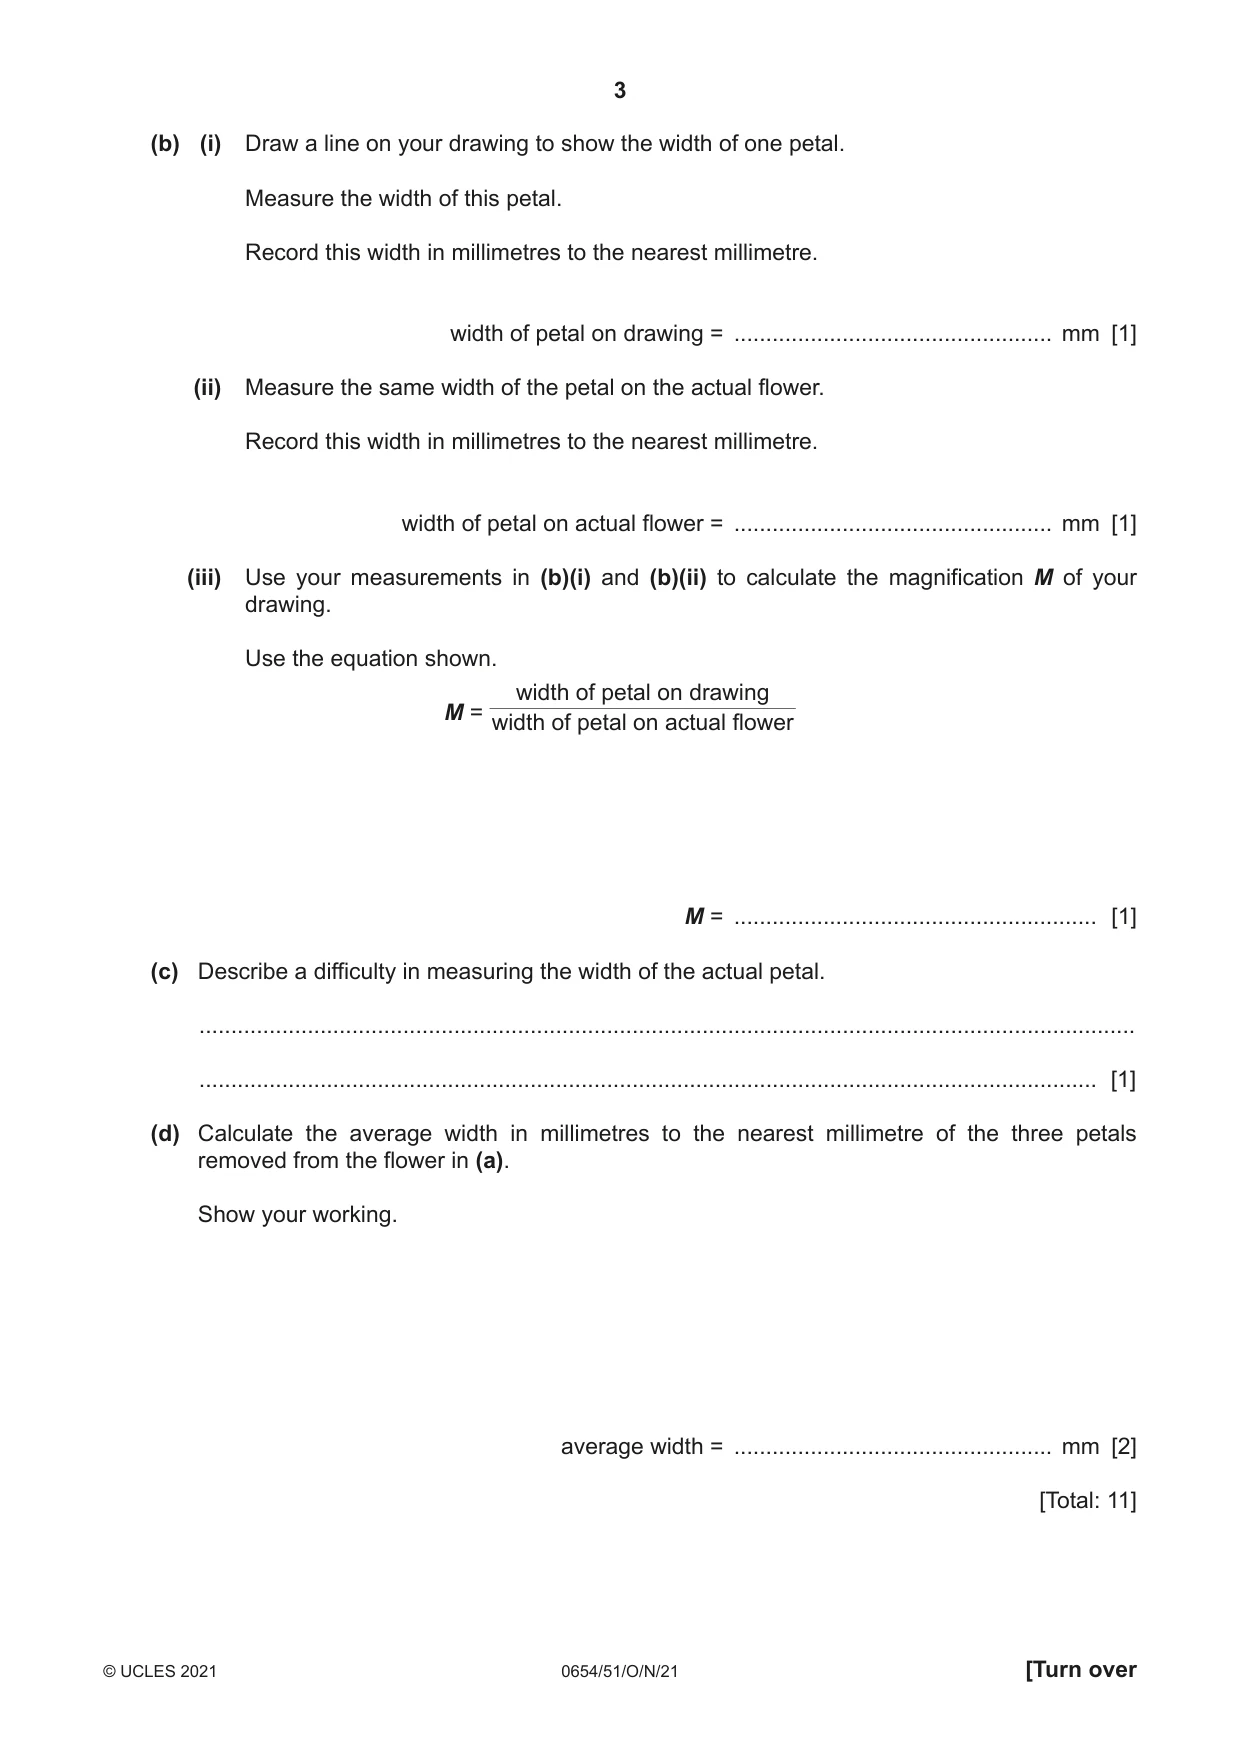
1 You are provided with a flower. (a) Remove three petals from one side of the flower so that the internal structures of the flower are clearly visible. Keep these petals for part (d). (i) In the box, make a large, detailed pencil drawing of the flower. Include the internal parts of the flower. [3] (ii) On your drawing add labelled lines to identify: • a petal • an anther. [2] (b) (i) Draw a line on your drawing to show the width of one petal. Measure the width of this petal. Record this width in millimetres to the nearest millimetre. width of petal on drawing = .................................................. mm [1] (ii) Measure the same width of the petal on the actual flower. Record this width in millimetres to the nearest millimetre. width of petal on actual flower = .................................................. mm [1] (iii) Use your measurements in (b)(i) and (b)(ii) to calculate the magnification M of your drawing. Use the equation shown. width of petal on drawing M = width of petal on actual flower M = ......................................................... [1] (c) Describe a difficulty in measuring the width of the actual petal. ................................................................................................................................................... ............................................................................................................................................. [1] (d) Calculate the average width in millimetres to the nearest millimetre of the three petals removed from the flower in (a). Show your working. average width = .................................................. mm [2] [Total: 11]
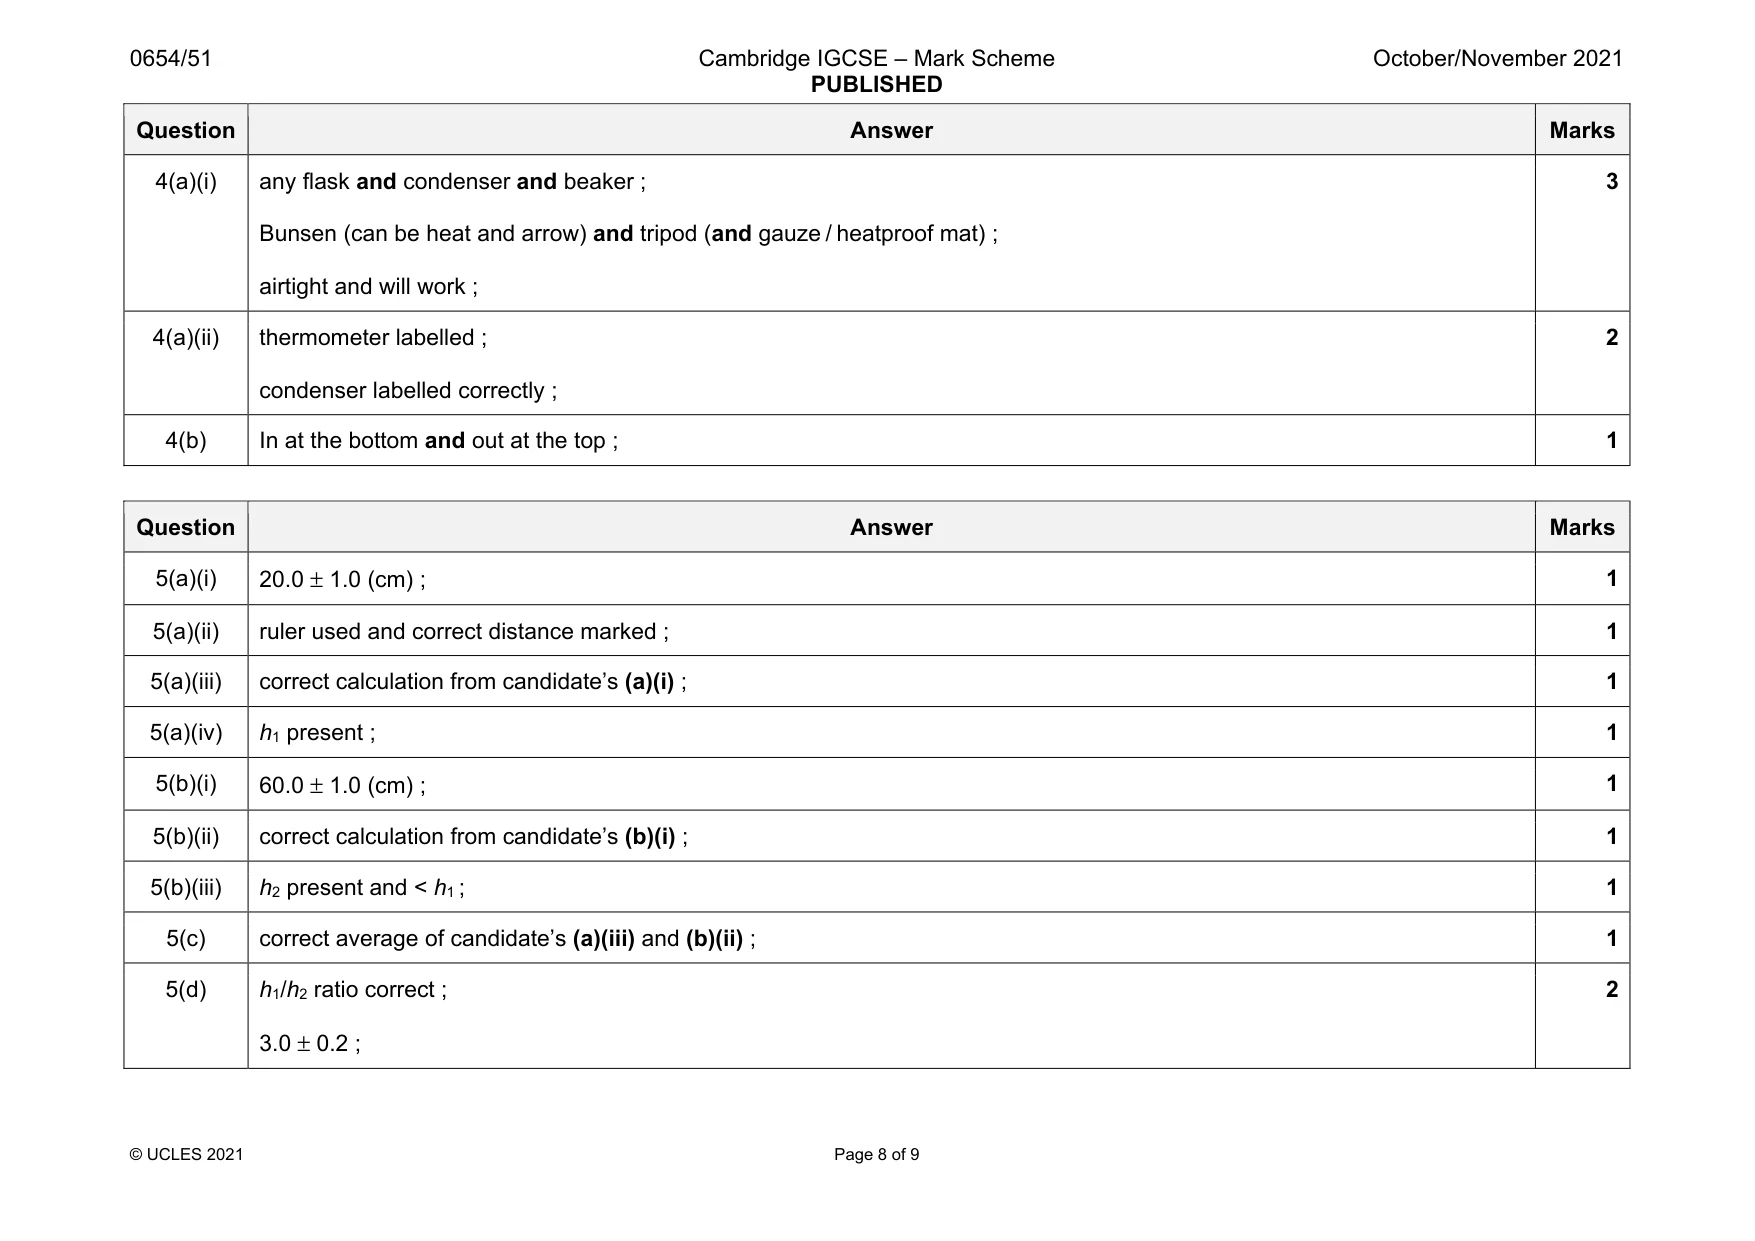
Mark scheme: 1(a)(i) size – at least half of the box ; quality – clear and continuous outline ; detail – carpel and stamen ; 3 1(a)(ii) petal ; anther ; 2 1(b)(i) measurement correct and line drawn ; 1 1(b)(ii) both measurements to nearest mm ; 1 1(b)(iii) correct calculation ; 1 1(c) not all the same width / curved / not flat ; 1 1(d) 3 × widths within 10 % of (b)(i) ; average calculated ; 2
Q2 · You are going to investigate the nutrient content of samples of honey and milk
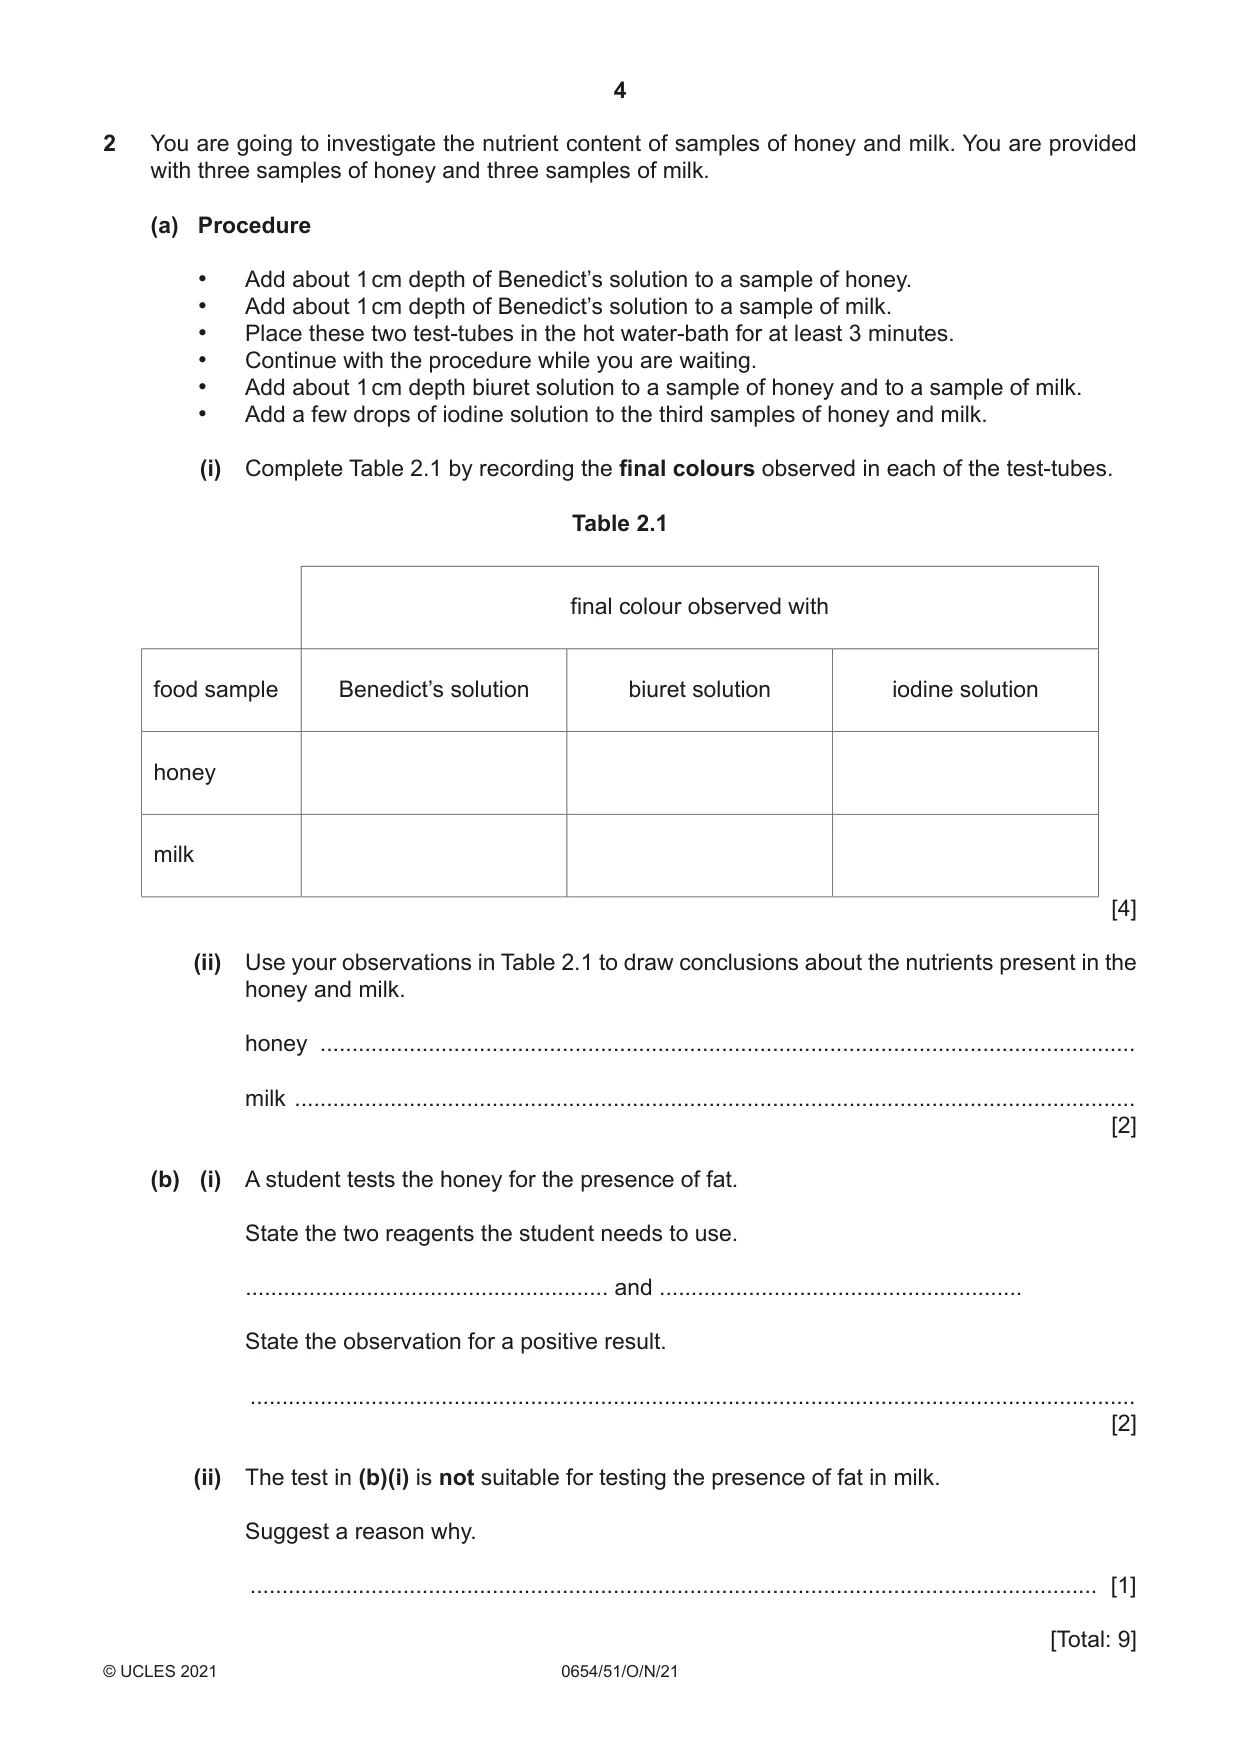
2 You are going to investigate the nutrient content of samples of honey and milk. You are provided with three samples of honey and three samples of milk. (a) Procedure • Add about 1 cm depth of Benedict’s solution to a sample of honey. • Add about 1 cm depth of Benedict’s solution to a sample of milk. • Place these two test-tubes in the hot water-bath for at least 3 minutes. • Continue with the procedure while you are waiting. • Add about 1 cm depth biuret solution to a sample of honey and to a sample of milk. • Add a few drops of iodine solution to the third samples of honey and milk. (i) Complete Table 2.1 by recording the final colours observed in each of the test-tubes. Table 2.1 final colour observed with food sample Benedict’s solution biuret solution iodine solution honey milk [4] (ii) Use your observations in Table 2.1 to draw conclusions about the nutrients present in the honey and milk. honey ................................................................................................................................ milk .................................................................................................................................... [2] (b) (i) A student tests the honey for the presence of fat. State the two reagents the student needs to use. ......................................................... and ......................................................... State the observation for a positive result. ........................................................................................................................................... [2] (ii) The test in (b)(i) is not suitable for testing the presence of fat in milk. Suggest a reason why. ..................................................................................................................................... [1] [Total: 9]
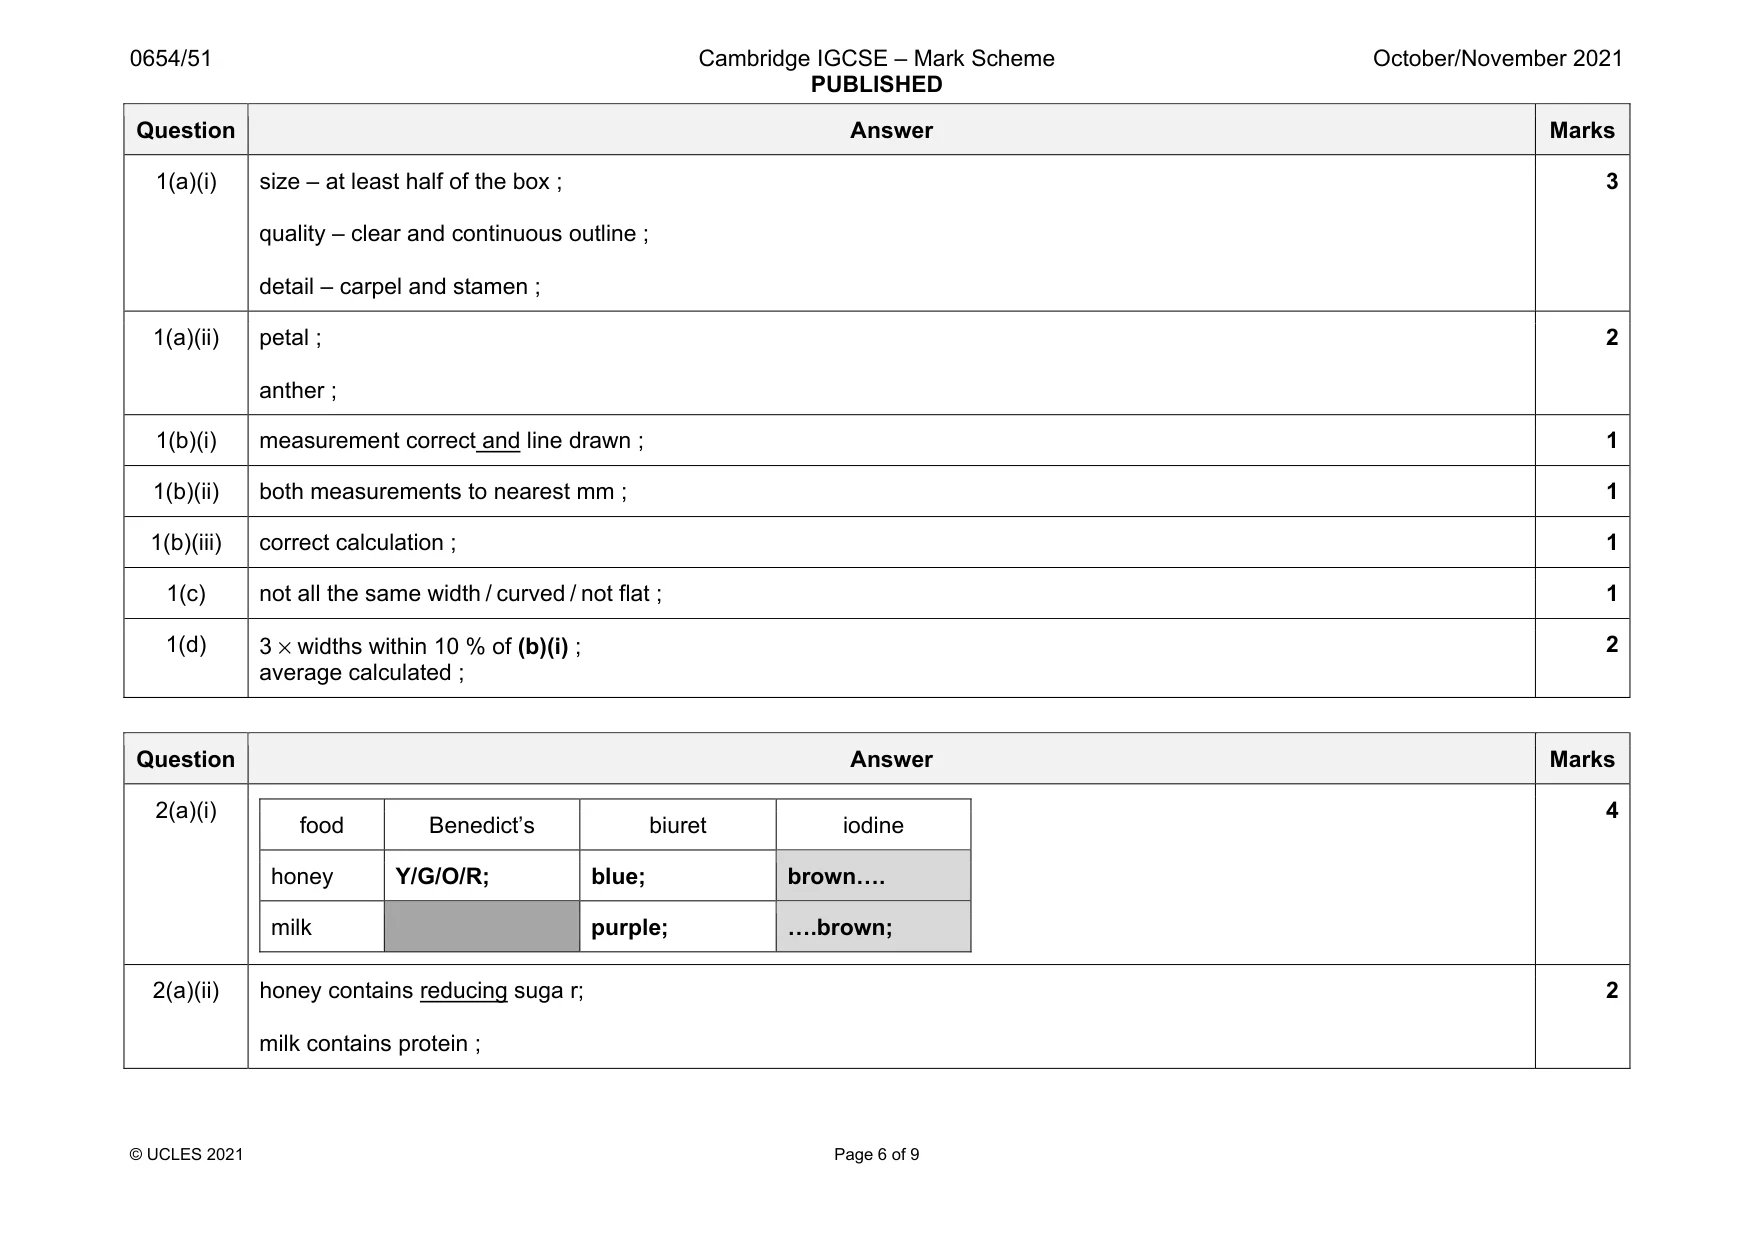
Mark scheme: 2(a)(i) food Benedict’s biuret iodine honey Y/G/O/R; blue; brown…. milk purple; ….brown; 4 2(a)(ii) honey contains reducing suga r; milk contains protein ; 2 Question Answer Marks 2(b)(i) water and ethanol / alcohol ; white emulsion ; 2 2(b)(ii) colour masked / colour change can’t be seen ; 1
Q3 · You are going to investigate the effect of dissolving salt on the boiling point…
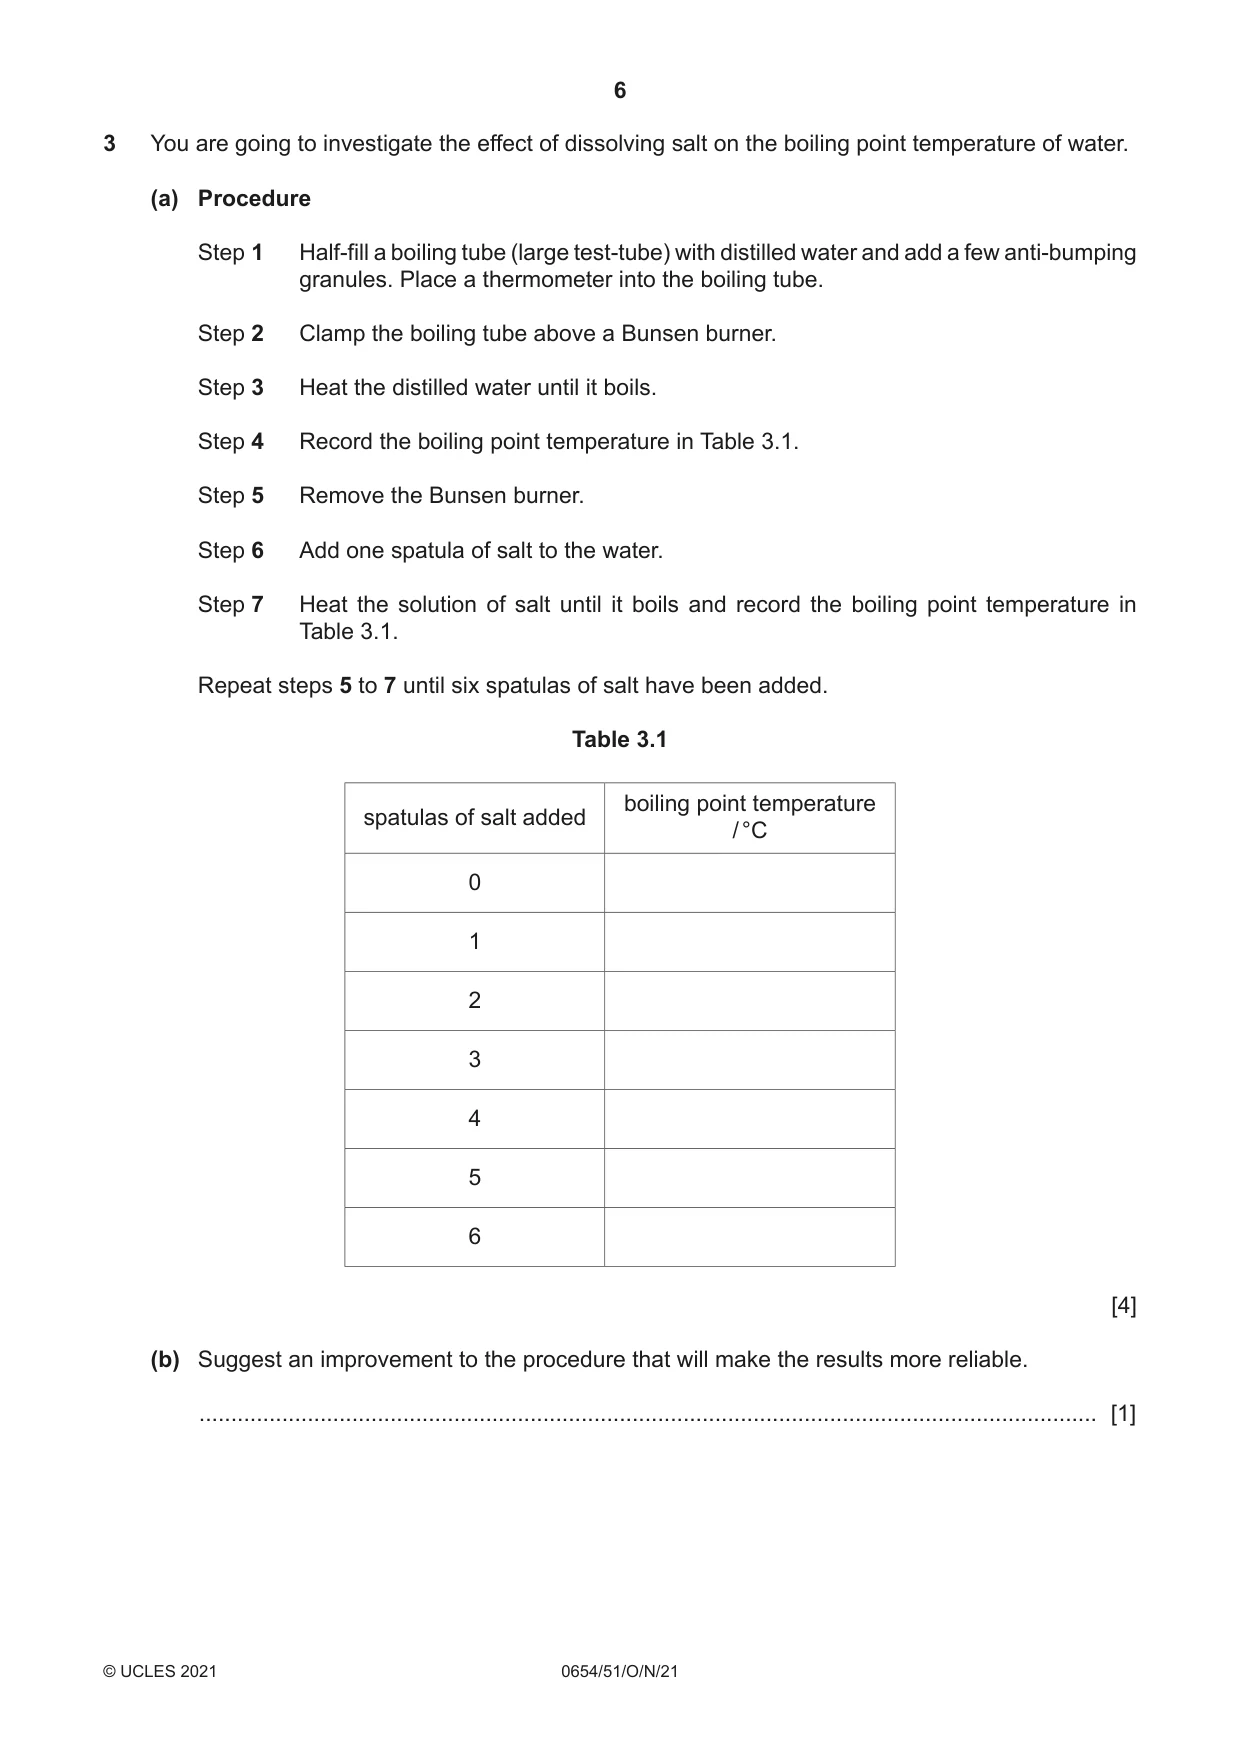
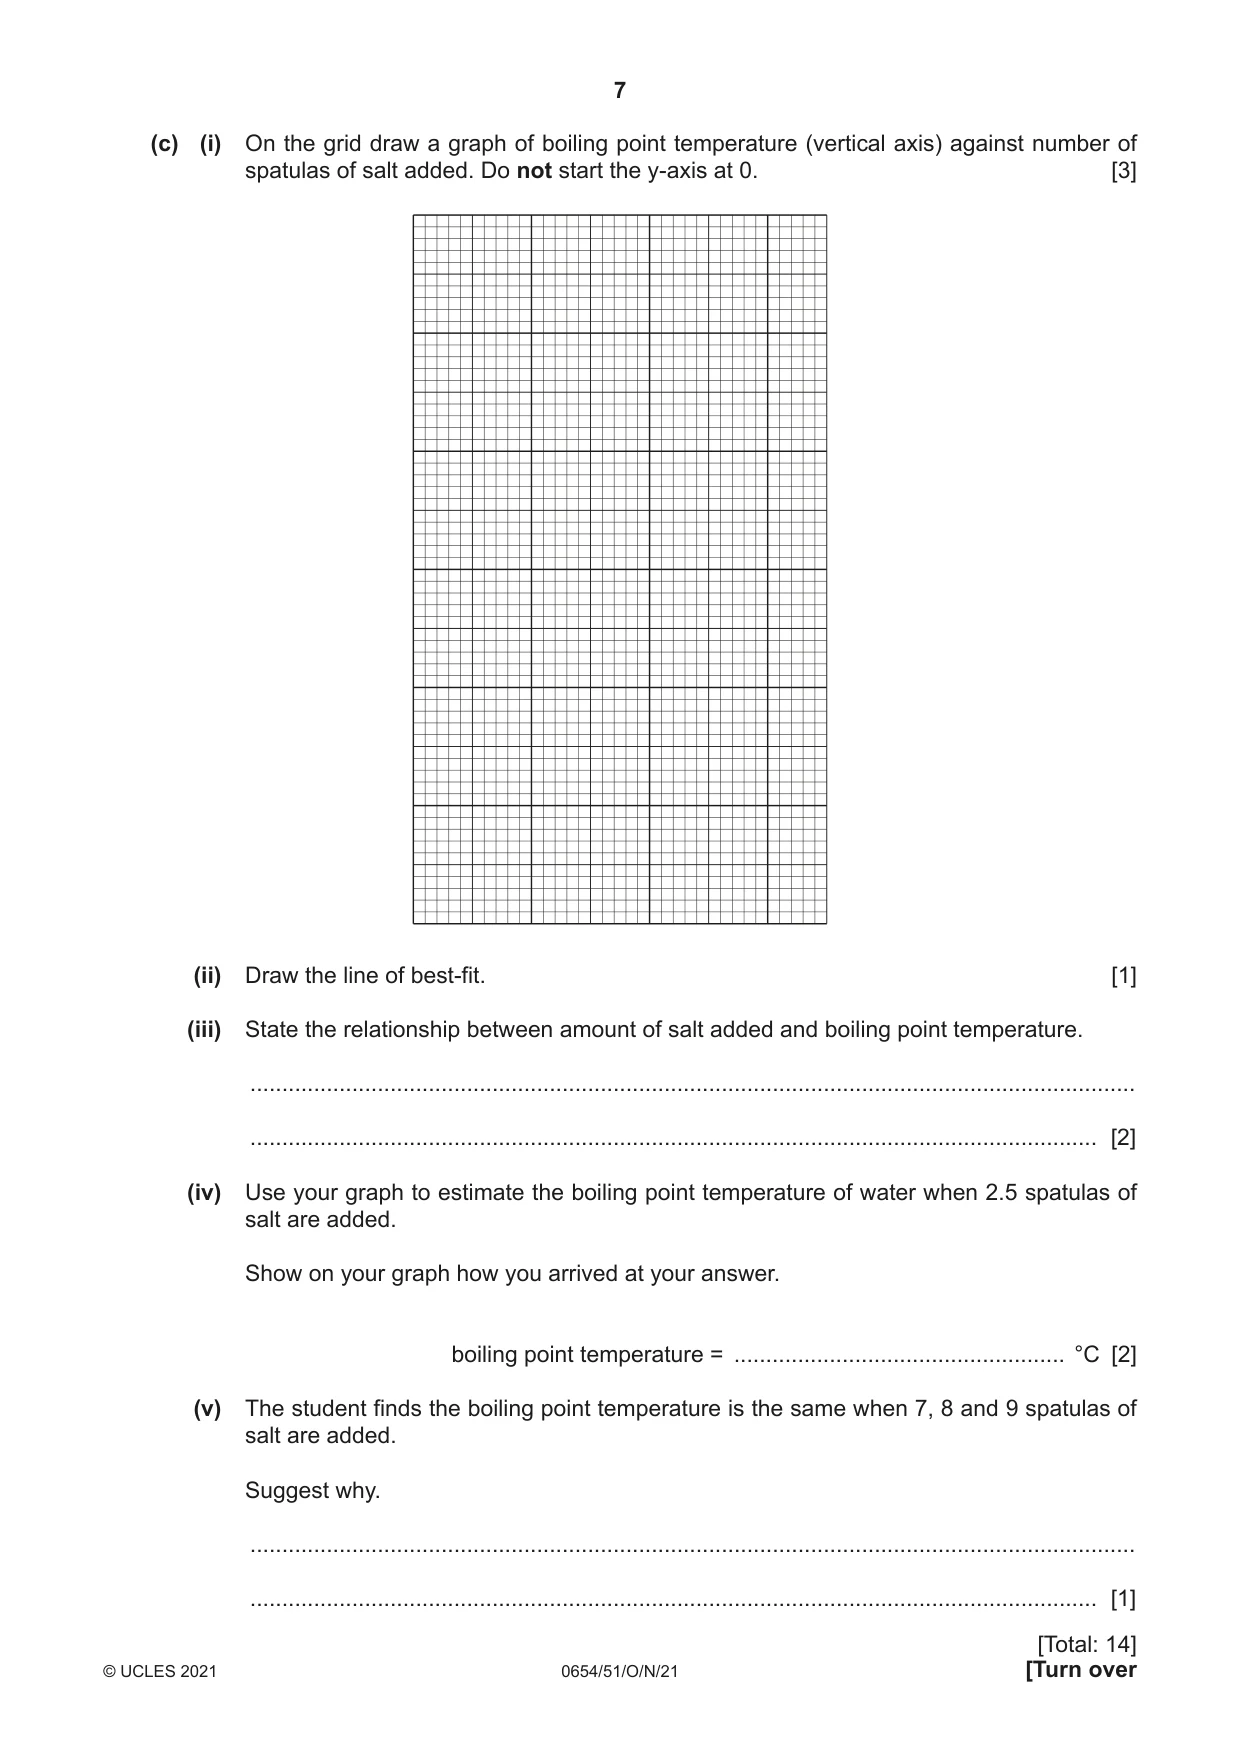
3 You are going to investigate the effect of dissolving salt on the boiling point temperature of water. (a) Procedure Step 1 Half-fill a boiling tube (large test-tube) with distilled water and add a few anti-bumping granules. Place a thermometer into the boiling tube. Step 2 Clamp the boiling tube above a Bunsen burner. Step 3 Heat the distilled water until it boils. Step 4 Record the boiling point temperature in Table 3.1. Step 5 Remove the Bunsen burner. Step 6 Add one spatula of salt to the water. Step 7 Heat the solution of salt until it boils and record the boiling point temperature in Table 3.1. Repeat steps 5 to 7 until six spatulas of salt have been added. Table 3.1 boiling point temperature spatulas of salt added / °C 0 1 2 3 4 5 6 [4] (b) Suggest an improvement to the procedure that will make the results more reliable. ............................................................................................................................................. [1] (c) (i) On the grid draw a graph of boiling point temperature (vertical axis) against number of spatulas of salt added. Do not start the y-axis at 0. [3] (ii) Draw the line of best-fit. [1] (iii) State the relationship between amount of salt added and boiling point temperature. ........................................................................................................................................... ..................................................................................................................................... [2] (iv) Use your graph to estimate the boiling point temperature of water when 2.5 spatulas of salt are added. Show on your graph how you arrived at your answer. boiling point temperature = .................................................... °C [2] (v) The student finds the boiling point temperature is the same when 7, 8 and 9 spatulas of salt are added. Suggest why. ........................................................................................................................................... ..................................................................................................................................... [1]
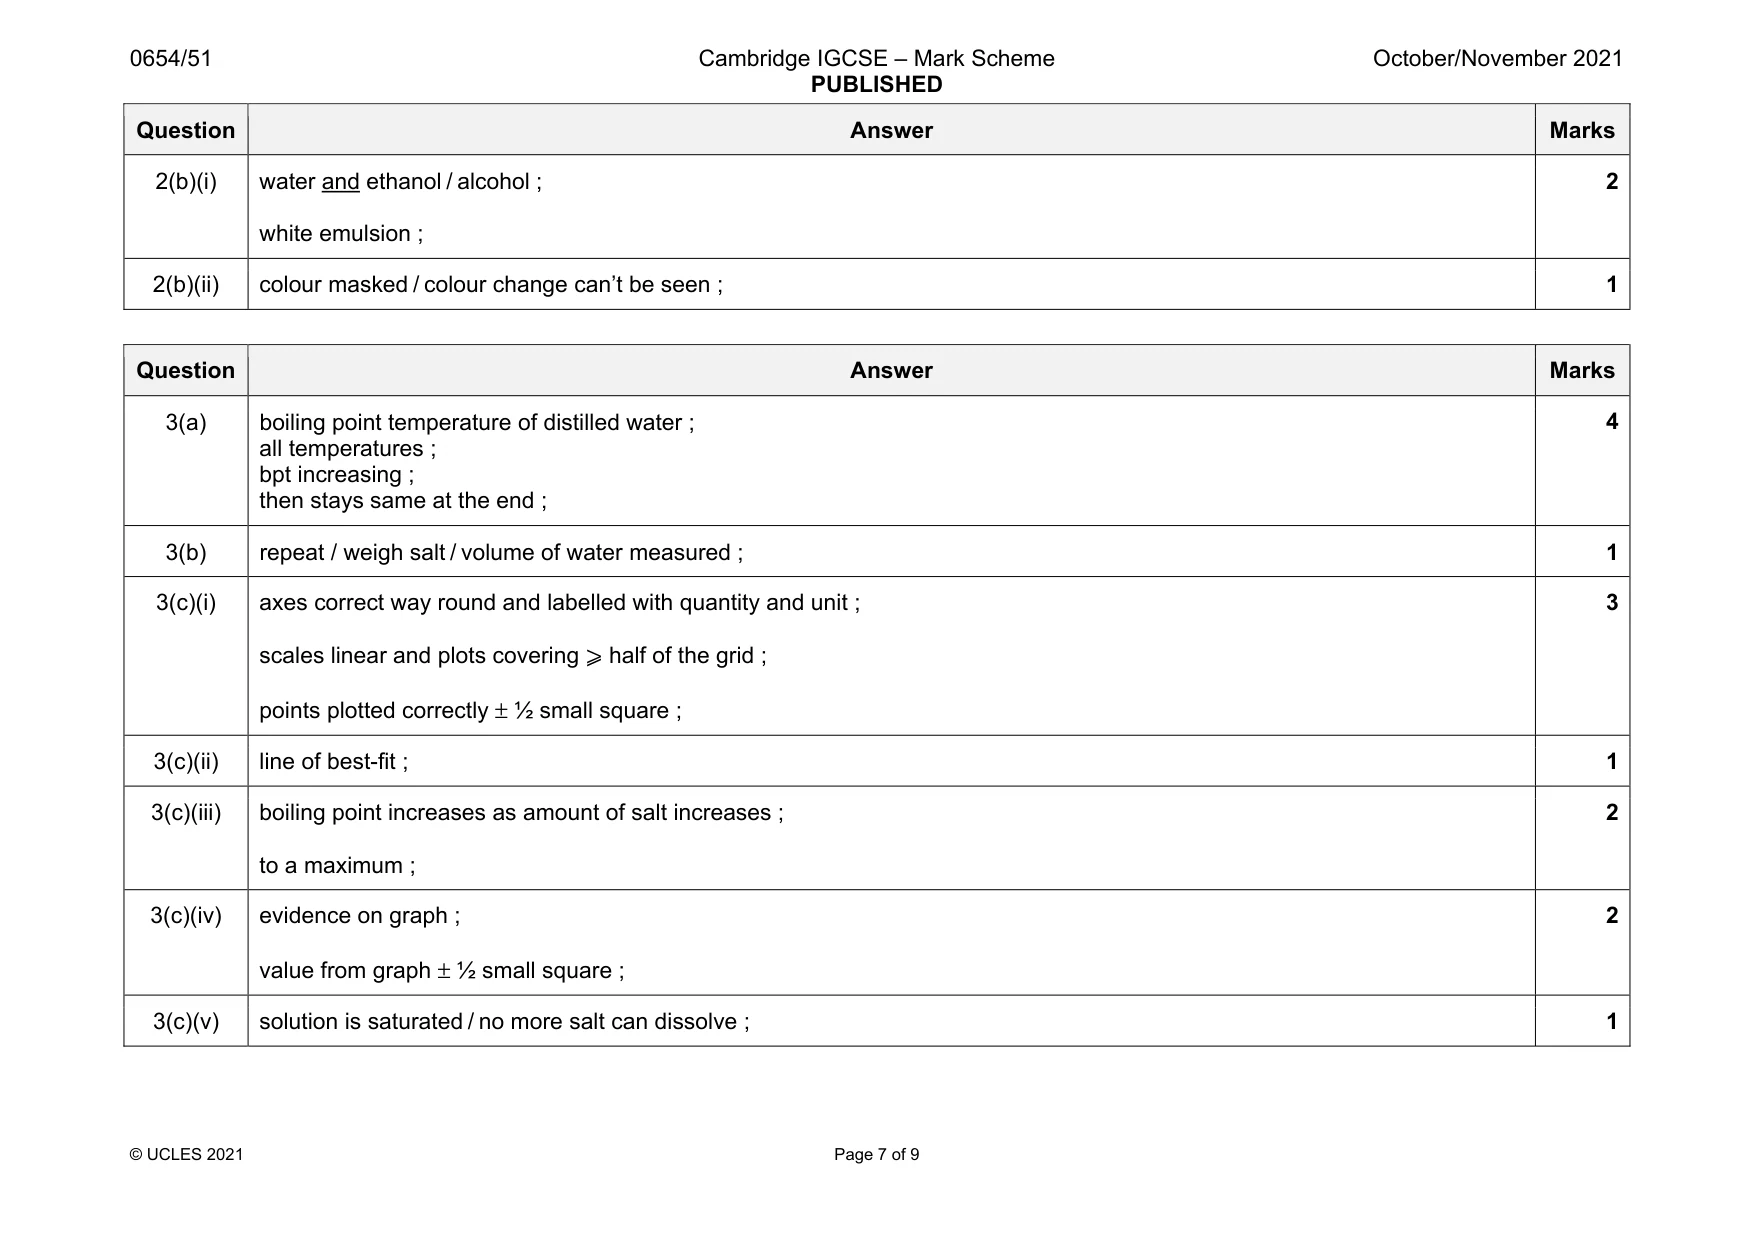
Mark scheme: 3(a) boiling point temperature of distilled water ; all temperatures ; bpt increasing ; then stays same at the end ; 3(b) repeat / weigh salt / volume of water measured ; 1 3(c)(i) axes correct way round and labelled with quantity and unit ; scales linear and plots covering ⩾ half of the grid ; points plotted correctly ± ½ small square ; 3 3(c)(ii) line of best-fit ; 1 3(c)(iii) boiling point increases as amount of salt increases ; to a maximum ; 2 3(c)(iv) evidence on graph ; value from graph ± ½ small square ; 2 3(c)(v) solution is saturated / no more salt can dissolve ; 1
Q4 · Methanol and water are both liquids and they have been mixed together
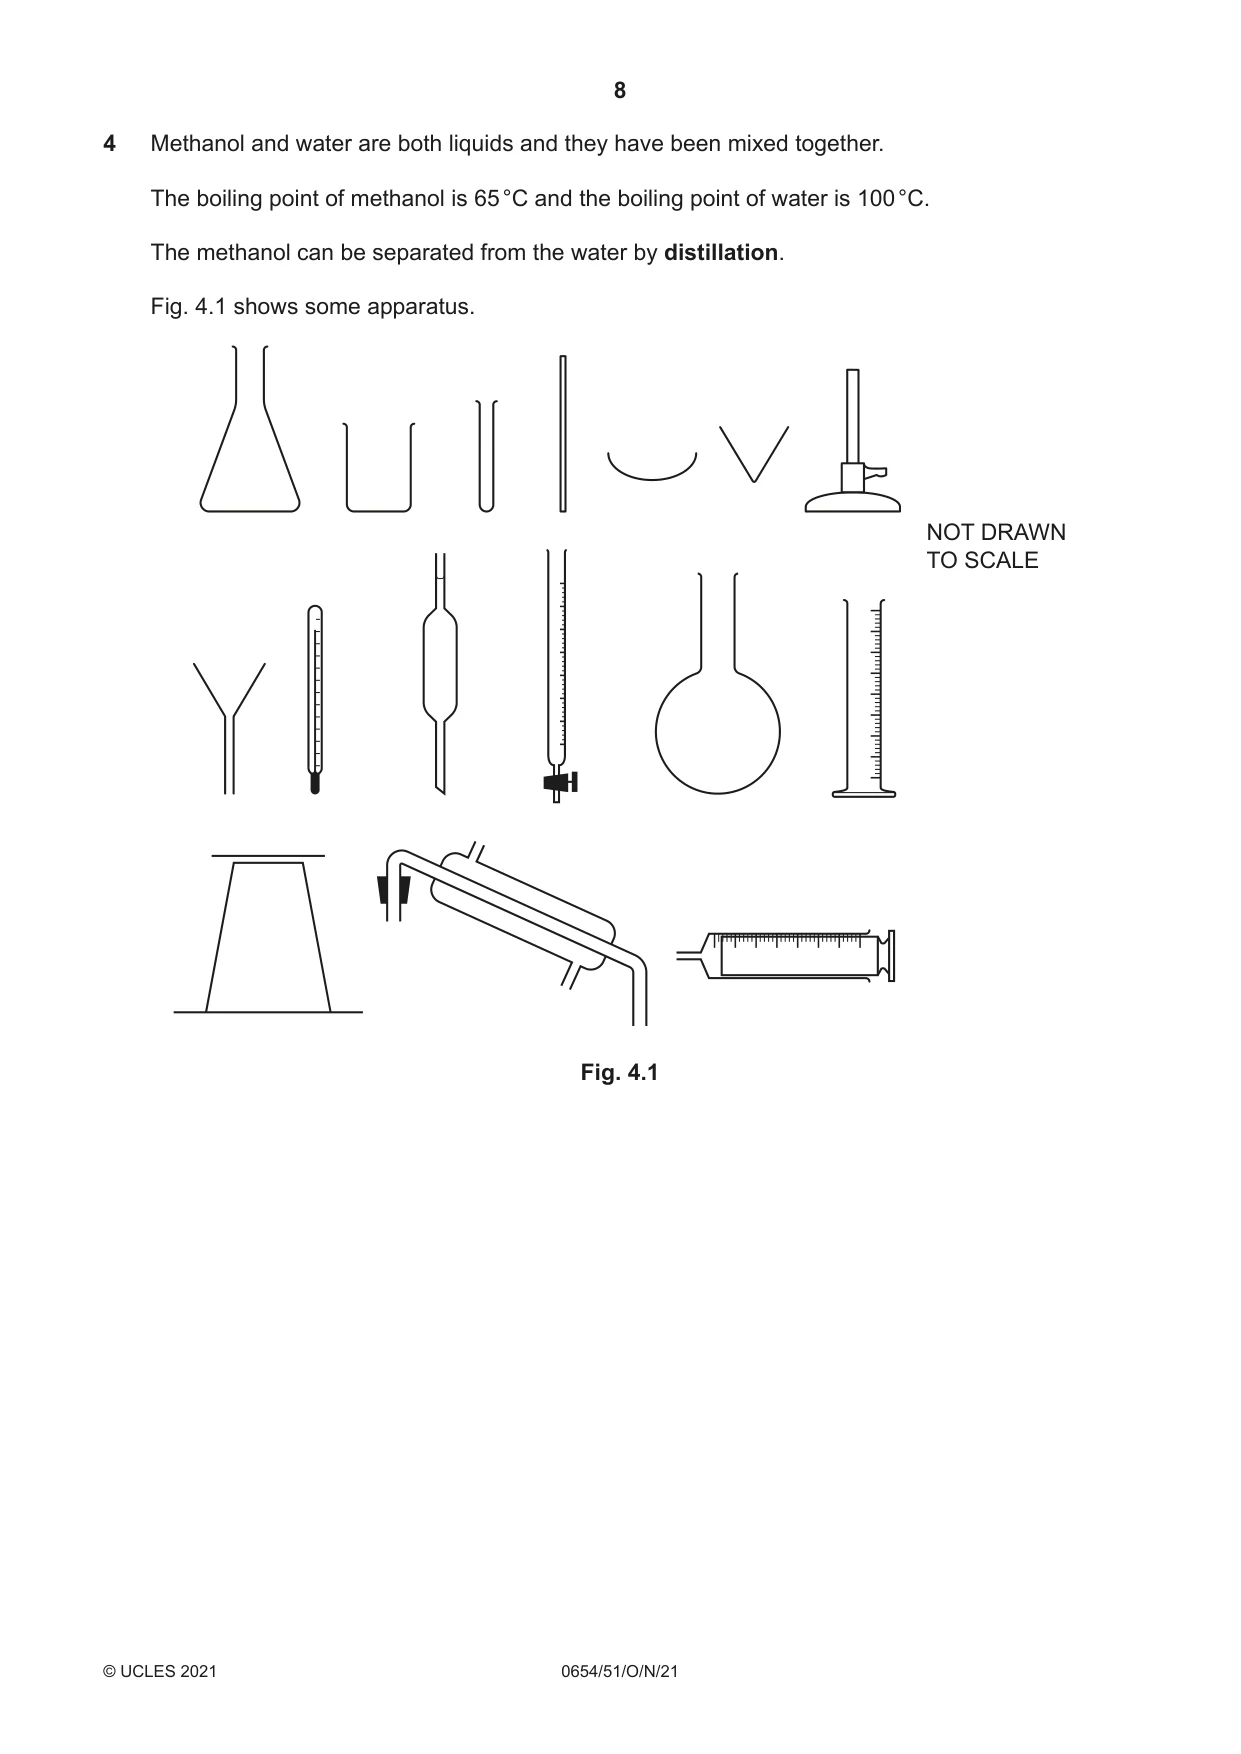
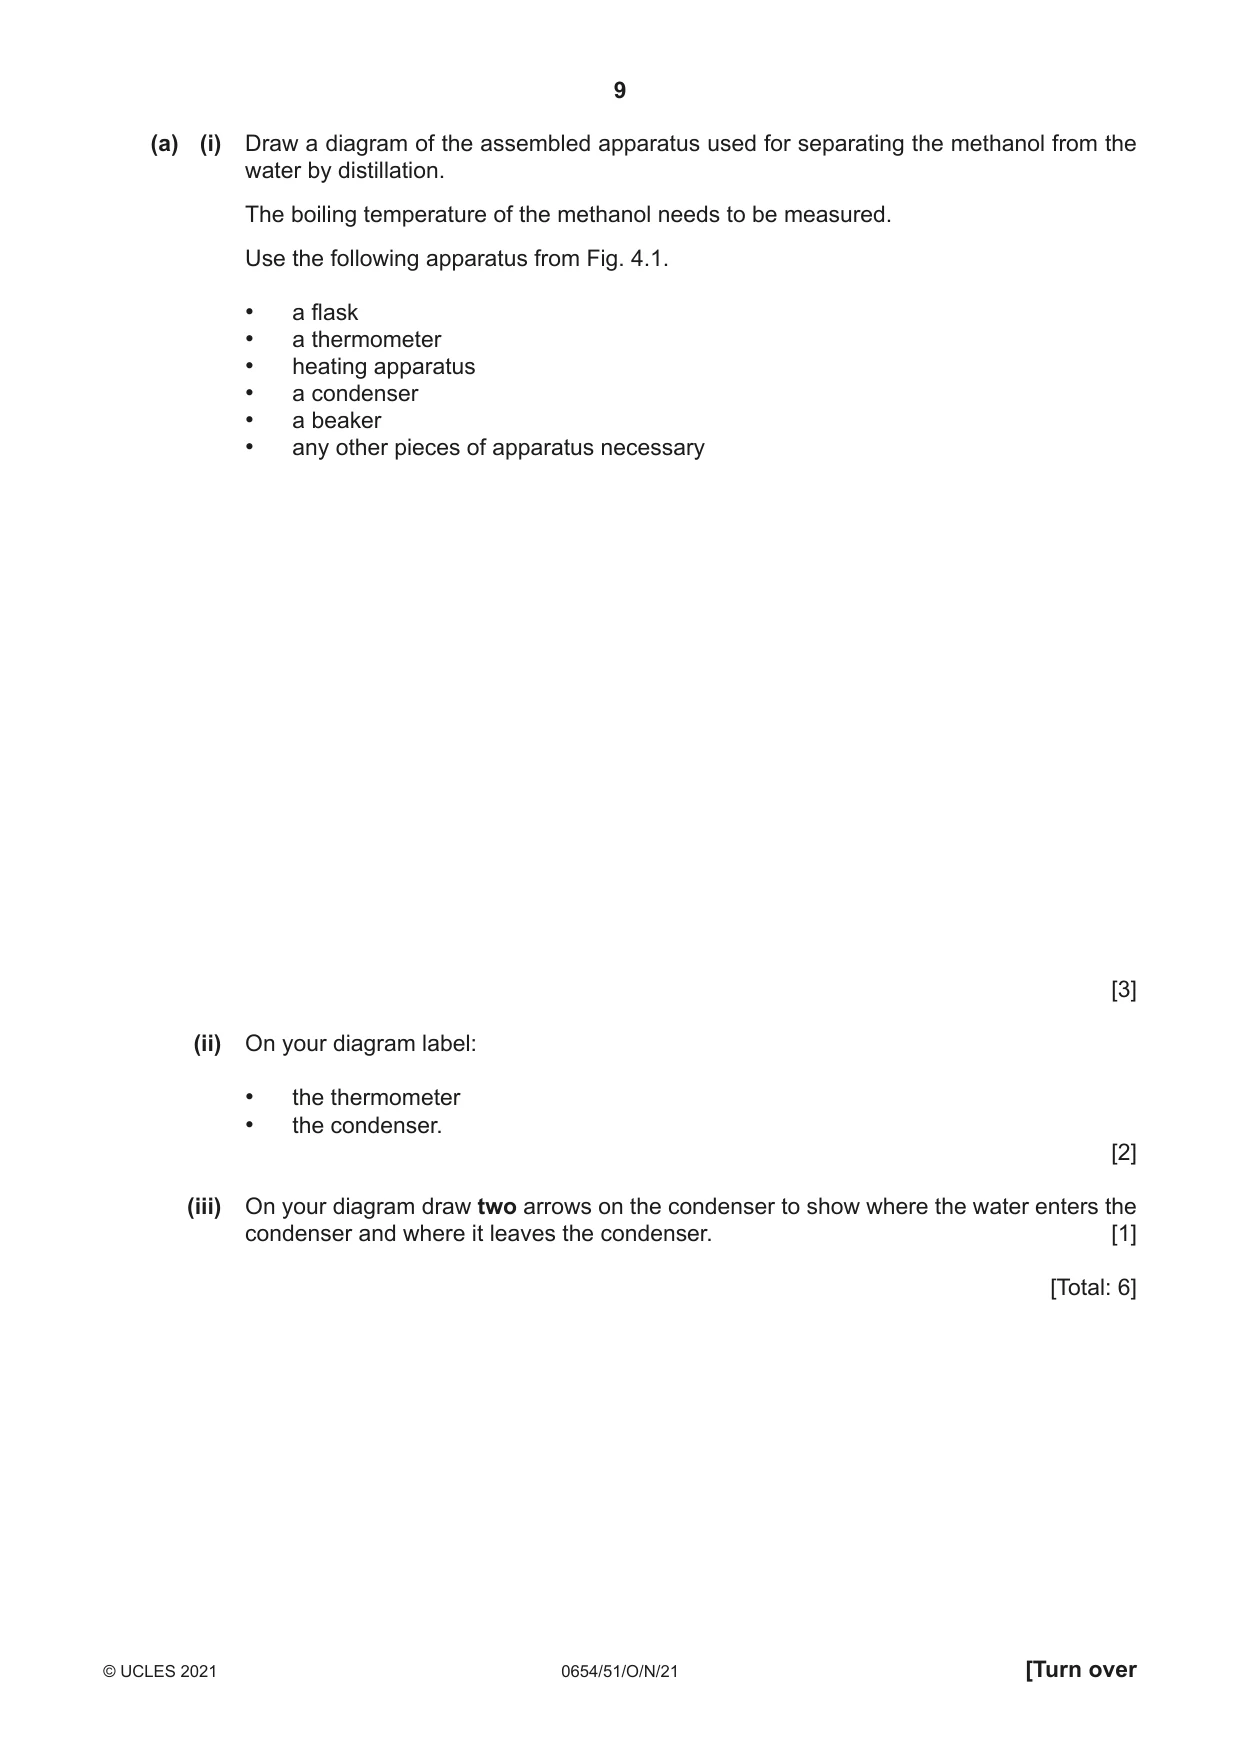
4 Methanol and water are both liquids and they have been mixed together. The boiling point of methanol is 65 °C and the boiling point of water is 100 °C. The methanol can be separated from the water by distillation. Fig. 4.1 shows some apparatus. NOT DRAWN TO SCALE Fig. 4.1 (a) (i) Draw a diagram of the assembled apparatus used for separating the methanol from the water by distillation. The boiling temperature of the methanol needs to be measured. Use the following apparatus from Fig. 4.1. • a flask • a thermometer • heating apparatus • a condenser • a beaker • any other pieces of apparatus necessary [3] (ii) On your diagram label: • the thermometer • the condenser. [2] (iii) On your diagram draw two arrows on the condenser to show where the water enters the condenser and where it leaves the condenser. [1] [Total: 6]
Mark scheme: 4(a)(i) any flask and condenser and beaker ; Bunsen (can be heat and arrow) and tripod (and gauze / heatproof mat) ; airtight and will work ; 3 4(a)(ii) thermometer labelled ; condenser labelled correctly ; 2 4(b) In at the bottom and out at the top ; 1
Q5 · You are going to determine the focal length of a convex lens
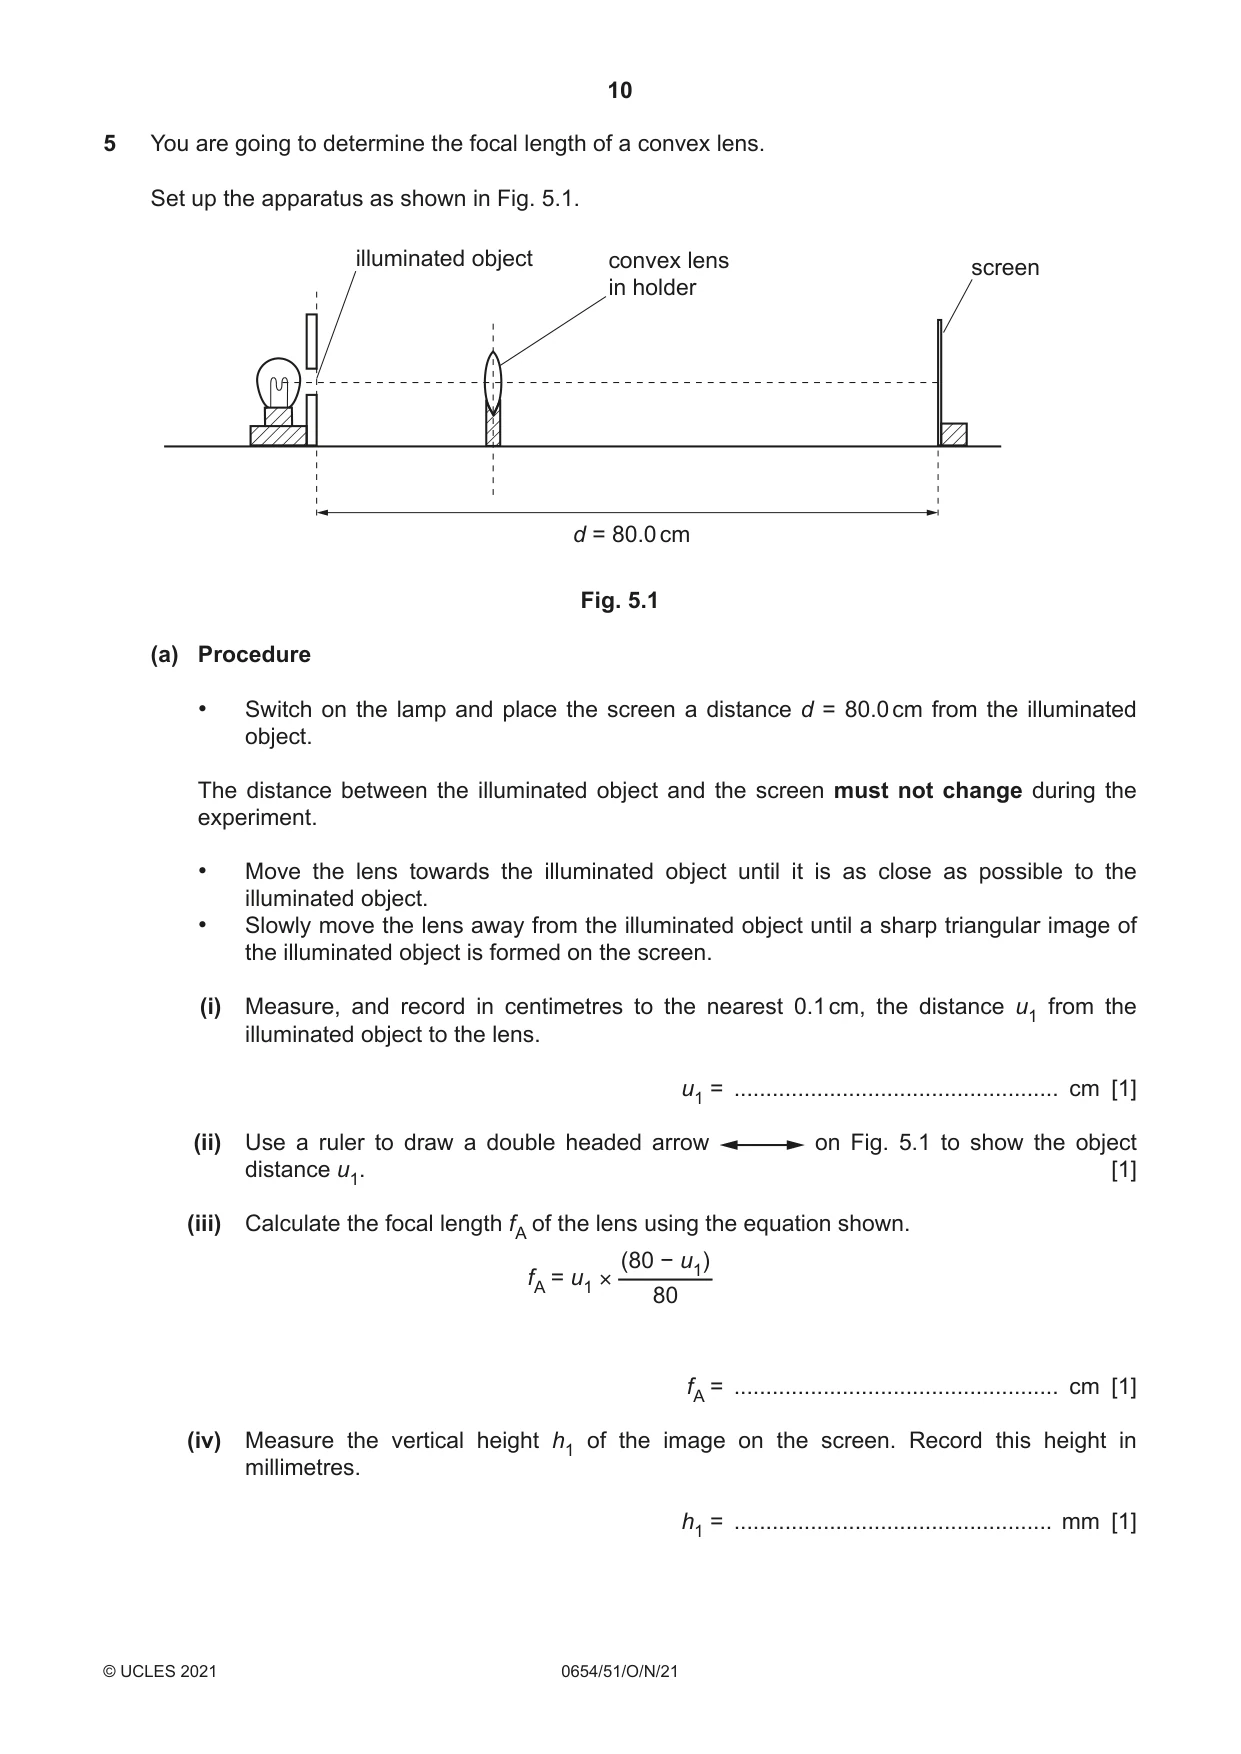
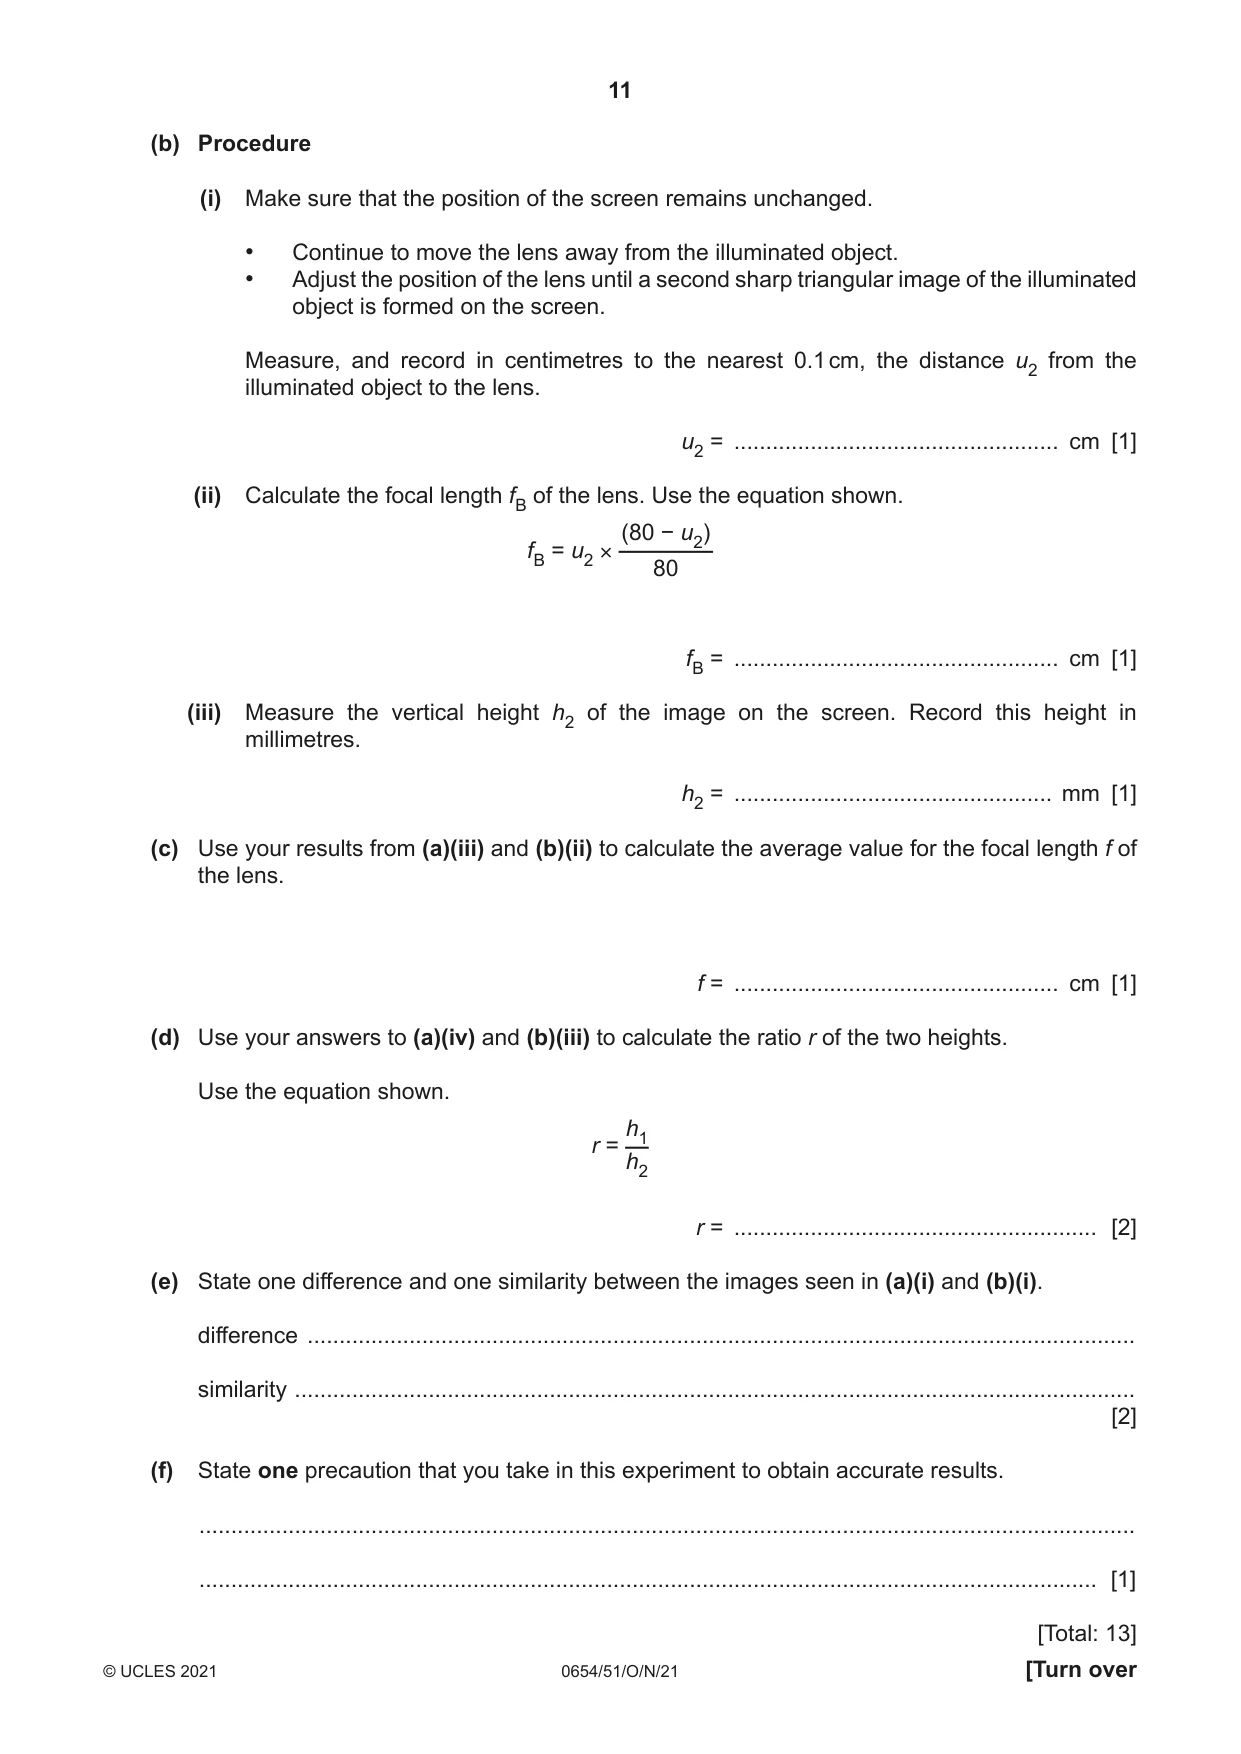
5 You are going to determine the focal length of a convex lens. Set up the apparatus as shown in Fig. 5.1. illuminated object convex lens screen in holder d = 80.0 cm Fig. 5.1 (a) Procedure • Switch on the lamp and place the screen a distance d = 80.0 cm from the illuminated object. The distance between the illuminated object and the screen must not change during the experiment. • Move the lens towards the illuminated object until it is as close as possible to the illuminated object. • Slowly move the lens away from the illuminated object until a sharp triangular image of the illuminated object is formed on the screen. (i) Measure, and record in centimetres to the nearest 0.1 cm, the distance u1 from the illuminated object to the lens. u1 = ................................................... cm [1] (ii) Use a ruler to draw a double headed arrow on Fig. 5.1 to show the object distance u1. [1] (iii) Calculate the focal length fA of the lens using the equation shown. (80 − u1) fA = u1 × 80 fA = ................................................... cm [1] (iv) Measure the vertical height h1 of the image on the screen. Record this height in millimetres. h1 = .................................................. mm [1] (b) Procedure (i) Make sure that the position of the screen remains unchanged. • Continue to move the lens away from the illuminated object. • Adjust the position of the lens until a second sharp triangular image of the illuminated object is formed on the screen. Measure, and record in centimetres to the nearest 0.1 cm, the distance u2 from the illuminated object to the lens. u2 = ................................................... cm [1] (ii) Calculate the focal length fB of the lens. Use the equation shown. (80 − u2) fB = u2 × 80 fB = ................................................... cm [1] (iii) Measure the vertical height h2 of the image on the screen. Record this height in millimetres. h2 = .................................................. mm [1] (c) Use your results from (a)(iii) and (b)(ii) to calculate the average value for the focal length f of the lens. f = ................................................... cm [1] (d) Use your answers to (a)(iv) and (b)(iii) to calculate the ratio r of the two heights. Use the equation shown. h1 r = h2 r = ......................................................... [2] (e) State one difference and one similarity between the images seen in (a)(i) and (b)(i). difference .................................................................................................................................. similarity .................................................................................................................................... [2] (f) State one precaution that you take in this experiment to obtain accurate results. ................................................................................................................................................... ............................................................................................................................................. [1] [Total: 13] 6 Fig. 6.1 shows a pendulum. string stand pendulum bob Fig. 6.1 The period of a pendulum is the time taken for one complete oscillation (swing) of the pendulum. Fig. 6.2 shows one complete oscillation. C B A one complete oscillation A of the pendulum is A B C A Fig. 6.2
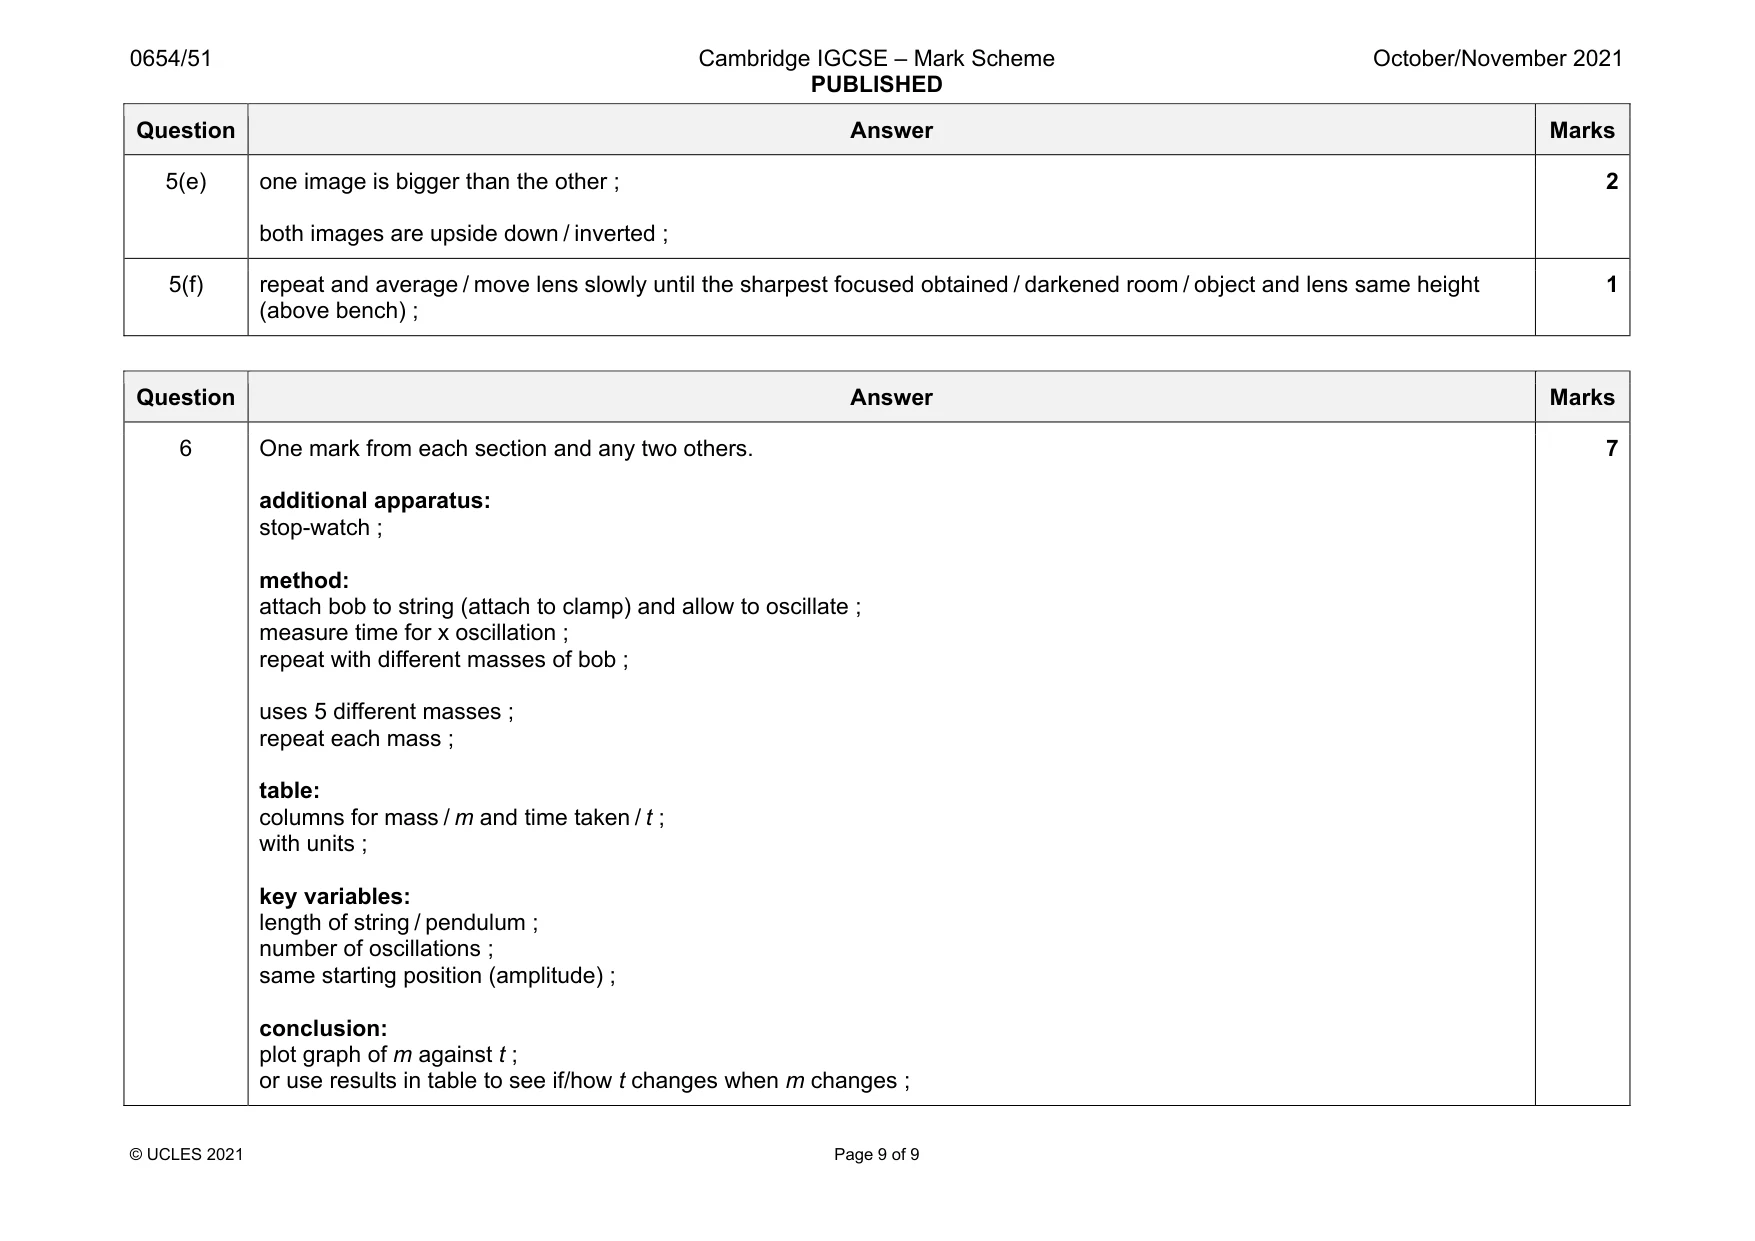
Mark scheme: 5(a)(i) 20.0 ± 1.0 (cm) ; 1 5(a)(ii) ruler used and correct distance marked ; 1 5(a)(iii) correct calculation from candidate’s (a)(i) ; 1 5(a)(iv) h1 present ; 1 5(b)(i) 60.0 ± 1.0 (cm) ; 1 5(b)(ii) correct calculation from candidate’s (b)(i) ; 1 5(b)(iii) h2 present and < h1 ; 1 5(c) correct average of candidate’s (a)(iii) and (b)(ii) ; 1 5(d) h1/h2 ratio correct ; 3.0 ± 0.2 ; 2 Question Answer Marks 5(e) one image is bigger than the other ; both images are upside down / inverted ; 2 5(f) repeat and average / move lens slowly until the sharpest focused obtained / darkened room / object and lens same height (above bench) ; 1
Question 6
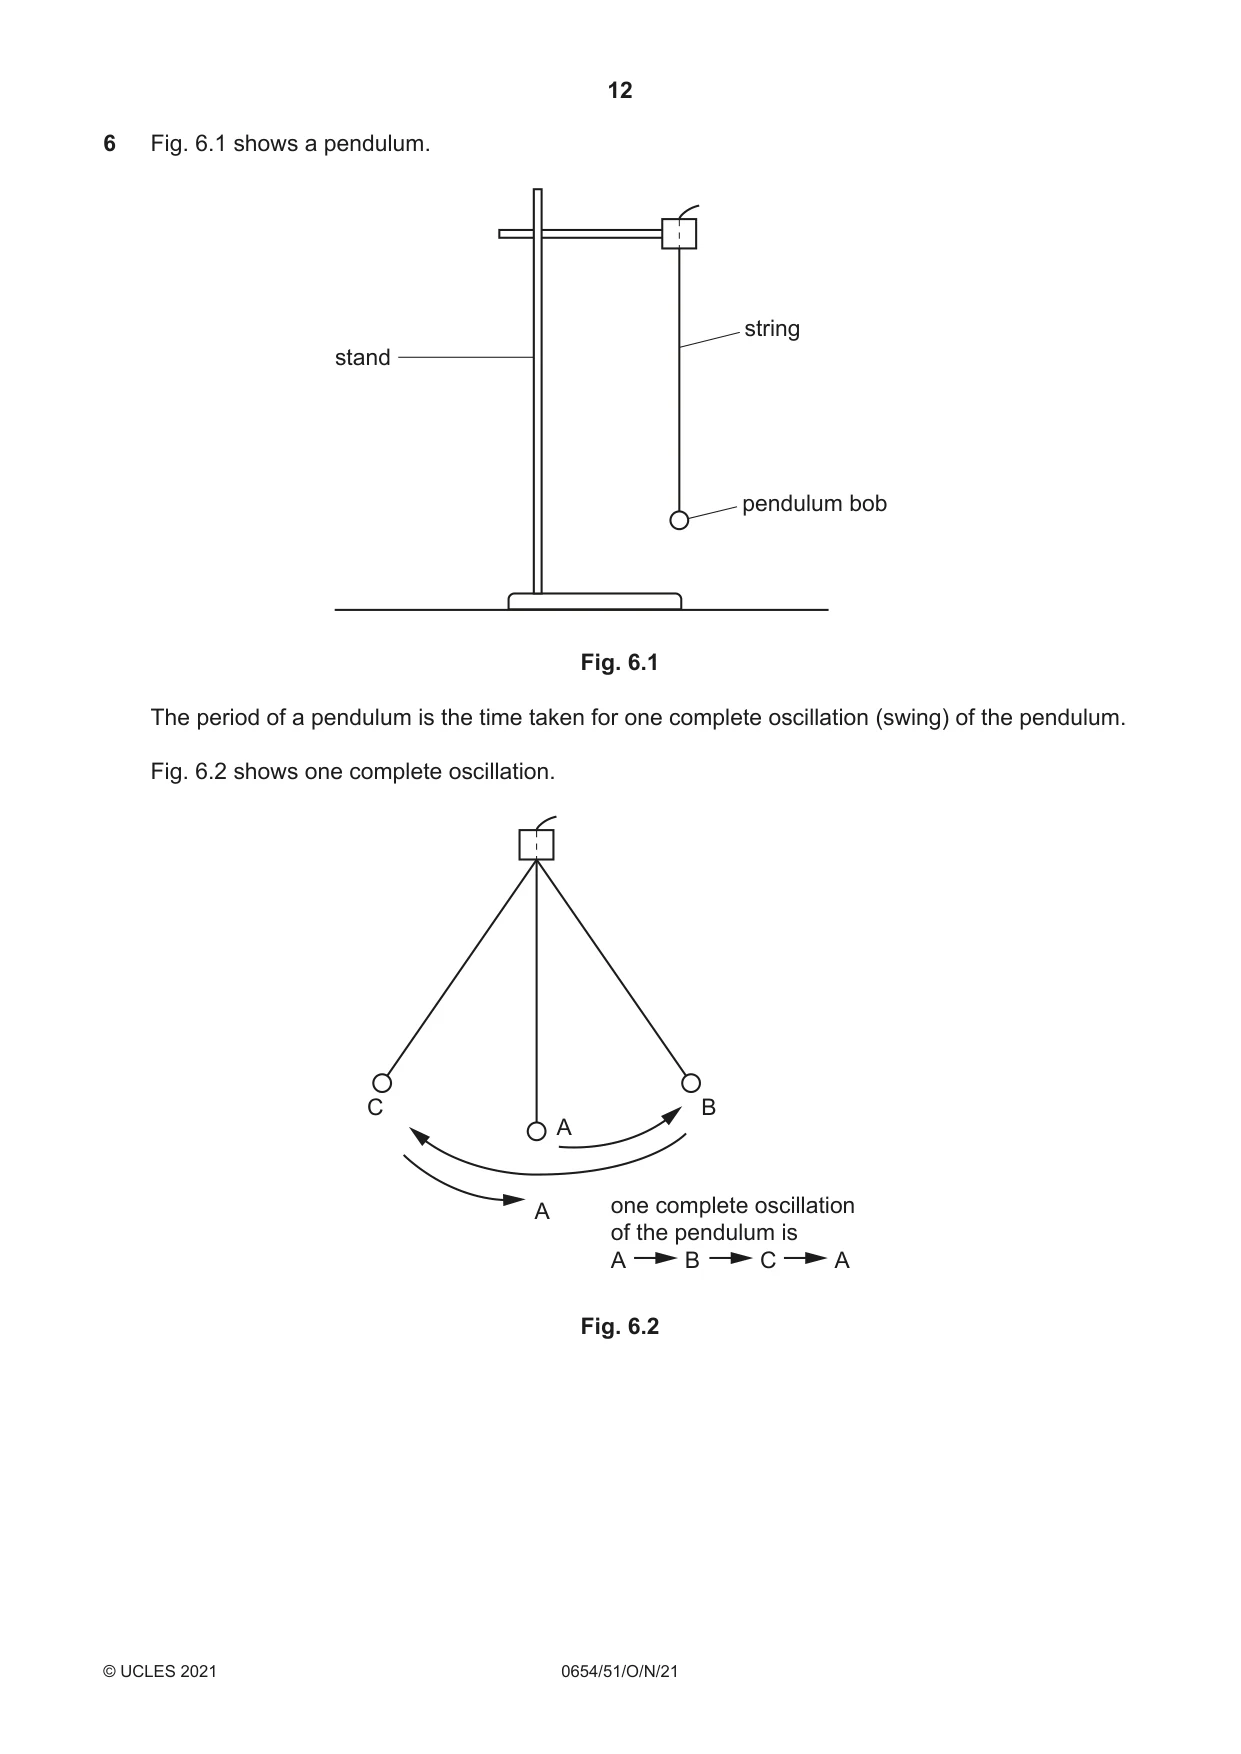
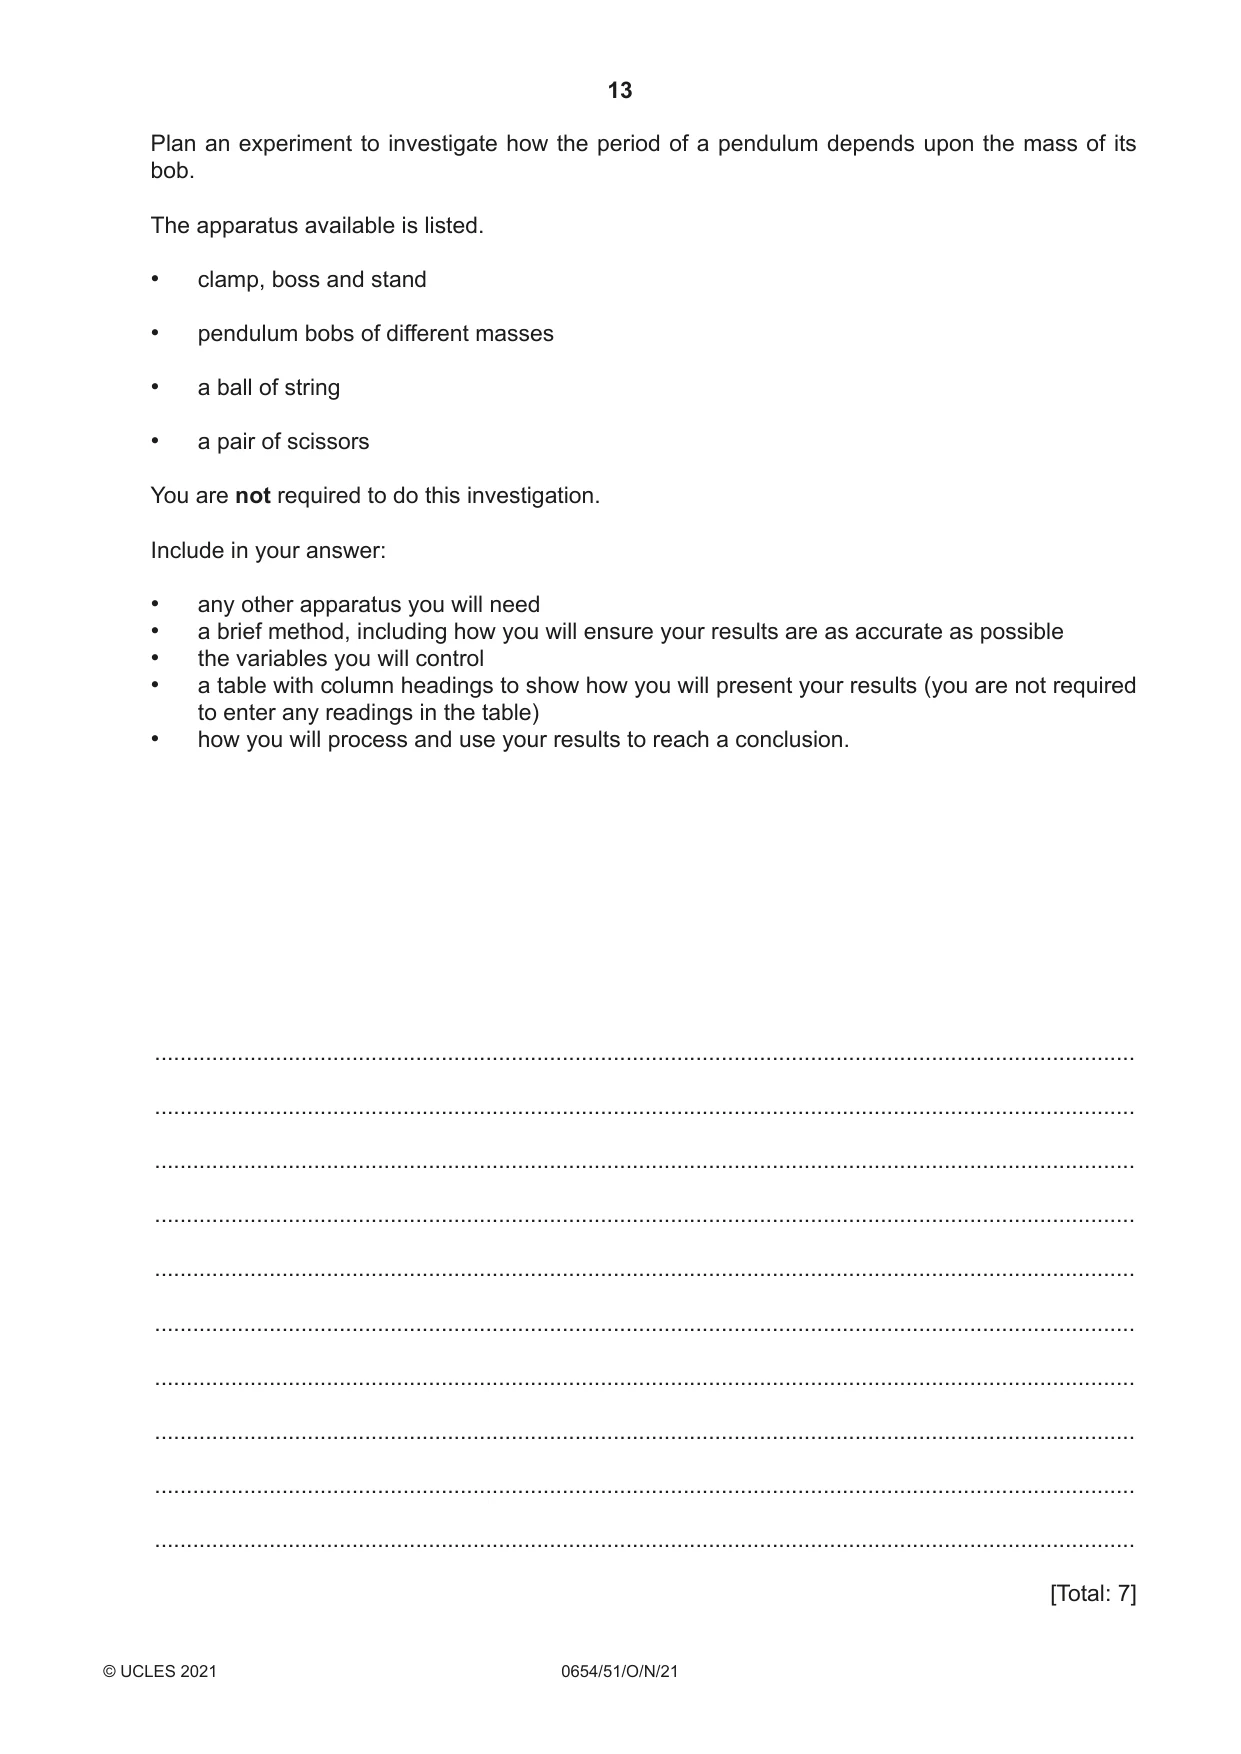
6 Fig. 6.1 shows a pendulum. string stand pendulum bob Fig. 6.1 The period of a pendulum is the time taken for one complete oscillation (swing) of the pendulum. Fig. 6.2 shows one complete oscillation. C B A one complete oscillation A of the pendulum is A B C A Fig. 6.2 Plan an experiment to investigate how the period of a pendulum depends upon the mass of its bob. The apparatus available is listed. • clamp, boss and stand • pendulum bobs of different masses • a ball of string • a pair of scissors You are not required to do this investigation. Include in your answer: • any other apparatus you will need • a brief method, including how you will ensure your results are as accurate as possible • the variables you will control • a table with column headings to show how you will present your results (you are not required to enter any readings in the table) • how you will process and use your results to reach a conclusion. .......................................................................................................................................................... .......................................................................................................................................................... .......................................................................................................................................................... .......................................................................................................................................................... .......................................................................................................................................................... .......................................................................................................................................................... .......................................................................................................................................................... .......................................................................................................................................................... .......................................................................................................................................................... .......................................................................................................................................................... [Total: 7]
Mark scheme: 6 One mark from each section and any two others. additional apparatus: stop-watch ; method: attach bob to string (attach to clamp) and allow to oscillate ; measure time for x oscillation ; repeat with different masses of bob ; uses 5 different masses ; repeat each mass ; table: columns for mass / m and time taken / t ; with units ; key variables: length of string / pendulum ; number of oscillations ; same starting position (amplitude) ; conclusion: plot graph of m against t ; or use results in table to see if/how t changes when m changes ;
More questions on Physical quantities and measurement techniques
What was in this paper
The subtopics covered by these 6 questions, and how many questions each got. Open one in a new tab to see every Cambridge question on it.
What you needed in this session
Cambridge’s own grade thresholds for 2021 Oct/Nov, Paper 5 · Variant 1. A higher threshold means an easier paper — the bar moves with how the cohort did.