Cambridge IGCSE Sciences - Co-ordinated (Double) 0654 — 2019 May/June Paper 5 · Variant 2
0654/52/M/J/19 · 7 questions · 60 marks · ≈68 min
The question paper and its mark scheme, free to read here and free to download. This is Cambridge’s own paper, exactly as it was sat.
Question paper20 pages




Mark scheme10 pages
Answers below. Sit the paper first if you are practising.
Questions as text
Q1 · You are going to test two solutions A and B for their nutrient content using iodine…
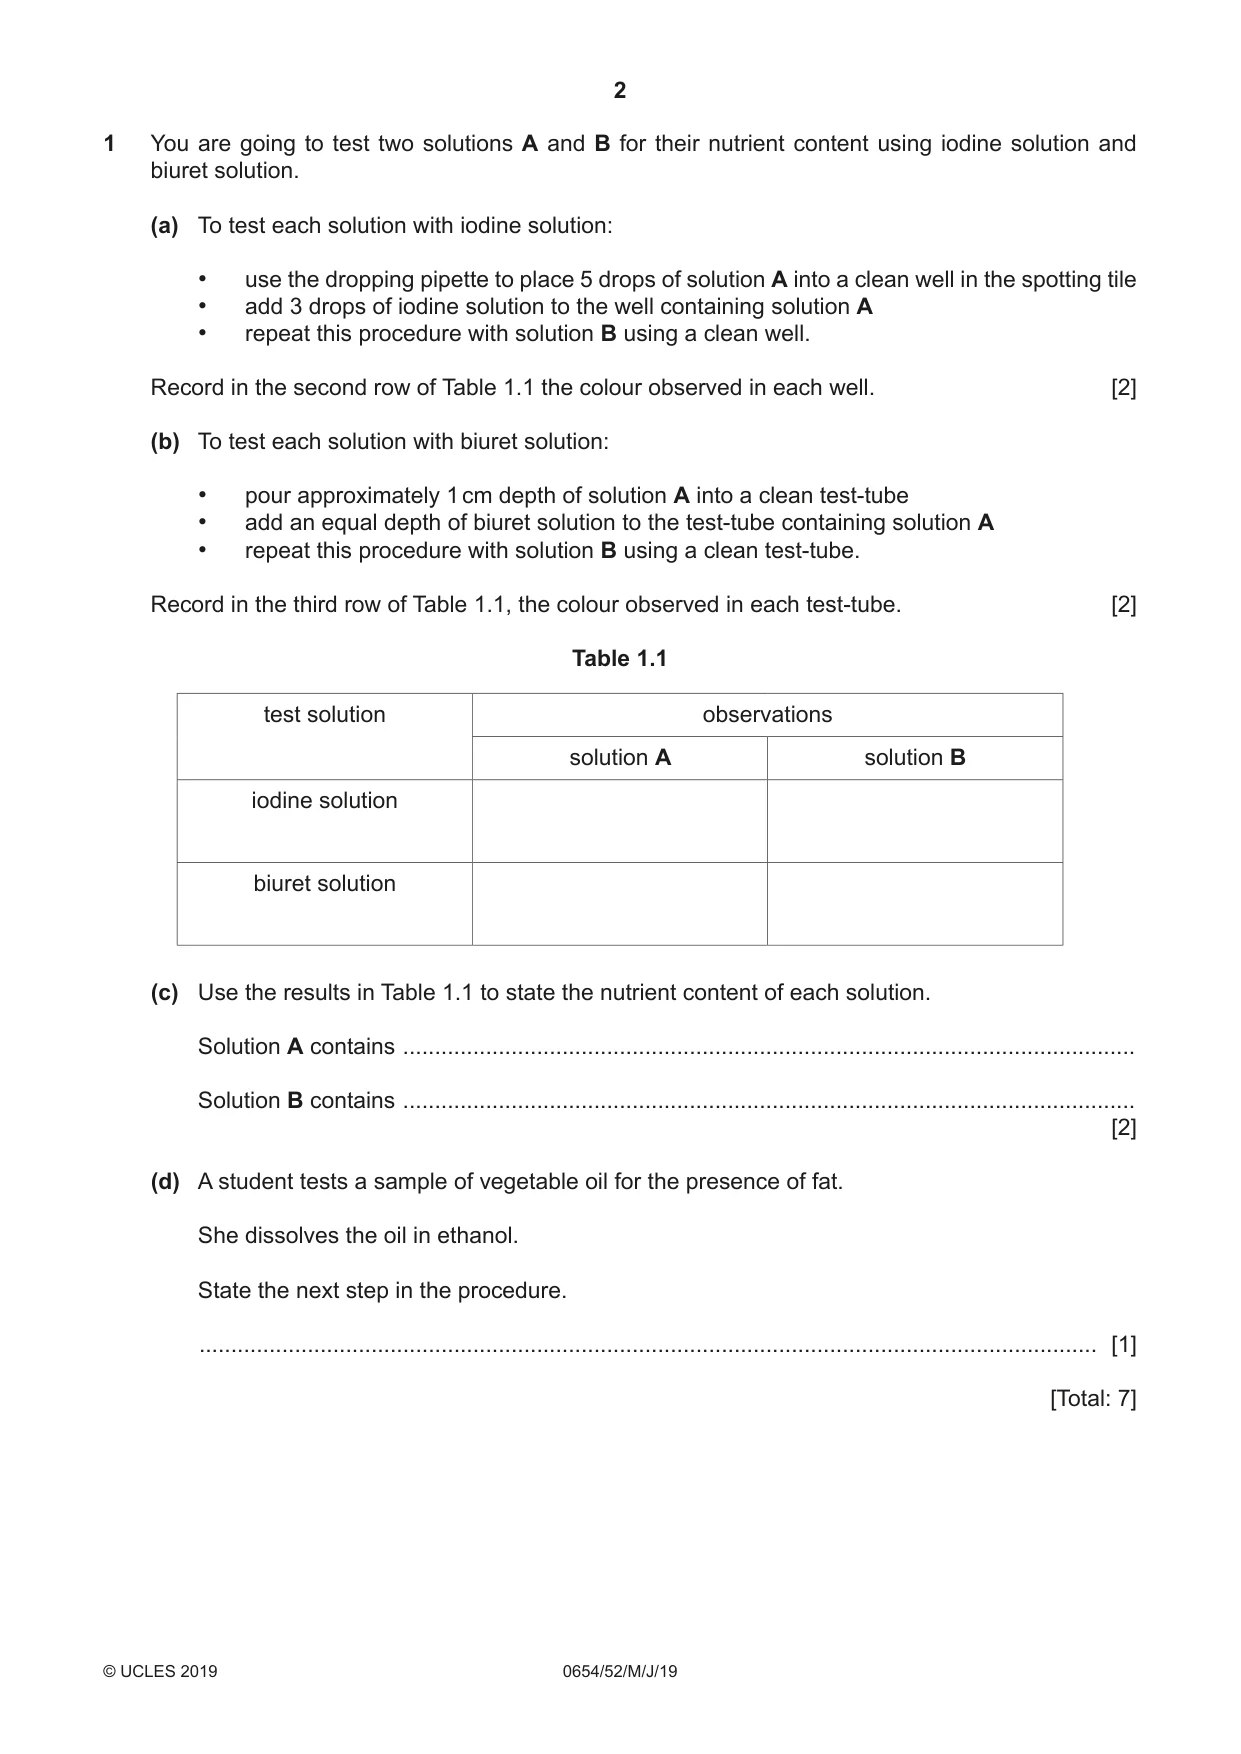
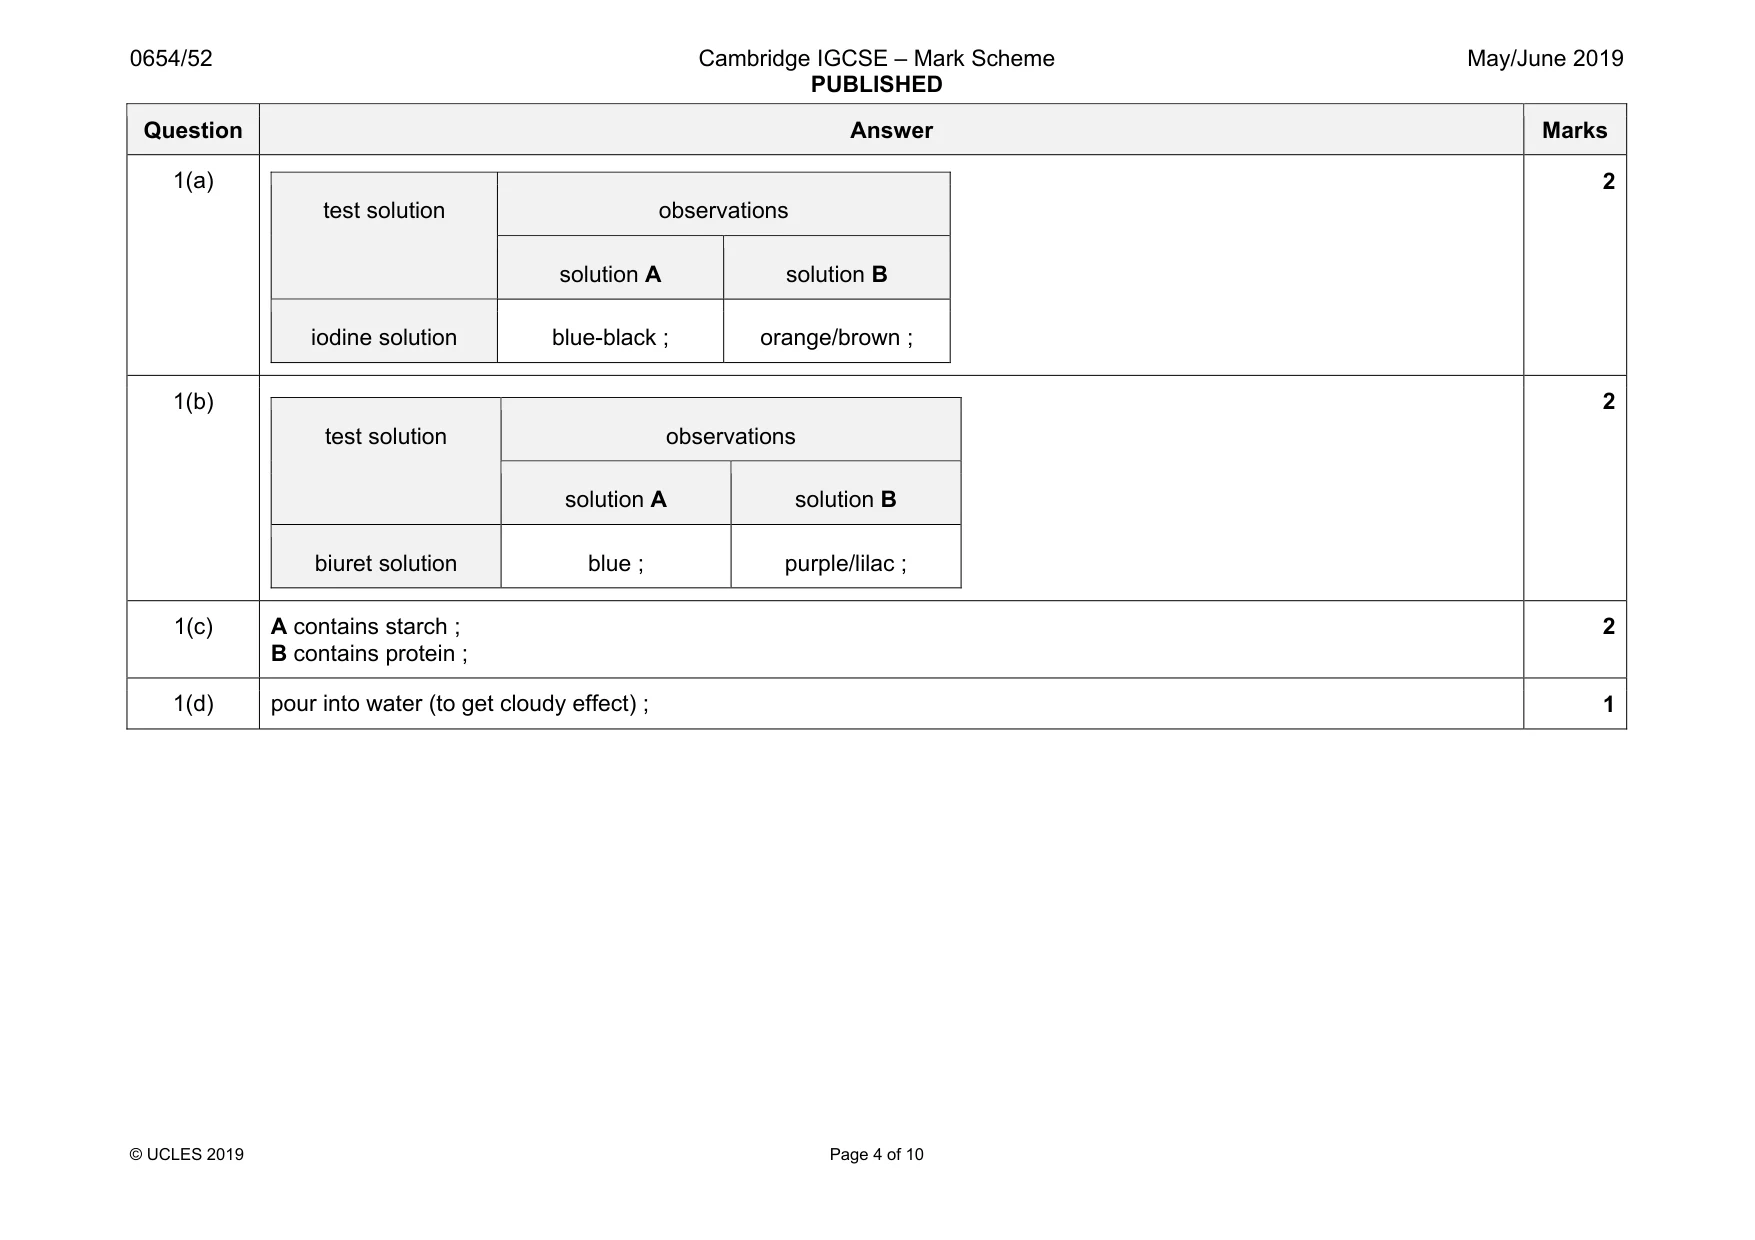
1 You are going to test two solutions A and B for their nutrient content using iodine solution and biuret solution. (a) To test each solution with iodine solution: • use the dropping pipette to place 5 drops of solution A into a clean well in the spotting tile • add 3 drops of iodine solution to the well containing solution A • repeat this procedure with solution B using a clean well. Record in the second row of Table 1.1 the colour observed in each well. [2] (b) To test each solution with biuret solution: • pour approximately 1 cm depth of solution A into a clean test-tube • add an equal depth of biuret solution to the test-tube containing solution A • repeat this procedure with solution B using a clean test-tube. Record in the third row of Table 1.1, the colour observed in each test-tube. [2] Table 1.1 test solution observations solution A solution B iodine solution biuret solution (c) Use the results in Table 1.1 to state the nutrient content of each solution. Solution A contains ................................................................................................................... Solution B contains ................................................................................................................... [2] (d) A student tests a sample of vegetable oil for the presence of fat. She dissolves the oil in ethanol. State the next step in the procedure. ............................................................................................................................................. [1] [Total: 7]
Mark scheme: 1(a) test solution observations solution A solution B iodine solution blue-black ; orange/brown ; 2 1(b) test solution observations solution A solution B biuret solution blue ; purple/lilac ; 2 1(c) A contains starch ; B contains protein ; 2 1(d) pour into water (to get cloudy effect) ; 1
Q2 · You are going to find the concentration of a sample of hydrochloric acid by reacting it…
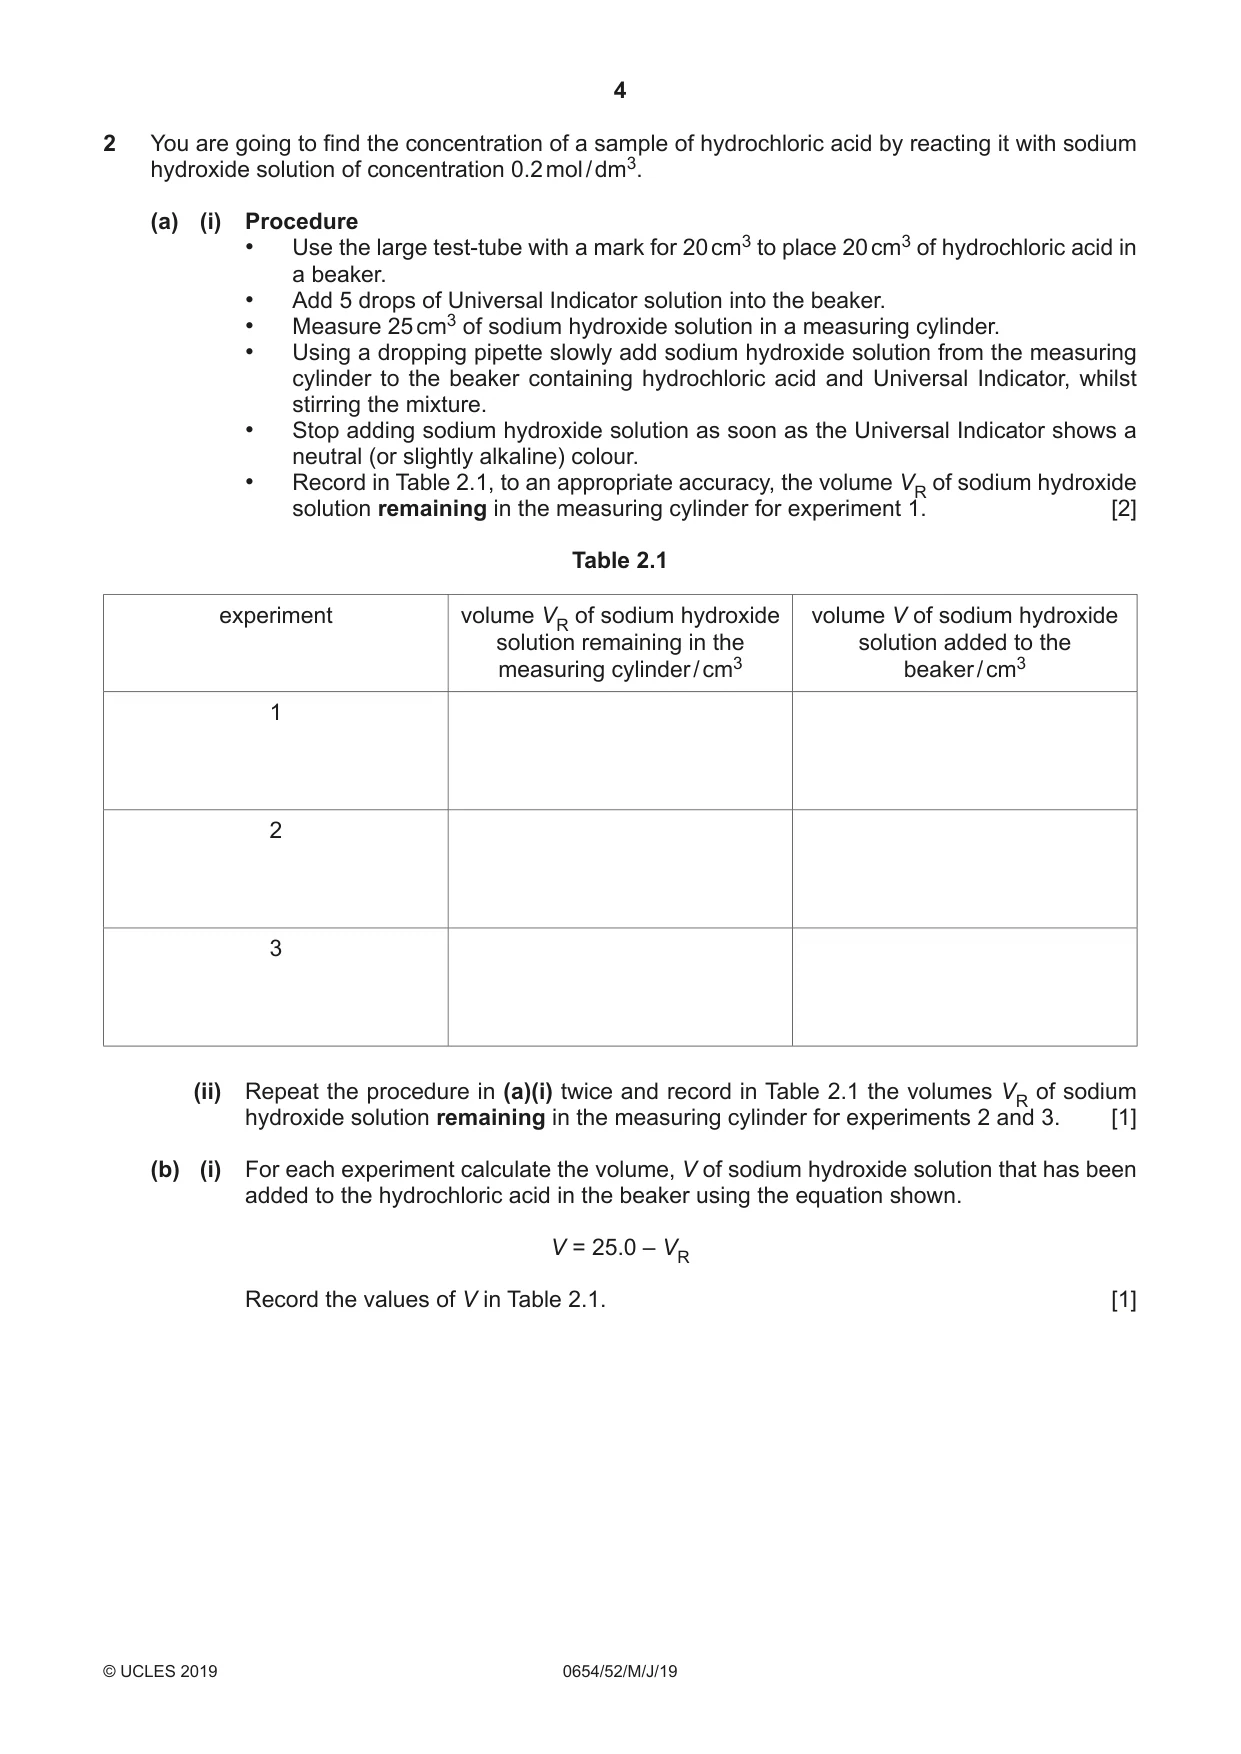
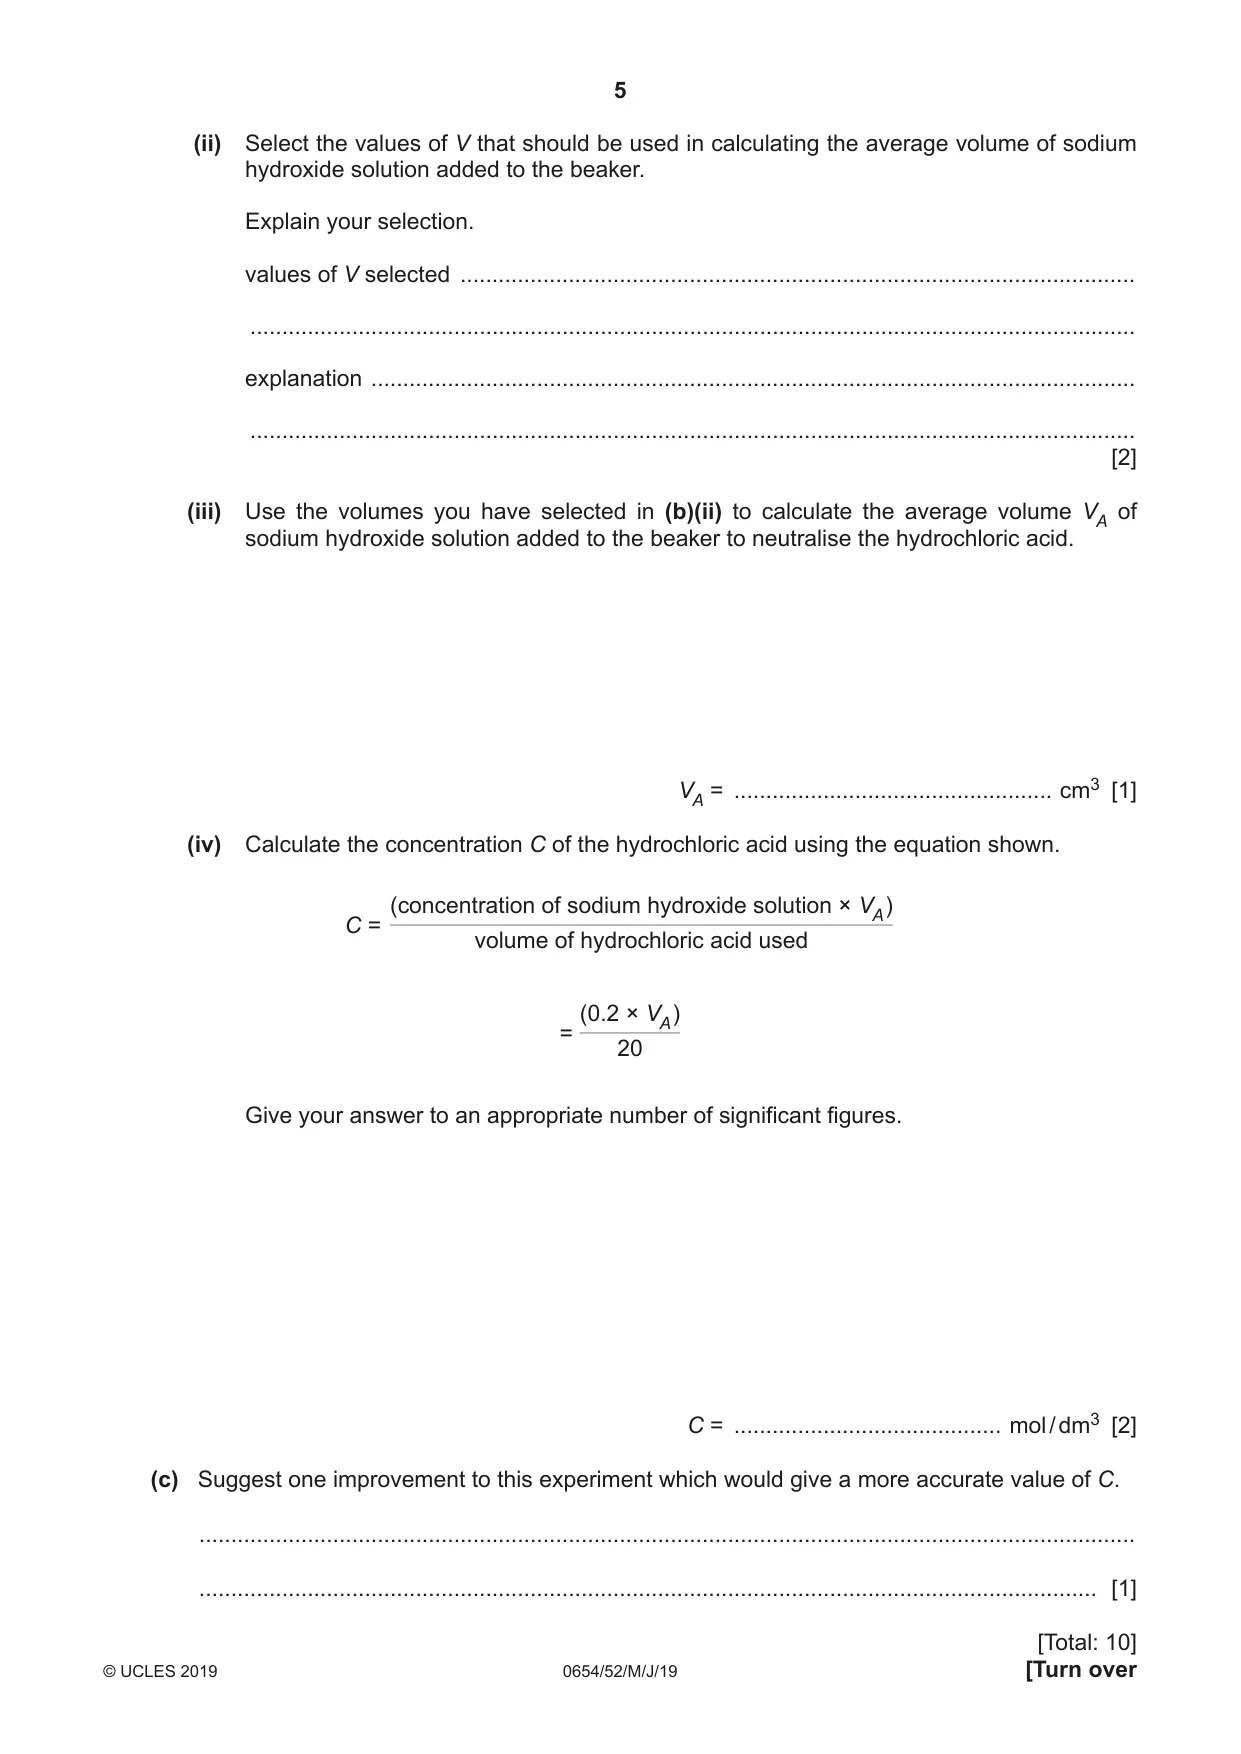
2 You are going to find the concentration of a sample of hydrochloric acid by reacting it with sodium hydroxide solution of concentration 0.2 mol / dm3. (a) (i) Procedure • Use the large test-tube with a mark for 20 cm3 to place 20 cm3 of hydrochloric acid in a beaker. • Add 5 drops of Universal Indicator solution into the beaker. • Measure 25 cm3 of sodium hydroxide solution in a measuring cylinder. • Using a dropping pipette slowly add sodium hydroxide solution from the measuring cylinder to the beaker containing hydrochloric acid and Universal Indicator, whilst stirring the mixture. • Stop adding sodium hydroxide solution as soon as the Universal Indicator shows a neutral (or slightly alkaline) colour. • Record in Table 2.1, to an appropriate accuracy, the volume VR of sodium hydroxide solution remaining in the measuring cylinder for experiment 1. [2] Table 2.1 experiment volume VR of sodium hydroxide volume V of sodium hydroxide solution remaining in the solution added to the measuring cylinder / cm3 beaker / cm3 1 2 3 (ii) Repeat the procedure in (a)(i) twice and record in Table 2.1 the volumes VR of sodium hydroxide solution remaining in the measuring cylinder for experiments 2 and 3. [1] (b) (i) For each experiment calculate the volume, V of sodium hydroxide solution that has been added to the hydrochloric acid in the beaker using the equation shown. V = 25.0 – VR Record the values of V in Table 2.1. [1] (ii) Select the values of V that should be used in calculating the average volume of sodium hydroxide solution added to the beaker. Explain your selection. values of V selected .......................................................................................................... ........................................................................................................................................... explanation ........................................................................................................................ ........................................................................................................................................... [2] (iii) Use the volumes you have selected in (b)(ii) to calculate the average volume VA of sodium hydroxide solution added to the beaker to neutralise the hydrochloric acid. VA = .................................................. cm3 [1] (iv) Calculate the concentration C of the hydrochloric acid using the equation shown. (concentration of sodium hydroxide solution × VA ) C = volume of hydrochloric acid used (0.2 × VA ) = 20 Give your answer to an appropriate number of significant figures. C = .......................................... mol / dm3 [2] (c) Suggest one improvement to this experiment which would give a more accurate value of C. ................................................................................................................................................... ............................................................................................................................................. [1]
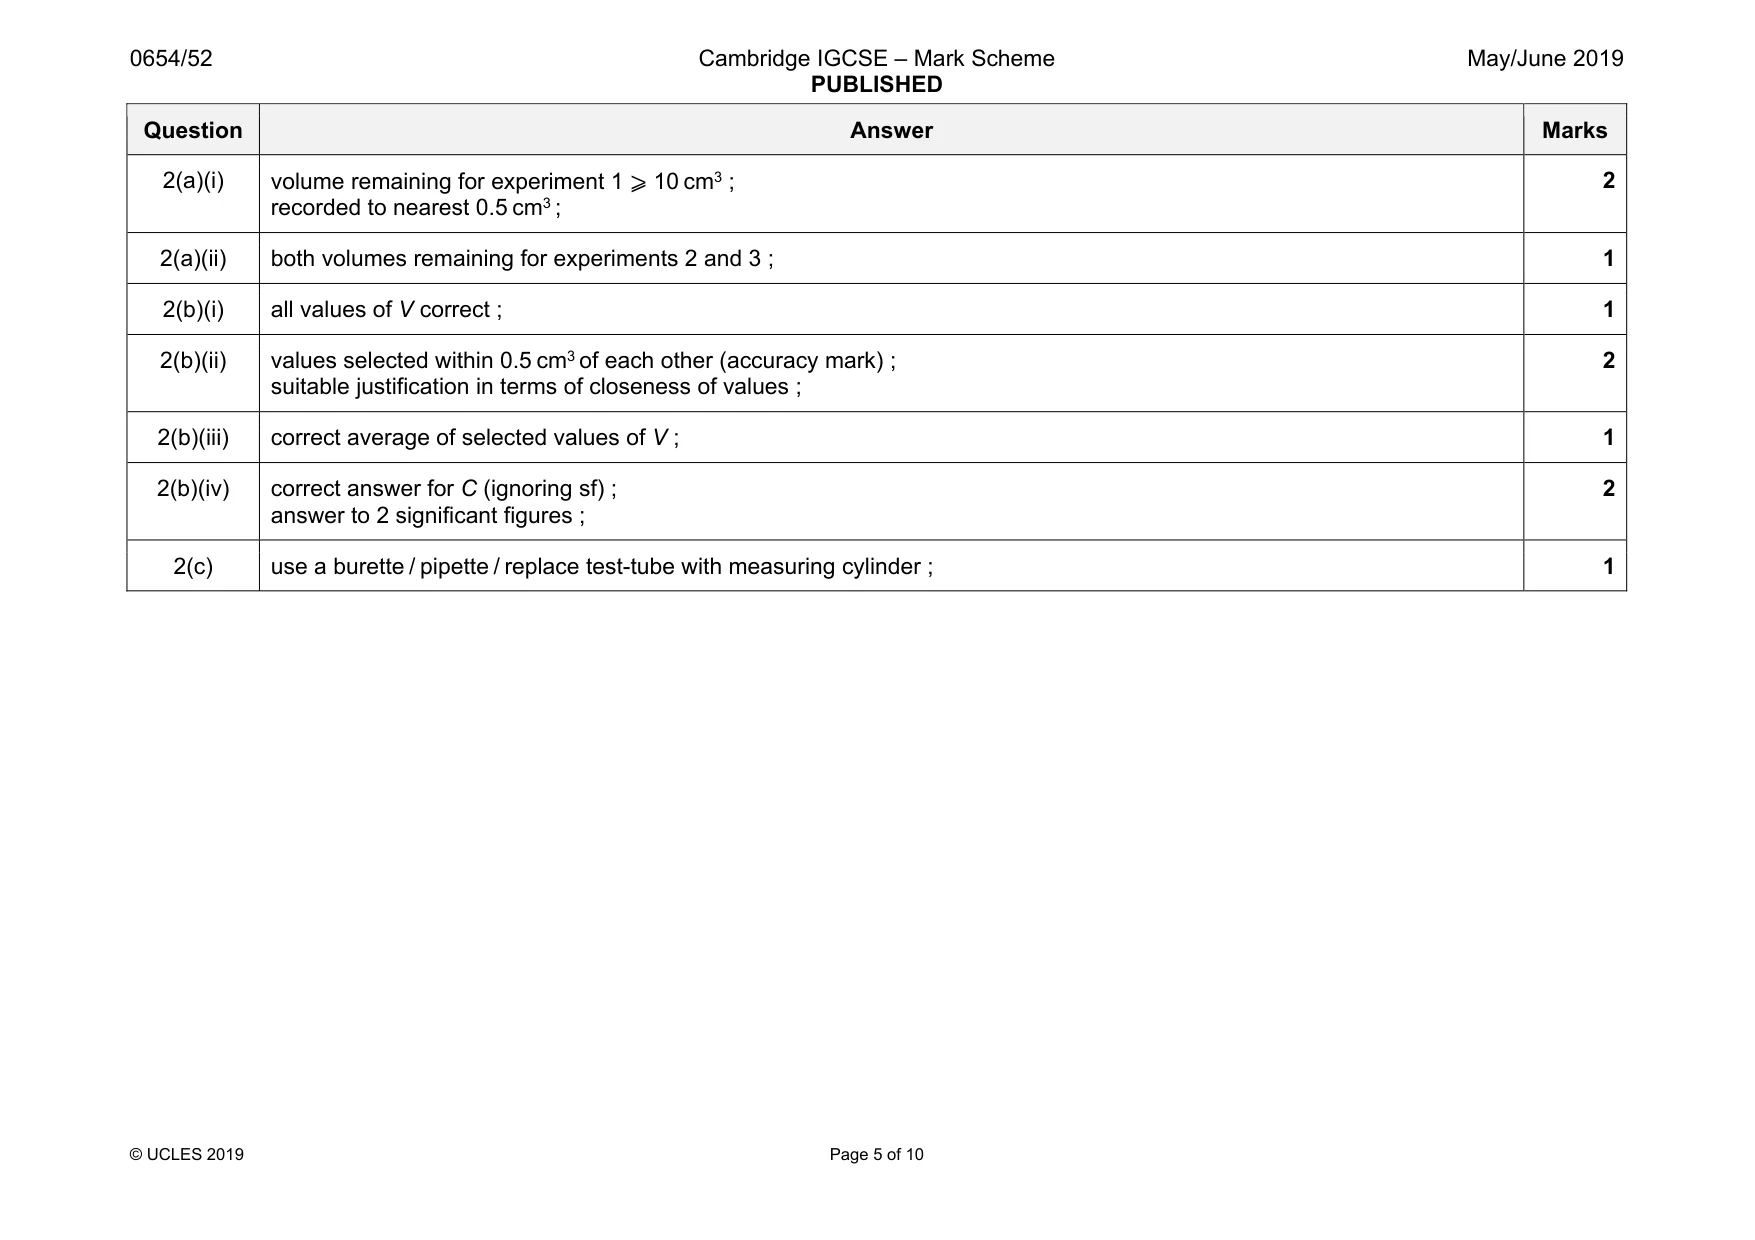
Mark scheme: 2(a)(i) recorded to nearest 0.5 cm3 ; 2 2(a)(ii) both volumes remaining for experiments 2 and 3 ; 1 2(b)(i) all values of V correct ; 1 2(b)(ii) values selected within 0.5 cm3 of each other (accuracy mark) ; suitable justification in terms of closeness of values ; 2 2(b)(iii) correct average of selected values of V ; 1 2(b)(iv) correct answer for C (ignoring sf) ; answer to 2 significant figures ; 2 2(c) use a burette / pipette / replace test-tube with measuring cylinder ; 1
Q3 · You are going to measure the resistance of an unknown resistor R
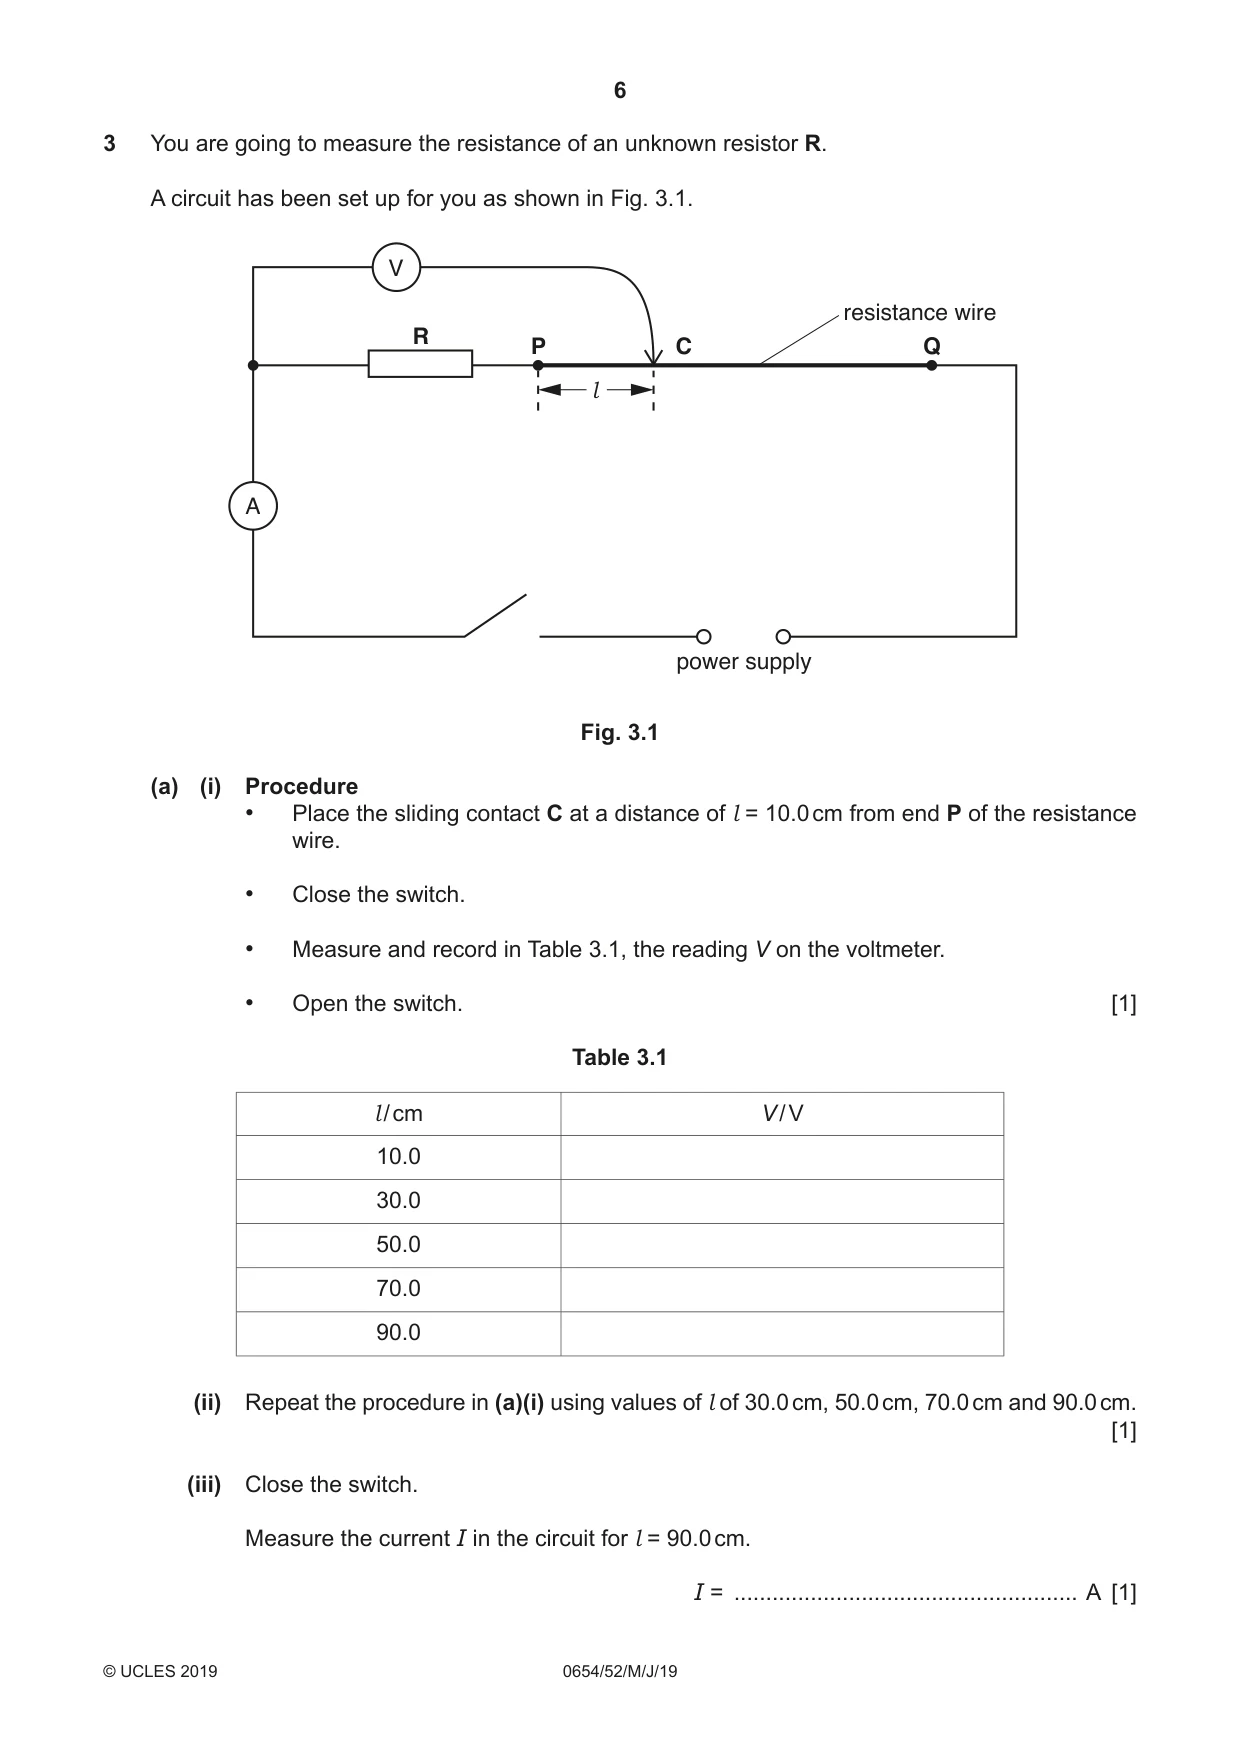
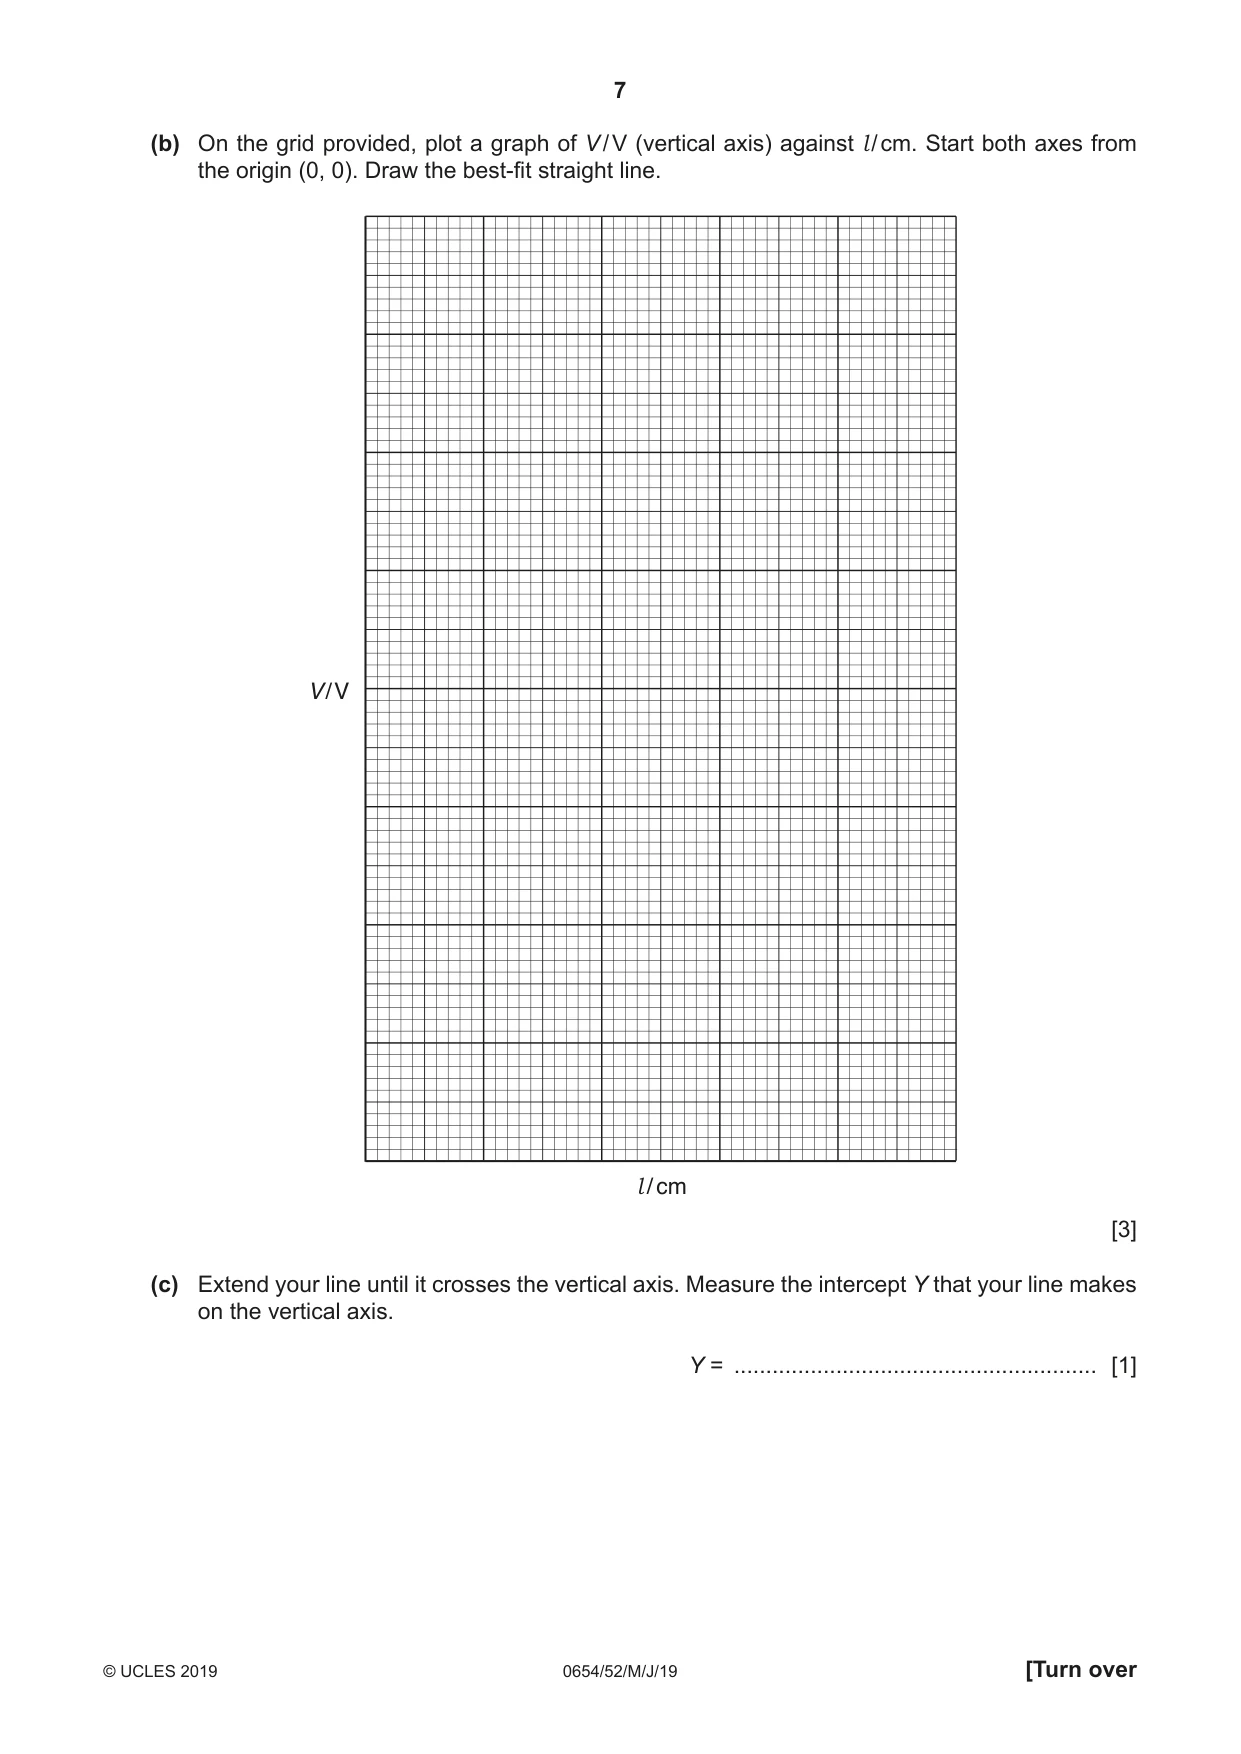
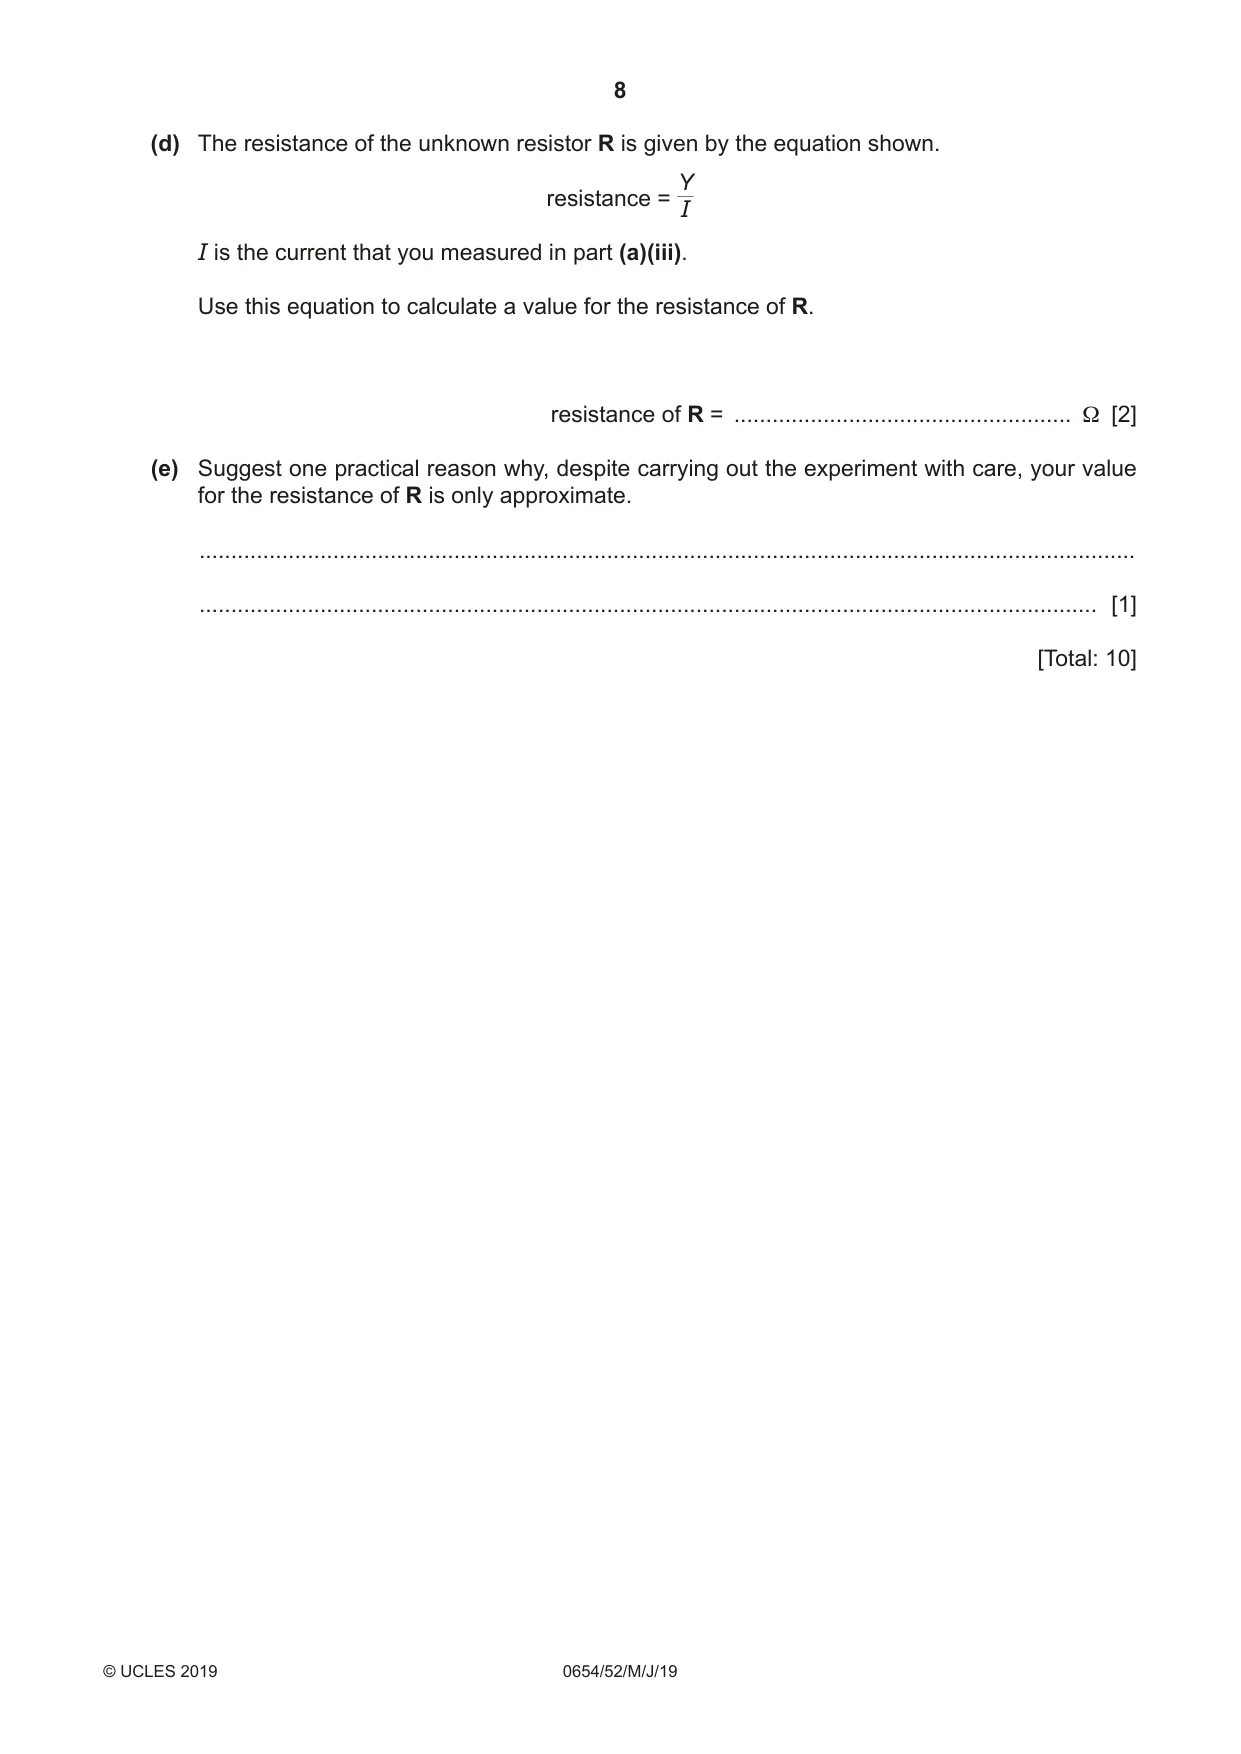
3 You are going to measure the resistance of an unknown resistor R. A circuit has been set up for you as shown in Fig. 3.1. V resistance wire R P C Q l A power supply Fig. 3.1 (a) (i) Procedure • Place the sliding contact C at a distance of l = 10.0 cm from end P of the resistance wire. • Close the switch. • Measure and record in Table 3.1, the reading V on the voltmeter. • Open the switch. [1] Table 3.1 l / cm V / V 10.0 30.0 50.0 70.0 90.0 (ii) Repeat the procedure in (a)(i) using values of l of 30.0 cm, 50.0 cm, 70.0 cm and 90.0 cm. [1] (iii) Close the switch. Measure the current I in the circuit for l = 90.0 cm. I = ...................................................... A [1] (b) On the grid provided, plot a graph of V / V (vertical axis) against l / cm. Start both axes from the origin (0, 0). Draw the best-fit straight line. V/V l / cm [3] (c) Extend your line until it crosses the vertical axis. Measure the intercept Y that your line makes on the vertical axis. Y = ......................................................... [1] (d) The resistance of the unknown resistor R is given by the equation shown. Y resistance = I I is the current that you measured in part (a)(iii). Use this equation to calculate a value for the resistance of R. resistance of R = ..................................................... Ω [2] (e) Suggest one practical reason why, despite carrying out the experiment with care, your value for the resistance of R is only approximate. ................................................................................................................................................... ............................................................................................................................................. [1] [Total: 10]
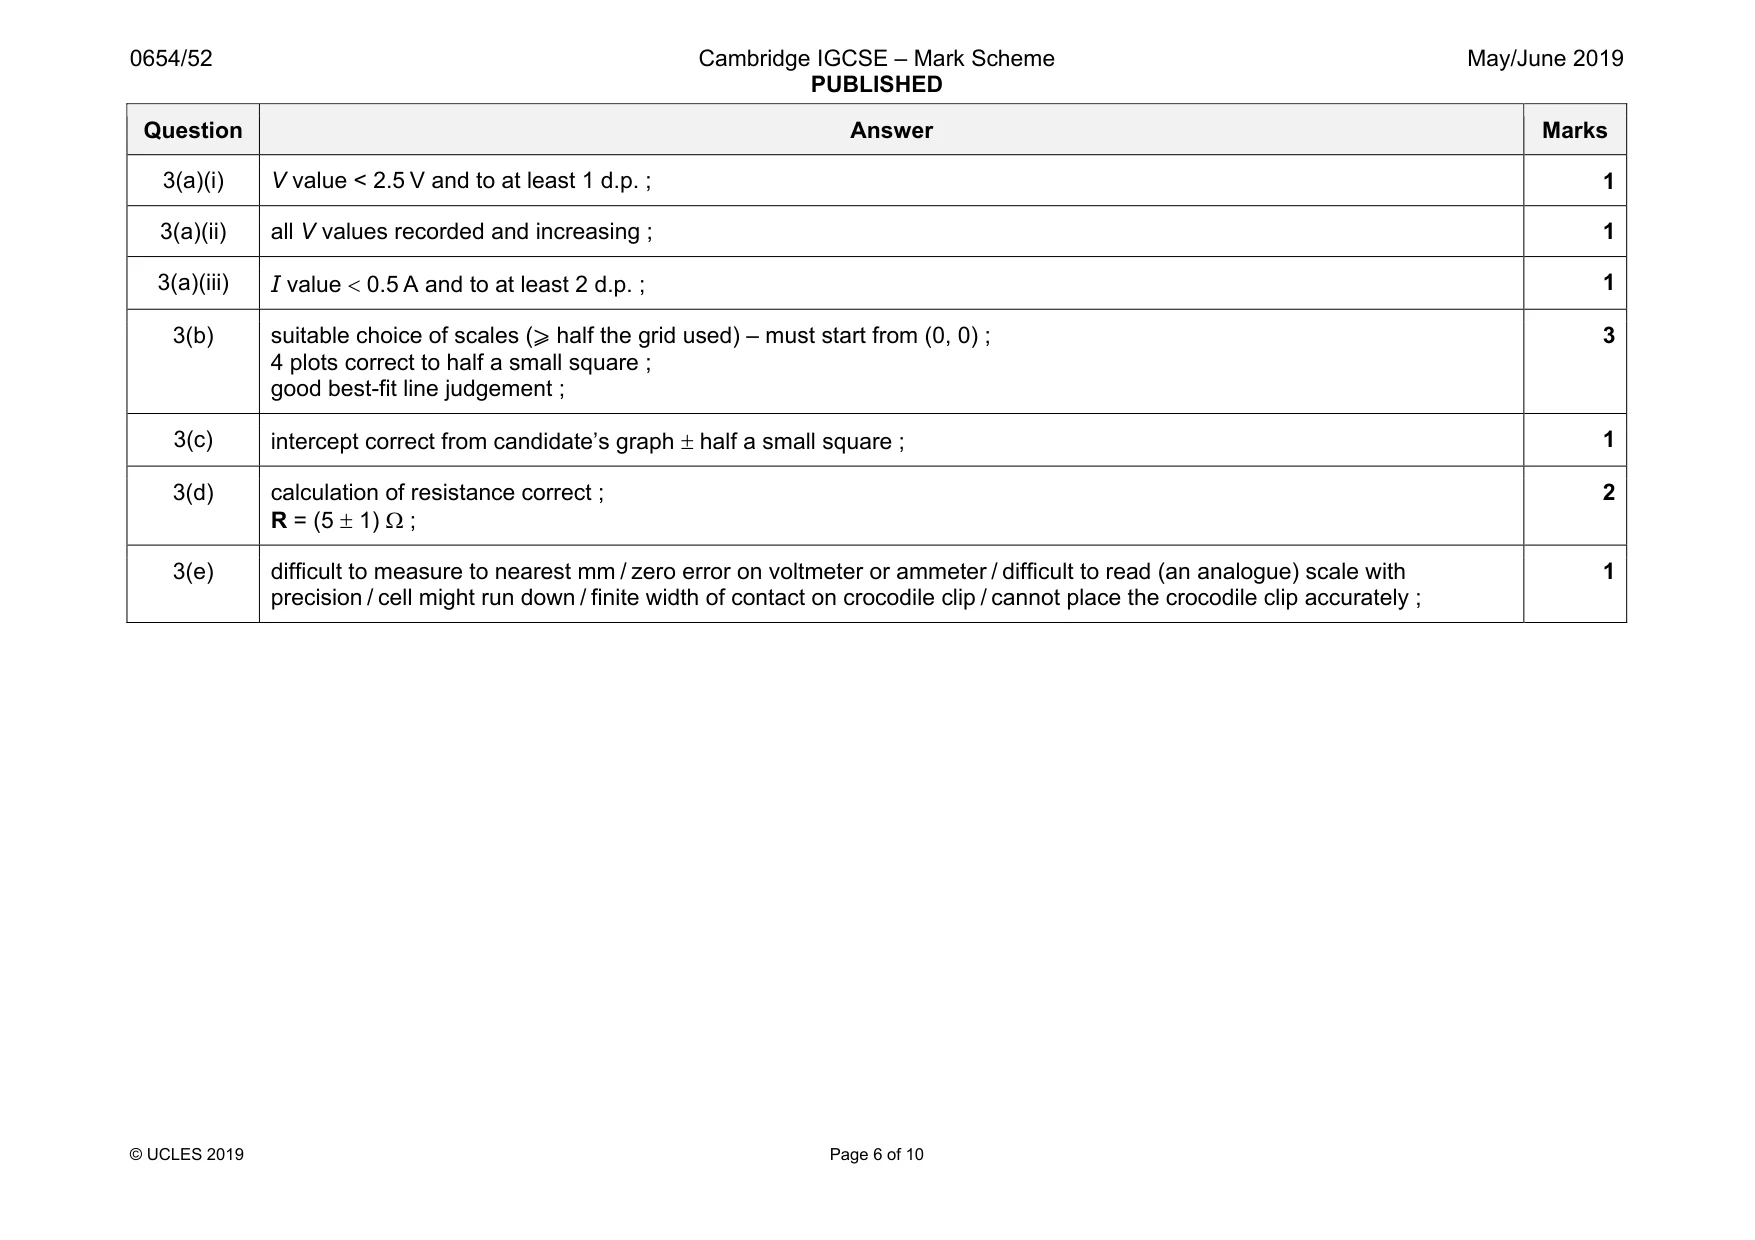
Mark scheme: 3(a)(i) V value < 2.5 V and to at least 1 d.p. ; 1 3(a)(ii) all V values recorded and increasing ; 1 3(a)(iii) I value < 0.5 A and to at least 2 d.p. ; 1 3(b) suitable choice of scales (⩾ half the grid used) – must start from (0, 0) ; 4 plots correct to half a small square ; good best-fit line judgement ; 3 3(c) intercept correct from candidate’s graph ± half a small square ; 1 3(d) calculation of resistance correct ; R = (5 ± 1) Ω ; 2 3(e) difficult to measure to nearest mm / zero error on voltmeter or ammeter / difficult to read (an analogue) scale with precision / cell might run down / finite width of contact on crocodile clip / cannot place the crocodile clip accurately ; 1
Q4 · You are provided with a nut in its shell
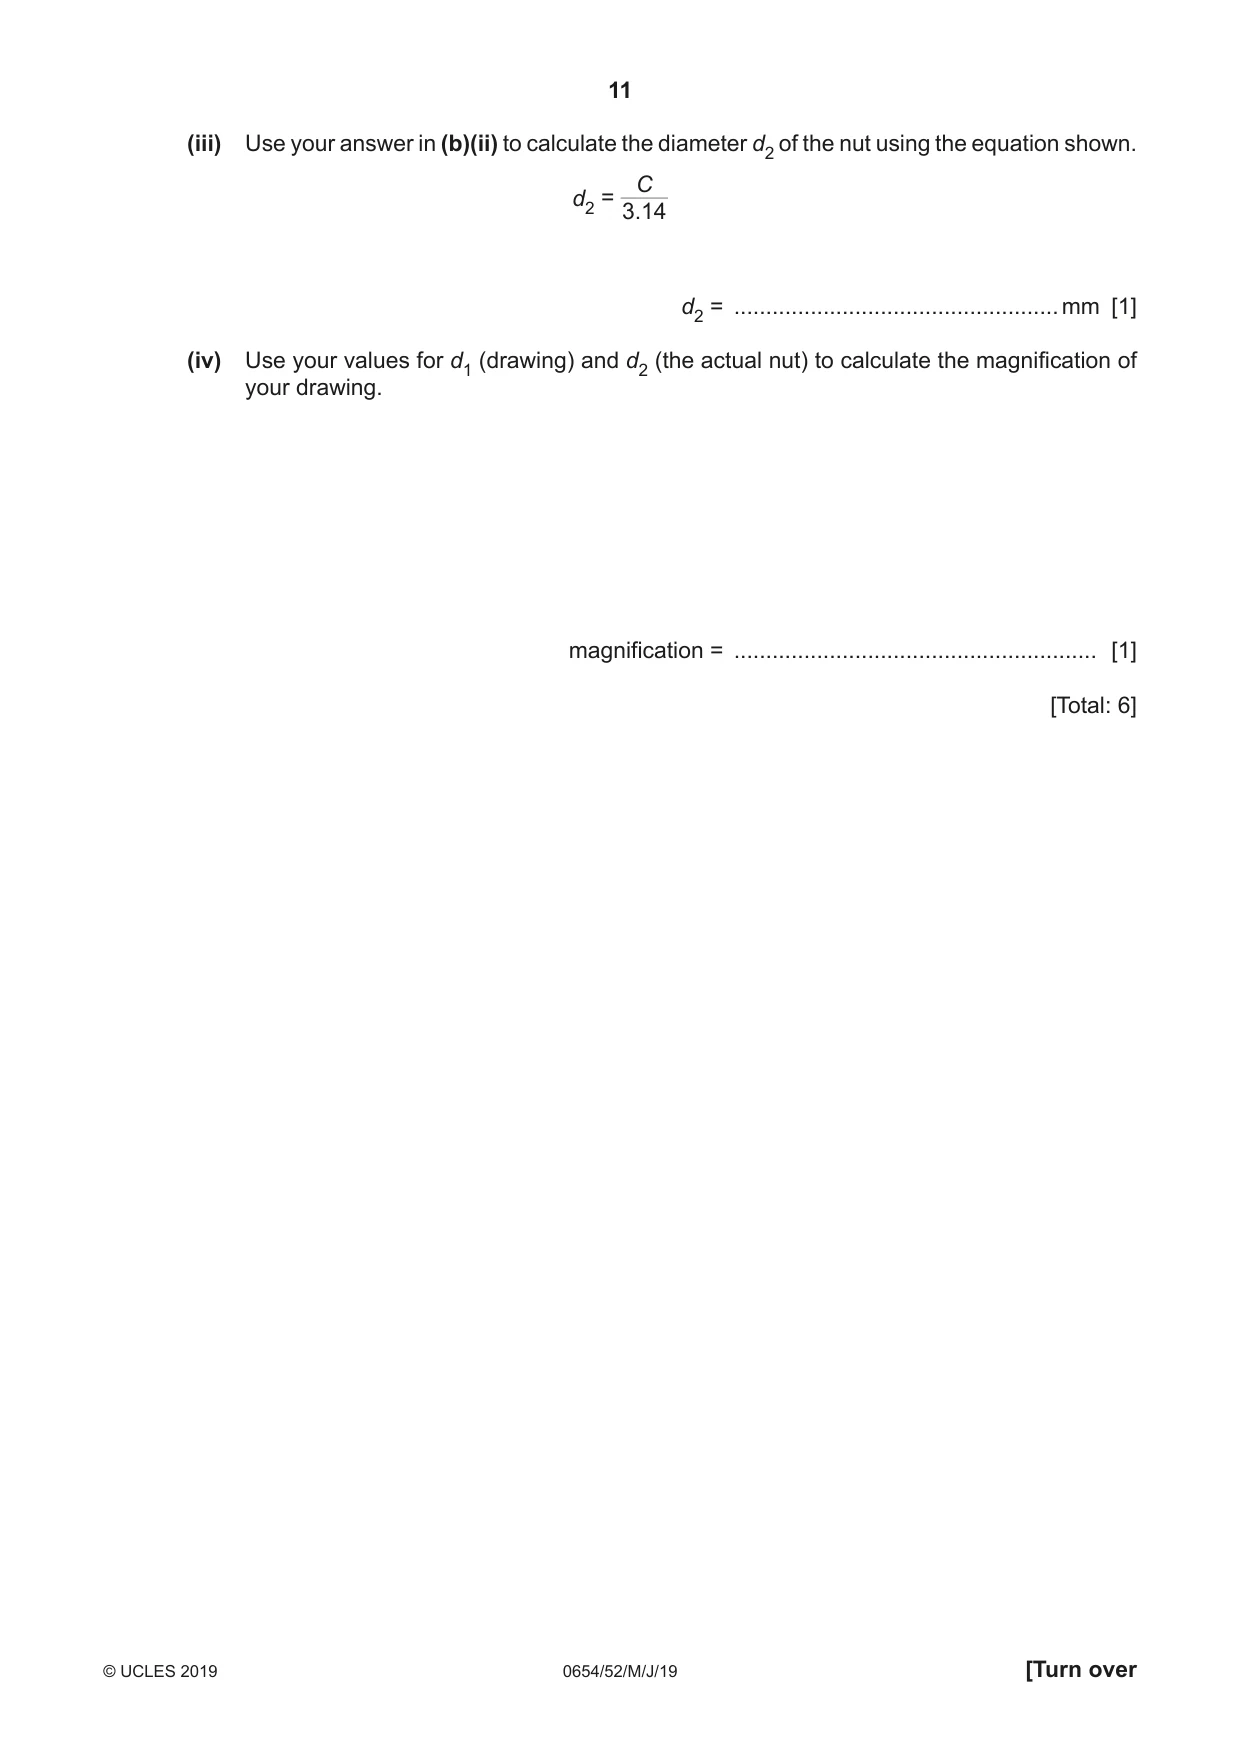
4 You are provided with a nut in its shell. (a) In the box, make an enlarged detailed pencil drawing of the nut. [2] (b) (i) Draw a line on your drawing from one side of the nut to the other to represent the diameter of the nut. Measure and record this diameter d1 in millimetres to the nearest millimetre. d1 = ................................................... mm [1] (ii) Use the string and ruler provided to measure the circumference of the nut in its shell. Record this circumference C in millimetres to the nearest millimetre. C = ................................................... mm [1] (iii) Use your answer in (b)(ii) to calculate the diameter d2 of the nut using the equation shown. C d2 = 3.14 d2 = ................................................... mm [1] (iv) Use your values for d1 (drawing) and d2 (the actual nut) to calculate the magnification of your drawing. magnification = ......................................................... [1] [Total: 6]
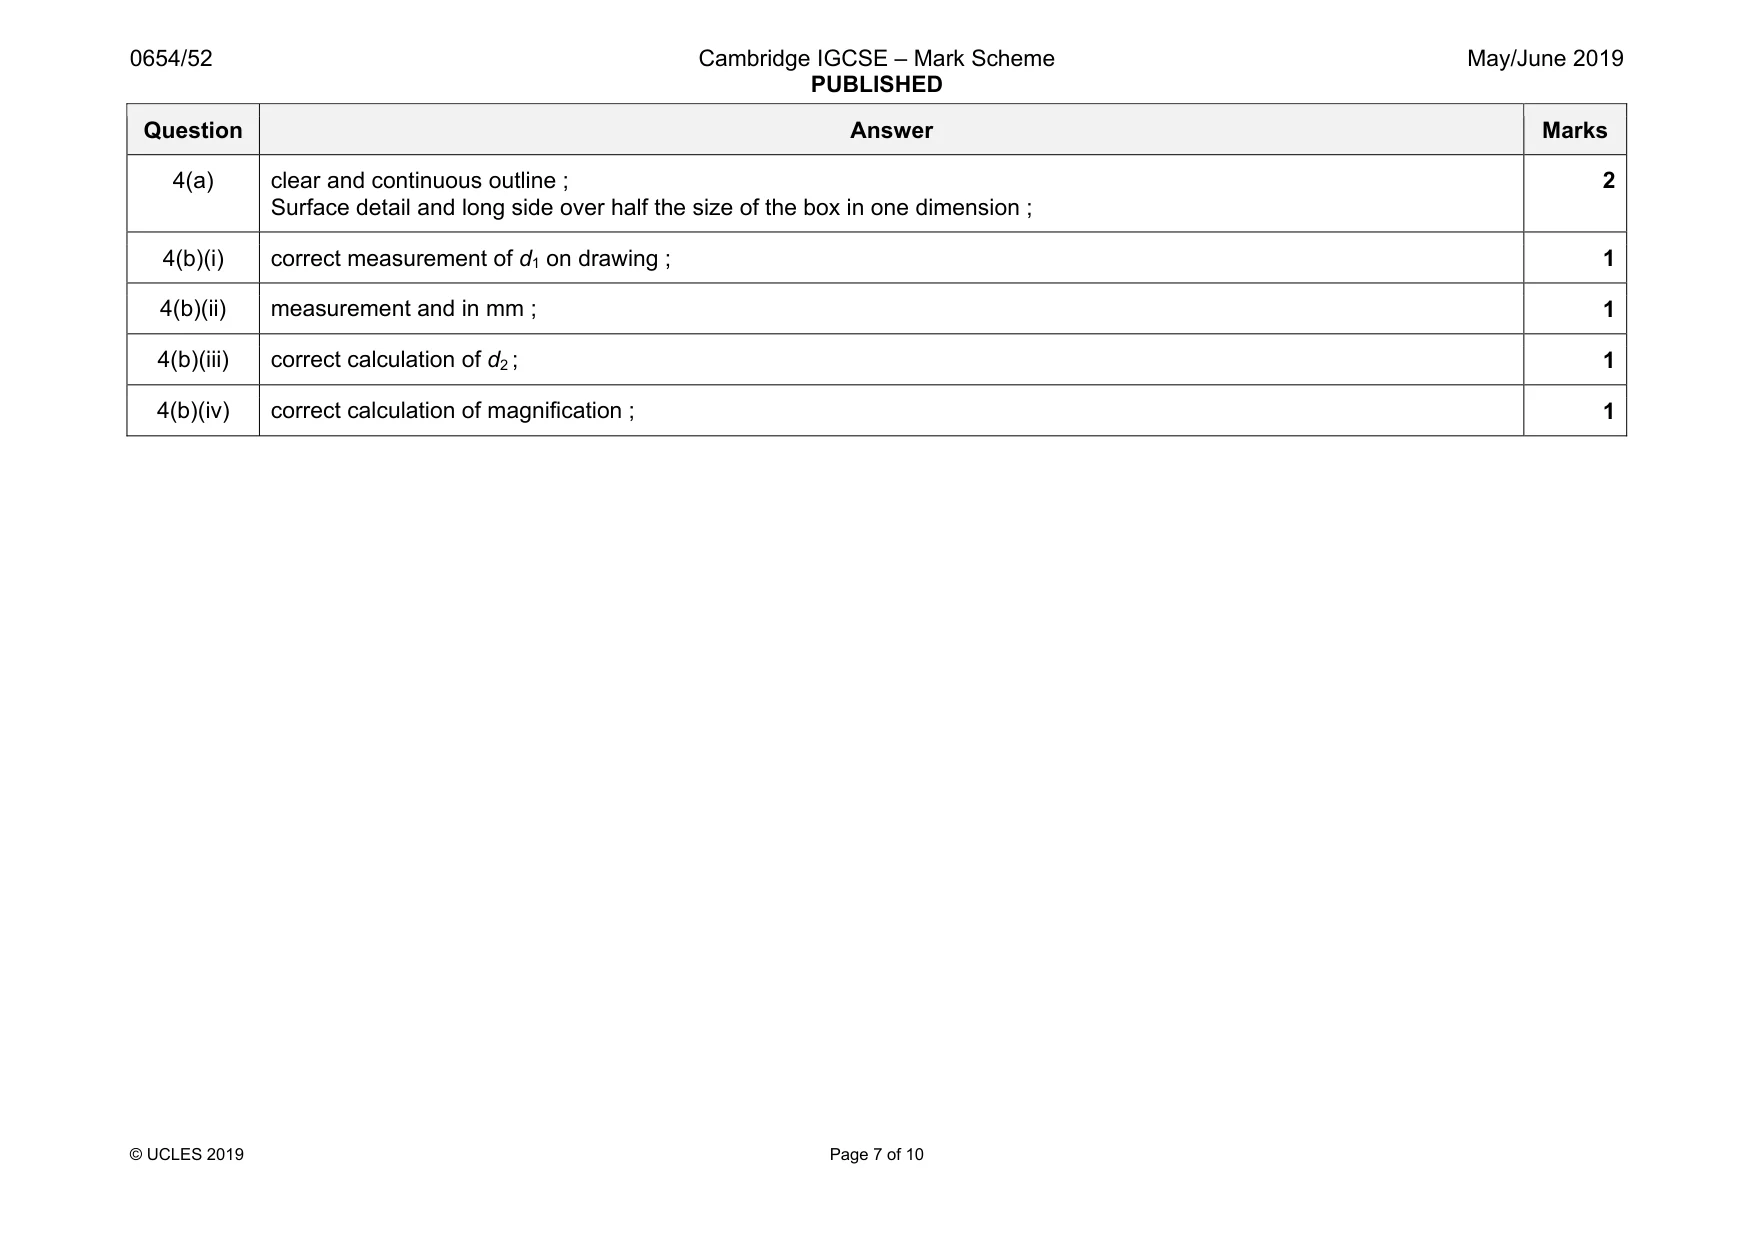
Mark scheme: 4(a) clear and continuous outline ; Surface detail and long side over half the size of the box in one dimension ; 2 4(b)(i) correct measurement of d1 on drawing ; 1 4(b)(ii) measurement and in mm ; 1 4(b)(iii) correct calculation of d2 ; 1 4(b)(iv) correct calculation of magnification ; 1
Q5 · You are going to investigate how the concentration of hydrochloric acid affects its…
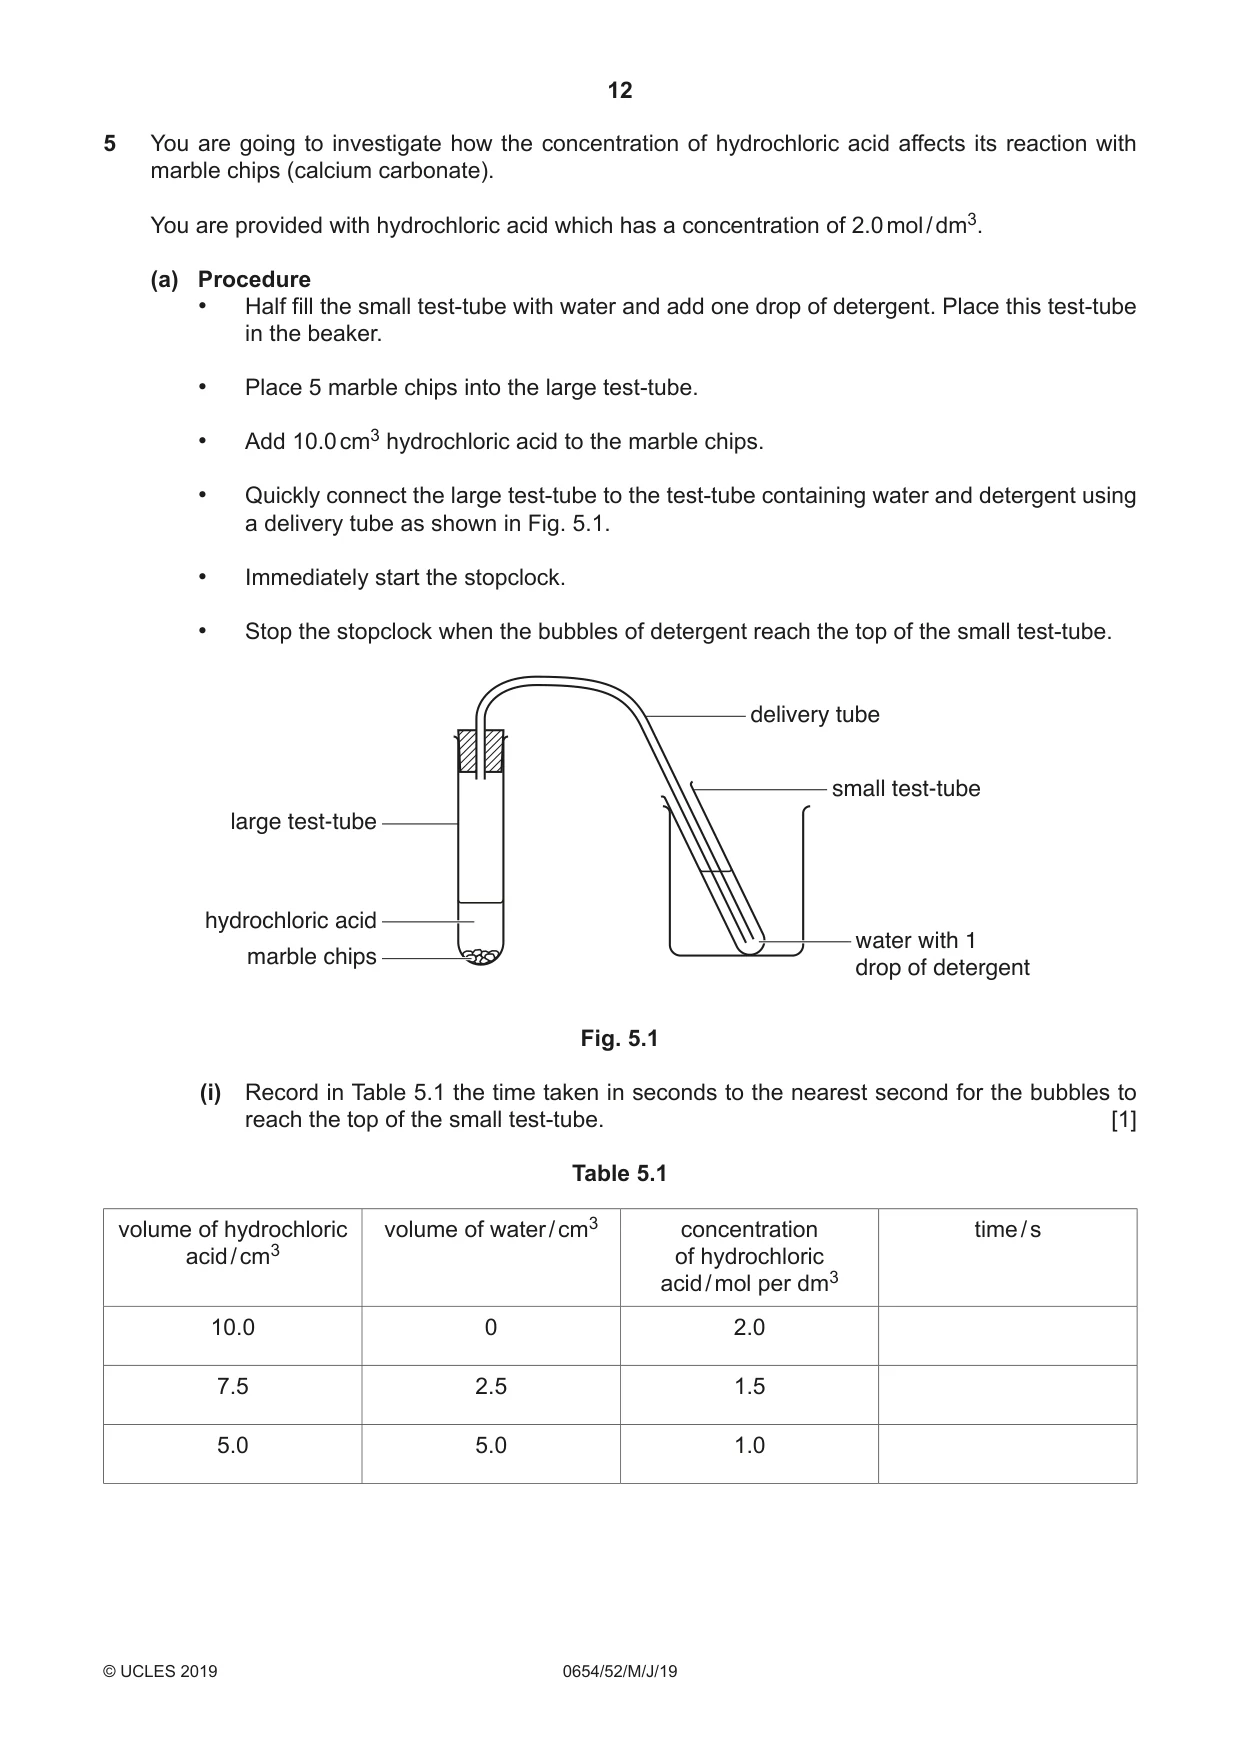
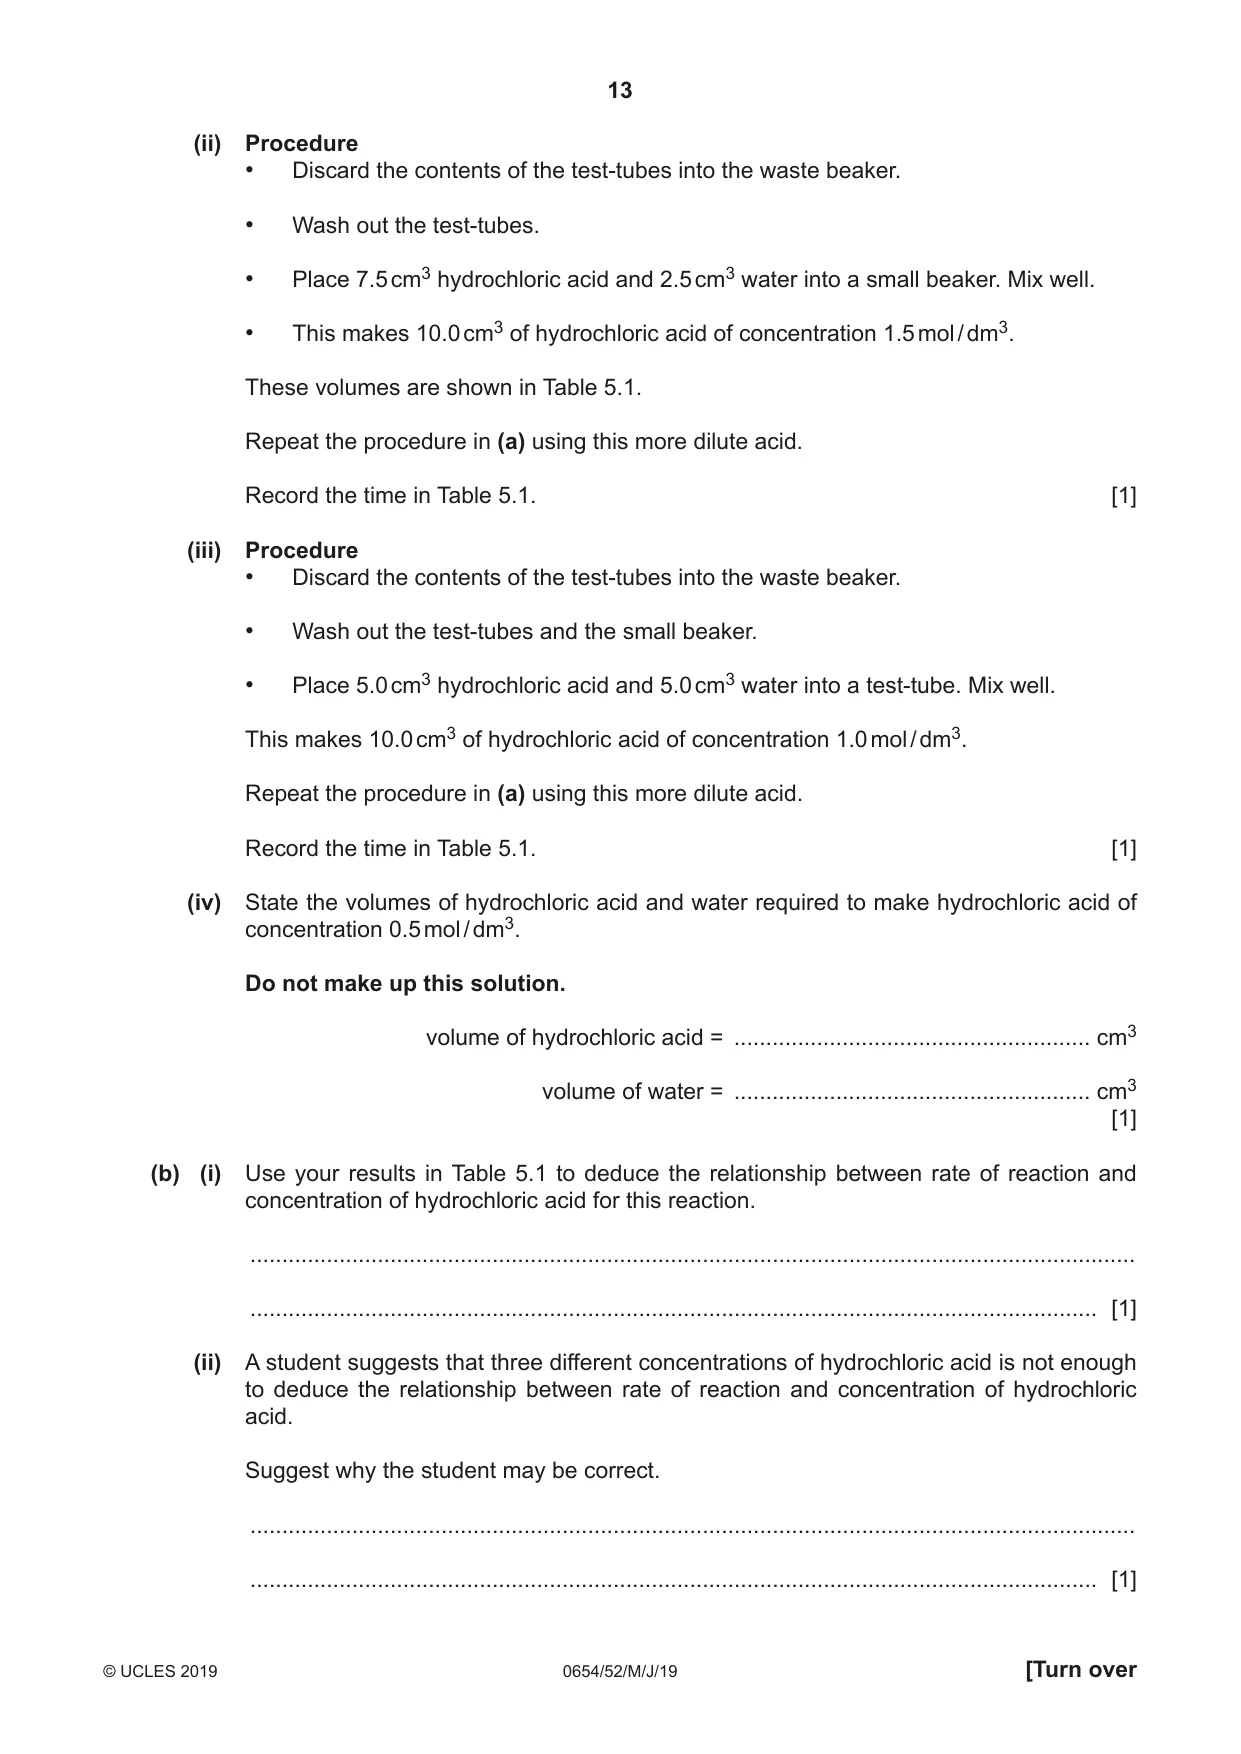
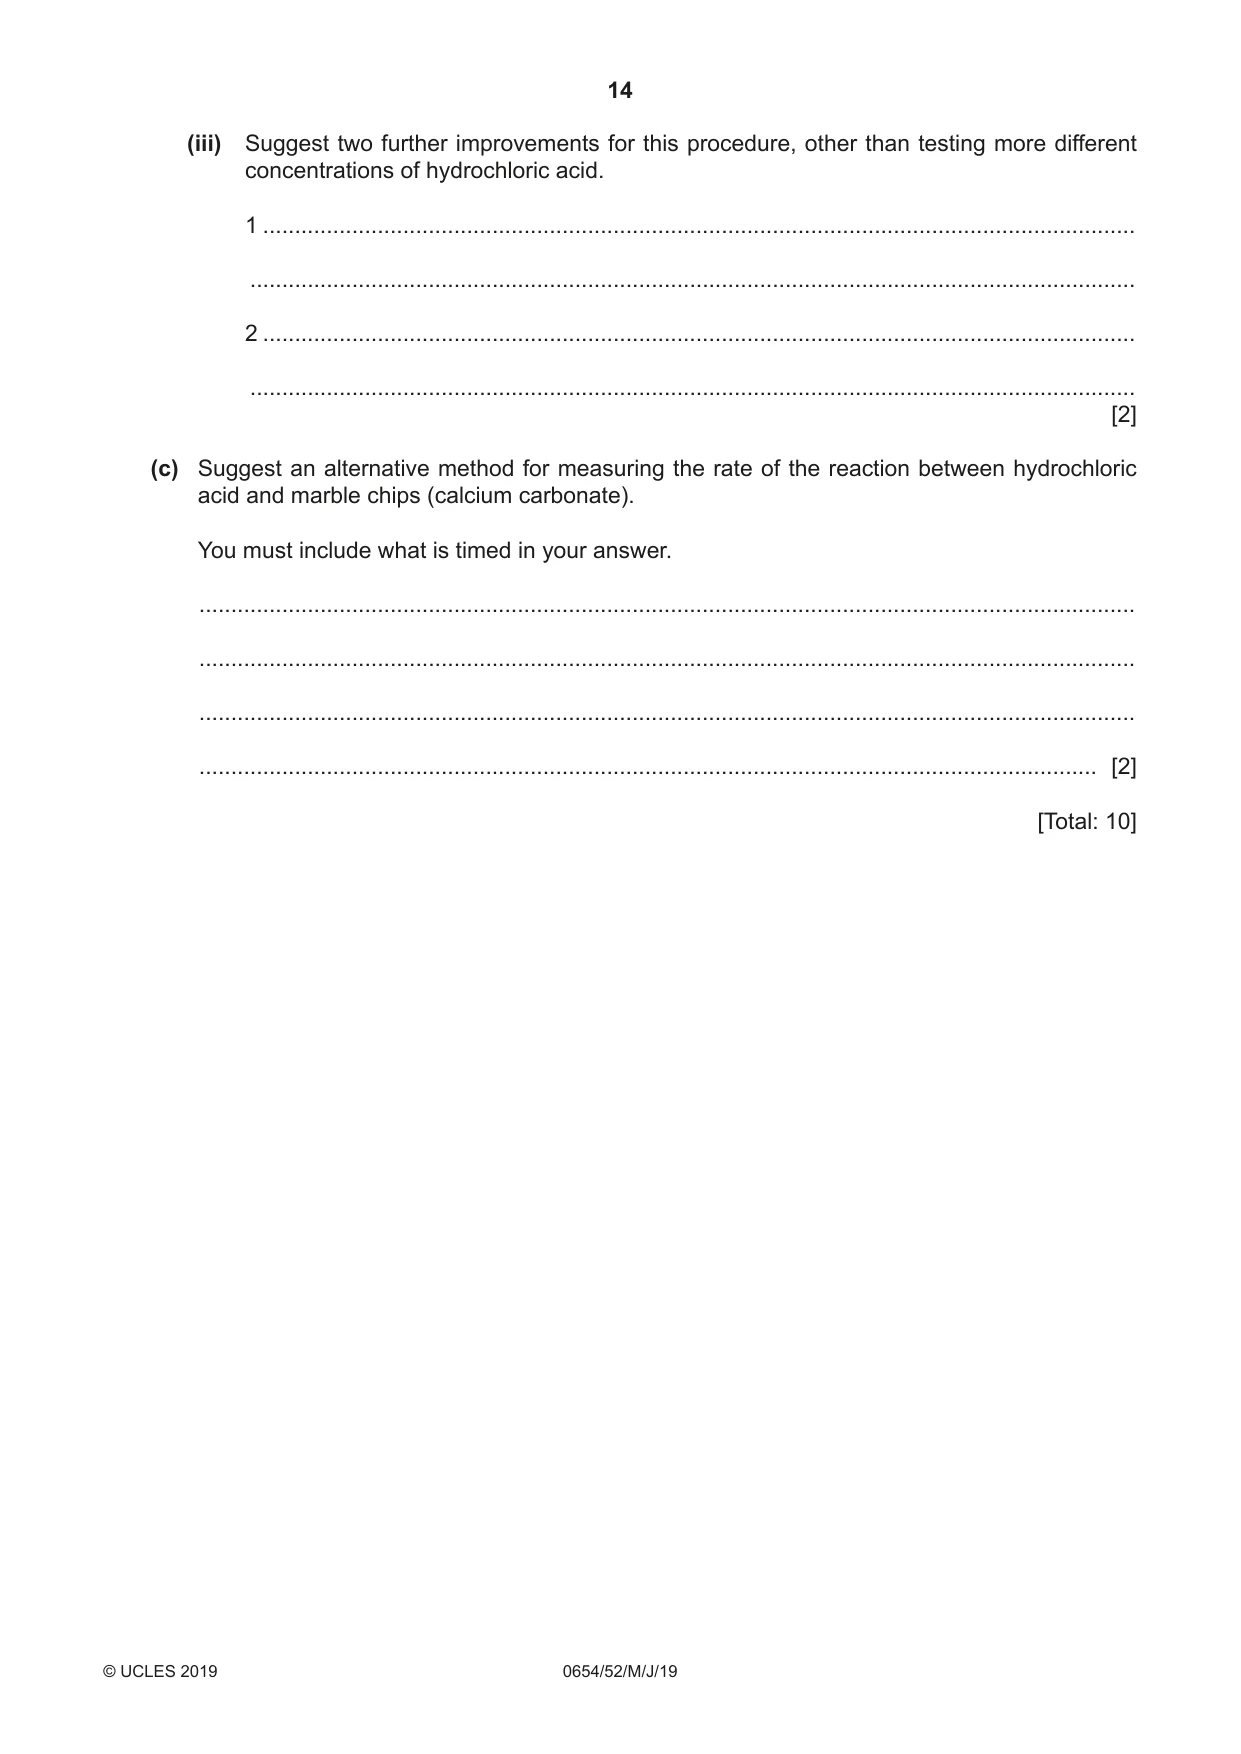
5 You are going to investigate how the concentration of hydrochloric acid affects its reaction with marble chips (calcium carbonate). You are provided with hydrochloric acid which has a concentration of 2.0 mol / dm3. (a) Procedure • Half fill the small test-tube with water and add one drop of detergent. Place this test-tube in the beaker. • Place 5 marble chips into the large test-tube. • Add 10.0 cm3 hydrochloric acid to the marble chips. • Quickly connect the large test-tube to the test-tube containing water and detergent using a delivery tube as shown in Fig. 5.1. • Immediately start the stopclock. • Stop the stopclock when the bubbles of detergent reach the top of the small test-tube. delivery tube small test-tube large test-tube hydrochloric acid water with 1 marble chips drop of detergent Fig. 5.1 (i) Record in Table 5.1 the time taken in seconds to the nearest second for the bubbles to reach the top of the small test-tube. [1] Table 5.1 volume of hydrochloric volume of water / cm3 concentration time / s acid / cm3 of hydrochloric acid / mol per dm3 10.0 0 2.0 7.5 2.5 1.5 5.0 5.0 1.0 (ii) Procedure • Discard the contents of the test-tubes into the waste beaker. • Wash out the test-tubes. • Place 7.5 cm3 hydrochloric acid and 2.5 cm3 water into a small beaker. Mix well. • This makes 10.0 cm3 of hydrochloric acid of concentration 1.5 mol / dm3. These volumes are shown in Table 5.1. Repeat the procedure in (a) using this more dilute acid. Record the time in Table 5.1. [1] (iii) Procedure • Discard the contents of the test-tubes into the waste beaker. • Wash out the test-tubes and the small beaker. • Place 5.0 cm3 hydrochloric acid and 5.0 cm3 water into a test-tube. Mix well. This makes 10.0 cm3 of hydrochloric acid of concentration 1.0 mol / dm3. Repeat the procedure in (a) using this more dilute acid. Record the time in Table 5.1. [1] (iv) State the volumes of hydrochloric acid and water required to make hydrochloric acid of concentration 0.5 mol / dm3. Do not make up this solution. volume of hydrochloric acid = ........................................................ cm3 volume of water = ........................................................ cm3 [1] (b) (i) Use your results in Table 5.1 to deduce the relationship between rate of reaction and concentration of hydrochloric acid for this reaction. ........................................................................................................................................... ..................................................................................................................................... [1] (ii) A student suggests that three different concentrations of hydrochloric acid is not enough to deduce the relationship between rate of reaction and concentration of hydrochloric acid. Suggest why the student may be correct. ........................................................................................................................................... ..................................................................................................................................... [1] (iii) Suggest two further improvements for this procedure, other than testing more different concentrations of hydrochloric acid. 1 ......................................................................................................................................... ........................................................................................................................................... 2 ......................................................................................................................................... ........................................................................................................................................... [2] (c) Suggest an alternative method for measuring the rate of the reaction between hydrochloric acid and marble chips (calcium carbonate). You must include what is timed in your answer. ................................................................................................................................................... ................................................................................................................................................... ................................................................................................................................................... ............................................................................................................................................. [2] [Total: 10]
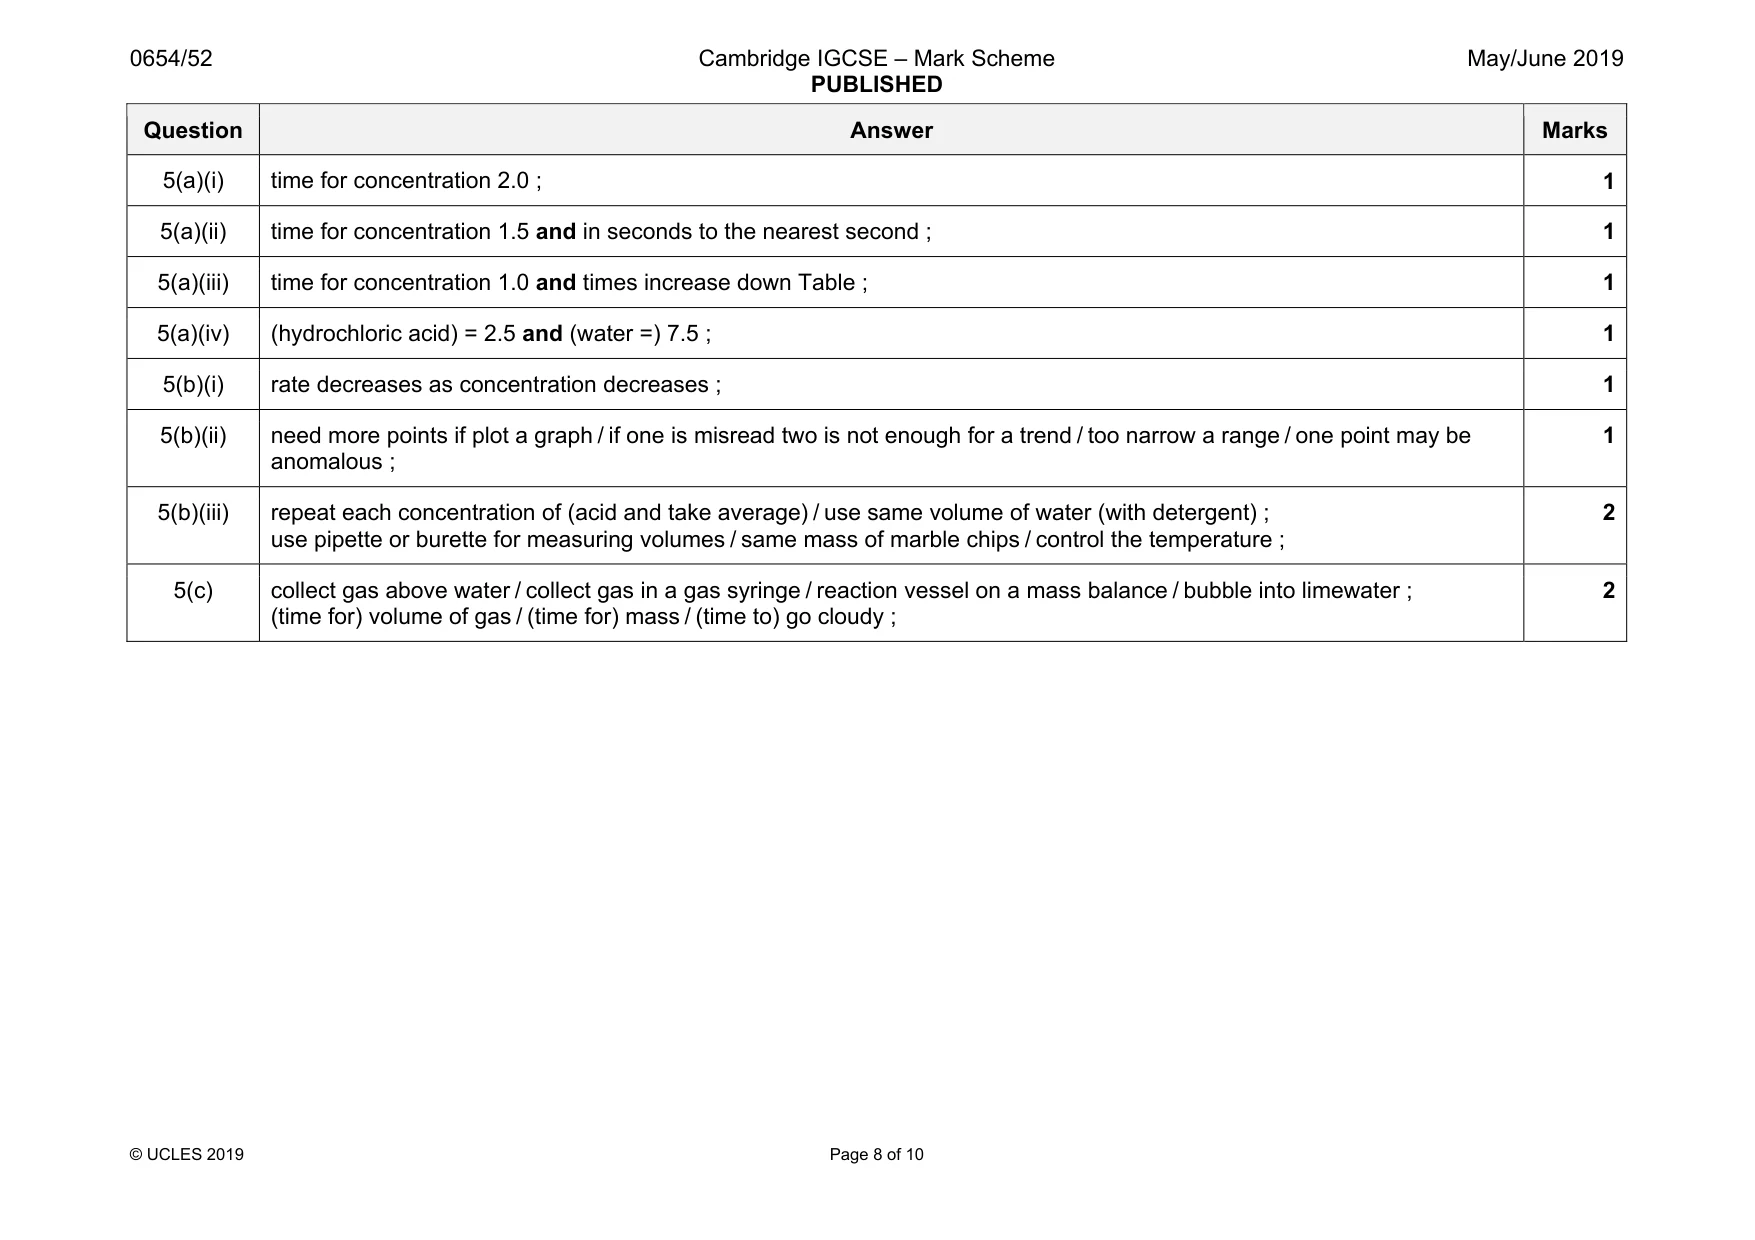
Mark scheme: 5(a)(i) time for concentration 2.0 ; 1 5(a)(ii) time for concentration 1.5 and in seconds to the nearest second ; 1 5(a)(iii) time for concentration 1.0 and times increase down Table ; 1 5(a)(iv) (hydrochloric acid) = 2.5 and (water =) 7.5 ; 1 5(b)(i) rate decreases as concentration decreases ; 1 5(b)(ii) need more points if plot a graph / if one is misread two is not enough for a trend / too narrow a range / one point may be anomalous ; 1 5(b)(iii) repeat each concentration of (acid and take average) / use same volume of water (with detergent) ; use pipette or burette for measuring volumes / same mass of marble chips / control the temperature ; 2 5(c) collect gas above water / collect gas in a gas syringe / reaction vessel on a mass balance / bubble into limewater ; (time for) volume of gas / (time for) mass / (time to) go cloudy ; 2
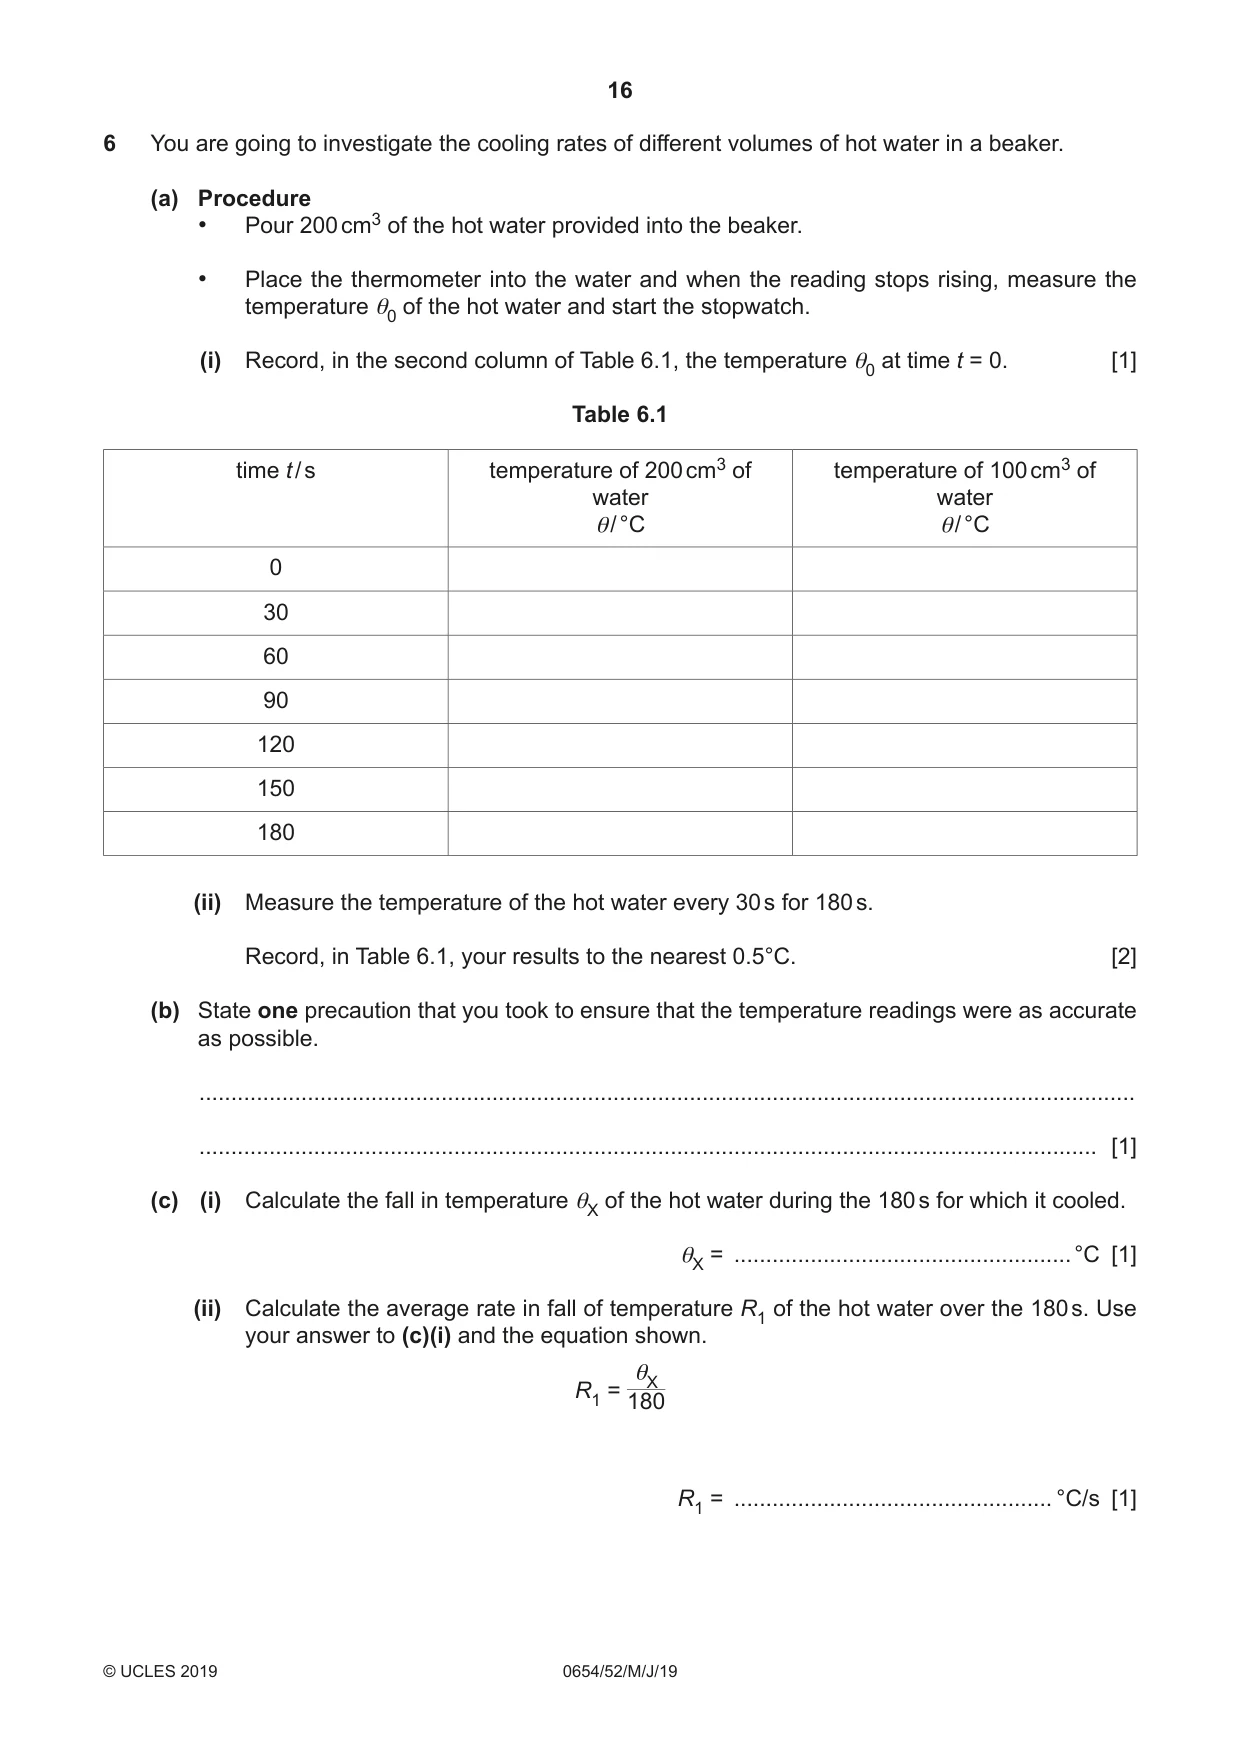
Q6 · You are going to investigate the cooling rates of different volumes of hot water in a…
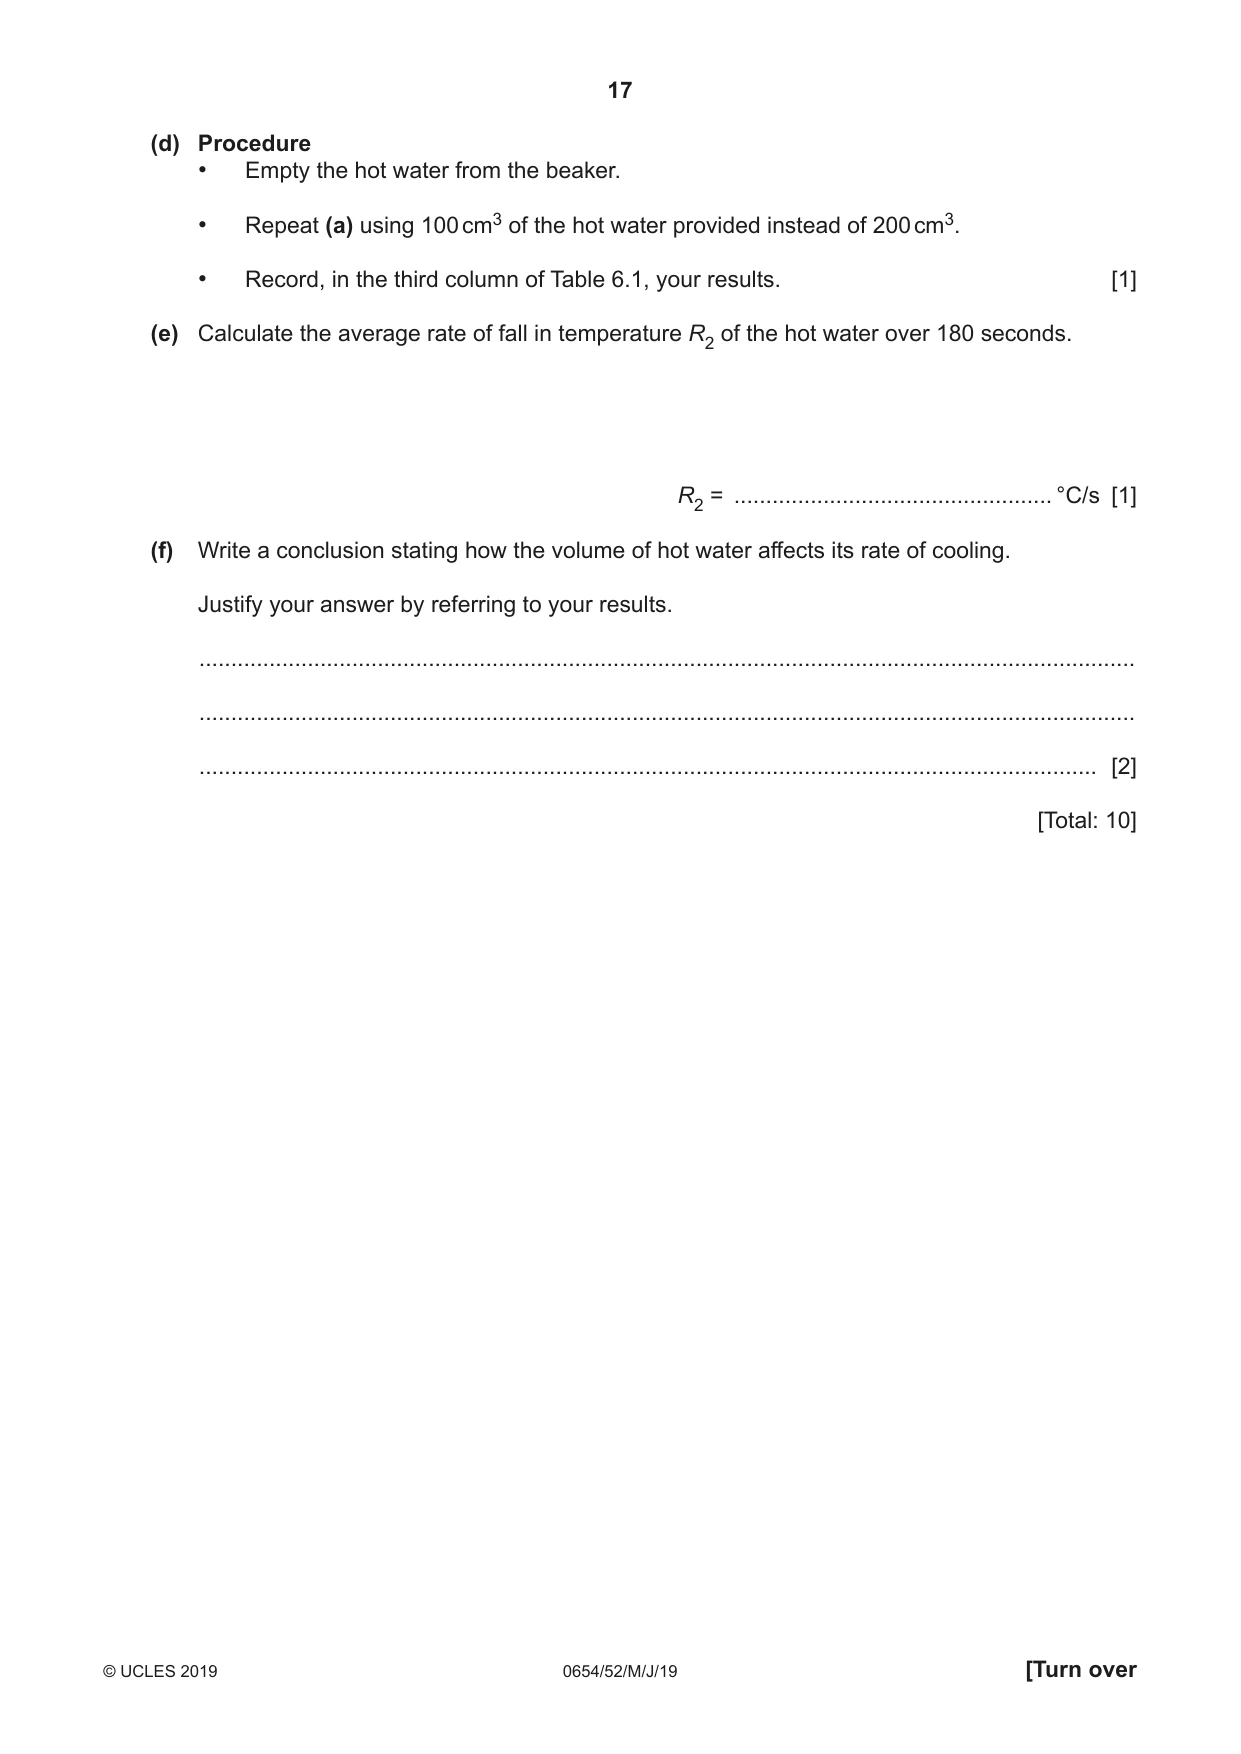
6 You are going to investigate the cooling rates of different volumes of hot water in a beaker. (a) Procedure • Pour 200 cm3 of the hot water provided into the beaker. • Place the thermometer into the water and when the reading stops rising, measure the temperature θ0 of the hot water and start the stopwatch. (i) Record, in the second column of Table 6.1, the temperature θ0 at time t = 0. [1] Table 6.1 time t / s temperature of 200 cm3 of temperature of 100 cm3 of water water θ/ °C θ/ °C 0 30 60 90 120 150 180 (ii) Measure the temperature of the hot water every 30 s for 180 s. Record, in Table 6.1, your results to the nearest 0.5°C. [2] (b) State one precaution that you took to ensure that the temperature readings were as accurate as possible. ................................................................................................................................................... ............................................................................................................................................. [1] (c) (i) Calculate the fall in temperature θX of the hot water during the 180 s for which it cooled. θX = ..................................................... °C [1] (ii) Calculate the average rate in fall of temperature R1 of the hot water over the 180 s. Use your answer to (c)(i) and the equation shown. θX R1 = 180 R1 = .................................................. °C/s [1] (d) Procedure • Empty the hot water from the beaker. • Repeat (a) using 100 cm3 of the hot water provided instead of 200 cm3. • Record, in the third column of Table 6.1, your results. [1] (e) Calculate the average rate of fall in temperature R2 of the hot water over 180 seconds. R2 = .................................................. °C/s [1] (f) Write a conclusion stating how the volume of hot water affects its rate of cooling. Justify your answer by referring to your results. ................................................................................................................................................... ................................................................................................................................................... ............................................................................................................................................. [2] [Total: 10]
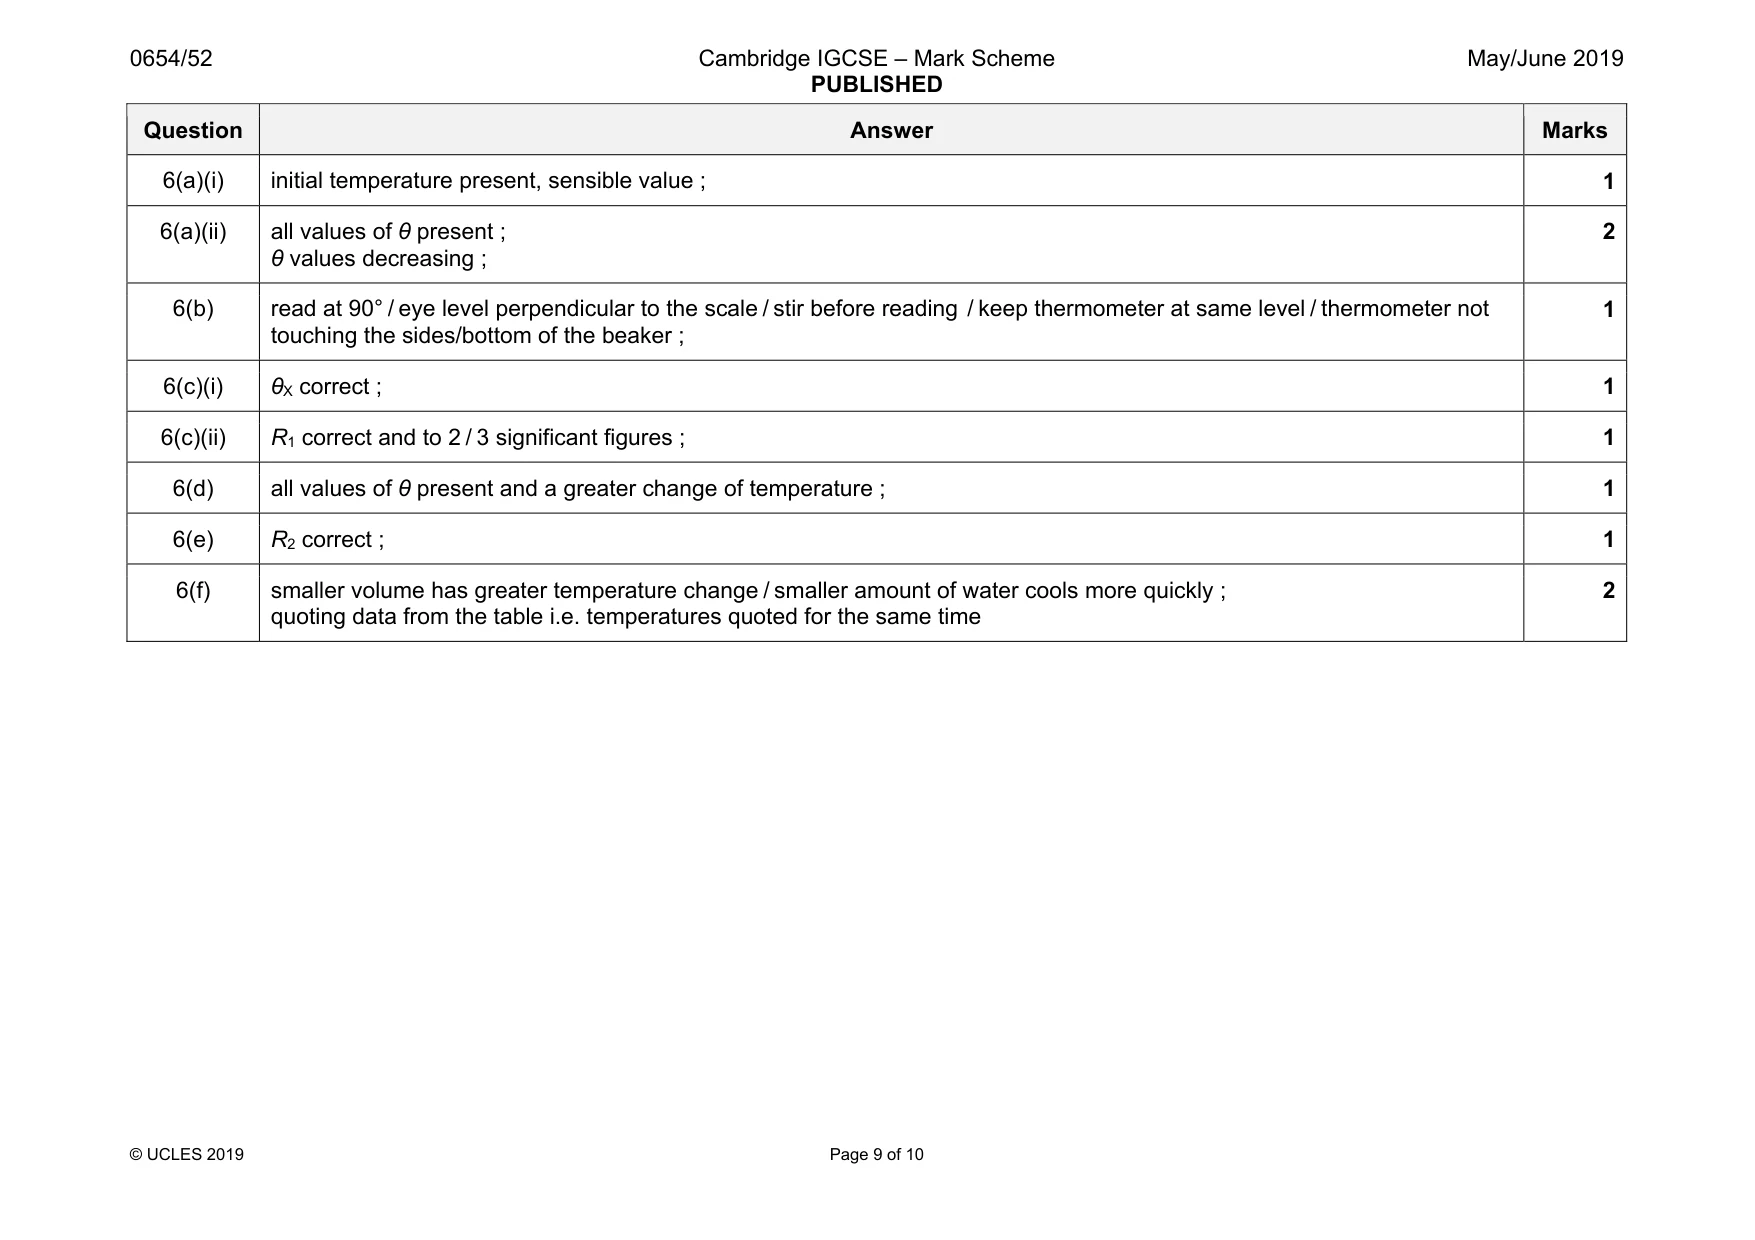
Mark scheme: 6(a)(i) initial temperature present, sensible value ; 1 6(a)(ii) all values of θ present ; θ values decreasing ; 2 6(b) read at 90° / eye level perpendicular to the scale / stir before reading / keep thermometer at same level / thermometer not touching the sides/bottom of the beaker ; 1 6(c)(i) θX correct ; 1 6(c)(ii) R1 correct and to 2 / 3 significant figures ; 1 6(d) all values of θ present and a greater change of temperature ; 1 6(e) R2 correct ; 1 6(f) smaller volume has greater temperature change / smaller amount of water cools more quickly ; quoting data from the table i.e. temperatures quoted for the same time 2
Q7 · A student has three solutions containing different concentrations of reducing sugar
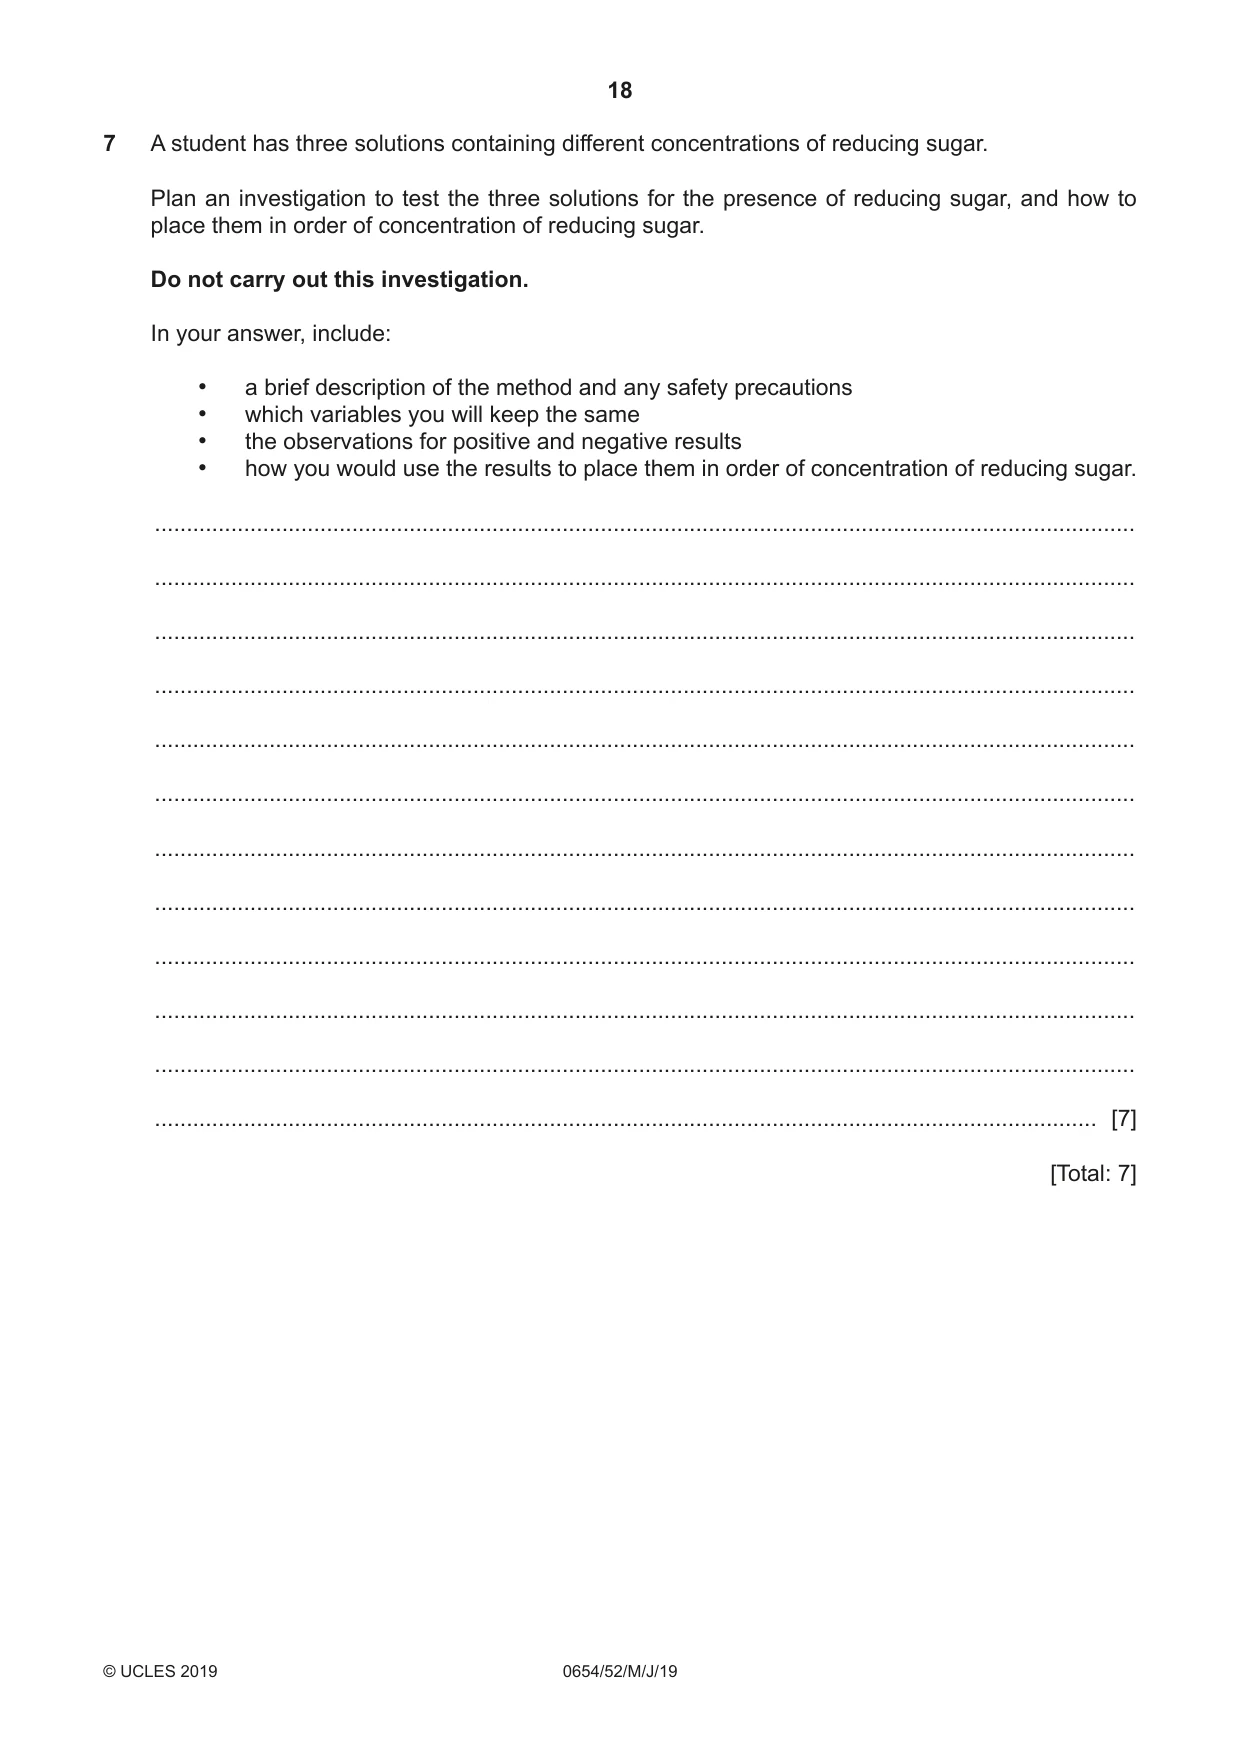
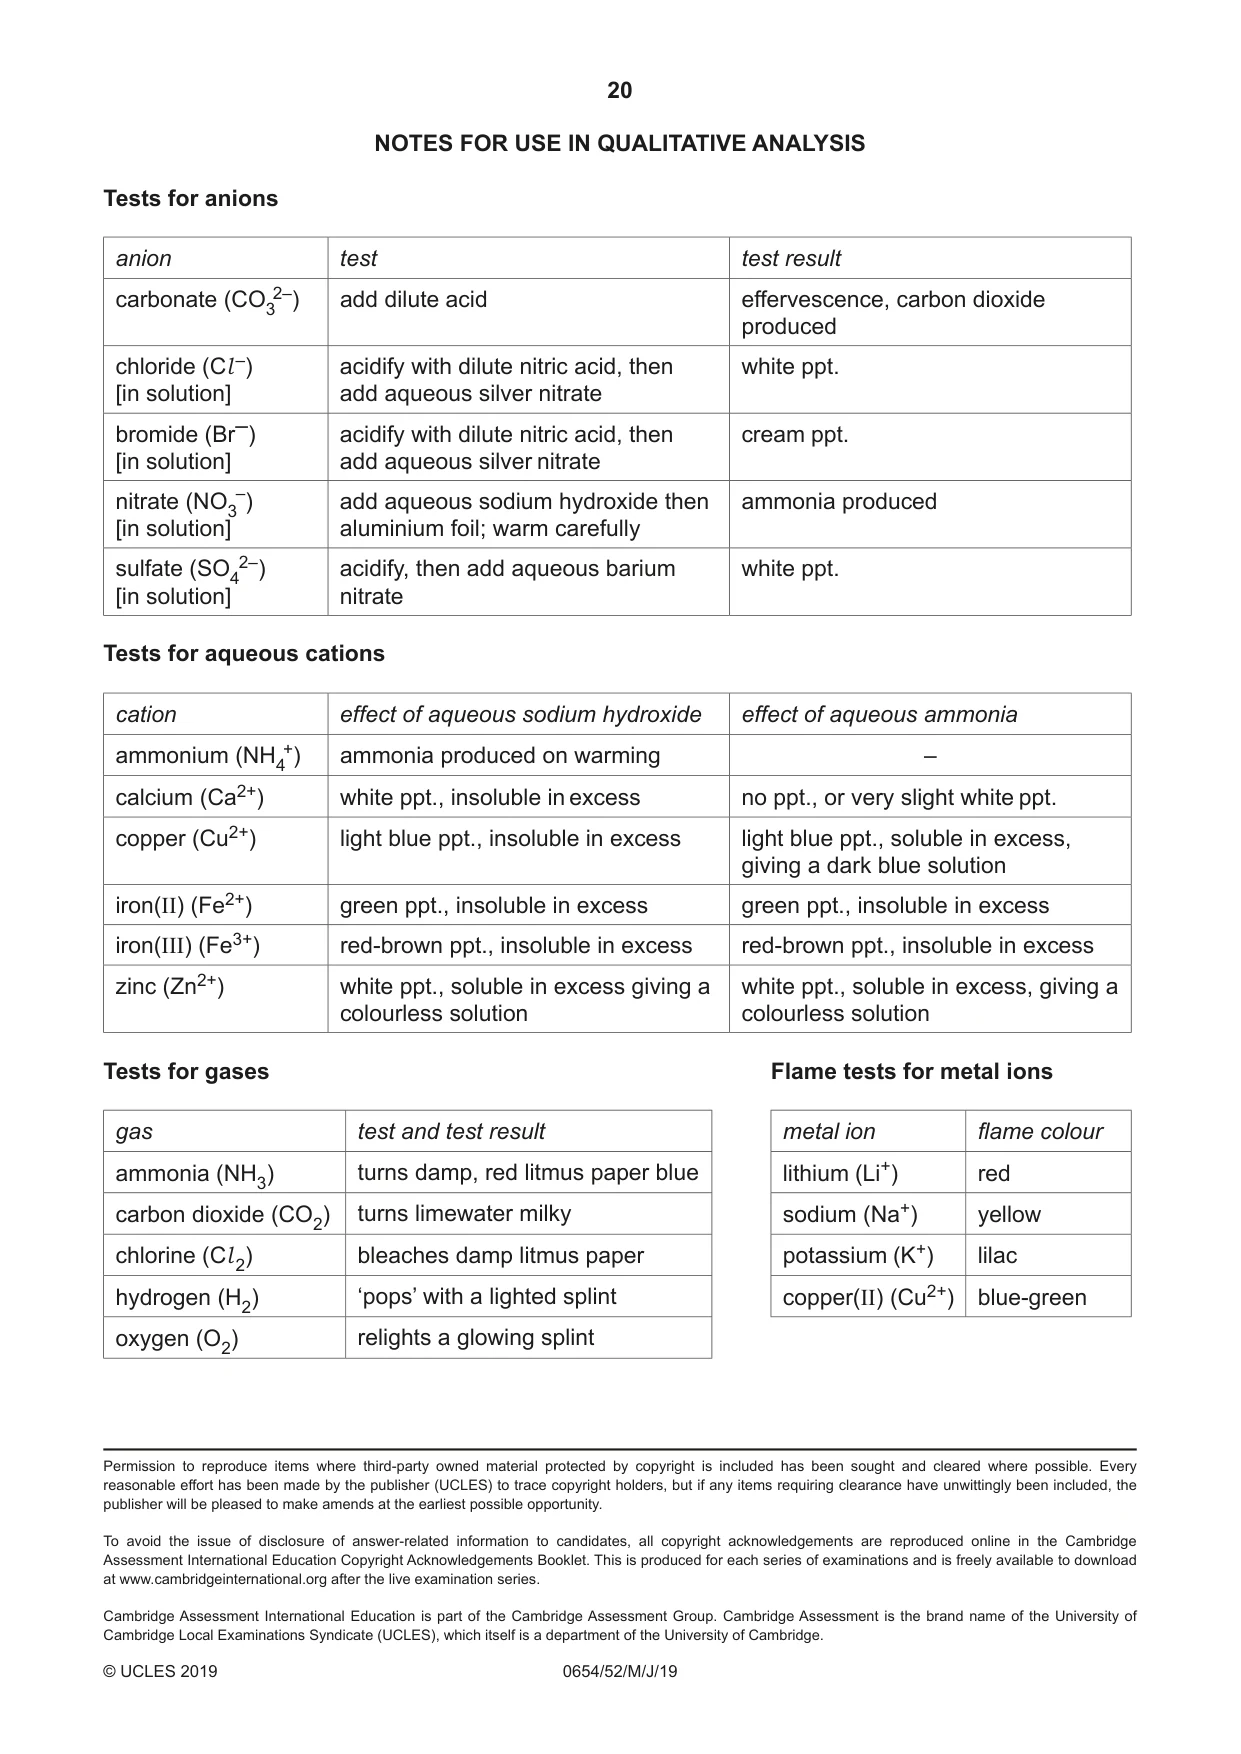
7 A student has three solutions containing different concentrations of reducing sugar. Plan an investigation to test the three solutions for the presence of reducing sugar, and how to place them in order of concentration of reducing sugar. Do not carry out this investigation. In your answer, include: • a brief description of the method and any safety precautions • which variables you will keep the same • the observations for positive and negative results • how you would use the results to place them in order of concentration of reducing sugar. .......................................................................................................................................................... .......................................................................................................................................................... .......................................................................................................................................................... .......................................................................................................................................................... .......................................................................................................................................................... .......................................................................................................................................................... .......................................................................................................................................................... .......................................................................................................................................................... .......................................................................................................................................................... .......................................................................................................................................................... .......................................................................................................................................................... .................................................................................................................................................... [7] [Total: 7] NOTES FOR USE IN QUALITATIVE ANALYSIS Tests for anions anion test test result carbonate (CO32–) add dilute acid effervescence, carbon dioxide produced chloride (Cl –) acidify with dilute nitric acid, then white ppt. [in solution] add aqueous silver nitrate bromide (Br–) acidify with dilute nitric acid, then cream ppt. [in solution] add aqueous silver nitrate nitrate (NO3–) add aqueous sodium hydroxide then ammonia produced [in solution] aluminium foil; warm carefully sulfate (SO42–) acidify, then add aqueous barium white ppt. [in solution] nitrate Tests for aqueous cations cation effect of aqueous sodium hydroxide effect of aqueous ammonia ammonium (NH4+) ammonia produced on warming – calcium (Ca2+) white ppt., insoluble in excess no ppt., or very slight white ppt. copper (Cu2+) light blue ppt., insoluble in excess light blue ppt., soluble in excess, giving a dark blue solution iron(II) (Fe2+) green ppt., insoluble in excess green ppt., insoluble in excess iron(III) (Fe3+) red-brown ppt., insoluble in excess red-brown ppt., insoluble in excess zinc (Zn2+) white ppt., soluble in excess giving a white ppt., soluble in excess, giving a colourless solution colourless solution Tests for gases Flame tests for metal ions gas test and test result metal ion flame colour ammonia (NH3) turns damp, red litmus paper blue lithium (Li+) red carbon dioxide (CO2) turns limewater milky sodium (Na+) yellow chlorine (Cl 2) bleaches damp litmus paper potassium (K+) lilac hydrogen (H2) ‘pops’ with a lighted splint copper(II) (Cu2+) blue-green oxygen (O2) relights a glowing splint
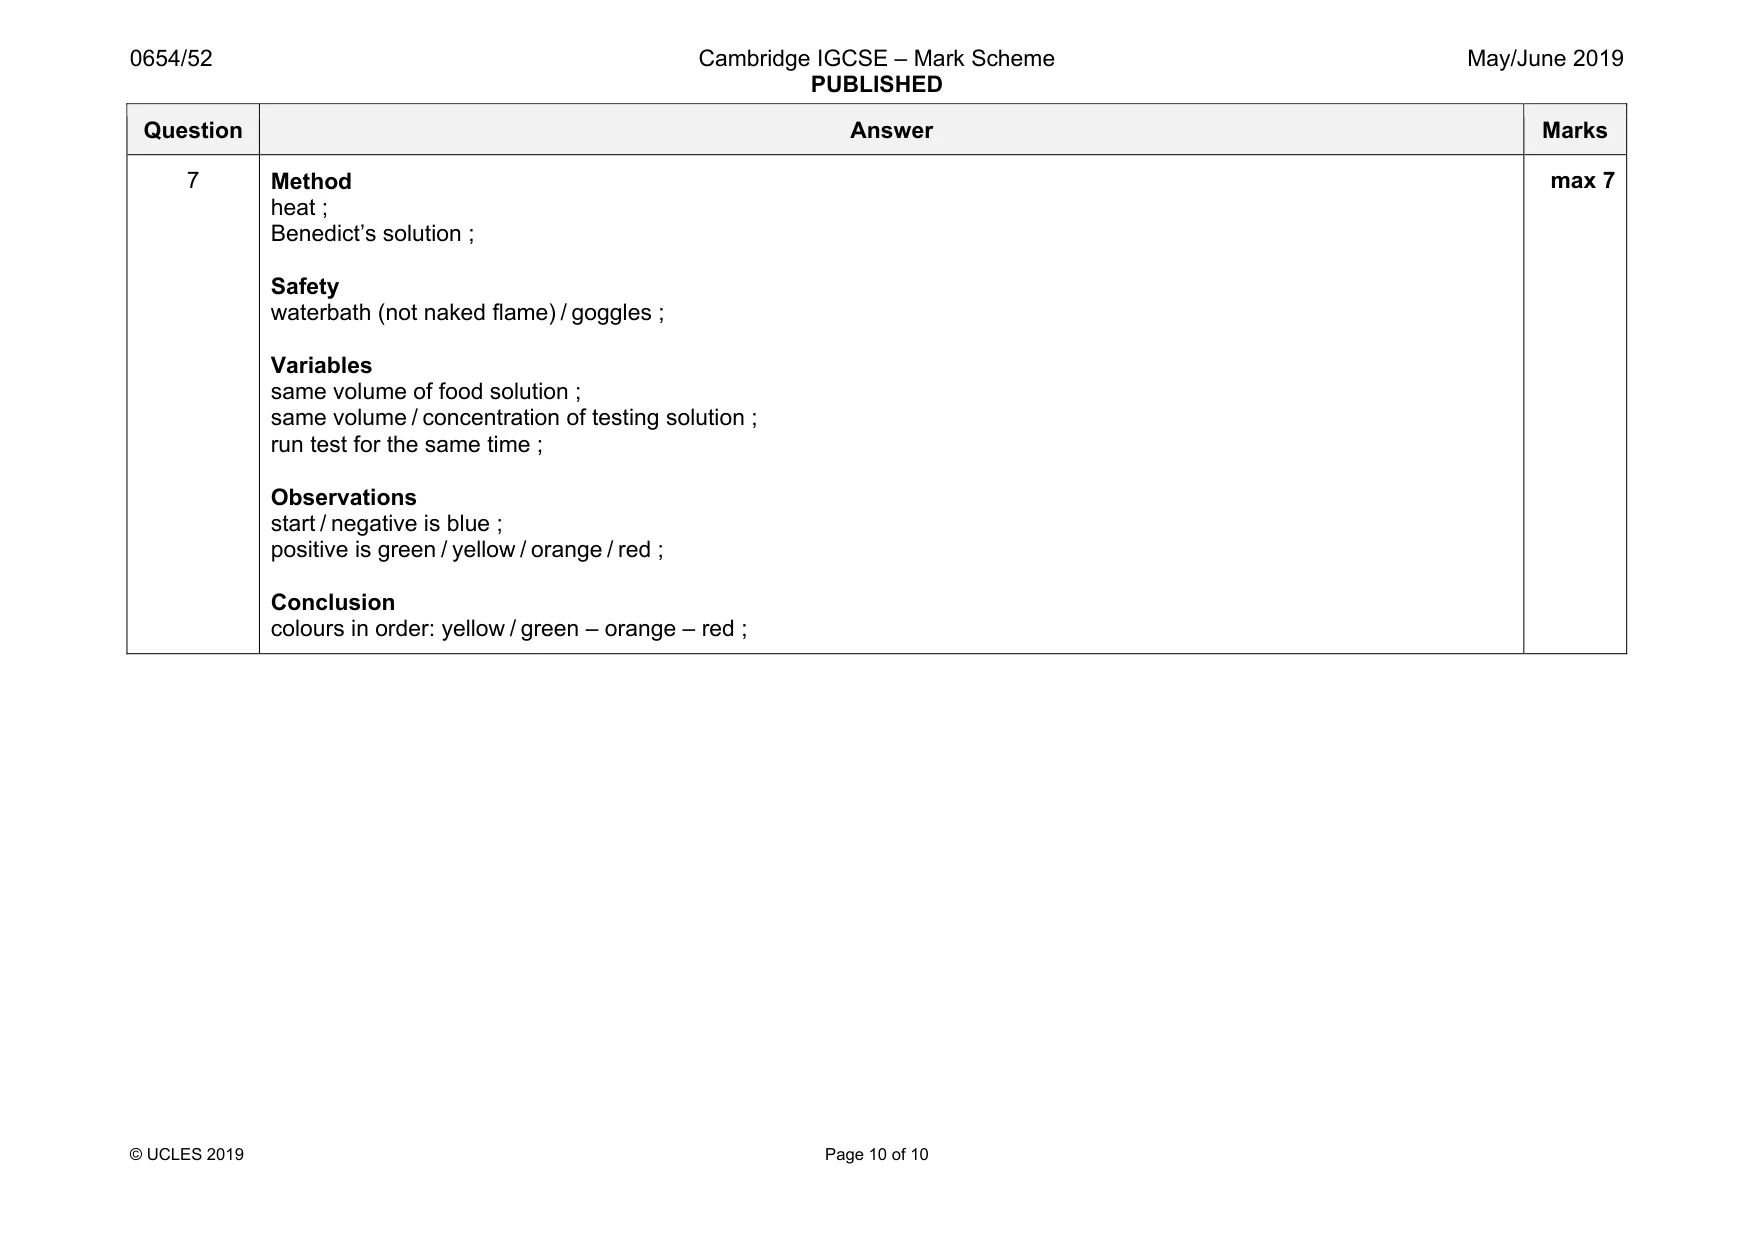
Mark scheme: 7 Method heat ; Benedict’s solution ; Safety waterbath (not naked flame) / goggles ; Variables same volume of food solution ; same volume / concentration of testing solution ; run test for the same time ; Observations start / negative is blue ; positive is green / yellow / orange / red ; Conclusion colours in order: yellow / green – orange – red ; max 7
What was in this paper
The subtopics covered by these 7 questions, and how many questions each got. Open one in a new tab to see every Cambridge question on it.
What you needed in this session
Cambridge’s own grade thresholds for 2019 May/June, Paper 5 · Variant 2. A higher threshold means an easier paper — the bar moves with how the cohort did.