Cambridge IGCSE Sciences - Co-ordinated (Double) 0654 — 2012 May/June Paper 5 · Variant 2
0654/52/M/J/12 · 45 marks · ≈51 min
The question paper and its mark scheme, free to read here and free to download. This is Cambridge’s own paper, exactly as it was sat.
Question paper12 pages

Mark scheme4 pages
Answers below. Sit the paper first if you are practising.
Paper as text
Question paper, page 1
This document consists of 11 printed pages and 1 blank page. IB12 06_0654_52/8RP © UCLES 2012 [Turn over *7655964576* For Examiner's Use 1 2 3 Total UNIVERSITY OF CAMBRIDGE INTERNATIONAL EXAMINATIONS International General Certificate of Secondary Education CO-ORDINATED SCIENCES 0654/52 Paper 5 Practical Test May/June 2012 2 hours Candidates answer on the Question Paper. Additional Materials: As listed in Instructions to Supervisors READ THESE INSTRUCTIONS FIRST Write your Centre number, candidate number and name on all the work you hand in. Write in dark blue or black pen. You may use a pencil for any diagrams, graphs or rough working. Do not use staples, paper clips, highlighters, glue or correction fluid. DO NOT WRITE IN ANY BARCODES. Answer all questions. Chemistry practical notes for this paper are printed on page 12. At the end of the examination, fasten all your work securely together. The number of marks is given in brackets [ ] at the end of each question or part question. www.XtremePapers.com
Question paper, page 2
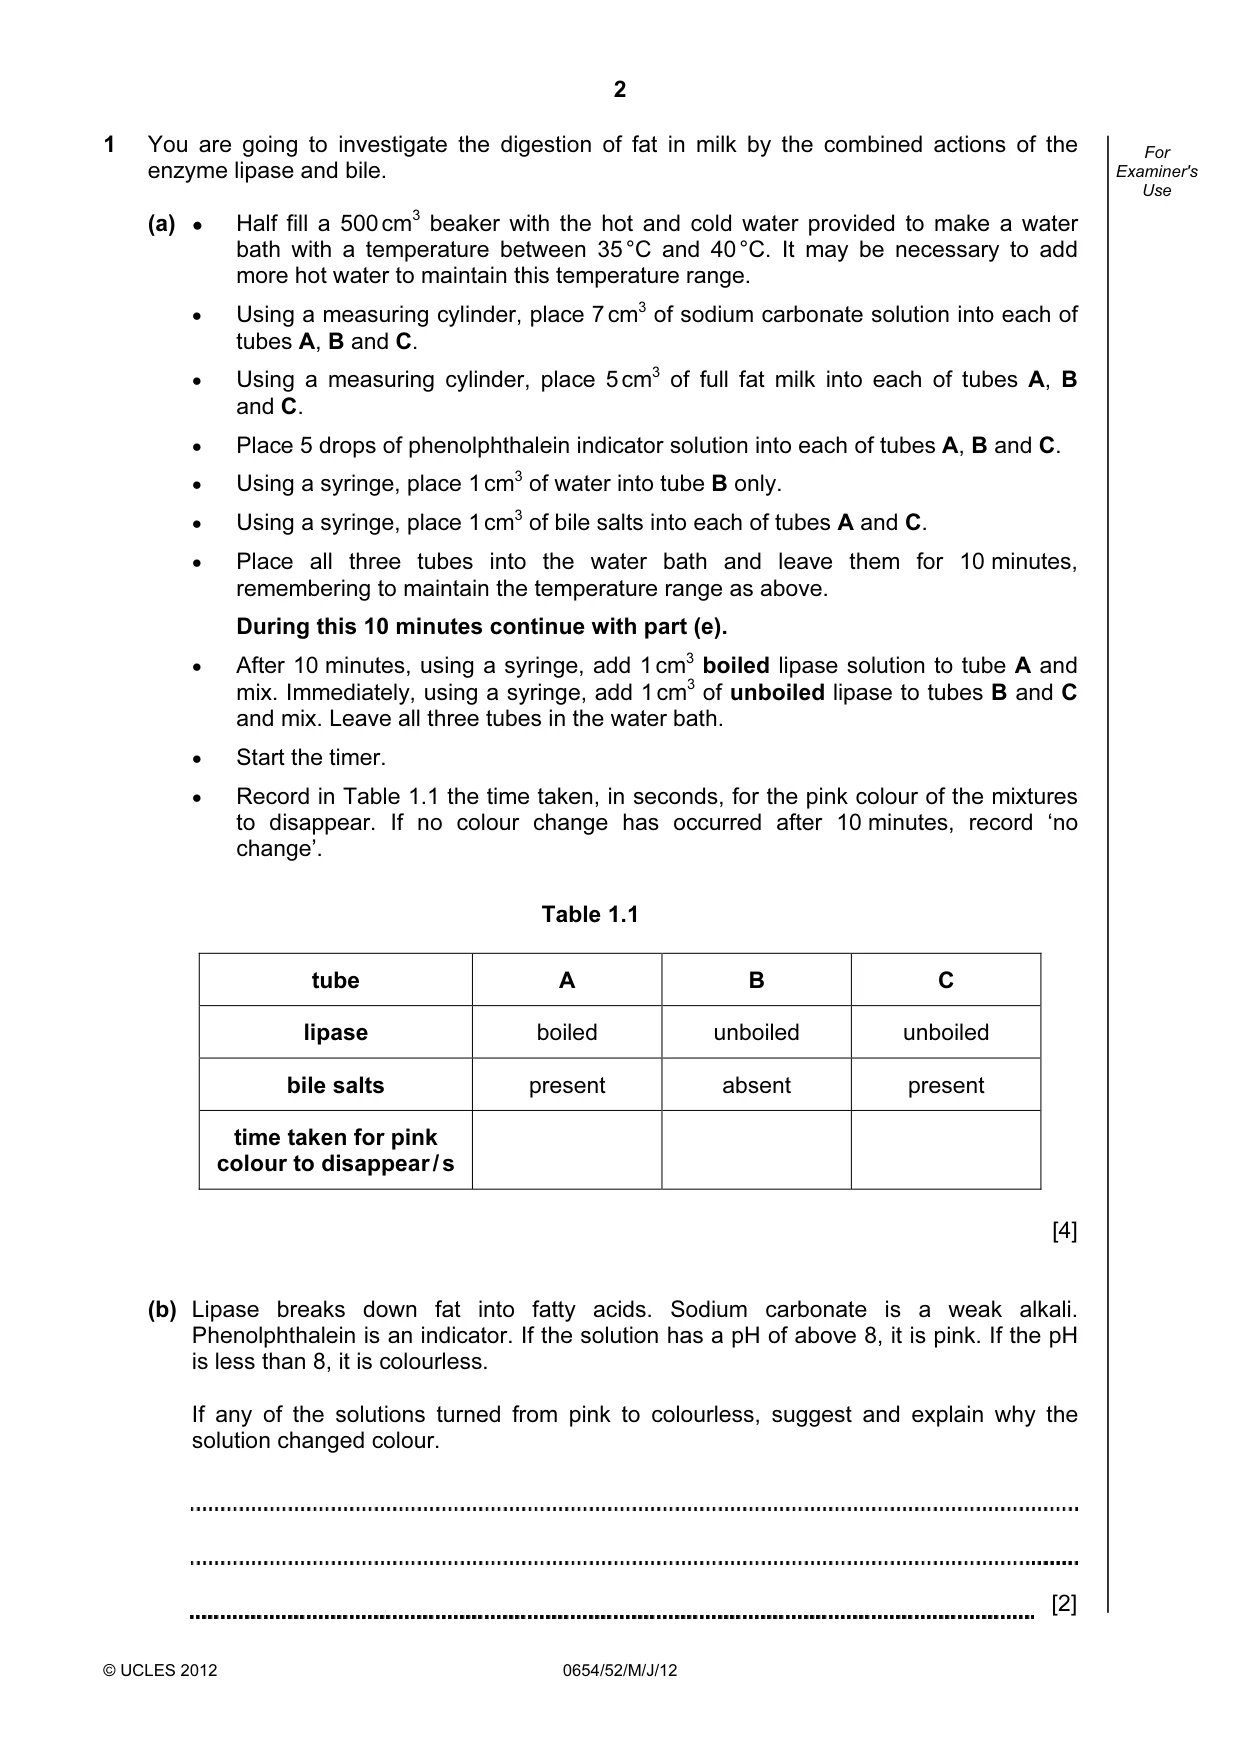
2 © UCLES 2012 0654/52/M/J/12 For Examiner's Use 1 You are going to investigate the digestion of fat in milk by the combined actions of the enzyme lipase and bile. (a) ● Half fill a 500 cm3 beaker with the hot and cold water provided to make a water bath with a temperature between 35 °C and 40 °C. It may be necessary to add more hot water to maintain this temperature range. • Using a measuring cylinder, place 7 cm3 of sodium carbonate solution into each of tubes A, B and C. • Using a measuring cylinder, place 5 cm3 of full fat milk into each of tubes A, B and C. • Place 5 drops of phenolphthalein indicator solution into each of tubes A, B and C. • Using a syringe, place 1 cm3 of water into tube B only. • Using a syringe, place 1 cm3 of bile salts into each of tubes A and C. • Place all three tubes into the water bath and leave them for 10 minutes, remembering to maintain the temperature range as above. During this 10 minutes continue with part (e). • After 10 minutes, using a syringe, add 1 cm3 boiled lipase solution to tube A and mix. Immediately, using a syringe, add 1 cm3 of unboiled lipase to tubes B and C and mix. Leave all three tubes in the water bath. • Start the timer. • Record in Table 1.1 the time taken, in seconds, for the pink colour of the mixtures to disappear. If no colour change has occurred after 10 minutes, record ‘no change’. Table 1.1 tube A B C lipase boiled unboiled unboiled bile salts present absent present time taken for pink colour to disappear / s [4] (b) Lipase breaks down fat into fatty acids. Sodium carbonate is a weak alkali. Phenolphthalein is an indicator. If the solution has a pH of above 8, it is pink. If the pH is less than 8, it is colourless. If any of the solutions turned from pink to colourless, suggest and explain why the solution changed colour. [2]
Question paper, page 3
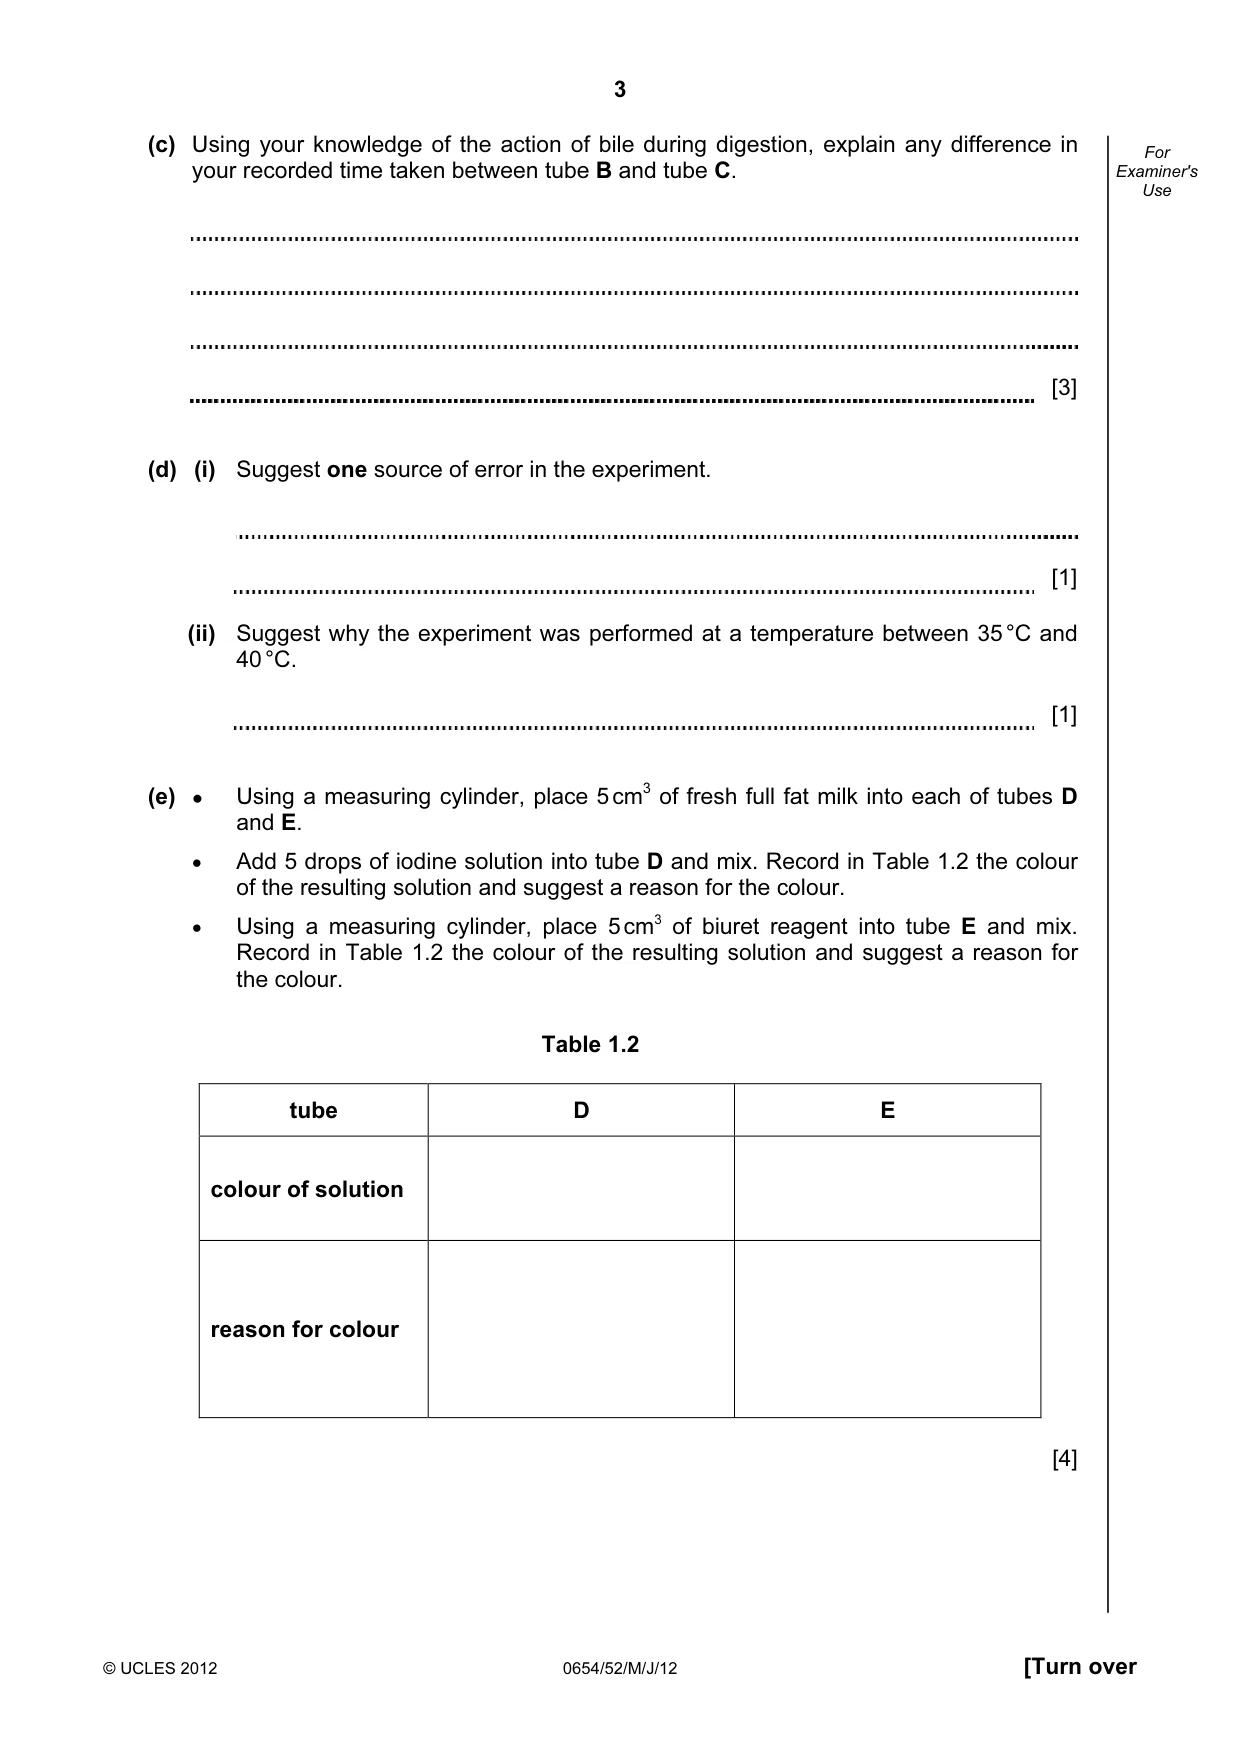
3 © UCLES 2012 0654/52/M/J/12 [Turn over For Examiner's Use (c) Using your knowledge of the action of bile during digestion, explain any difference in your recorded time taken between tube B and tube C. [3] (d) (i) Suggest one source of error in the experiment. [1] (ii) Suggest why the experiment was performed at a temperature between 35 °C and 40 °C. [1] (e) ● Using a measuring cylinder, place 5 cm3 of fresh full fat milk into each of tubes D and E. • Add 5 drops of iodine solution into tube D and mix. Record in Table 1.2 the colour of the resulting solution and suggest a reason for the colour. • Using a measuring cylinder, place 5 cm3 of biuret reagent into tube E and mix. Record in Table 1.2 the colour of the resulting solution and suggest a reason for the colour. Table 1.2 tube D E colour of solution reason for colour [4]
Question paper, page 4
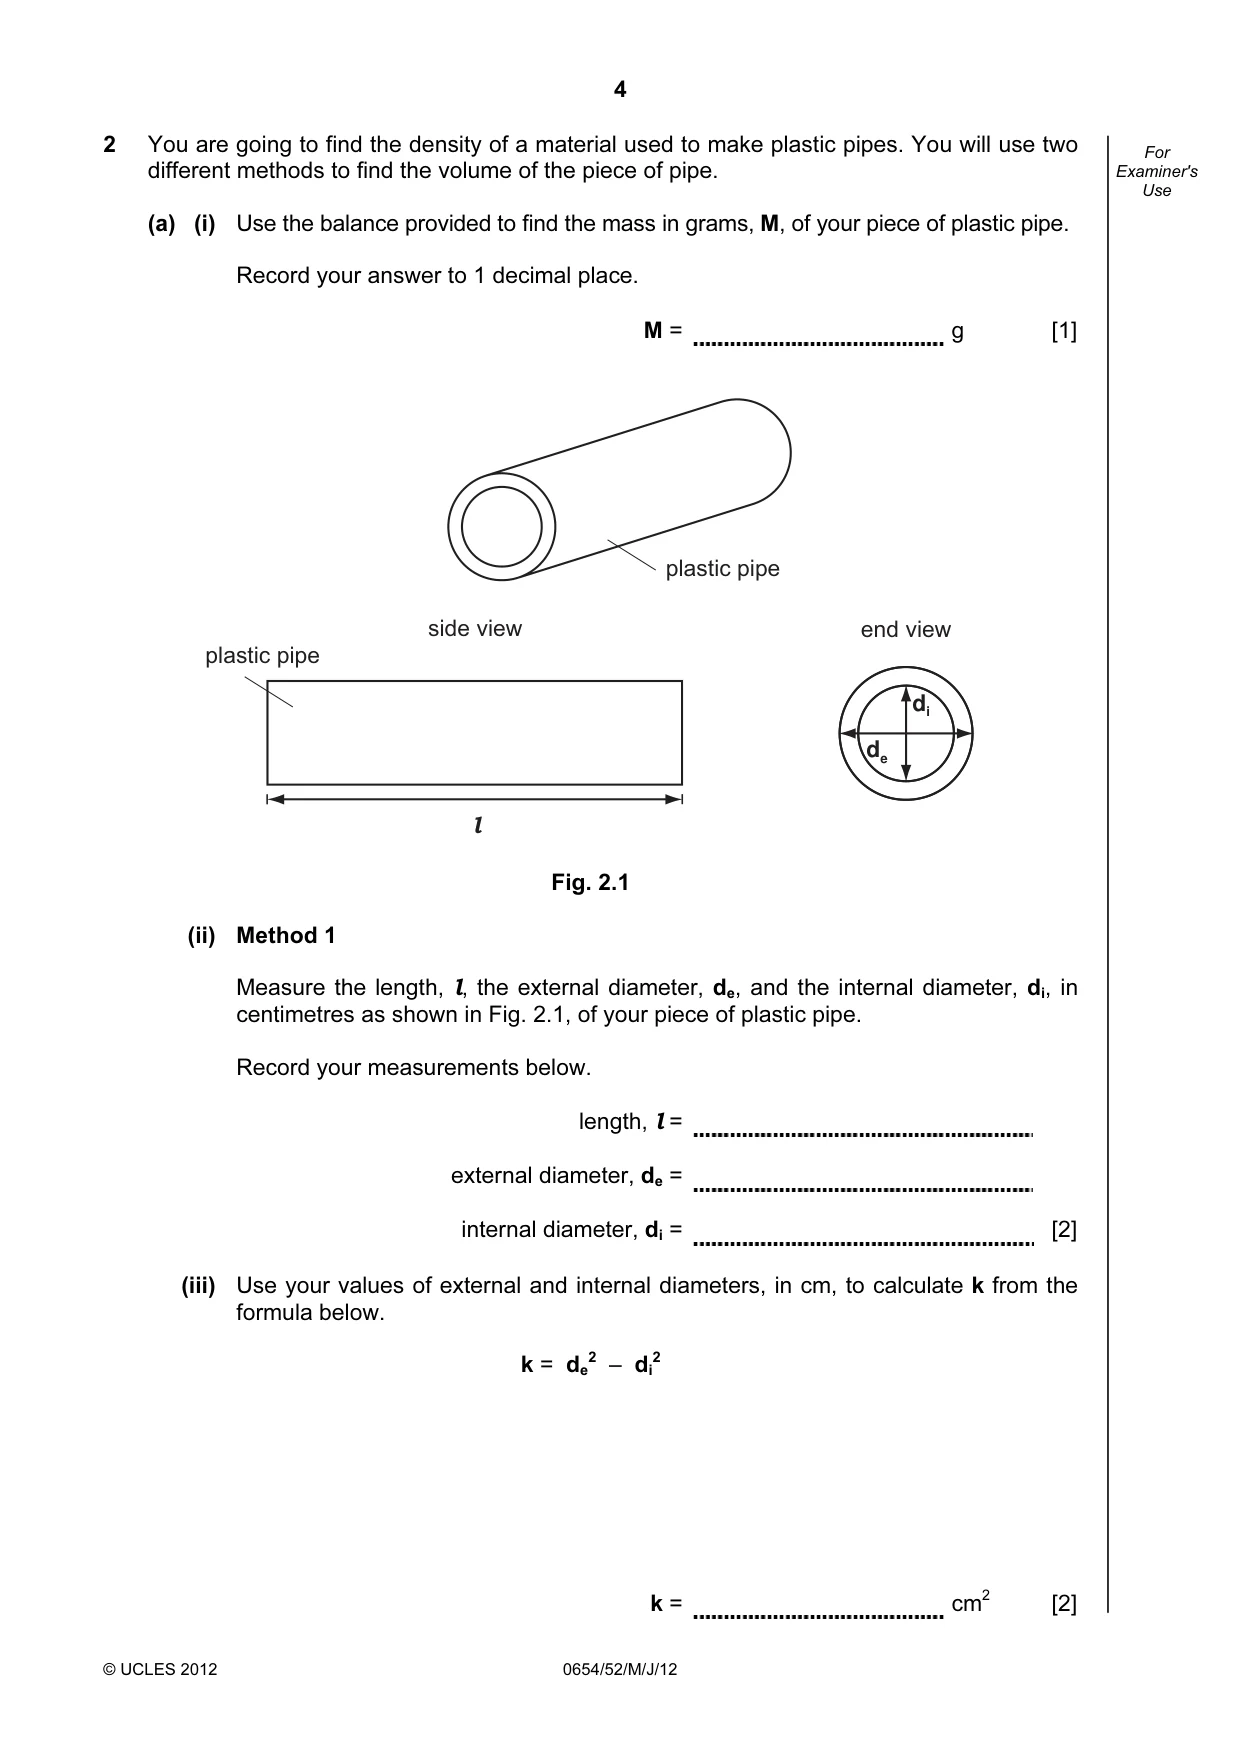
4 © UCLES 2012 0654/52/M/J/12 For Examiner's Use 2 You are going to find the density of a material used to make plastic pipes. You will use two different methods to find the volume of the piece of pipe. (a) (i) Use the balance provided to find the mass in grams, M, of your piece of plastic pipe. Record your answer to 1 decimal place. M = g [1] l side view de di end view plastic pipe plastic pipe Fig. 2.1 (ii) Method 1 Measure the length, l, the external diameter, de, and the internal diameter, di, in centimetres as shown in Fig. 2.1, of your piece of plastic pipe. Record your measurements below. length, l = external diameter, de = internal diameter, di = [2] (iii) Use your values of external and internal diameters, in cm, to calculate k from the formula below. k = de 2 – di 2 k = cm2 [2]
Question paper, page 5
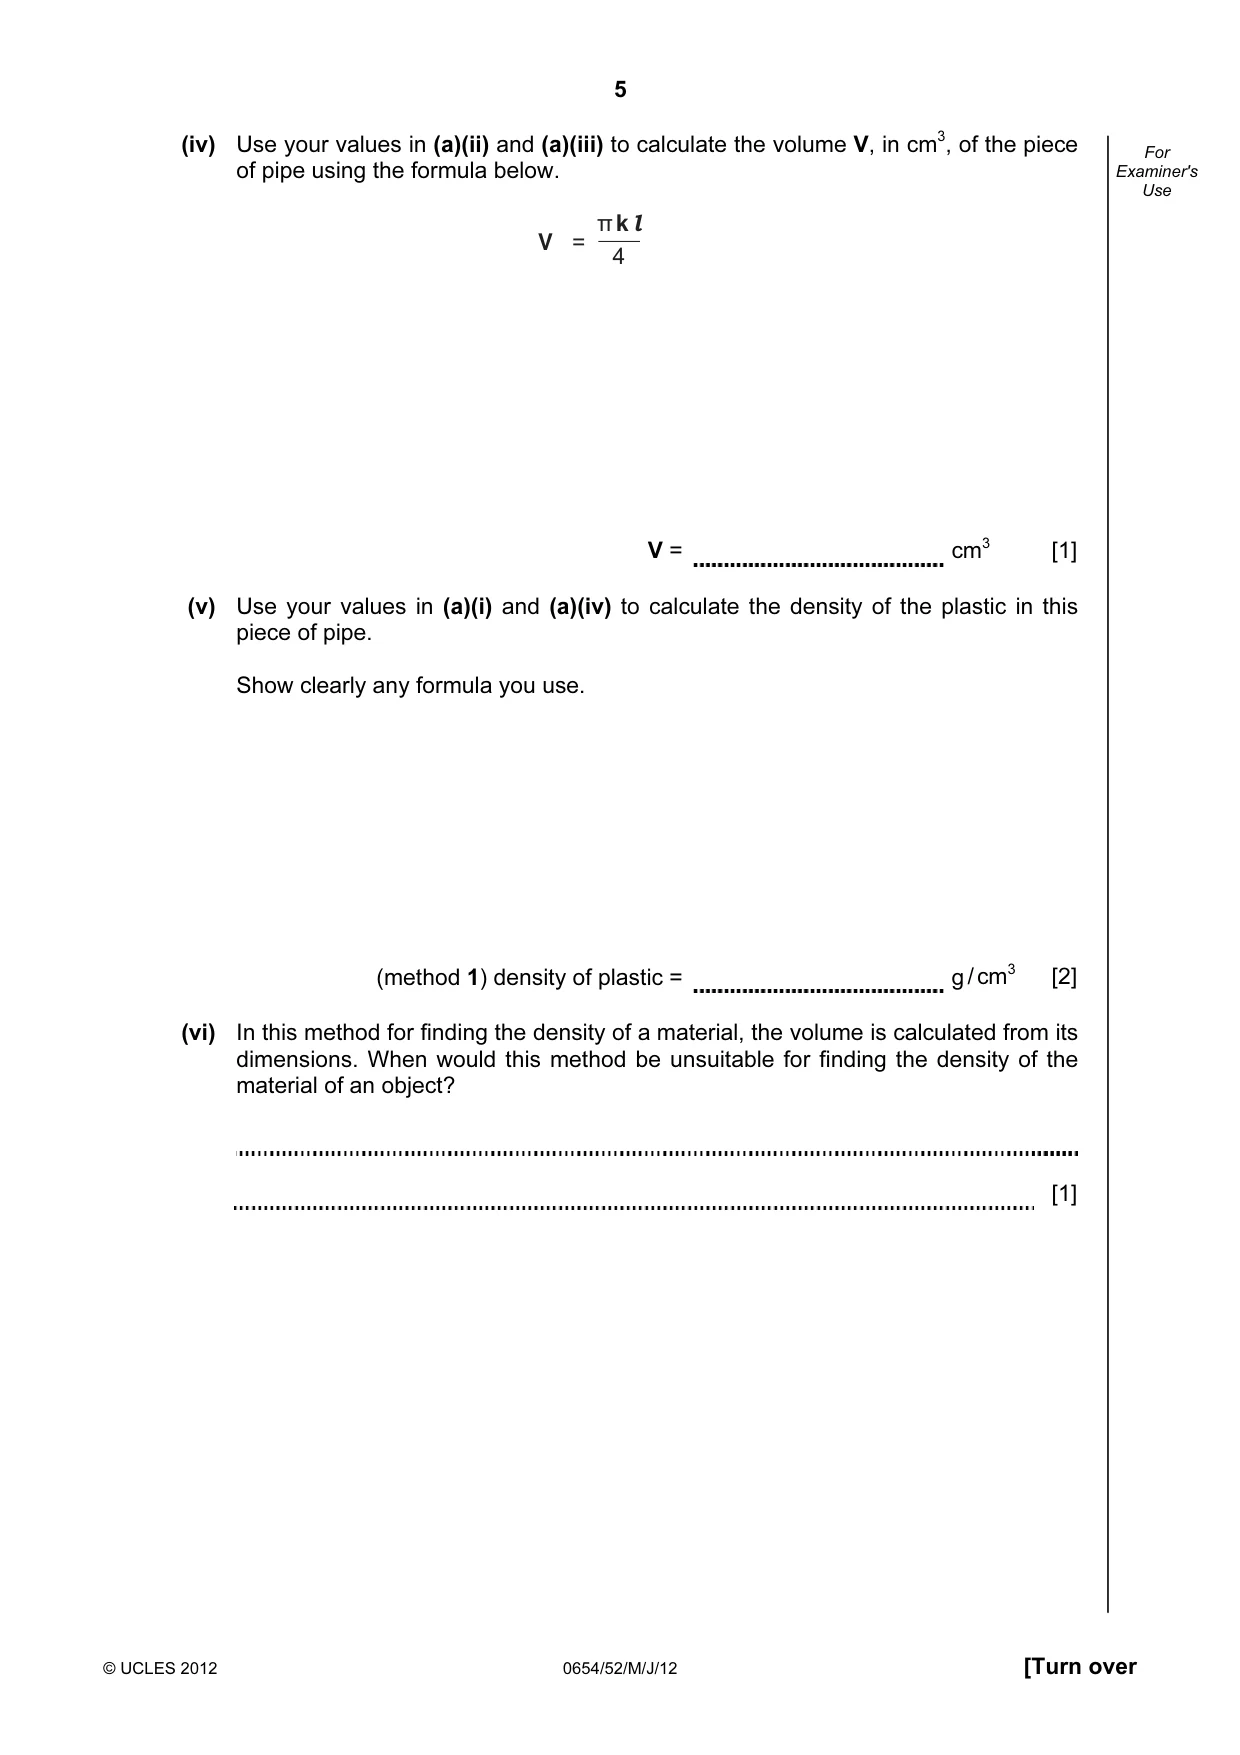
5 © UCLES 2012 0654/52/M/J/12 [Turn over For Examiner's Use (iv) Use your values in (a)(ii) and (a)(iii) to calculate the volume V, in cm3, of the piece of pipe using the formula below. π k l 4 V = V = cm3 [1] (v) Use your values in (a)(i) and (a)(iv) to calculate the density of the plastic in this piece of pipe. Show clearly any formula you use. (method 1) density of plastic = g / cm3 [2] (vi) In this method for finding the density of a material, the volume is calculated from its dimensions. When would this method be unsuitable for finding the density of the material of an object? [1]
Question paper, page 6
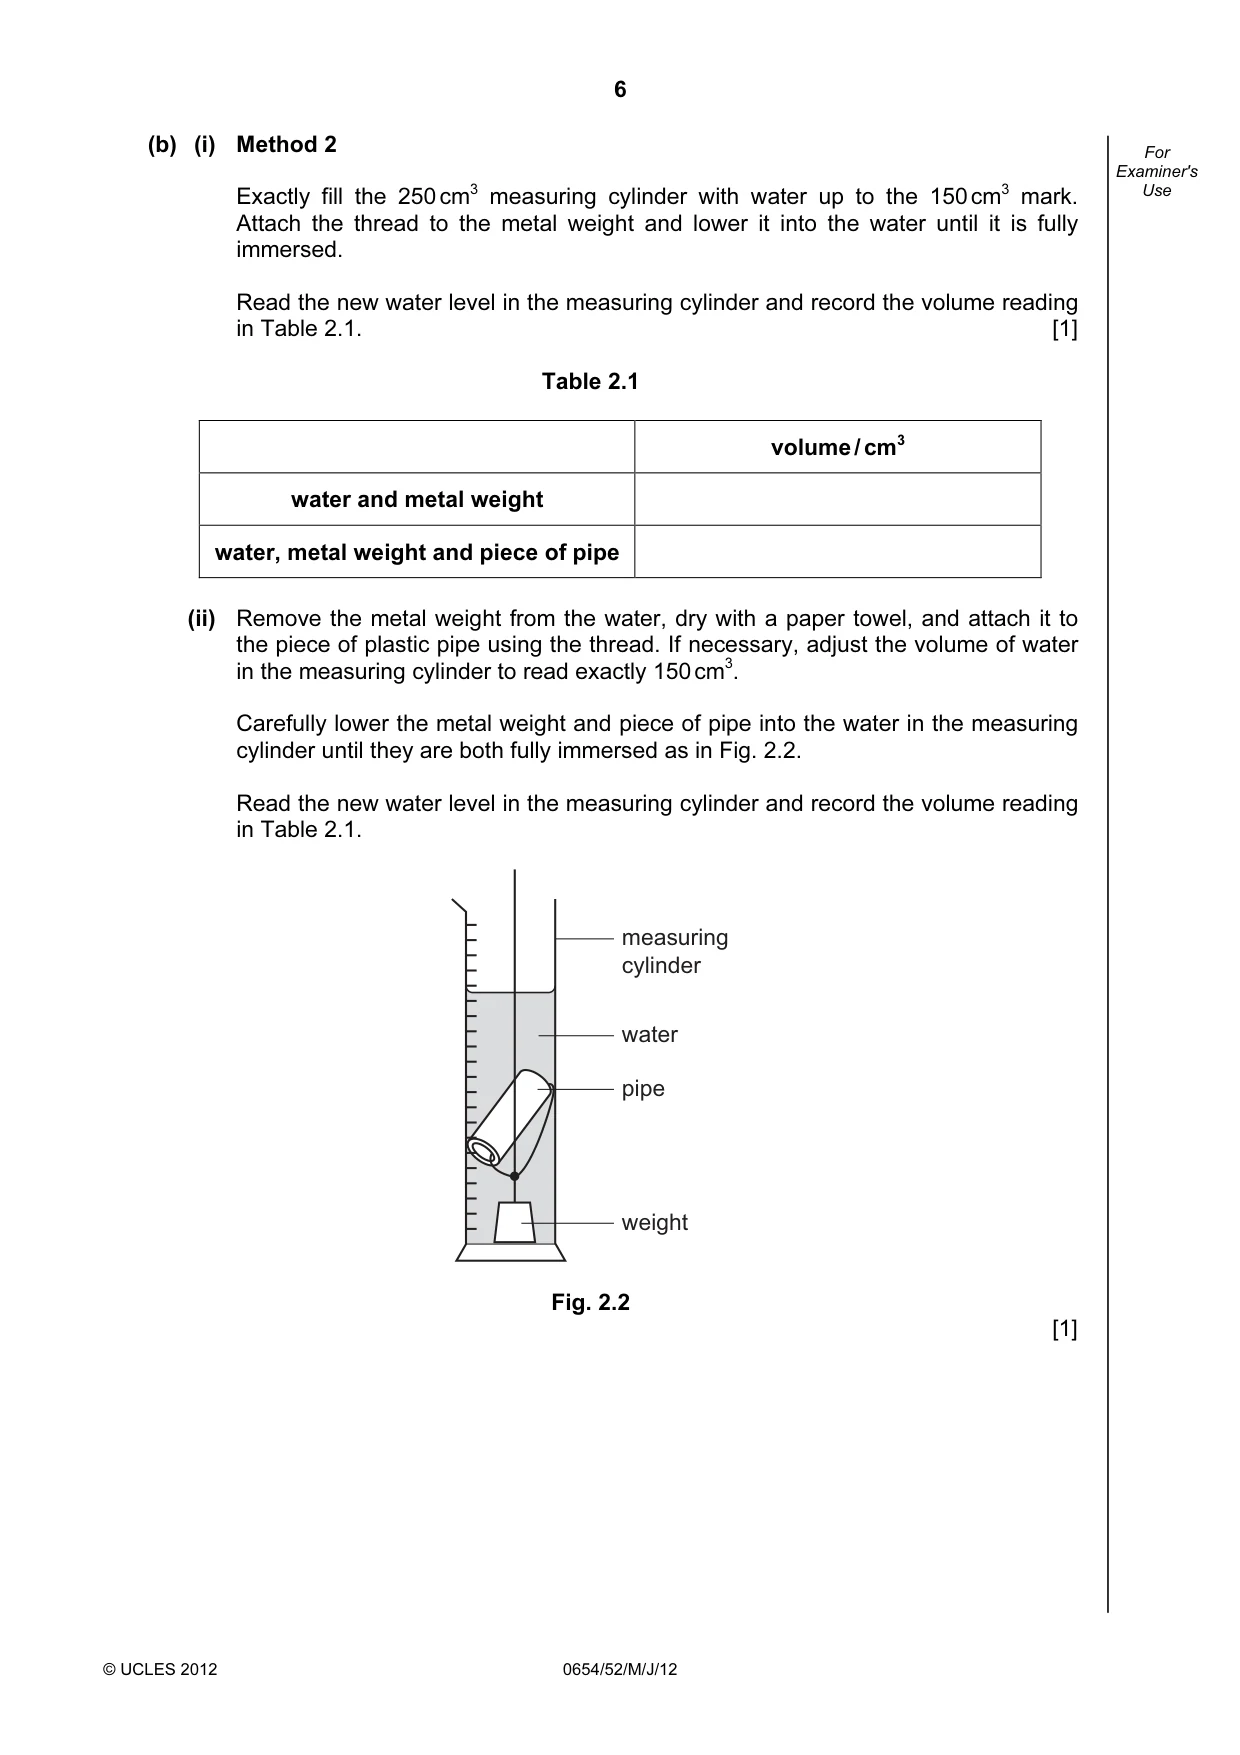
6 © UCLES 2012 0654/52/M/J/12 For Examiner's Use (b) (i) Method 2 Exactly fill the 250 cm3 measuring cylinder with water up to the 150 cm3 mark. Attach the thread to the metal weight and lower it into the water until it is fully immersed. Read the new water level in the measuring cylinder and record the volume reading in Table 2.1. [1] Table 2.1 volume / cm3 water and metal weight water, metal weight and piece of pipe (ii) Remove the metal weight from the water, dry with a paper towel, and attach it to the piece of plastic pipe using the thread. If necessary, adjust the volume of water in the measuring cylinder to read exactly 150 cm3. Carefully lower the metal weight and piece of pipe into the water in the measuring cylinder until they are both fully immersed as in Fig. 2.2. Read the new water level in the measuring cylinder and record the volume reading in Table 2.1. measuring cylinder water pipe weight Fig. 2.2 [1]
Question paper, page 7
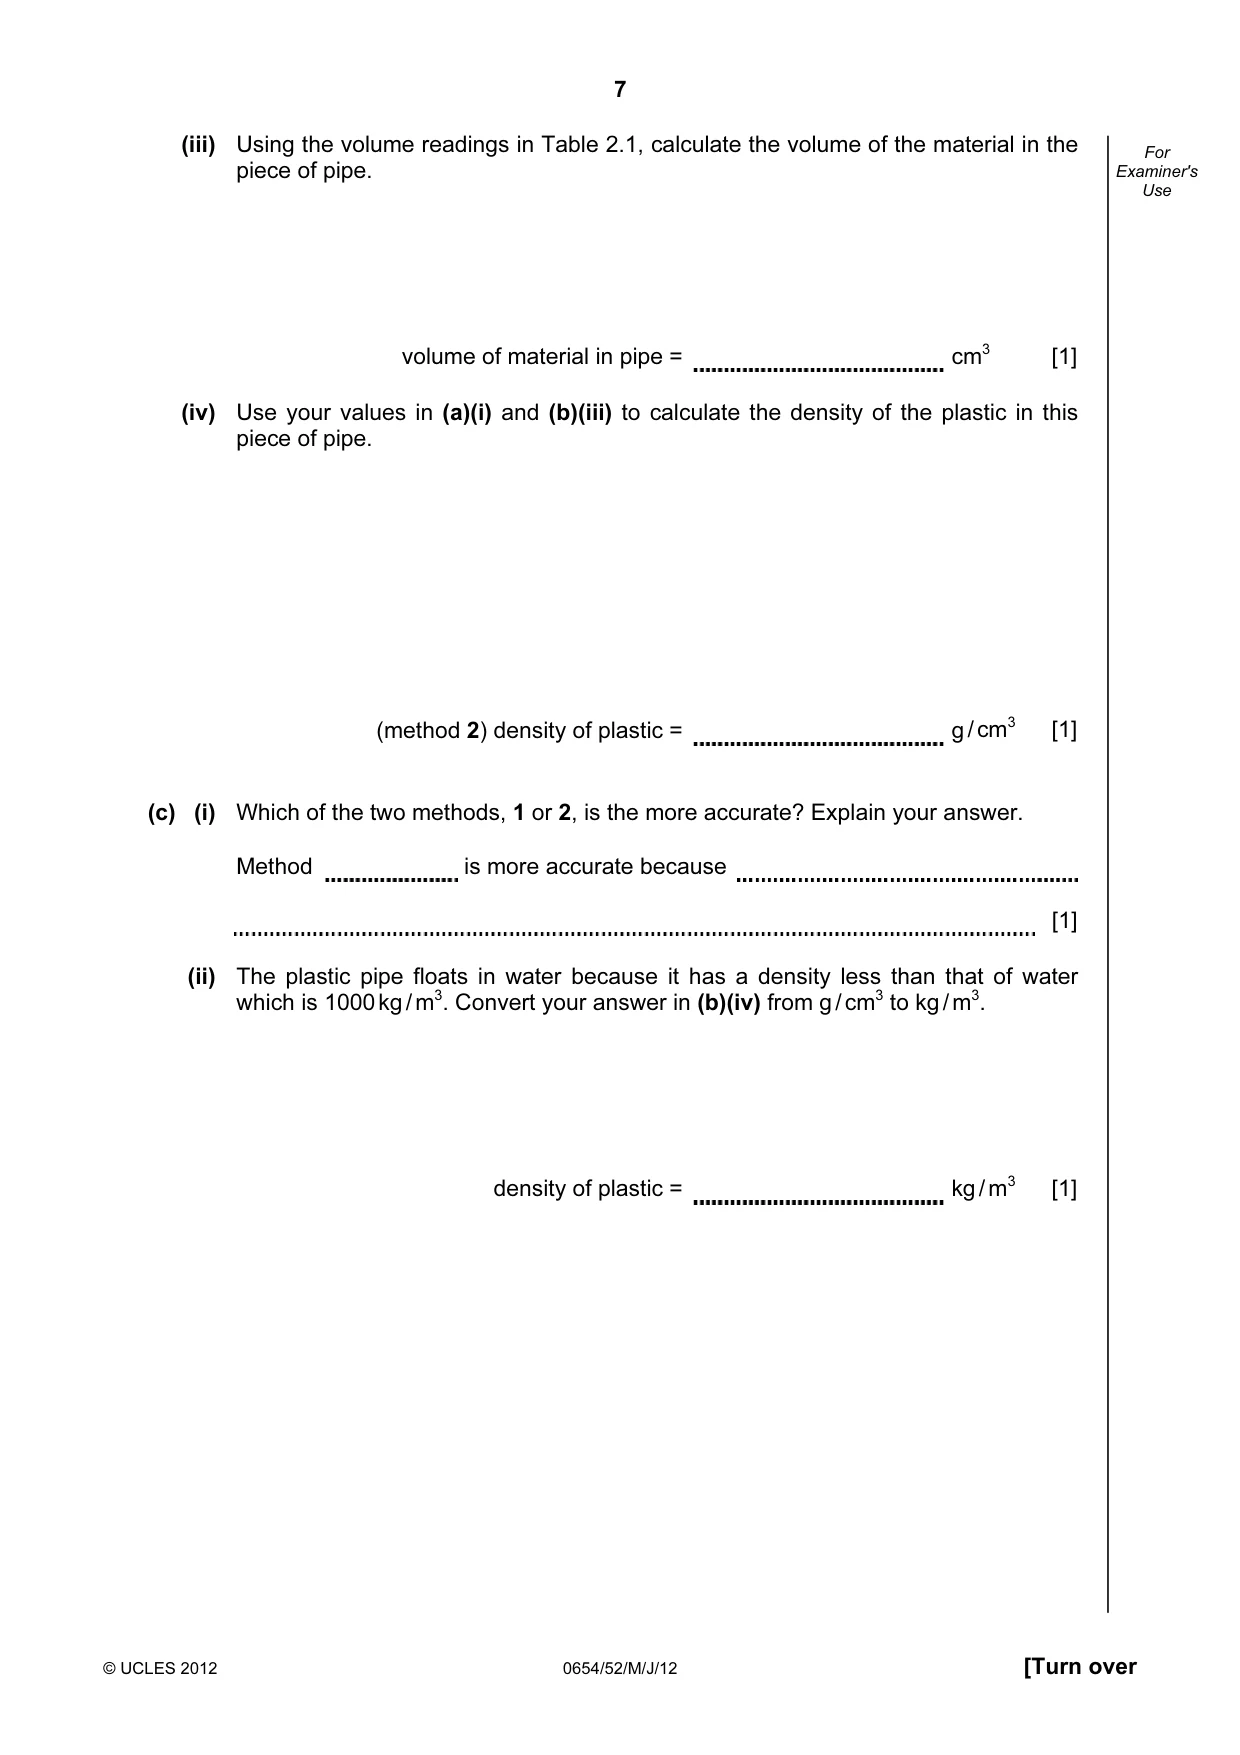
7 © UCLES 2012 0654/52/M/J/12 [Turn over For Examiner's Use (iii) Using the volume readings in Table 2.1, calculate the volume of the material in the piece of pipe. volume of material in pipe = cm3 [1] (iv) Use your values in (a)(i) and (b)(iii) to calculate the density of the plastic in this piece of pipe. (method 2) density of plastic = g / cm3 [1] (c) (i) Which of the two methods, 1 or 2, is the more accurate? Explain your answer. Method is more accurate because [1] (ii) The plastic pipe floats in water because it has a density less than that of water which is 1000 kg / m3. Convert your answer in (b)(iv) from g / cm3 to kg / m3. density of plastic = kg / m3 [1]
Question paper, page 8
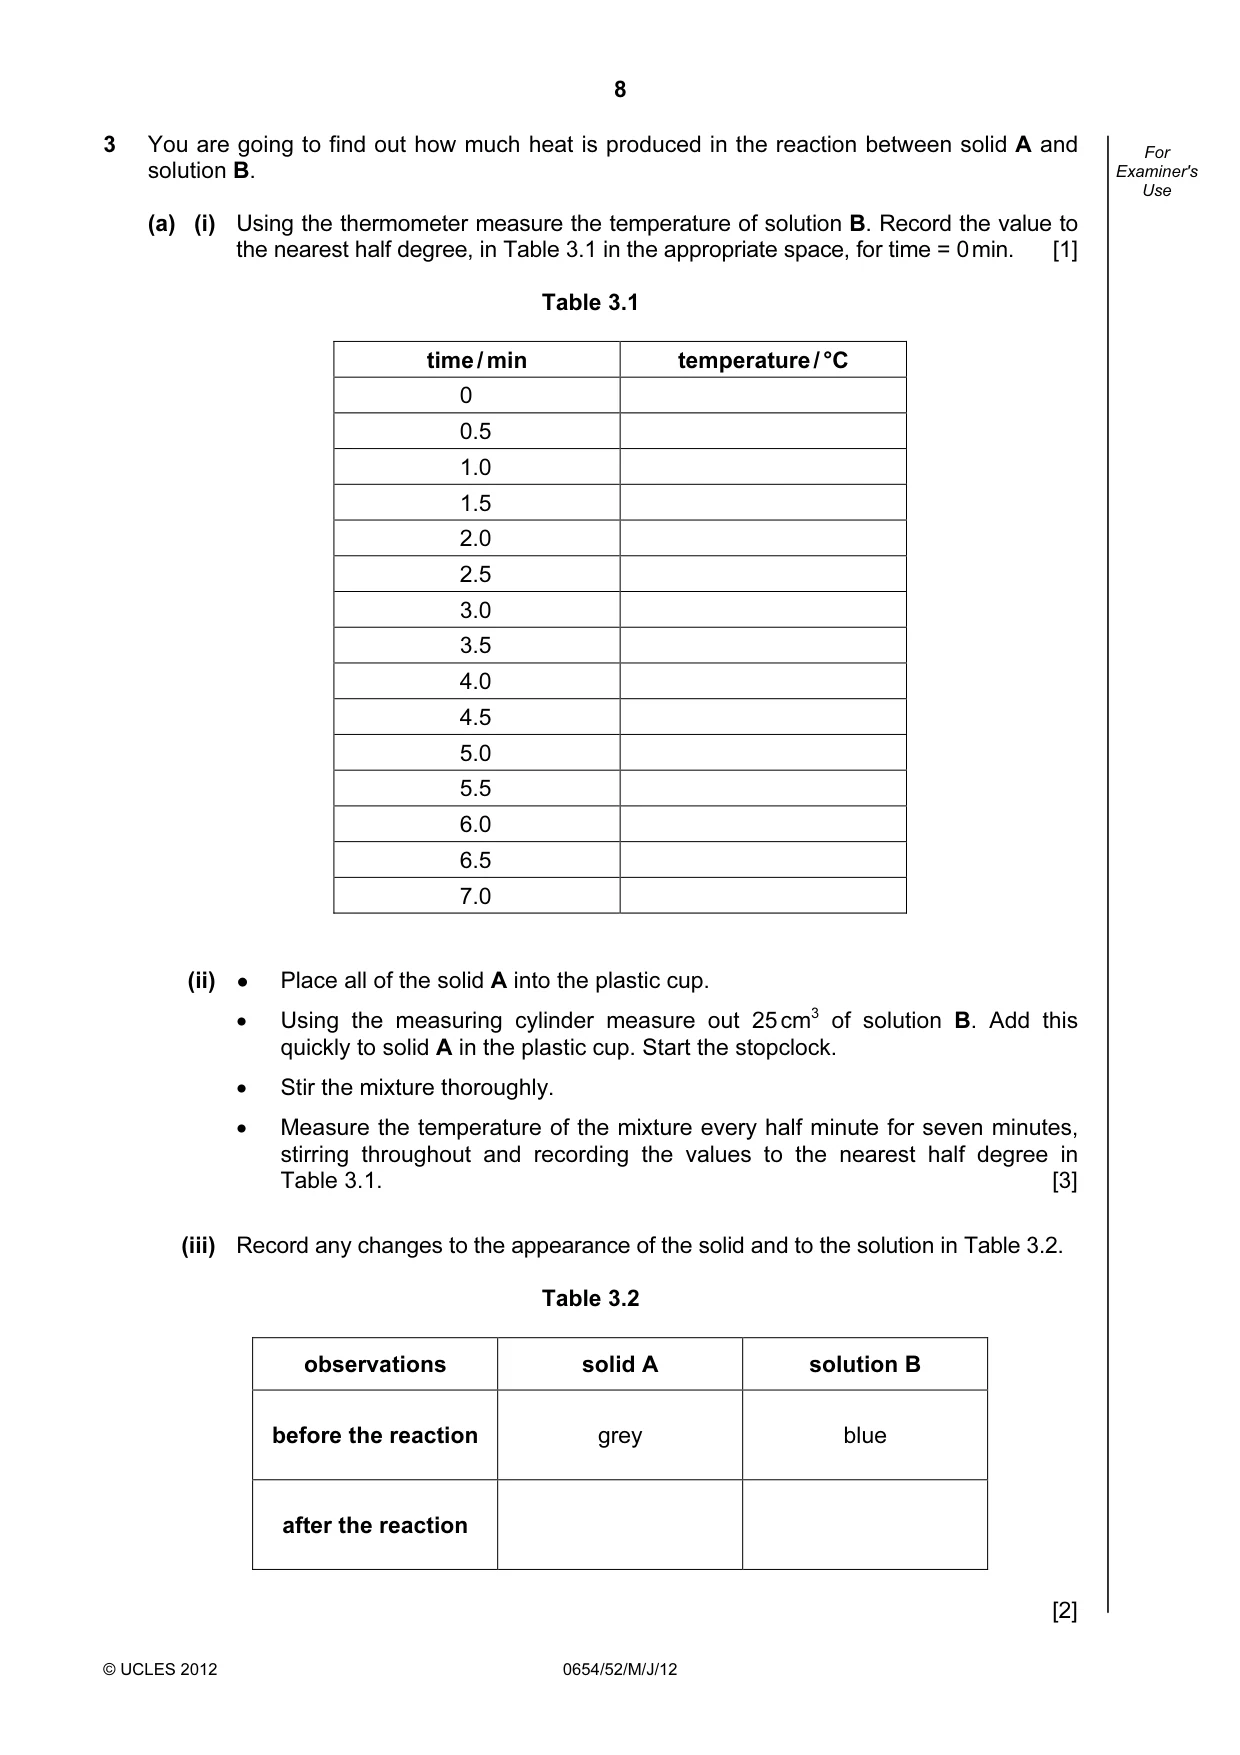
8 © UCLES 2012 0654/52/M/J/12 For Examiner's Use 3 You are going to find out how much heat is produced in the reaction between solid A and solution B. (a) (i) Using the thermometer measure the temperature of solution B. Record the value to the nearest half degree, in Table 3.1 in the appropriate space, for time = 0 min. [1] Table 3.1 time / min temperature / °C 0 0.5 1.0 1.5 2.0 2.5 3.0 3.5 4.0 4.5 5.0 5.5 6.0 6.5 7.0 (ii) ● Place all of the solid A into the plastic cup. • Using the measuring cylinder measure out 25 cm3 of solution B. Add this quickly to solid A in the plastic cup. Start the stopclock. • Stir the mixture thoroughly. • Measure the temperature of the mixture every half minute for seven minutes, stirring throughout and recording the values to the nearest half degree in Table 3.1. [3] (iii) Record any changes to the appearance of the solid and to the solution in Table 3.2. Table 3.2 observations solid A solution B before the reaction grey blue after the reaction [2]
Question paper, page 9
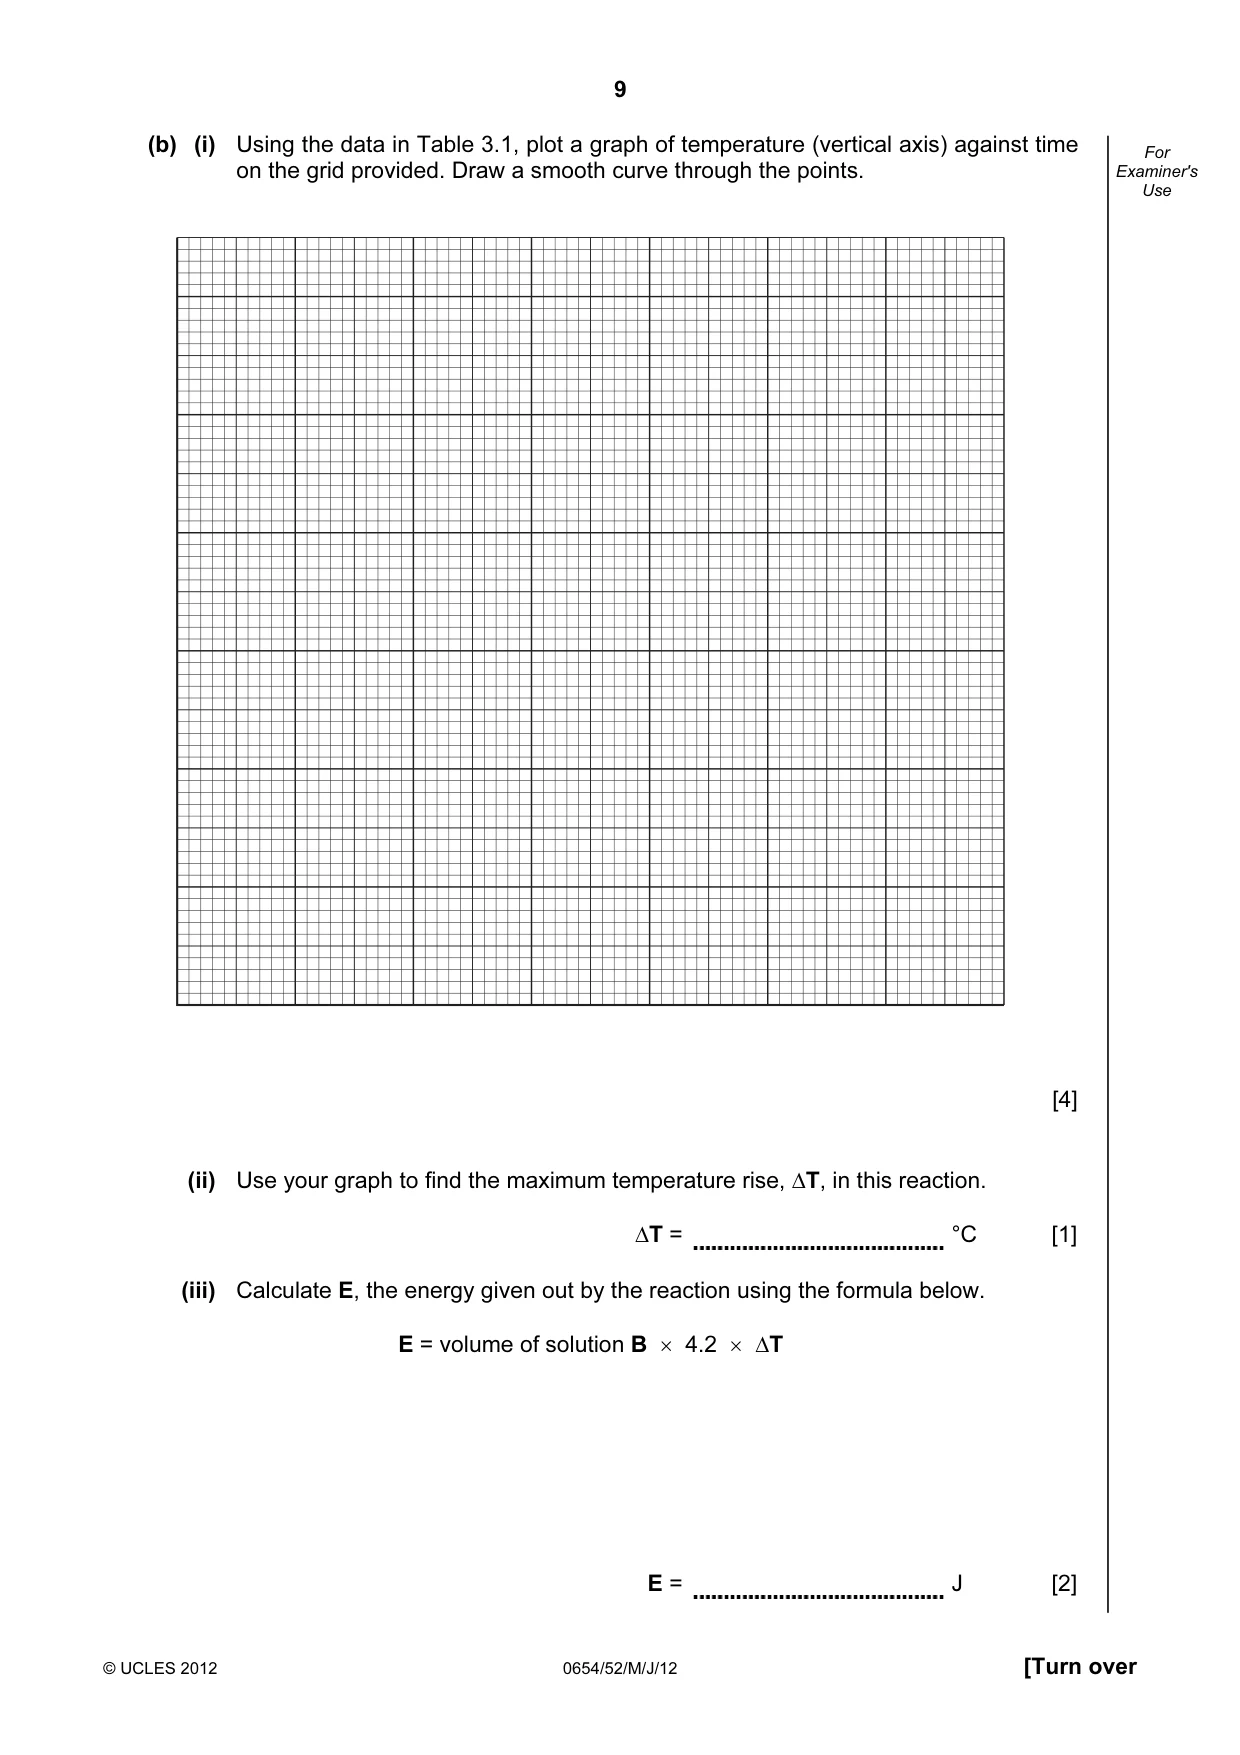
9 © UCLES 2012 0654/52/M/J/12 [Turn over For Examiner's Use (b) (i) Using the data in Table 3.1, plot a graph of temperature (vertical axis) against time on the grid provided. Draw a smooth curve through the points. [4] (ii) Use your graph to find the maximum temperature rise, ∆T, in this reaction. ∆T = °C [1] (iii) Calculate E, the energy given out by the reaction using the formula below. E = volume of solution B × 4.2 × ∆T E = J [2]
Question paper, page 10
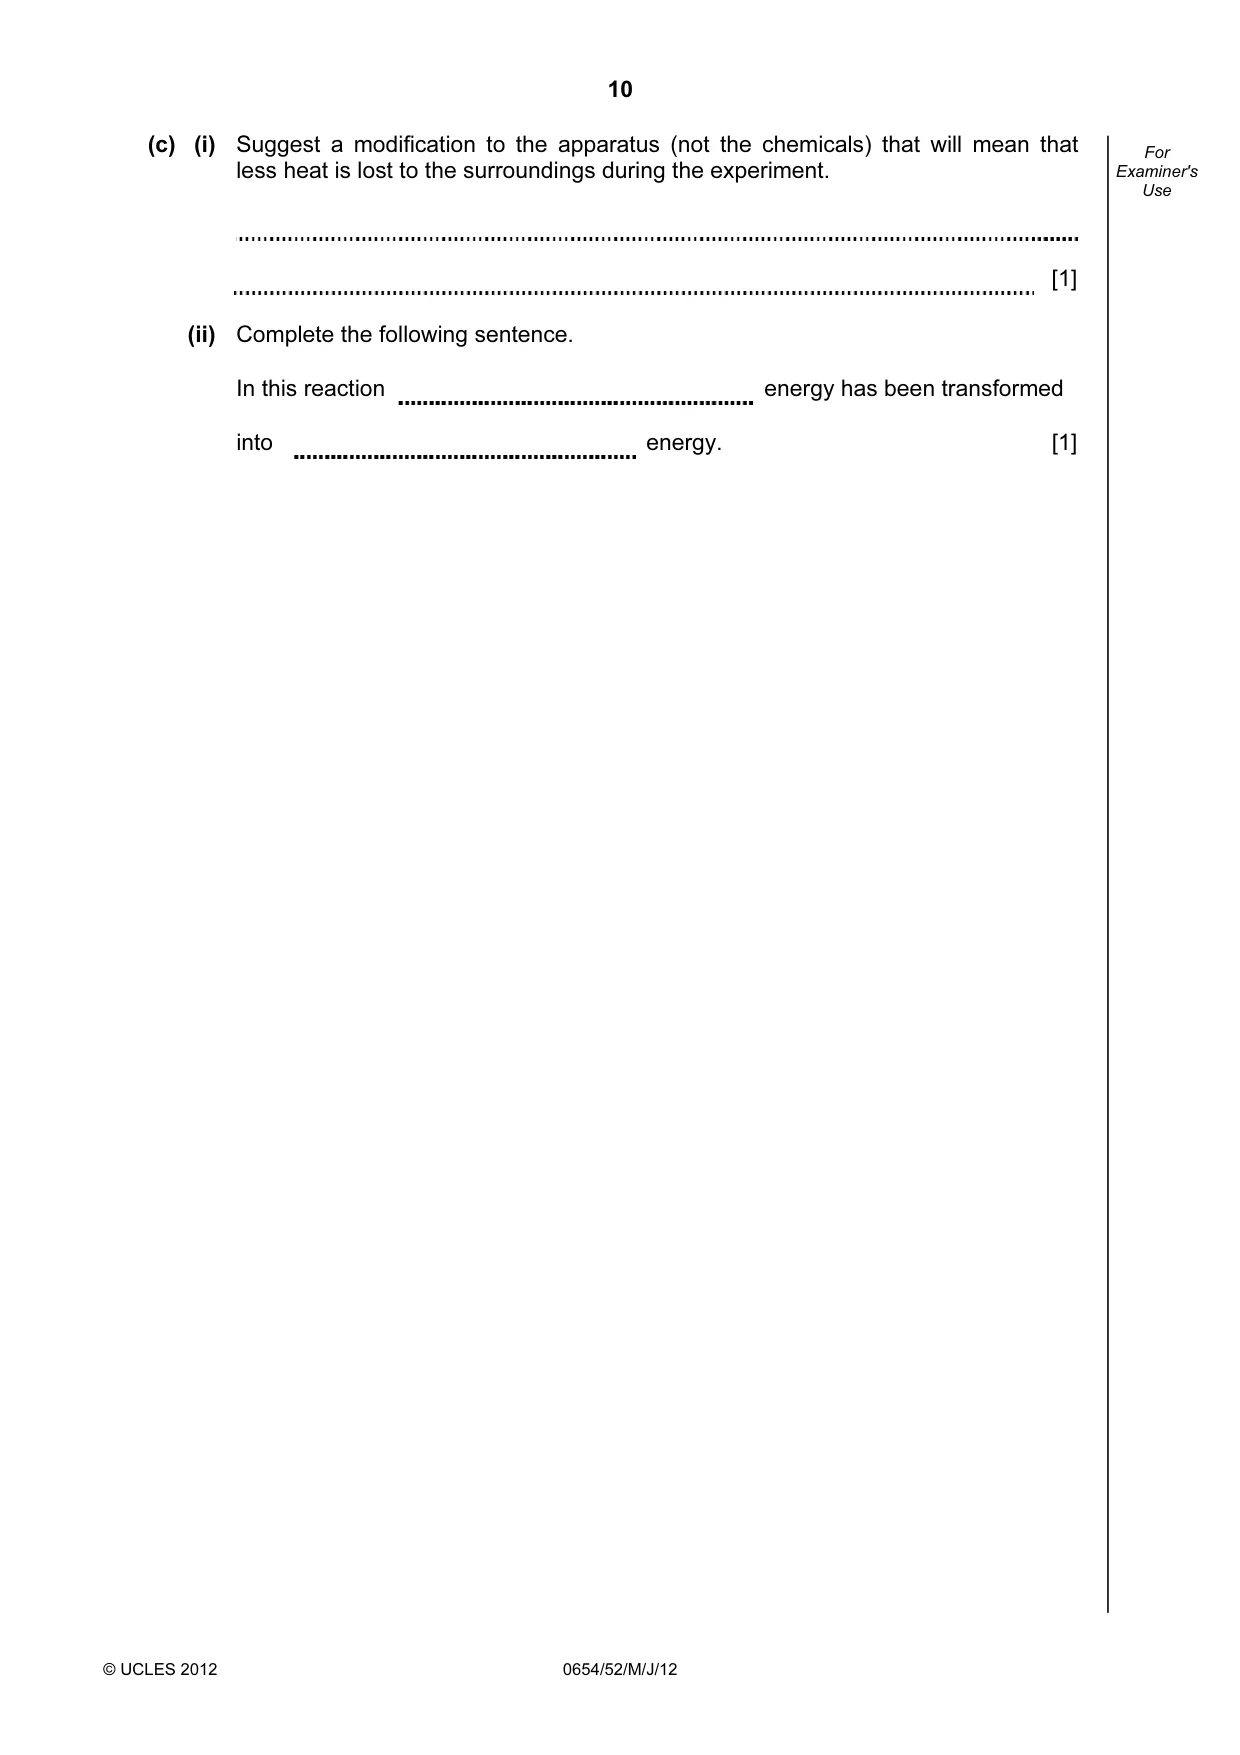
10 © UCLES 2012 0654/52/M/J/12 For Examiner's Use (c) (i) Suggest a modification to the apparatus (not the chemicals) that will mean that less heat is lost to the surroundings during the experiment. [1] (ii) Complete the following sentence. In this reaction energy has been transformed into energy. [1]
Question paper, page 11
11 © UCLES 2012 0654/52/M/J/12 BLANK PAGE
Question paper, page 12
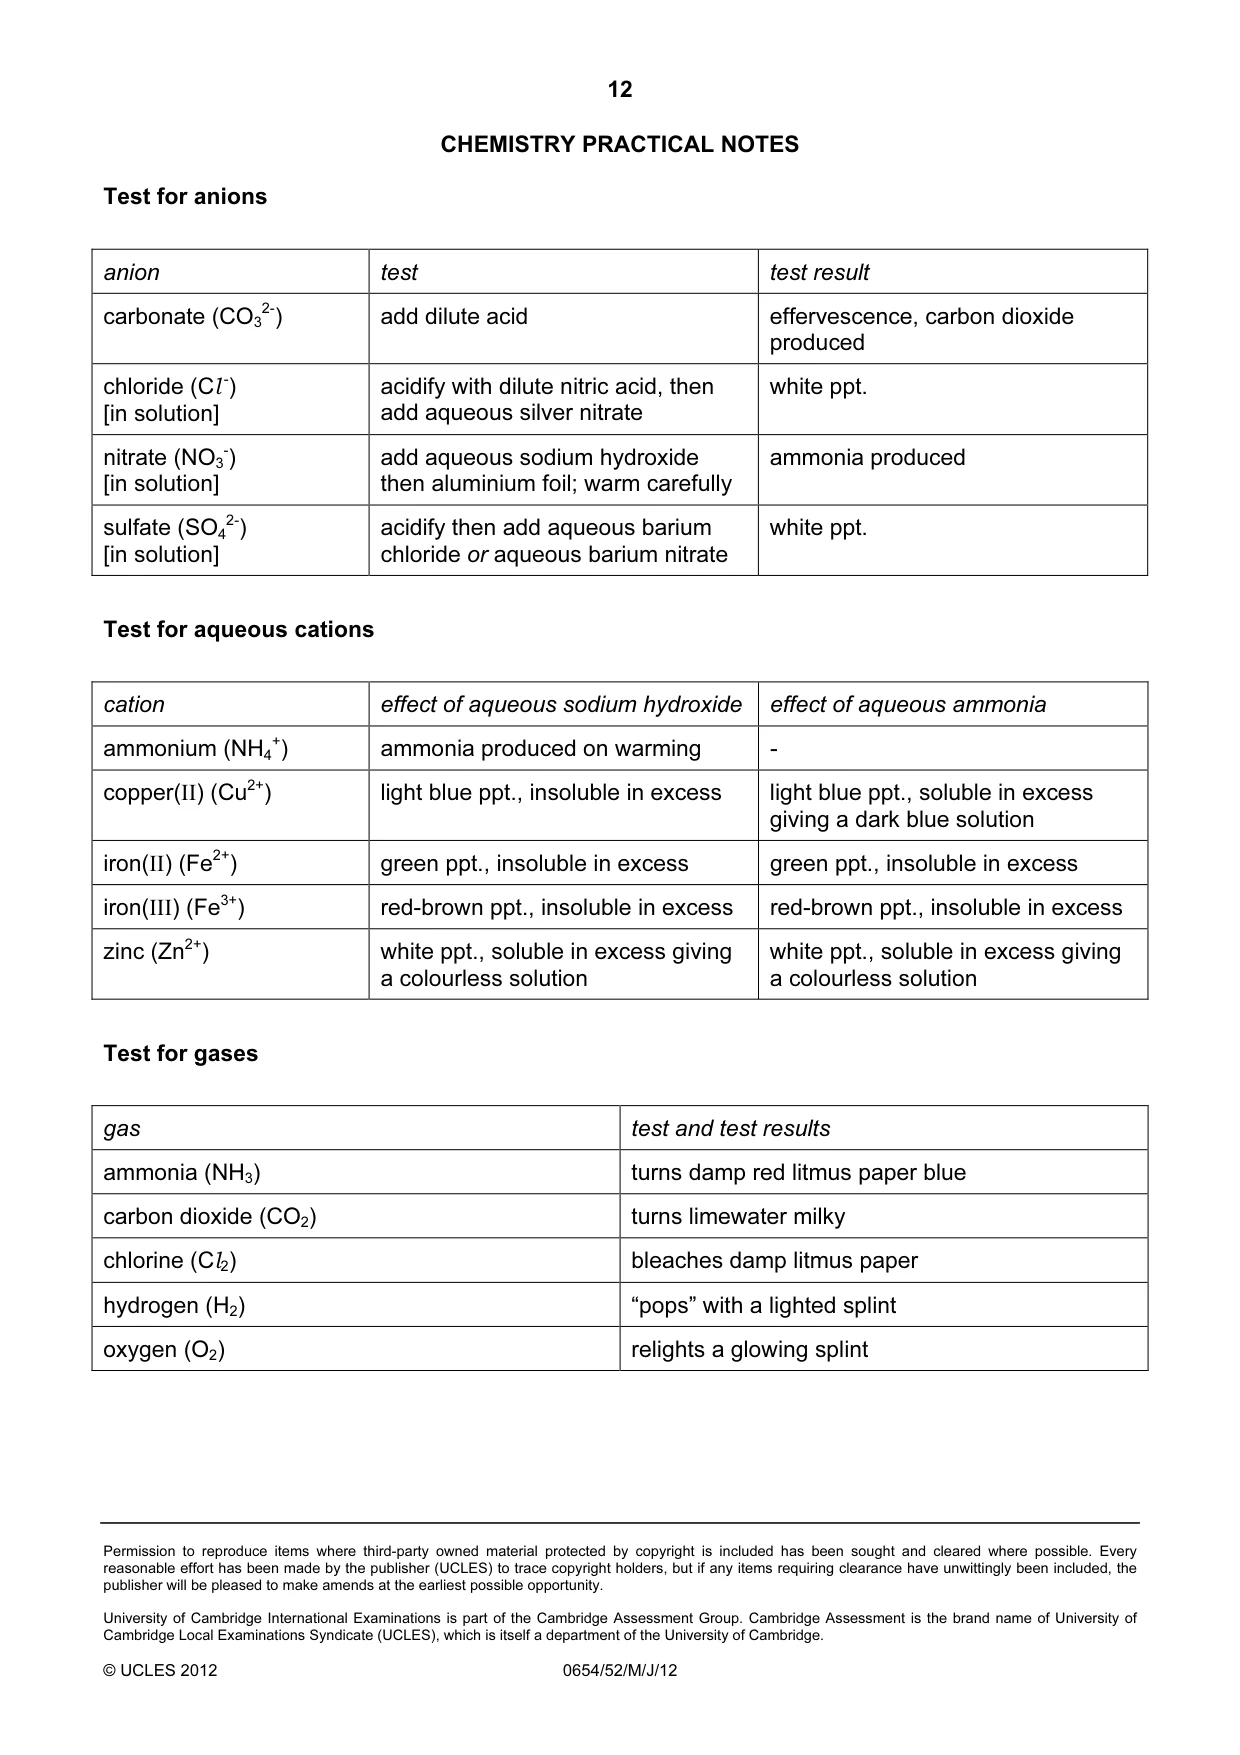
12 Permission to reproduce items where third-party owned material protected by copyright is included has been sought and cleared where possible. Every reasonable effort has been made by the publisher (UCLES) to trace copyright holders, but if any items requiring clearance have unwittingly been included, the publisher will be pleased to make amends at the earliest possible opportunity. University of Cambridge International Examinations is part of the Cambridge Assessment Group. Cambridge Assessment is the brand name of University of Cambridge Local Examinations Syndicate (UCLES), which is itself a department of the University of Cambridge. © UCLES 2012 0654/52/M/J/12 CHEMISTRY PRACTICAL NOTES Test for anions anion test test result carbonate (CO3 2-) add dilute acid effervescence, carbon dioxide produced chloride (Cl -) [in solution] acidify with dilute nitric acid, then add aqueous silver nitrate white ppt. nitrate (NO3 -) [in solution] add aqueous sodium hydroxide then aluminium foil; warm carefully ammonia produced sulfate (SO4 2-) [in solution] acidify then add aqueous barium chloride or aqueous barium nitrate white ppt. Test for aqueous cations cation effect of aqueous sodium hydroxide effect of aqueous ammonia ammonium (NH4 +) ammonia produced on warming - copper(II) (Cu2+) light blue ppt., insoluble in excess light blue ppt., soluble in excess giving a dark blue solution iron(II) (Fe2+) green ppt., insoluble in excess green ppt., insoluble in excess iron(III) (Fe3+) red-brown ppt., insoluble in excess red-brown ppt., insoluble in excess zinc (Zn2+) white ppt., soluble in excess giving a colourless solution white ppt., soluble in excess giving a colourless solution Test for gases gas test and test results ammonia (NH3) turns damp red litmus paper blue carbon dioxide (CO2) turns limewater milky chlorine (Cl2) bleaches damp litmus paper hydrogen (H2) “pops” with a lighted splint oxygen (O2) relights a glowing splint
Mark scheme, page 1
UNIVERSITY OF CAMBRIDGE INTERNATIONAL EXAMINATIONS International General Certificate of Secondary Education MARK SCHEME for the May/June 2012 question paper for the guidance of teachers 0654 CO-ORDINATED SCIENCES 0654/52 Paper 5 (Practical), maximum raw mark 45 This mark scheme is published as an aid to teachers and candidates, to indicate the requirements of the examination. It shows the basis on which Examiners were instructed to award marks. It does not indicate the details of the discussions that took place at an Examiners’ meeting before marking began, which would have considered the acceptability of alternative answers. Mark schemes must be read in conjunction with the question papers and the report on the examination. • Cambridge will not enter into discussions or correspondence in connection with these mark schemes. Cambridge is publishing the mark schemes for the May/June 2012 question papers for most IGCSE, GCE Advanced Level and Advanced Subsidiary Level syllabuses and some Ordinary Level syllabuses. www.XtremePapers.com
Mark scheme, page 2
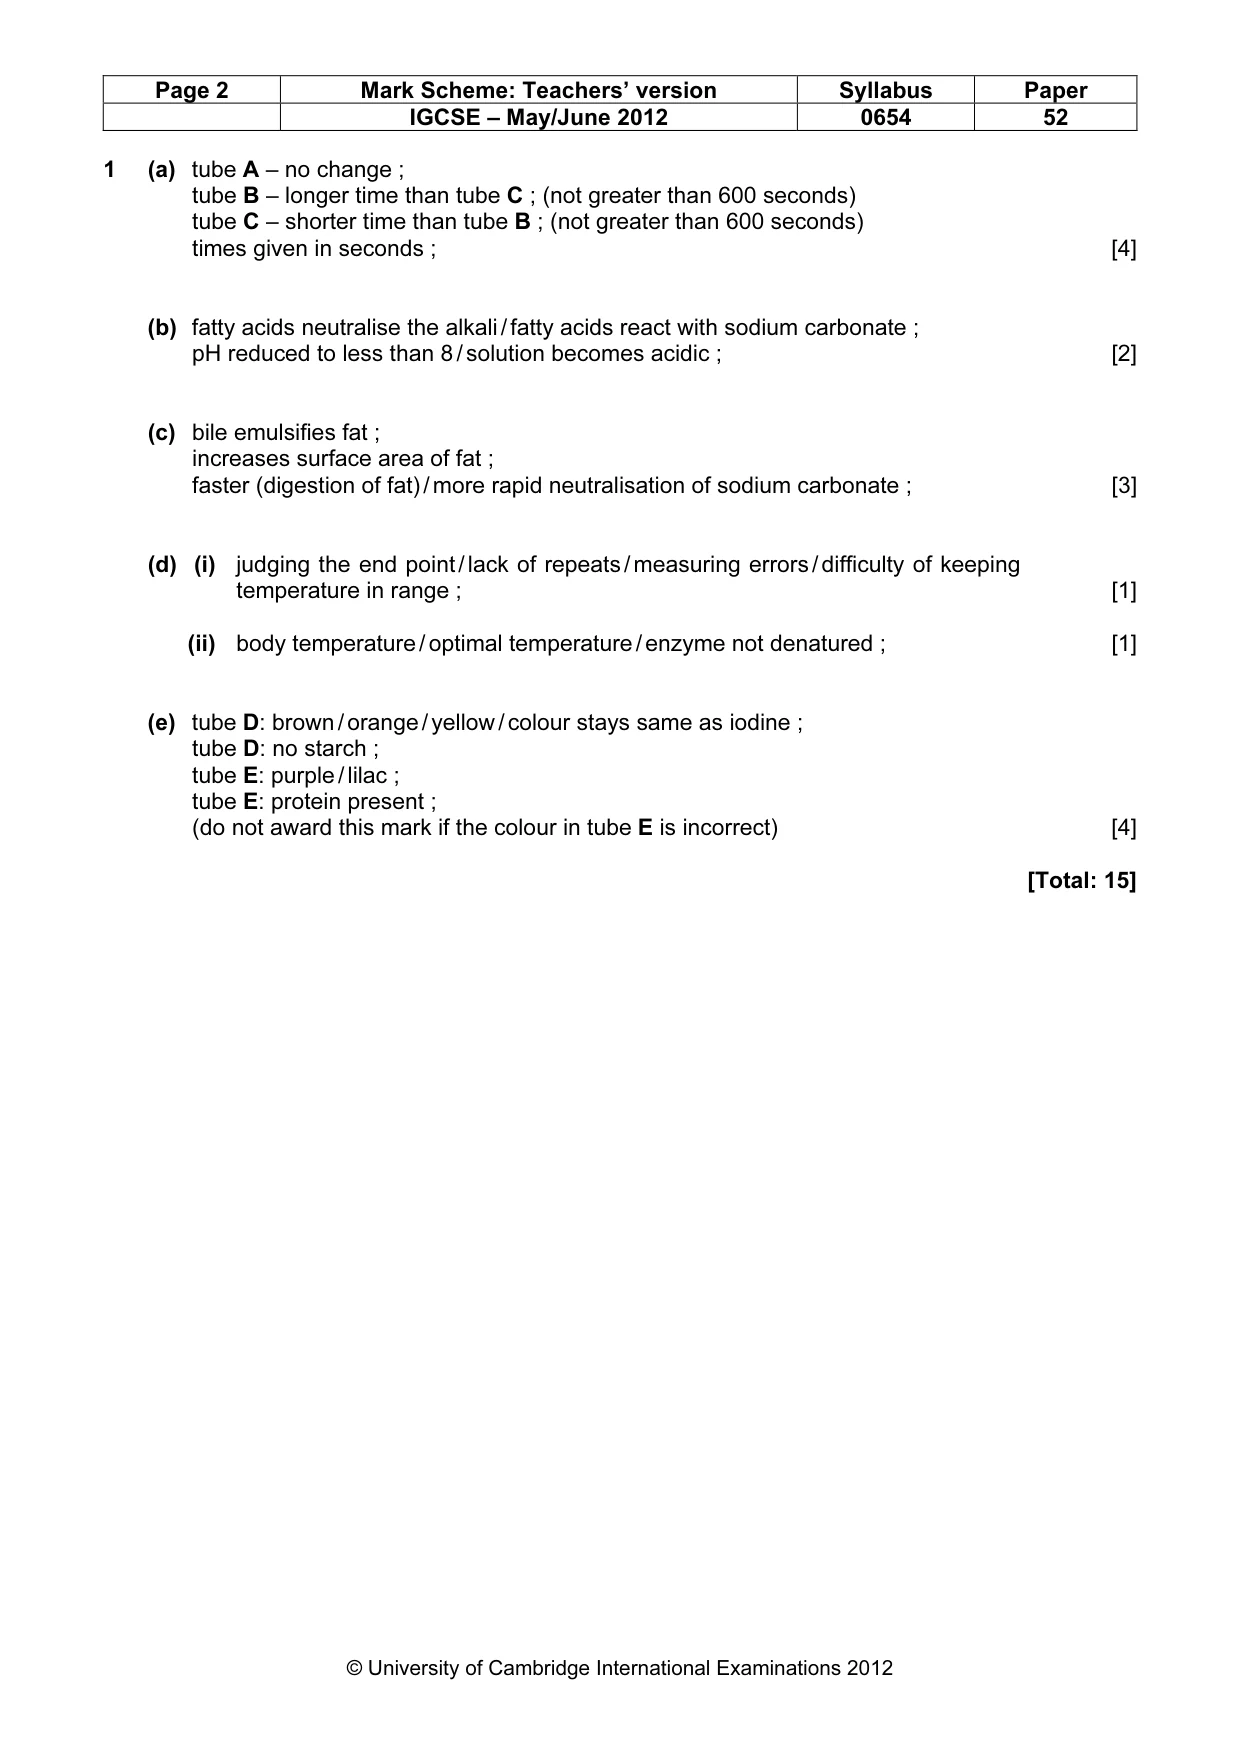
Page 2 Mark Scheme: Teachers’ version Syllabus Paper IGCSE – May/June 2012 0654 52 © University of Cambridge International Examinations 2012 1 (a) tube A – no change ; tube B – longer time than tube C ; (not greater than 600 seconds) tube C – shorter time than tube B ; (not greater than 600 seconds) times given in seconds ; [4] (b) fatty acids neutralise the alkali / fatty acids react with sodium carbonate ; pH reduced to less than 8 / solution becomes acidic ; [2] (c) bile emulsifies fat ; increases surface area of fat ; faster (digestion of fat) / more rapid neutralisation of sodium carbonate ; [3] (d) (i) judging the end point / lack of repeats / measuring errors / difficulty of keeping temperature in range ; [1] (ii) body temperature / optimal temperature / enzyme not denatured ; [1] (e) tube D: brown / orange / yellow / colour stays same as iodine ; tube D: no starch ; tube E: purple / lilac ; tube E: protein present ; (do not award this mark if the colour in tube E is incorrect) [4] [Total: 15]
Mark scheme, page 3
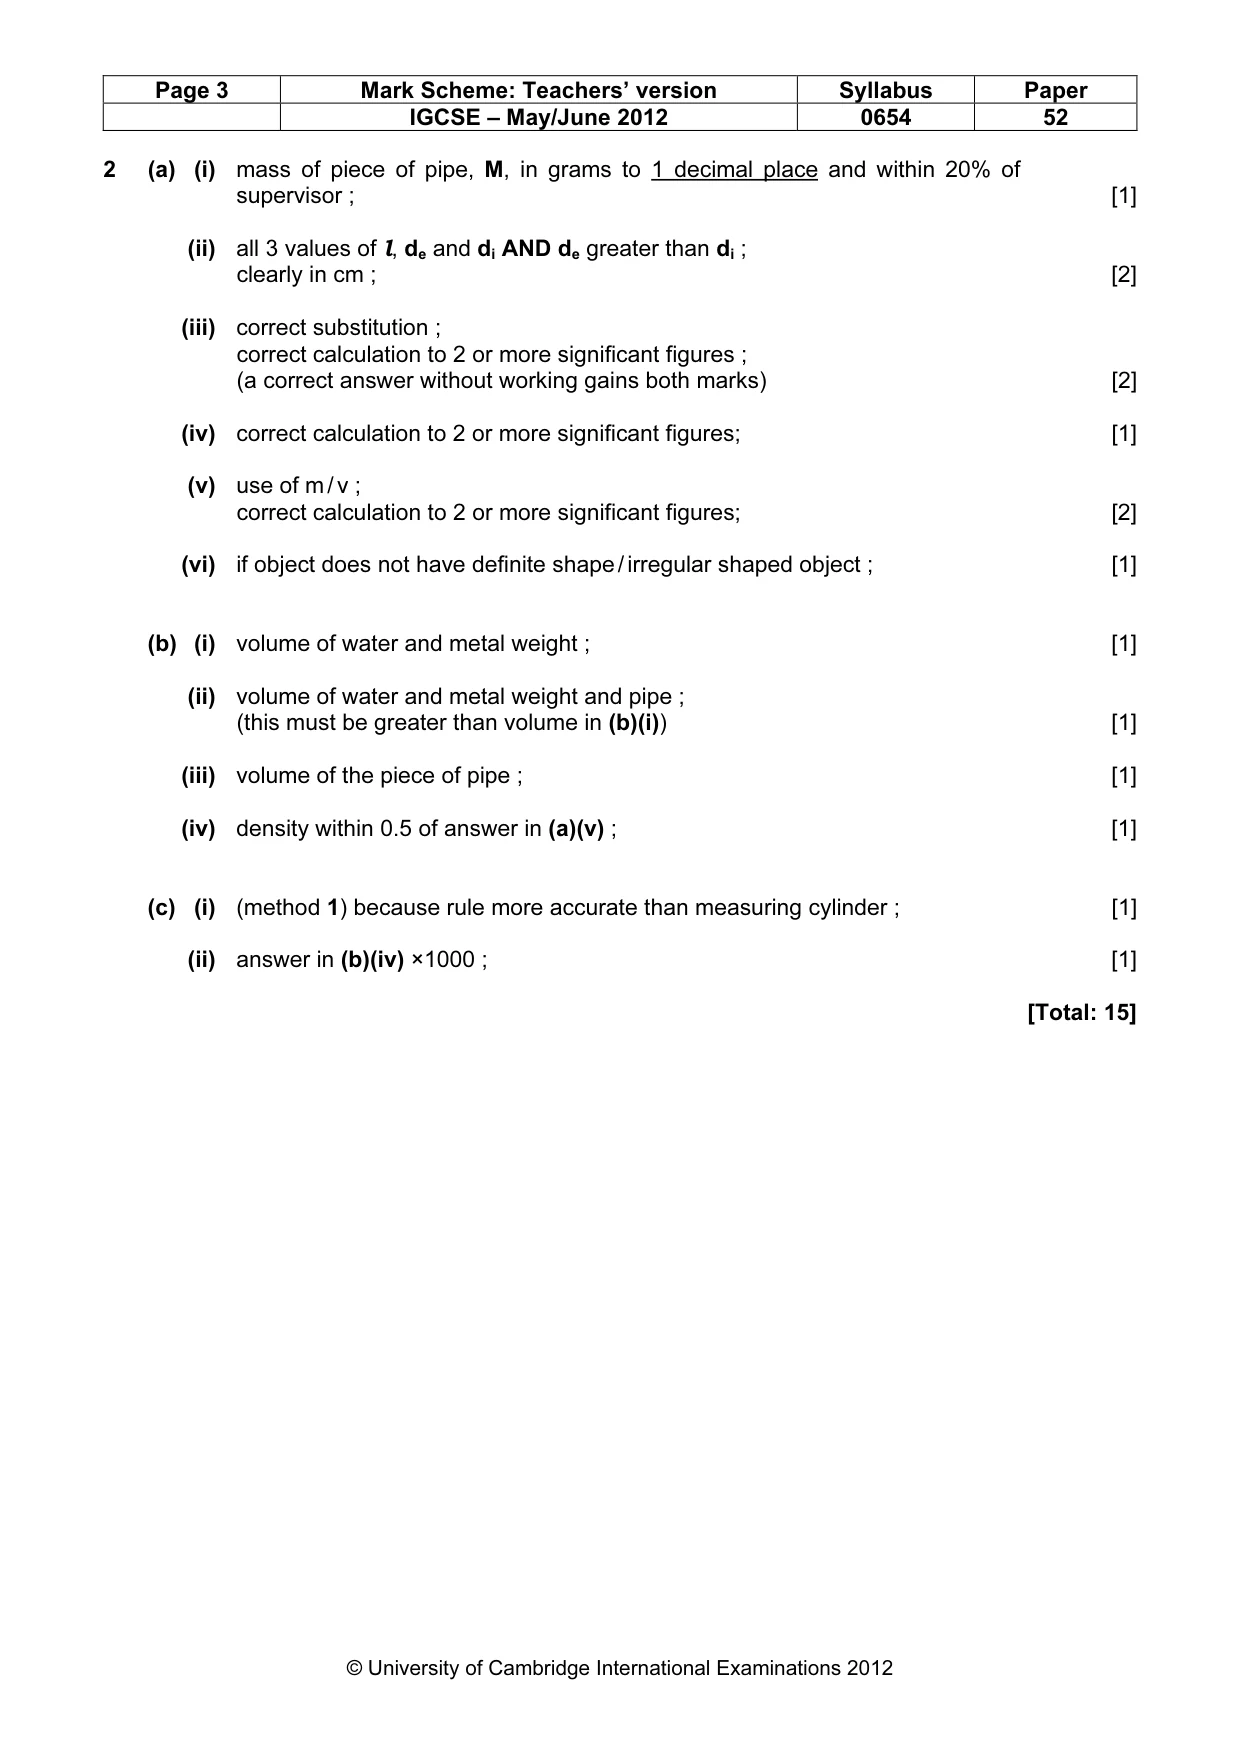
Page 3 Mark Scheme: Teachers’ version Syllabus Paper IGCSE – May/June 2012 0654 52 © University of Cambridge International Examinations 2012 2 (a) (i) mass of piece of pipe, M, in grams to 1 decimal place and within 20% of supervisor ; [1] (ii) all 3 values of l, de and di AND de greater than di ; clearly in cm ; [2] (iii) correct substitution ; correct calculation to 2 or more significant figures ; (a correct answer without working gains both marks) [2] (iv) correct calculation to 2 or more significant figures; [1] (v) use of m / v ; correct calculation to 2 or more significant figures; [2] (vi) if object does not have definite shape / irregular shaped object ; [1] (b) (i) volume of water and metal weight ; [1] (ii) volume of water and metal weight and pipe ; (this must be greater than volume in (b)(i)) [1] (iii) volume of the piece of pipe ; [1] (iv) density within 0.5 of answer in (a)(v) ; [1] (c) (i) (method 1) because rule more accurate than measuring cylinder ; [1] (ii) answer in (b)(iv) ×1000 ; [1] [Total: 15]
Mark scheme, page 4
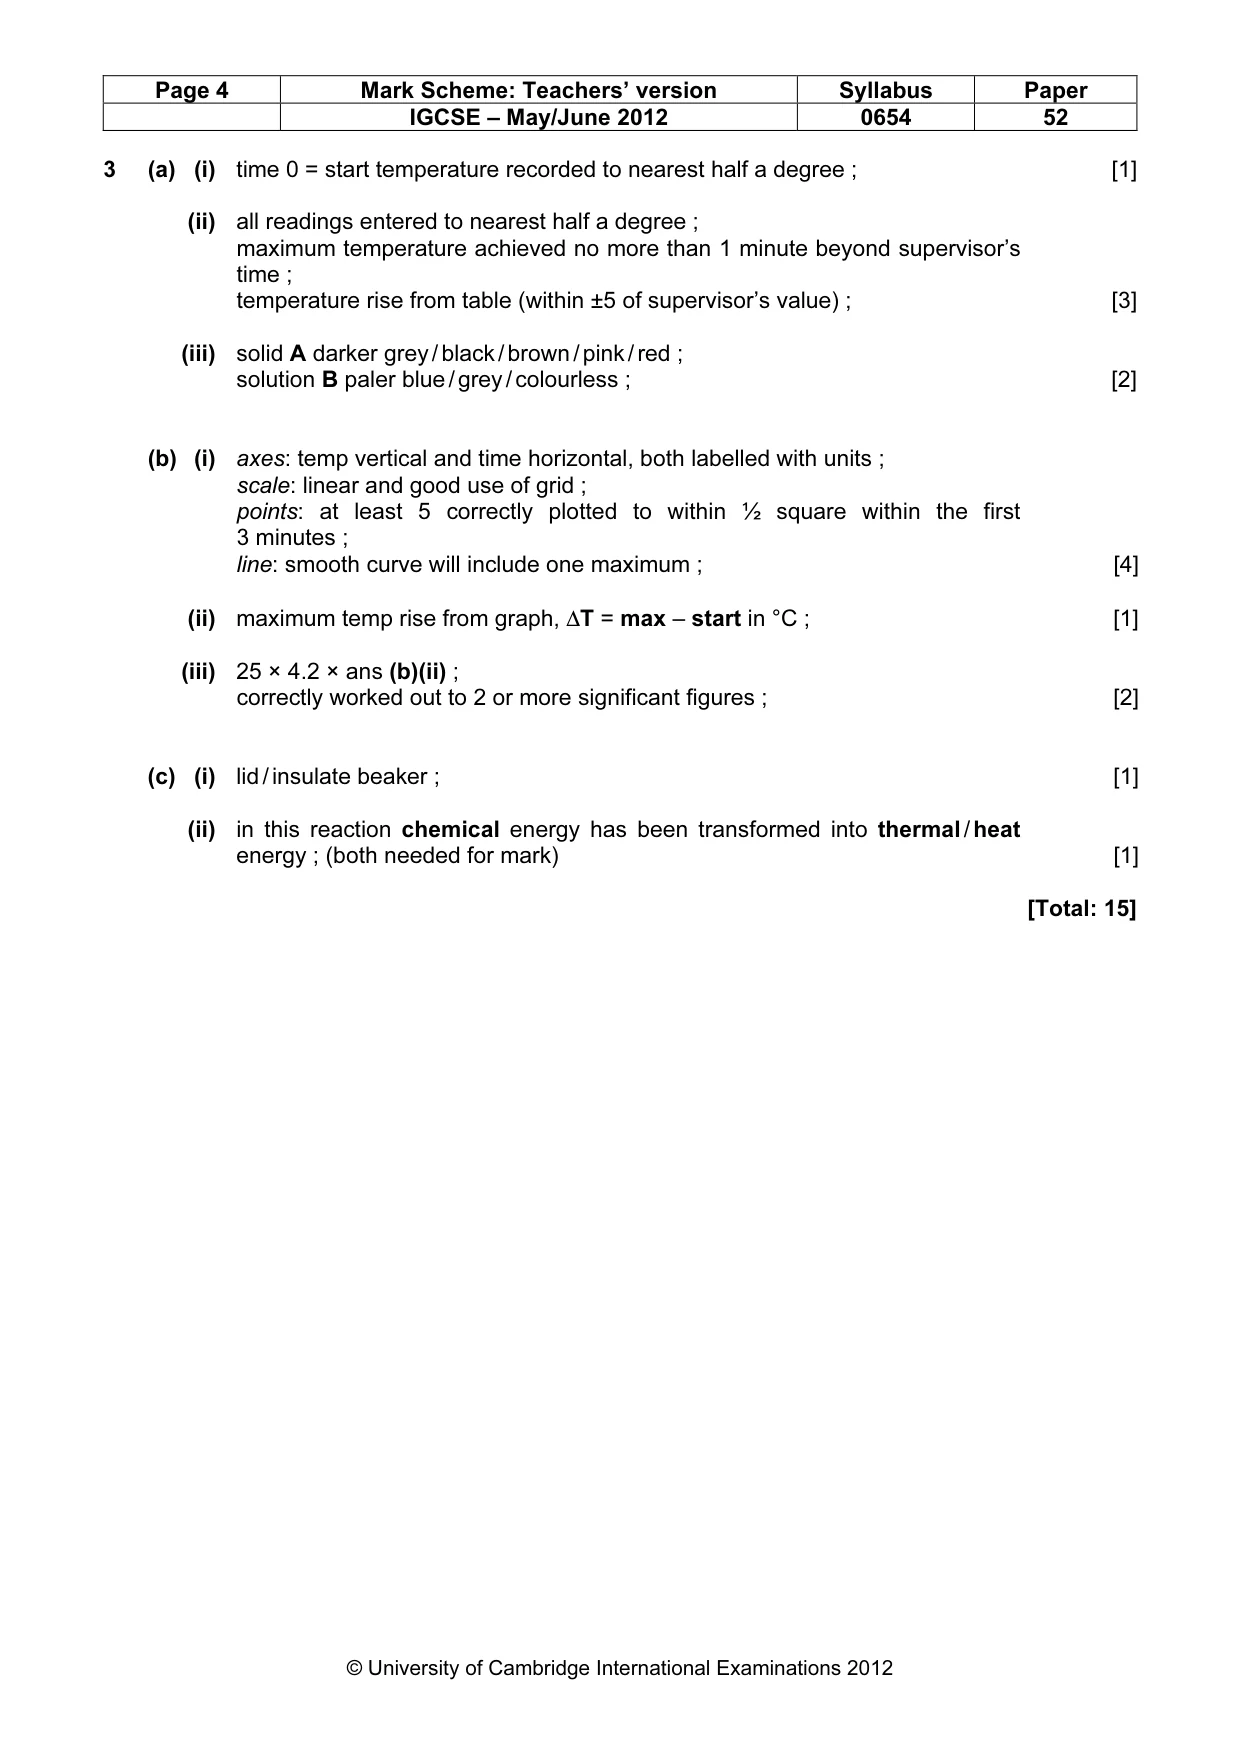
Page 4 Mark Scheme: Teachers’ version Syllabus Paper IGCSE – May/June 2012 0654 52 © University of Cambridge International Examinations 2012 3 (a) (i) time 0 = start temperature recorded to nearest half a degree ; [1] (ii) all readings entered to nearest half a degree ; maximum temperature achieved no more than 1 minute beyond supervisor’s time ; temperature rise from table (within ±5 of supervisor’s value) ; [3] (iii) solid A darker grey / black / brown / pink / red ; solution B paler blue / grey / colourless ; [2] (b) (i) axes: temp vertical and time horizontal, both labelled with units ; scale: linear and good use of grid ; points: at least 5 correctly plotted to within ½ square within the first 3 minutes ; line: smooth curve will include one maximum ; [4] (ii) maximum temp rise from graph, ∆T = max – start in °C ; [1] (iii) 25 × 4.2 × ans (b)(ii) ; correctly worked out to 2 or more significant figures ; [2] (c) (i) lid / insulate beaker ; [1] (ii) in this reaction chemical energy has been transformed into thermal / heat energy ; (both needed for mark) [1] [Total: 15]
What you needed in this session
Cambridge’s own grade thresholds for 2012 May/June, Paper 5 · Variant 2. A higher threshold means an easier paper — the bar moves with how the cohort did.