Cambridge IGCSE Sciences - Co-ordinated (Double) 0654 — 2006 Oct/Nov Paper 5 · Variant 1
0654/51/O/N/06 · 45 marks · ≈51 min
The question paper and its mark scheme, free to read here and free to download. This is Cambridge’s own paper, exactly as it was sat.
Question paper12 pages
Mark scheme3 pages
Answers below. Sit the paper first if you are practising.
Paper as text
Question paper, page 1
Centre Number Candidate Number Name UNIVERSITY OF CAMBRIDGE INTERNATIONAL EXAMINATIONS International General Certificate of Secondary Education CO-ORDINATED SCIENCES 0654/05 Paper 5 Practical Test October/November 2006 2 hours Candidates answer on the Question Paper. Additional Materials: As listed in Instructions to Supervisors READ THESE INSTRUCTIONS FIRST Write your Centre number, candidate number and name on all the work you hand in. Write in dark blue or black pen. You may use a soft pencil for any diagrams, graphs or rough working. Do not use staples, paper clips, highlighters, glue or correction fluid. Answer all questions. Chemistry practical notes for this paper are printed on page 12. At the end of the examination, fasten all your work securely together. The number of marks is given in brackets [ ] at the end of each question or part question. For Examiner’s Use 1 2 3 Total This document consists of 12 printed pages. IB06 11_0654_05/3RP UCLES 2006 [Turn over www.XtremePapers.com
Question paper, page 2
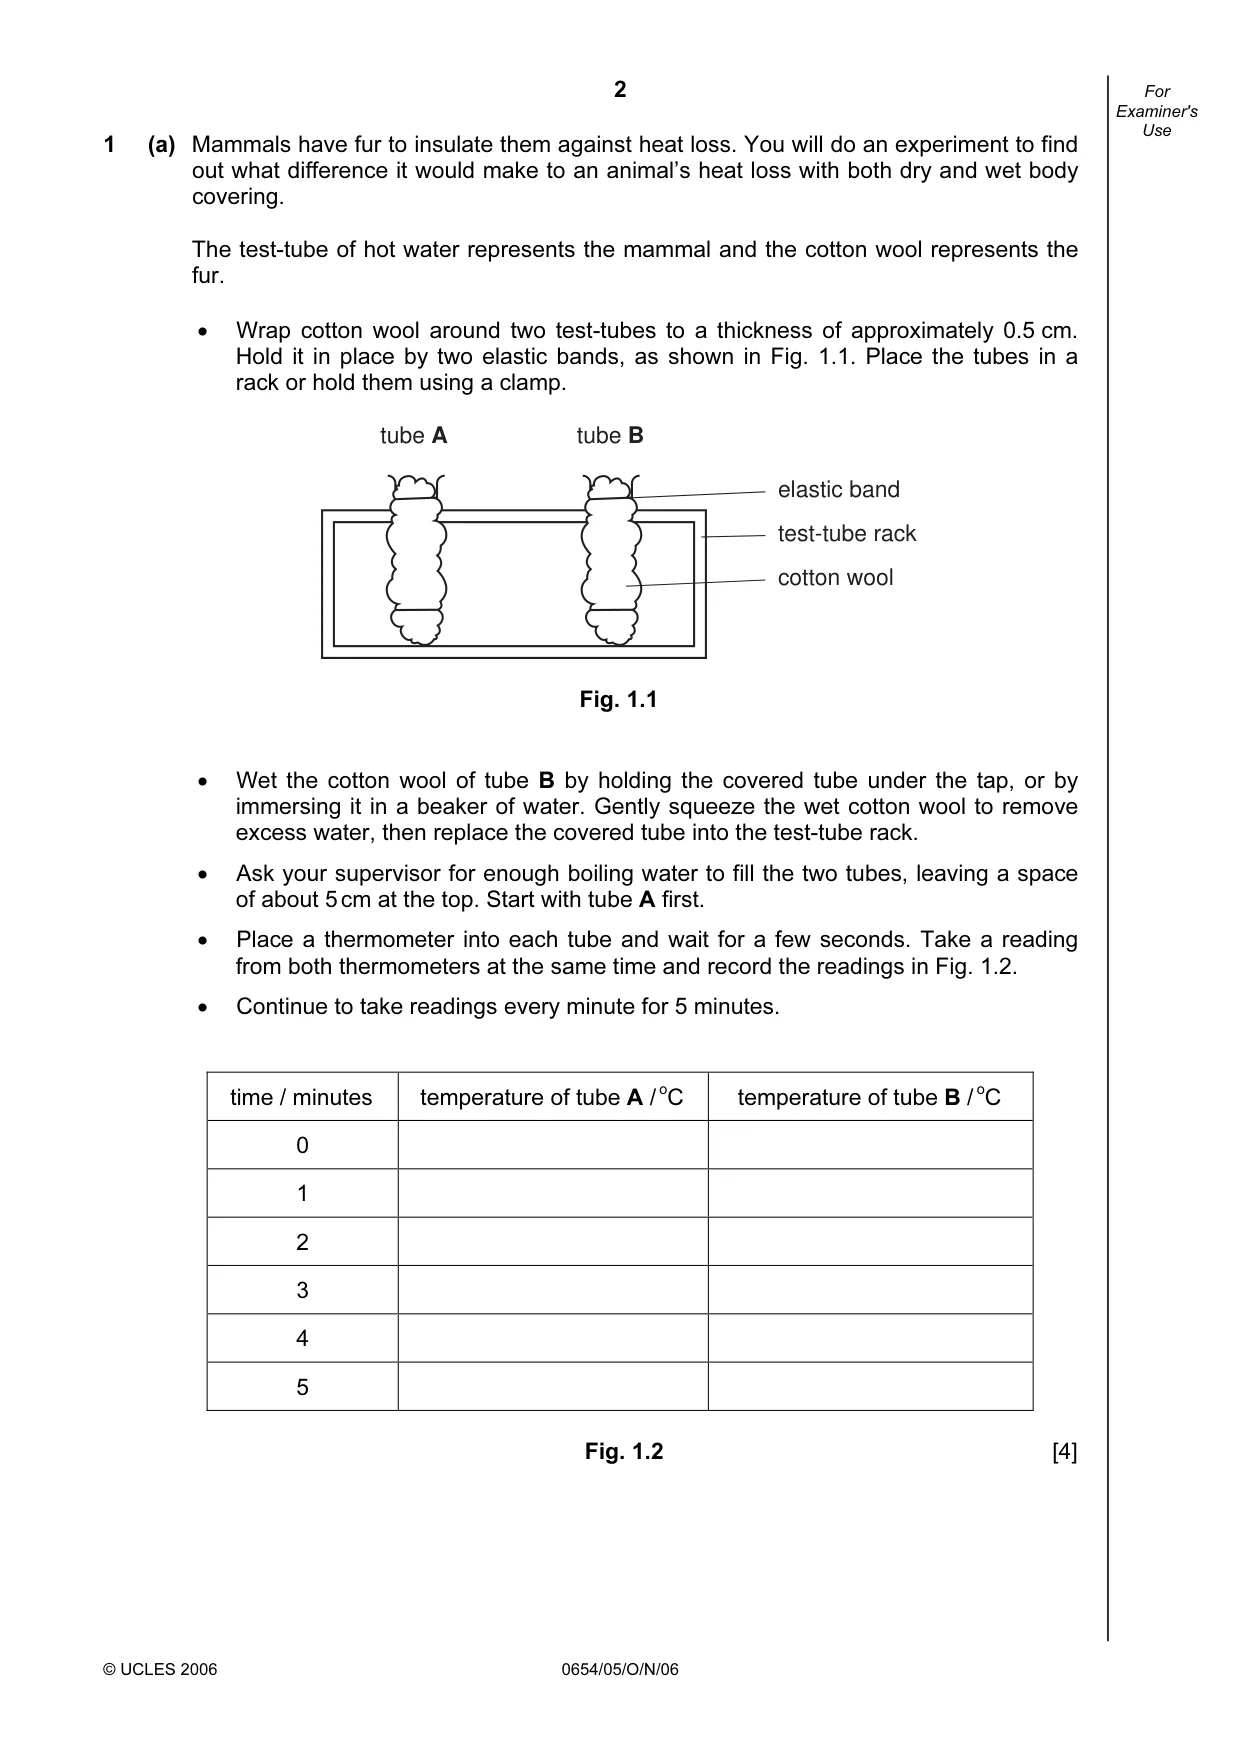
2 © UCLES 2006 0654/05/O/N/06 For Examiner's Use 1 (a) Mammals have fur to insulate them against heat loss. You will do an experiment to find out what difference it would make to an animal’s heat loss with both dry and wet body covering. The test-tube of hot water represents the mammal and the cotton wool represents the fur. • Wrap cotton wool around two test-tubes to a thickness of approximately 0.5 cm. Hold it in place by two elastic bands, as shown in Fig. 1.1. Place the tubes in a rack or hold them using a clamp. tube A tube B elastic band test-tube rack cotton wool Fig. 1.1 • Wet the cotton wool of tube B by holding the covered tube under the tap, or by immersing it in a beaker of water. Gently squeeze the wet cotton wool to remove excess water, then replace the covered tube into the test-tube rack. • Ask your supervisor for enough boiling water to fill the two tubes, leaving a space of about 5 cm at the top. Start with tube A first. • Place a thermometer into each tube and wait for a few seconds. Take a reading from both thermometers at the same time and record the readings in Fig. 1.2. • Continue to take readings every minute for 5 minutes. time / minutes temperature of tube A / oC temperature of tube B / oC 0 1 2 3 4 5 Fig. 1.2 [4]
Question paper, page 3
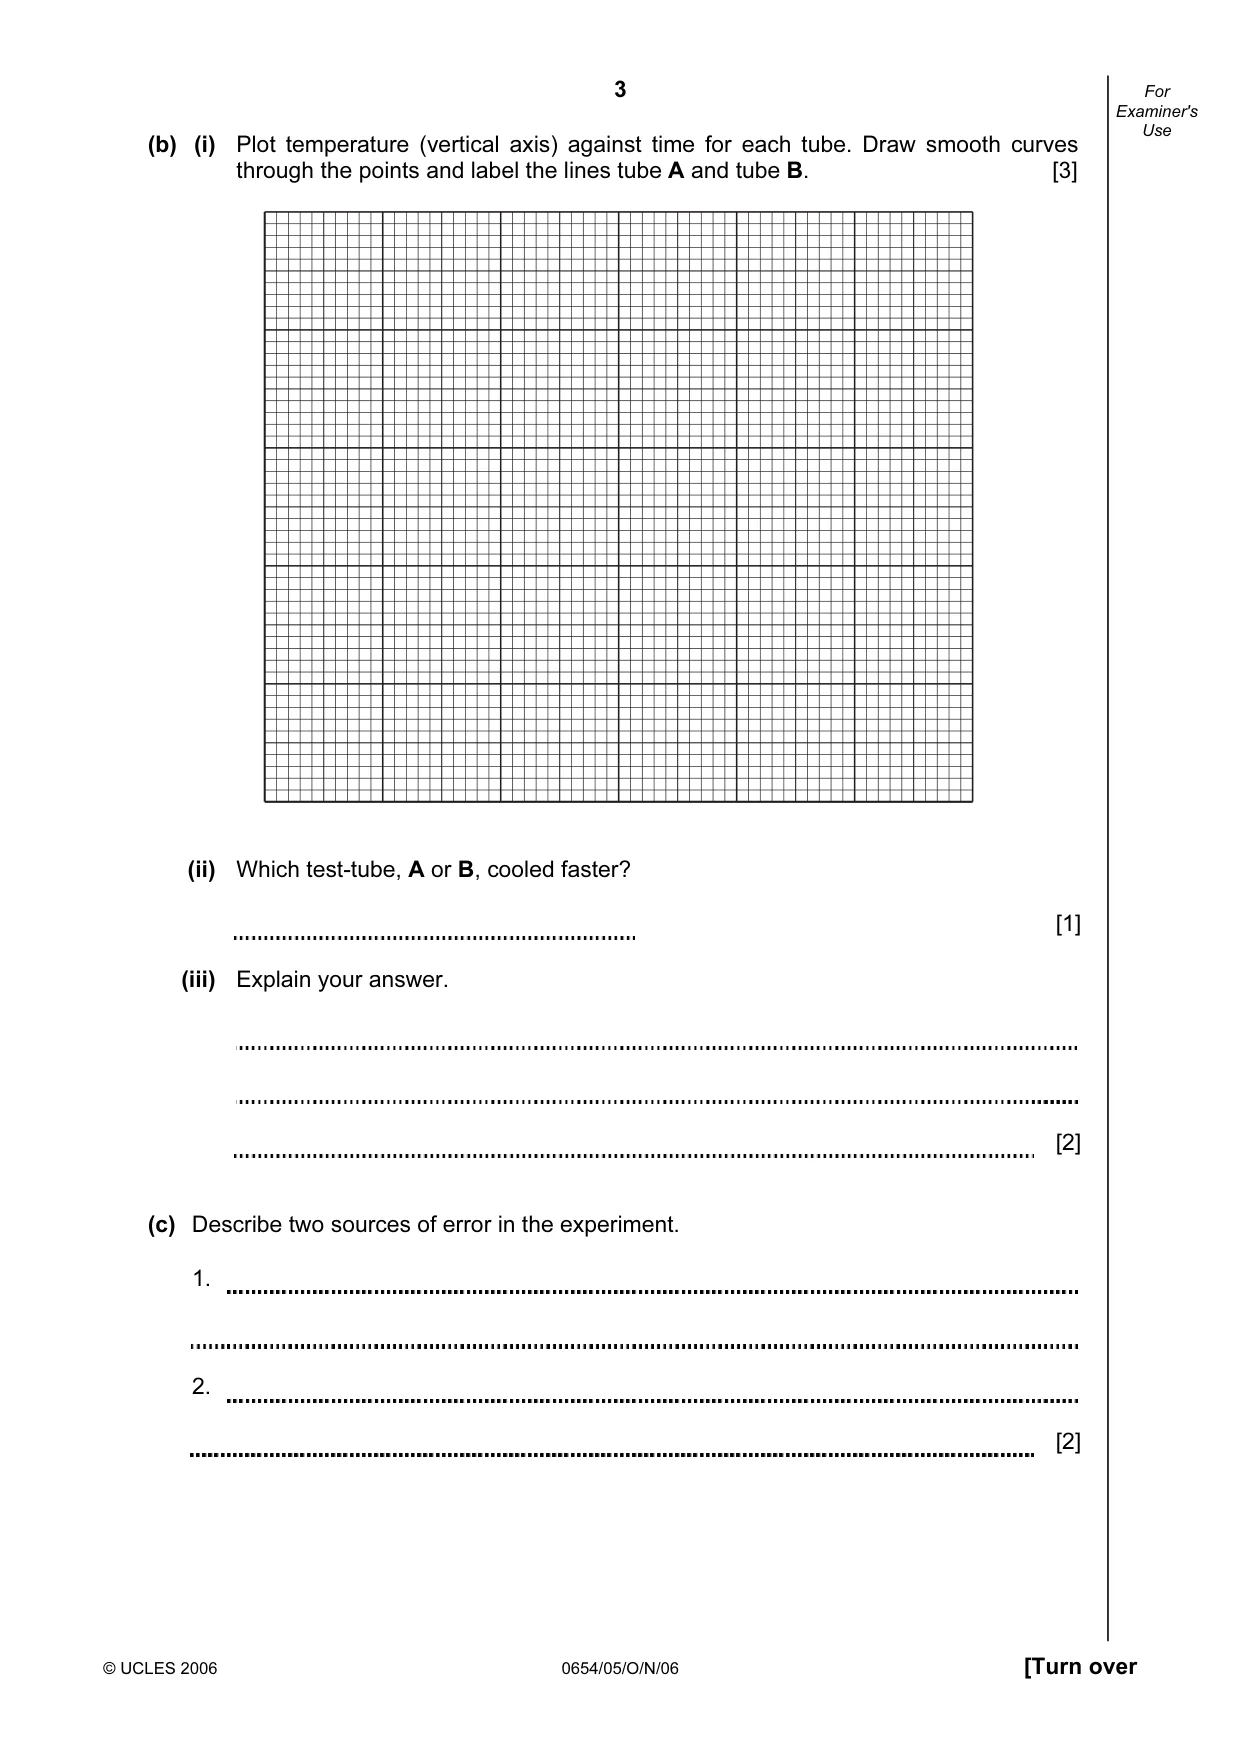
3 © UCLES 2006 0654/05/O/N/06 [Turn over For Examiner's Use (b) (i) Plot temperature (vertical axis) against time for each tube. Draw smooth curves through the points and label the lines tube A and tube B. [3] (ii) Which test-tube, A or B, cooled faster? [1] (iii) Explain your answer. [2] (c) Describe two sources of error in the experiment. 1. 2. [2]
Question paper, page 4
4 © UCLES 2006 0654/05/O/N/06 For Examiner's Use (d) (i) The experiment uses the test-tubes as models of mammals. Explain how the temperature variation is different in mammals compared with the test-tubes in the experiment. [1] (ii) The skin of mammals produces oil that coats the fur. This makes it water-resistant, so that rain will run off the fur, preventing it from becoming wet. Suggest how washing a mammal’s fur with strong detergent may interfere with its ability to retain heat. [2]
Question paper, page 5
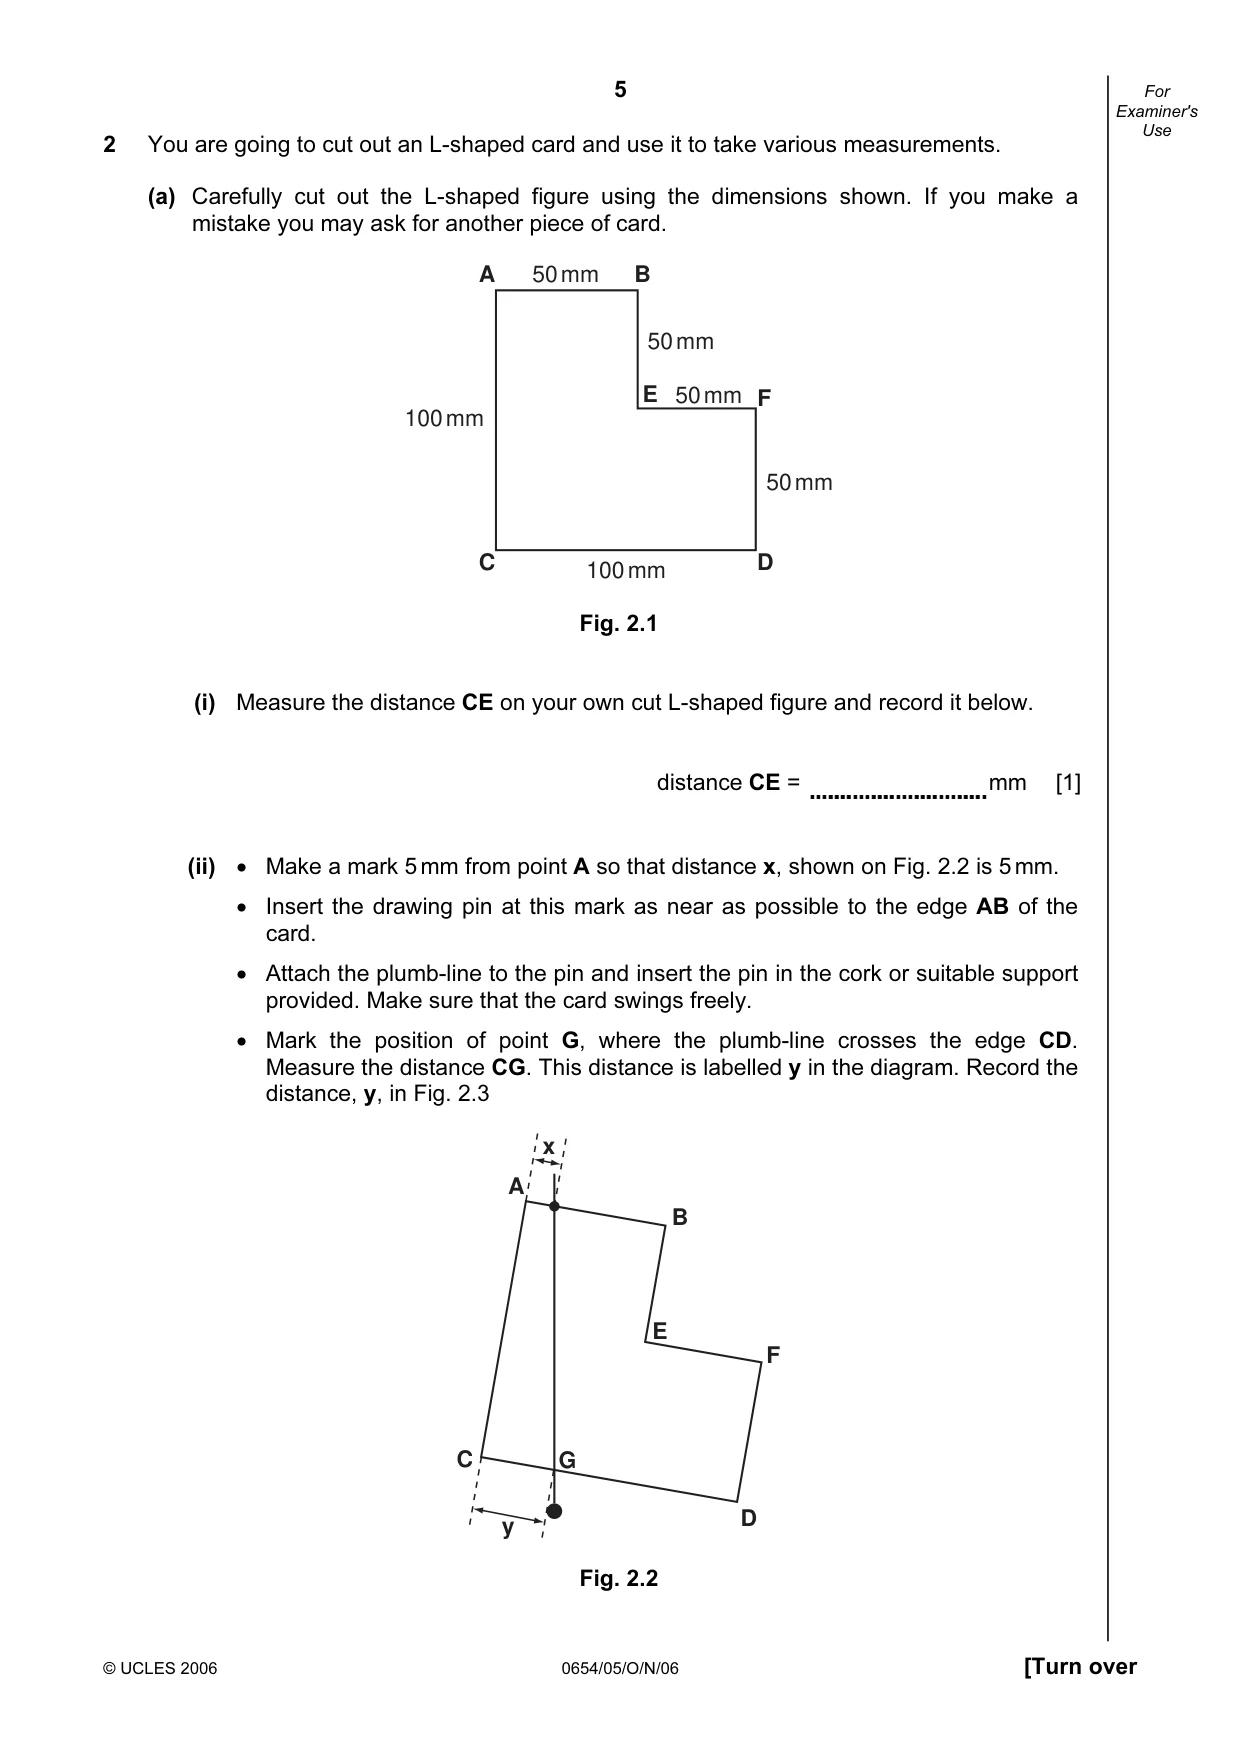
5 © UCLES 2006 0654/05/O/N/06 [Turn over For Examiner's Use 2 You are going to cut out an L-shaped card and use it to take various measurements. (a) Carefully cut out the L-shaped figure using the dimensions shown. If you make a mistake you may ask for another piece of card. A C D F B E 50 mm 50 mm 50 mm 50 mm 100 mm 100 mm Fig. 2.1 (i) Measure the distance CE on your own cut L-shaped figure and record it below. distance CE = mm [1] (ii) • Make a mark 5 mm from point A so that distance x, shown on Fig. 2.2 is 5 mm. • Insert the drawing pin at this mark as near as possible to the edge AB of the card. • Attach the plumb-line to the pin and insert the pin in the cork or suitable support provided. Make sure that the card swings freely. • Mark the position of point G, where the plumb-line crosses the edge CD. Measure the distance CG. This distance is labelled y in the diagram. Record the distance, y, in Fig. 2.3 x y A B C D E F G Fig. 2.2
Question paper, page 6
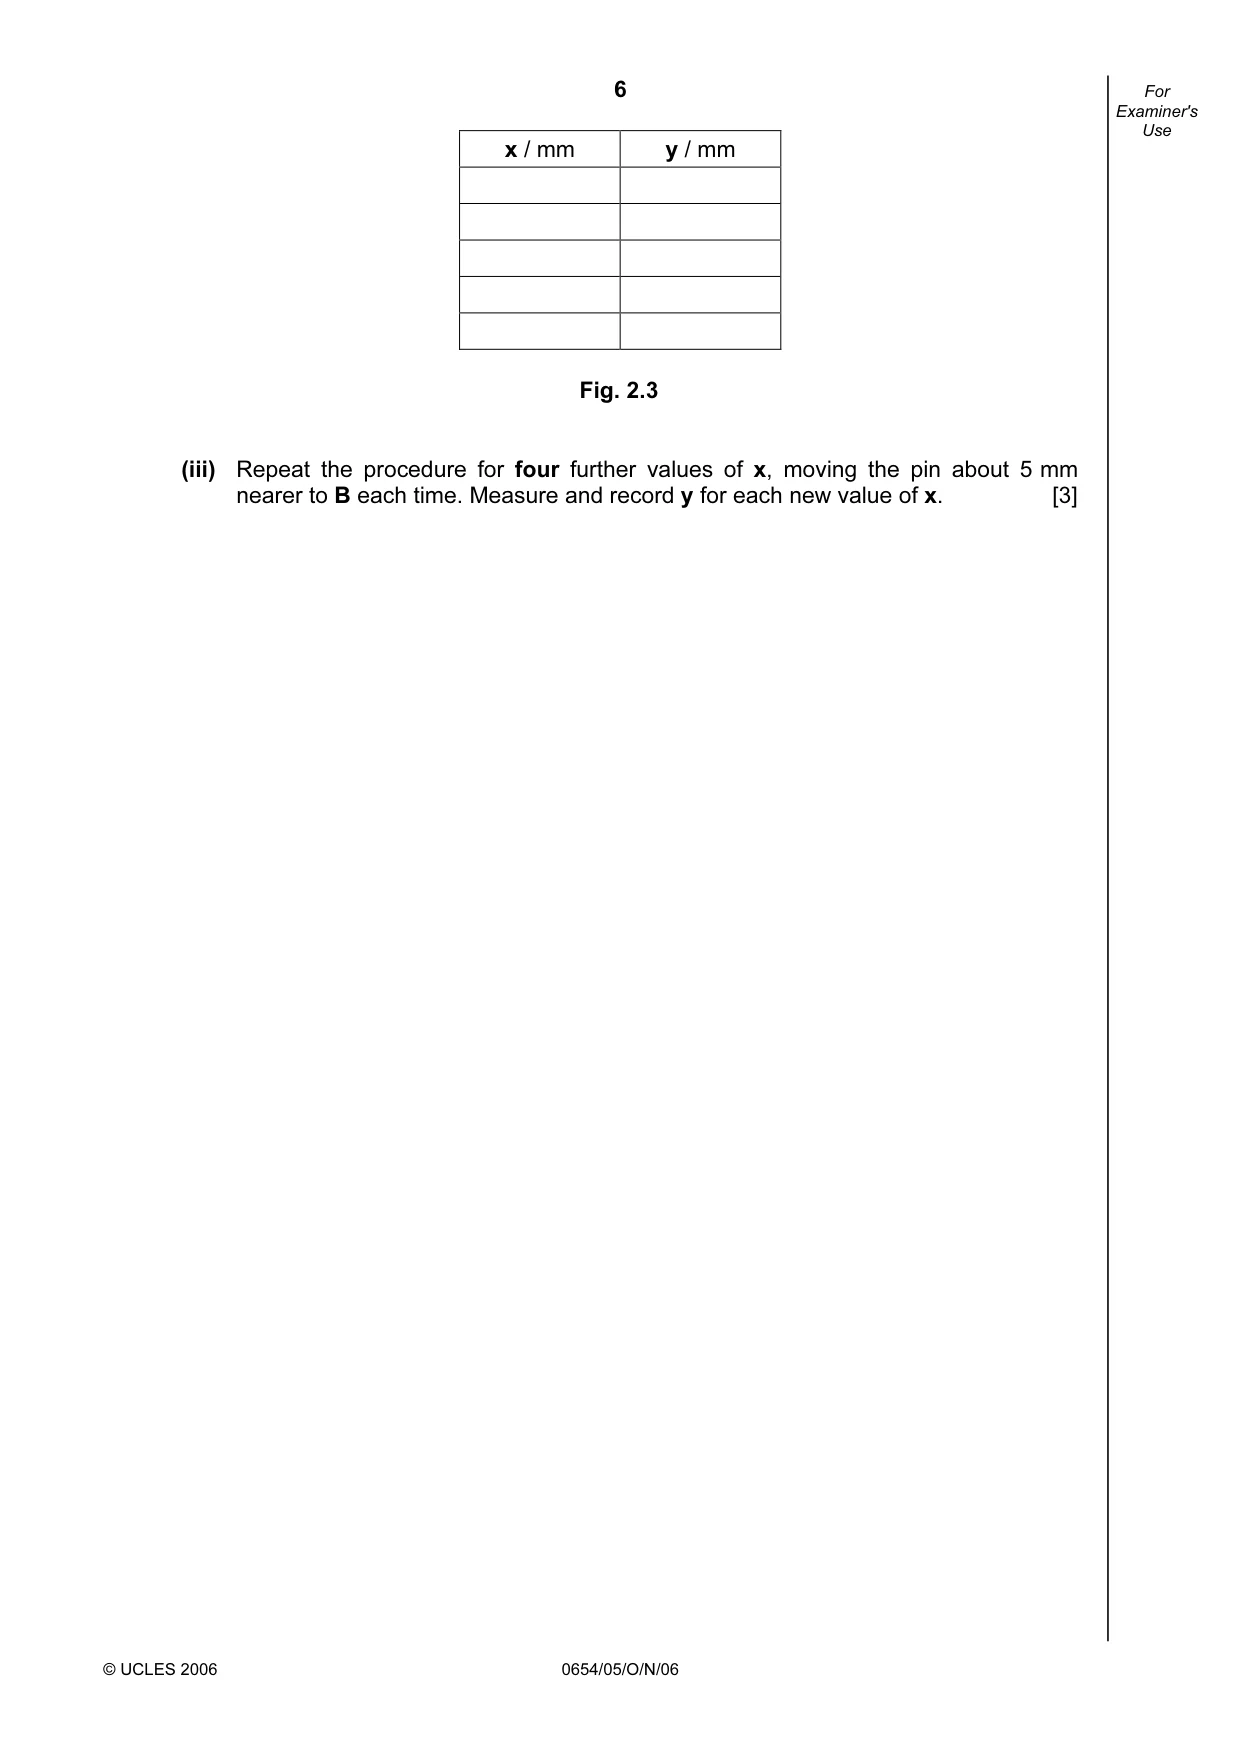
6 © UCLES 2006 0654/05/O/N/06 For Examiner's Use x / mm y / mm Fig. 2.3 (iii) Repeat the procedure for four further values of x, moving the pin about 5 mm nearer to B each time. Measure and record y for each new value of x. [3]
Question paper, page 7
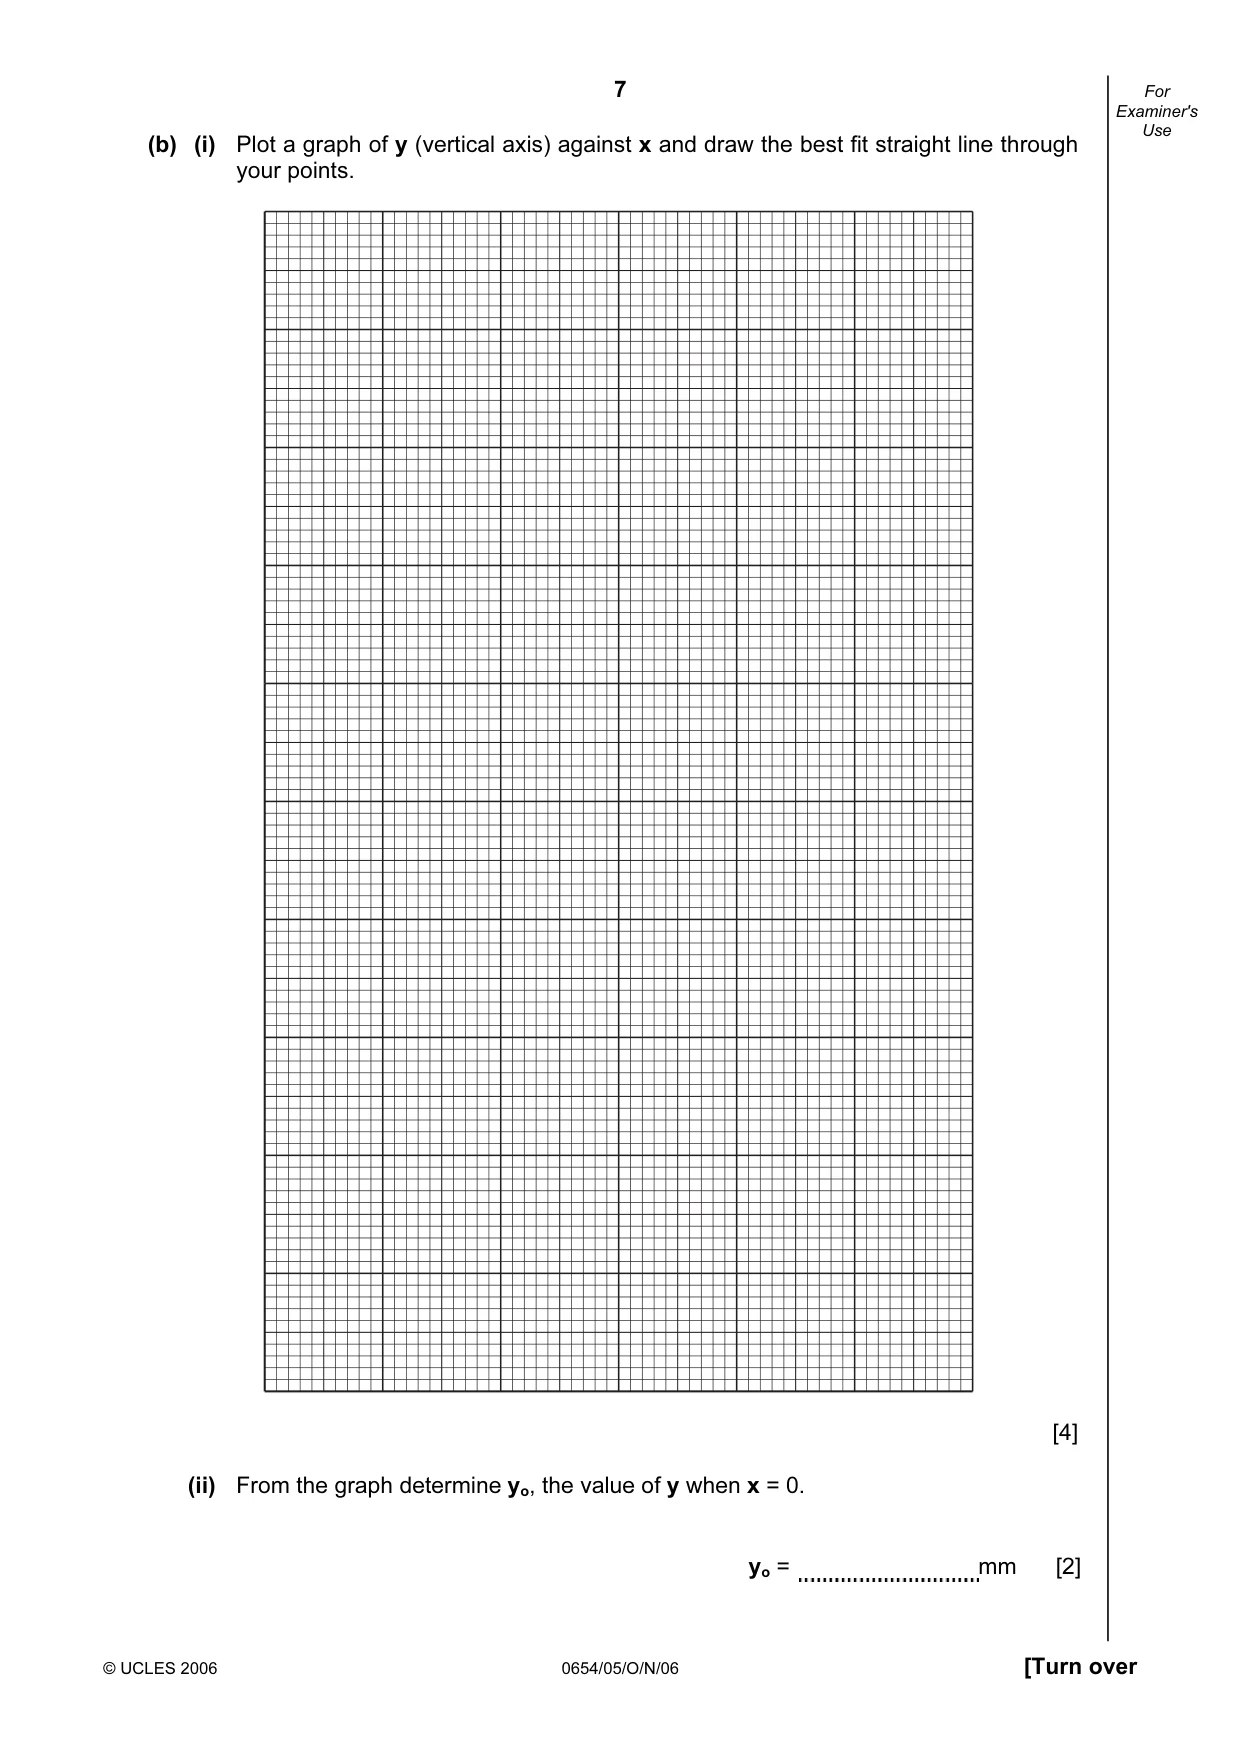
7 © UCLES 2006 0654/05/O/N/06 [Turn over For Examiner's Use (b) (i) Plot a graph of y (vertical axis) against x and draw the best fit straight line through your points. [4] (ii) From the graph determine yo, the value of y when x = 0. yo = mm [2]
Question paper, page 8
8 © UCLES 2006 0654/05/O/N/06 For Examiner's Use (c) (i) Place the L-shaped card on the space below. Using a pencil, draw around the card. Label the drawing with the letters A to F as shown in Fig. 2.2. [2] (ii) Using the value of yo from (b)(ii), show point G on your drawing. Join point G to point A. Measure and record the length of the line AG. length of line AG = mm [2] (iii) Draw the line CE. Mark the point M, where lines CE and AG cross. [1]
Question paper, page 9
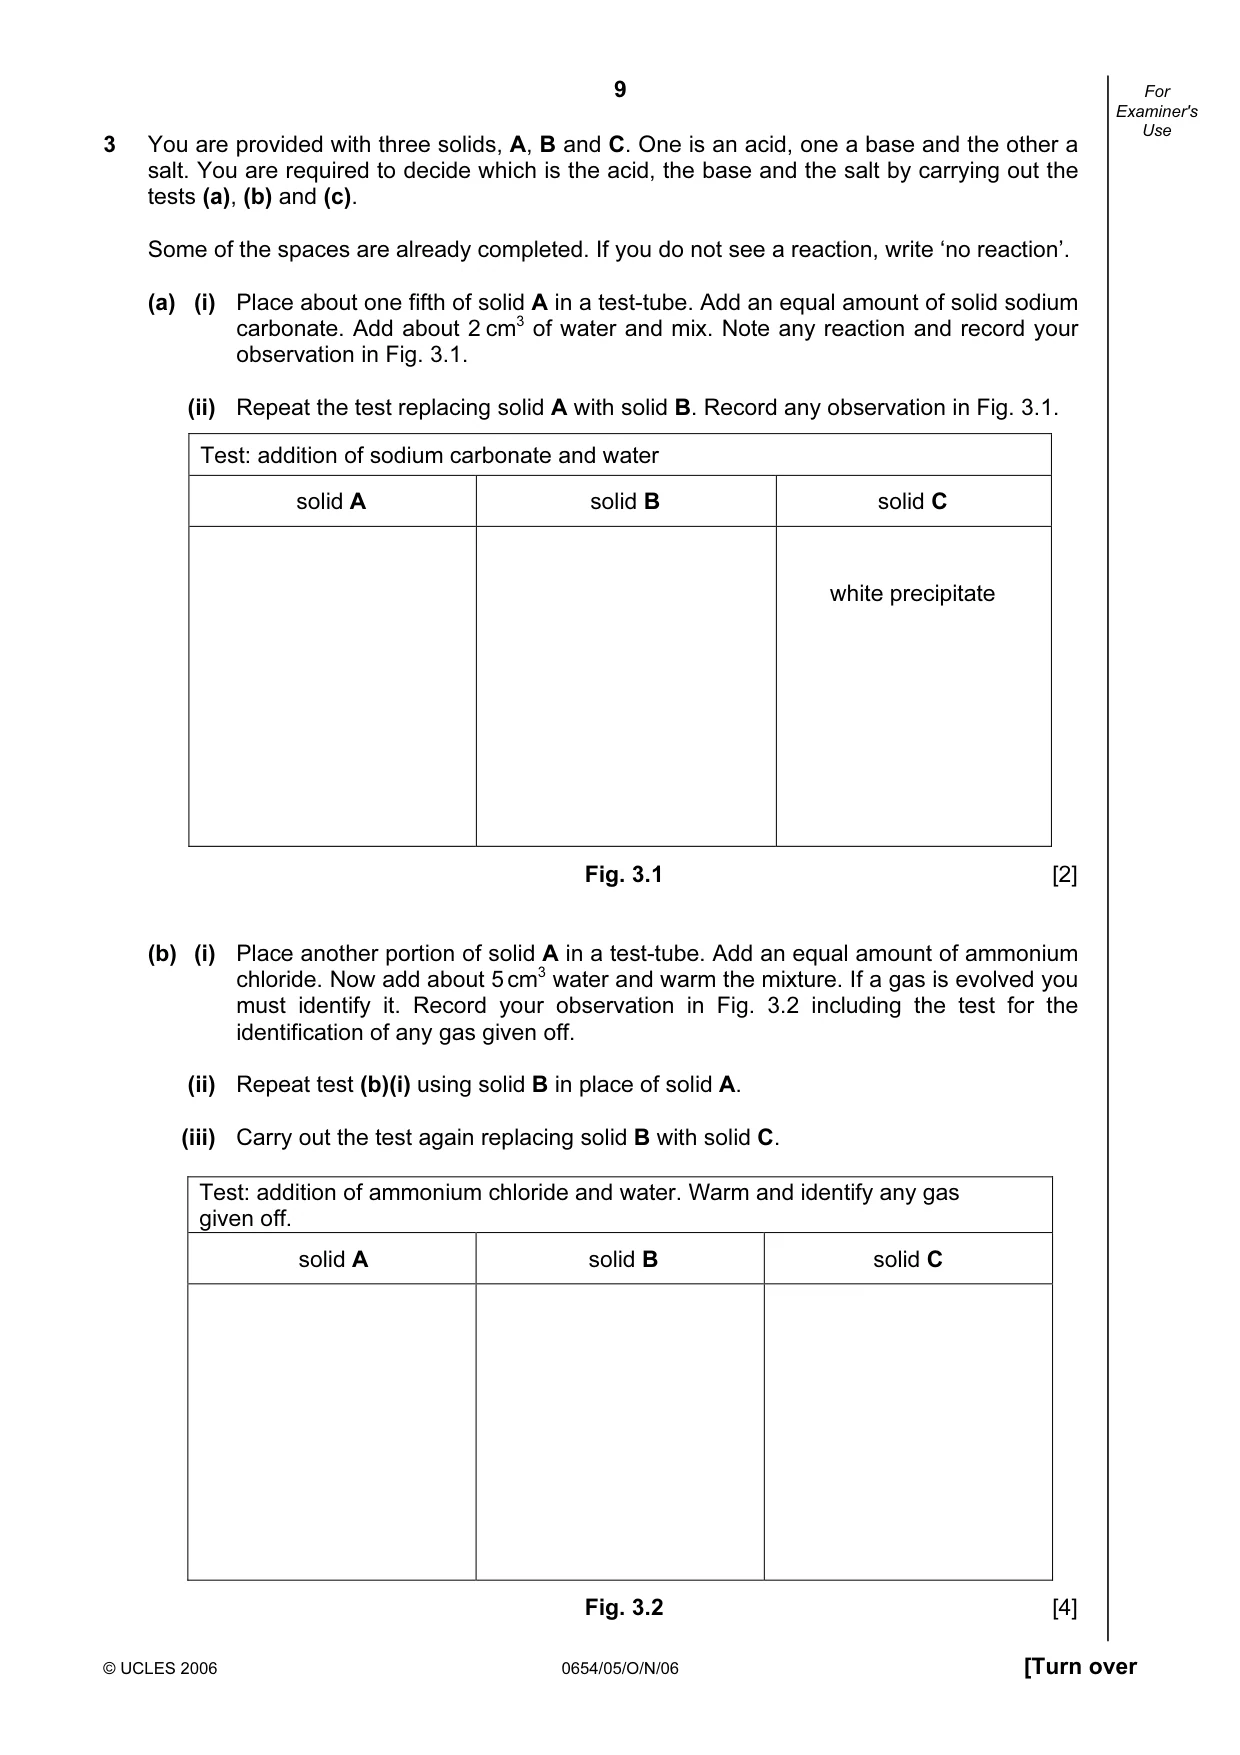
9 © UCLES 2006 0654/05/O/N/06 [Turn over For Examiner's Use 3 You are provided with three solids, A, B and C. One is an acid, one a base and the other a salt. You are required to decide which is the acid, the base and the salt by carrying out the tests (a), (b) and (c). Some of the spaces are already completed. If you do not see a reaction, write ‘no reaction’. (a) (i) Place about one fifth of solid A in a test-tube. Add an equal amount of solid sodium carbonate. Add about 2 cm3 of water and mix. Note any reaction and record your observation in Fig. 3.1. (ii) Repeat the test replacing solid A with solid B. Record any observation in Fig. 3.1. Test: addition of sodium carbonate and water solid A solid B solid C white precipitate Fig. 3.1 [2] (b) (i) Place another portion of solid A in a test-tube. Add an equal amount of ammonium chloride. Now add about 5 cm3 water and warm the mixture. If a gas is evolved you must identify it. Record your observation in Fig. 3.2 including the test for the identification of any gas given off. (ii) Repeat test (b)(i) using solid B in place of solid A. (iii) Carry out the test again replacing solid B with solid C. Test: addition of ammonium chloride and water. Warm and identify any gas given off. solid A solid B solid C Fig. 3.2 [4]
Question paper, page 10
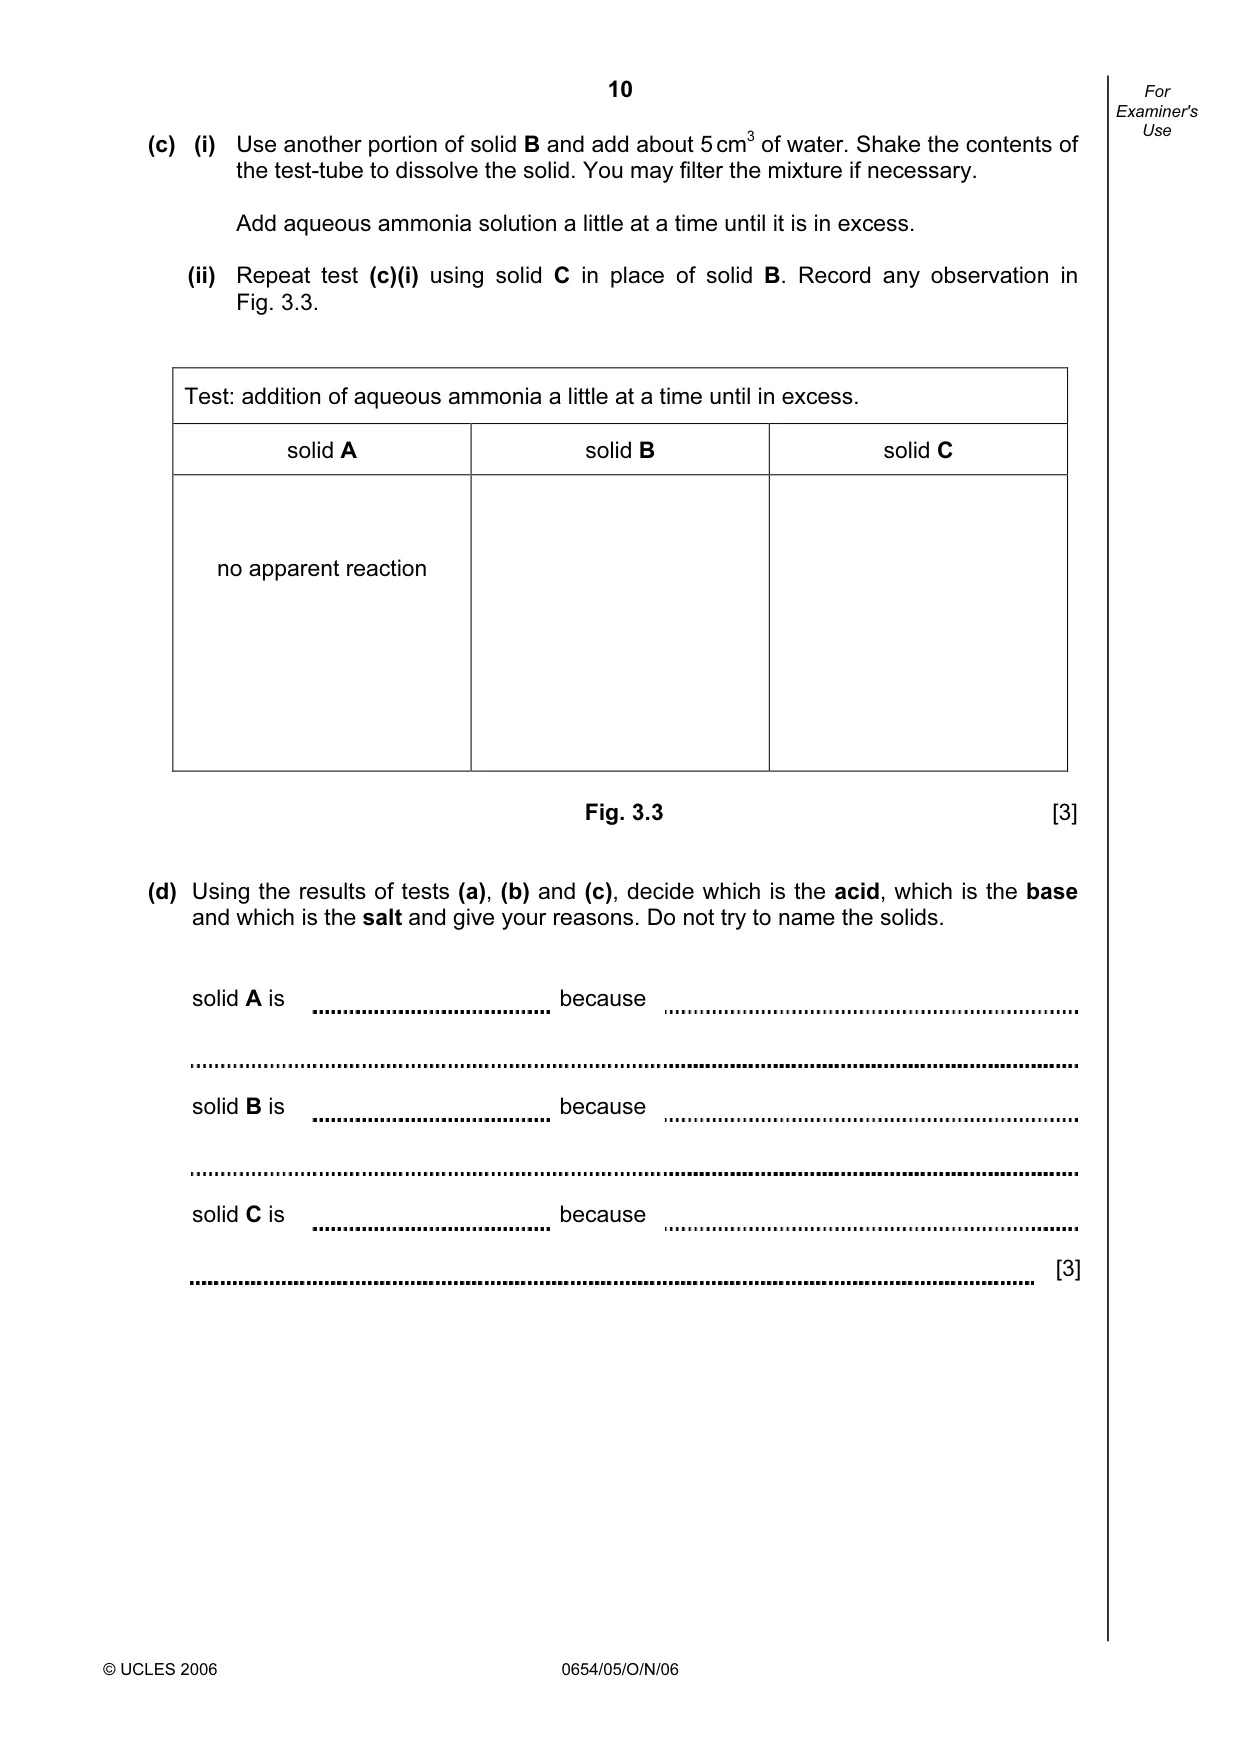
10 © UCLES 2006 0654/05/O/N/06 For Examiner's Use (c) (i) Use another portion of solid B and add about 5 cm3 of water. Shake the contents of the test-tube to dissolve the solid. You may filter the mixture if necessary. Add aqueous ammonia solution a little at a time until it is in excess. (ii) Repeat test (c)(i) using solid C in place of solid B. Record any observation in Fig. 3.3. Test: addition of aqueous ammonia a little at a time until in excess. solid A solid B solid C no apparent reaction Fig. 3.3 [3] (d) Using the results of tests (a), (b) and (c), decide which is the acid, which is the base and which is the salt and give your reasons. Do not try to name the solids. solid A is because solid B is because solid C is because [3]
Question paper, page 11
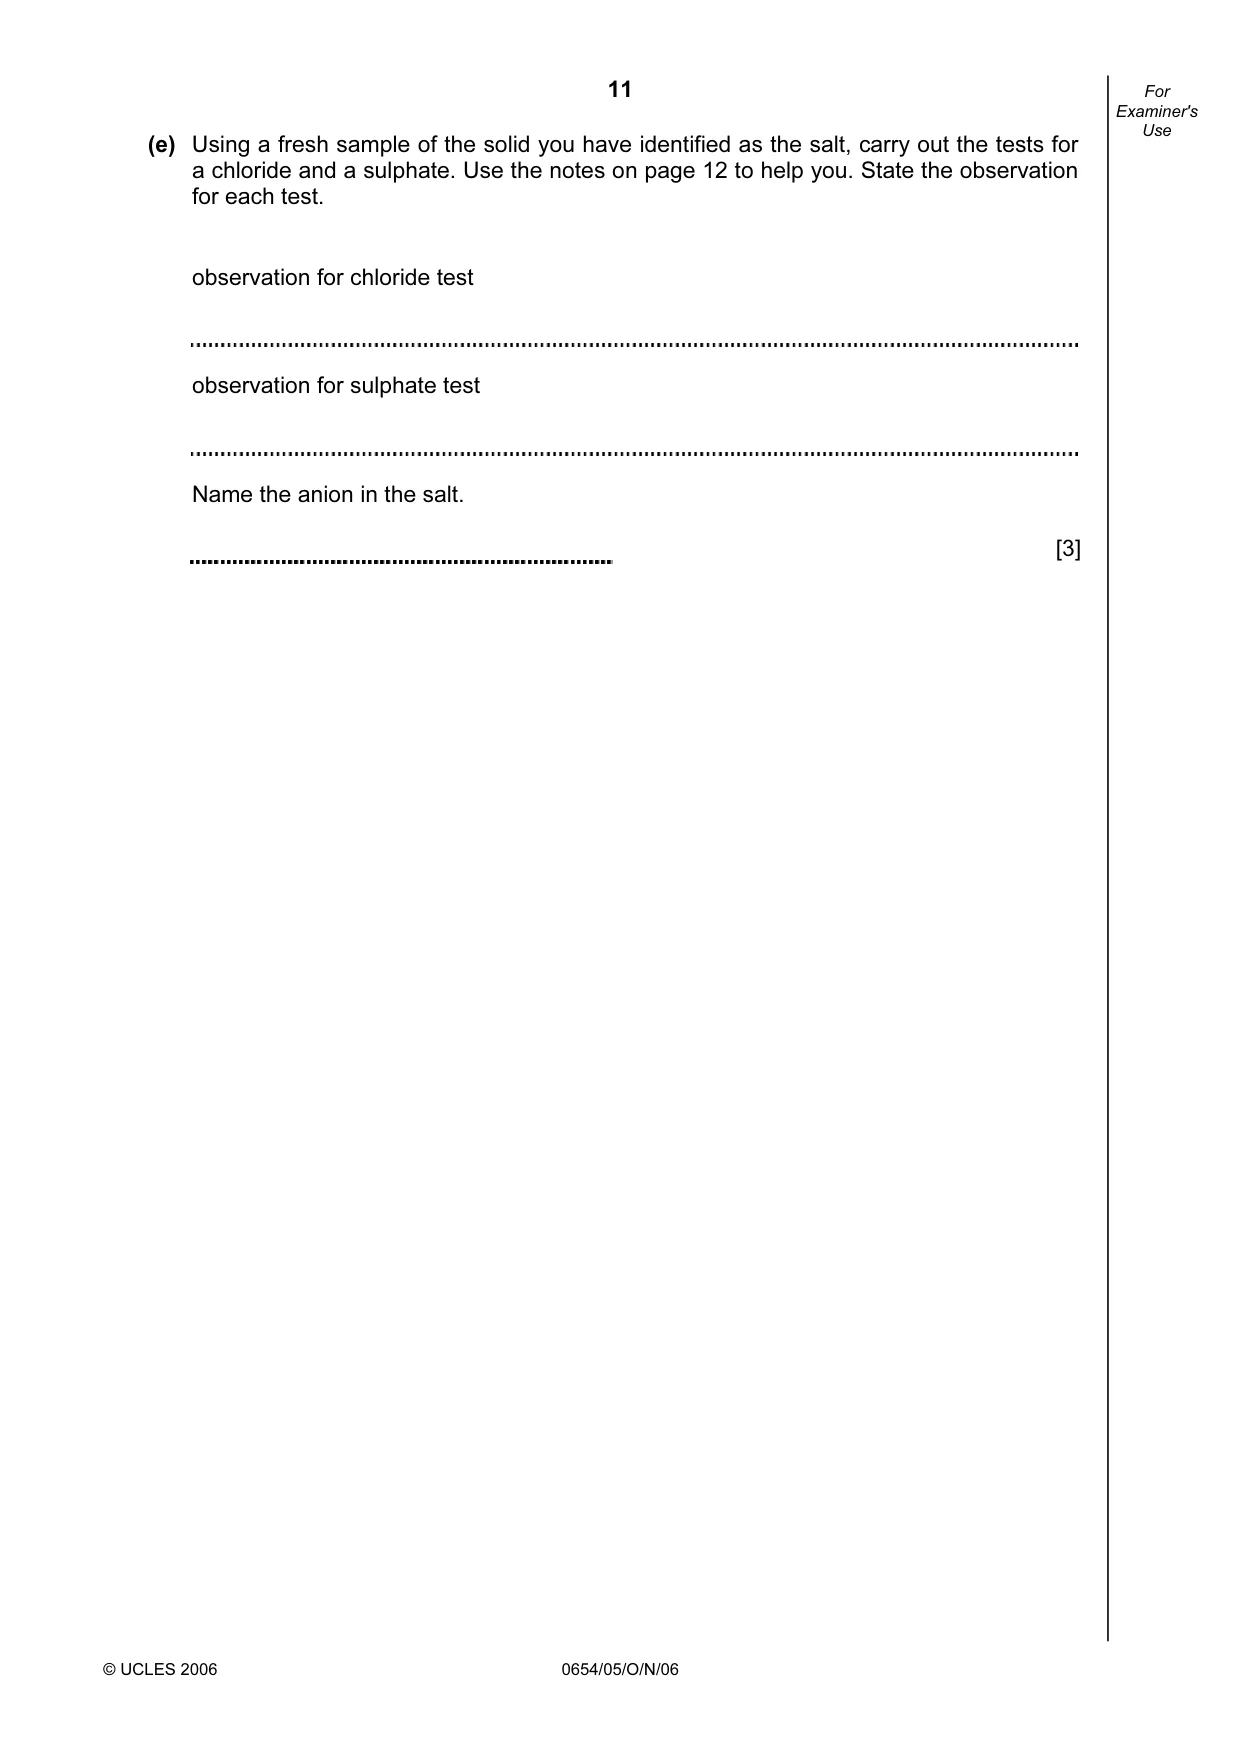
11 © UCLES 2006 0654/05/O/N/06 For Examiner's Use (e) Using a fresh sample of the solid you have identified as the salt, carry out the tests for a chloride and a sulphate. Use the notes on page 12 to help you. State the observation for each test. observation for chloride test observation for sulphate test Name the anion in the salt. [3]
Question paper, page 12
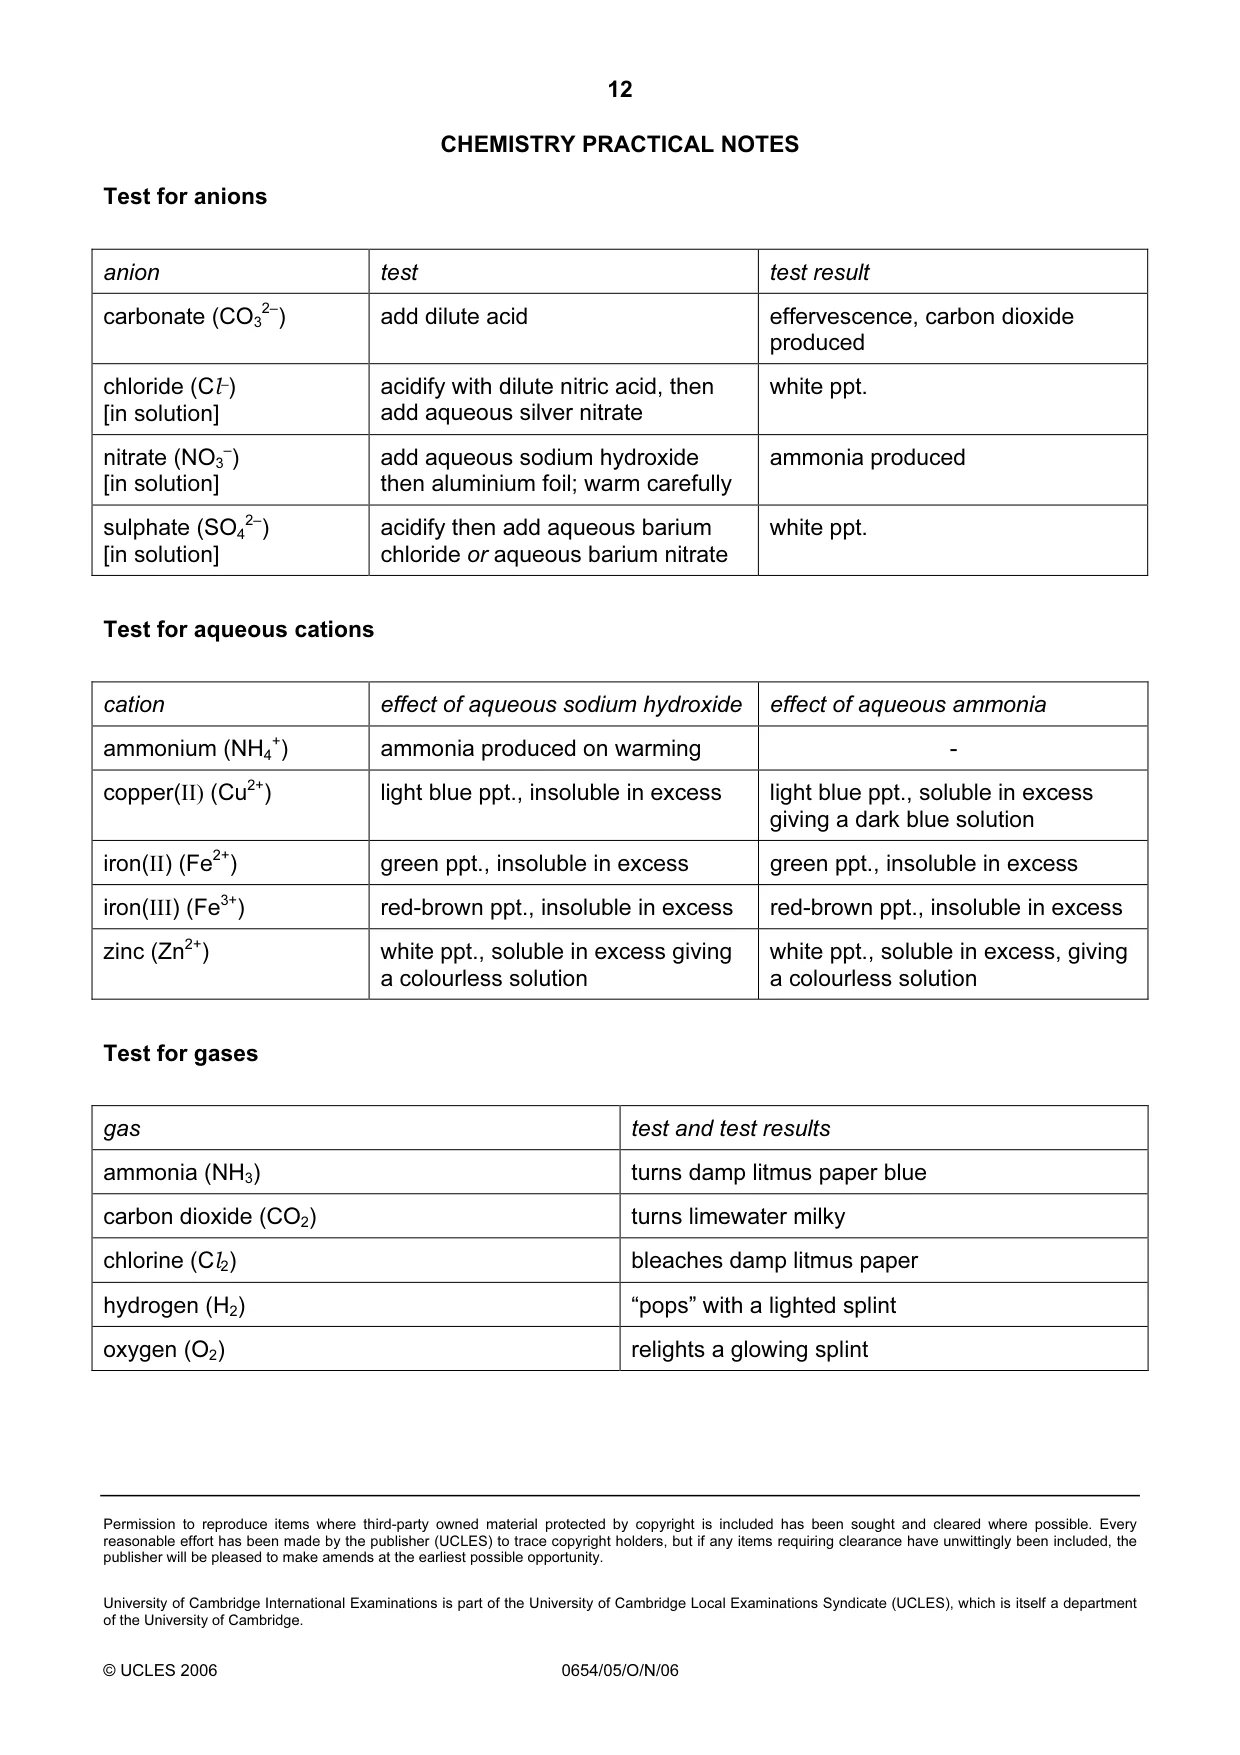
12 Permission to reproduce items where third-party owned material protected by copyright is included has been sought and cleared where possible. Every reasonable effort has been made by the publisher (UCLES) to trace copyright holders, but if any items requiring clearance have unwittingly been included, the publisher will be pleased to make amends at the earliest possible opportunity. University of Cambridge International Examinations is part of the University of Cambridge Local Examinations Syndicate (UCLES), which is itself a department of the University of Cambridge. © UCLES 2006 0654/05/O/N/06 CHEMISTRY PRACTICAL NOTES Test for anions anion test test result carbonate (CO3 2–) add dilute acid effervescence, carbon dioxide produced chloride (Cl–) [in solution] acidify with dilute nitric acid, then add aqueous silver nitrate white ppt. nitrate (NO3 –) [in solution] add aqueous sodium hydroxide then aluminium foil; warm carefully ammonia produced sulphate (SO4 2–) [in solution] acidify then add aqueous barium chloride or aqueous barium nitrate white ppt. Test for aqueous cations cation effect of aqueous sodium hydroxide effect of aqueous ammonia ammonium (NH4 +) ammonia produced on warming - copper(II) (Cu2+) light blue ppt., insoluble in excess light blue ppt., soluble in excess giving a dark blue solution iron(II) (Fe2+) green ppt., insoluble in excess green ppt., insoluble in excess iron(III) (Fe3+) red-brown ppt., insoluble in excess red-brown ppt., insoluble in excess zinc (Zn2+) white ppt., soluble in excess giving a colourless solution white ppt., soluble in excess, giving a colourless solution Test for gases gas test and test results ammonia (NH3) turns damp litmus paper blue carbon dioxide (CO2) turns limewater milky chlorine (Cl2) bleaches damp litmus paper hydrogen (H2) “pops” with a lighted splint oxygen (O2) relights a glowing splint
Mark scheme, page 1
UNIVERSITY OF CAMBRIDGE INTERNATIONAL EXAMINATIONS International General Certificate of Secondary Education MARK SCHEME for the October/November 2006 question paper 0654 CO-ORDINATED SCIENCES 0654/05 Paper 5 - Practical, maximum raw mark 45 This mark scheme is published as an aid to teachers and students, to indicate the requirements of the examination. It shows the basis on which Examiners were instructed to award marks. It does not indicate the details of the discussions that took place at an Examiners’ meeting before marking began. All Examiners are instructed that alternative correct answers and unexpected approaches in candidates’ scripts must be given marks that fairly reflect the relevant knowledge and skills demonstrated. Mark schemes must be read in conjunction with the question papers and the report on the examination. The grade thresholds for various grades are published in the report on the examination for most IGCSE, GCE Advanced Level and Advanced Subsidiary Level syllabuses. • CIE will not enter into discussions or correspondence in connection with these mark schemes. CIE is publishing the mark schemes for the October/November 2006 question papers for most IGCSE, GCE Advanced Level and Advanced Subsidiary Level syllabuses and some Ordinary Level syllabuses. www.XtremePapers.com
Mark scheme, page 2
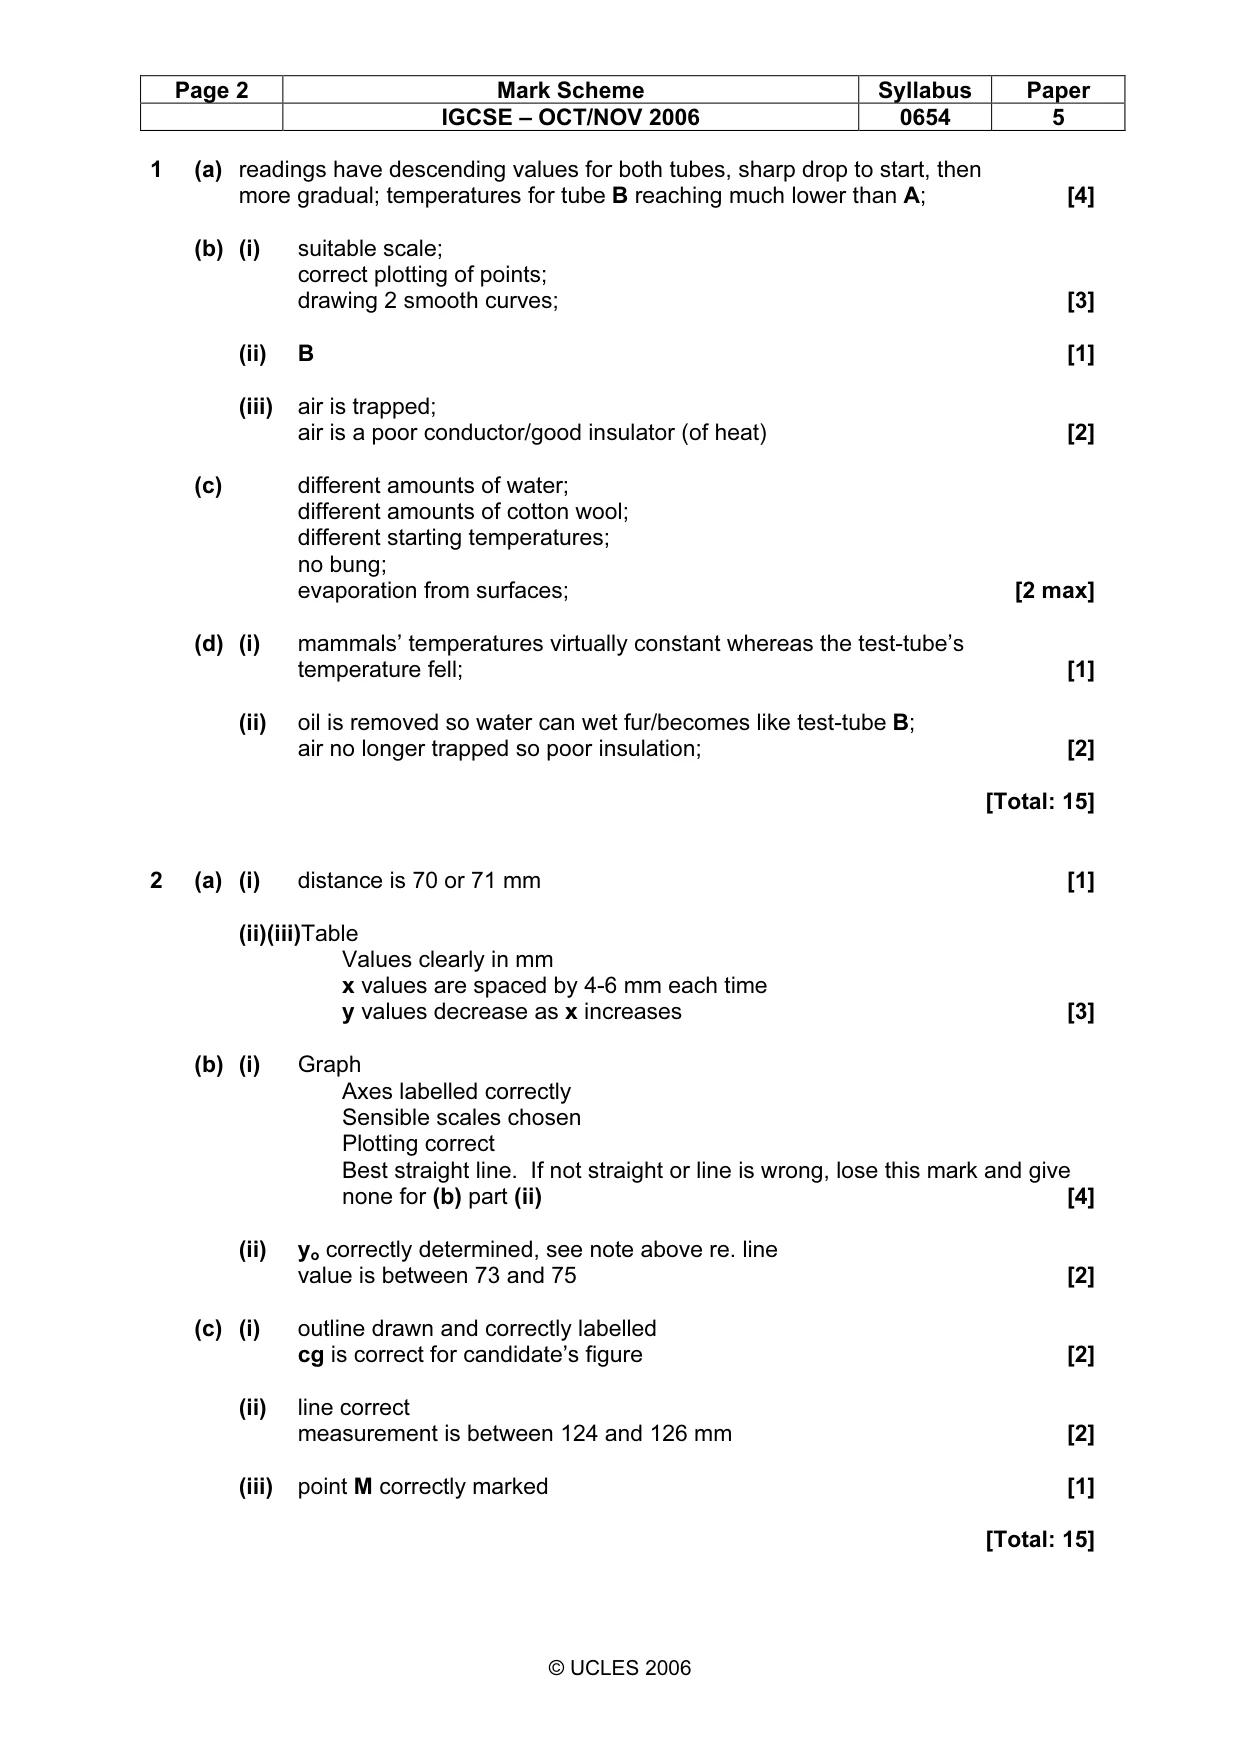
Page 2 Mark Scheme Syllabus Paper IGCSE – OCT/NOV 2006 0654 5 © UCLES 2006 1 (a) readings have descending values for both tubes, sharp drop to start, then more gradual; temperatures for tube B reaching much lower than A; [4] (b) (i) suitable scale; correct plotting of points; drawing 2 smooth curves; [3] (ii) B [1] (iii) air is trapped; air is a poor conductor/good insulator (of heat) [2] (c) different amounts of water; different amounts of cotton wool; different starting temperatures; no bung; evaporation from surfaces; [2 max] (d) (i) mammals’ temperatures virtually constant whereas the test-tube’s temperature fell; [1] (ii) oil is removed so water can wet fur/becomes like test-tube B; air no longer trapped so poor insulation; [2] [Total: 15] 2 (a) (i) distance is 70 or 71 mm [1] (ii)(iii)Table Values clearly in mm x values are spaced by 4-6 mm each time y values decrease as x increases [3] (b) (i) Graph Axes labelled correctly Sensible scales chosen Plotting correct Best straight line. If not straight or line is wrong, lose this mark and give none for (b) part (ii) [4] (ii) yo correctly determined, see note above re. line value is between 73 and 75 [2] (c) (i) outline drawn and correctly labelled cg is correct for candidate’s figure [2] (ii) line correct measurement is between 124 and 126 mm [2] (iii) point M correctly marked [1] [Total: 15]
Mark scheme, page 3
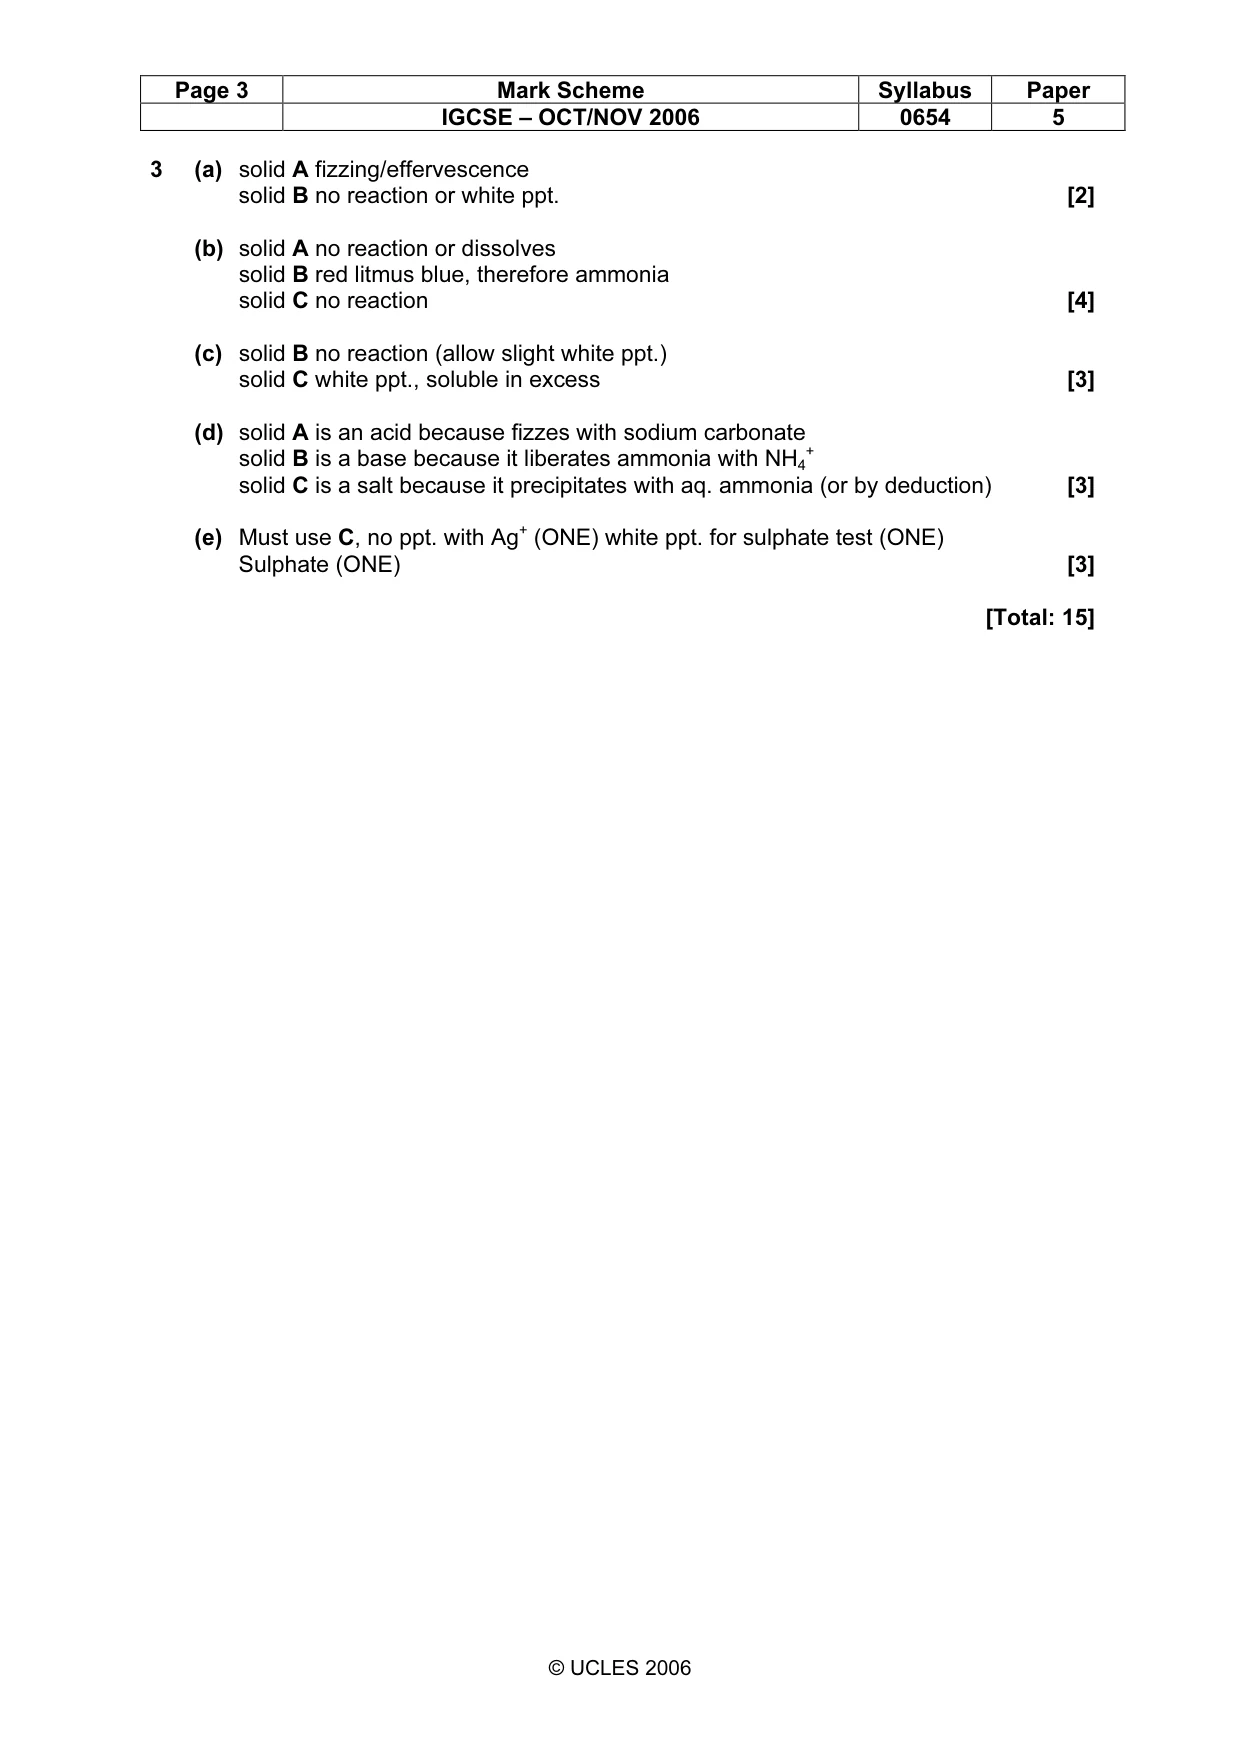
Page 3 Mark Scheme Syllabus Paper IGCSE – OCT/NOV 2006 0654 5 © UCLES 2006 3 (a) solid A fizzing/effervescence solid B no reaction or white ppt. [2] (b) solid A no reaction or dissolves solid B red litmus blue, therefore ammonia solid C no reaction [4] (c) solid B no reaction (allow slight white ppt.) solid C white ppt., soluble in excess [3] (d) solid A is an acid because fizzes with sodium carbonate solid B is a base because it liberates ammonia with NH4 + solid C is a salt because it precipitates with aq. ammonia (or by deduction) [3] (e) Must use C, no ppt. with Ag+ (ONE) white ppt. for sulphate test (ONE) Sulphate (ONE) [3] [Total: 15]
What you needed in this session
Cambridge’s own grade thresholds for 2006 Oct/Nov, Paper 5 · Variant 1. A higher threshold means an easier paper — the bar moves with how the cohort did.