Cambridge IGCSE Sciences - Co-ordinated (Double) 0654 — 2004 Oct/Nov Paper 5 · Variant 1
0654/51/O/N/04
The question paper and its mark scheme, free to read here and free to download. This is Cambridge’s own paper, exactly as it was sat.
Question paper12 pages


Mark scheme5 pages
Answers below. Sit the paper first if you are practising.
Paper as text
Question paper, page 1
This document consists of 10 printed pages and 2 blank pages. SP (SLM/GR) S65711/3 © UCLES 2004 [Turn over UNIVERSITY OF CAMBRIDGE INTERNATIONAL EXAMINATIONS International General Certificate of Secondary Education CO-ORDINATED SCIENCES 0654/05 Paper 5 Practical Test October/November 2004 2 hours Candidates answer on the Question Paper. Additional Materials: As listed in Instructions to Supervisors READ THESE INSTRUCTIONS FIRST Write your Centre number, candidate number and name on all the work you hand in. Write in dark blue or black pen in the spaces provided on the Question Paper. You may use a soft pencil for any diagrams, graphs or rough working. Do not use staples, paper clips, highlighters, glue or correction fluid. Answer all questions. At the end of the examination, fasten all your work securely together. The number of marks is given in brackets [ ] at the end of each question or part question. Chemistry practical notes for this paper are printed on page 12. Centre Number Candidate Number Name If you have been given a label, look at the details. If any details are incorrect or missing, please fill in your correct details in the space given at the top of this page. Stick your personal label here, if provided. For Examiner’s Use 1 2 3 Total www.XtremePapers.com
Question paper, page 2
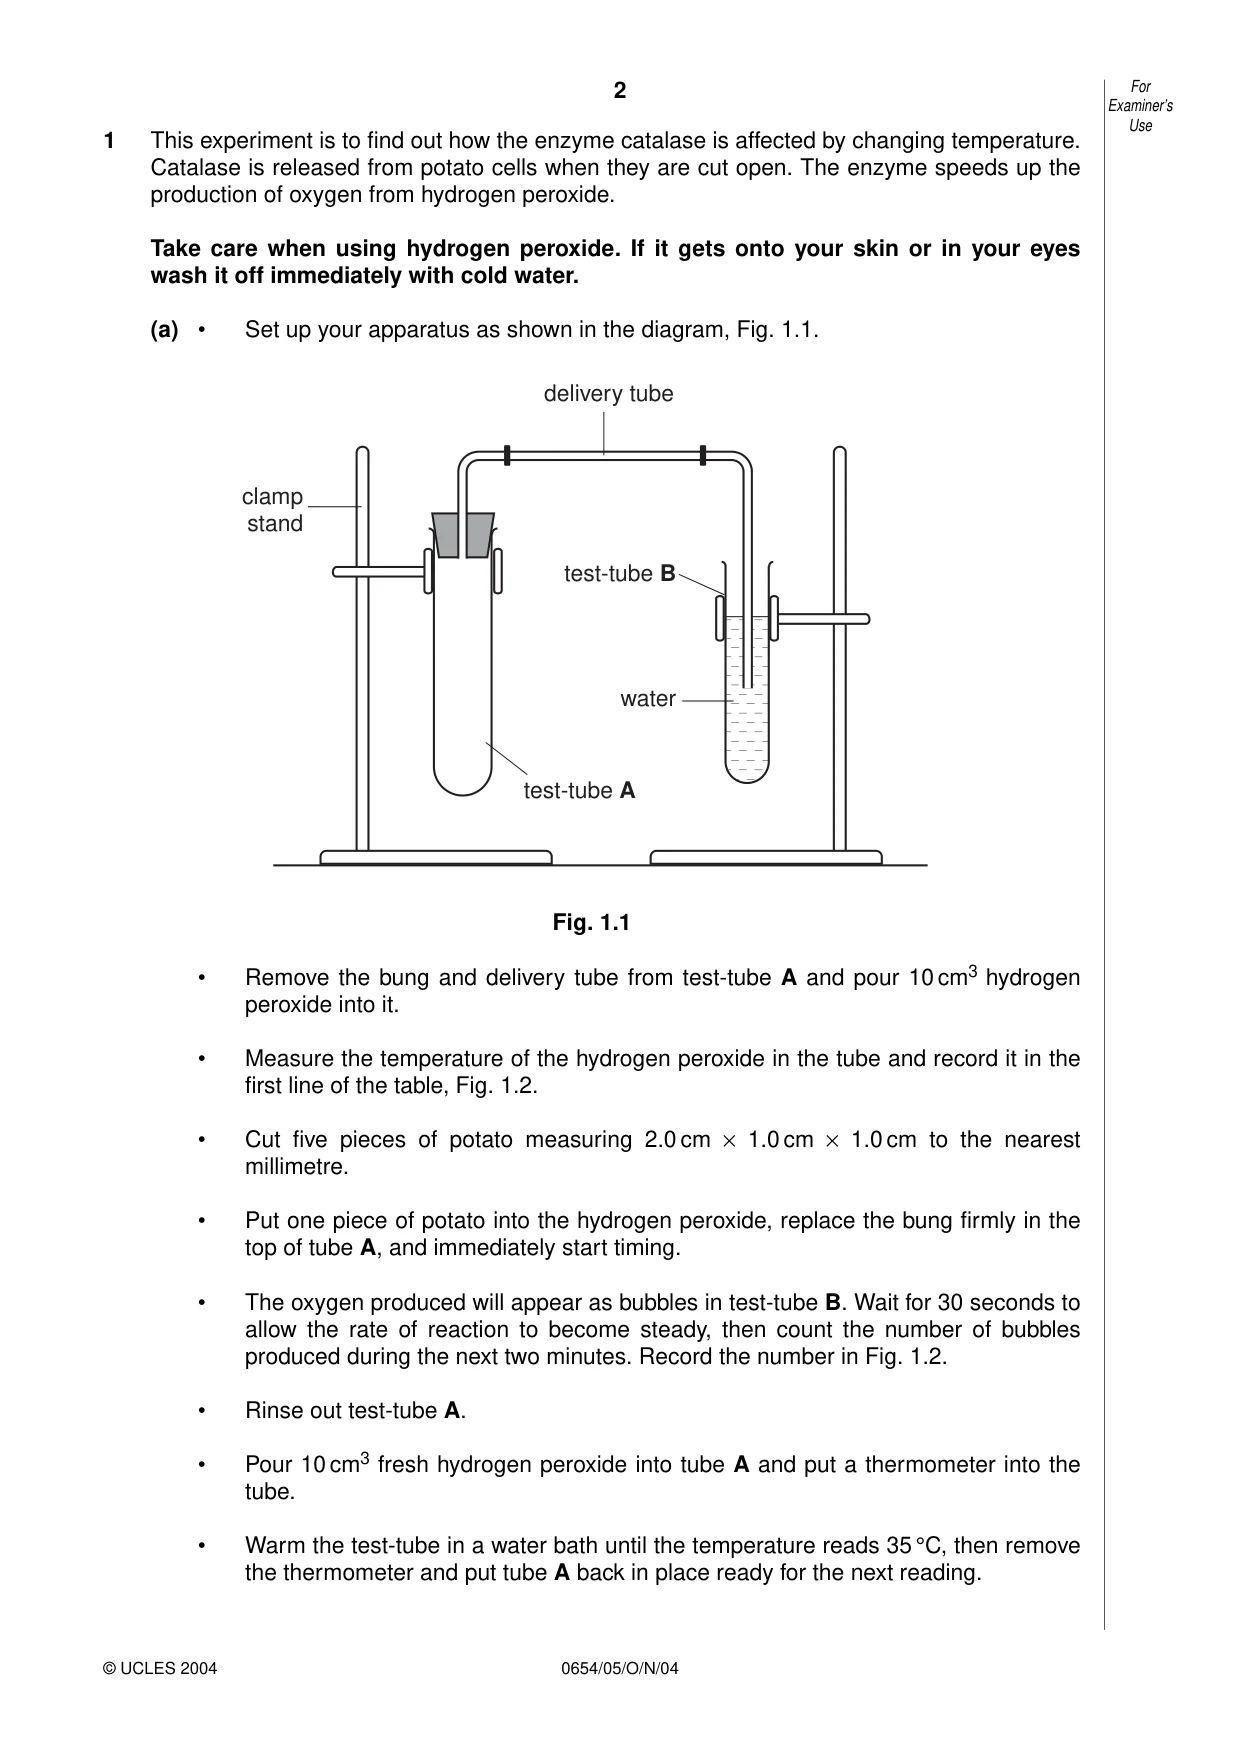
2 0654/05/O/N/04 1 This experiment is to find out how the enzyme catalase is affected by changing temperature. Catalase is released from potato cells when they are cut open. The enzyme speeds up the production of oxygen from hydrogen peroxide. Take care when using hydrogen peroxide. If it gets onto your skin or in your eyes wash it off immediately with cold water. (a) • Set up your apparatus as shown in the diagram, Fig. 1.1. Fig. 1.1 • Remove the bung and delivery tube from test-tube A and pour 10 cm3 hydrogen peroxide into it. • Measure the temperature of the hydrogen peroxide in the tube and record it in the first line of the table, Fig. 1.2. • Cut five pieces of potato measuring 2.0 cm × 1.0 cm × 1.0 cm to the nearest millimetre. • Put one piece of potato into the hydrogen peroxide, replace the bung firmly in the top of tube A, and immediately start timing. • The oxygen produced will appear as bubbles in test-tube B. Wait for 30 seconds to allow the rate of reaction to become steady, then count the number of bubbles produced during the next two minutes. Record the number in Fig. 1.2. • Rinse out test-tube A. • Pour 10 cm3 fresh hydrogen peroxide into tube A and put a thermometer into the tube. • Warm the test-tube in a water bath until the temperature reads 35 °C, then remove the thermometer and put tube A back in place ready for the next reading. clamp stand test-tube A test-tube B water delivery tube For Examiner’s Use © UCLES 2004
Question paper, page 3
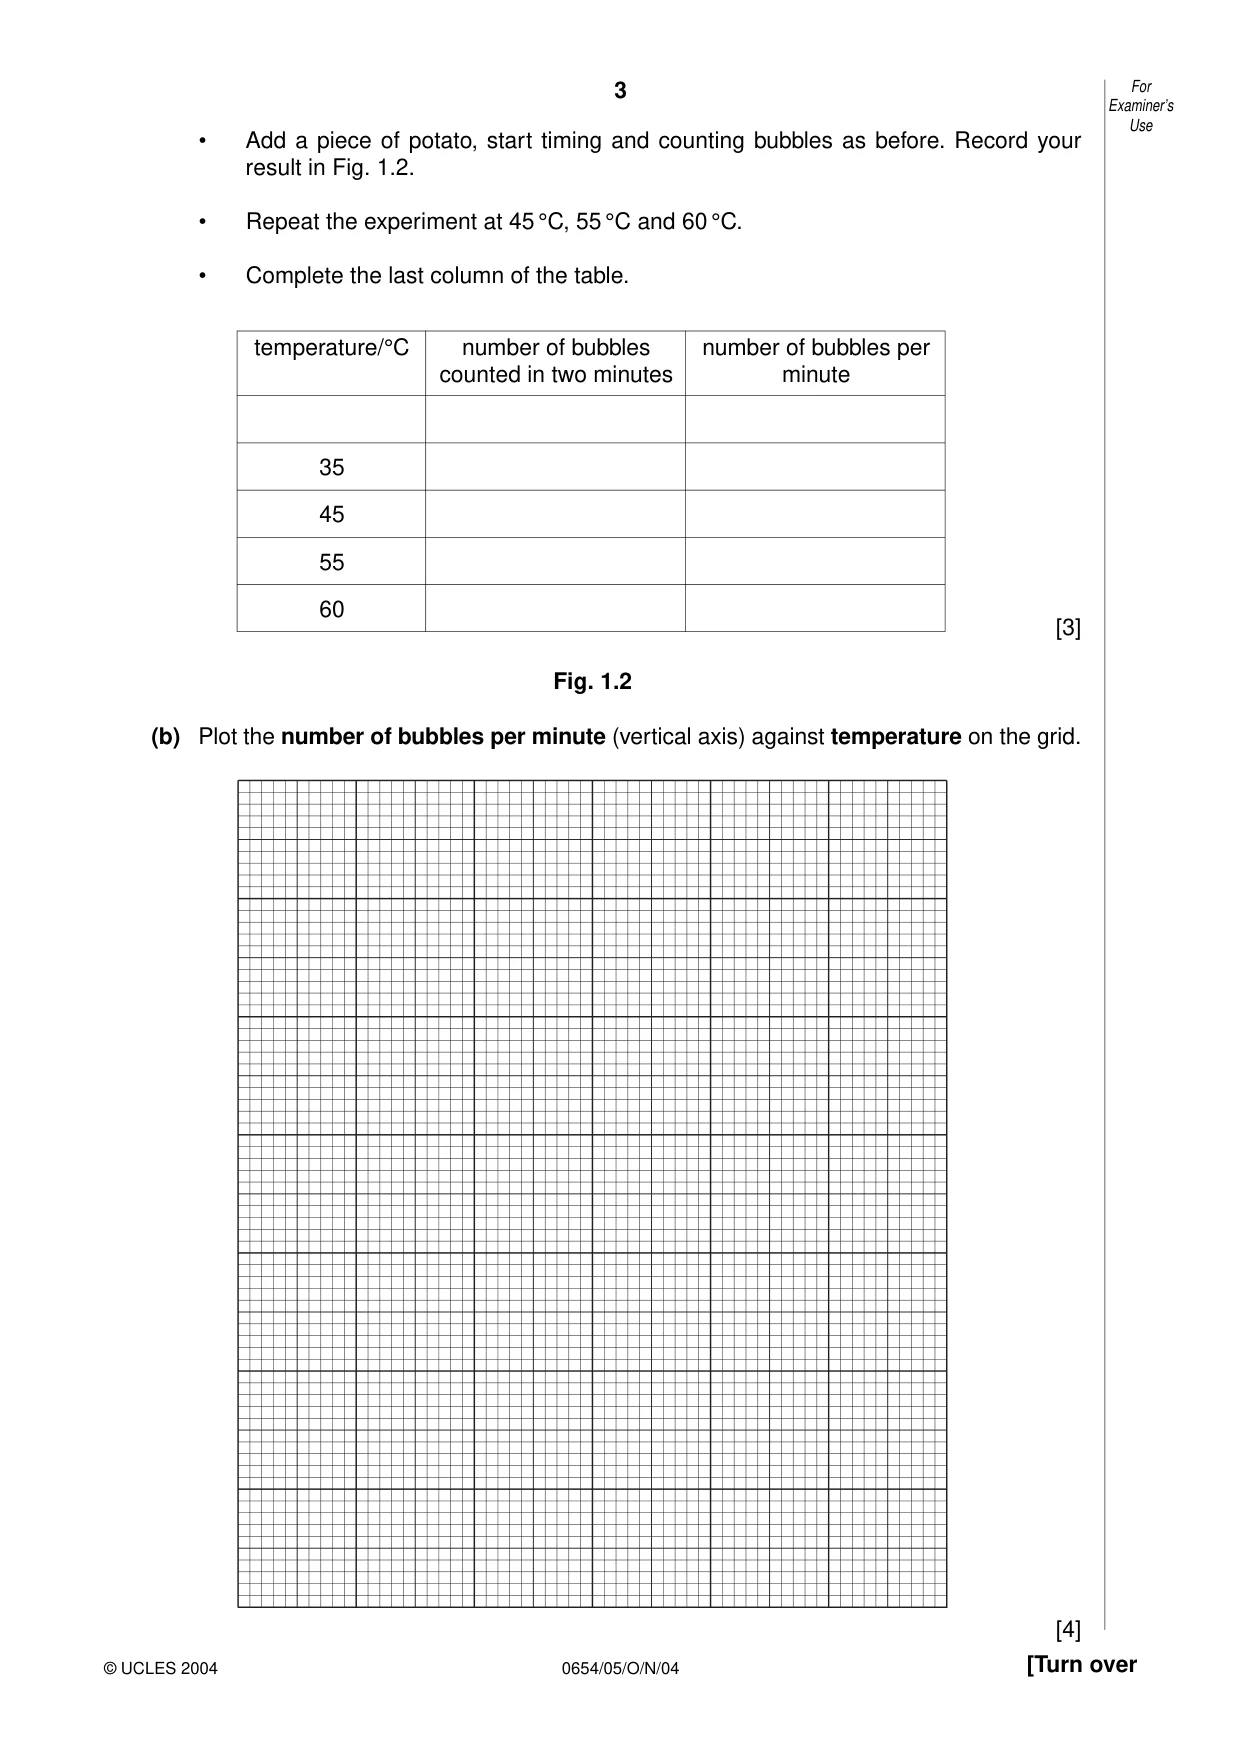
3 0654/05/O/N/04 [Turn over • Add a piece of potato, start timing and counting bubbles as before. Record your result in Fig. 1.2. • Repeat the experiment at 45 °C, 55 °C and 60 °C. • Complete the last column of the table. [3] Fig. 1.2 (b) Plot the number of bubbles per minute (vertical axis) against temperature on the grid. [4] For Examiner’s Use © UCLES 2004 temperature/°C number of bubbles number of bubbles per counted in two minutes minute 35 45 55 60
Question paper, page 4
4 0654/05/O/N/04 (c) Explain the shape of your graph using your knowledge of enzyme action. … … … …[2] (d) (i) State one way you could improve the experiment to make it more accurate. … … (ii) Explain why your improvement would work. … …[2] (e) Describe how the apparatus could be used to find out how the surface area of potato affects the rate of decomposition of hydrogen peroxide by catalase. … … … … … … … … … … … … … … … … …[4] For Examiner’s Use © UCLES 2004
Question paper, page 6
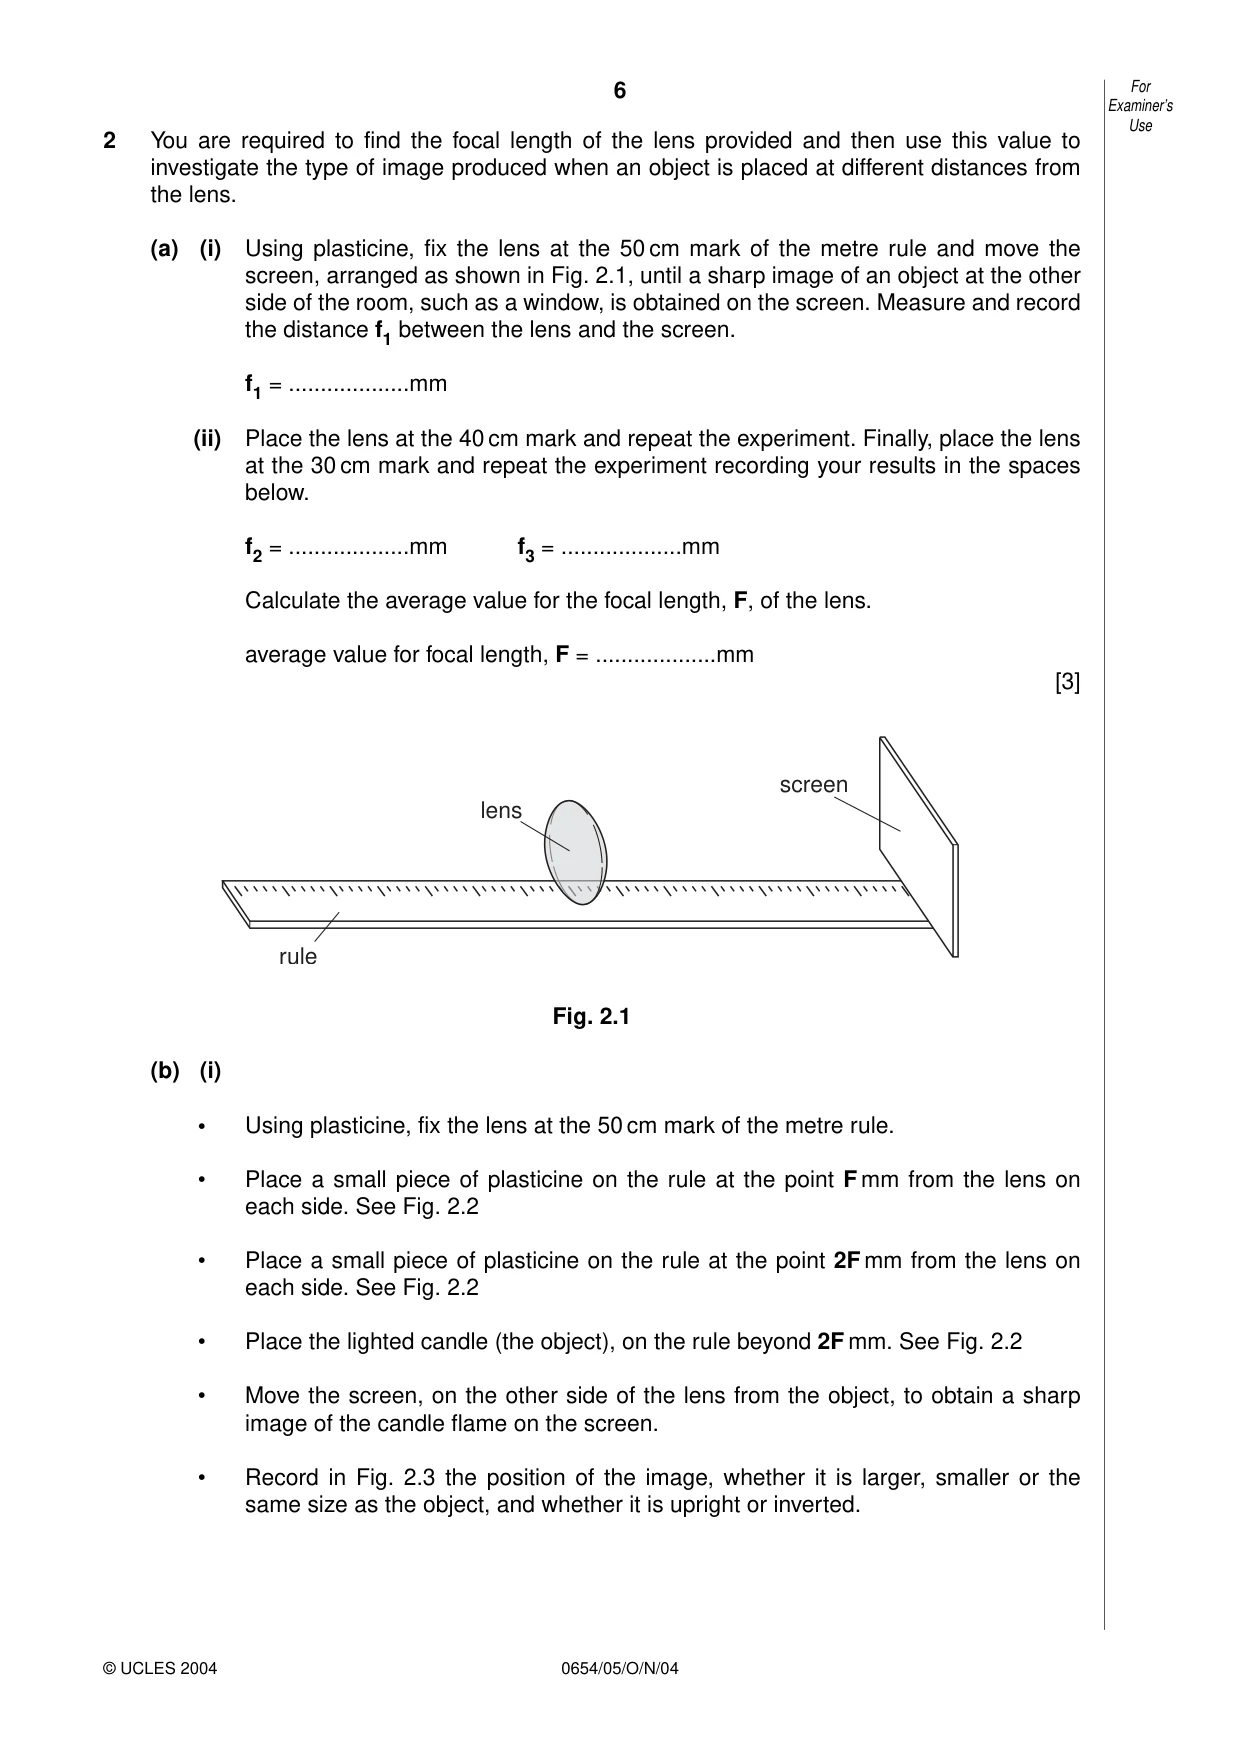
6 0654/05/O/N/04 2 You are required to find the focal length of the lens provided and then use this value to investigate the type of image produced when an object is placed at different distances from the lens. (a) (i) Using plasticine, fix the lens at the 50 cm mark of the metre rule and move the screen, arranged as shown in Fig. 2.1, until a sharp image of an object at the other side of the room, such as a window, is obtained on the screen. Measure and record the distance f1 between the lens and the screen. f1 = …mm (ii) Place the lens at the 40 cm mark and repeat the experiment. Finally, place the lens at the 30 cm mark and repeat the experiment recording your results in the spaces below. f2 = …mm f3 = …mm Calculate the average value for the focal length, F, of the lens. average value for focal length, F = …mm [3] Fig. 2.1 (b) (i) • Using plasticine, fix the lens at the 50 cm mark of the metre rule. • Place a small piece of plasticine on the rule at the point F mm from the lens on each side. See Fig. 2.2 • Place a small piece of plasticine on the rule at the point 2F mm from the lens on each side. See Fig. 2.2 • Place the lighted candle (the object), on the rule beyond 2F mm. See Fig. 2.2 • Move the screen, on the other side of the lens from the object, to obtain a sharp image of the candle flame on the screen. • Record in Fig. 2.3 the position of the image, whether it is larger, smaller or the same size as the object, and whether it is upright or inverted. lens rule screen For Examiner’s Use © UCLES 2004
Question paper, page 7
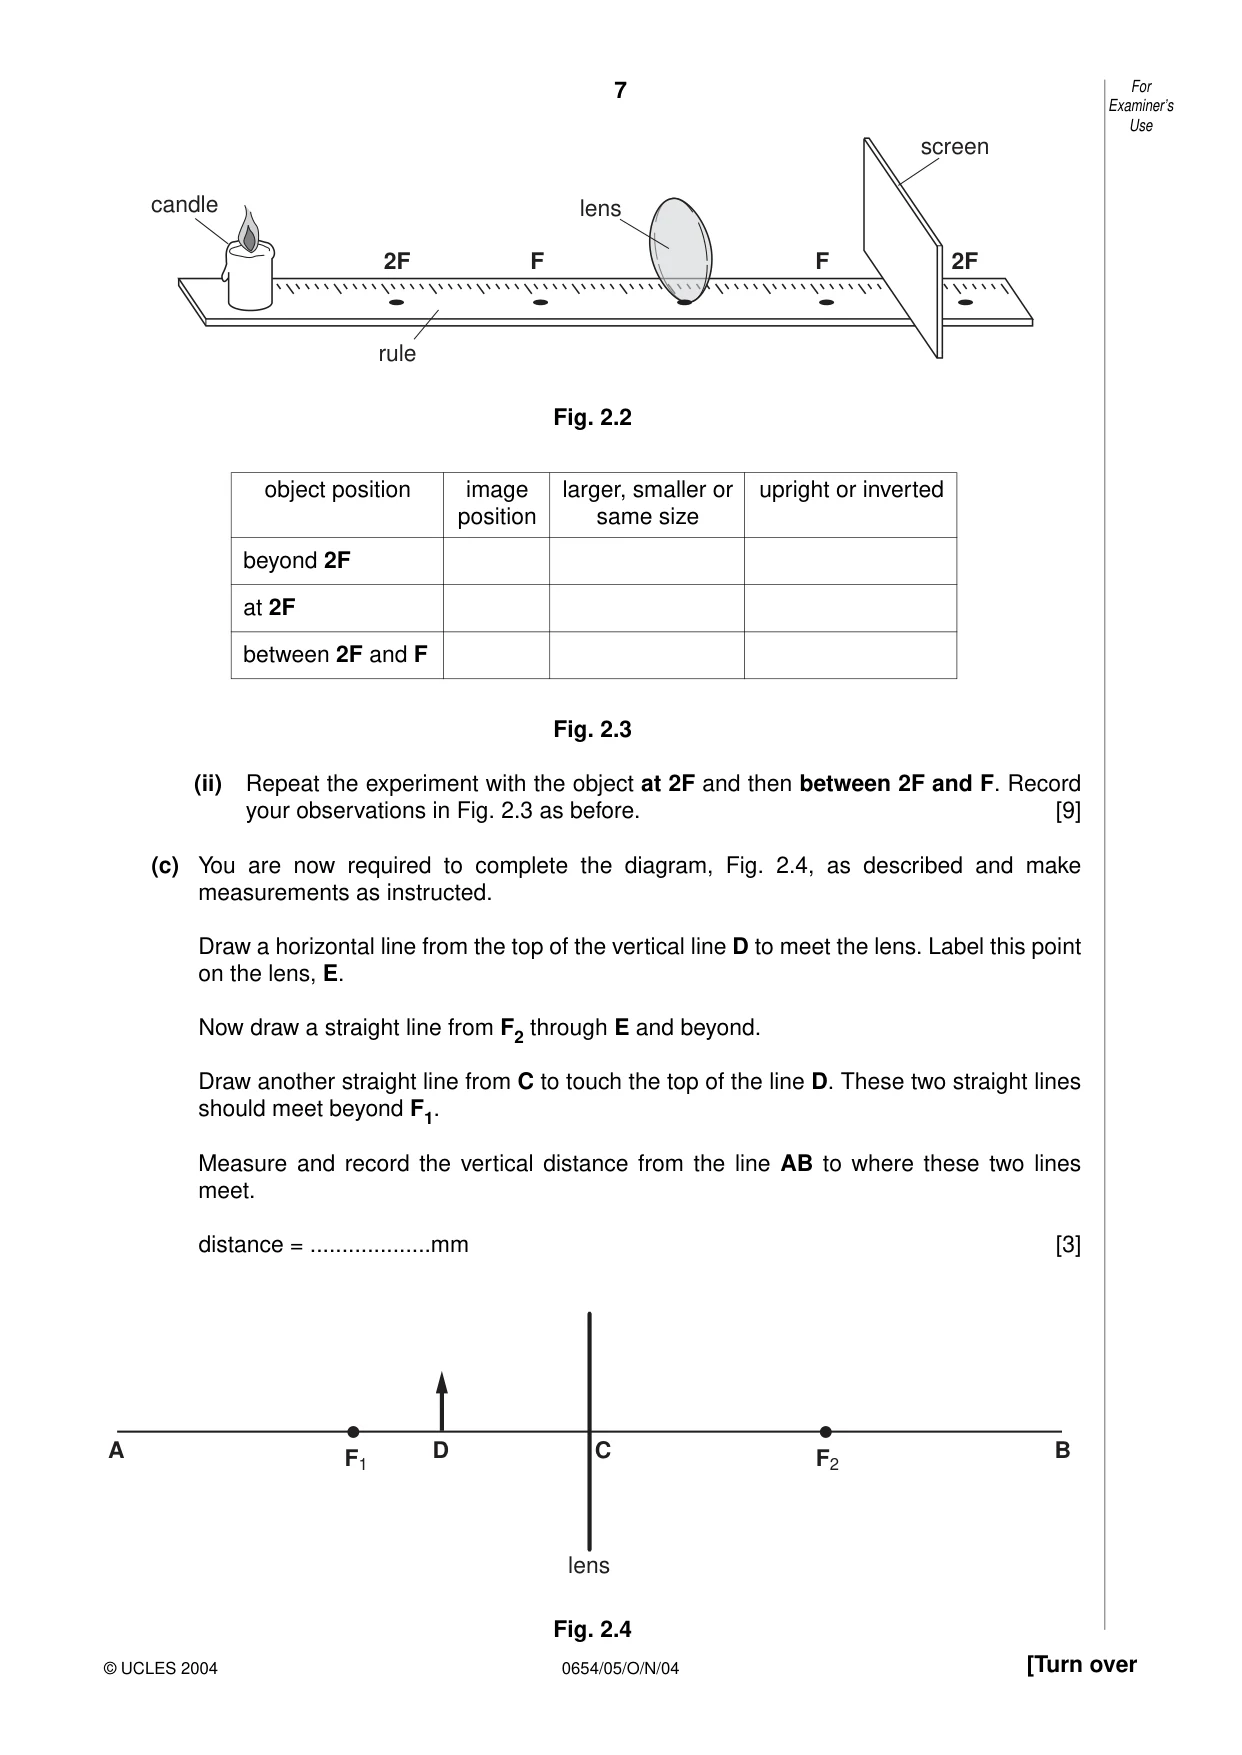
7 0654/05/O/N/04 [Turn over For Examiner’s Use Fig. 2.2 Fig. 2.3 (ii) Repeat the experiment with the object at 2F and then between 2F and F. Record your observations in Fig. 2.3 as before. [9] (c) You are now required to complete the diagram, Fig. 2.4, as described and make measurements as instructed. Draw a horizontal line from the top of the vertical line D to meet the lens. Label this point on the lens, E. Now draw a straight line from F2 through E and beyond. Draw another straight line from C to touch the top of the line D. These two straight lines should meet beyond F1. Measure and record the vertical distance from the line AB to where these two lines meet. distance = …mm [3] Fig. 2.4 F2 F1 A B C D lens lens rule screen candle 2F F F 2F © UCLES 2004 object position image larger, smaller or upright or inverted position same size beyond 2F at 2F between 2F and F
Question paper, page 8
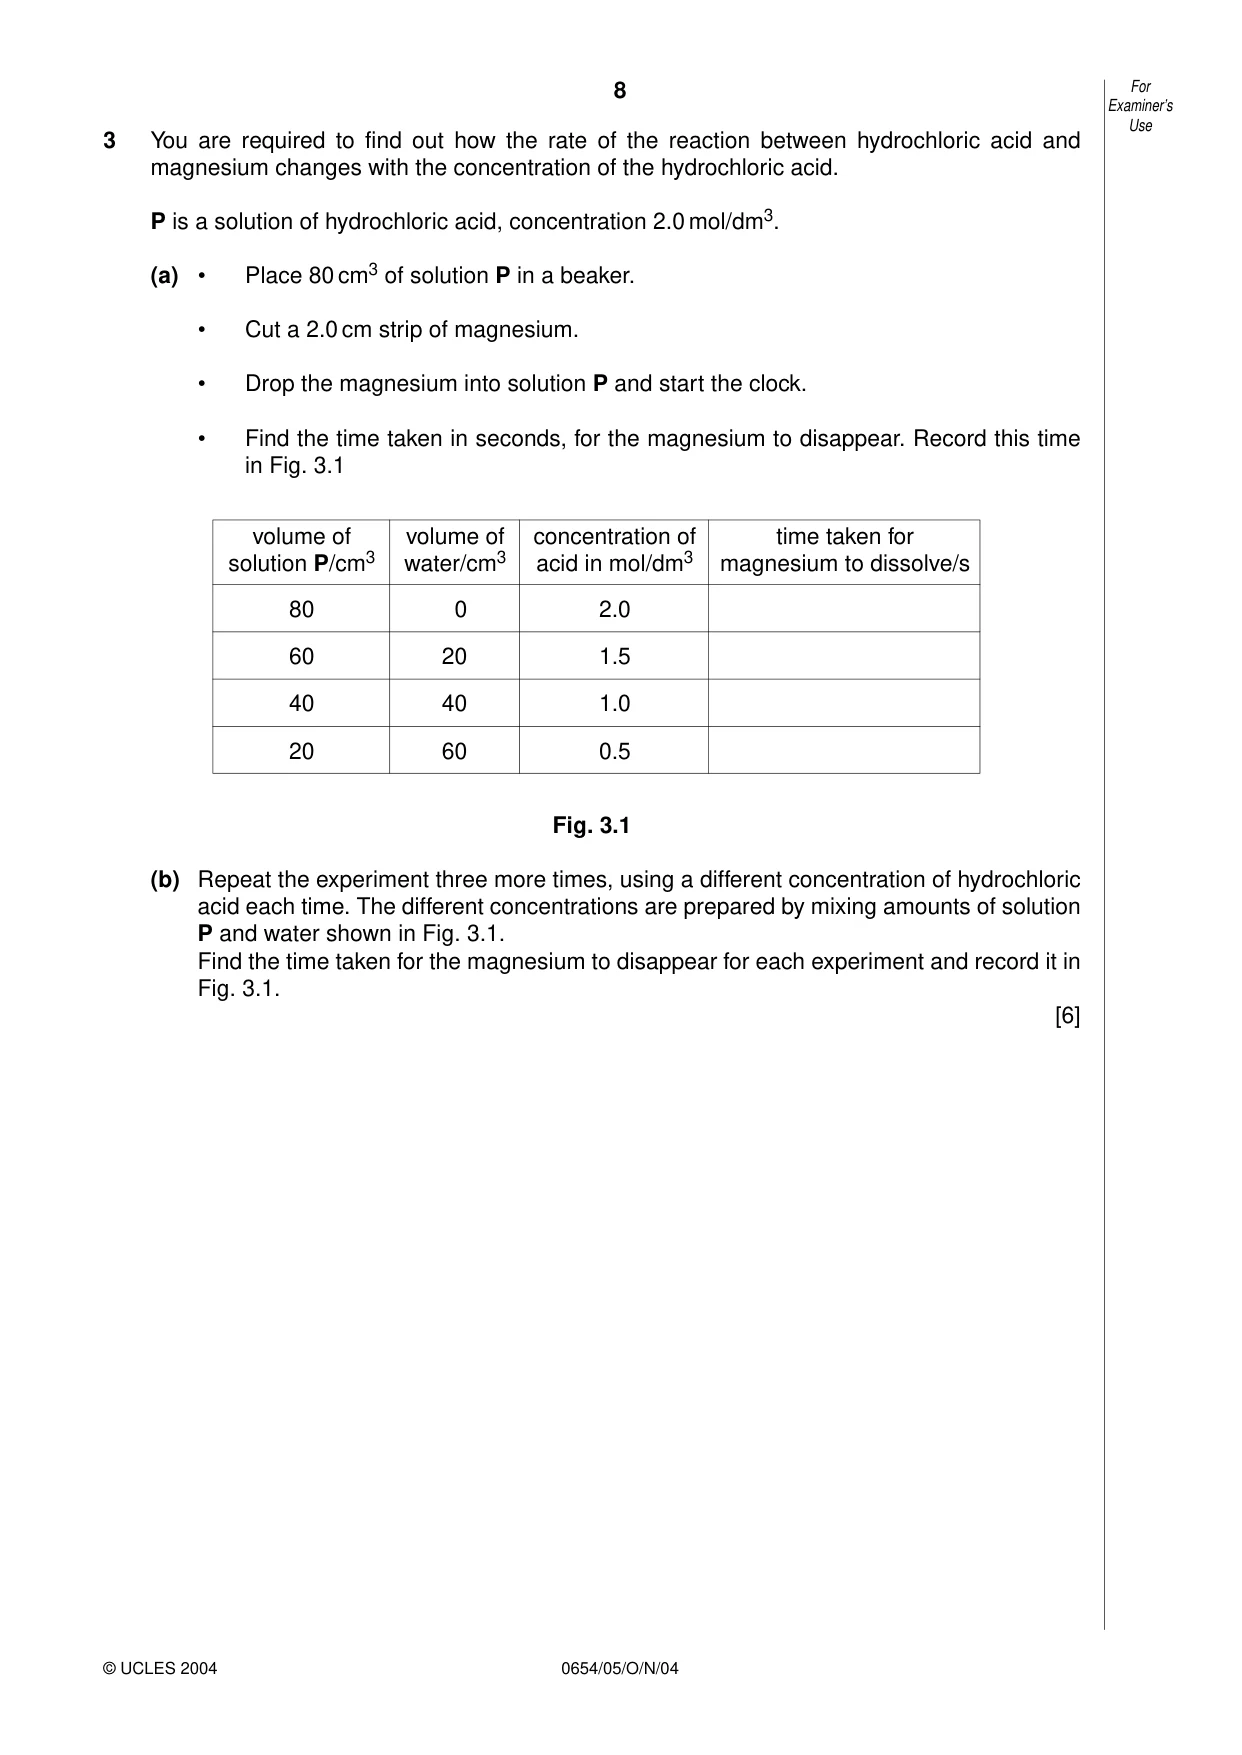
8 0654/05/O/N/04 3 You are required to find out how the rate of the reaction between hydrochloric acid and magnesium changes with the concentration of the hydrochloric acid. P is a solution of hydrochloric acid, concentration 2.0 mol/dm3. (a) • Place 80 cm3 of solution P in a beaker. • Cut a 2.0 cm strip of magnesium. • Drop the magnesium into solution P and start the clock. • Find the time taken in seconds, for the magnesium to disappear. Record this time in Fig. 3.1 Fig. 3.1 (b) Repeat the experiment three more times, using a different concentration of hydrochloric acid each time. The different concentrations are prepared by mixing amounts of solution P and water shown in Fig. 3.1. Find the time taken for the magnesium to disappear for each experiment and record it in Fig. 3.1. [6] For Examiner’s Use © UCLES 2004 volume of volume of concentration of time taken for solution P/cm3 water/cm3 acid in mol/dm3 magnesium to dissolve/s 80 0 2.0 60 20 1.5 40 40 1.0 20 60 0.5
Question paper, page 9
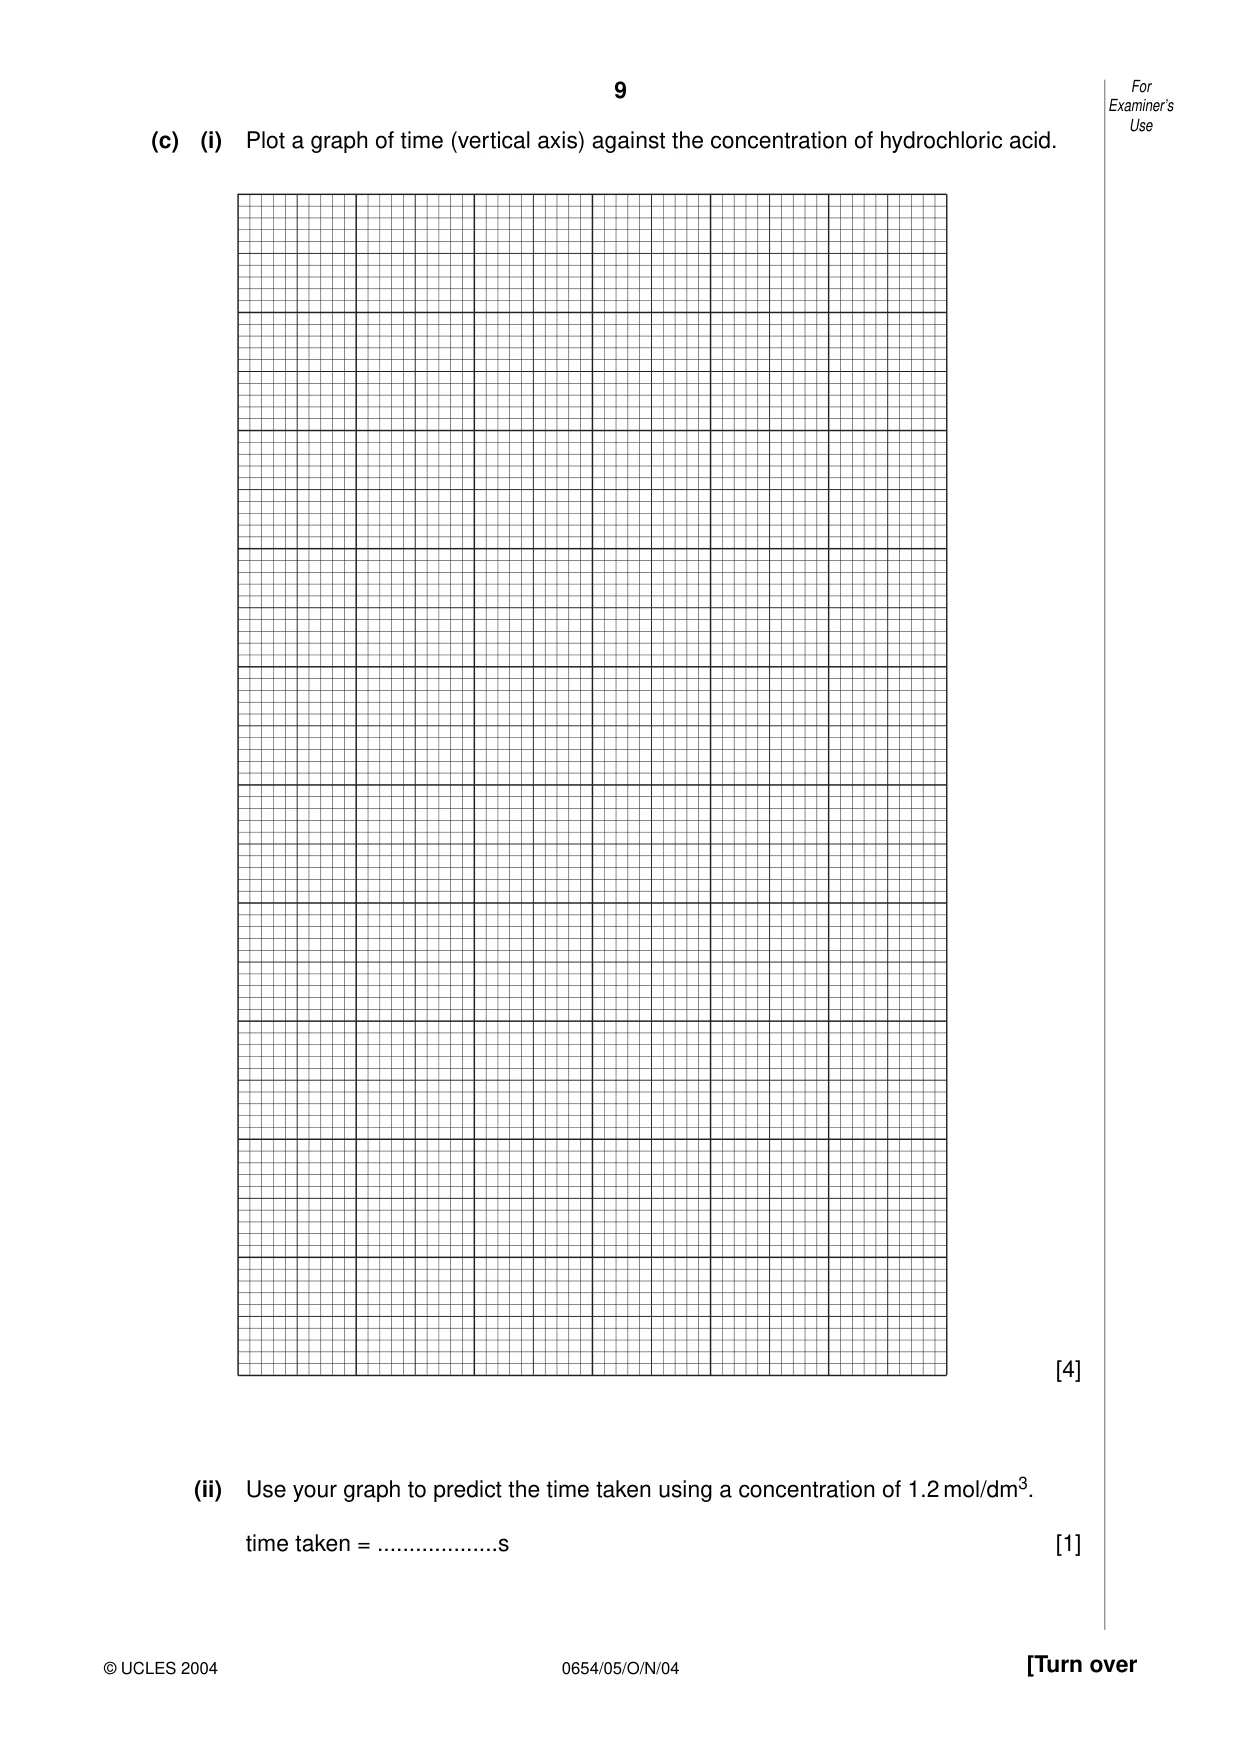
9 0654/05/O/N/04 [Turn over (c) (i) Plot a graph of time (vertical axis) against the concentration of hydrochloric acid. [4] (ii) Use your graph to predict the time taken using a concentration of 1.2 mol/dm3. time taken = …s [1] For Examiner’s Use © UCLES 2004
Question paper, page 10
10 0654/05/O/N/04 (d) Use your graph to describe the relationship between the concentration of acid and the rate of reaction. … …[1] (e) A student read in a book that 0.1 g of magnesium produces 100 cm3 of hydrogen gas when reacted with hydrochloric acid. Describe an experiment you would carry out to test this statement. Draw a diagram of the apparatus that you would use. … … … … … [3] For Examiner’s Use © UCLES 2004
Question paper, page 12
12 0654/05/O/N/04 CHEMISTRY PRACTICAL NOTES © UCLES 2004 anion test add dilute acid acidify with dilute nitric acid, then add aqueous silver nitrate add aqueous sodium hydroxide, then aluminium foil; warm carefully acidify, then add aqueous barium chloride or aqueous barium nitrate test result effervescence, carbon dioxide produced white ppt. ammonia produced white ppt. carbonate (CO32–) chloride (Cl –) [in solution] nitrate (NO3–) [in solution] sulphate (SO42–) [in solution] Test for anions Test for aqueous cations Test for gases cation ammonium (NH4 +) zinc (Zn2+) copper(II) (Cu2+) iron(II) (Fe2+) iron(III) (Fe3+) effect of aqueous sodium hydroxide ammonia produced on warming light blue ppt., insoluble in excess green ppt., insoluble in excess red-brown ppt., insoluble in excess white ppt., soluble in excess, giving a colourless solution white ppt., soluble in excess, giving a colourless solution effect of aqueous ammonia – light blue ppt., soluble in excess, giving a dark blue solution green ppt., insoluble in excess red-brown ppt., insoluble in excess gas test and test result turns damp litmus paper blue turns lime water milky bleaches damp litmus paper ‘pops’ with a lighted splint relights a glowing splint ammonia (NH3) carbon dioxide (CO2) chlorine (Cl 2) hydrogen (H2) oxygen (O2) University of Cambridge International Examinations is part of the University of Cambridge Local Examinations Syndicate (UCLES) which is itself a department of the University of Cambridge.
Mark scheme, page 1
UNIVERSITY OF CAMBRIDGE INTERNATIONAL EXAMINATIONS International General Certificate of Secondary Education MARK SCHEME for the NOVEMBER 2004 question paper 0654 CO-ORDINATED SCIENCES 0654/05 Paper 5 (Practical Test), maximum raw mark 45 This mark scheme is published as an aid to teachers and students, to indicate the requirements of the examination. It shows the basis on which Examiners were initially instructed to award marks. It does not indicate the details of the discussions that took place at an Examiners’ meeting before marking began. Any substantial changes to the mark scheme that arose from these discussions will be recorded in the published Report on the Examination. All Examiners are instructed that alternative correct answers and unexpected approaches in candidates’ scripts must be given marks that fairly reflect the relevant knowledge and skills demonstrated. Mark schemes must be read in conjunction with the question papers and the Report on the Examination. • CIE will not enter into discussion or correspondence in connection with these mark schemes. CIE is publishing the mark schemes for the November 2004 question papers for most IGCSE and GCE Advanced Level syllabuses. www.XtremePapers.com
Mark scheme, page 2
Grade thresholds taken for Syllabus 0654 (Co-ordinated Sciences) in the November 2004 examination. minimum mark required for grade: maximum mark available AA CC EE FF Component 5 45 31 21 17 14 The threshold (minimum mark) for B is set halfway between those for Grades A and C. The threshold (minimum mark) for D is set halfway between those for Grades C and E. The threshold (minimum mark) for G is set as many marks below the F threshold as the E threshold is above it. Grade A* does not exist at the level of an individual component.
Mark scheme, page 3
November 2004 INTERNATIONAL GCSE MARK SCHEME MAXIMUM MARK: 45 SYLLABUS/COMPONENT: 0654/05 CO-ORDINATED SCIENCES Paper 5 (Practical Test)
Mark scheme, page 4
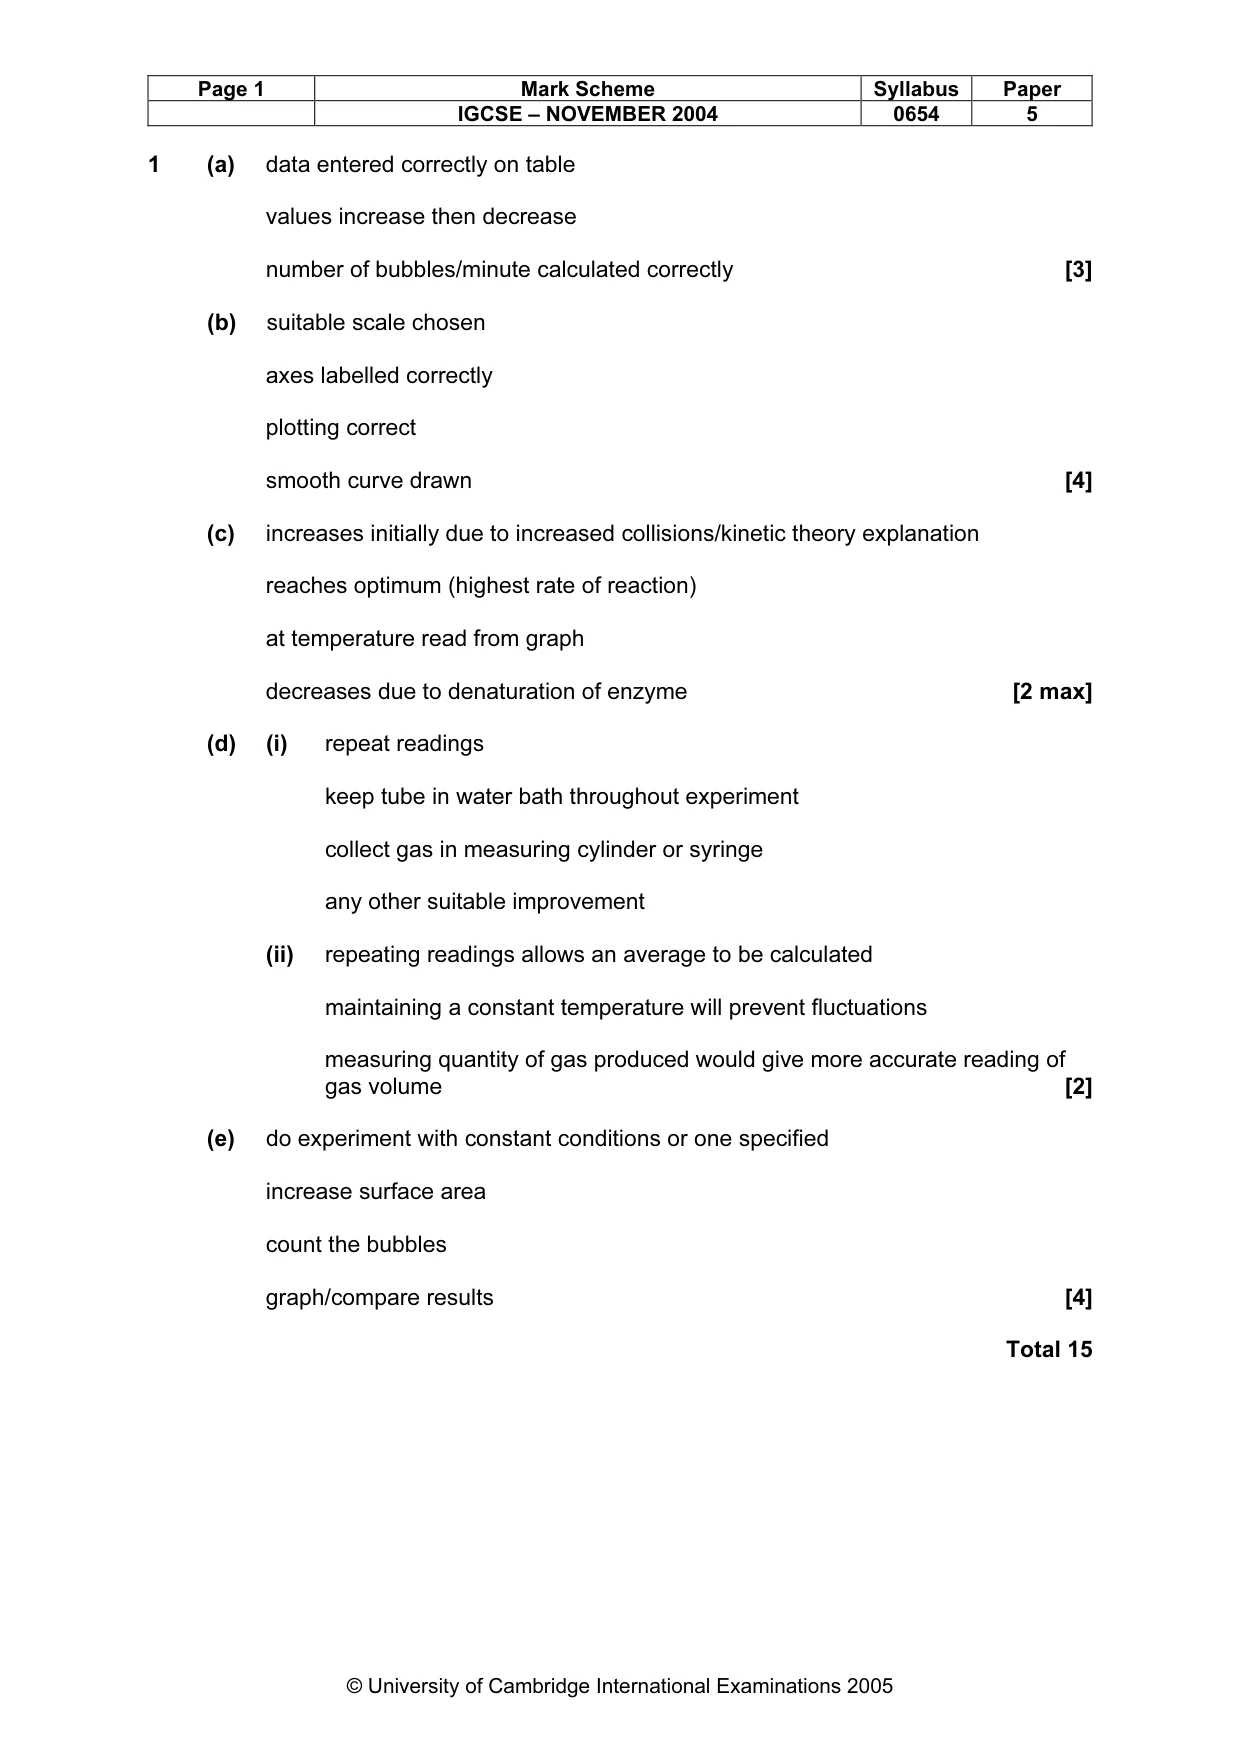
Page 1 Mark Scheme Syllabus Paper IGCSE – NOVEMBER 2004 0654 5 © University of Cambridge International Examinations 2005 1 (a) data entered correctly on table values increase then decrease number of bubbles/minute calculated correctly [3] (b) suitable scale chosen axes labelled correctly plotting correct smooth curve drawn [4] (c) increases initially due to increased collisions/kinetic theory explanation reaches optimum (highest rate of reaction) at temperature read from graph decreases due to denaturation of enzyme [2 max] (d) (i) repeat readings keep tube in water bath throughout experiment collect gas in measuring cylinder or syringe any other suitable improvement (ii) repeating readings allows an average to be calculated maintaining a constant temperature will prevent fluctuations measuring quantity of gas produced would give more accurate reading of gas volume [2] (e) do experiment with constant conditions or one specified increase surface area count the bubbles graph/compare results [4] Total 15
Mark scheme, page 5
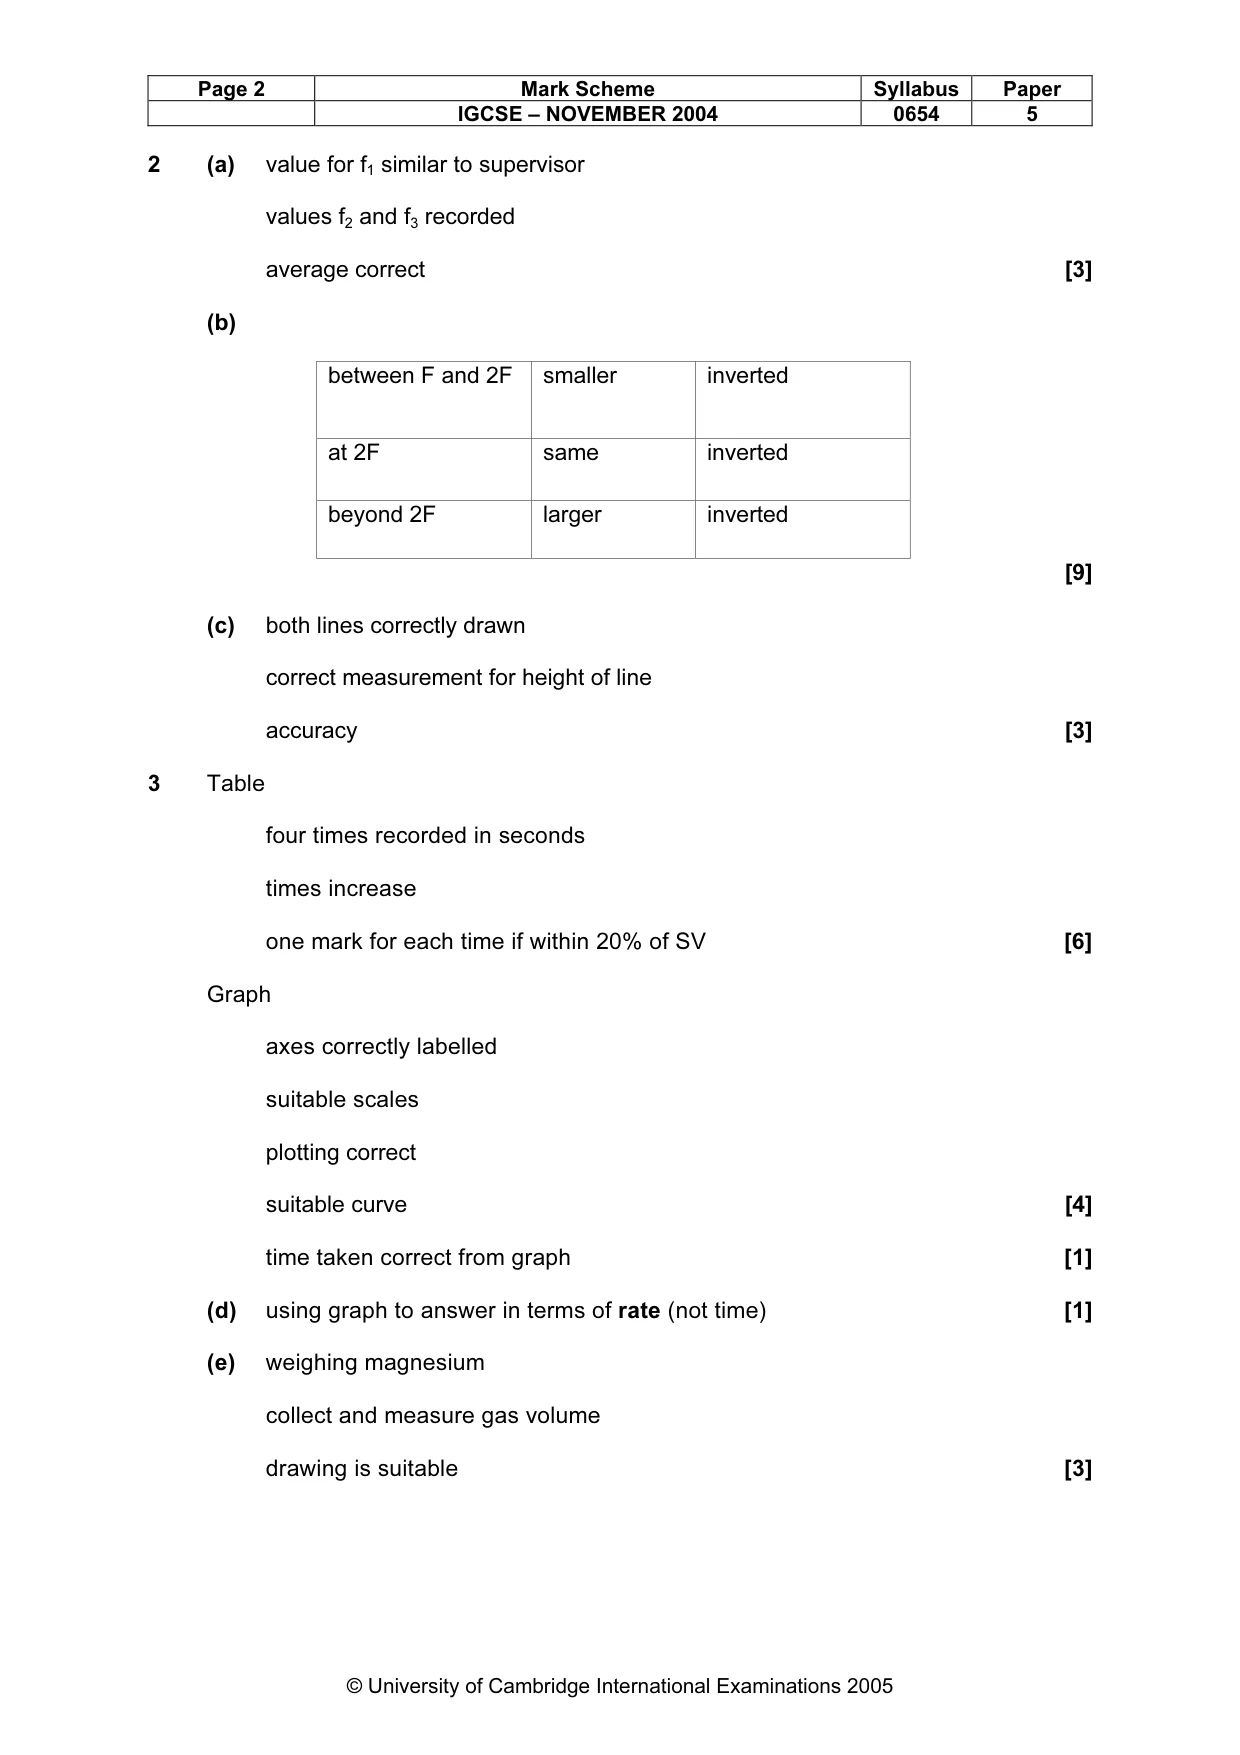
Page 2 Mark Scheme Syllabus Paper IGCSE – NOVEMBER 2004 0654 5 © University of Cambridge International Examinations 2005 2 (a) value for f1 similar to supervisor values f2 and f3 recorded average correct [3] (b) between F and 2F smaller inverted at 2F same inverted beyond 2F larger inverted [9] (c) both lines correctly drawn correct measurement for height of line accuracy [3] 3 Table four times recorded in seconds times increase one mark for each time if within 20% of SV [6] Graph axes correctly labelled suitable scales plotting correct suitable curve [4] time taken correct from graph [1] (d) using graph to answer in terms of rate (not time) [1] (e) weighing magnesium collect and measure gas volume drawing is suitable [3]