Questions as text
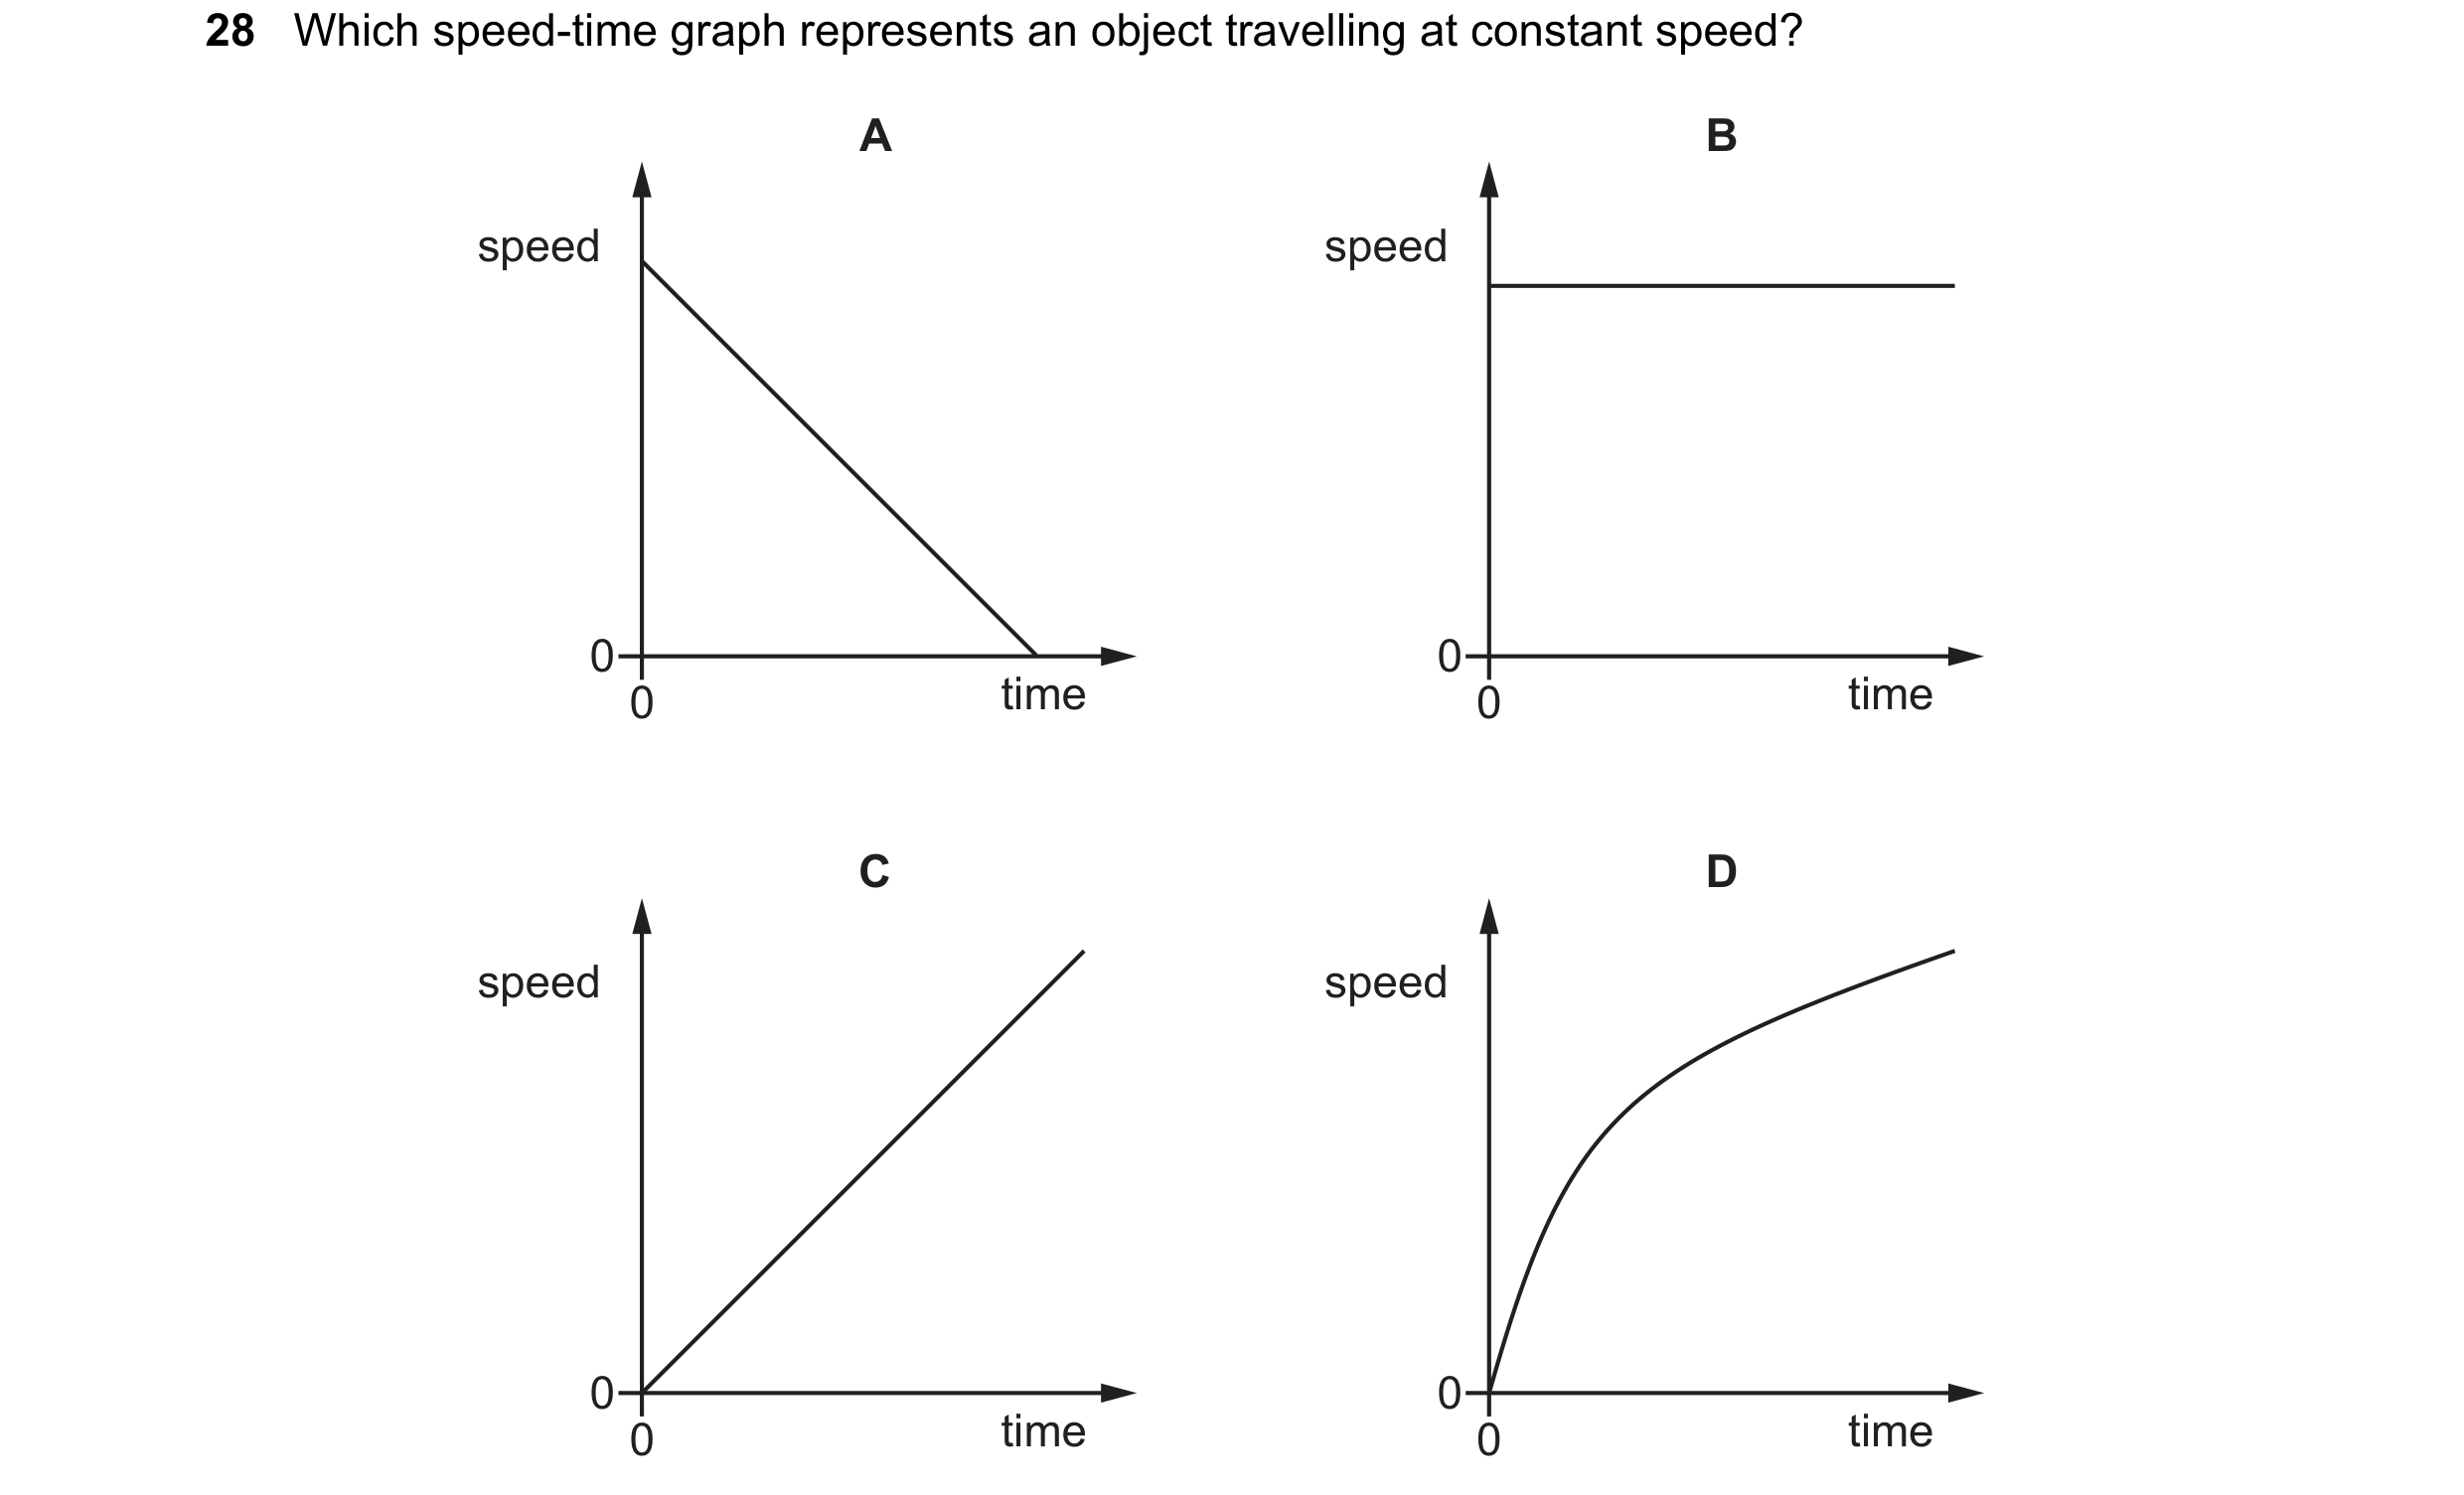
Q1 · Which speed-time graph represents an object travelling at constant speed? 0973/11 May/June 2019
28 Which speed-time graph represents an object travelling at constant speed? A B speed speed 0 0 0 time 0 time C D speed speed 0 0 0 time 0 time
1 marks
Answer: B
This question in 0973/11 May/June 2019
Q2 · A person stands 80 m from a high wall and claps his hands 0973/11 May/June 2020
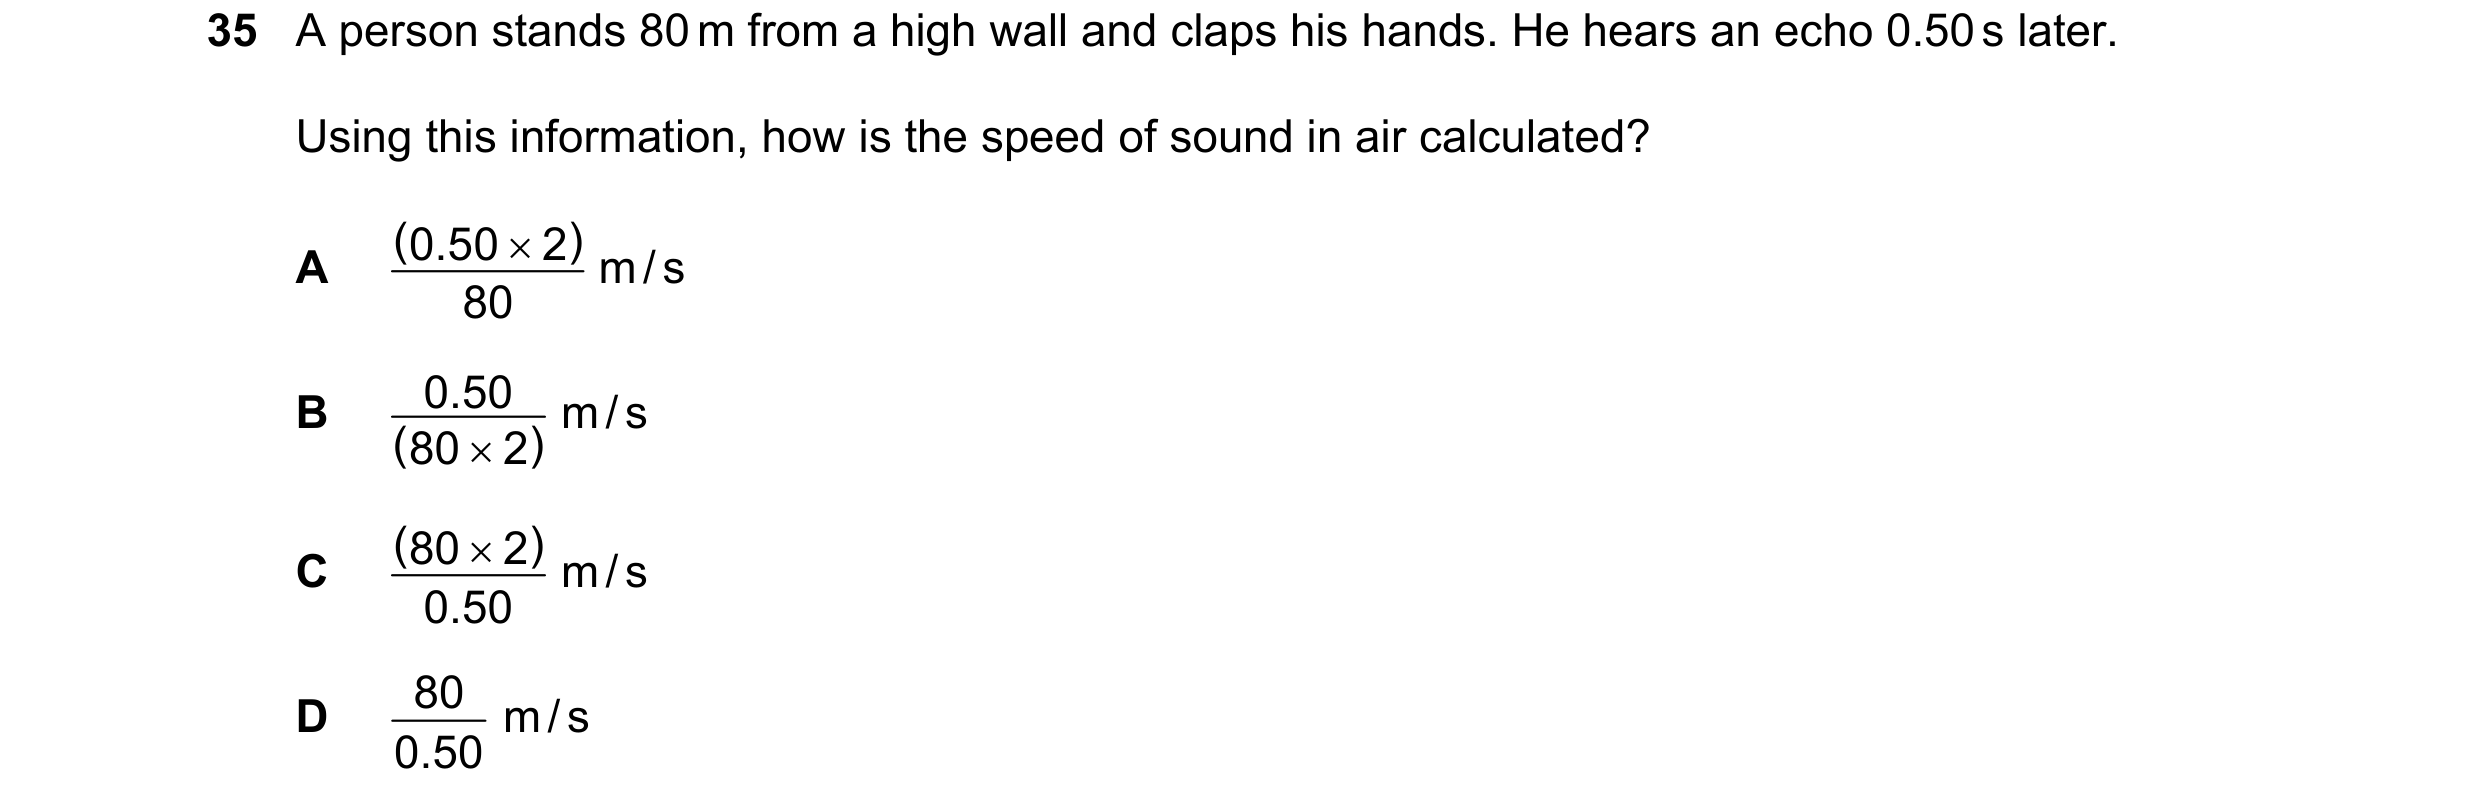
35 A person stands 80 m from a high wall and claps his hands. He hears an echo 0.50 s later. Using this information, how is the speed of sound in air calculated? ( 0.50 × 2 ) A m / s 80 B 0.50 m / s ( 80 × 2 ) ( 80 × 2 ) C m / s 0.50 80 D m / s 0.50
1 marks
Answer: C
This question in 0973/11 May/June 2020
Q3 · A man climbs up a vertical cliff that is 60 m high 0973/11 Oct/Nov 2020
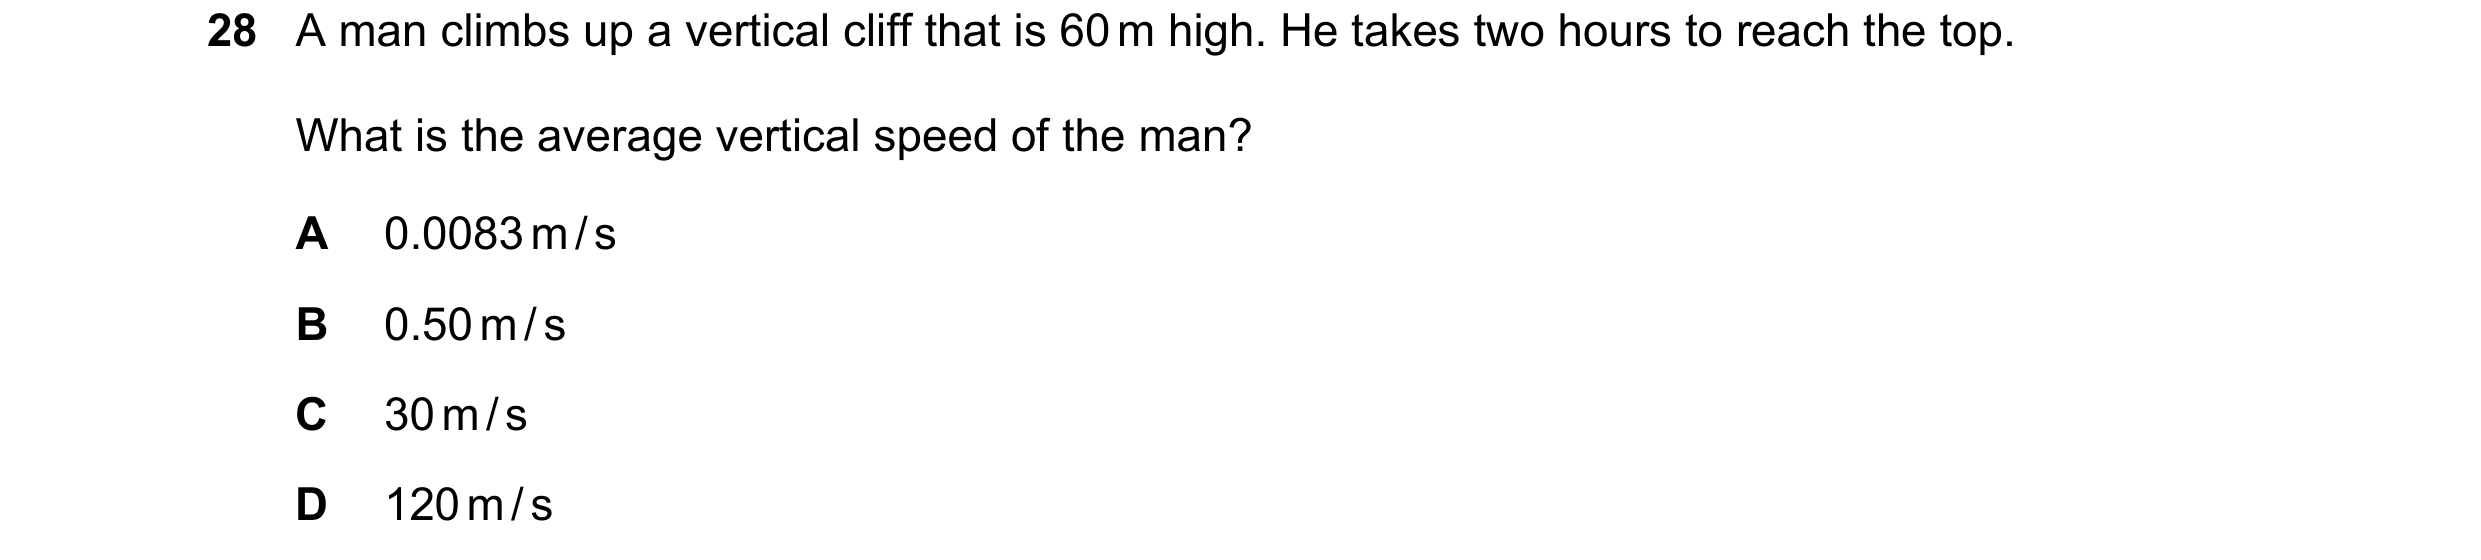
28 A man climbs up a vertical cliff that is 60 m high. He takes two hours to reach the top. What is the average vertical speed of the man? A 0.0083 m / s B 0.50 m / s C 30 m / s D 120 m / s
1 marks
Answer: A
This question in 0973/11 Oct/Nov 2020
Q4 · A worker in a quarry stands 0.90 km away from an explosion 0973/11 Oct/Nov 2020
34 A worker in a quarry stands 0.90 km away from an explosion. She sees the explosion 3.0 s before she hears the sound of the explosion. Using this information, what value can be determined for the speed of sound? A 300 m / s B 600 m / s C 2700 m / s D 5400 m / s
1 marks
Answer: A
This question in 0973/11 Oct/Nov 2020
Q5 · Which distance–time graph represents an object that is decelerating? 0973/11 May/June 2021
28 Which distance–time graph represents an object that is decelerating? A B distance distance 0 0 0 time 0 time C D distance distance 0 0 0 time 0 time
1 marks
Answer: A
This question in 0973/11 May/June 2021
Q6 · A vehicle moves a total distance of 300 m in 40 seconds 0973/11 May/June 2021
29 A vehicle moves a total distance of 300 m in 40 seconds. What is its average speed? A 0.13 m / s B 7.5 m / s C 340 m / s D 12 000 m / s
1 marks
Answer: B
This question in 0973/11 May/June 2021
Q7 · A girl runs 5000 m in 1200 seconds and then walks a further 3000 m in 1800 seconds 0973/12 May/June 2021
28 A girl runs 5000 m in 1200 seconds and then walks a further 3000 m in 1800 seconds. What is her average speed for this journey? A 1.7 m / s B 2.7 m / s C 2.9 m / s D 5.8 m / s
1 marks
Answer: B
This question in 0973/12 May/June 2021
Q8 · What does the area under a speed–time graph represent? 0973/12 May/June 2022
28 What does the area under a speed–time graph represent? A acceleration B average speed C distance travelled D total time taken
1 marks
Answer: C
This question in 0973/12 May/June 2022
Q9 · The graph shows how the speed of an object varies with time 0973/11 Oct/Nov 2022
28 The graph shows how the speed of an object varies with time. speed 0 0 time Which graph is the distance–time graph for this object? A B distance distance 0 0 0 time 0 time C D distance distance 0 0 0 time 0 time
1 marks
Answer: D
This question in 0973/11 Oct/Nov 2022
Q10 · Two students conduct an experiment to determine the speed of sound in air 0973/11 Oct/Nov 2022
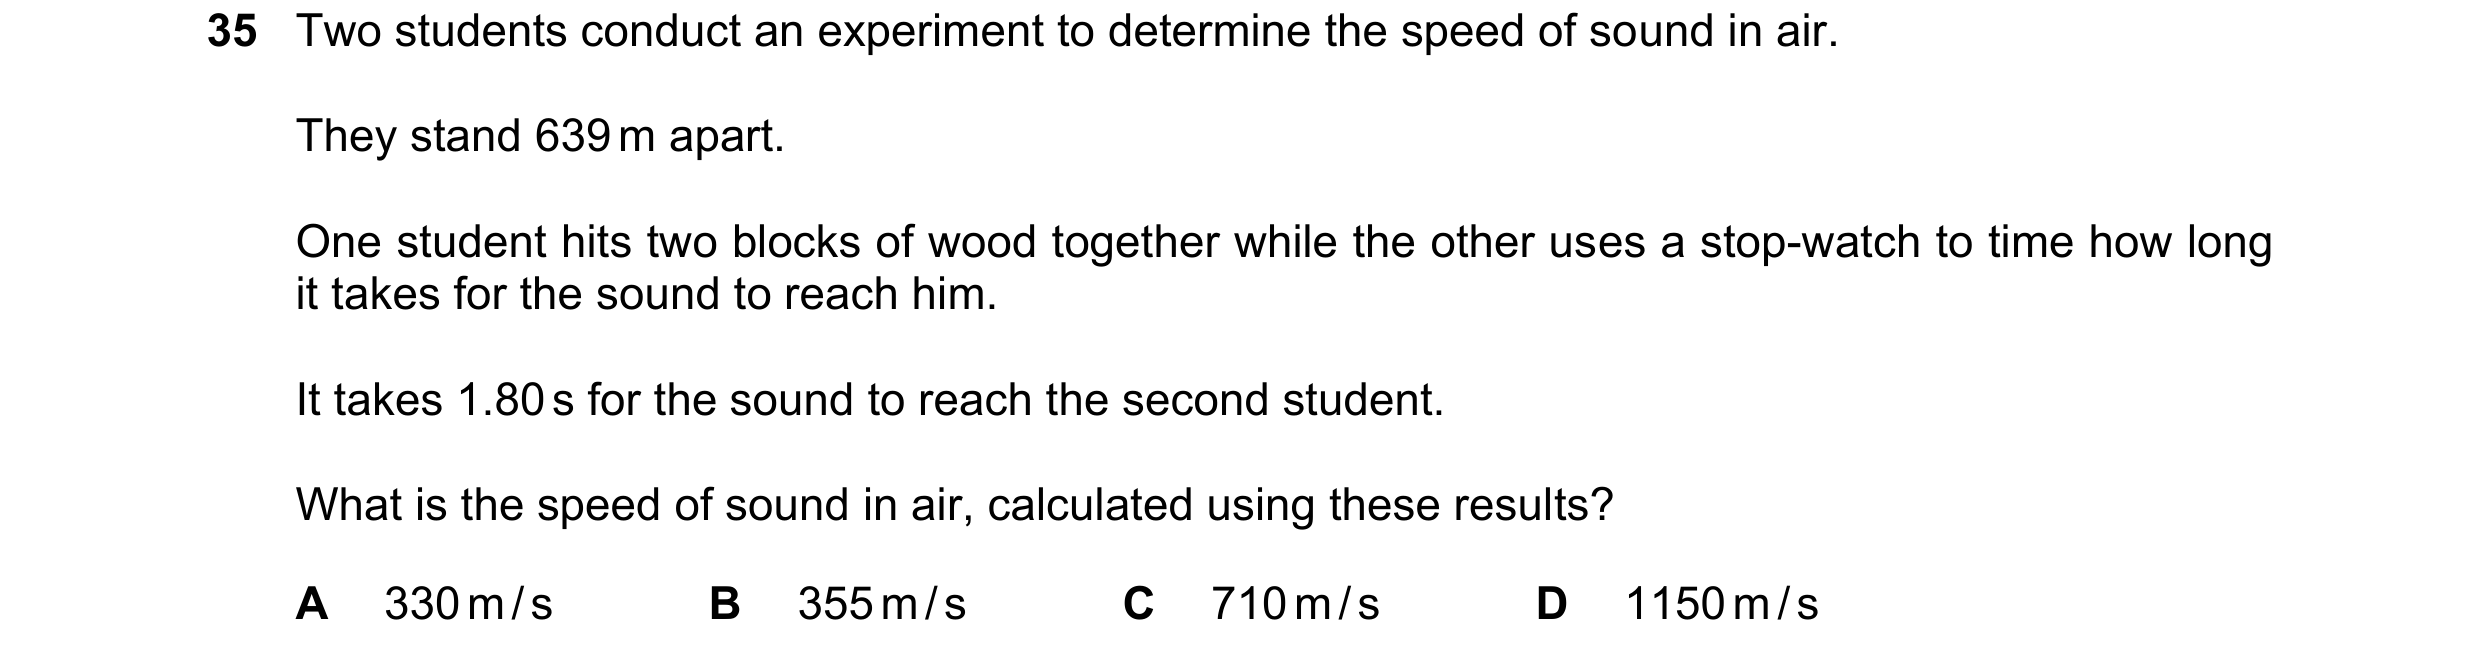
35 Two students conduct an experiment to determine the speed of sound in air. They stand 639 m apart. One student hits two blocks of wood together while the other uses a stop-watch to time how long it takes for the sound to reach him. It takes 1.80 s for the sound to reach the second student. What is the speed of sound in air, calculated using these results? A 330 m / s B 355 m / s C 710 m / s D 1150 m / s
1 marks
Answer: B
This question in 0973/11 Oct/Nov 2022
Q11 · The graph shows how the speed of an object varies with time 0973/11 May/June 2023
28 The graph shows how the speed of an object varies with time. 8.0 speed m / s 2.0 0 0 10 time / s What is the distance moved by the object between time 0 s and time 10 s? A 30 m B 40 m C 50 m D 80 m
1 marks
Answer: C
This question in 0973/11 May/June 2023
Q12 · A man stands 420 m away from a high wall 0973/11 May/June 2023
34 A man stands 420 m away from a high wall. He bangs a drum once and starts a stop-watch at the same time. When he hears an echo from the wall, the stop-watch reads 2.4 s. What is the speed of sound, calculated from this information? A 87.5 m / s B 175 m / s C 330 m / s D 350 m / s
1 marks
Answer: D
This question in 0973/11 May/June 2023
Q13 · The speed–time graph represents part of a car journey 0973/11 Oct/Nov 2023
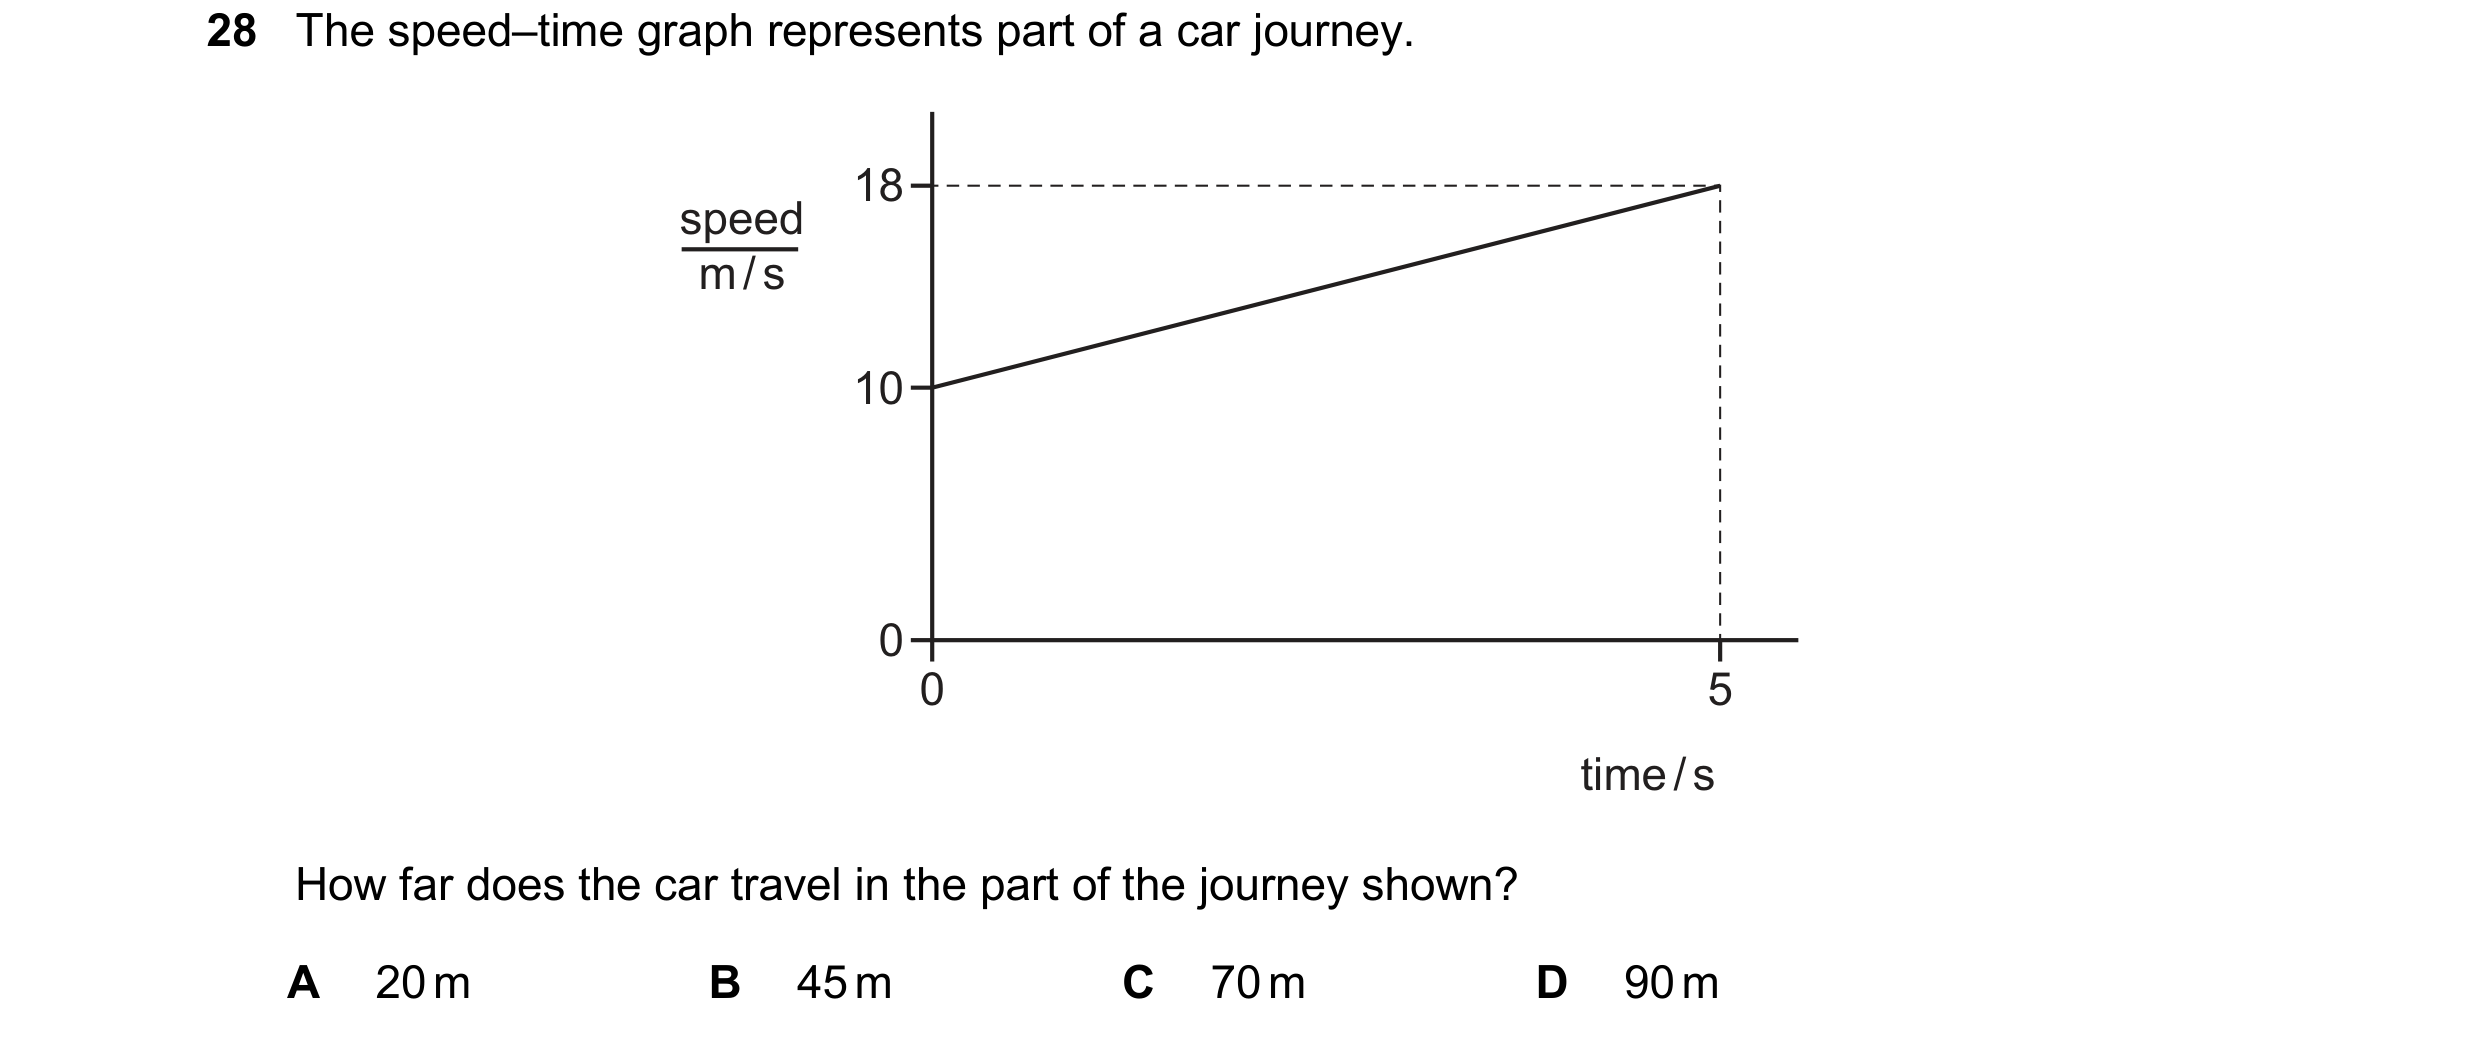
28 The speed–time graph represents part of a car journey. 18 speed m / s 10 0 0 5 time / s How far does the car travel in the part of the journey shown? A 20 m B 45 m C 70 m D 90 m
1 marks
Answer: C
This question in 0973/11 Oct/Nov 2023
Q14 · A car travels at constant speed 0973/11 May/June 2024
28 A car travels at constant speed. It is at point X at time = 0. Which distance–time graph and speed–time graph represent the motion of the car? distance–time graph speed–time graph distance speed from X A 0 0 0 time 0 time distance speed from X B 0 0 0 time 0 time distance speed from X C 0 0 0 time 0 time distance speed from X D 0 0 0 time 0 time
1 marks
Answer: A
This question in 0973/11 May/June 2024
Q15 · The graph shows how the speed of an object varies with time 0973/12 May/June 2024
28 The graph shows how the speed of an object varies with time. The speed of the object is v at time t. v speed 0 0 t time Which expression gives the distance travelled by the object in time t ? 1 v v 1 A B C vt D vt 2 t t 2
1 marks
Answer: C
This question in 0973/12 May/June 2024
Q16 · A person runs 5000 m in 1200 s and then walks a further 3000 m in 1800 s 0973/11 Oct/Nov 2024
28 A person runs 5000 m in 1200 s and then walks a further 3000 m in 1800 s. What is their average speed for this journey? A 1.7 m / s B 2.7 m / s C 2.9 m / s D 5.8 m / s
1 marks
Answer: B
This question in 0973/11 Oct/Nov 2024
 1 / 6
1 / 6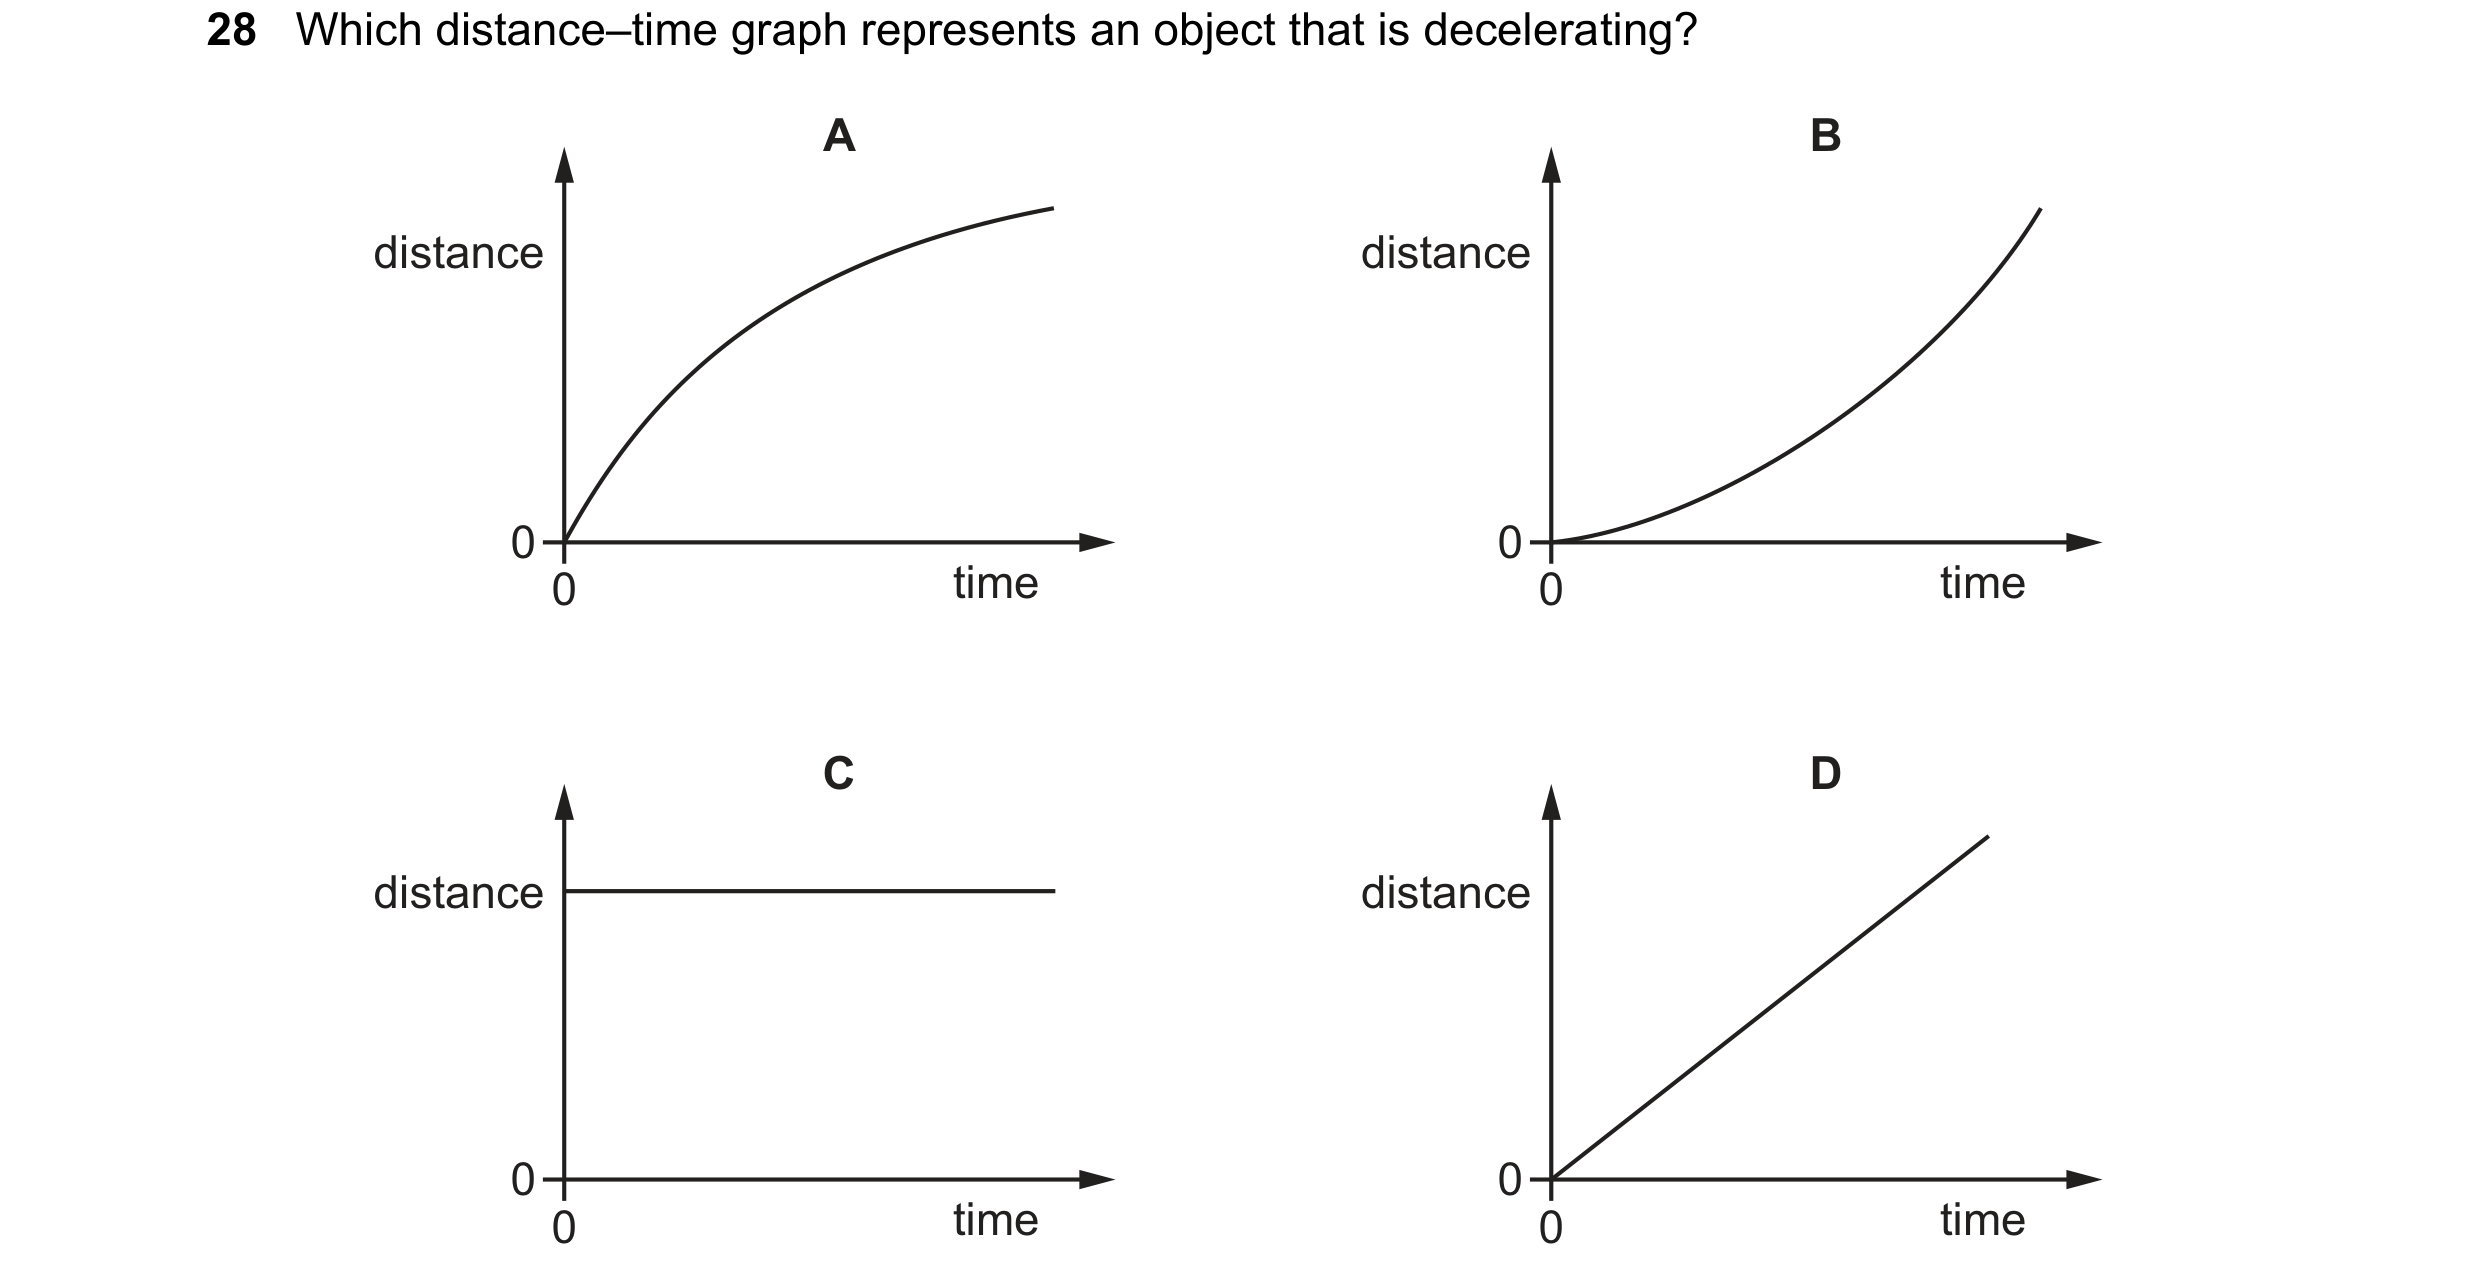


 2 / 6
2 / 6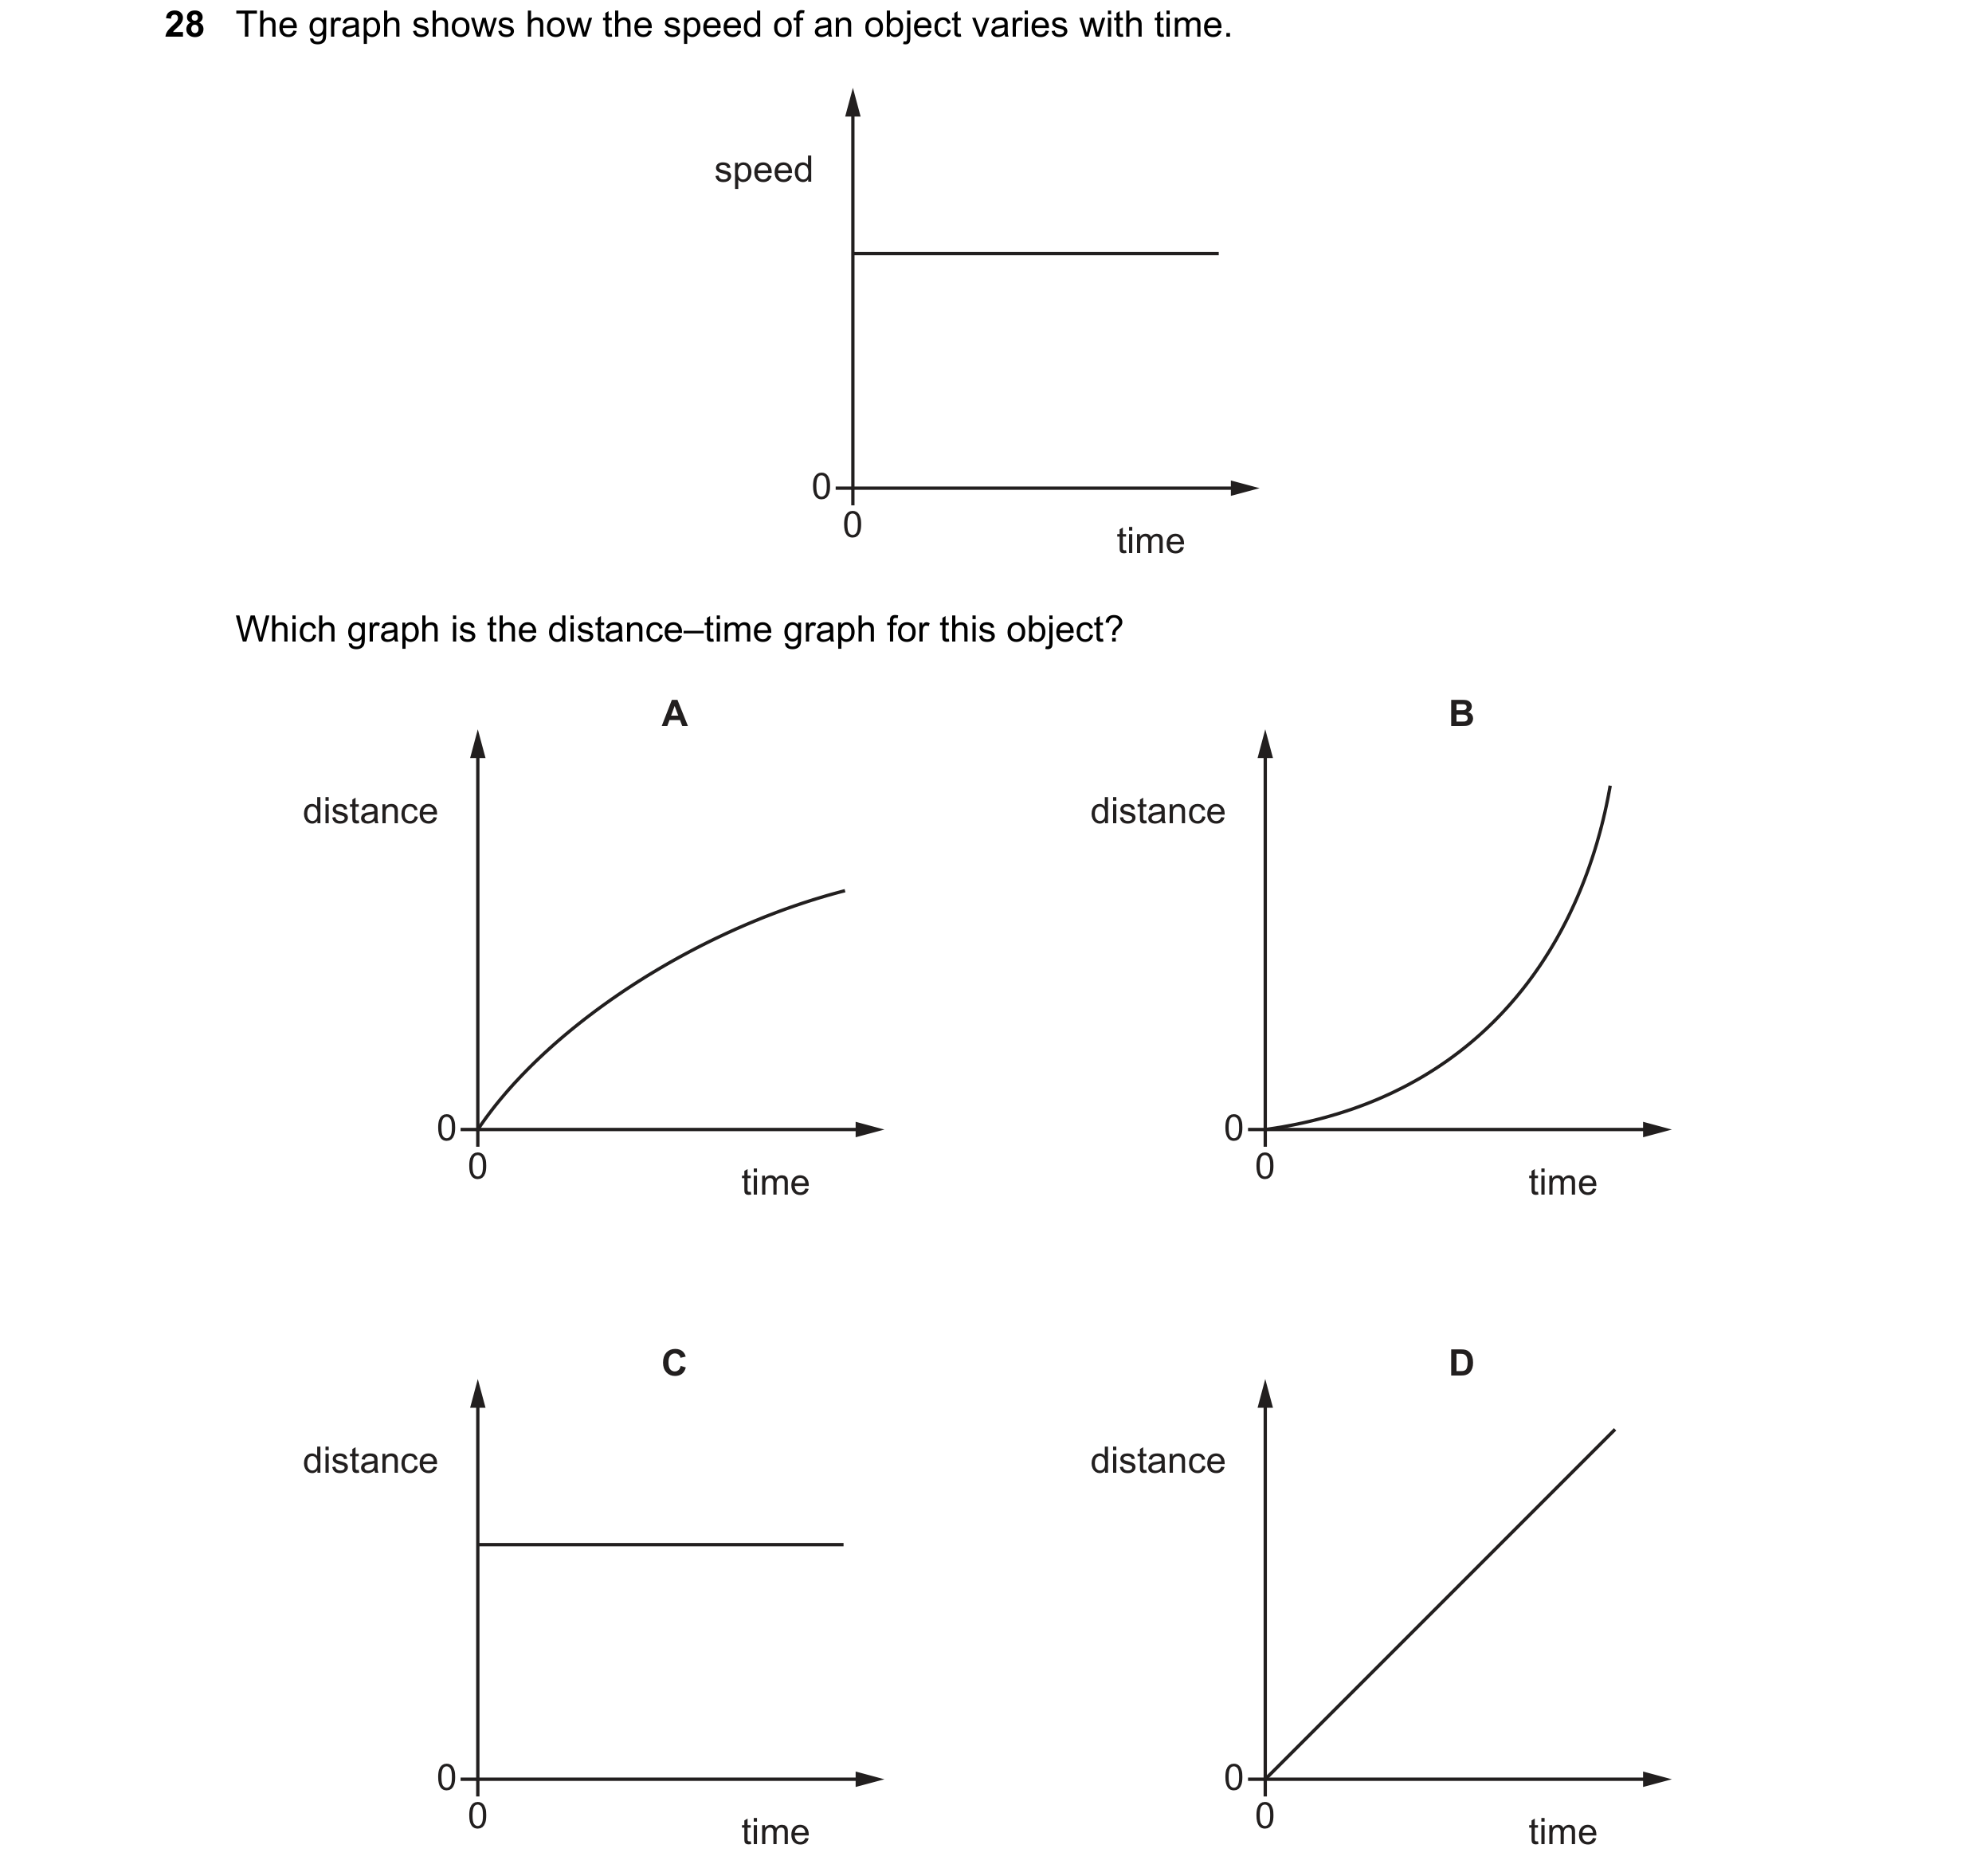
 3 / 6
3 / 6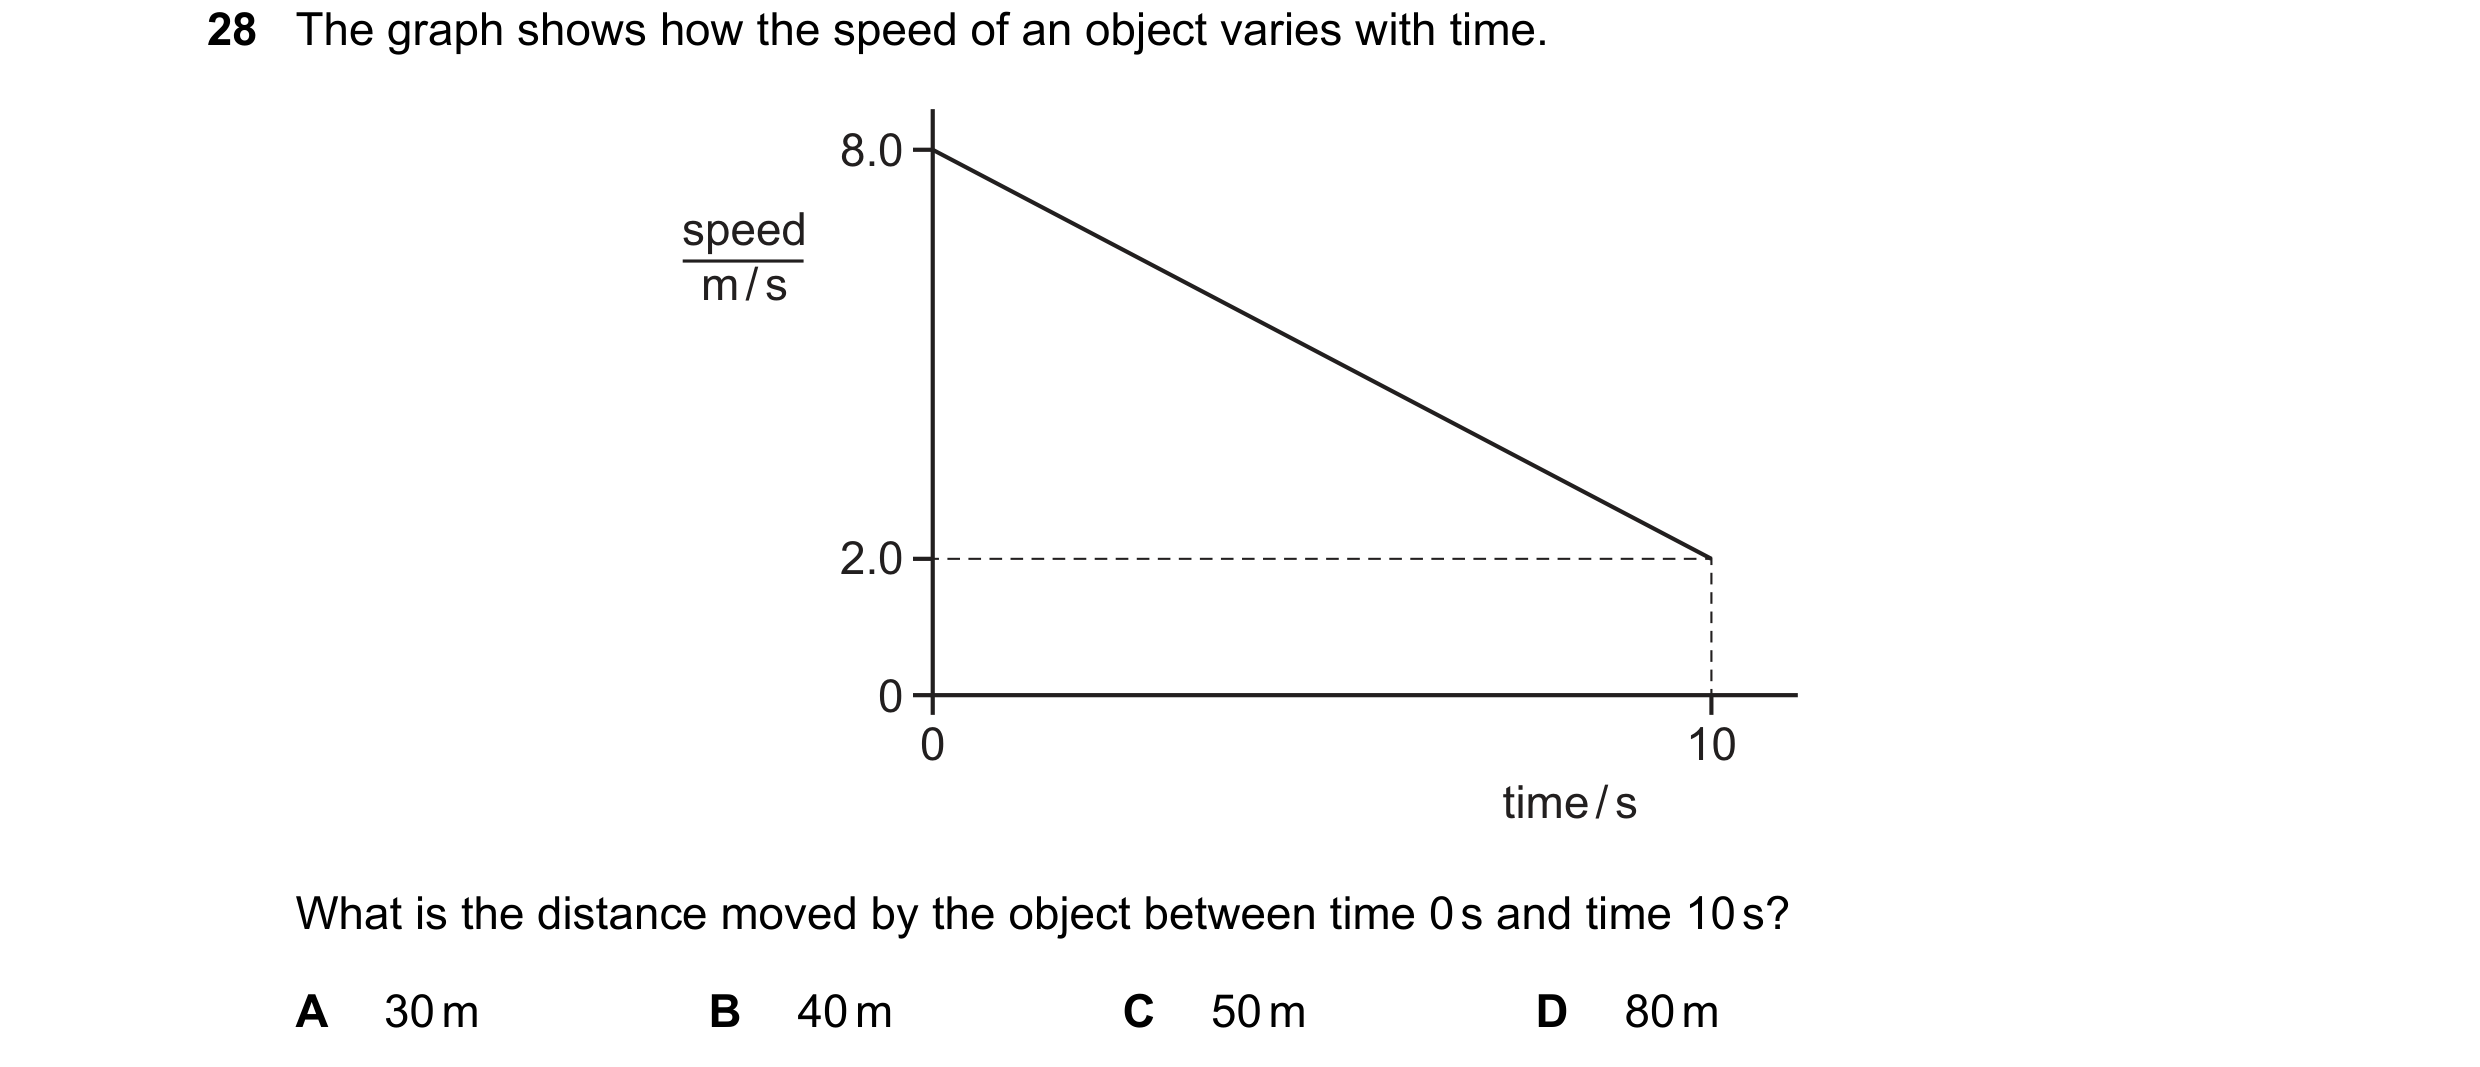

 4 / 6
4 / 6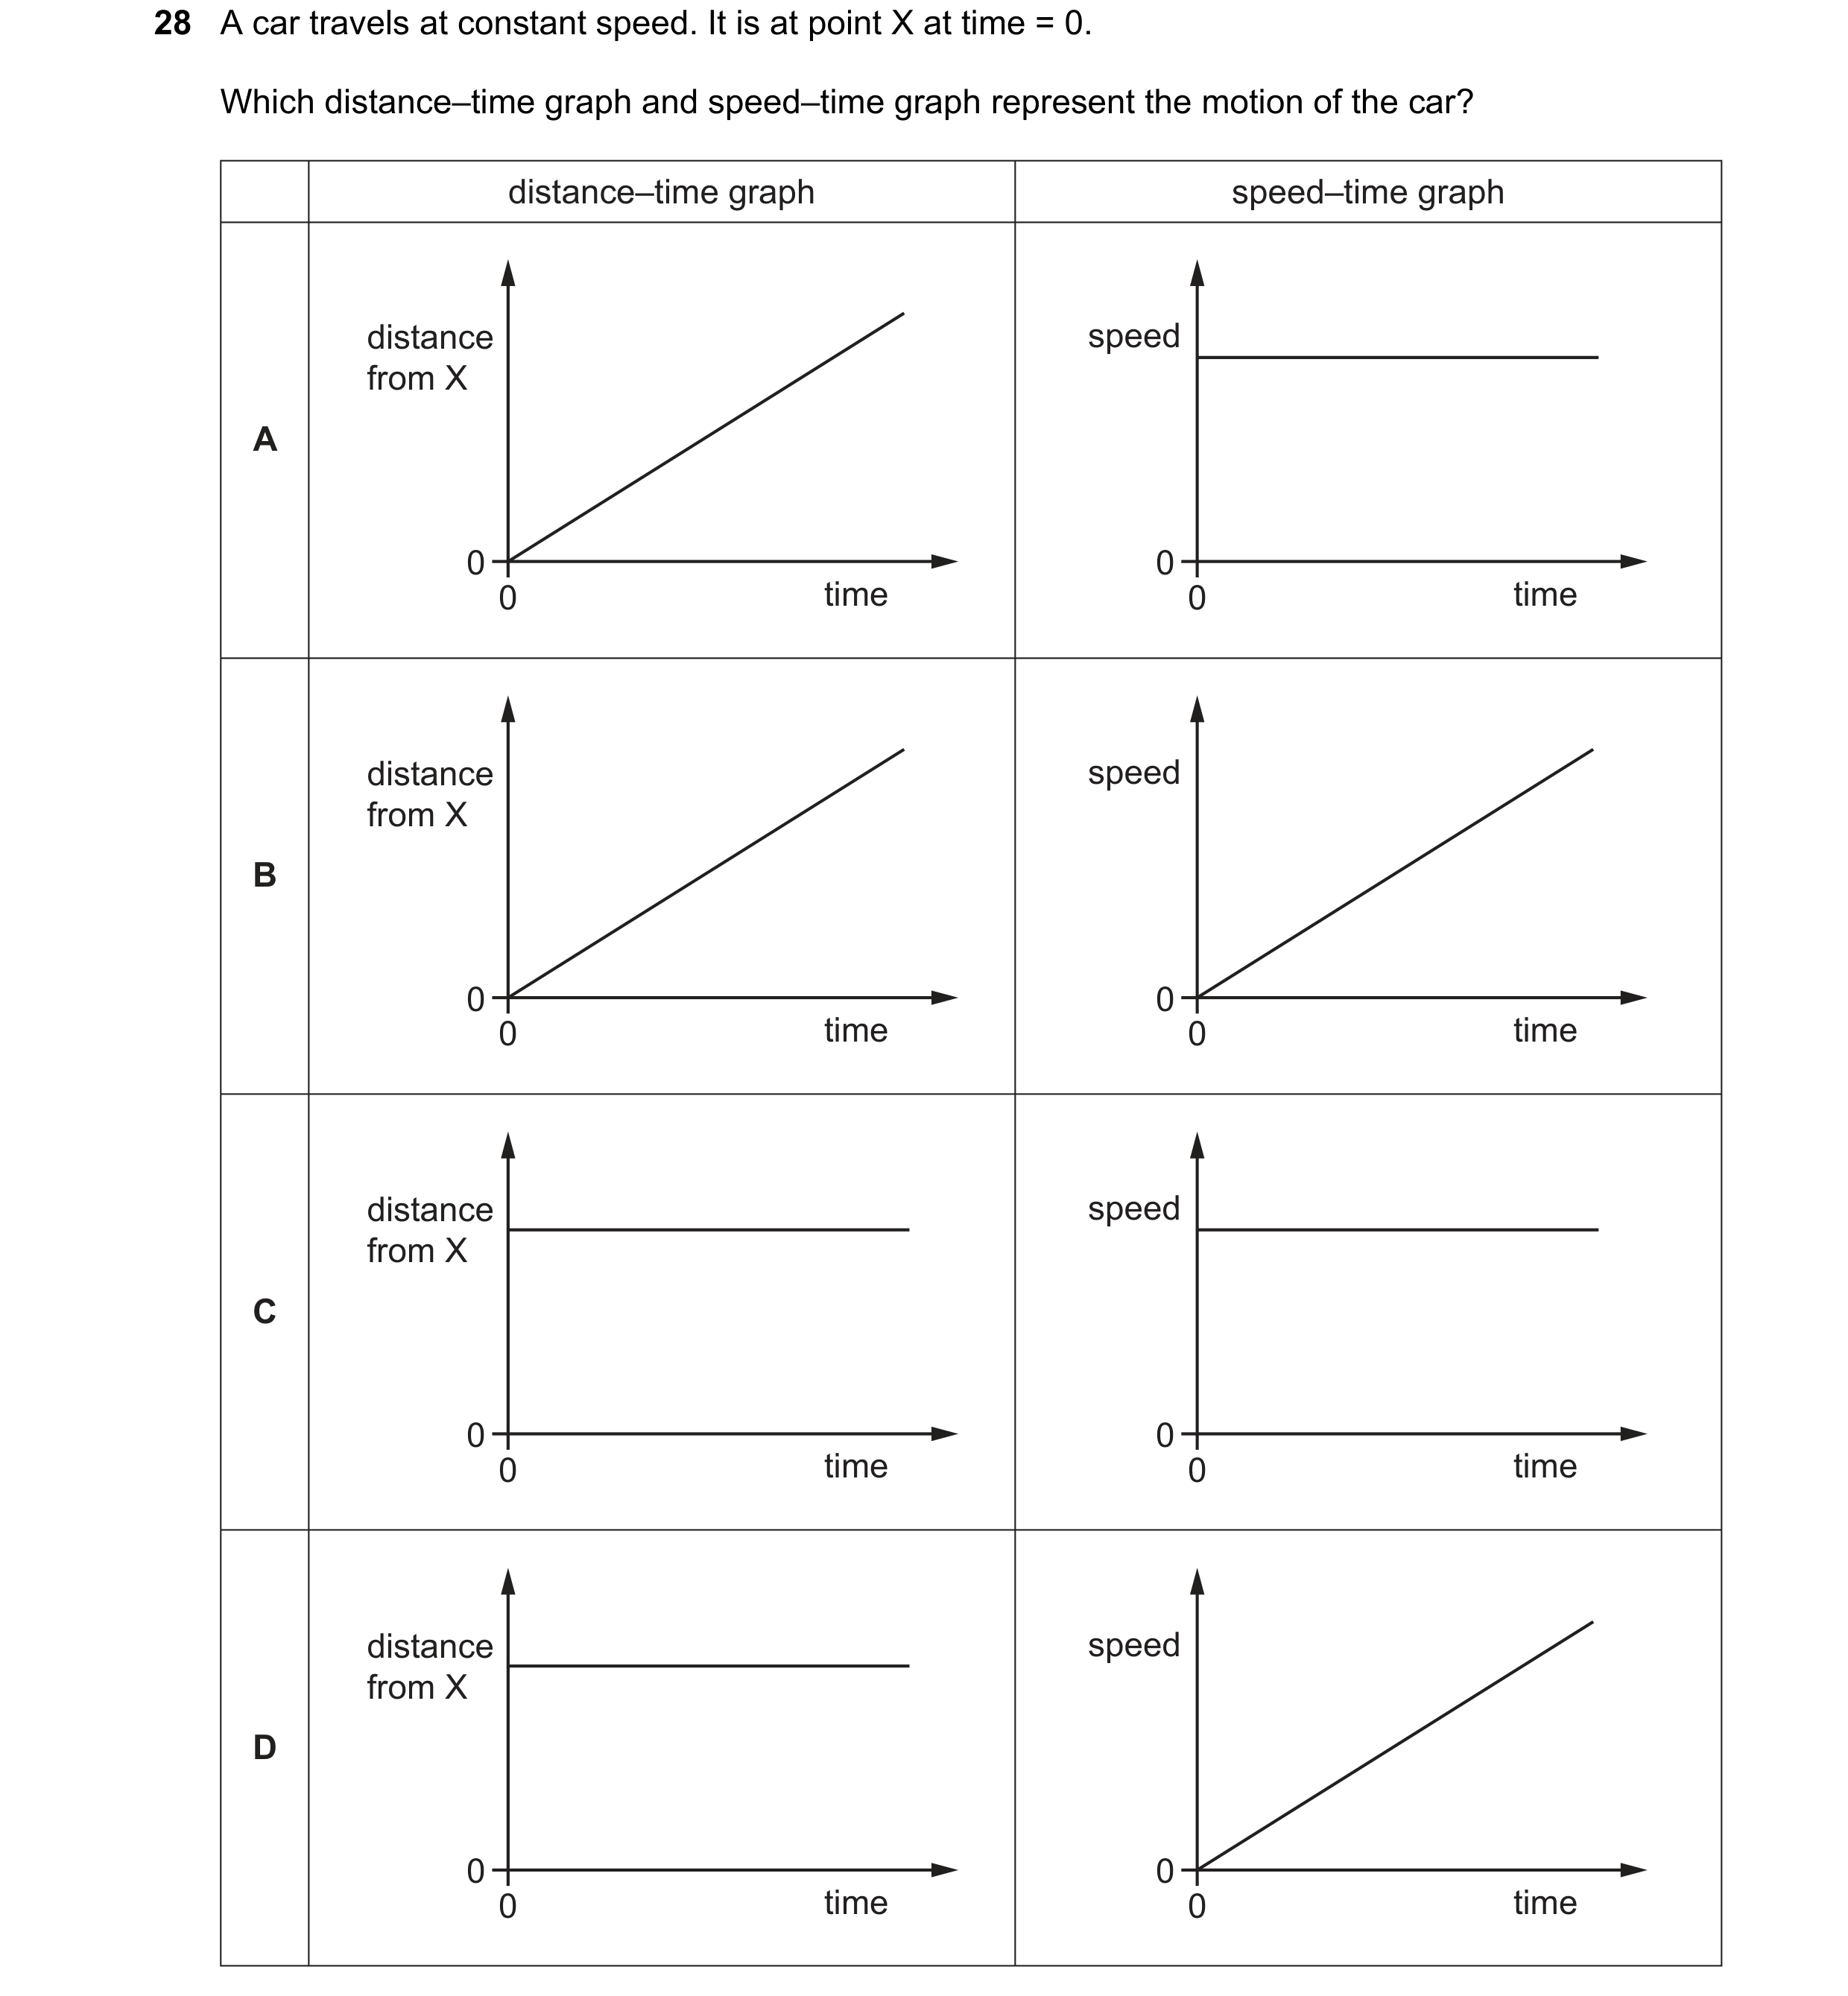 5 / 6
5 / 6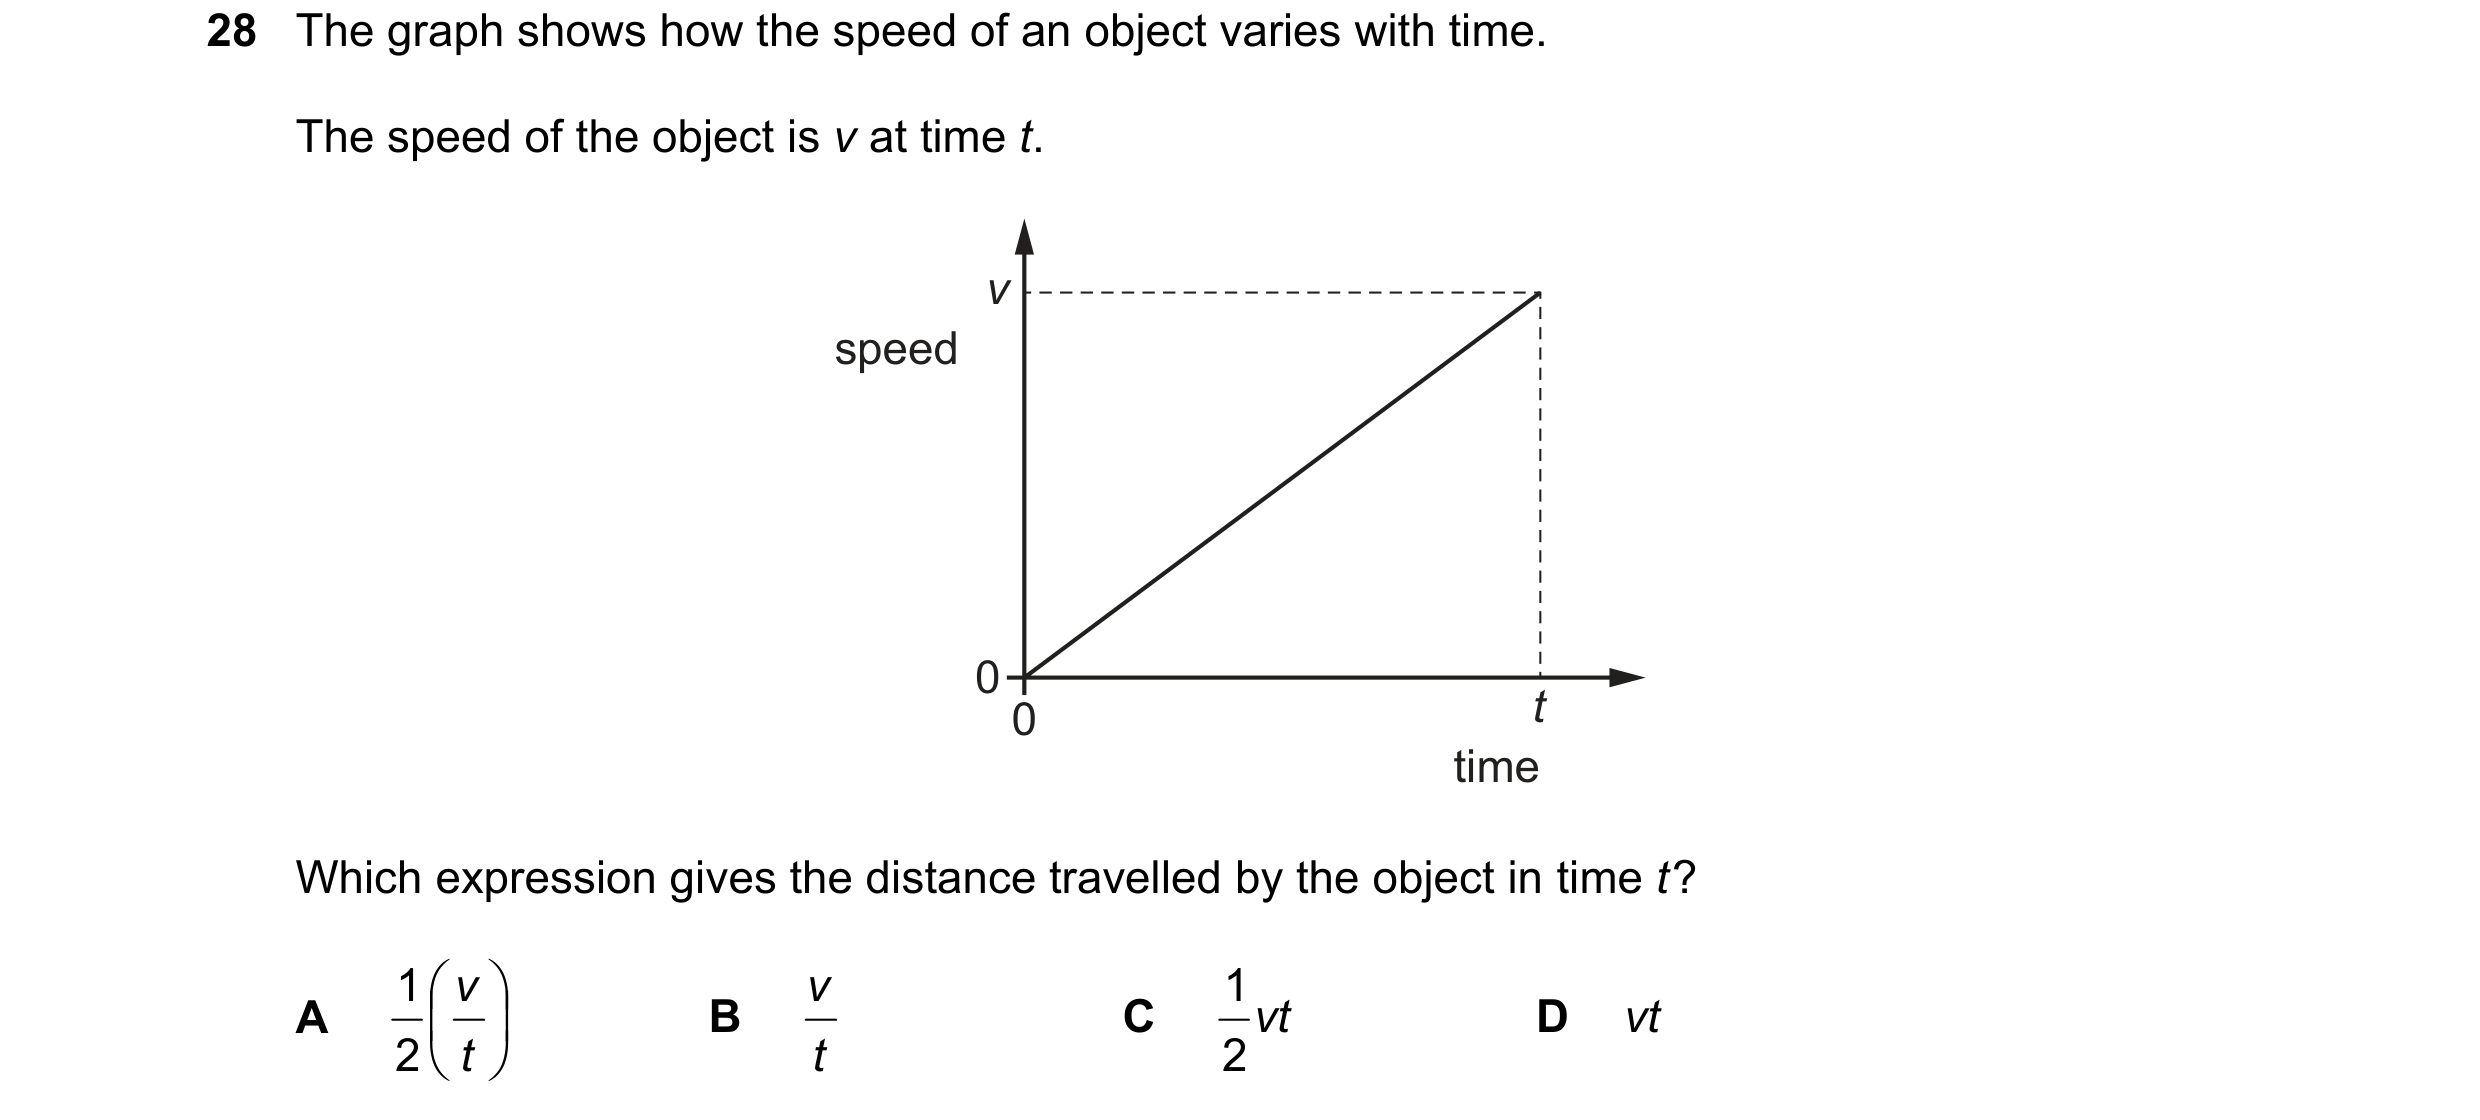
 6 / 6
6 / 6