Cambridge IGCSE Sciences - Co-ordinated (9-1) 0973 — 2023 May/June Paper 5 · Variant 1
0973/51/M/J/23 · 6 questions · 60 marks · ≈68 min
The question paper and its mark scheme, free to read here and free to download. This is Cambridge’s own paper, exactly as it was sat.
Question paper16 pages



Mark scheme14 pages
Answers below. Sit the paper first if you are practising.
Questions as text
Q1 · You are going to investigate the use of an enzyme for the extraction of juice from apples
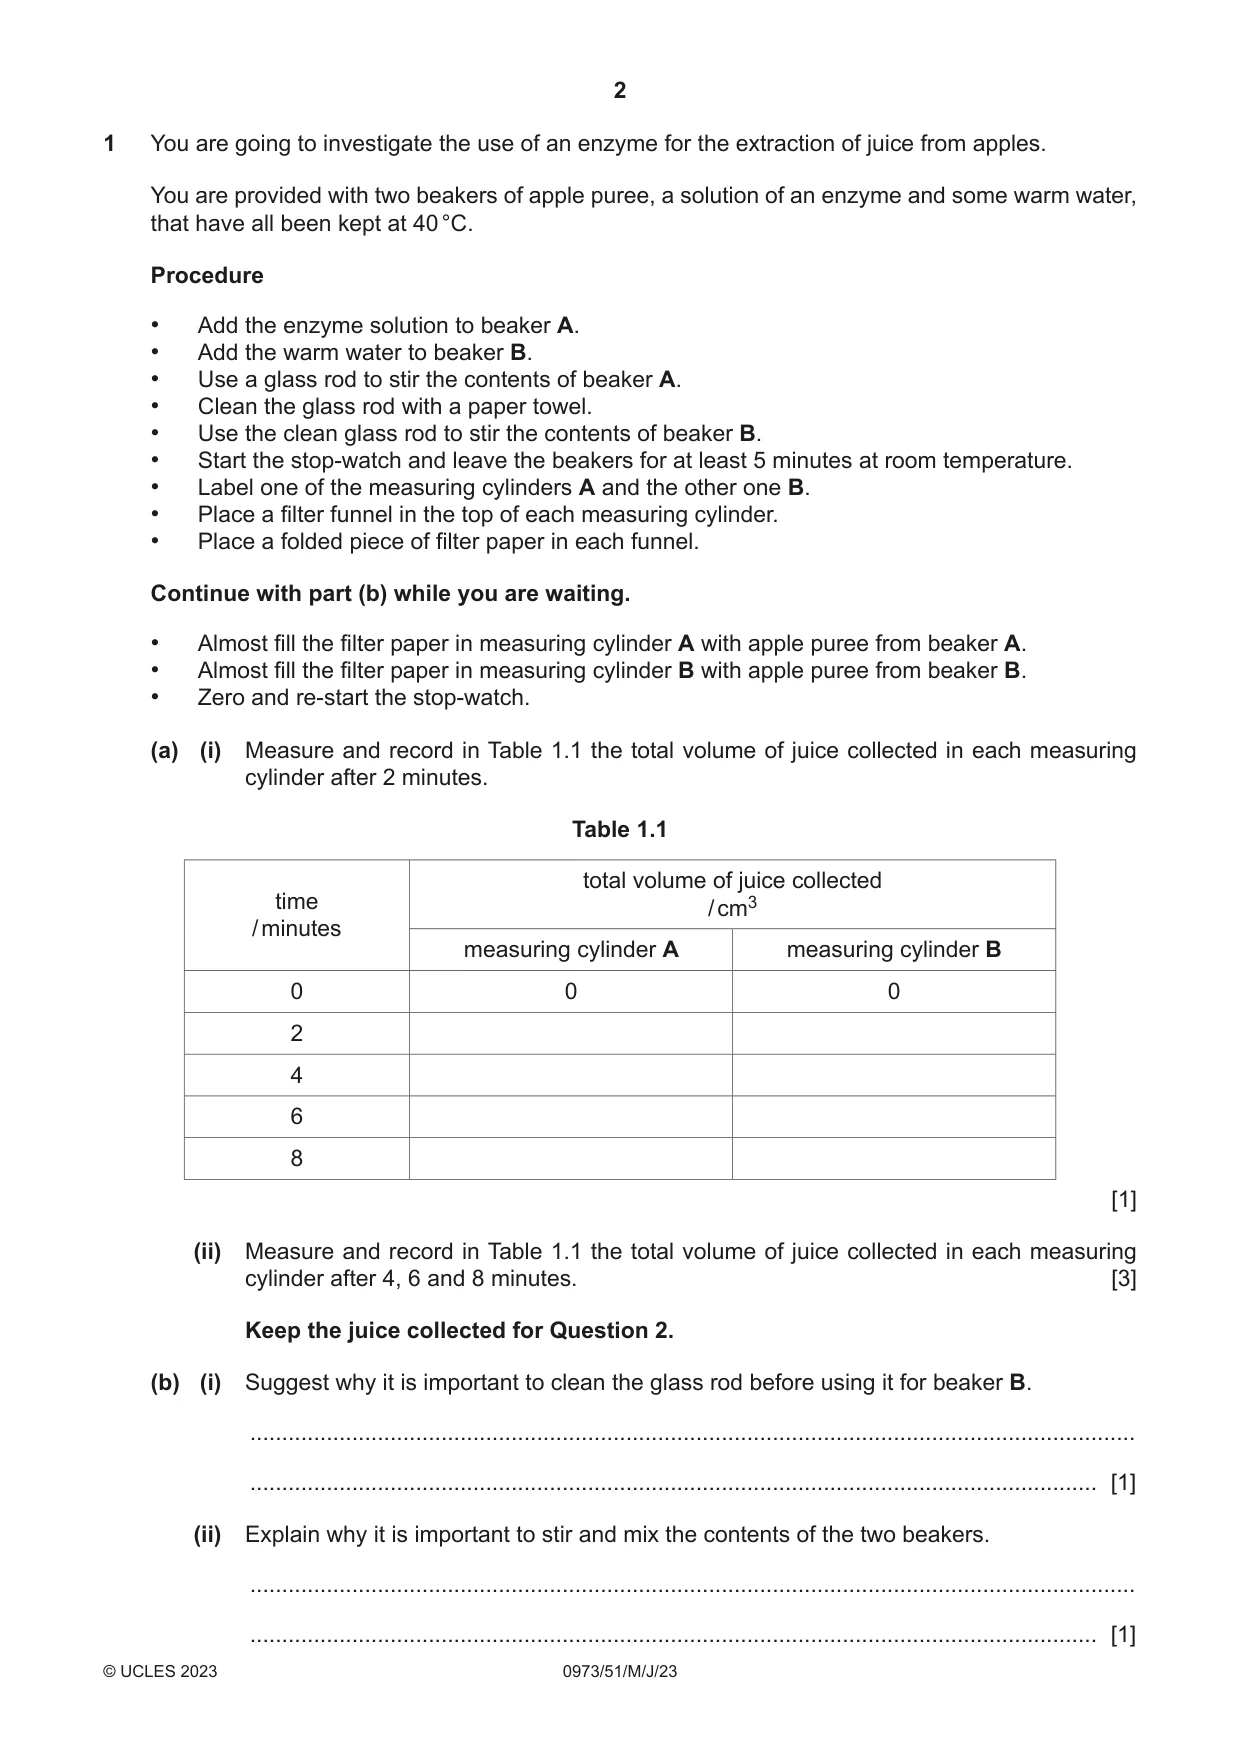
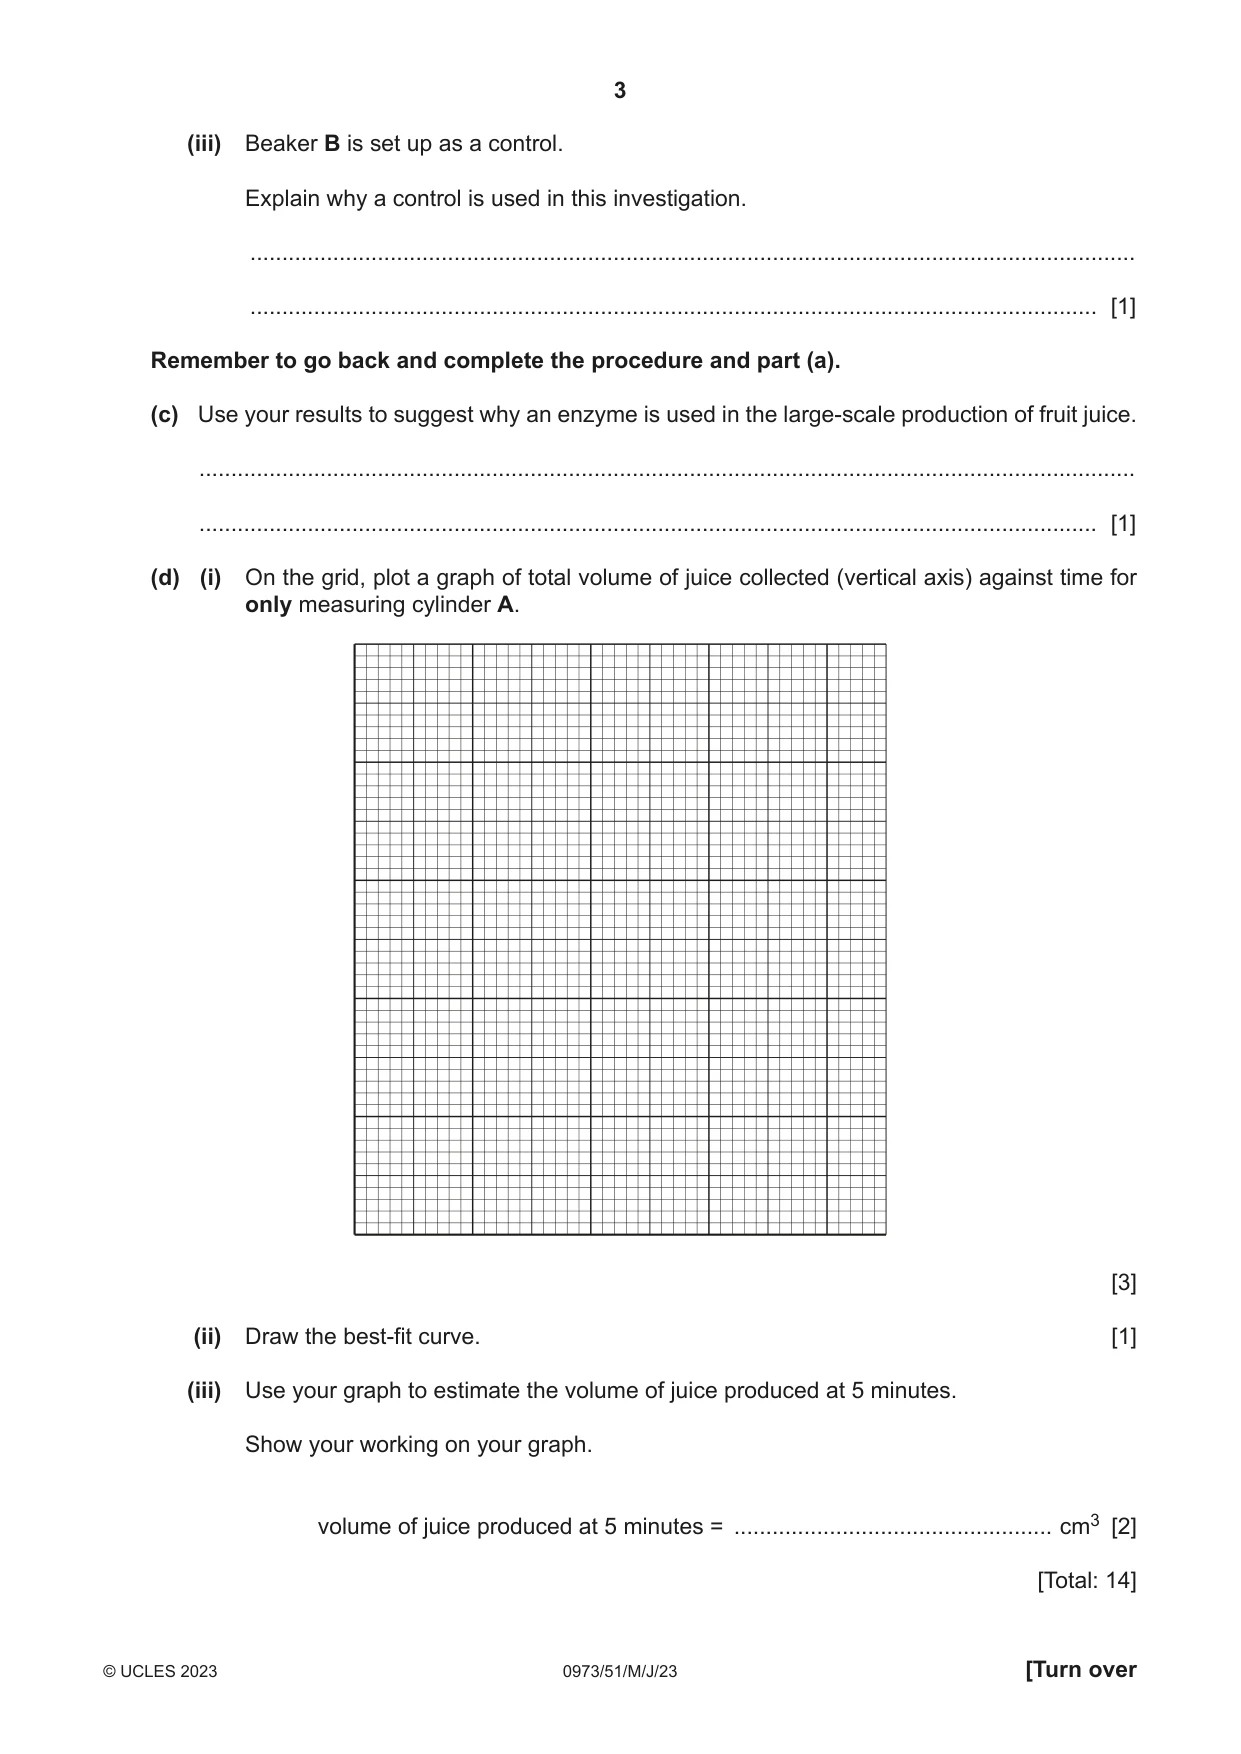
1 You are going to investigate the use of an enzyme for the extraction of juice from apples. You are provided with two beakers of apple puree, a solution of an enzyme and some warm water, that have all been kept at 40 °C. Procedure • Add the enzyme solution to beaker A. • Add the warm water to beaker B. • Use a glass rod to stir the contents of beaker A. • Clean the glass rod with a paper towel. • Use the clean glass rod to stir the contents of beaker B. • Start the stop-watch and leave the beakers for at least 5 minutes at room temperature. • Label one of the measuring cylinders A and the other one B. • Place a filter funnel in the top of each measuring cylinder. • Place a folded piece of filter paper in each funnel. Continue with part (b) while you are waiting. • Almost fill the filter paper in measuring cylinder A with apple puree from beaker A. • Almost fill the filter paper in measuring cylinder B with apple puree from beaker B. • Zero and re-start the stop-watch. (a) (i) Measure and record in Table 1.1 the total volume of juice collected in each measuring cylinder after 2 minutes. Table 1.1 total volume of juice collected time / cm3 / minutes measuring cylinder A measuring cylinder B 0 0 0 2 4 6 8 [1] (ii) Measure and record in Table 1.1 the total volume of juice collected in each measuring cylinder after 4, 6 and 8 minutes. [3] Keep the juice collected for Question 2. (b) (i) Suggest why it is important to clean the glass rod before using it for beaker B. ........................................................................................................................................... ..................................................................................................................................... [1] (ii) Explain why it is important to stir and mix the contents of the two beakers. ........................................................................................................................................... ..................................................................................................................................... [1] (iii) Beaker B is set up as a control. Explain why a control is used in this investigation. ........................................................................................................................................... ..................................................................................................................................... [1] Remember to go back and complete the procedure and part (a). (c) Use your results to suggest why an enzyme is used in the large-scale production of fruit juice. ................................................................................................................................................... ............................................................................................................................................. [1] (d) (i) On the grid, plot a graph of total volume of juice collected (vertical axis) against time for only measuring cylinder A. [3] (ii) Draw the best-fit curve. [1] (iii) Use your graph to estimate the volume of juice produced at 5 minutes. Show your working on your graph. volume of juice produced at 5 minutes = .................................................. cm3 [2] [Total: 14]
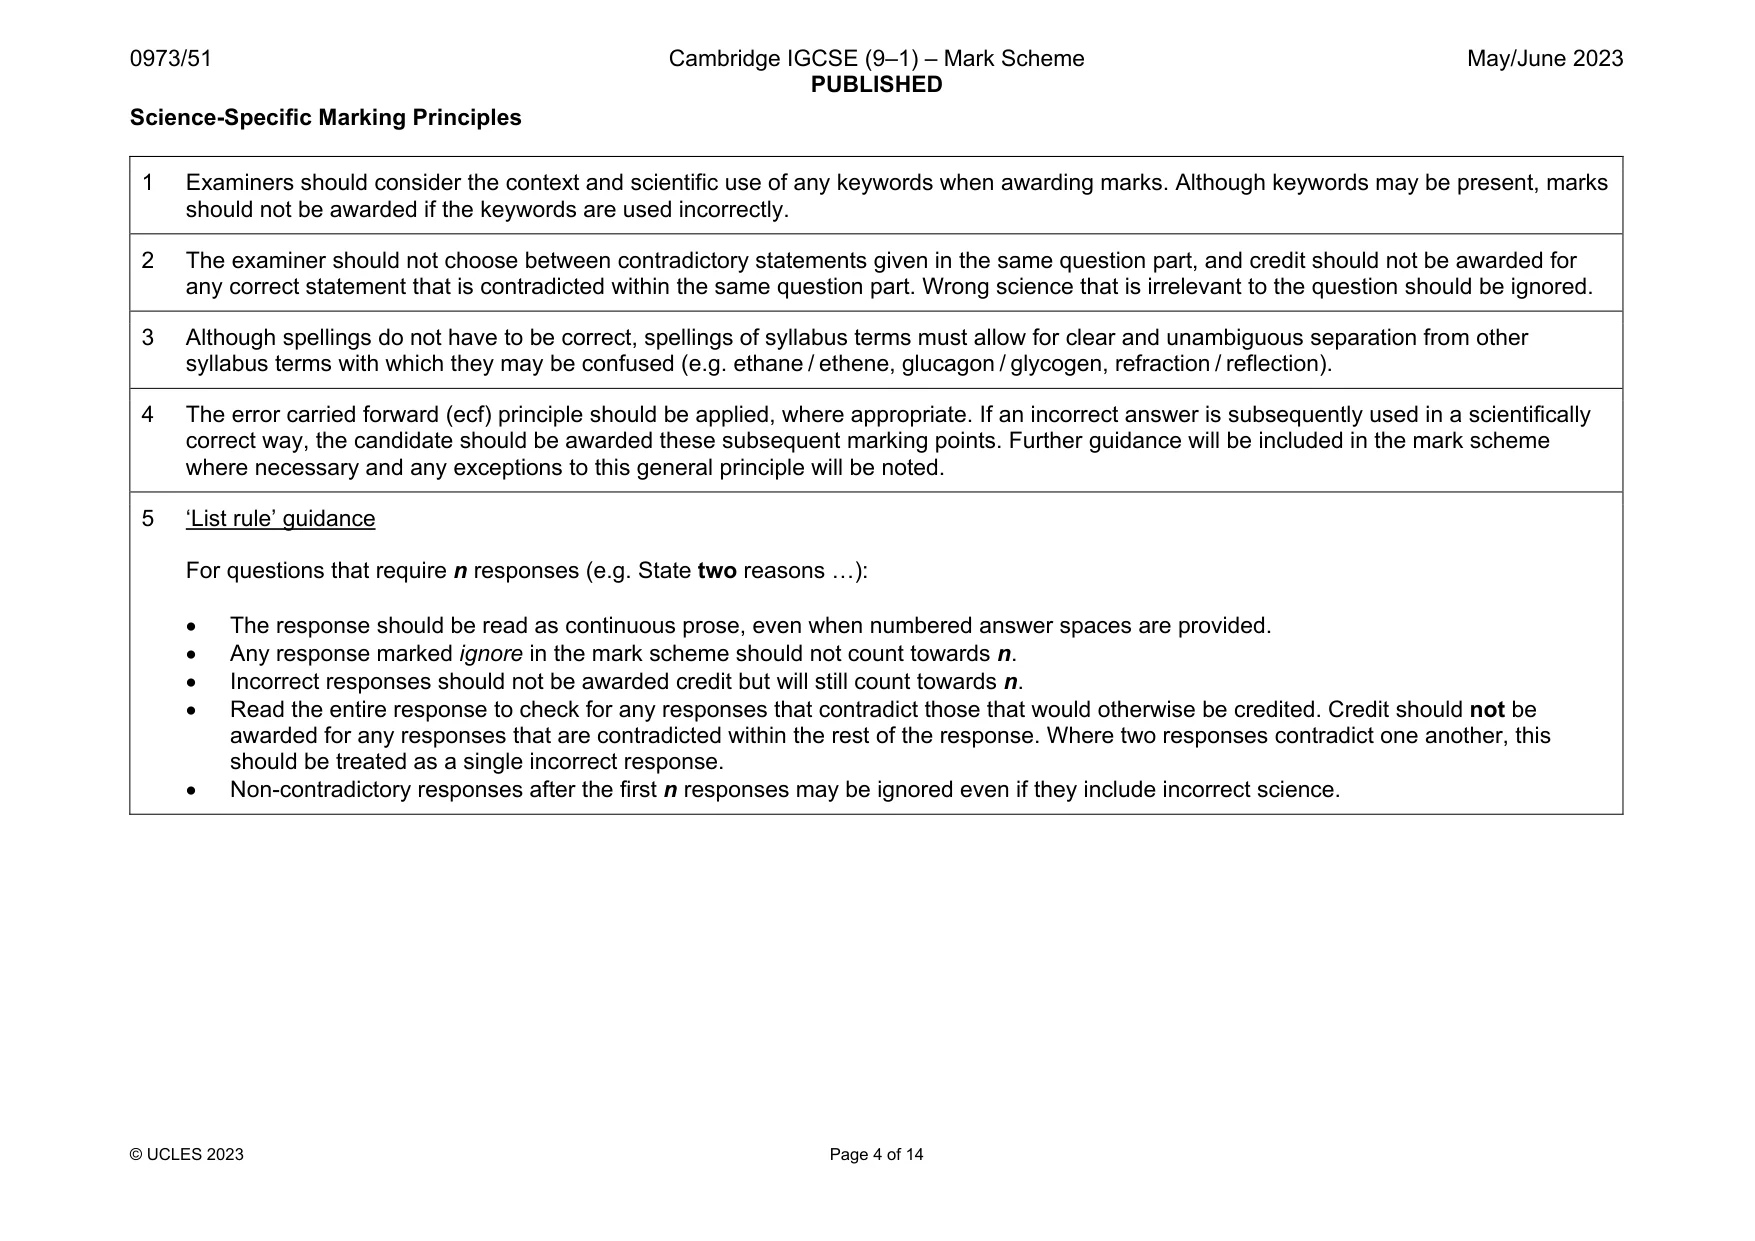
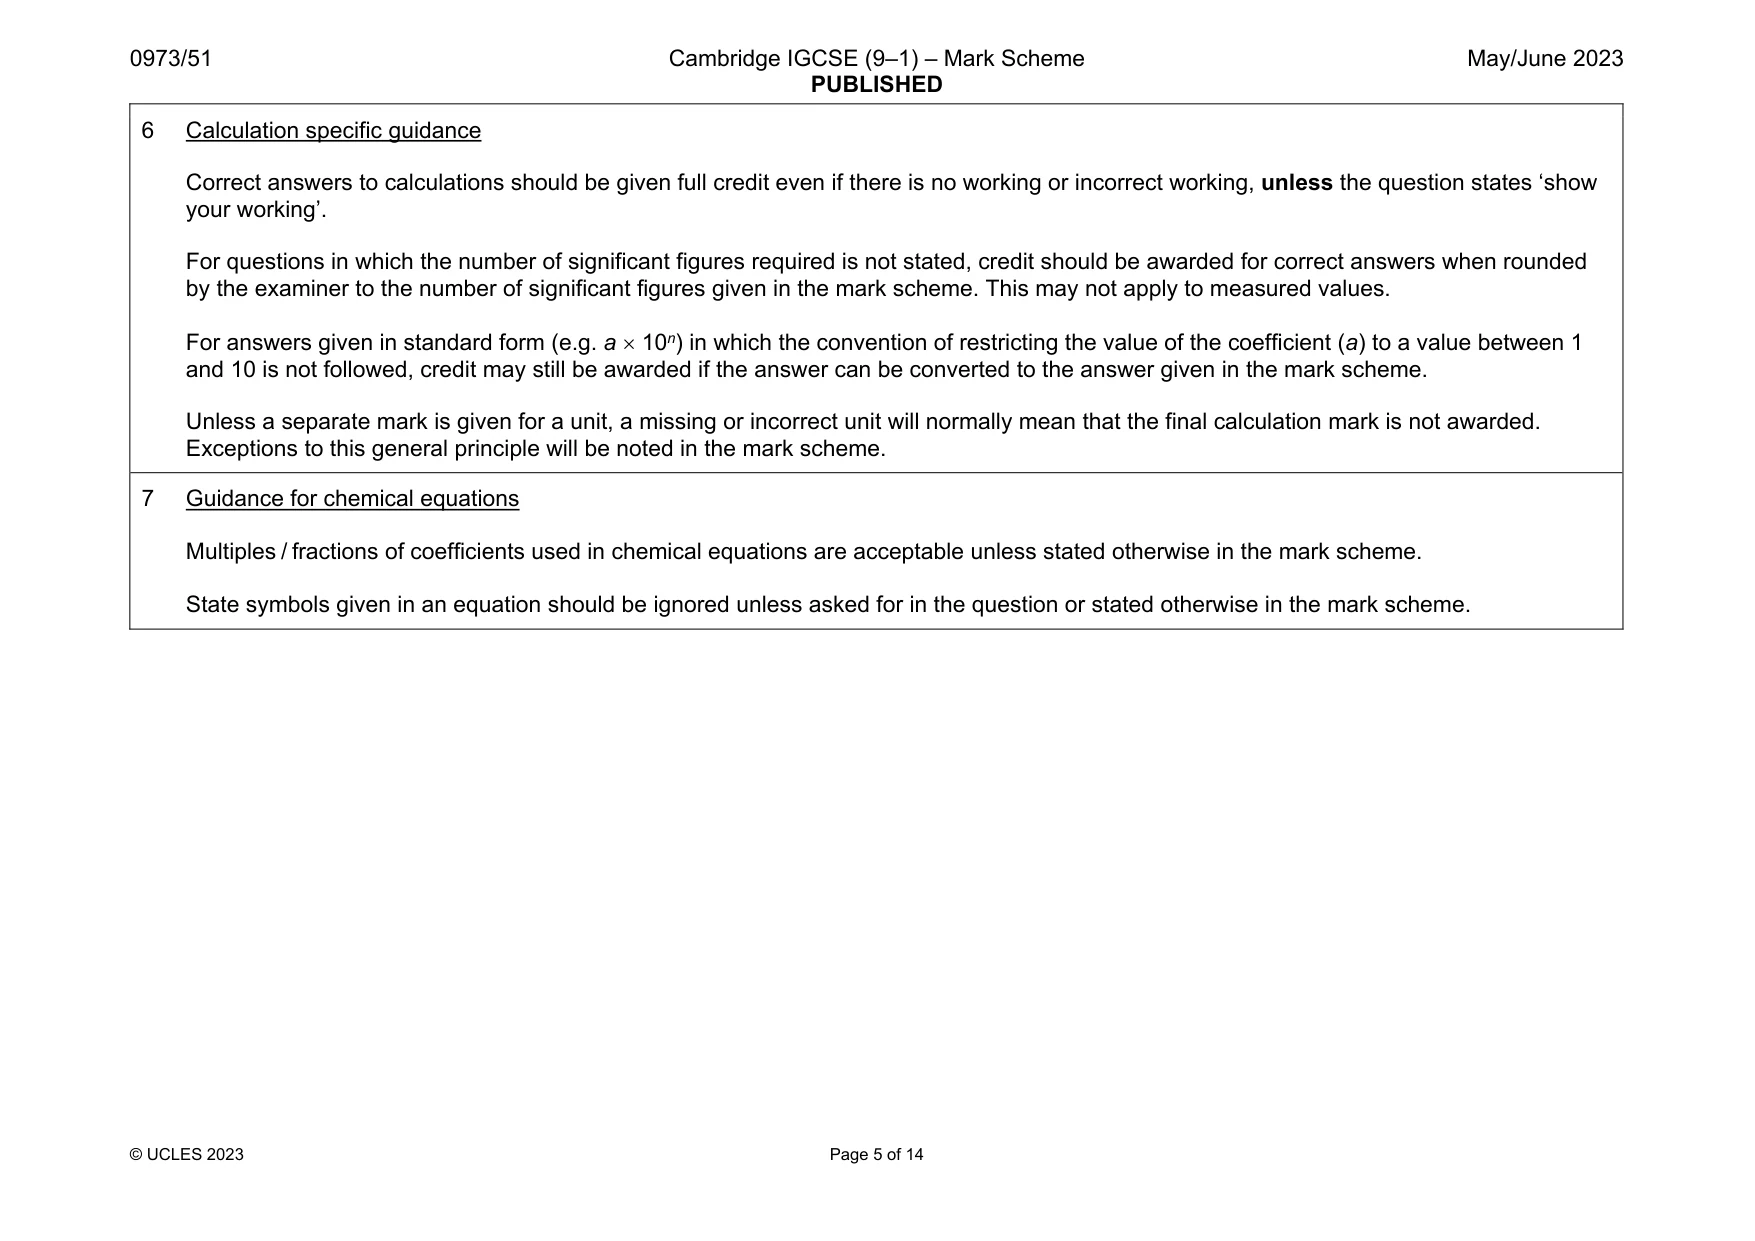
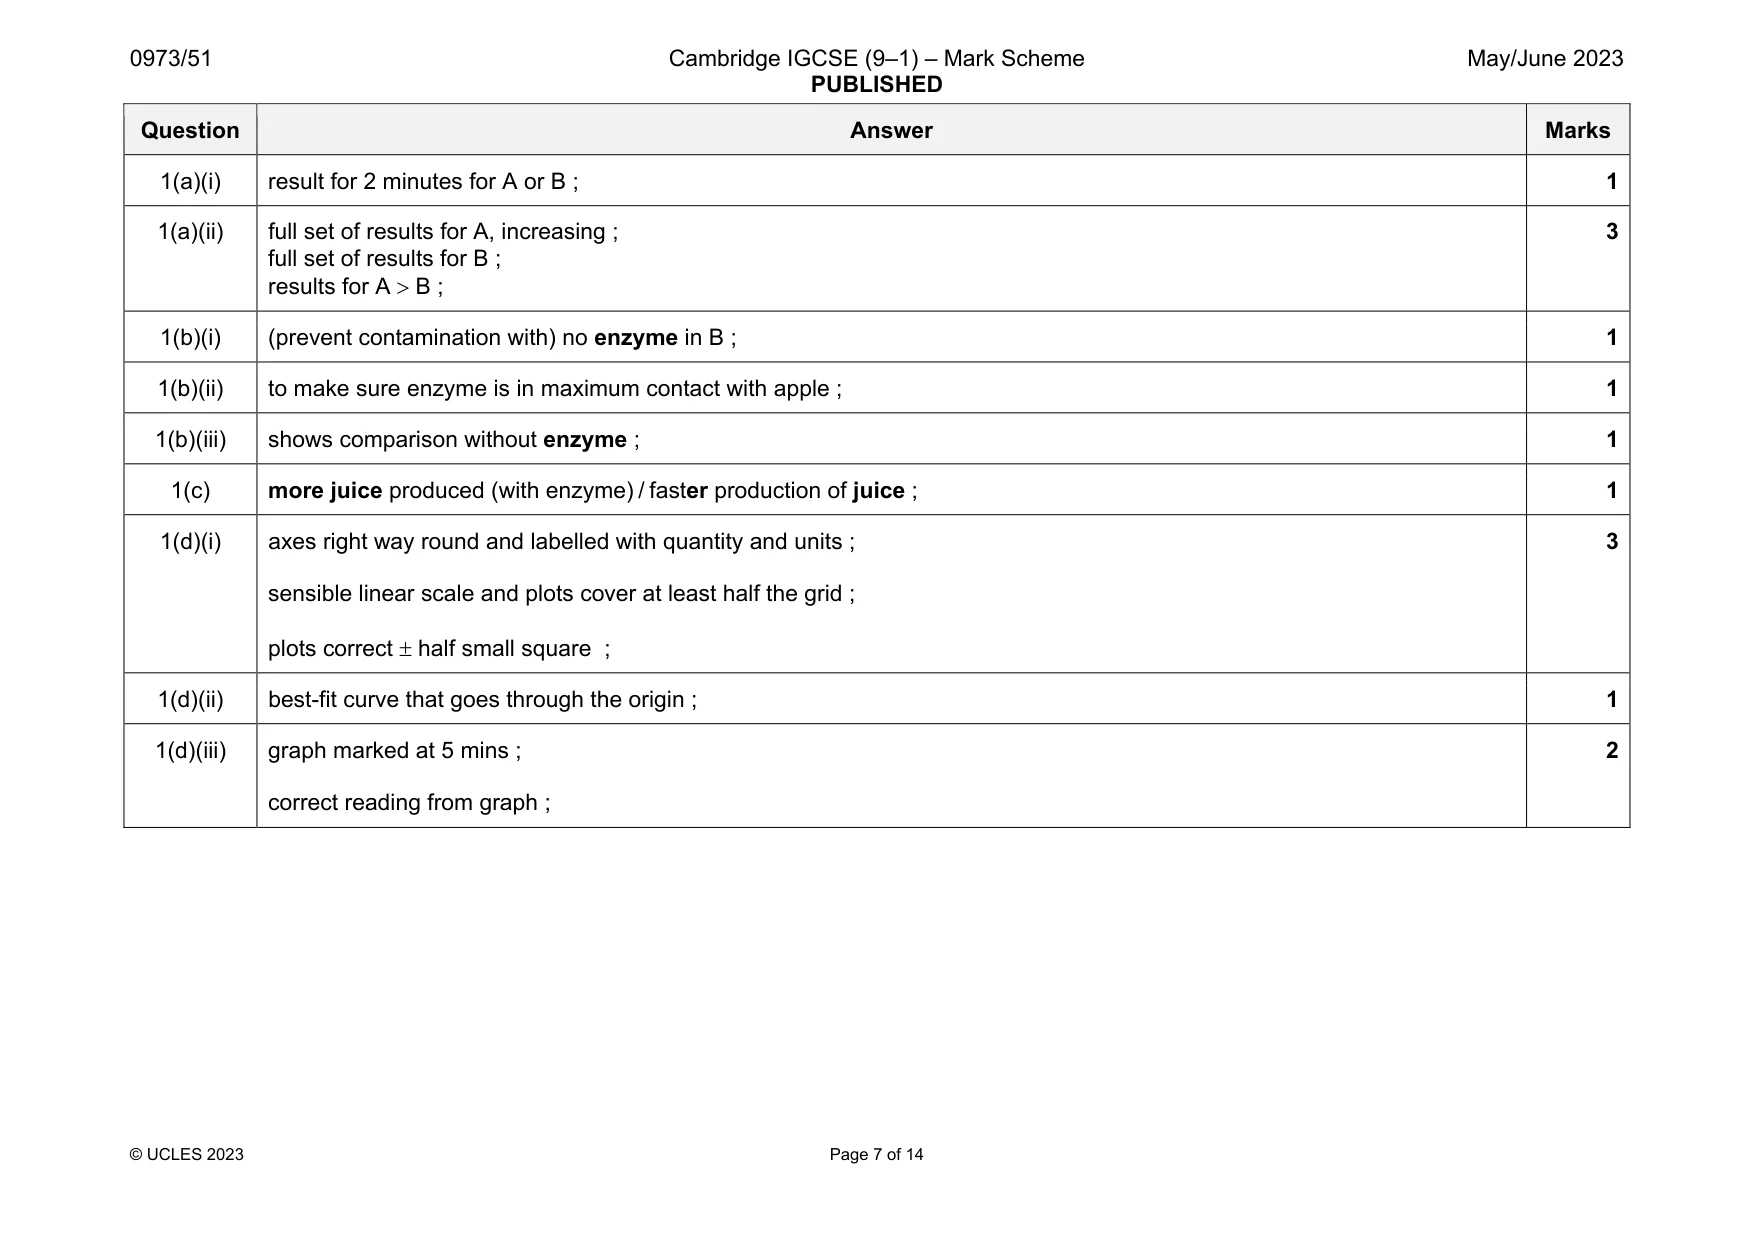
Mark scheme: 1(a)(i) result for 2 minutes for A or B ; 1 1(a)(ii) full set of results for A, increasing ; full set of results for B ; results for A B ; 3 1(b)(i) (prevent contamination with) no enzyme in B ; 1 1(b)(ii) to make sure enzyme is in maximum contact with apple ; 1 1(b)(iii) shows comparison without enzyme ; 1 1(c) more juice produced (with enzyme) / faster production of juice ; 1 1(d)(i) axes right way round and labelled with quantity and units ; sensible linear scale and plots cover at least half the grid ; plots correct half small square ; 3 1(d)(ii) best-fit curve that goes through the origin ; 1 1(d)(iii) graph marked at 5 mins ; correct reading from graph ; 2
Q2 · You are going to test some of the apple juice, made in Question 1, for its nutrient…
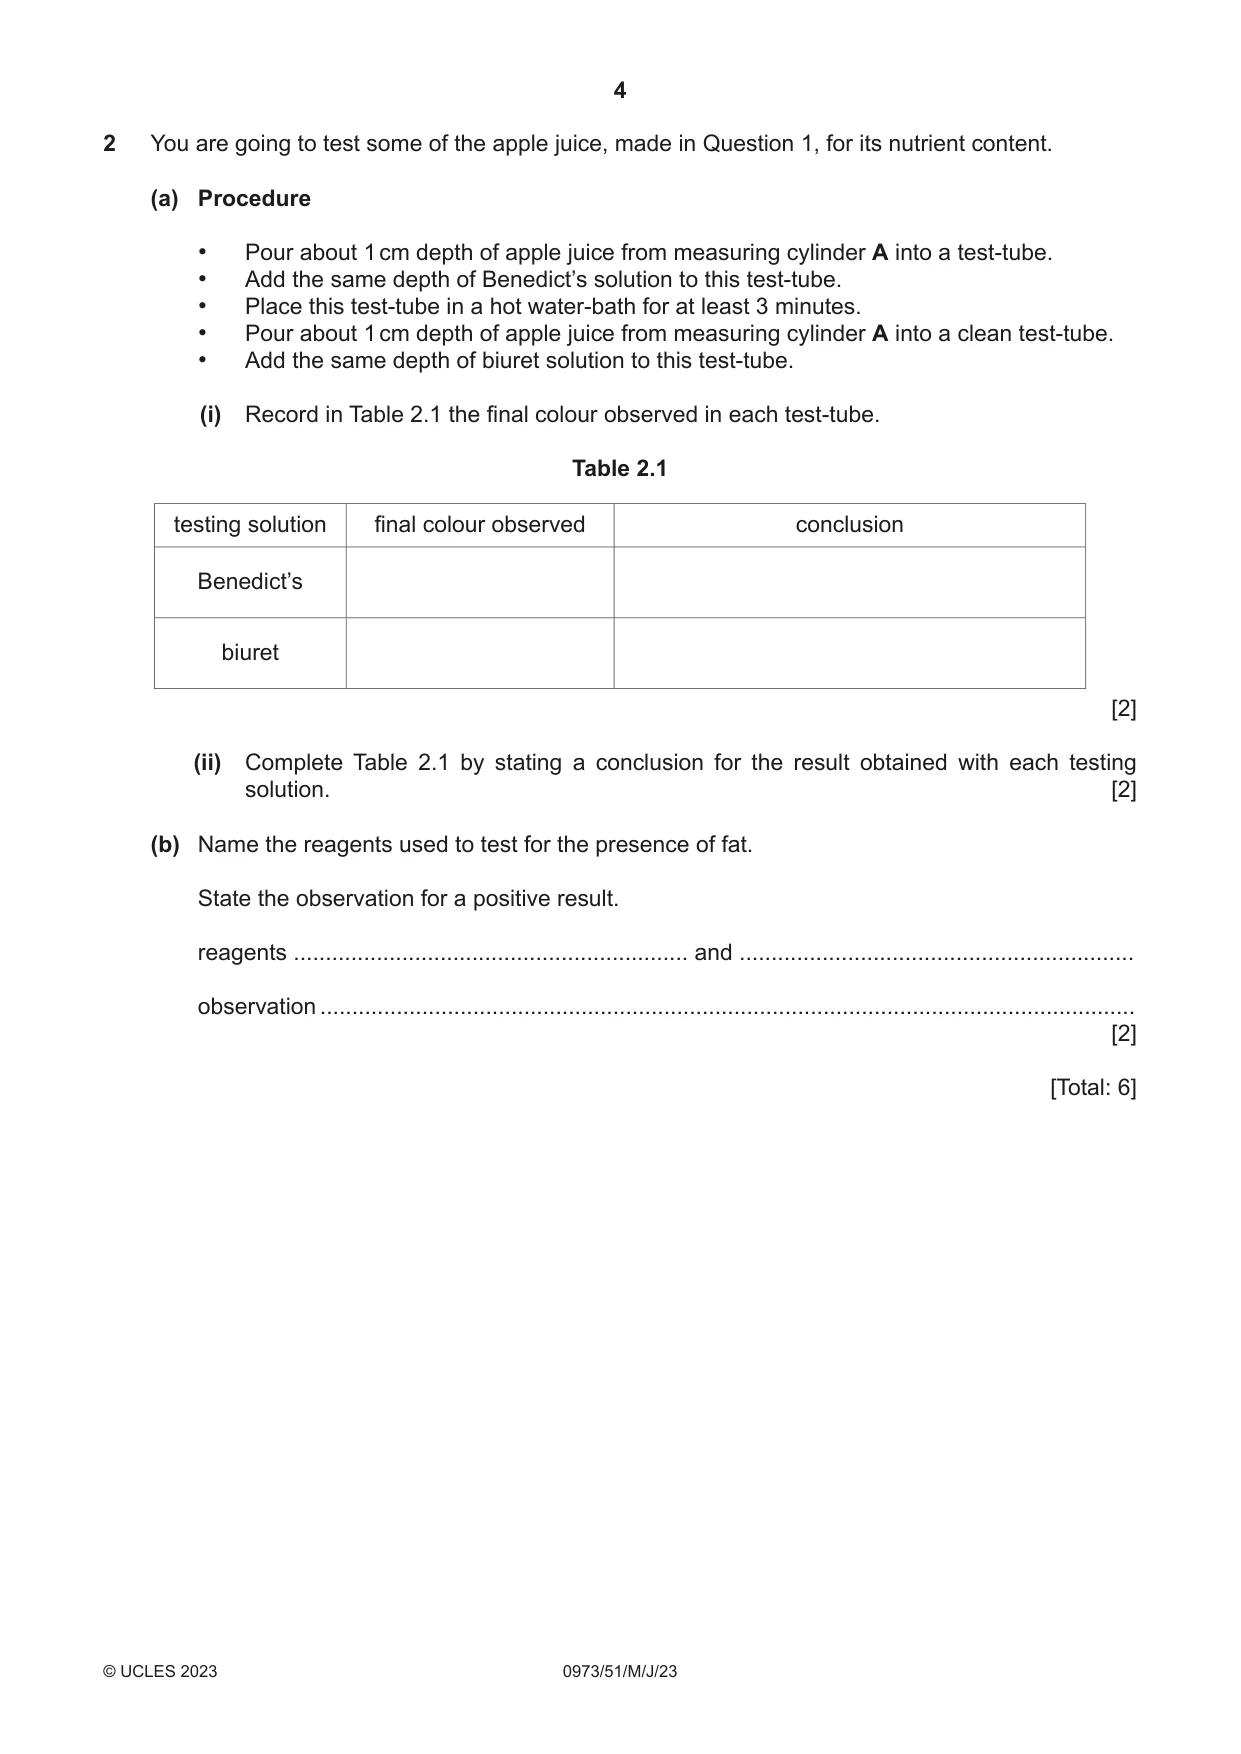
2 You are going to test some of the apple juice, made in Question 1, for its nutrient content. (a) Procedure • Pour about 1 cm depth of apple juice from measuring cylinder A into a test-tube. • Add the same depth of Benedict’s solution to this test-tube. • Place this test-tube in a hot water-bath for at least 3 minutes. • Pour about 1 cm depth of apple juice from measuring cylinder A into a clean test-tube. • Add the same depth of biuret solution to this test-tube. (i) Record in Table 2.1 the final colour observed in each test-tube. Table 2.1 testing solution final colour observed conclusion Benedict’s biuret [2] (ii) Complete Table 2.1 by stating a conclusion for the result obtained with each testing solution. [2] (b) Name the reagents used to test for the presence of fat. State the observation for a positive result. reagents .............................................................. and .............................................................. observation ................................................................................................................................ [2] [Total: 6]
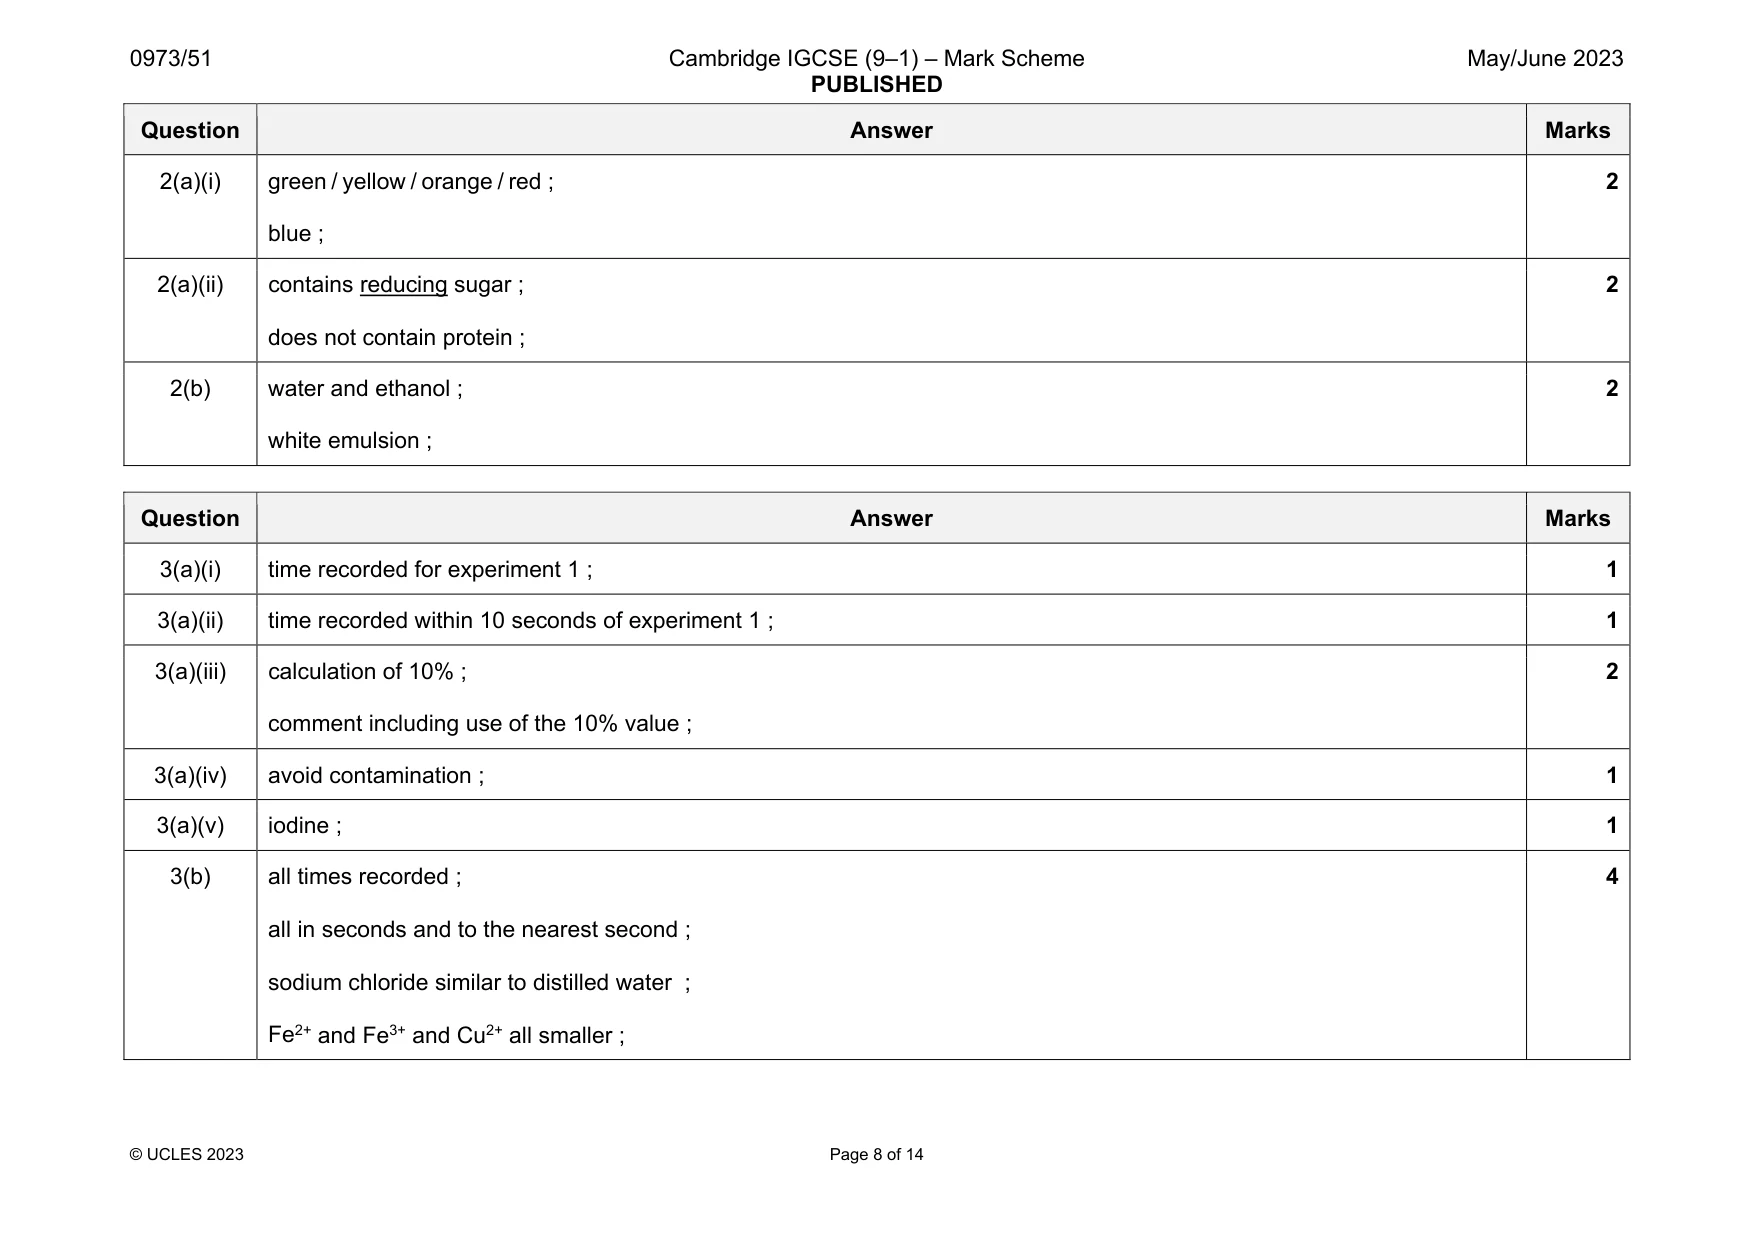
Mark scheme: 2(a)(i) green / yellow / orange / red ; blue ; 2 2(a)(ii) contains reducing sugar ; does not contain protein ; 2 2(b) water and ethanol ; white emulsion ; 2
Q3 · You are going to investigate the rate of the reaction between solutions K and H
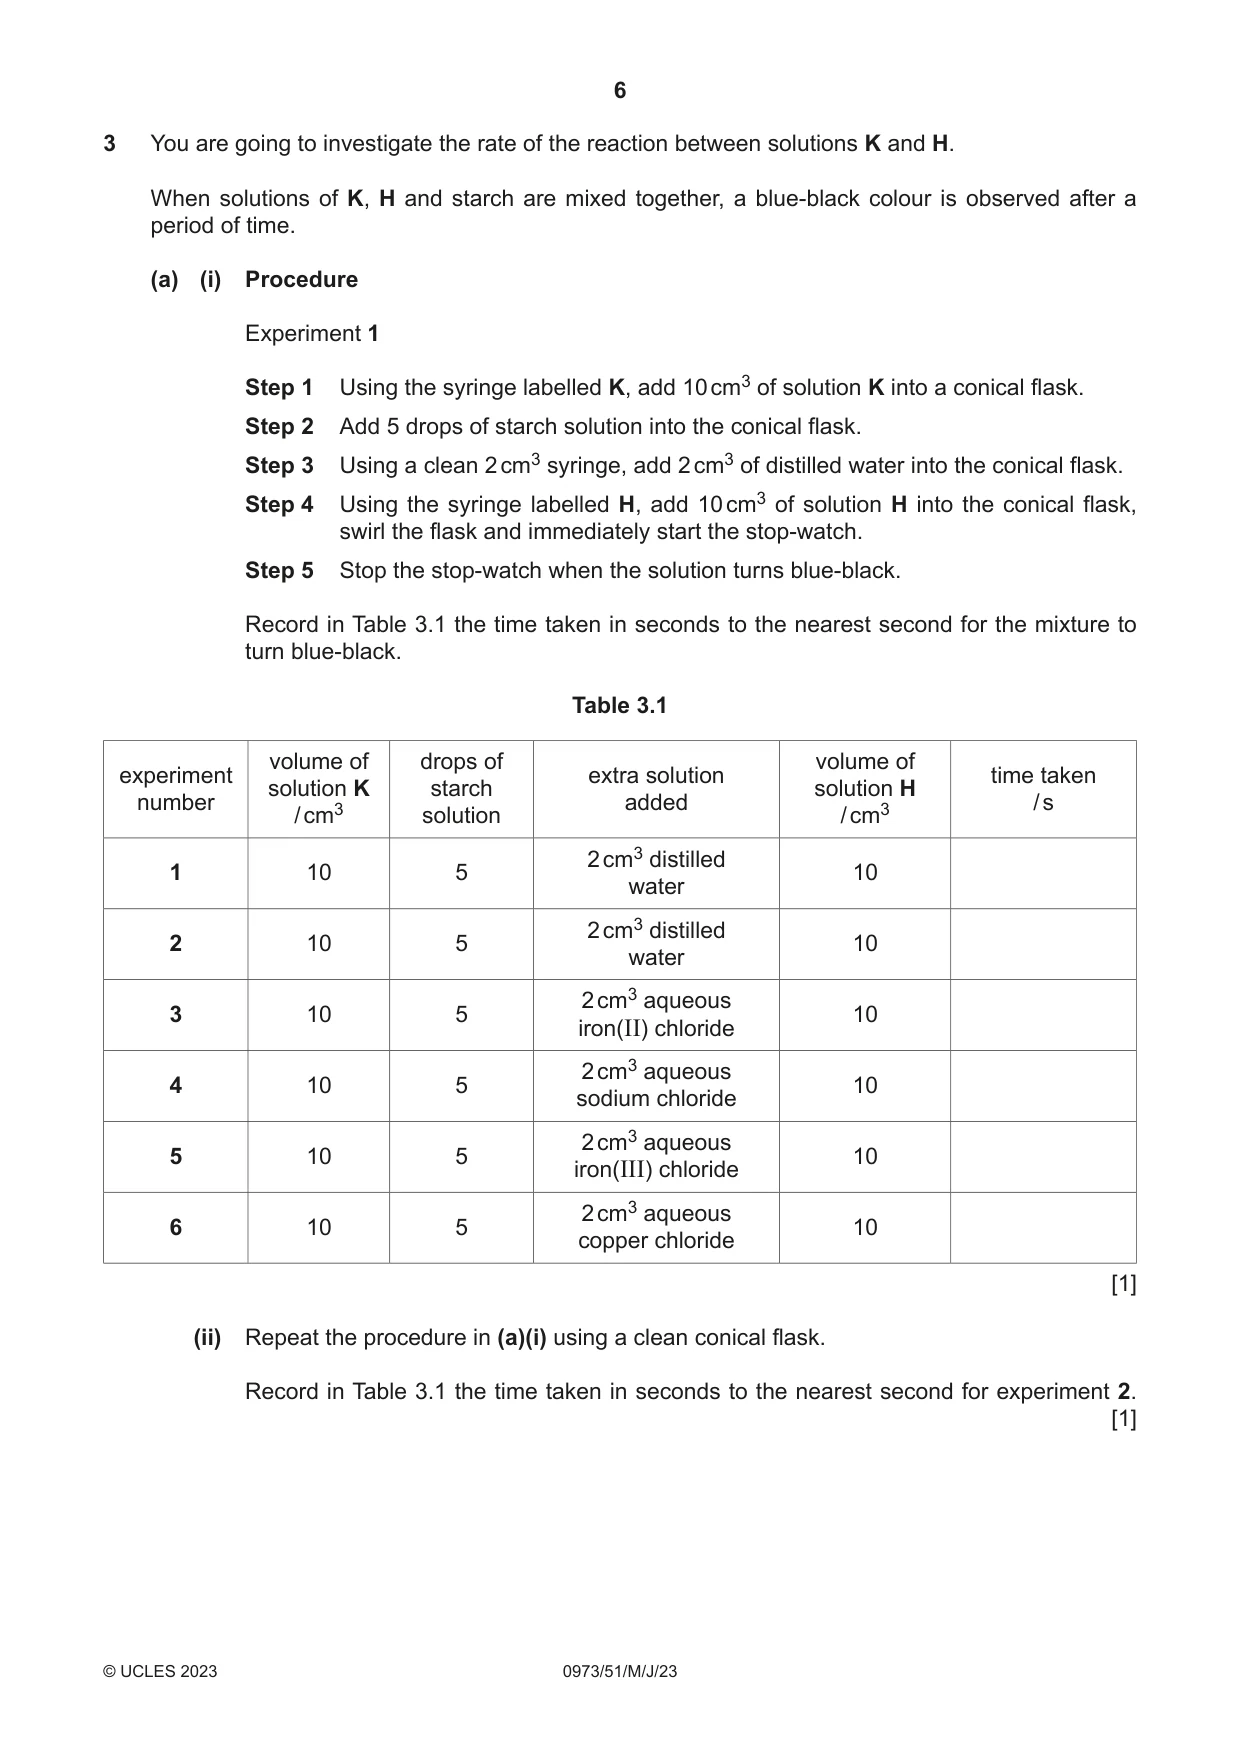
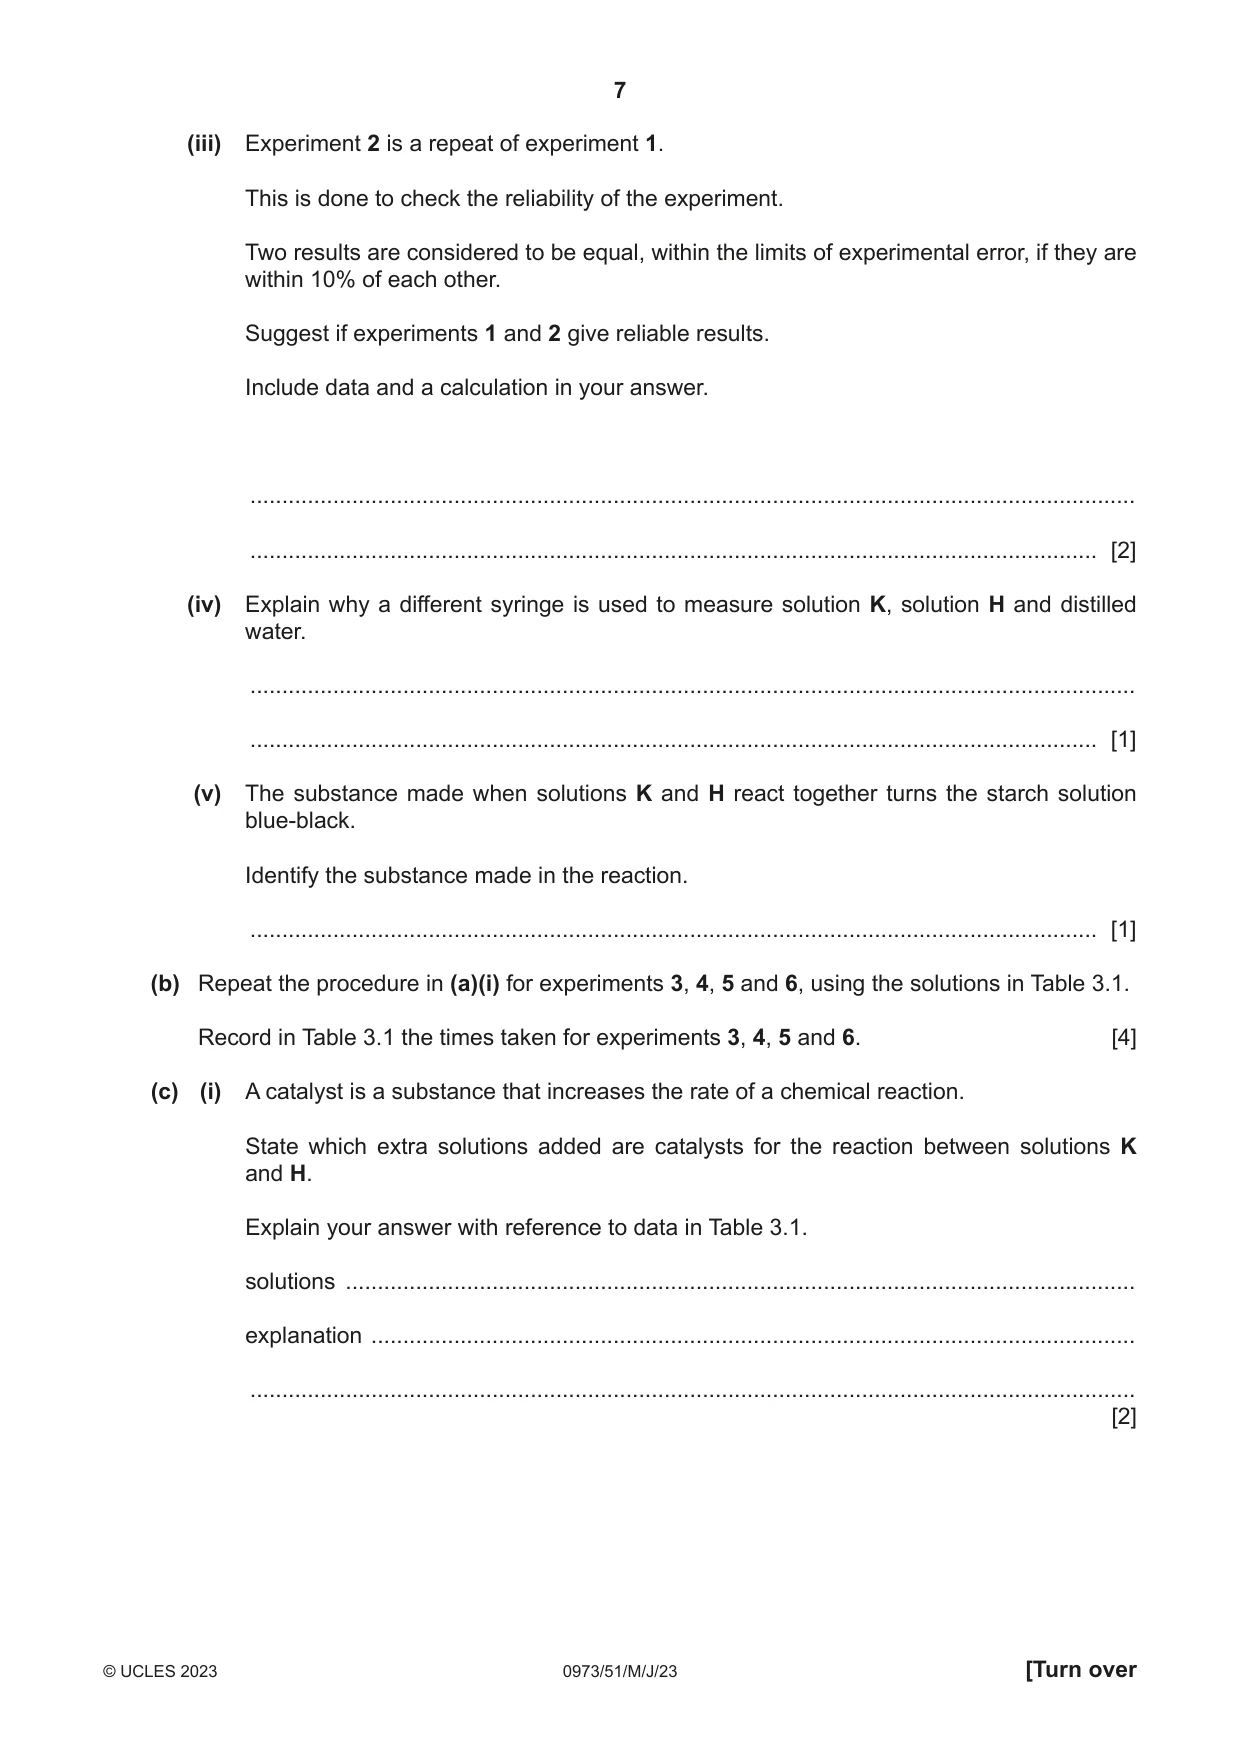
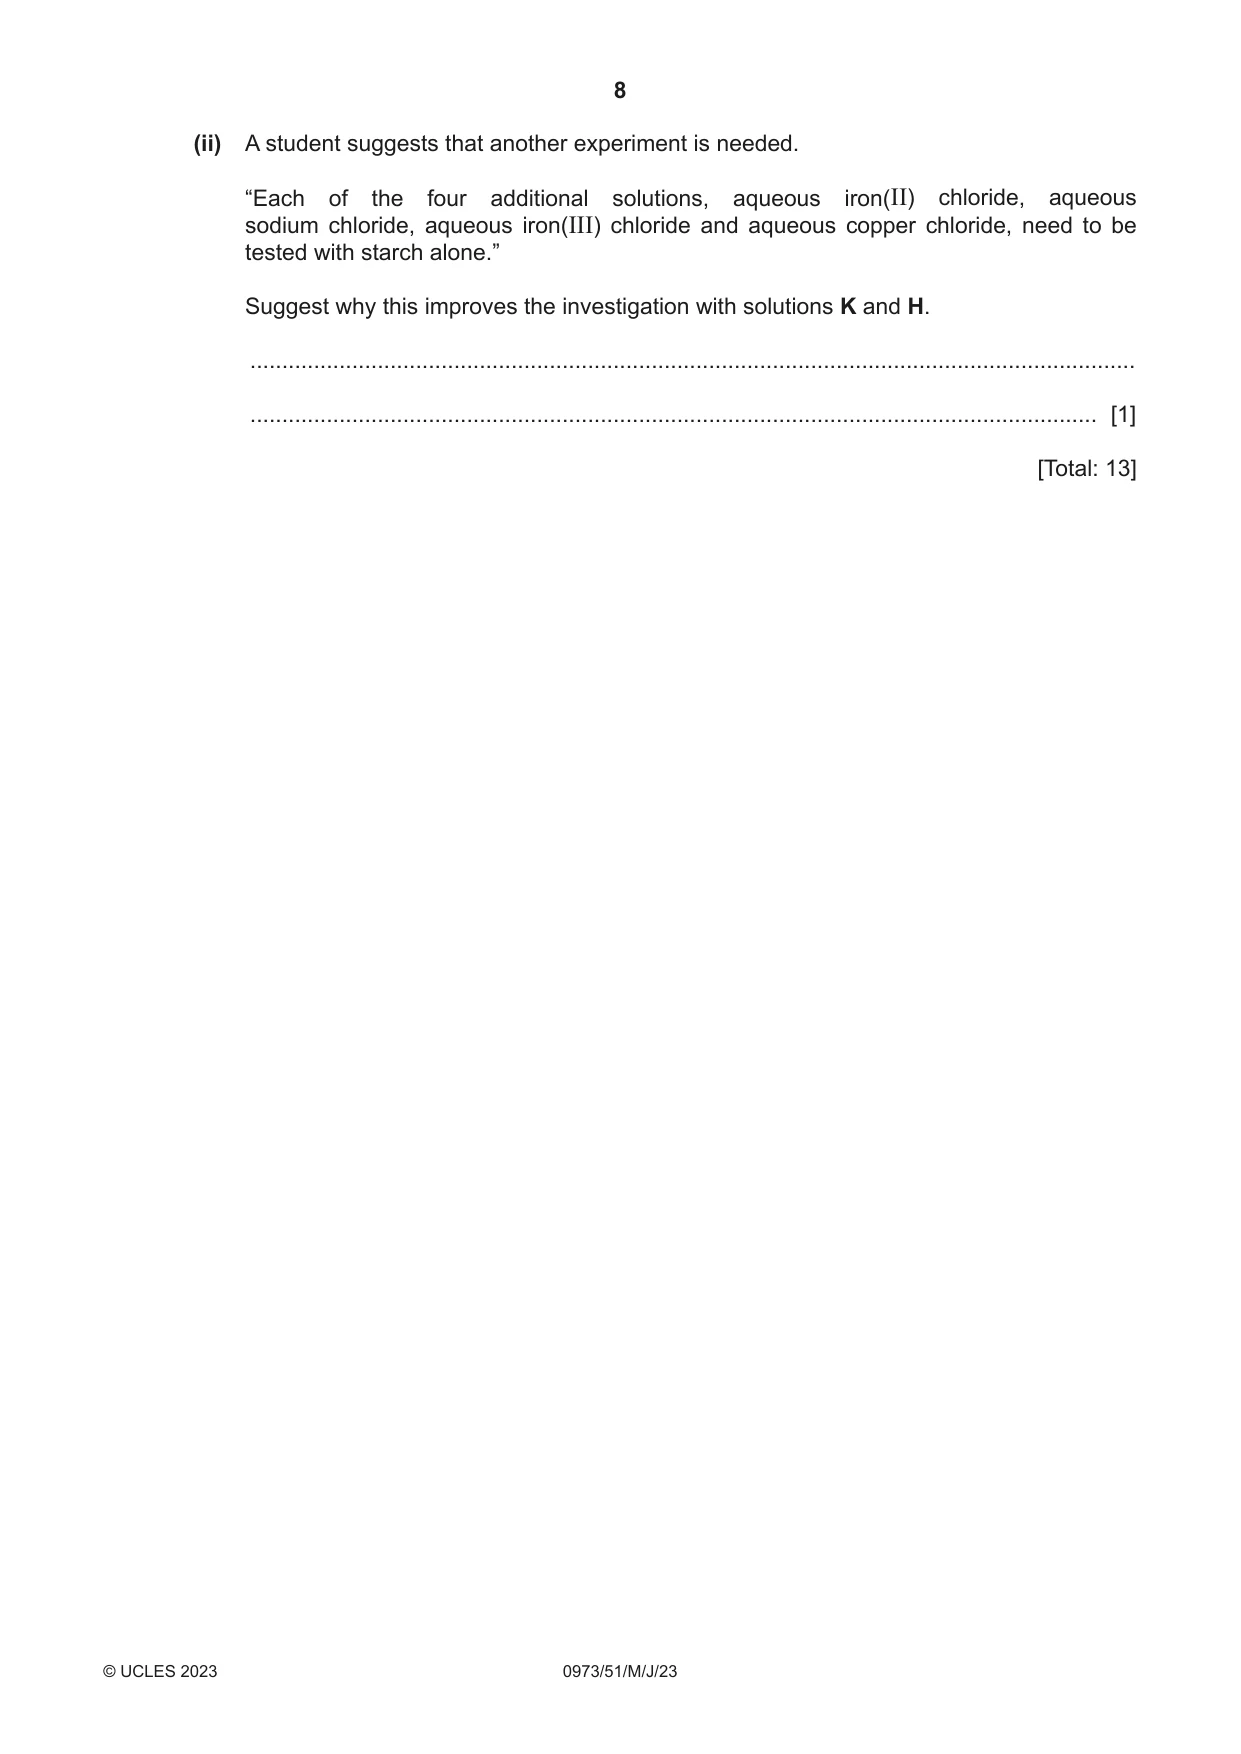
3 You are going to investigate the rate of the reaction between solutions K and H. When solutions of K, H and starch are mixed together, a blue-black colour is observed after a period of time. (a) (i) Procedure Experiment 1 Step 1 Using the syringe labelled K, add 10 cm3 of solution K into a conical flask. Step 2 Add 5 drops of starch solution into the conical flask. Step 3 Using a clean 2 cm3 syringe, add 2 cm3 of distilled water into the conical flask. Step 4 Using the syringe labelled H, add 10 cm3 of solution H into the conical flask, swirl the flask and immediately start the stop-watch. Step 5 Stop the stop-watch when the solution turns blue-black. Record in Table 3.1 the time taken in seconds to the nearest second for the mixture to turn blue-black. Table 3.1 volume of drops of volume of experiment extra solution time taken solution K starch solution H number added / s / cm3 solution / cm3 2 cm3 distilled 1 10 5 10 water 2 cm3 distilled 2 10 5 10 water 2 cm3 aqueous 3 10 5 10 iron(II) chloride 2 cm3 aqueous 4 10 5 10 sodium chloride 2 cm3 aqueous 5 10 5 10 iron(III) chloride 2 cm3 aqueous 6 10 5 10 copper chloride [1] (ii) Repeat the procedure in (a)(i) using a clean conical flask. Record in Table 3.1 the time taken in seconds to the nearest second for experiment 2. [1] (iii) Experiment 2 is a repeat of experiment 1. This is done to check the reliability of the experiment. Two results are considered to be equal, within the limits of experimental error, if they are within 10% of each other. Suggest if experiments 1 and 2 give reliable results. Include data and a calculation in your answer. ........................................................................................................................................... ..................................................................................................................................... [2] (iv) Explain why a different syringe is used to measure solution K, solution H and distilled water. ........................................................................................................................................... ..................................................................................................................................... [1] (v) The substance made when solutions K and H react together turns the starch solution blue-black. Identify the substance made in the reaction. ..................................................................................................................................... [1] (b) Repeat the procedure in (a)(i) for experiments 3, 4, 5 and 6, using the solutions in Table 3.1. Record in Table 3.1 the times taken for experiments 3, 4, 5 and 6. [4] (c) (i) A catalyst is a substance that increases the rate of a chemical reaction. State which extra solutions added are catalysts for the reaction between solutions K and H. Explain your answer with reference to data in Table 3.1. solutions ............................................................................................................................ explanation ........................................................................................................................ ........................................................................................................................................... [2] (ii) A student suggests that another experiment is needed. “Each of the four additional solutions, aqueous iron(II) chloride, aqueous sodium chloride, aqueous iron(III) chloride and aqueous copper chloride, need to be tested with starch alone.” Suggest why this improves the investigation with solutions K and H. ........................................................................................................................................... ..................................................................................................................................... [1] [Total: 13]
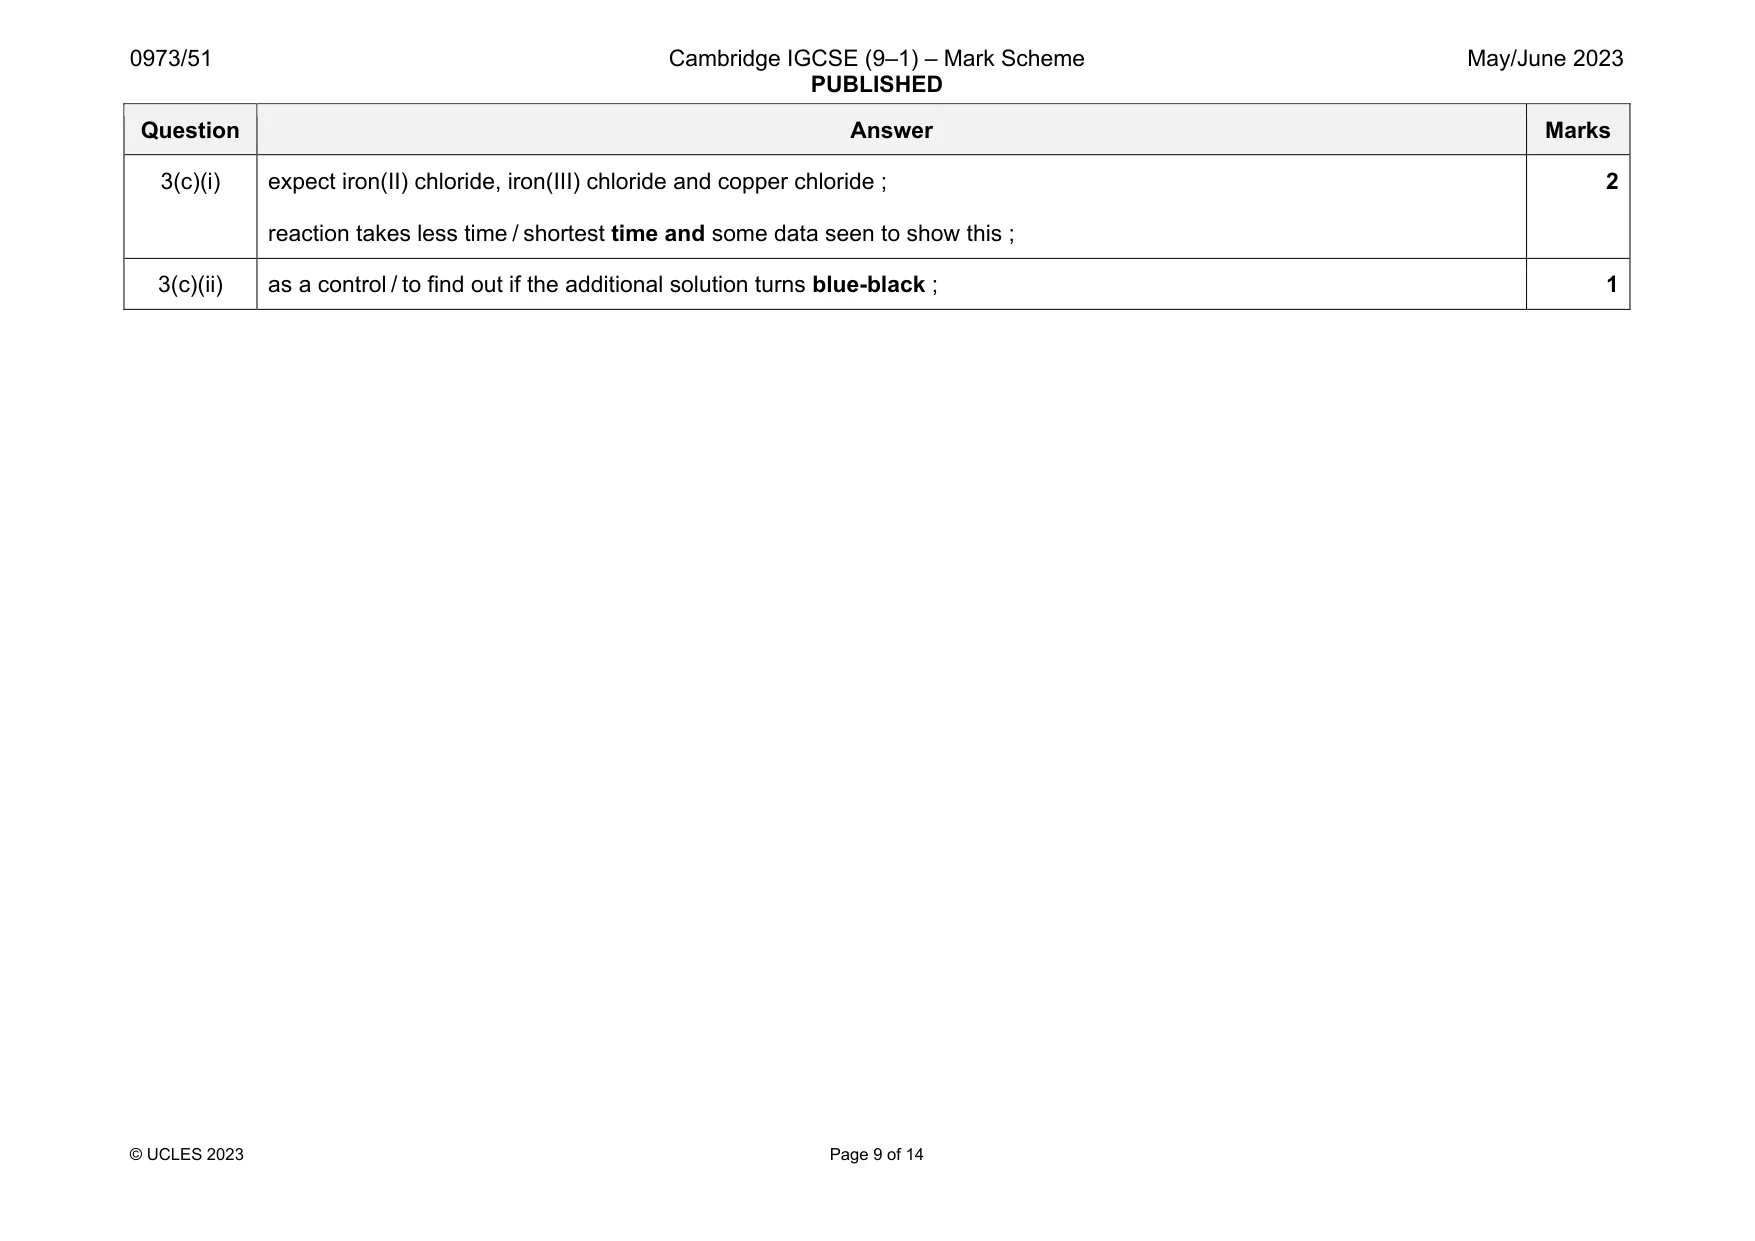
Mark scheme: 3(a)(i) time recorded for experiment 1 ; 1 3(a)(ii) time recorded within 10 seconds of experiment 1 ; 1 3(a)(iii) calculation of 10% ; comment including use of the 10% value ; 2 3(a)(iv) avoid contamination ; 1 3(a)(v) iodine ; 1 3(b) all times recorded ; all in seconds and to the nearest second ; sodium chloride similar to distilled water ; Fe2+ and Fe3+ and Cu2+ all smaller ; 4 Question Answer Marks 3(c)(i) expect iron(II) chloride, iron(III) chloride and copper chloride ; reaction takes less time / shortest time and some data seen to show this ; 2 3(c)(ii) as a control / to find out if the additional solution turns blue-black ; 1
Q4 · Aqueous hydrogen peroxide is a solution that breaks down slowly into water and oxygen gas
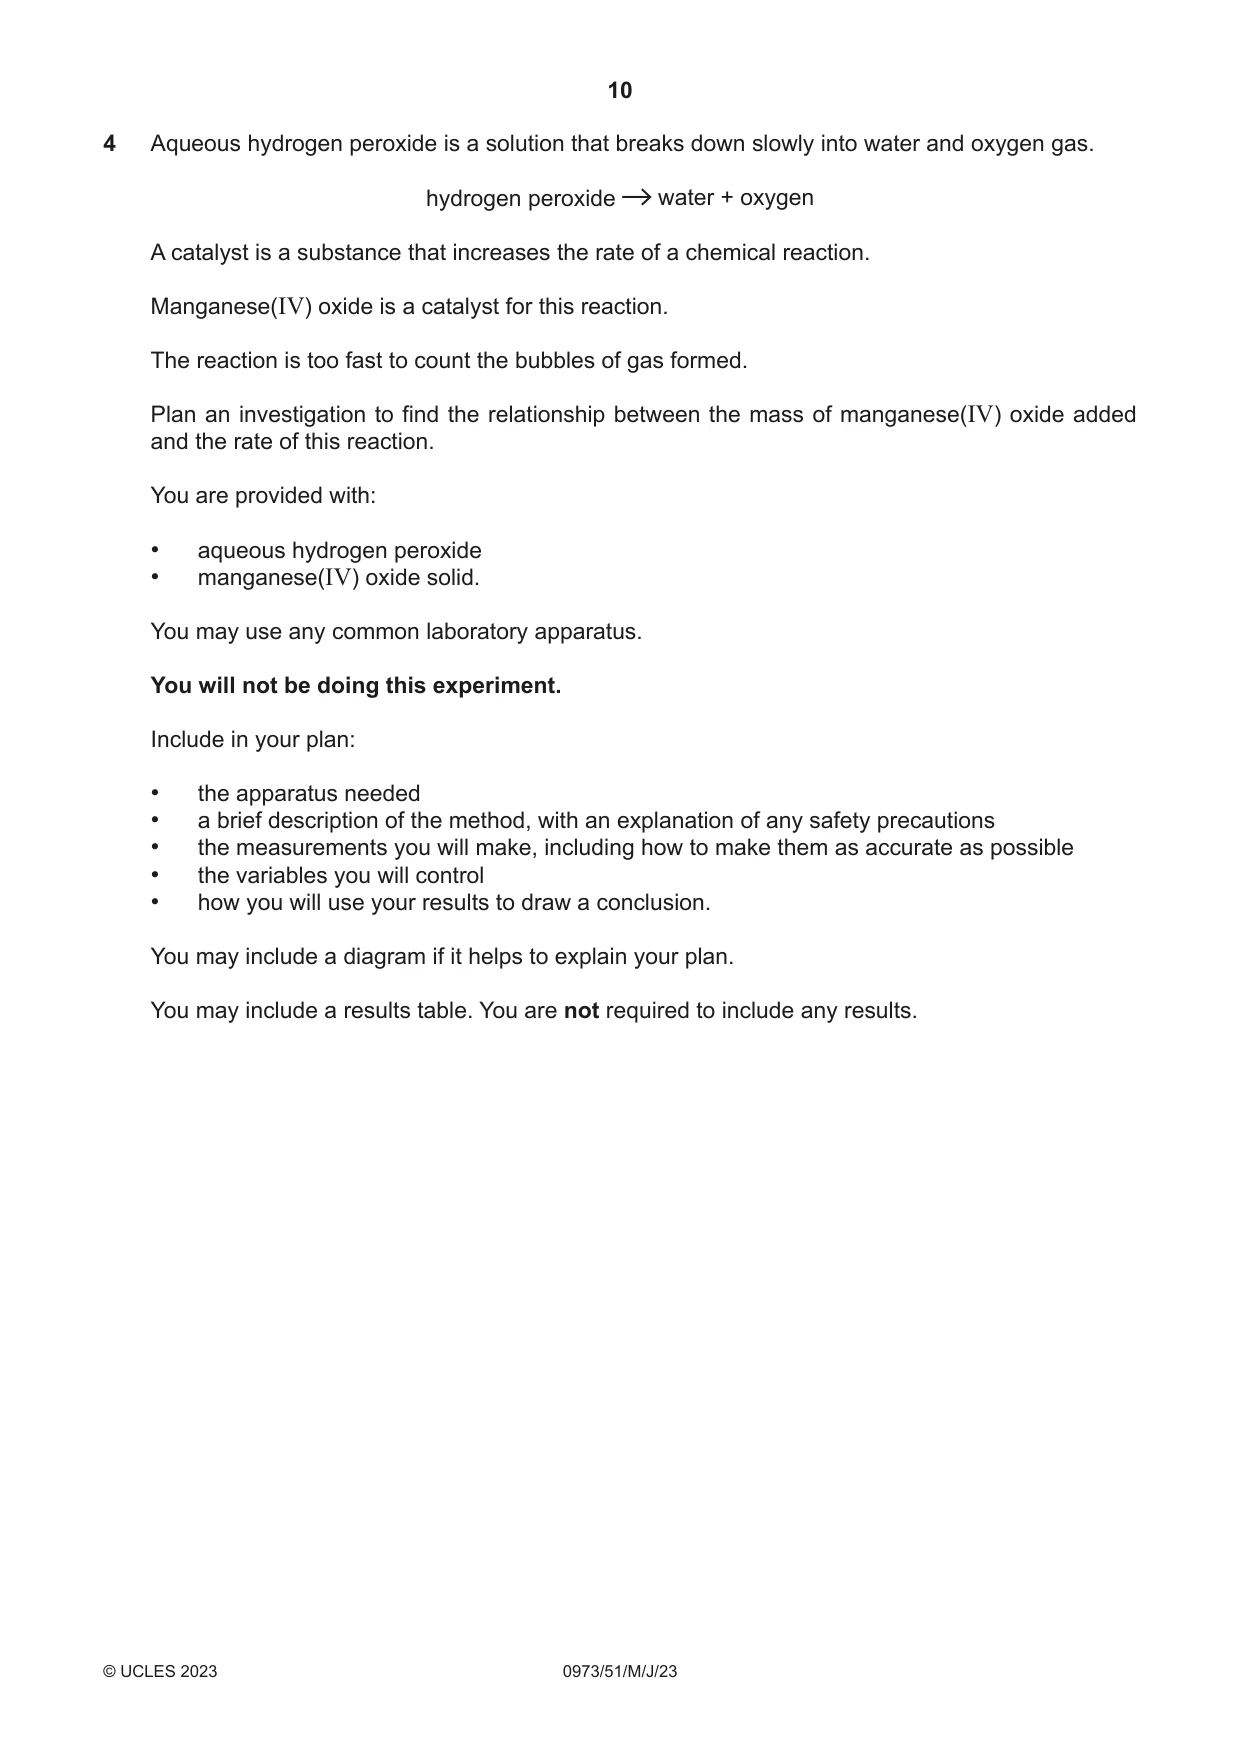
4 Aqueous hydrogen peroxide is a solution that breaks down slowly into water and oxygen gas. hydrogen peroxide water + oxygen A catalyst is a substance that increases the rate of a chemical reaction. Manganese(IV) oxide is a catalyst for this reaction. The reaction is too fast to count the bubbles of gas formed. Plan an investigation to find the relationship between the mass of manganese(IV) oxide added and the rate of this reaction. You are provided with: • aqueous hydrogen peroxide • manganese(IV) oxide solid. You may use any common laboratory apparatus. You will not be doing this experiment. Include in your plan: • the apparatus needed • a brief description of the method, with an explanation of any safety precautions • the measurements you will make, including how to make them as accurate as possible • the variables you will control • how you will use your results to draw a conclusion. You may include a diagram if it helps to explain your plan. You may include a results table. You are not required to include any results. .......................................................................................................................................................... .......................................................................................................................................................... .......................................................................................................................................................... .......................................................................................................................................................... .......................................................................................................................................................... .......................................................................................................................................................... .......................................................................................................................................................... .......................................................................................................................................................... .......................................................................................................................................................... .......................................................................................................................................................... .......................................................................................................................................................... .......................................................................................................................................................... .......................................................................................................................................................... .......................................................................................................................................................... .......................................................................................................................................................... .......................................................................................................................................................... .......................................................................................................................................................... .......................................................................................................................................................... .......................................................................................................................................................... .......................................................................................................................................................... .................................................................................................................................................... [7]
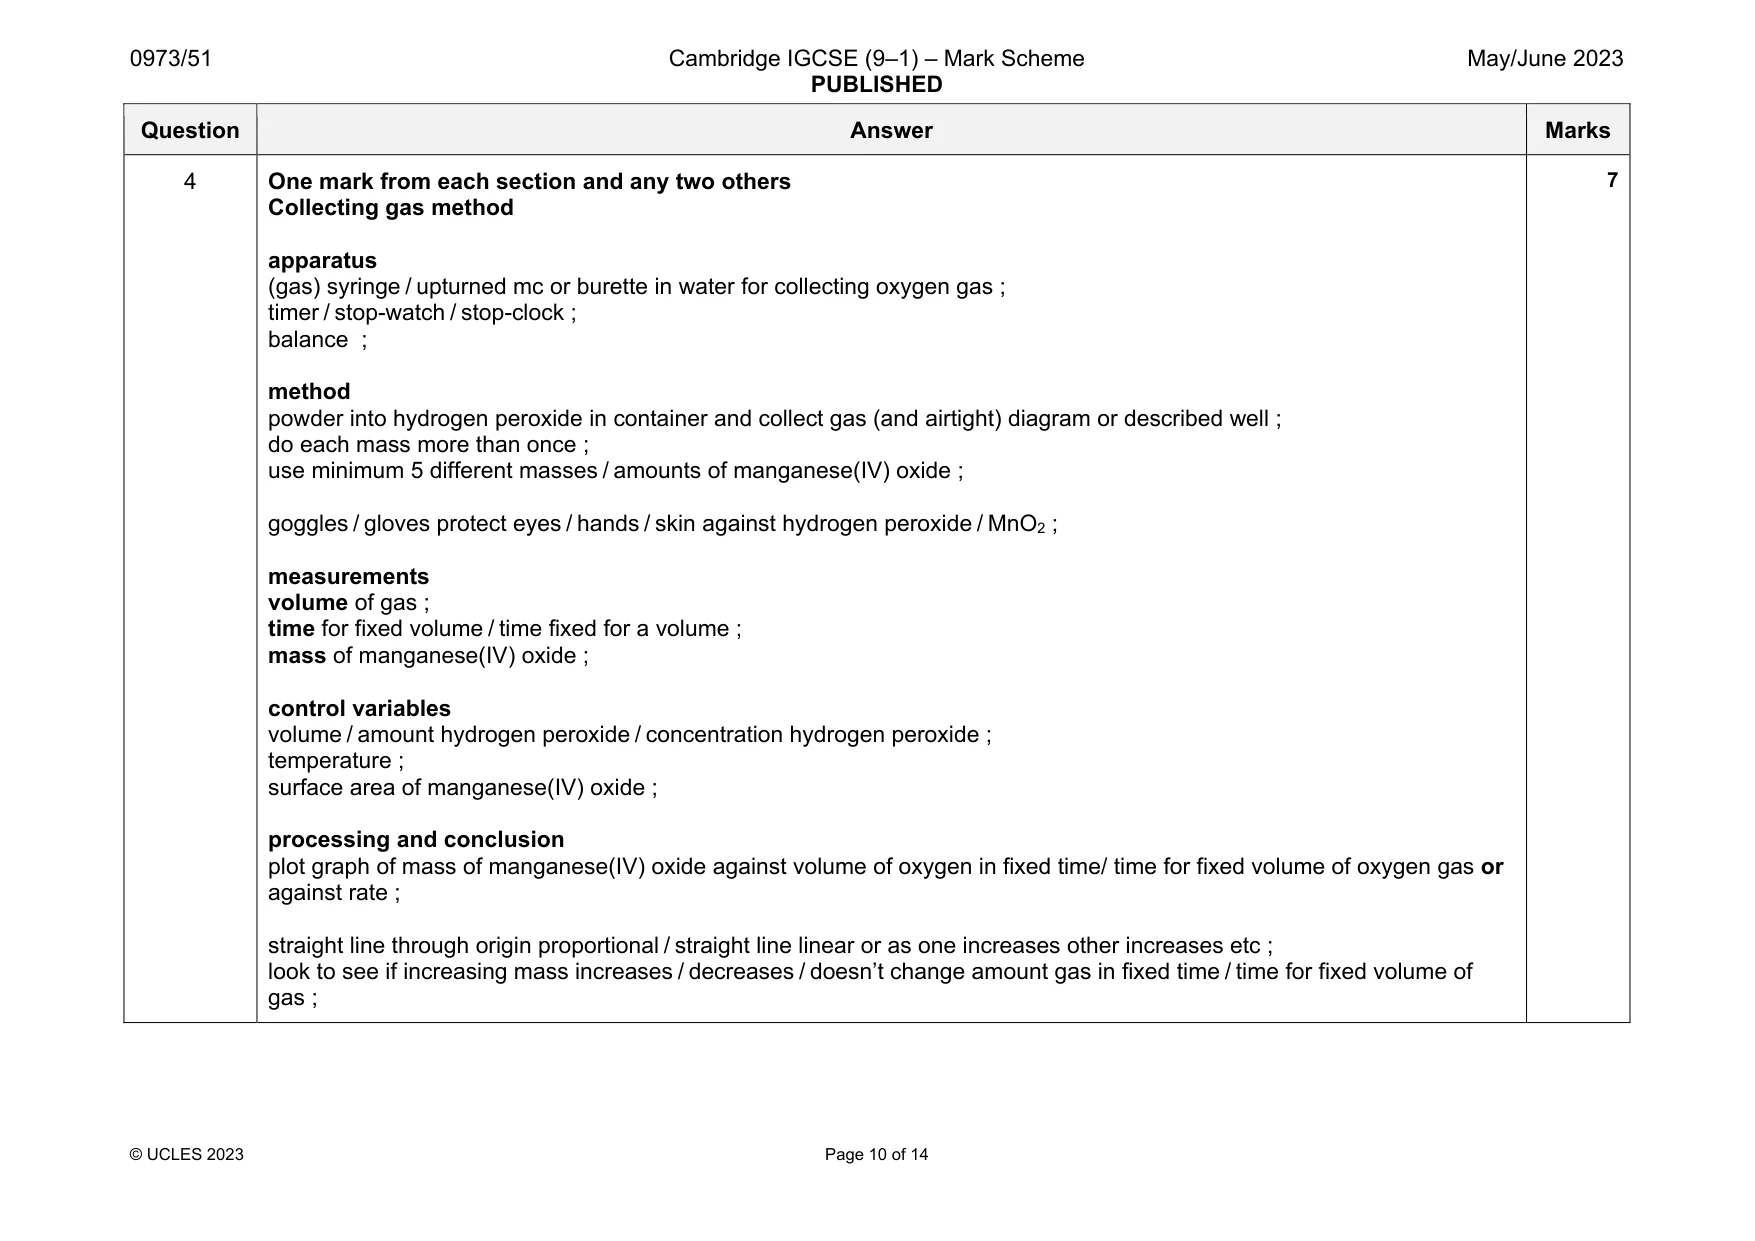
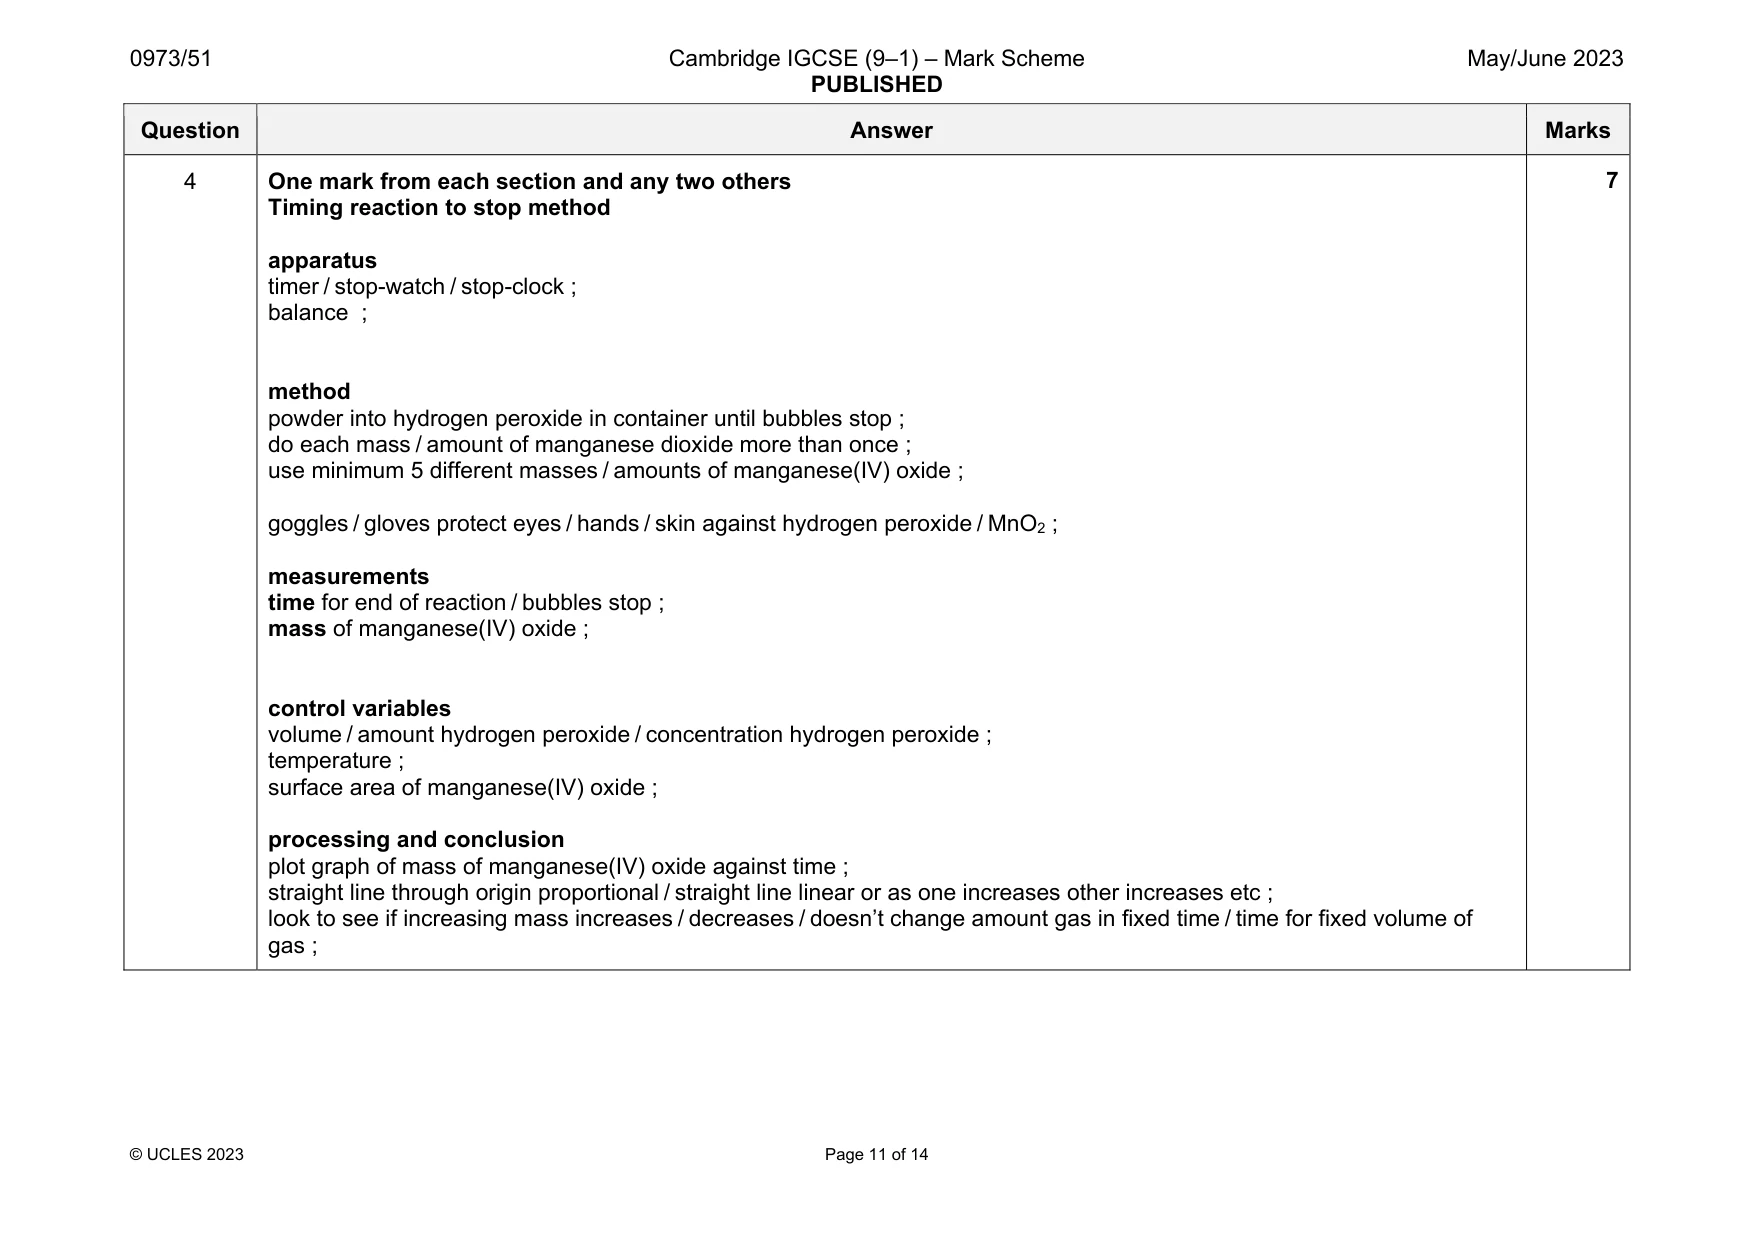
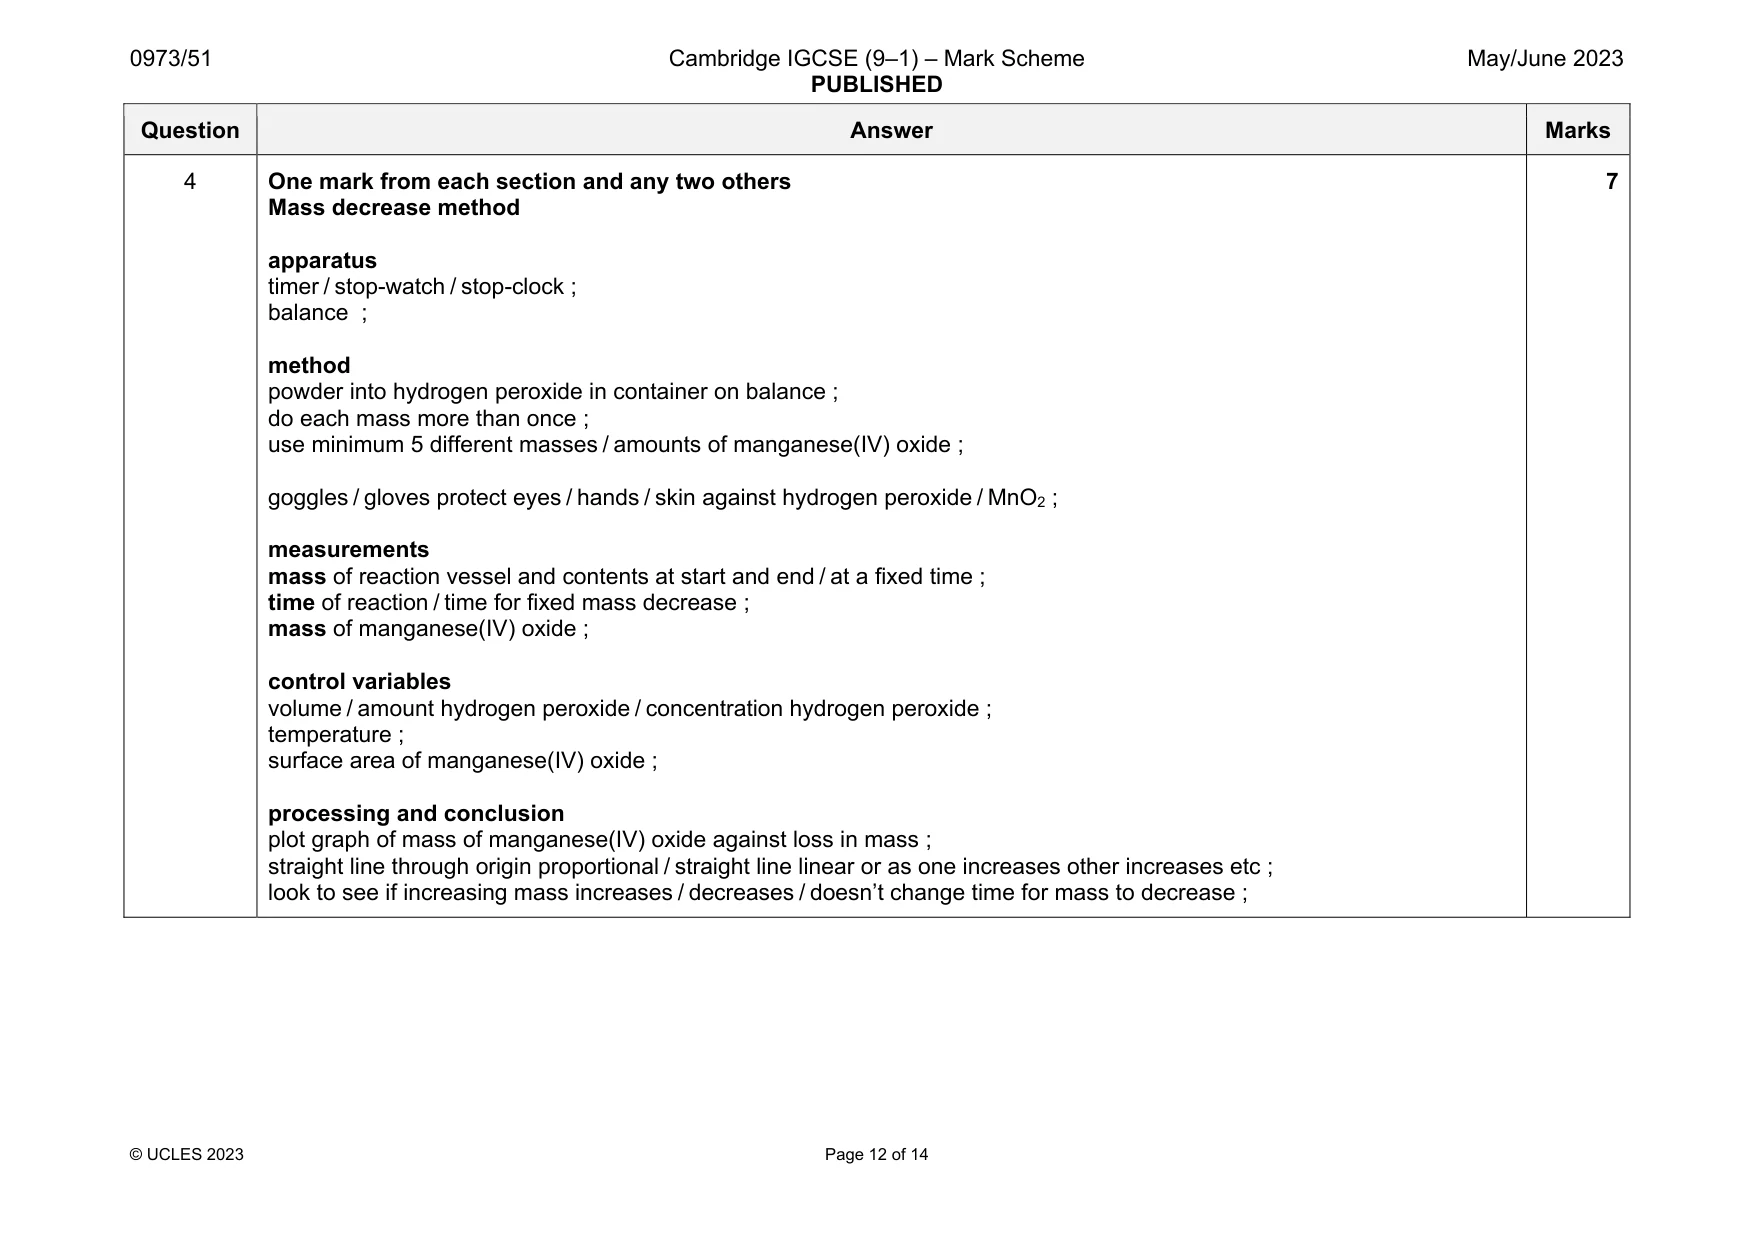
Mark scheme: 4 One mark from each section and any two others Collecting gas method apparatus (gas) syringe / upturned mc or burette in water for collecting oxygen gas ; timer / stop-watch / stop-clock ; balance ; method powder into hydrogen peroxide in container and collect gas (and airtight) diagram or described well ; do each mass more than once ; use minimum 5 different masses / amounts of manganese(IV) oxide ; goggles / gloves protect eyes / hands / skin against hydrogen peroxide / MnO2 ; measurements volume of gas ; time for fixed volume / time fixed for a volume ; mass of manganese(IV) oxide ; control variables volume / amount hydrogen peroxide / concentration hydrogen peroxide ; temperature ; surface area of manganese(IV) oxide ; processing and conclusion plot graph of mass of manganese(IV) oxide against volume of oxygen in fixed time/ time for fixed volume of oxygen gas or against rate ; straight line through origin proportional / straight line linear or as one increases other increases etc ; look to see if increasing mass increases / decreases / doesn’t change amount gas in fixed time / time for fixed volume of gas ; Question Answer Marks 4 One mark from each section and any two others Timing reaction to stop method apparatus timer / stop-watch / stop-clock ; balance ; method powder into hydrogen peroxide in container until bubbles stop ; do each mass / amount of manganese dioxide more than once ; use minimum 5 different masses / amounts of manganese(IV) oxide ; goggles / gloves protect eyes / hands / skin against hydrogen peroxide / MnO2 ; measurements time for end of reaction / bubbles stop ; mass of manganese(IV) oxide ; control variables volume / amount hydrogen peroxide / concentration hydrogen peroxide ; temperature ; surface area of manganese(IV) oxide ; processing and conclusion plot graph of mass of manganese(IV) oxide against time ; straight line through origin proportional / straight line linear or as one increases other increases etc ; look to see if increasing mass increases / decreases / doesn’t change amount gas in fixed time / time for fixed volume of gas ; 7 Question Answer Marks 4 One mark from each section and any two others Mass decrease method apparatus timer / stop-watch / stop-clock ; balance ; method powder into hydrogen peroxide in container on balance ; do each mass more than once ; use minimum 5 different masses / amounts of manganese(IV) oxide ; goggles / gloves protect eyes / hands / skin against hydrogen peroxide / MnO2 ; measurements mass of reaction vessel and contents at start and end / at a fixed time ; time of reaction / time for fixed mass decrease ; mass of manganese(IV) oxide ; control variables volume / amount hydrogen peroxide / concentration hydrogen peroxide ; temperature ; surface area of manganese(IV) oxide ; processing and conclusion plot graph of mass of manganese(IV) oxide against loss in mass ; straight line through origin proportional / straight line linear or as one increases other increases etc ; look to see if increasing mass increases / decreases / doesn’t change time for mass to decrease ; 7
Q5 · You are going to investigate the stretching of a spring
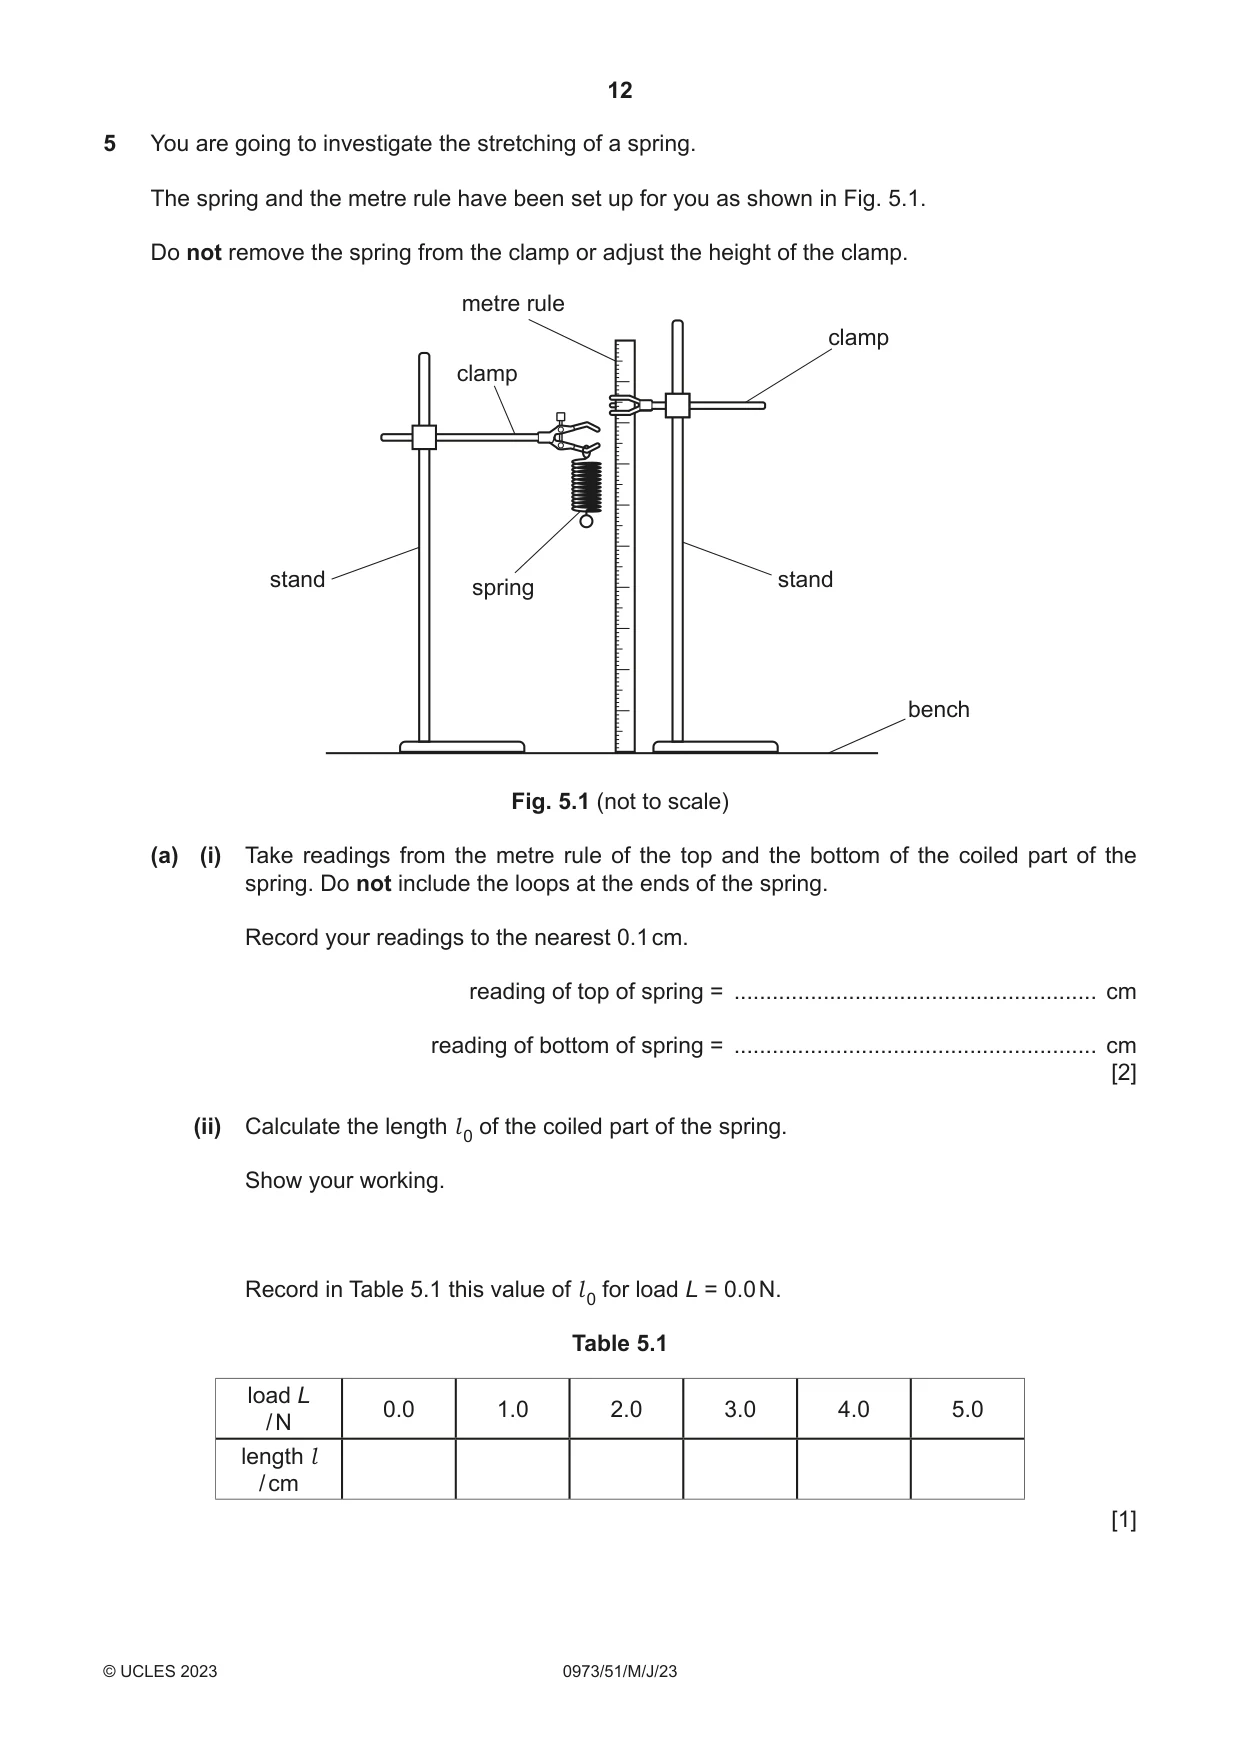
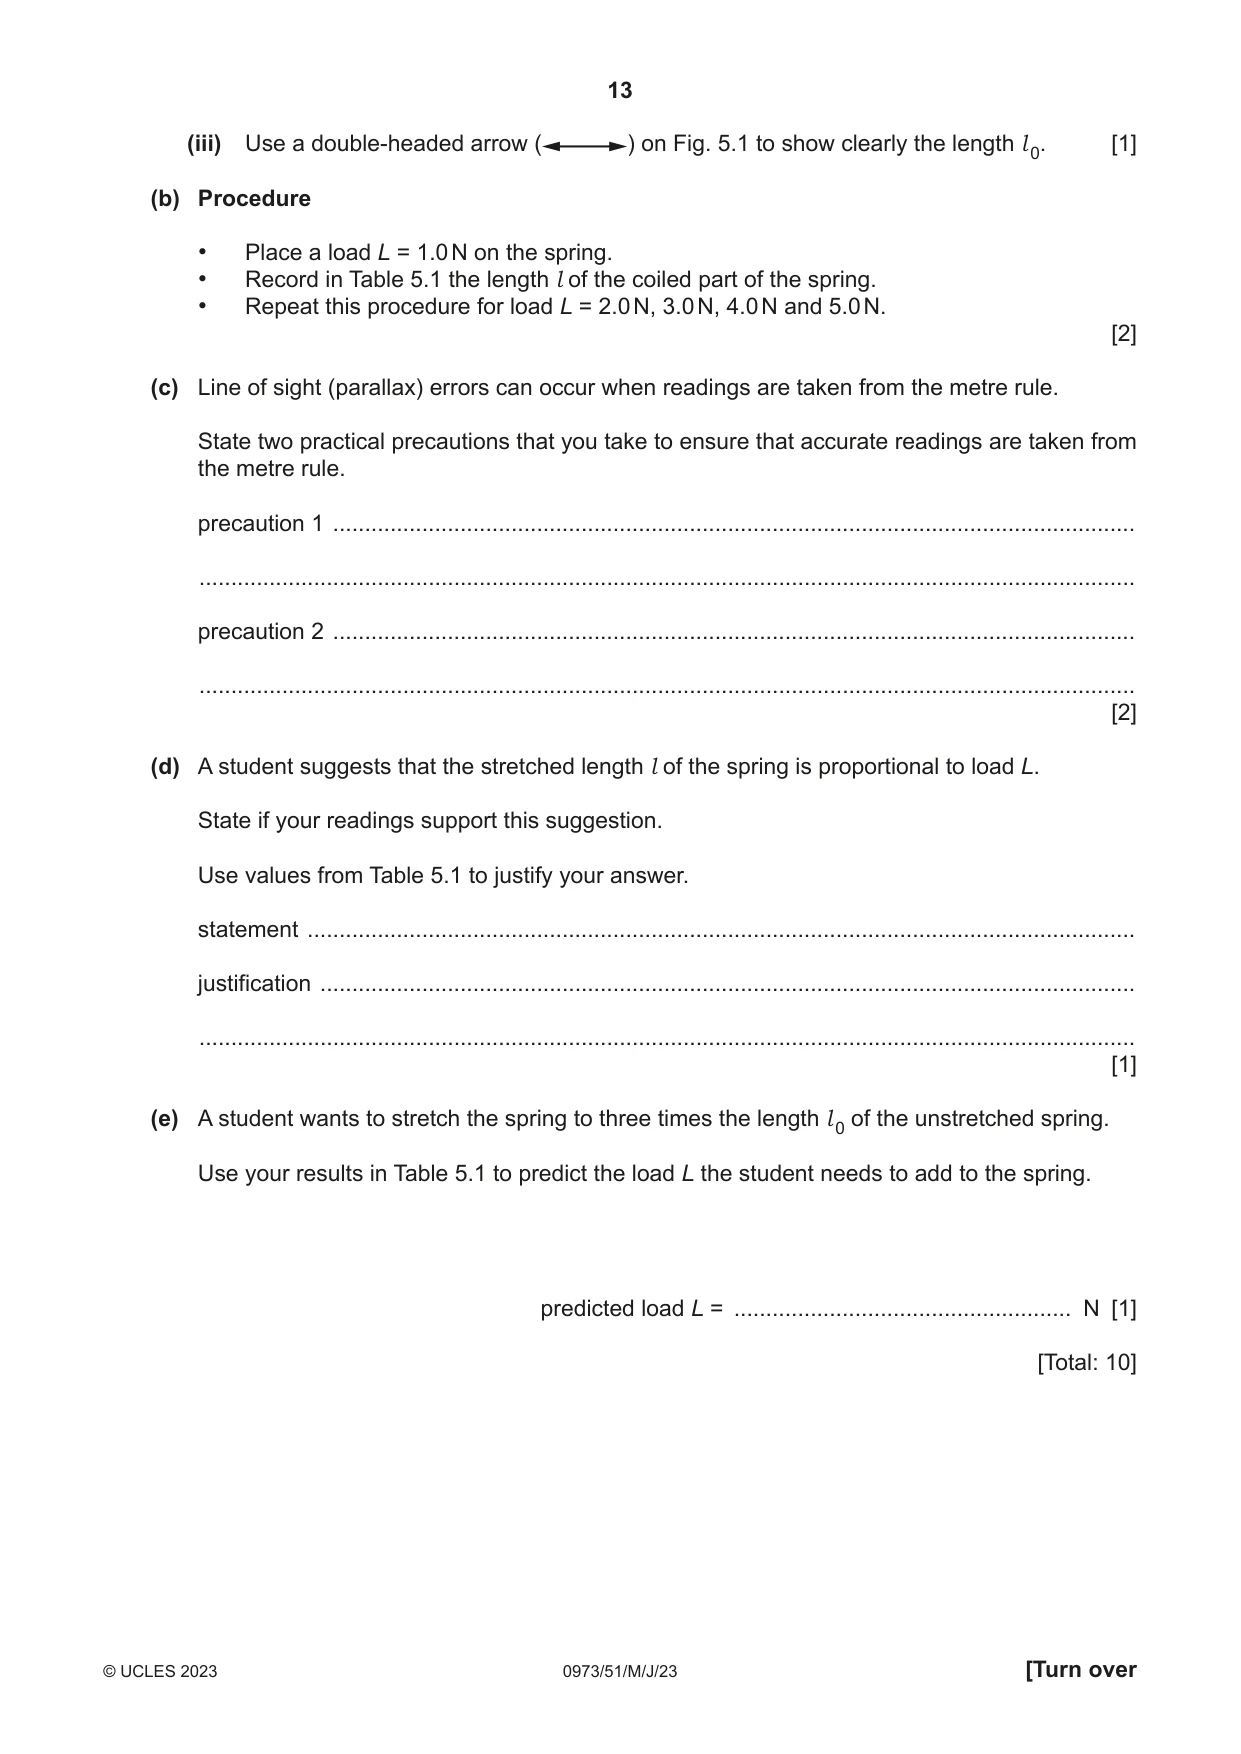
5 You are going to investigate the stretching of a spring. The spring and the metre rule have been set up for you as shown in Fig. 5.1. Do not remove the spring from the clamp or adjust the height of the clamp. metre rule clamp clamp stand stand spring bench Fig. 5.1 (not to scale) (a) (i) Take readings from the metre rule of the top and the bottom of the coiled part of the spring. Do not include the loops at the ends of the spring. Record your readings to the nearest 0.1 cm. reading of top of spring = ......................................................... cm reading of bottom of spring = ......................................................... cm [2] (ii) Calculate the length l 0 of the coiled part of the spring. Show your working. Record in Table 5.1 this value of l 0 for load L = 0.0 N. Table 5.1 load L 0.0 1.0 2.0 3.0 4.0 5.0 / N length l / cm [1] (iii) Use a double-headed arrow ( ) on Fig. 5.1 to show clearly the length l 0. [1] (b) Procedure • Place a load L = 1.0 N on the spring. • Record in Table 5.1 the length l of the coiled part of the spring. • Repeat this procedure for load L = 2.0 N, 3.0 N, 4.0 N and 5.0 N. [2] (c) Line of sight (parallax) errors can occur when readings are taken from the metre rule. State two practical precautions that you take to ensure that accurate readings are taken from the metre rule. precaution 1 .............................................................................................................................. ................................................................................................................................................... precaution 2 .............................................................................................................................. ................................................................................................................................................... [2] (d) A student suggests that the stretched length l of the spring is proportional to load L. State if your readings support this suggestion. Use values from Table 5.1 to justify your answer. statement .................................................................................................................................. justification ................................................................................................................................ ................................................................................................................................................... [1] (e) A student wants to stretch the spring to three times the length l 0 of the unstretched spring. Use your results in Table 5.1 to predict the load L the student needs to add to the spring. predicted load L = ..................................................... N [1] [Total: 10]
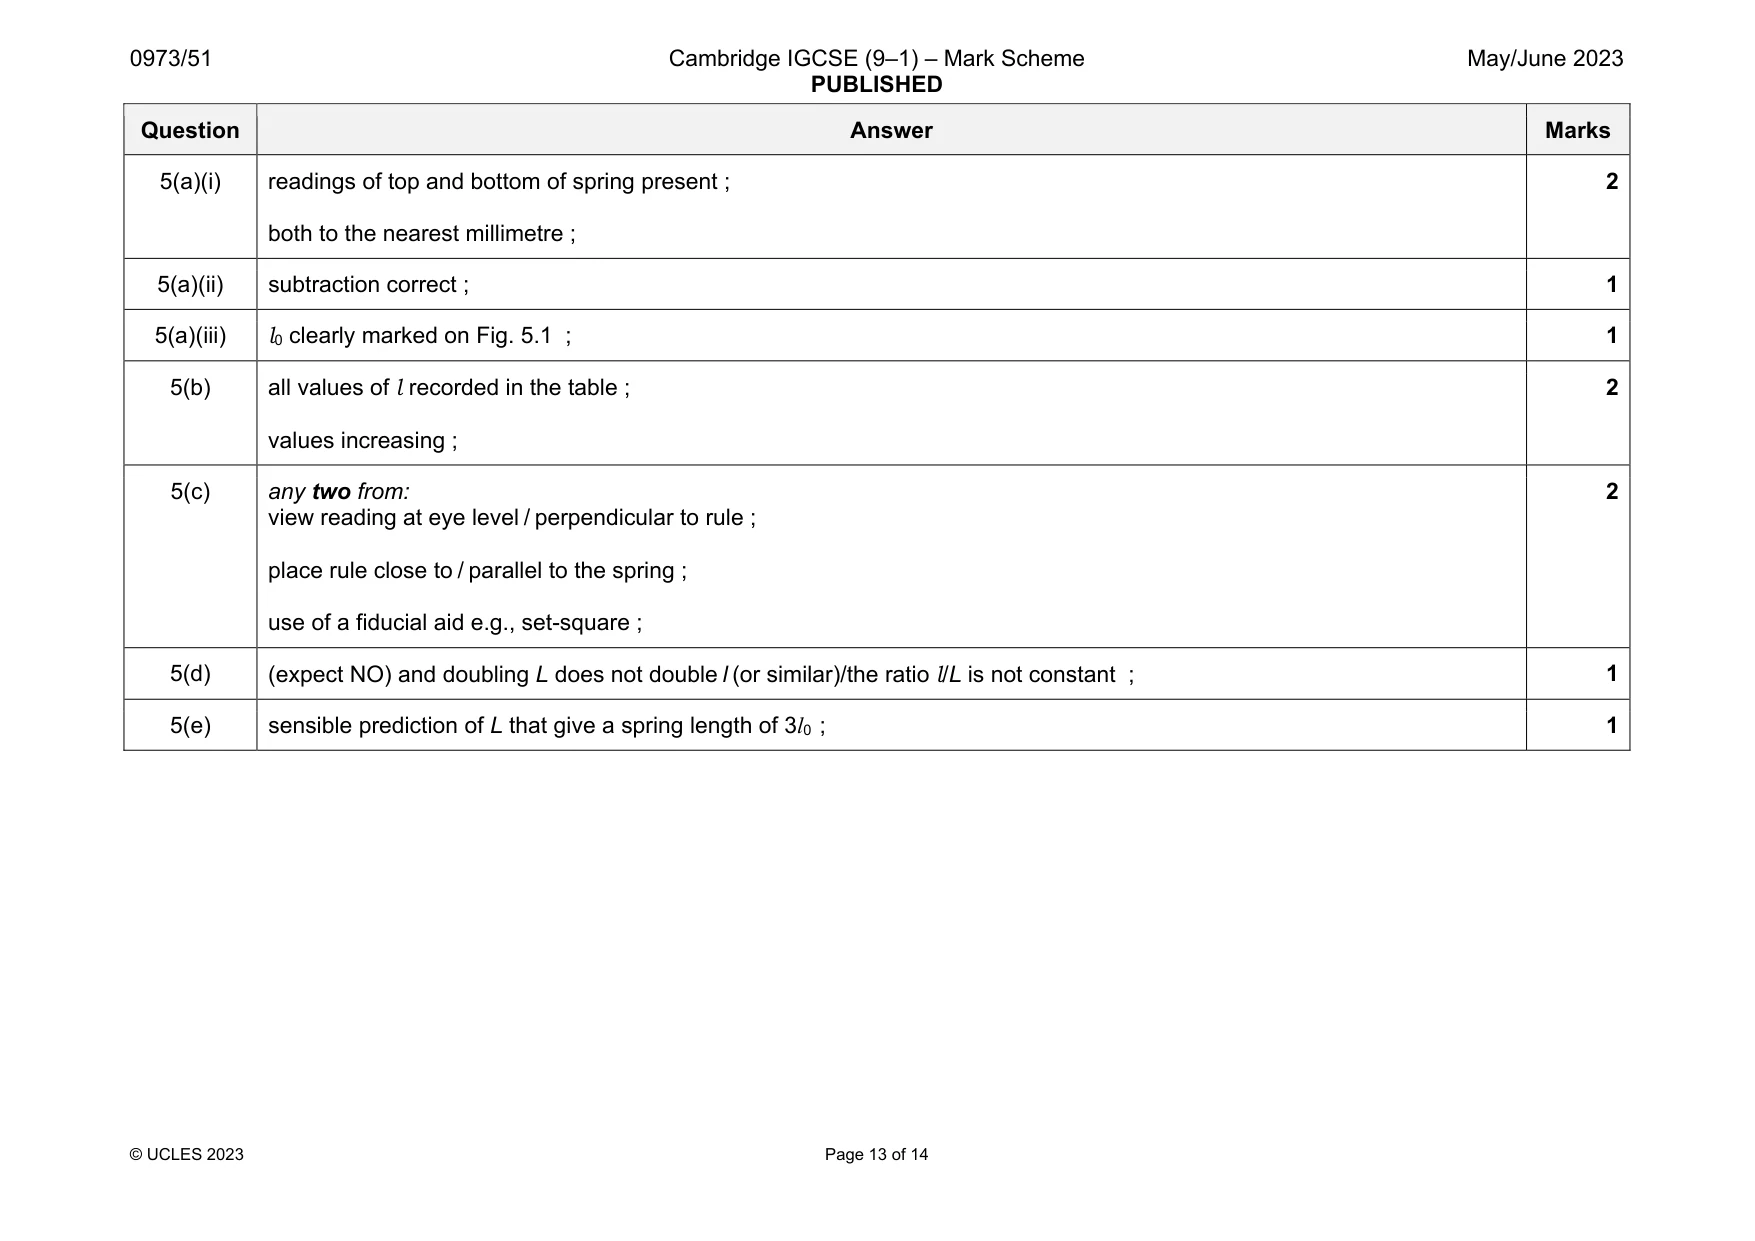
Mark scheme: 5(a)(i) readings of top and bottom of spring present ; both to the nearest millimetre ; 2 5(a)(ii) subtraction correct ; 1 5(a)(iii) l0 clearly marked on Fig. 5.1 ; 1 5(b) all values of l recorded in the table ; values increasing ; 2 5(c) any two from: view reading at eye level / perpendicular to rule ; place rule close to / parallel to the spring ; use of a fiducial aid e.g., set-square ; 2 5(d) (expect NO) and doubling L does not double l (or similar)/the ratio l/L is not constant ; 1 5(e) sensible prediction of L that give a spring length of 3l0 ; 1
Q6 · You are going to investigate the cooling of hot water in a beaker
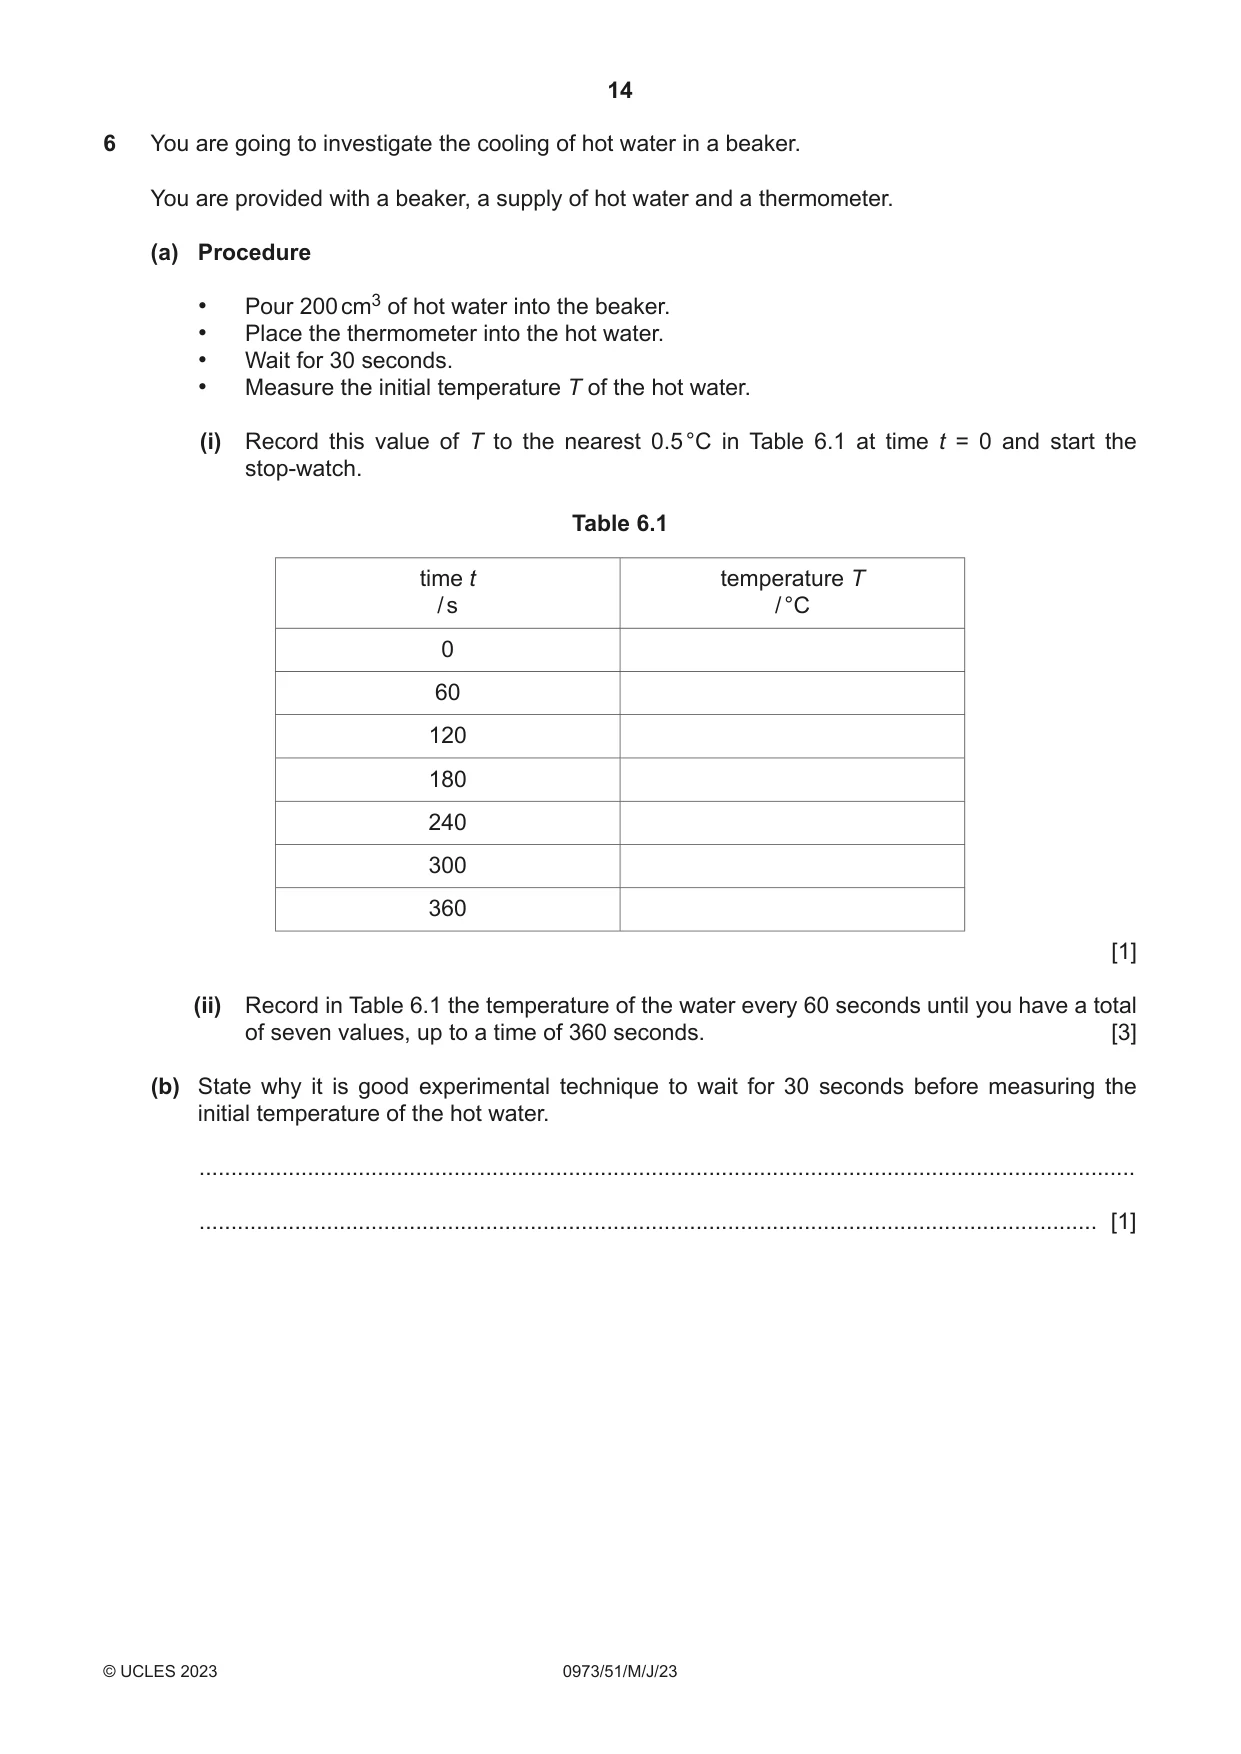
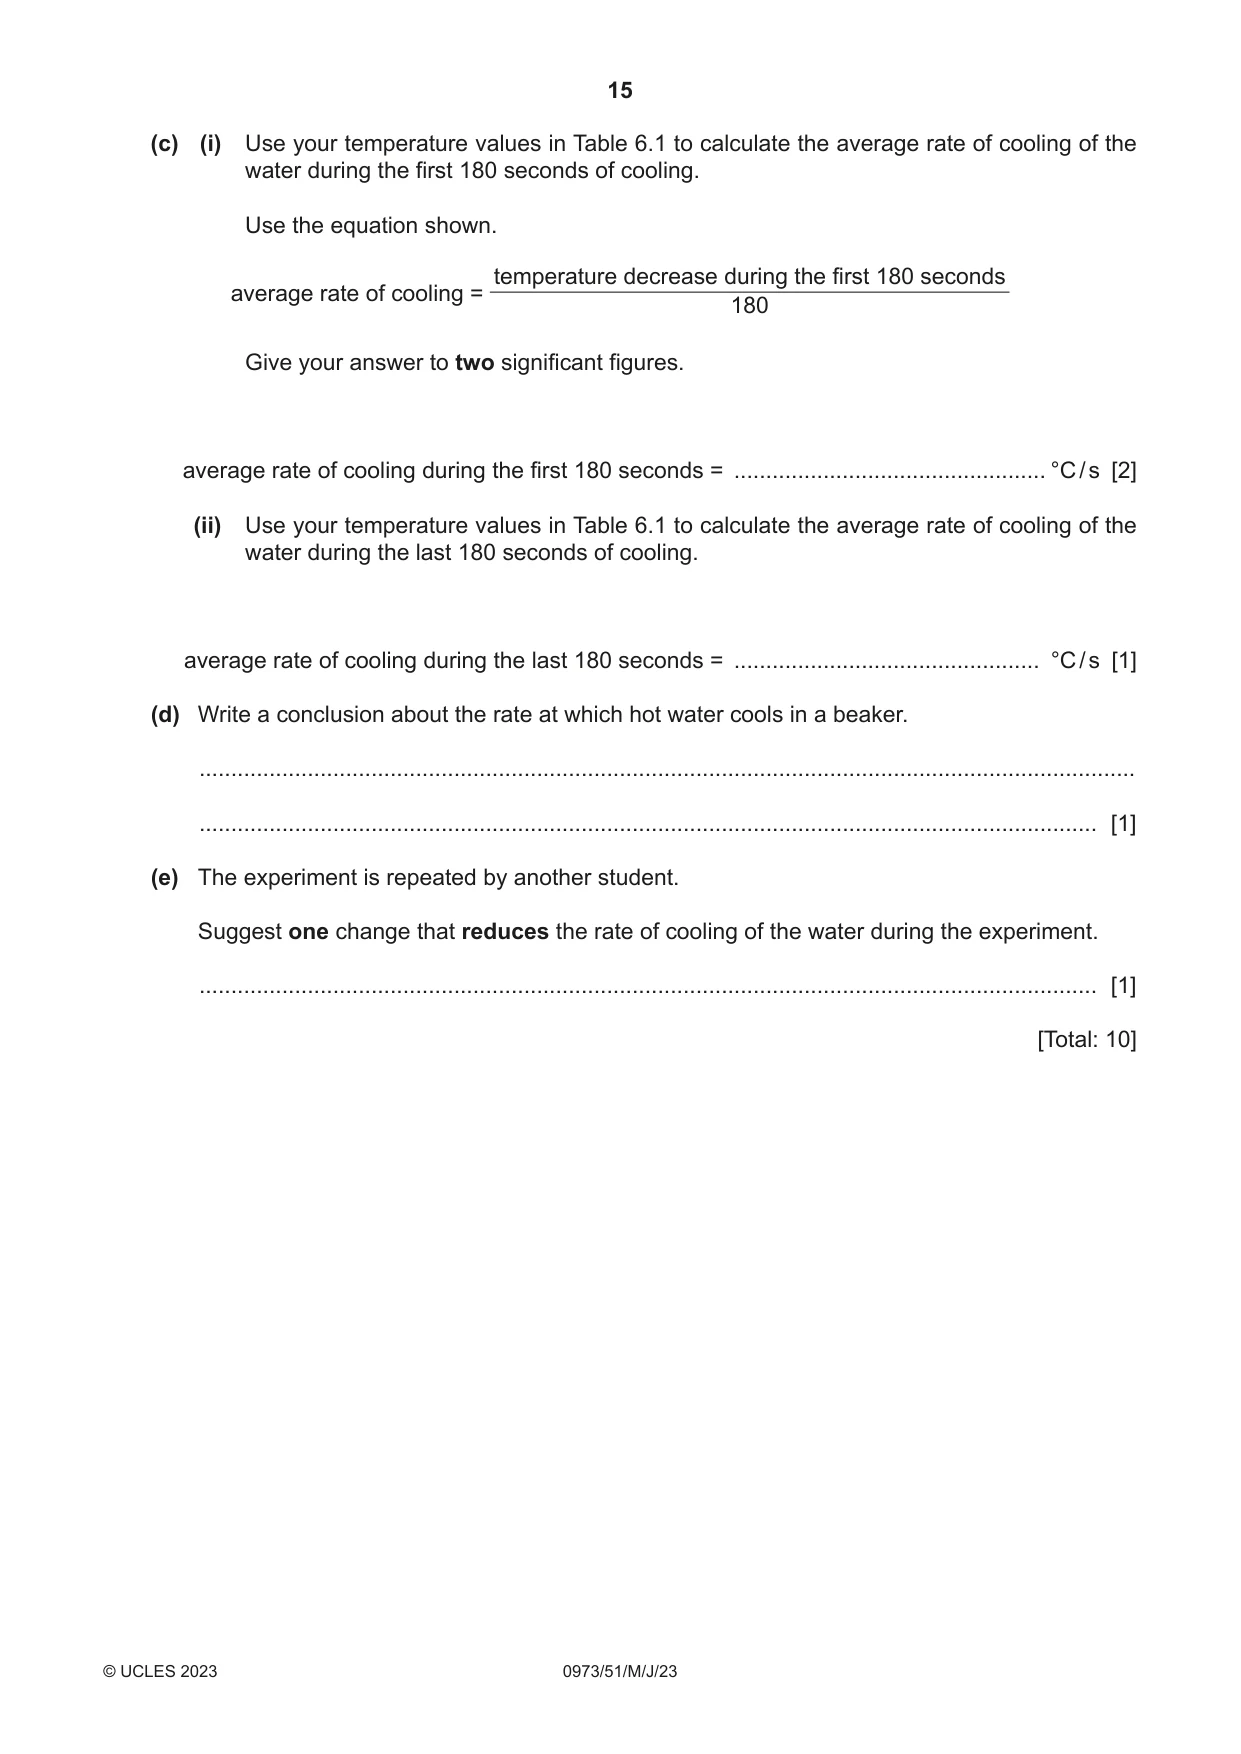
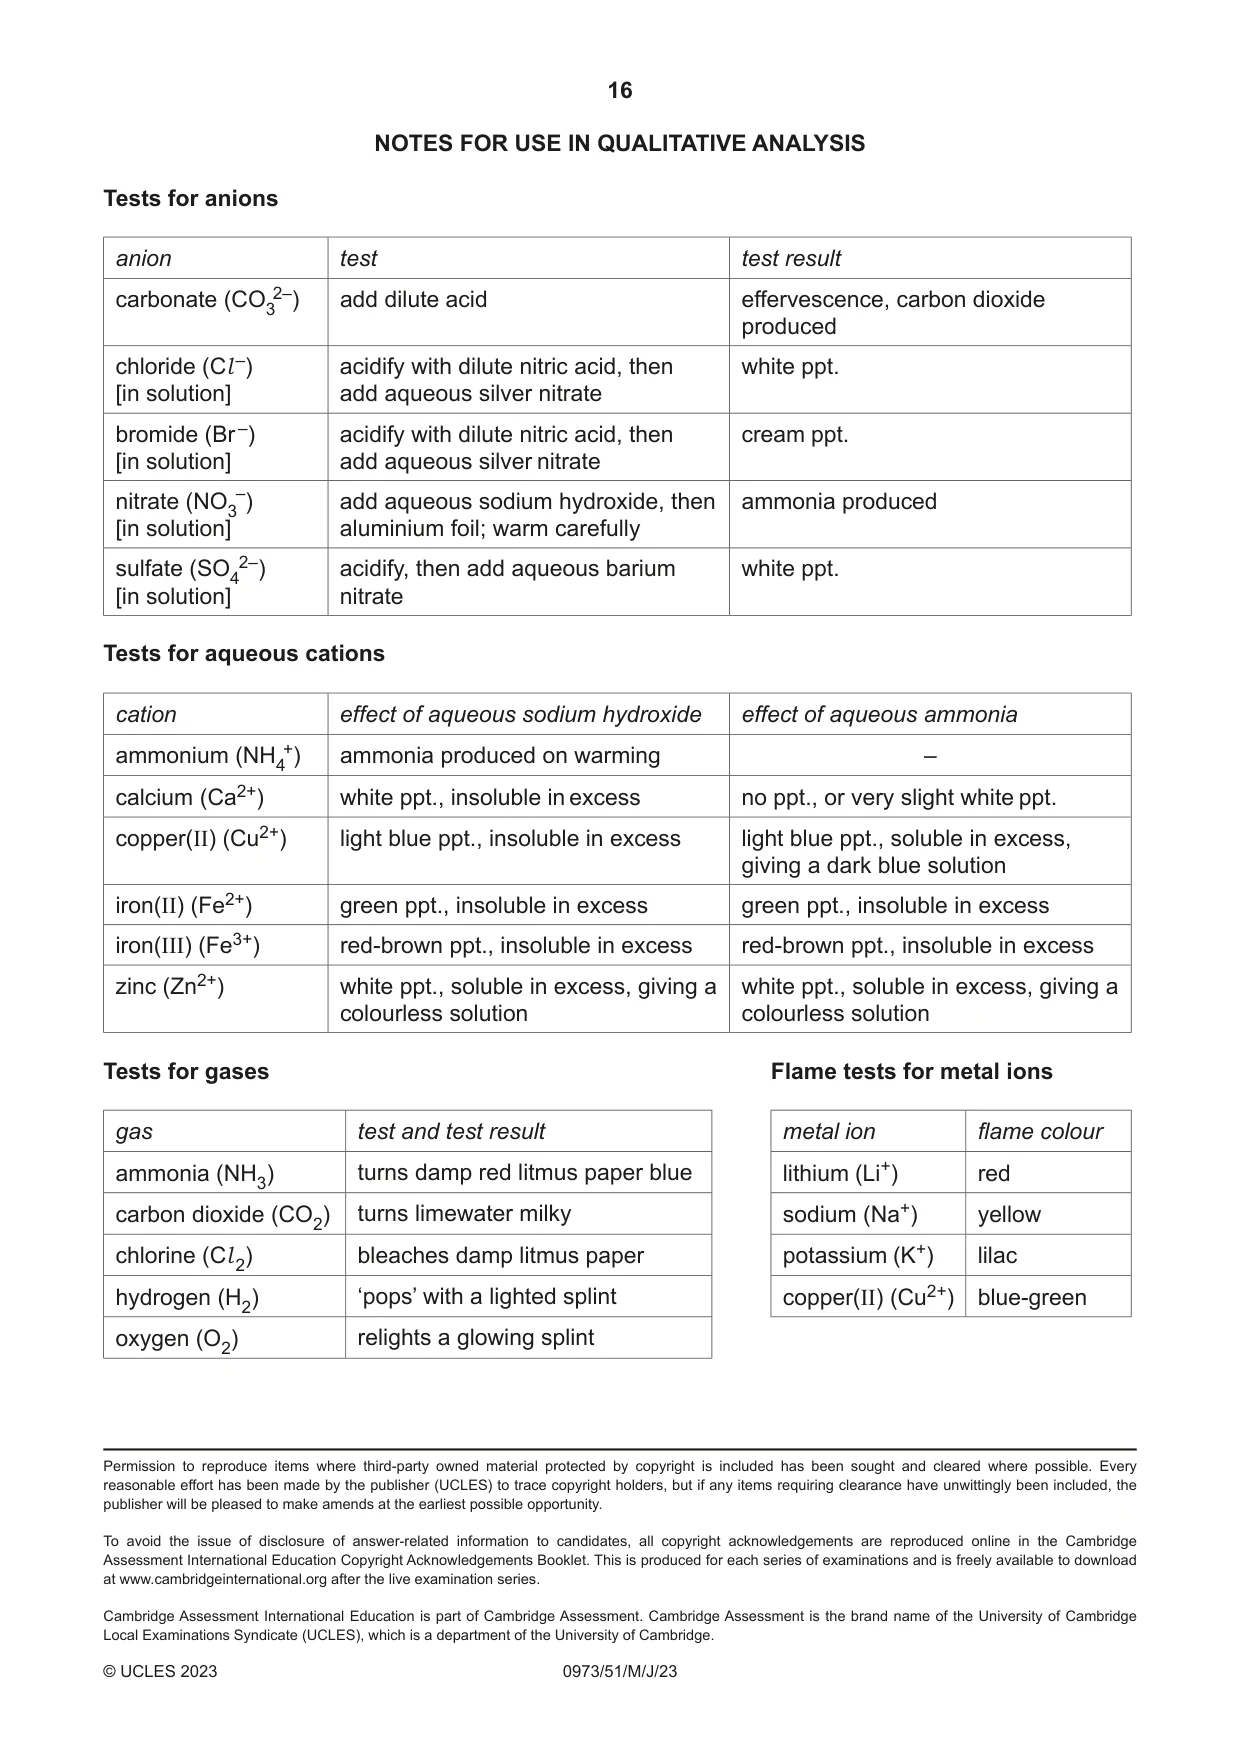
6 You are going to investigate the cooling of hot water in a beaker. You are provided with a beaker, a supply of hot water and a thermometer. (a) Procedure • Pour 200 cm3 of hot water into the beaker. • Place the thermometer into the hot water. • Wait for 30 seconds. • Measure the initial temperature T of the hot water. (i) Record this value of T to the nearest 0.5 °C in Table 6.1 at time t = 0 and start the stop-watch. Table 6.1 time t temperature T / s / °C 0 60 120 180 240 300 360 [1] (ii) Record in Table 6.1 the temperature of the water every 60 seconds until you have a total of seven values, up to a time of 360 seconds. [3] (b) State why it is good experimental technique to wait for 30 seconds before measuring the initial temperature of the hot water. ................................................................................................................................................... ............................................................................................................................................. [1] (c) (i) Use your temperature values in Table 6.1 to calculate the average rate of cooling of the water during the first 180 seconds of cooling. Use the equation shown. temperature decrease during the first 180 seconds average rate of cooling = 180 Give your answer to two significant figures. average rate of cooling during the first 180 seconds = ................................................. °C / s [2] (ii) Use your temperature values in Table 6.1 to calculate the average rate of cooling of the water during the last 180 seconds of cooling. average rate of cooling during the last 180 seconds = ................................................ °C / s [1] (d) Write a conclusion about the rate at which hot water cools in a beaker. ................................................................................................................................................... ............................................................................................................................................. [1] (e) The experiment is repeated by another student. Suggest one change that reduces the rate of cooling of the water during the experiment. ............................................................................................................................................. [1] [Total: 10] NOTES FOR USE IN QUALITATIVE ANALYSIS Tests for anions anion test test result carbonate (CO32–) add dilute acid effervescence, carbon dioxide produced chloride (Cl –) acidify with dilute nitric acid, then white ppt. [in solution] add aqueous silver nitrate bromide (Br –) acidify with dilute nitric acid, then cream ppt. [in solution] add aqueous silver nitrate nitrate (NO3–) add aqueous sodium hydroxide, then ammonia produced [in solution] aluminium foil; warm carefully sulfate (SO42–) acidify, then add aqueous barium white ppt. [in solution] nitrate Tests for aqueous cations cation effect of aqueous sodium hydroxide effect of aqueous ammonia ammonium (NH4+) ammonia produced on warming – calcium (Ca2+) white ppt., insoluble in excess no ppt., or very slight white ppt. copper(II) (Cu2+) light blue ppt., insoluble in excess light blue ppt., soluble in excess, giving a dark blue solution iron(II) (Fe2+) green ppt., insoluble in excess green ppt., insoluble in excess iron(III) (Fe3+) red-brown ppt., insoluble in excess red-brown ppt., insoluble in excess zinc (Zn2+) white ppt., soluble in excess, giving a white ppt., soluble in excess, giving a colourless solution colourless solution Tests for gases Flame tests for metal ions gas test and test result metal ion flame colour ammonia (NH3) turns damp red litmus paper blue lithium (Li+) red carbon dioxide (CO2) turns limewater milky sodium (Na+) yellow chlorine (Cl 2) bleaches damp litmus paper potassium (K+) lilac hydrogen (H2) ‘pops’ with a lighted splint copper(II) (Cu2+) blue-green oxygen (O2) relights a glowing splint
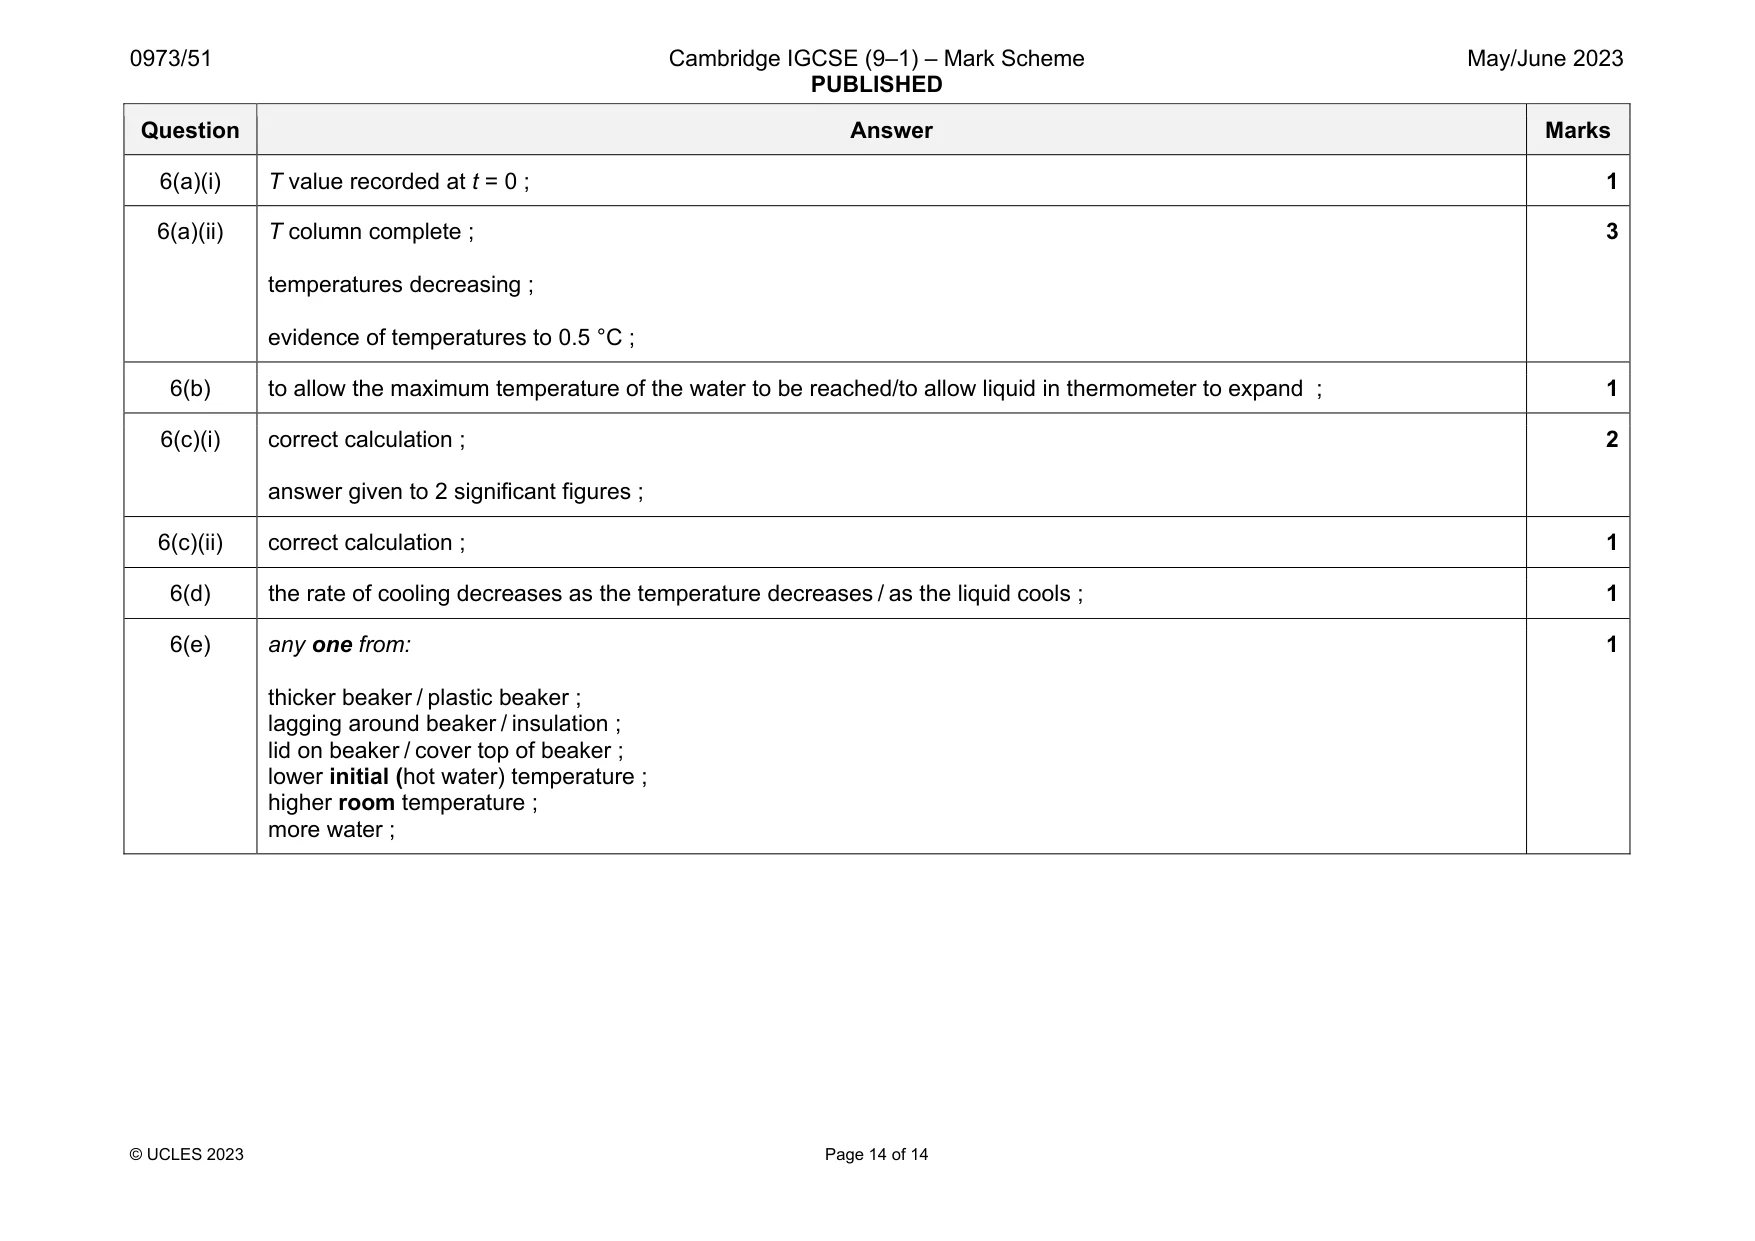
Mark scheme: 6(a)(i) T value recorded at t = 0 ; 1 6(a)(ii) T column complete ; temperatures decreasing ; evidence of temperatures to 0.5 °C ; 3 6(b) to allow the maximum temperature of the water to be reached/to allow liquid in thermometer to expand ; 1 6(c)(i) correct calculation ; answer given to 2 significant figures ; 2 6(c)(ii) correct calculation ; 1 6(d) the rate of cooling decreases as the temperature decreases / as the liquid cools ; 1 6(e) any one from: thicker beaker / plastic beaker ; lagging around beaker / insulation ; lid on beaker / cover top of beaker ; lower initial (hot water) temperature ; higher room temperature ; more water ; 1
What was in this paper
The subtopics covered by these 6 questions, and how many questions each got. Open one in a new tab to see every Cambridge question on it.
What you needed in this session
Cambridge’s own grade thresholds for 2023 May/June, Paper 5 · Variant 1. A higher threshold means an easier paper — the bar moves with how the cohort did.