Cambridge IGCSE Sciences - Co-ordinated (9-1) 0973 — 2020 Oct/Nov Paper 6 · Variant 1
0973/61/O/N/20 · 6 questions · 60 marks · ≈68 min
The question paper and its mark scheme, free to read here and free to download. This is Cambridge’s own paper, exactly as it was sat.
Question paper16 pages
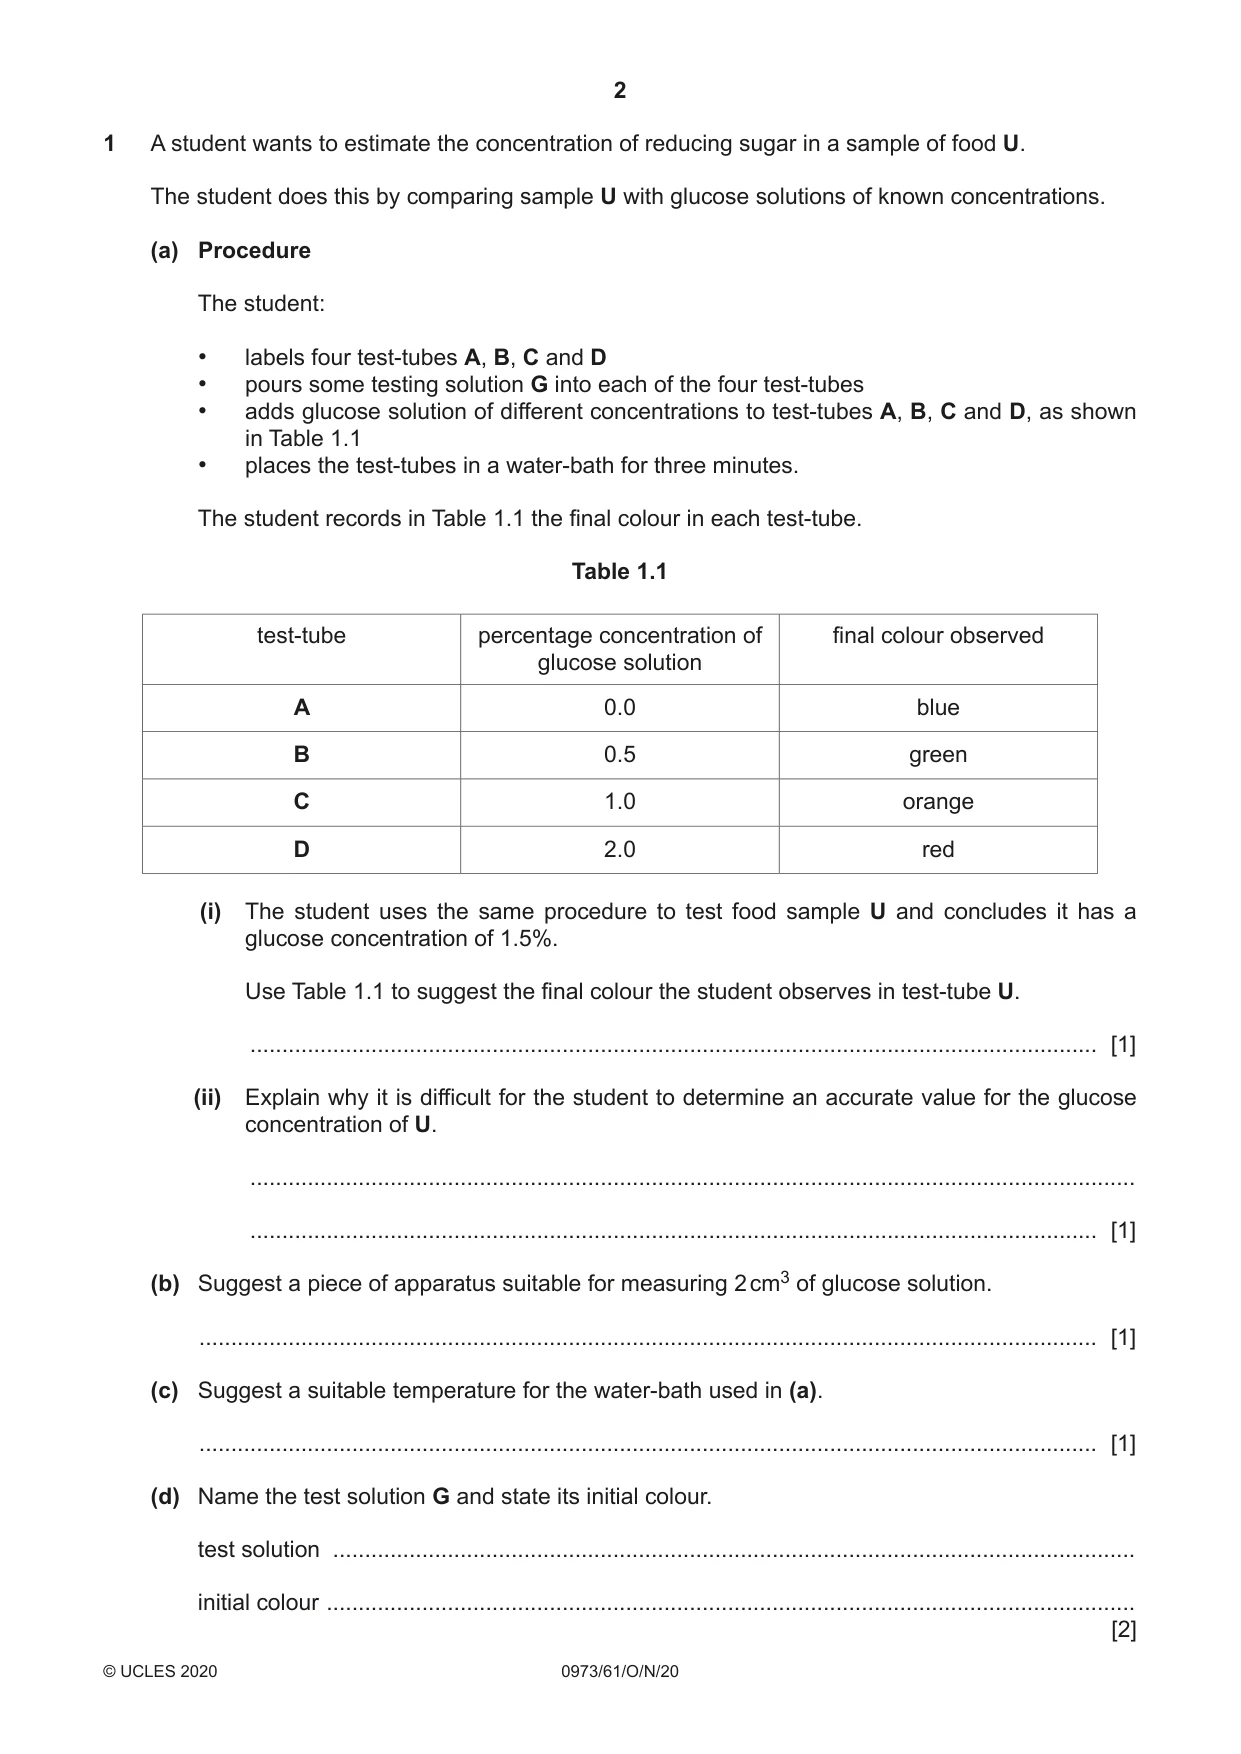
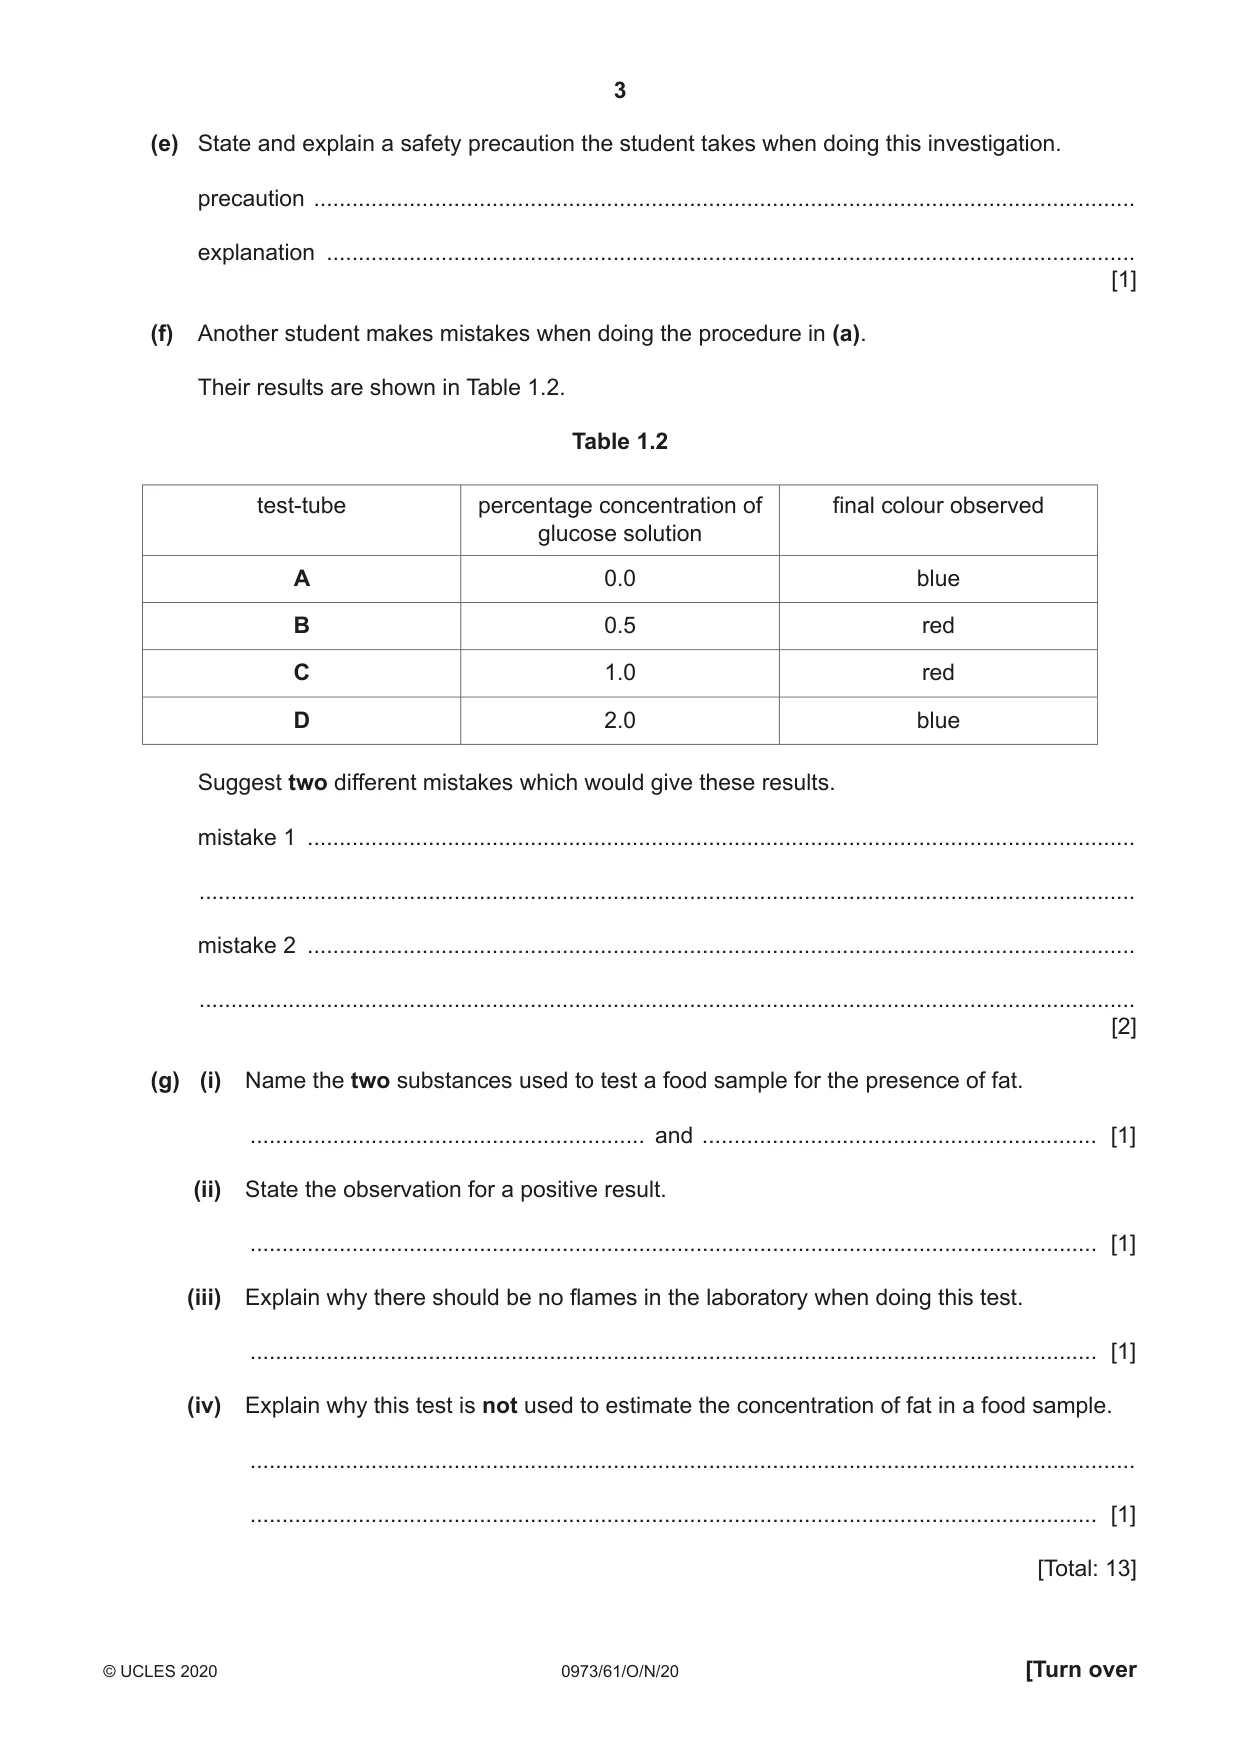
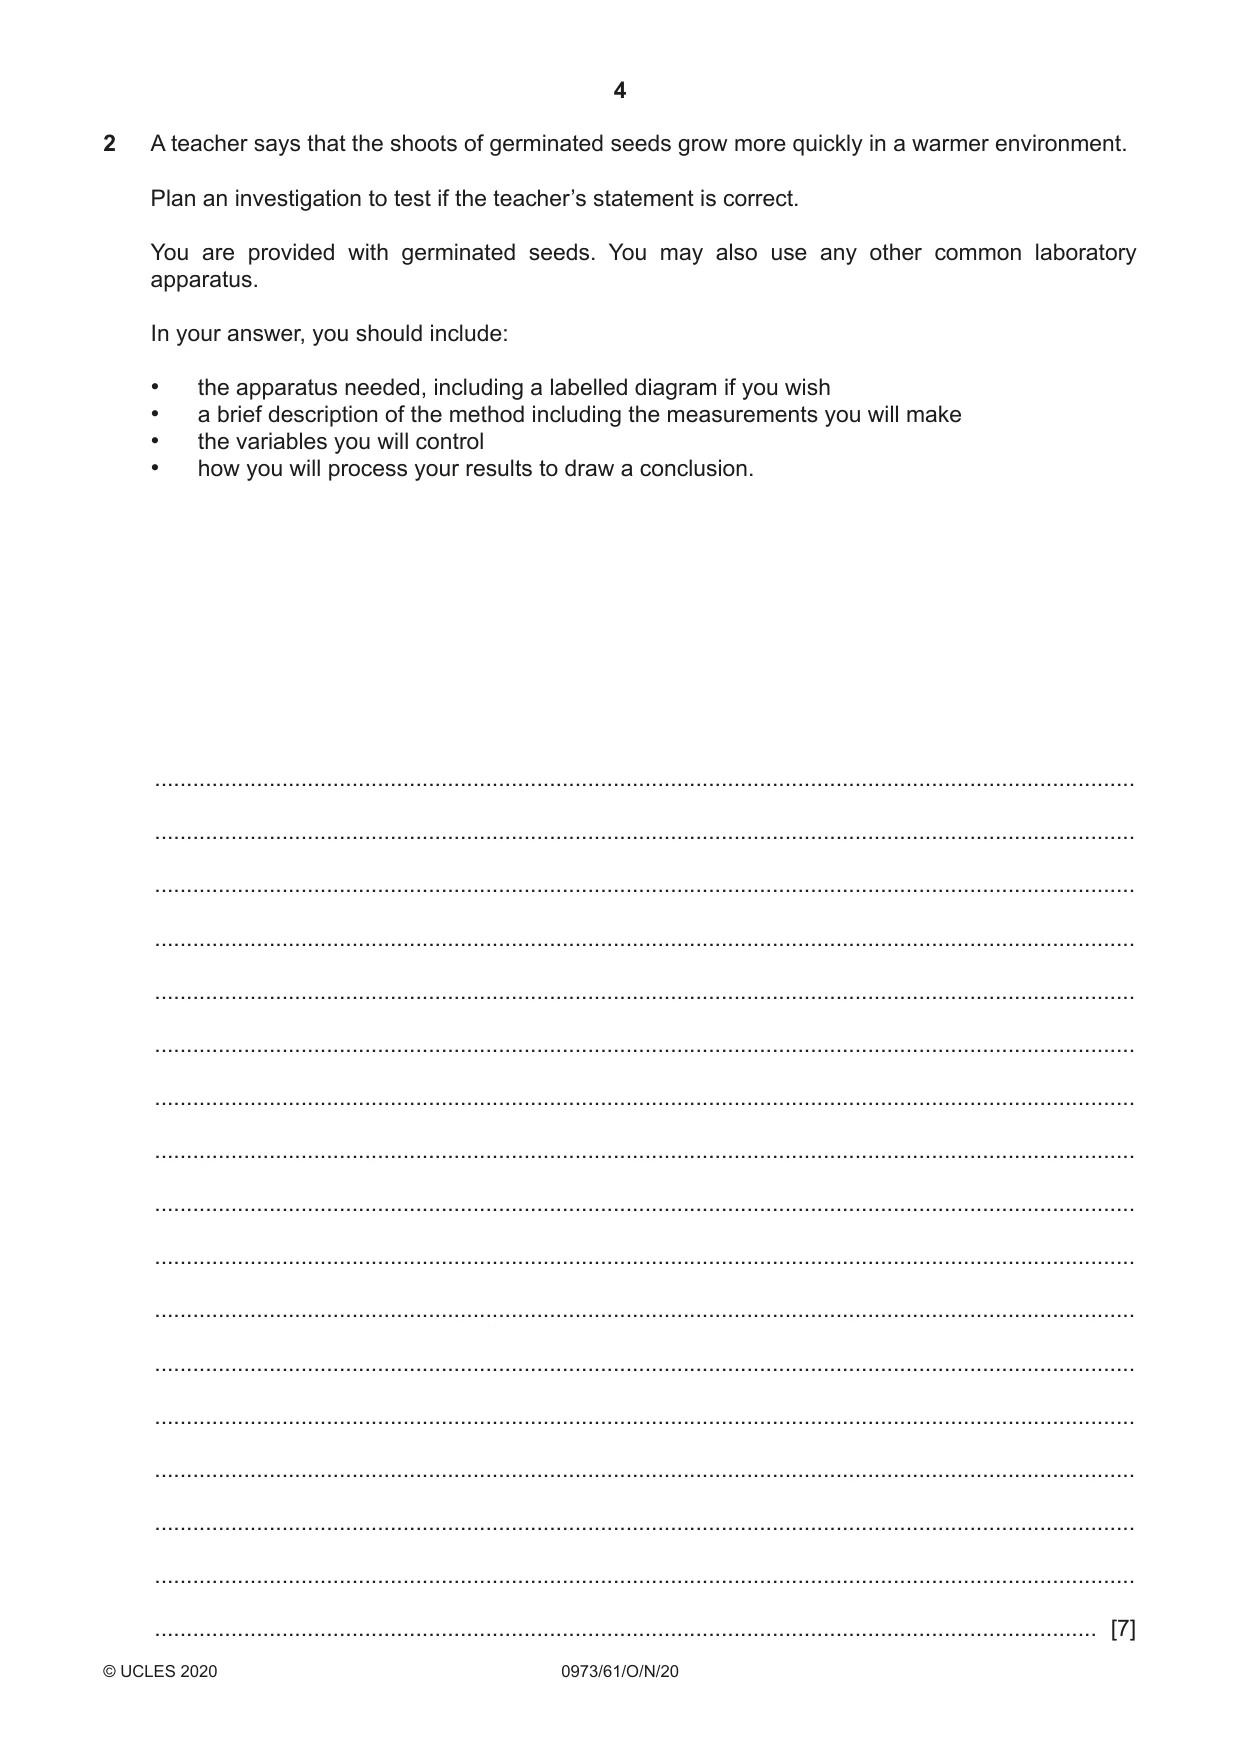


Mark scheme10 pages
Answers below. Sit the paper first if you are practising.
Questions as text
Q1 · A student wants to estimate the concentration of reducing sugar in a sample of food U
1 A student wants to estimate the concentration of reducing sugar in a sample of food U. The student does this by comparing sample U with glucose solutions of known concentrations. (a) Procedure The student: • labels four test-tubes A, B, C and D • pours some testing solution G into each of the four test-tubes • adds glucose solution of different concentrations to test-tubes A, B, C and D, as shown in Table 1.1 • places the test-tubes in a water-bath for three minutes. The student records in Table 1.1 the final colour in each test-tube. Table 1.1 test-tube percentage concentration of final colour observed glucose solution A 0.0 blue B 0.5 green C 1.0 orange D 2.0 red (i) The student uses the same procedure to test food sample U and concludes it has a glucose concentration of 1.5%. Use Table 1.1 to suggest the final colour the student observes in test-tube U. ..................................................................................................................................... [1] (ii) Explain why it is difficult for the student to determine an accurate value for the glucose concentration of U. ........................................................................................................................................... ..................................................................................................................................... [1] (b) Suggest a piece of apparatus suitable for measuring 2 cm3 of glucose solution. ............................................................................................................................................. [1] (c) Suggest a suitable temperature for the water-bath used in (a). ............................................................................................................................................. [1] (d) Name the test solution G and state its initial colour. test solution .............................................................................................................................. initial colour ............................................................................................................................... [2] (e) State and explain a safety precaution the student takes when doing this investigation. precaution ................................................................................................................................. explanation ............................................................................................................................... [1] (f) Another student makes mistakes when doing the procedure in (a). Their results are shown in Table 1.2. Table 1.2 test-tube percentage concentration of final colour observed glucose solution A 0.0 blue B 0.5 red C 1.0 red D 2.0 blue Suggest two different mistakes which would give these results. mistake 1 .................................................................................................................................. ................................................................................................................................................... mistake 2 .................................................................................................................................. ................................................................................................................................................... [2] (g) (i) Name the two substances used to test a food sample for the presence of fat. .............................................................. and .............................................................. [1] (ii) State the observation for a positive result. ..................................................................................................................................... [1] (iii) Explain why there should be no flames in the laboratory when doing this test. ..................................................................................................................................... [1] (iv) Explain why this test is not used to estimate the concentration of fat in a food sample. ........................................................................................................................................... ..................................................................................................................................... [1] [Total: 13]
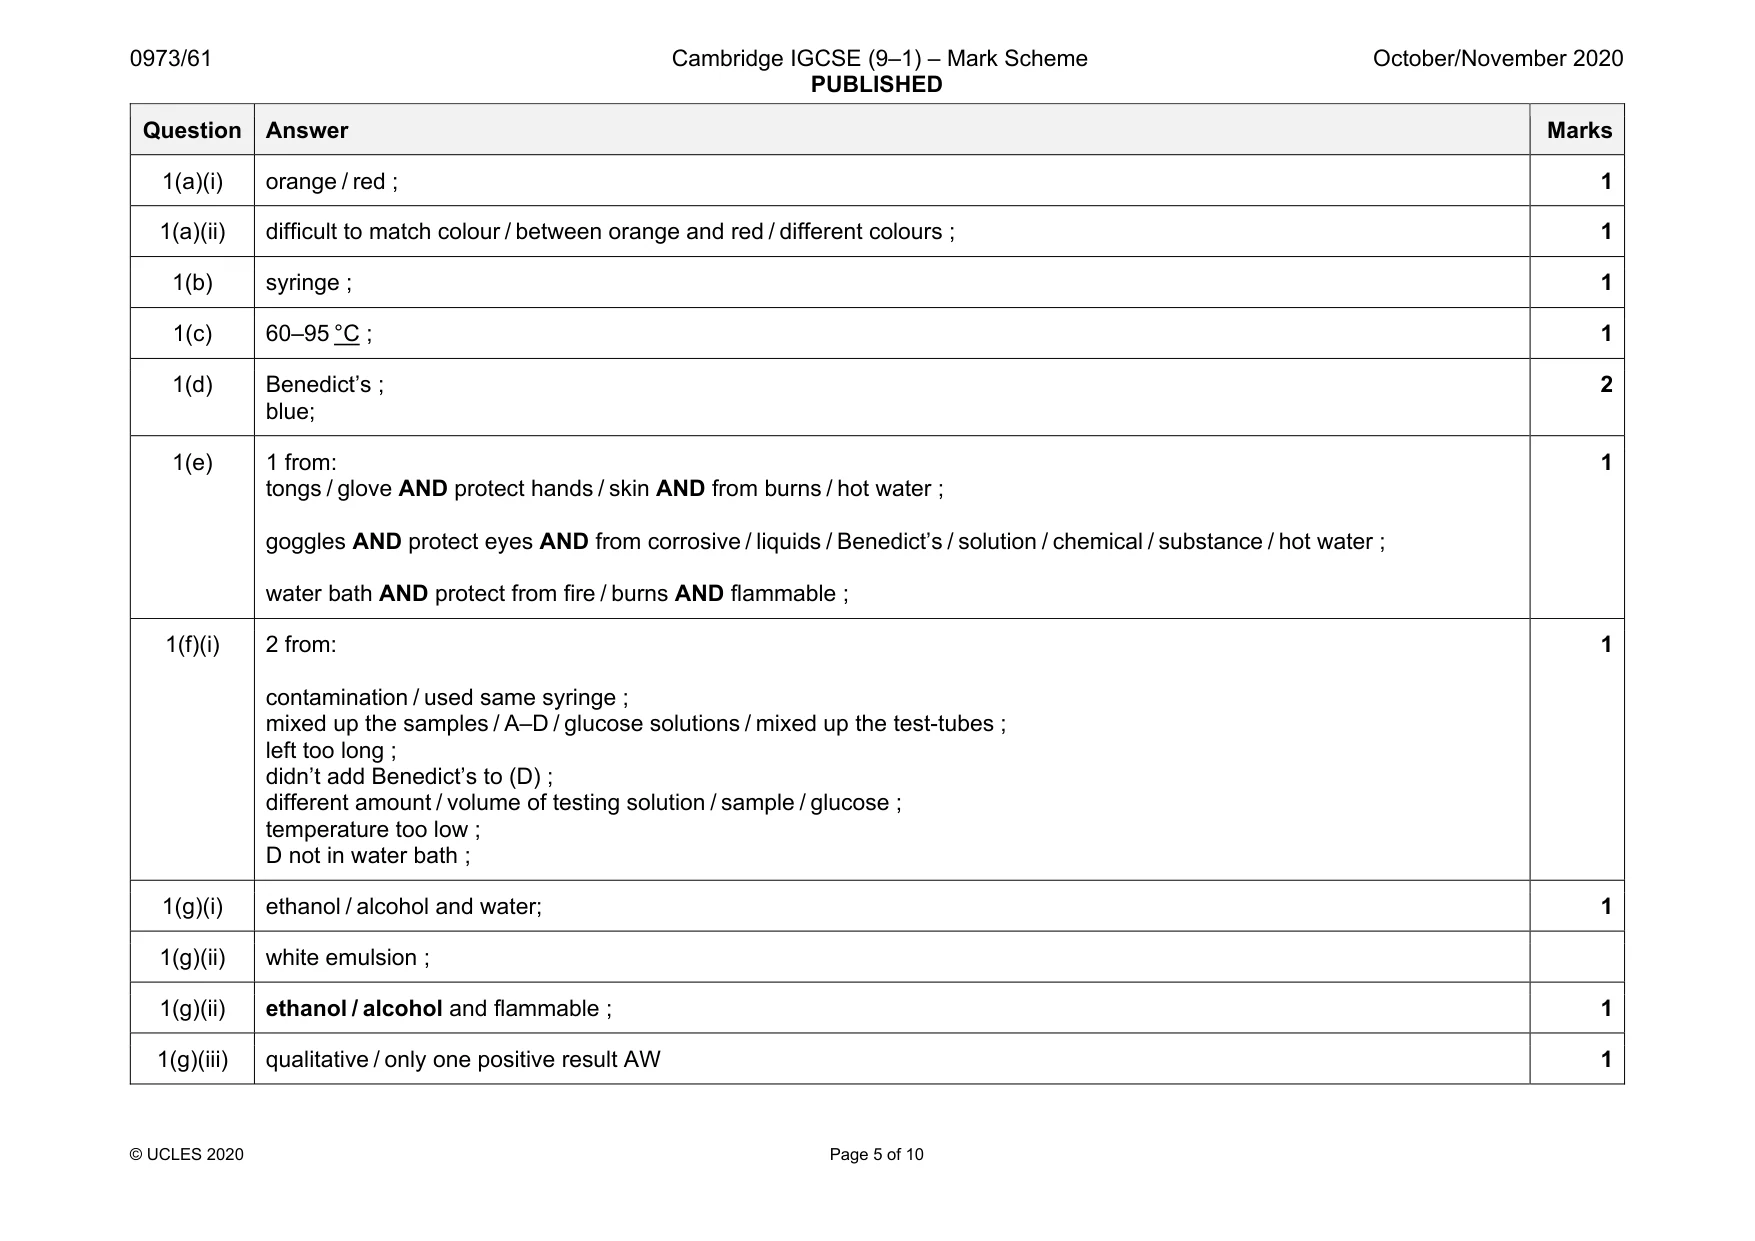
Mark scheme: 1(a)(i) orange / red ; 1 1(a)(ii) difficult to match colour / between orange and red / different colours ; 1 1(b) syringe ; 1 1(c) 60–95 °C ; 1 1(d) Benedict’s ; blue; 2 1(e) 1 from: tongs / glove AND protect hands / skin AND from burns / hot water ; goggles AND protect eyes AND from corrosive / liquids / Benedict’s / solution / chemical / substance / hot water ; water bath AND protect from fire / burns AND flammable ; 1 1(f)(i) 2 from: contamination / used same syringe ; mixed up the samples / A–D / glucose solutions / mixed up the test-tubes ; left too long ; didn’t add Benedict’s to (D) ; different amount / volume of testing solution / sample / glucose ; temperature too low ; D not in water bath ; 1 1(g)(i) ethanol / alcohol and water; 1 1(g)(ii) white emulsion ; 1(g)(ii) ethanol / alcohol and flammable ; 1 1(g)(iii) qualitative / only one positive result AW 1 Question Answer Marks
Q2 · A teacher says that the shoots of germinated seeds grow more quickly in a warmer…
2 A teacher says that the shoots of germinated seeds grow more quickly in a warmer environment. Plan an investigation to test if the teacher’s statement is correct. You are provided with germinated seeds. You may also use any other common laboratory apparatus. In your answer, you should include: • the apparatus needed, including a labelled diagram if you wish • a brief description of the method including the measurements you will make • the variables you will control • how you will process your results to draw a conclusion. .......................................................................................................................................................... .......................................................................................................................................................... .......................................................................................................................................................... .......................................................................................................................................................... .......................................................................................................................................................... .......................................................................................................................................................... .......................................................................................................................................................... .......................................................................................................................................................... .......................................................................................................................................................... .......................................................................................................................................................... .......................................................................................................................................................... .......................................................................................................................................................... .......................................................................................................................................................... .......................................................................................................................................................... .......................................................................................................................................................... .......................................................................................................................................................... .................................................................................................................................................... [7]
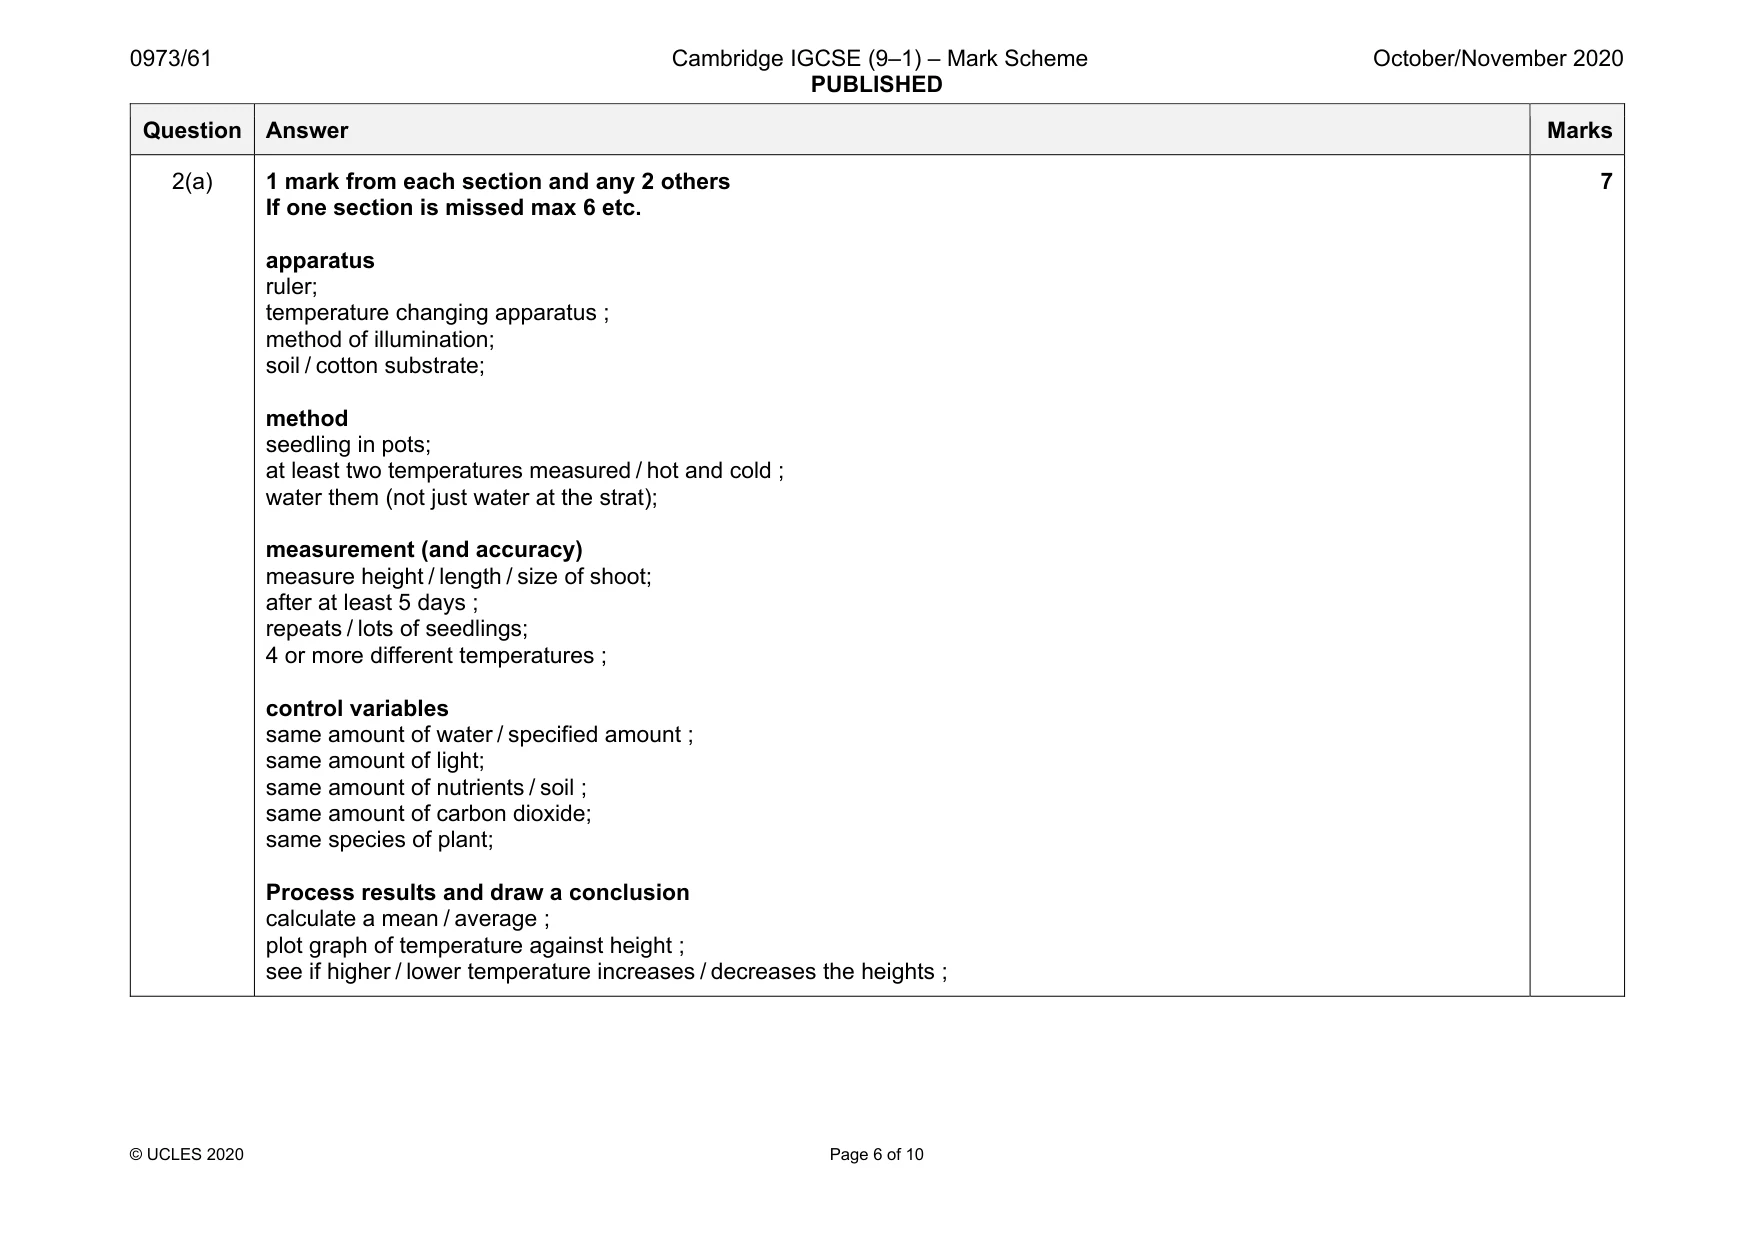
Mark scheme: 2(a) 1 mark from each section and any 2 others If one section is missed max 6 etc. apparatus ruler; temperature changing apparatus ; method of illumination; soil / cotton substrate; method seedling in pots; at least two temperatures measured / hot and cold ; water them (not just water at the strat); measurement (and accuracy) measure height / length / size of shoot; after at least 5 days ; repeats / lots of seedlings; 4 or more different temperatures ; control variables same amount of water / specified amount ; same amount of light; same amount of nutrients / soil ; same amount of carbon dioxide; same species of plant; Process results and draw a conclusion calculate a mean / average ; plot graph of temperature against height ; see if higher / lower temperature increases / decreases the heights ; 7 Question Answer Marks
Q3 · A student is provided with solid J which is a mixture of two compounds
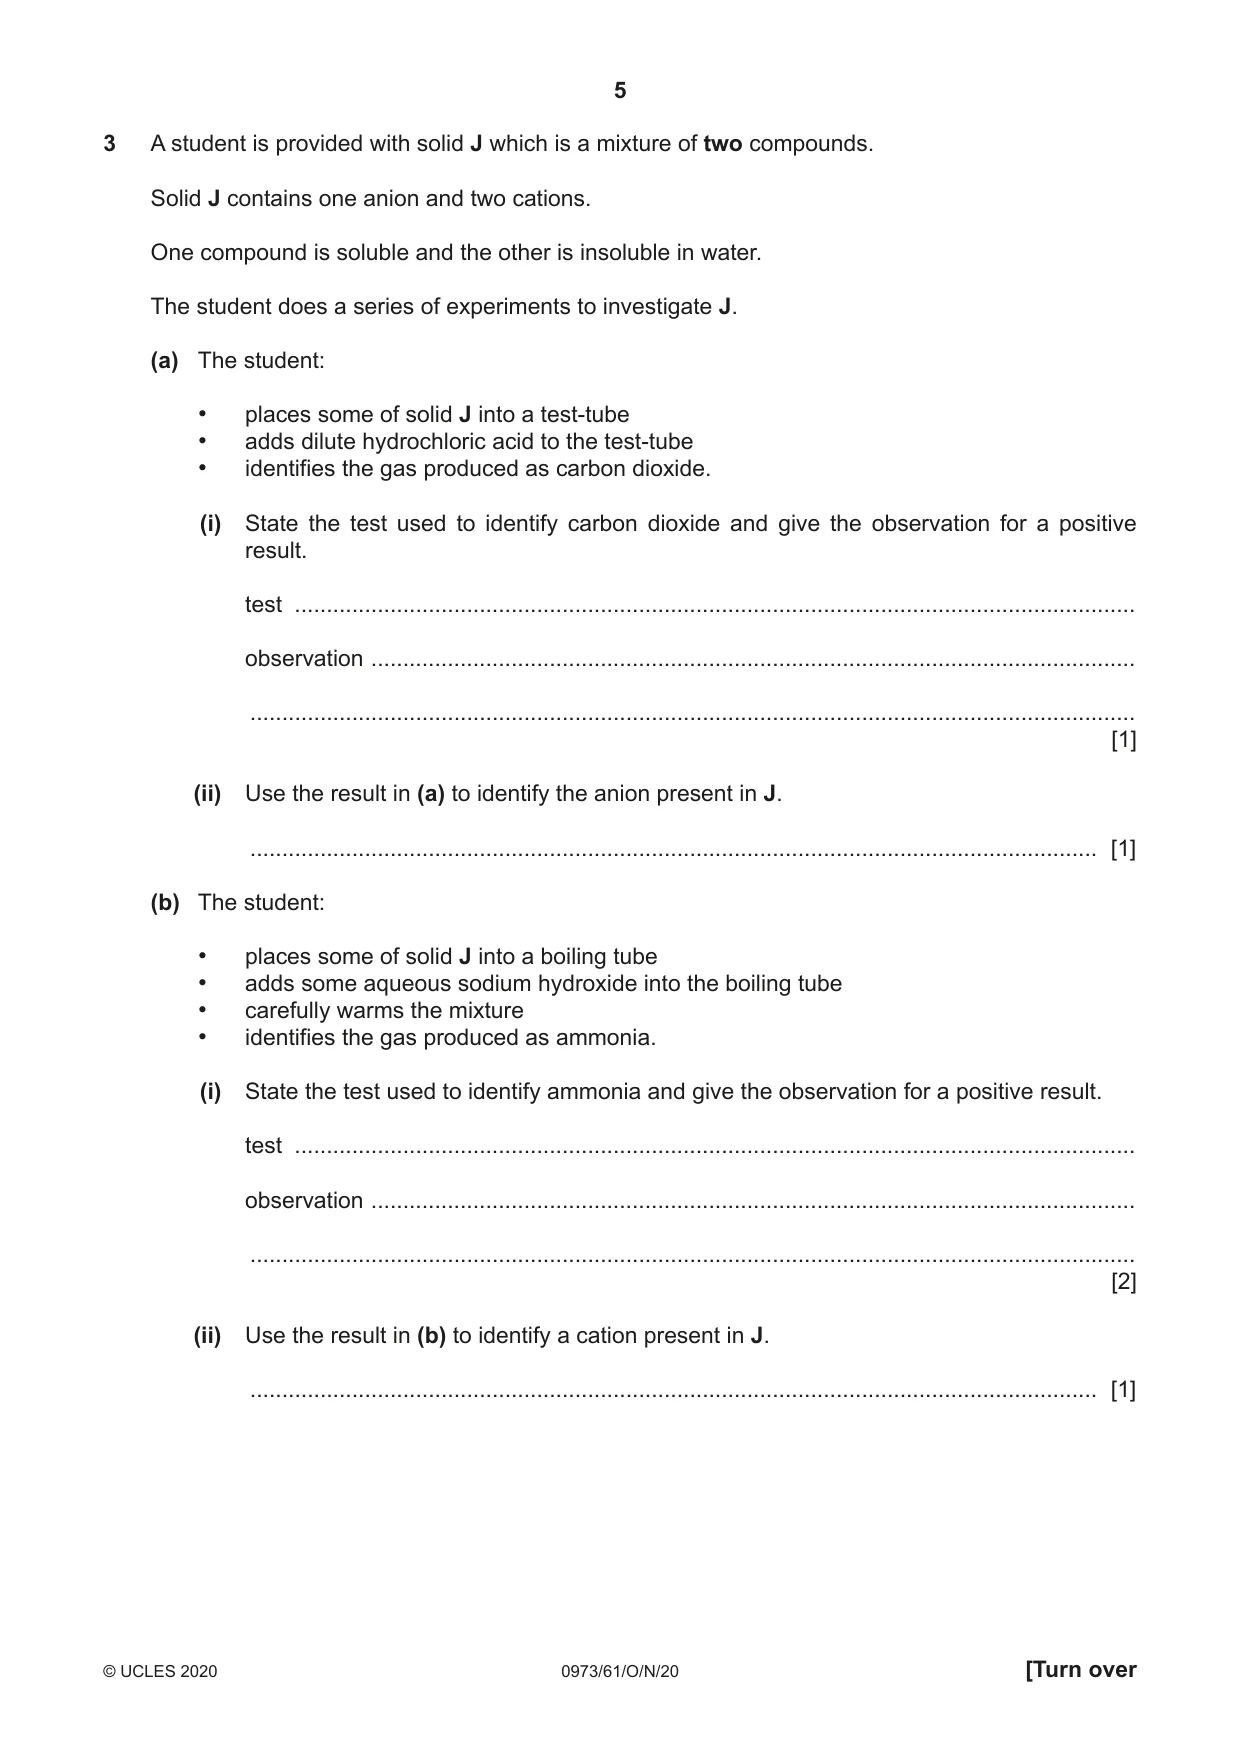
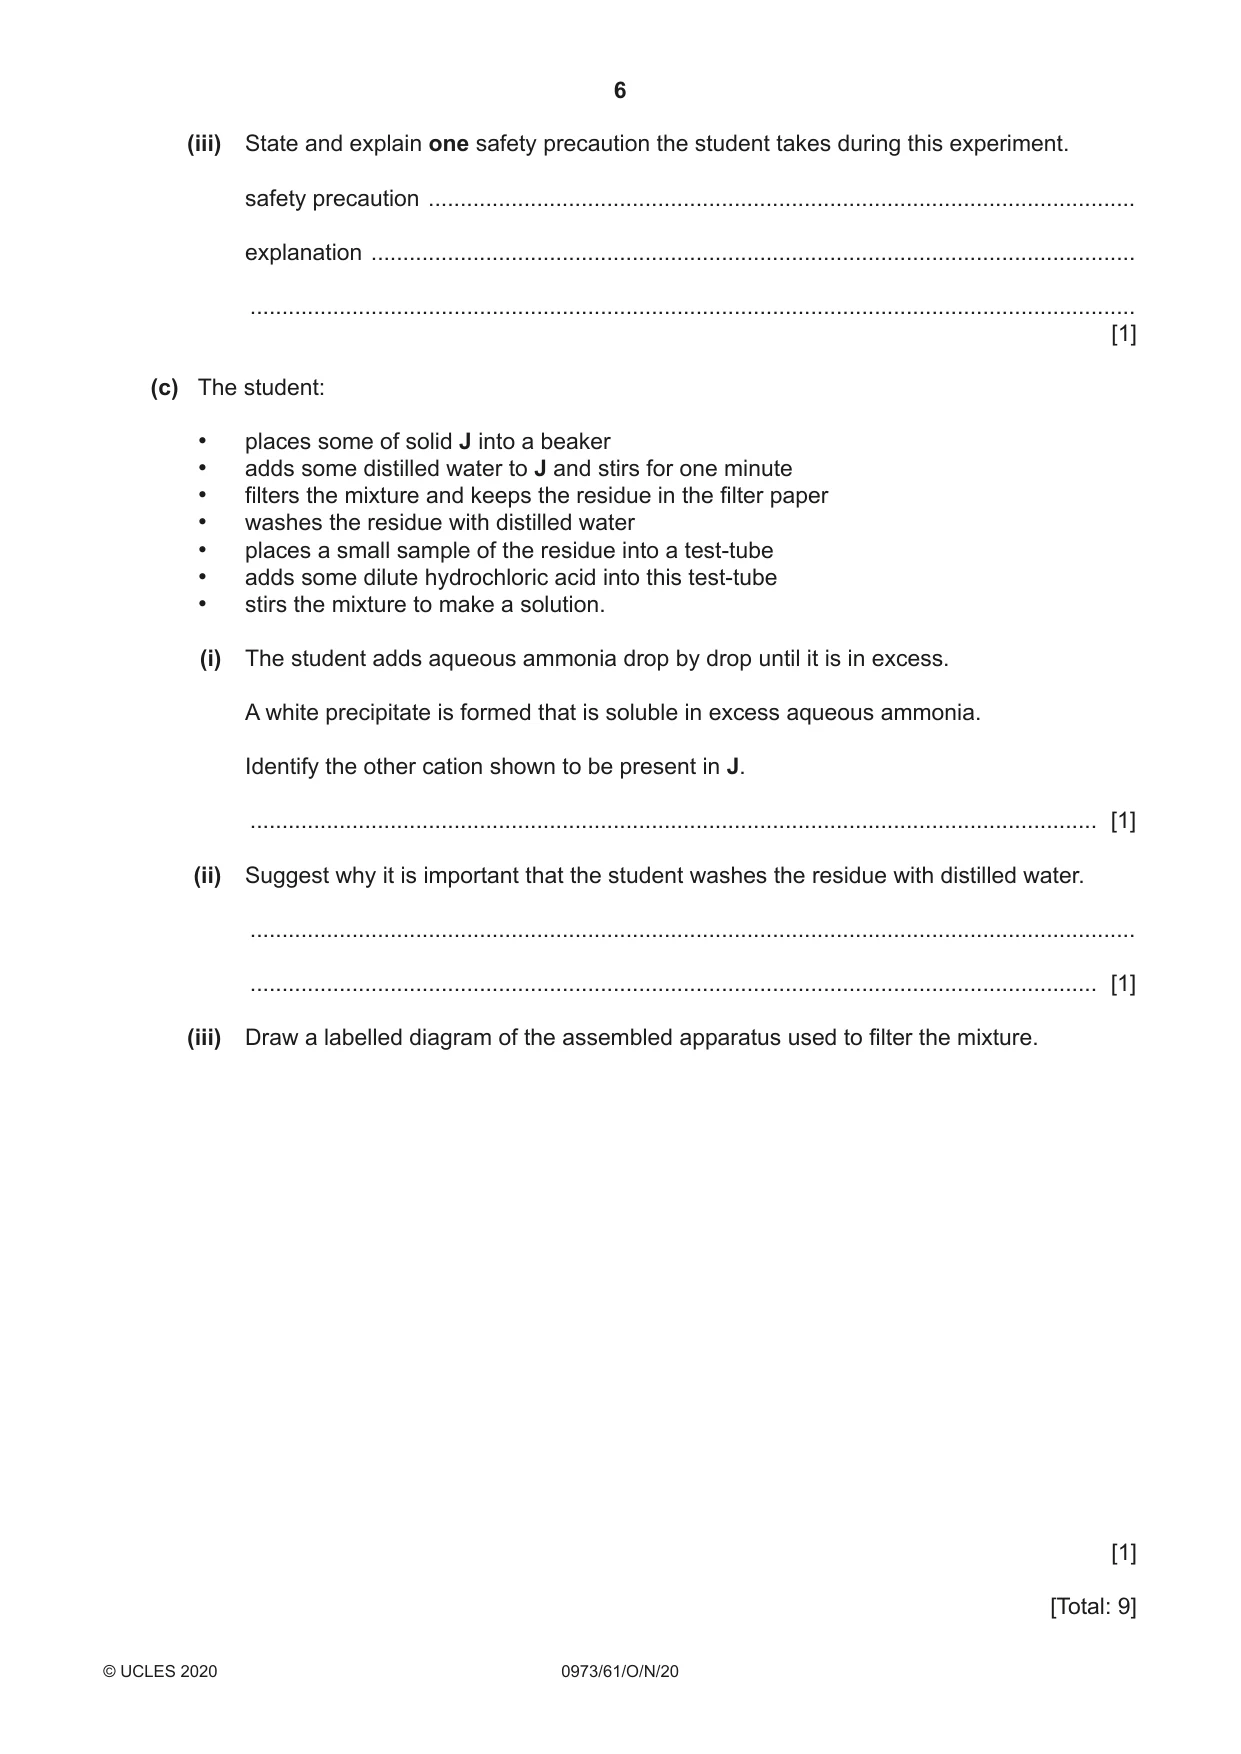
3 A student is provided with solid J which is a mixture of two compounds. Solid J contains one anion and two cations. One compound is soluble and the other is insoluble in water. The student does a series of experiments to investigate J. (a) The student: • places some of solid J into a test-tube • adds dilute hydrochloric acid to the test-tube • identifies the gas produced as carbon dioxide. (i) State the test used to identify carbon dioxide and give the observation for a positive result. test .................................................................................................................................... observation ........................................................................................................................ ........................................................................................................................................... [1] (ii) Use the result in (a) to identify the anion present in J. ..................................................................................................................................... [1] (b) The student: • places some of solid J into a boiling tube • adds some aqueous sodium hydroxide into the boiling tube • carefully warms the mixture • identifies the gas produced as ammonia. (i) State the test used to identify ammonia and give the observation for a positive result. test .................................................................................................................................... observation ........................................................................................................................ ........................................................................................................................................... [2] (ii) Use the result in (b) to identify a cation present in J. ..................................................................................................................................... [1] (iii) State and explain one safety precaution the student takes during this experiment. safety precaution ............................................................................................................... explanation ........................................................................................................................ ........................................................................................................................................... [1] (c) The student: • places some of solid J into a beaker • adds some distilled water to J and stirs for one minute • filters the mixture and keeps the residue in the filter paper • washes the residue with distilled water • places a small sample of the residue into a test-tube • adds some dilute hydrochloric acid into this test-tube • stirs the mixture to make a solution. (i) The student adds aqueous ammonia drop by drop until it is in excess. A white precipitate is formed that is soluble in excess aqueous ammonia. Identify the other cation shown to be present in J. ..................................................................................................................................... [1] (ii) Suggest why it is important that the student washes the residue with distilled water. ........................................................................................................................................... ..................................................................................................................................... [1] (iii) Draw a labelled diagram of the assembled apparatus used to filter the mixture. [1] [Total: 9]
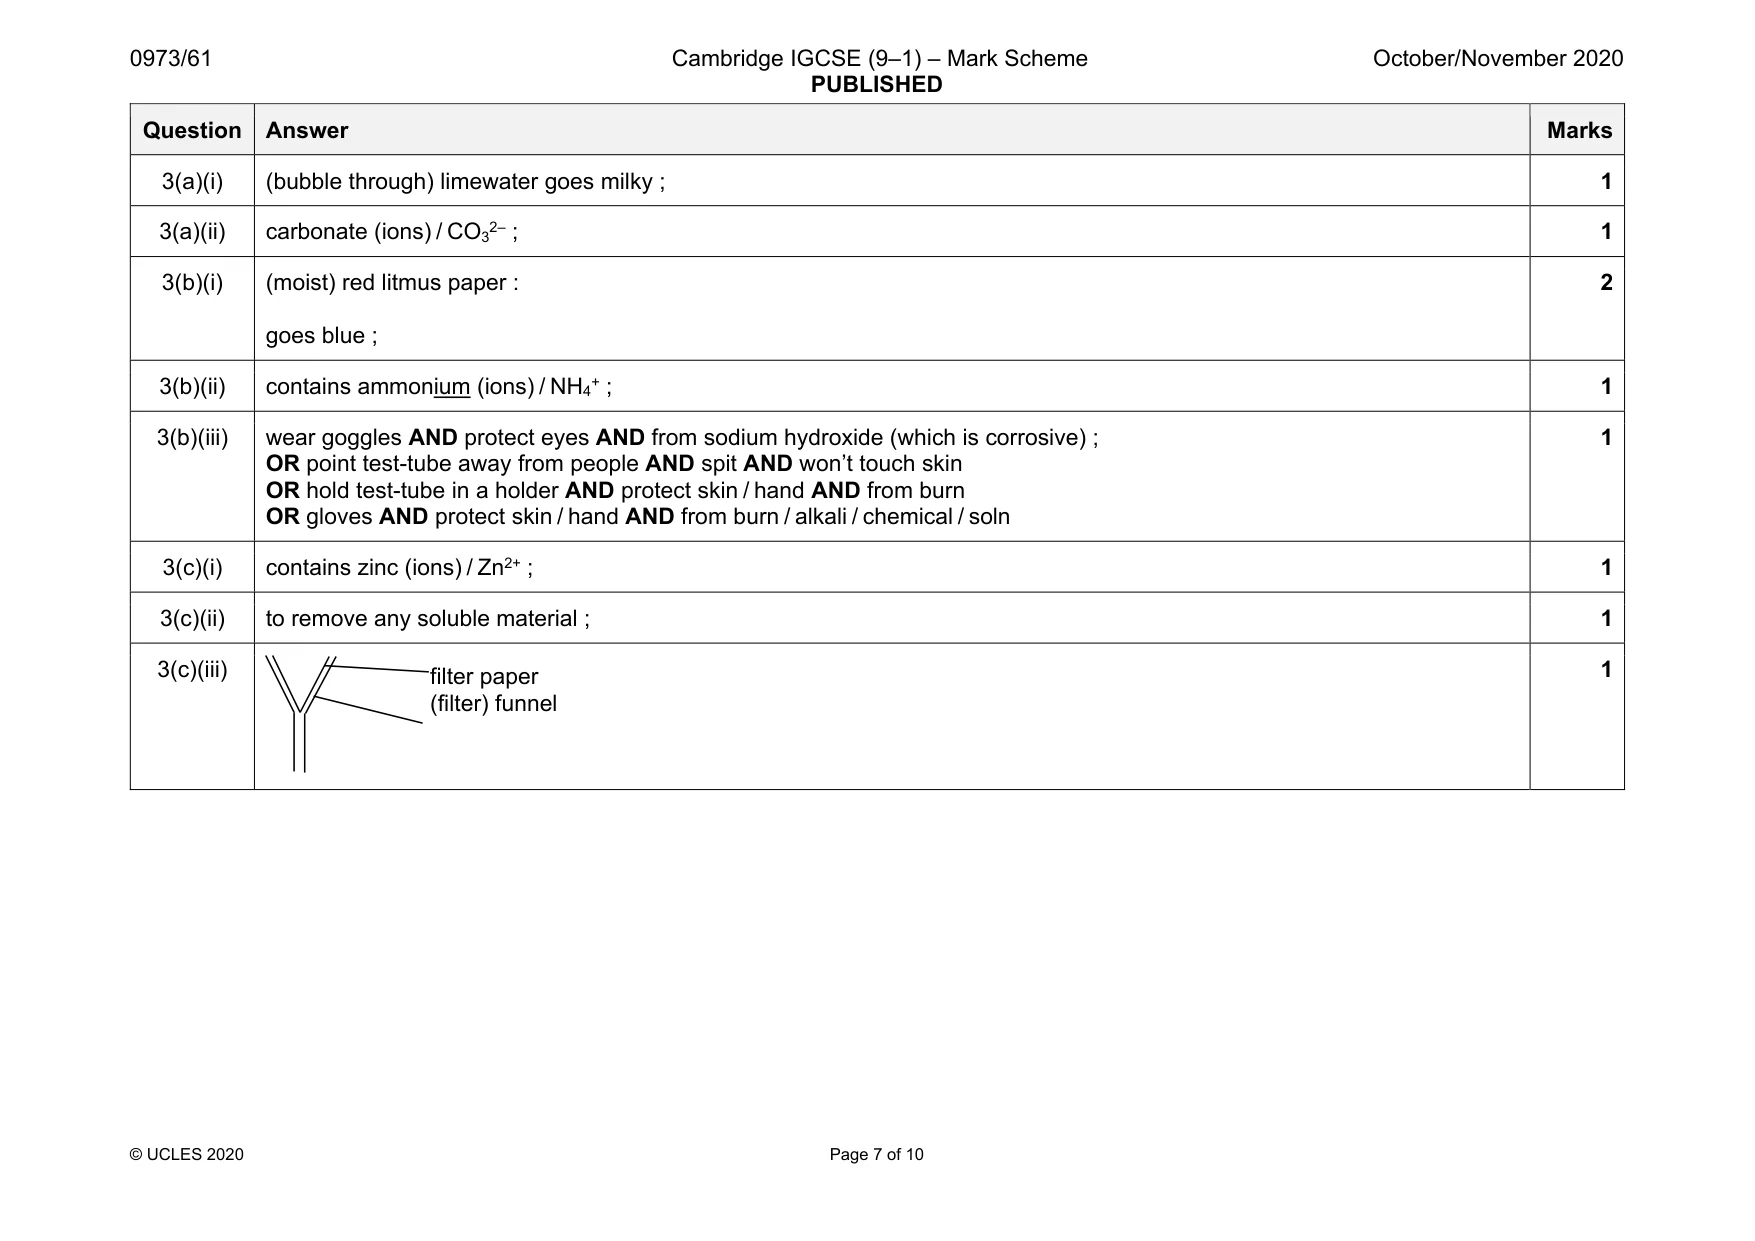
Mark scheme: 3(a)(i) (bubble through) limewater goes milky ; 1 3(a)(ii) carbonate (ions) / CO32– ; 1 3(b)(i) (moist) red litmus paper : goes blue ; 2 3(b)(ii) contains ammonium (ions) / NH4+ ; 1 3(b)(iii) wear goggles AND protect eyes AND from sodium hydroxide (which is corrosive) ; OR point test-tube away from people AND spit AND won’t touch skin OR hold test-tube in a holder AND protect skin / hand AND from burn OR gloves AND protect skin / hand AND from burn / alkali / chemical / soln 1 3(c)(i) contains zinc (ions) / Zn2+ ; 1 3(c)(ii) to remove any soluble material ; 1 3(c)(iii) 1 filter paper (filter) funnel Question Answer Marks
Q4 · A student investigates the effect of increasing the length of magnesium ribbon on the…
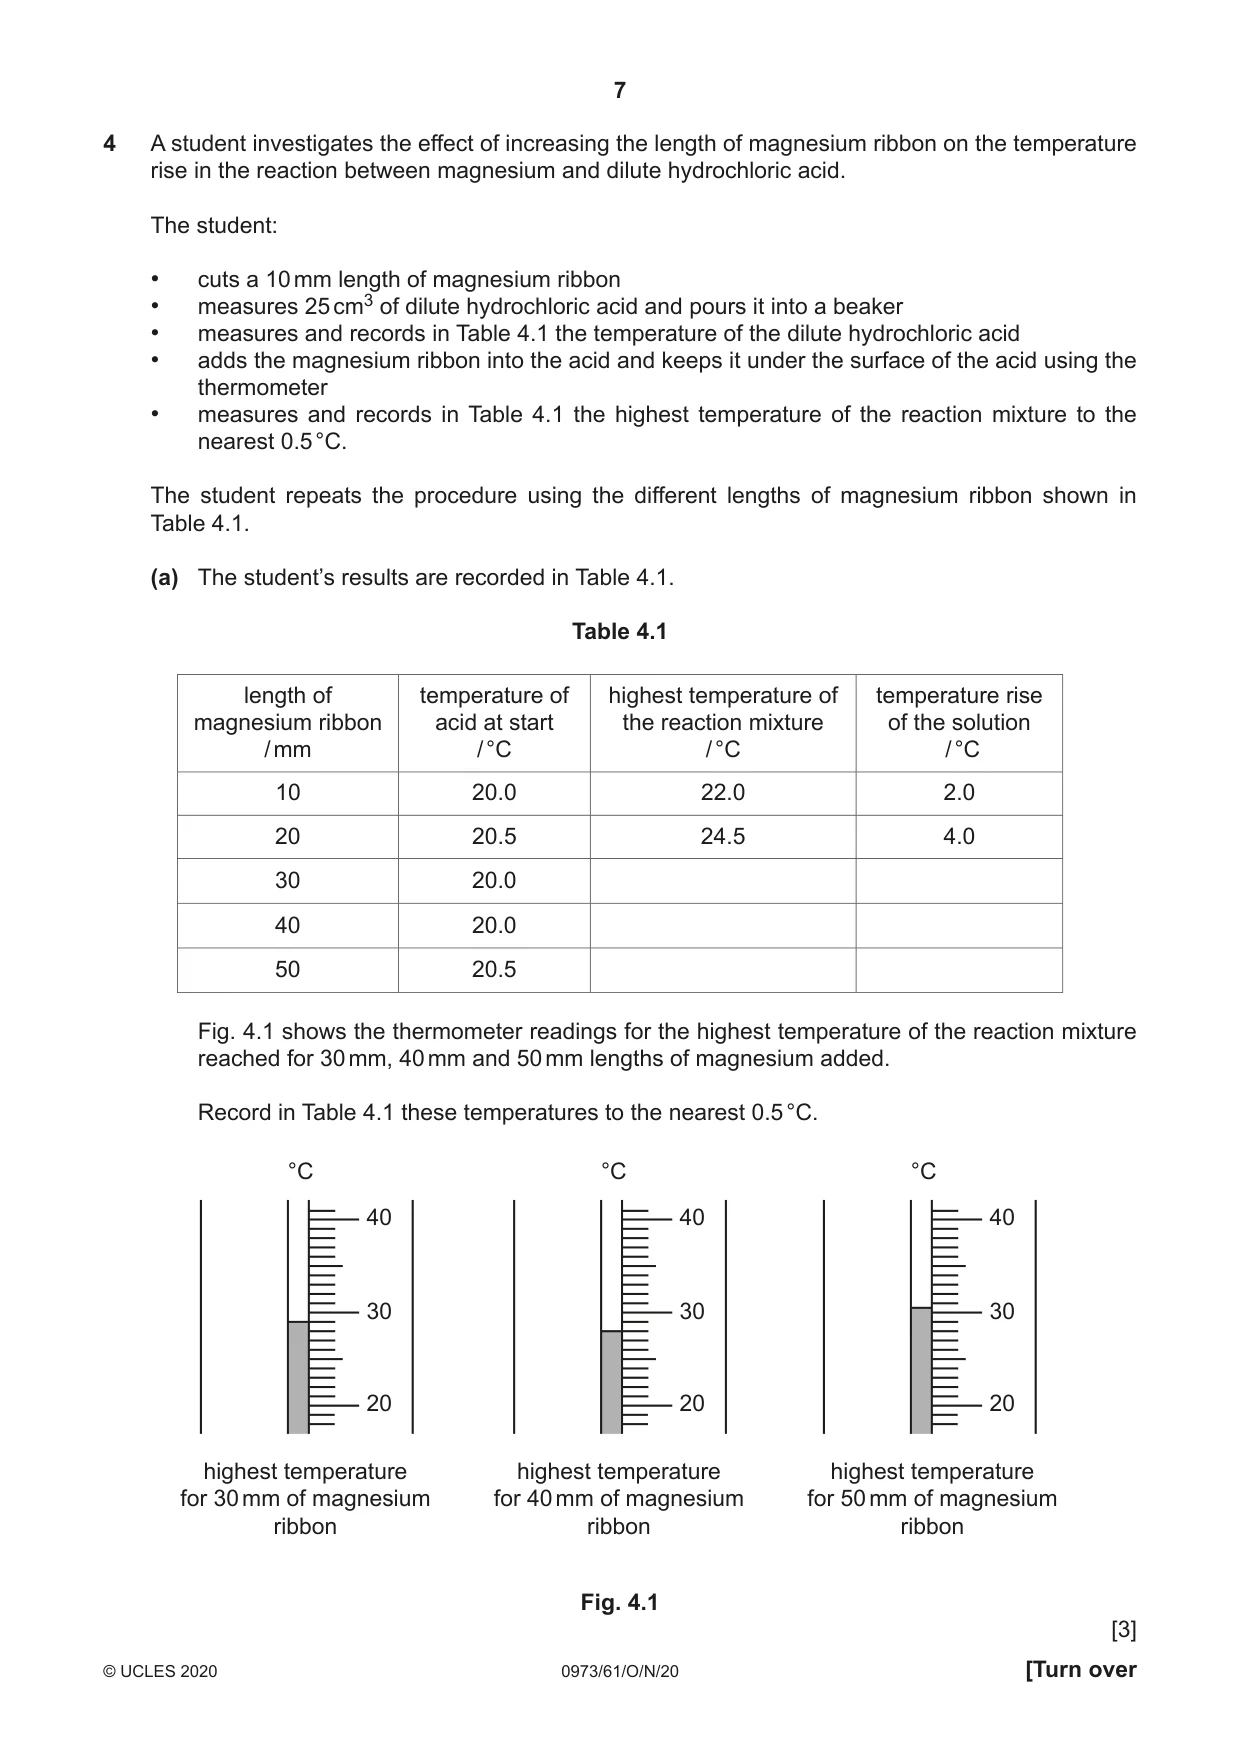
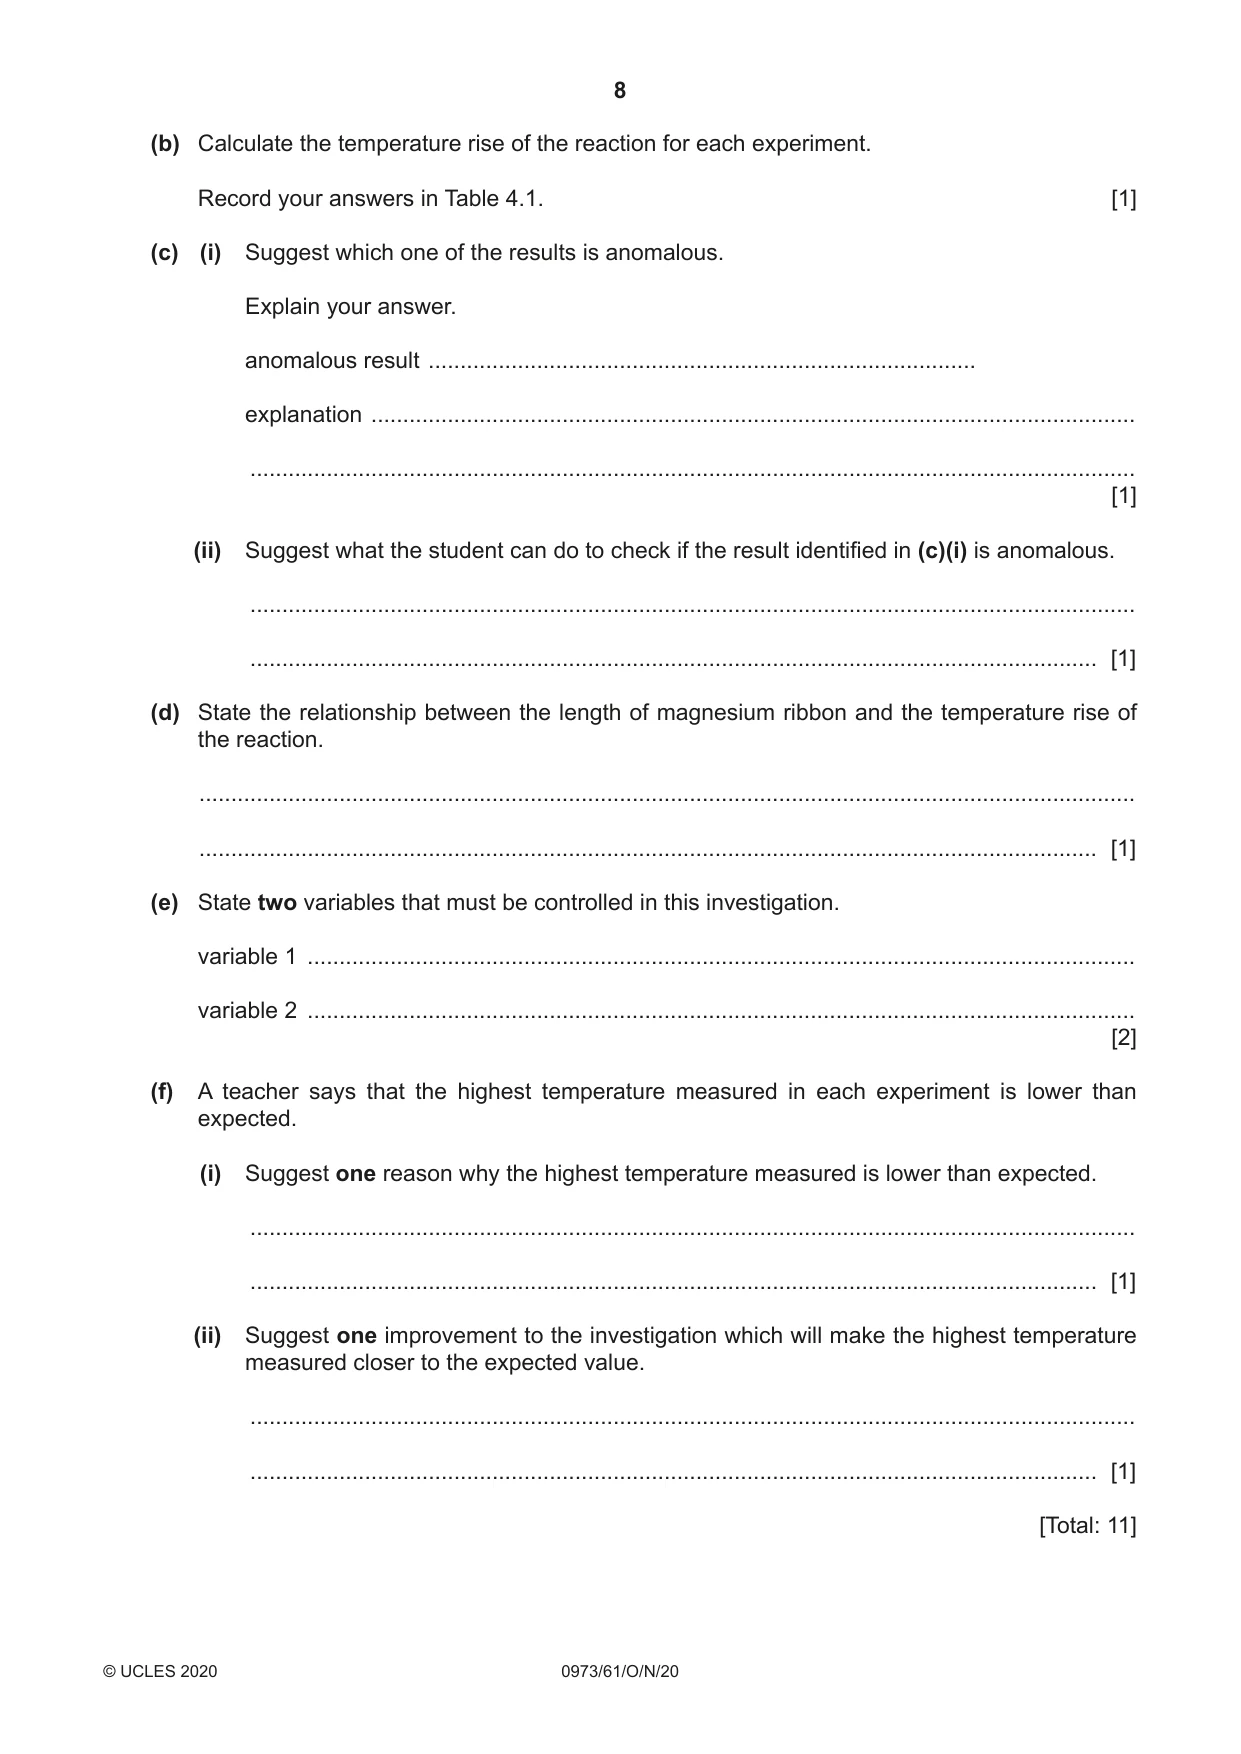
4 A student investigates the effect of increasing the length of magnesium ribbon on the temperature rise in the reaction between magnesium and dilute hydrochloric acid. The student: • cuts a 10 mm length of magnesium ribbon • measures 25 cm3 of dilute hydrochloric acid and pours it into a beaker • measures and records in Table 4.1 the temperature of the dilute hydrochloric acid • adds the magnesium ribbon into the acid and keeps it under the surface of the acid using the thermometer • measures and records in Table 4.1 the highest temperature of the reaction mixture to the nearest 0.5 °C. The student repeats the procedure using the different lengths of magnesium ribbon shown in Table 4.1. (a) The student’s results are recorded in Table 4.1. Table 4.1 length of temperature of highest temperature of temperature rise magnesium ribbon acid at start the reaction mixture of the solution / mm / °C / °C / °C 10 20.0 22.0 2.0 20 20.5 24.5 4.0 30 20.0 40 20.0 50 20.5 Fig. 4.1 shows the thermometer readings for the highest temperature of the reaction mixture reached for 30 mm, 40 mm and 50 mm lengths of magnesium added. Record in Table 4.1 these temperatures to the nearest 0.5 °C. °C °C °C 40 40 40 30 30 30 20 20 20 highest temperature highest temperature highest temperature for 30 mm of magnesium for 40 mm of magnesium for 50 mm of magnesium ribbon ribbon ribbon Fig. 4.1 [3] (b) Calculate the temperature rise of the reaction for each experiment. Record your answers in Table 4.1. [1] (c) (i) Suggest which one of the results is anomalous. Explain your answer. anomalous result ...................................................................................... explanation ........................................................................................................................ ........................................................................................................................................... [1] (ii) Suggest what the student can do to check if the result identified in (c)(i) is anomalous. ........................................................................................................................................... ..................................................................................................................................... [1] (d) State the relationship between the length of magnesium ribbon and the temperature rise of the reaction. ................................................................................................................................................... ............................................................................................................................................. [1] (e) State two variables that must be controlled in this investigation. variable 1 .................................................................................................................................. variable 2 .................................................................................................................................. [2] (f) A teacher says that the highest temperature measured in each experiment is lower than expected. (i) Suggest one reason why the highest temperature measured is lower than expected. ........................................................................................................................................... ..................................................................................................................................... [1] (ii) Suggest one improvement to the investigation which will make the highest temperature measured closer to the expected value. ........................................................................................................................................... ..................................................................................................................................... [1] [Total: 11]
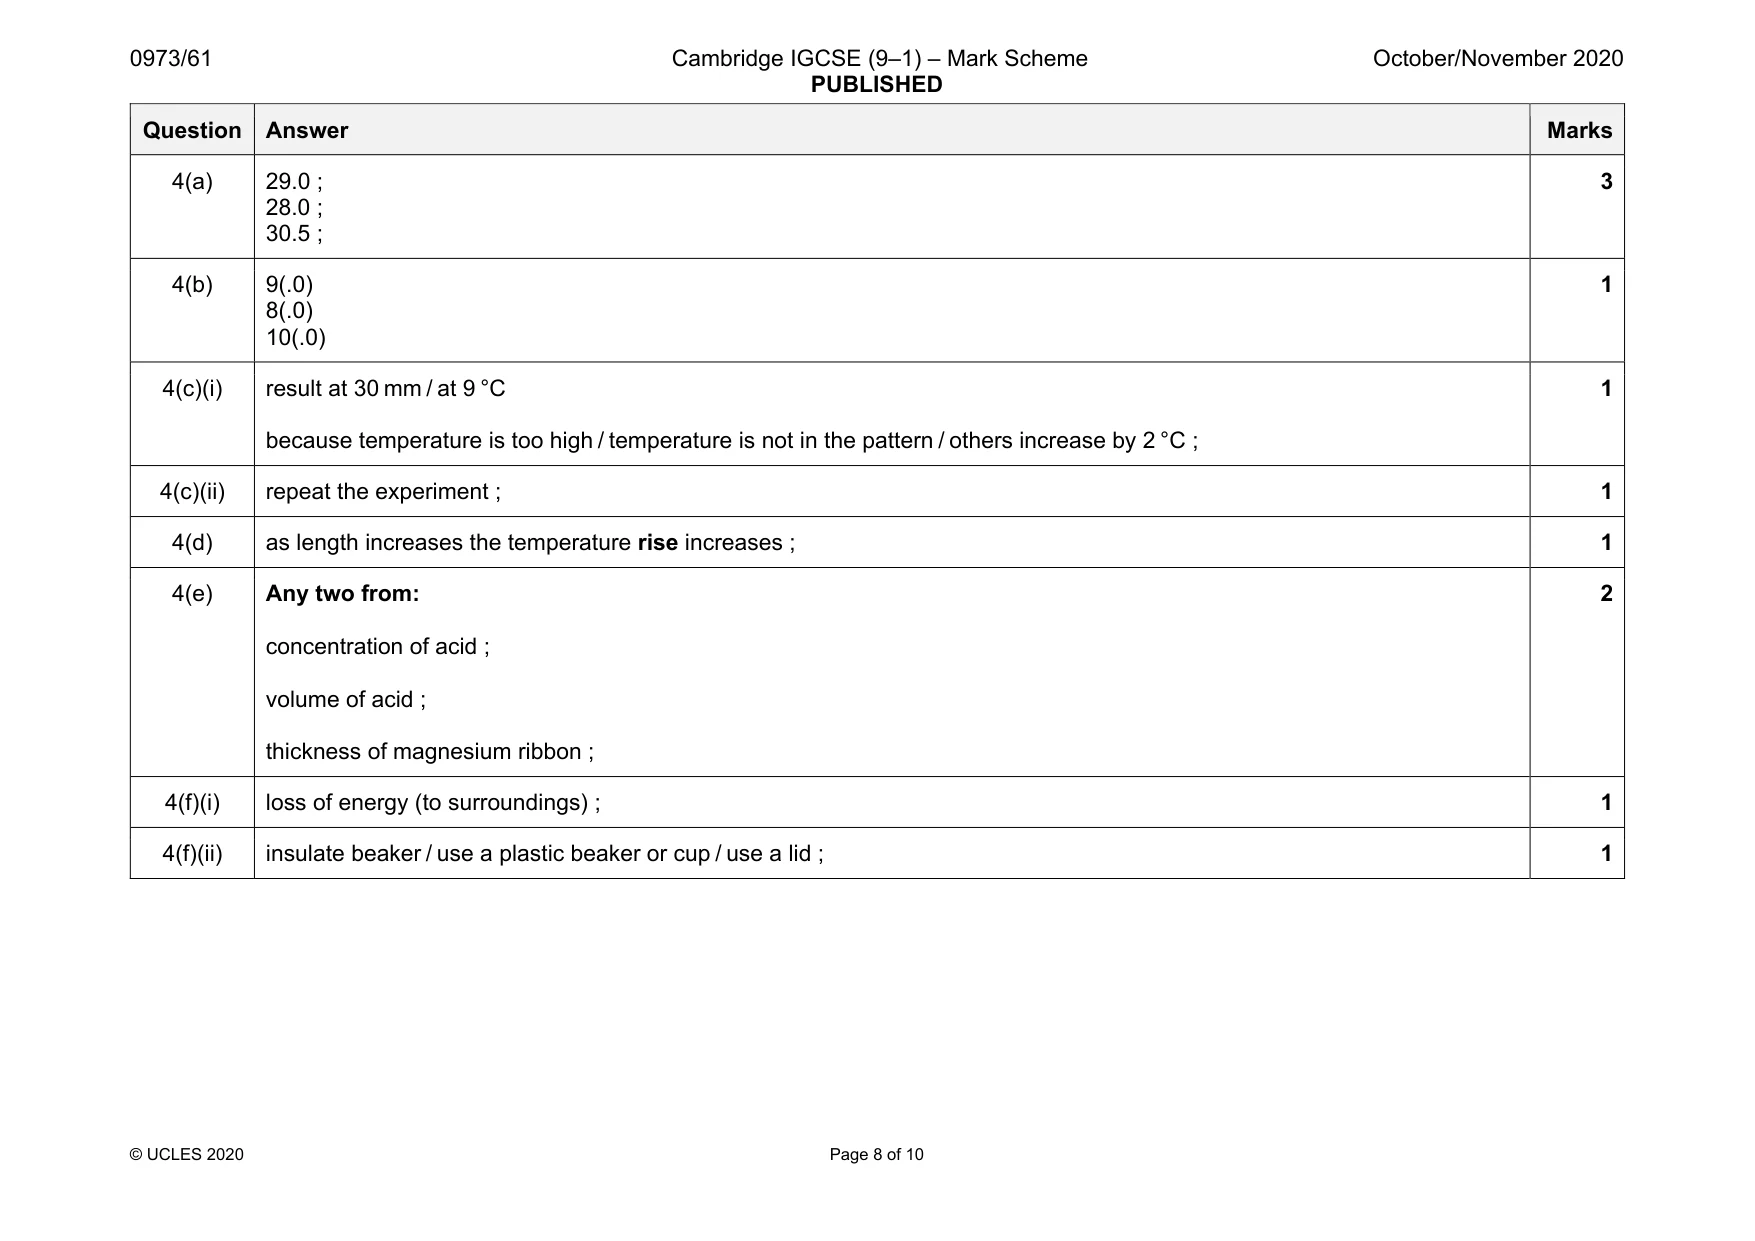
Mark scheme: 4(a) 29.0 ; 28.0 ; 30.5 ; 3 4(b) 9(.0) 8(.0) 10(.0) 1 4(c)(i) result at 30 mm / at 9 °C because temperature is too high / temperature is not in the pattern / others increase by 2 °C ; 1 4(c)(ii) repeat the experiment ; 1 4(d) as length increases the temperature rise increases ; 1 4(e) Any two from: concentration of acid ; volume of acid ; thickness of magnesium ribbon ; 2 4(f)(i) loss of energy (to surroundings) ; 1 4(f)(ii) insulate beaker / use a plastic beaker or cup / use a lid ; 1 Question Answer Marks
Q5 · A student uses two different methods to measure the spring constant k of a spring
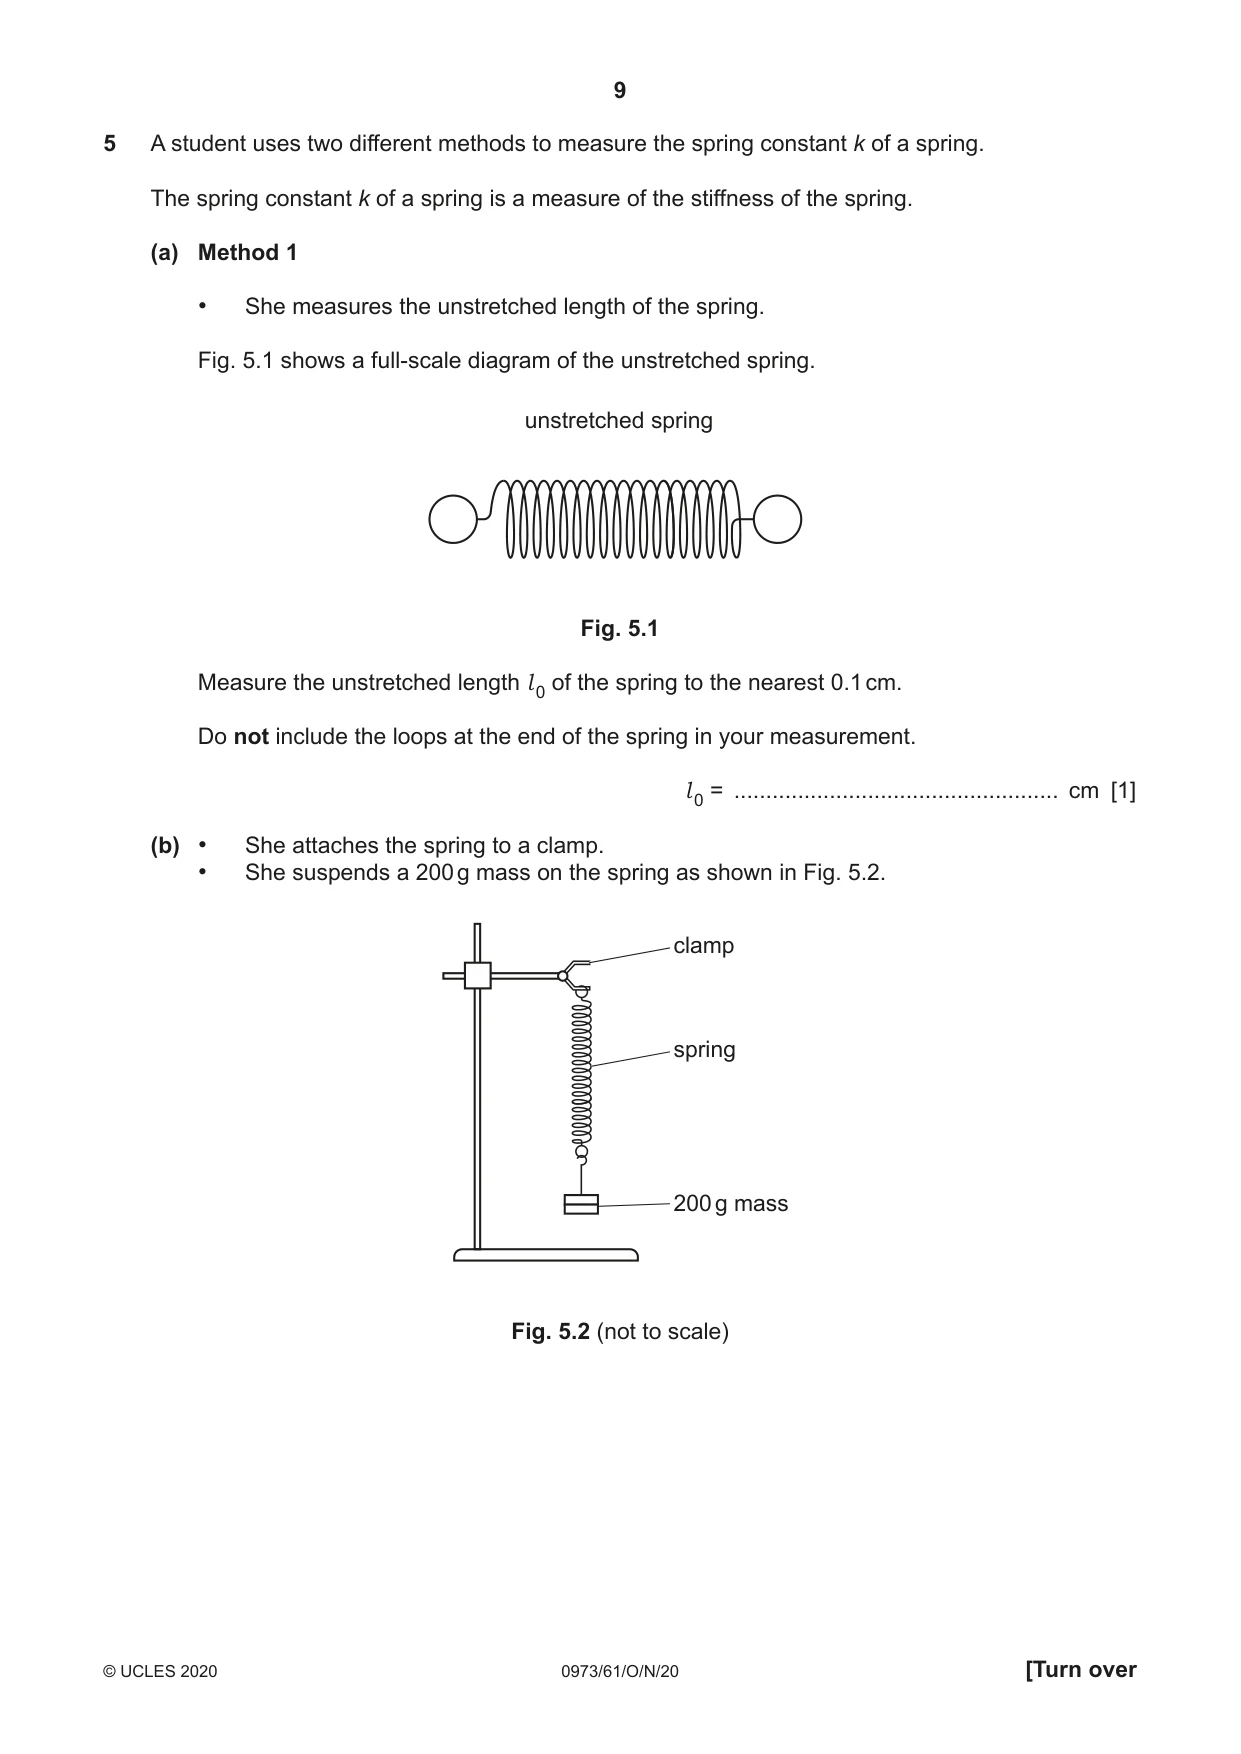
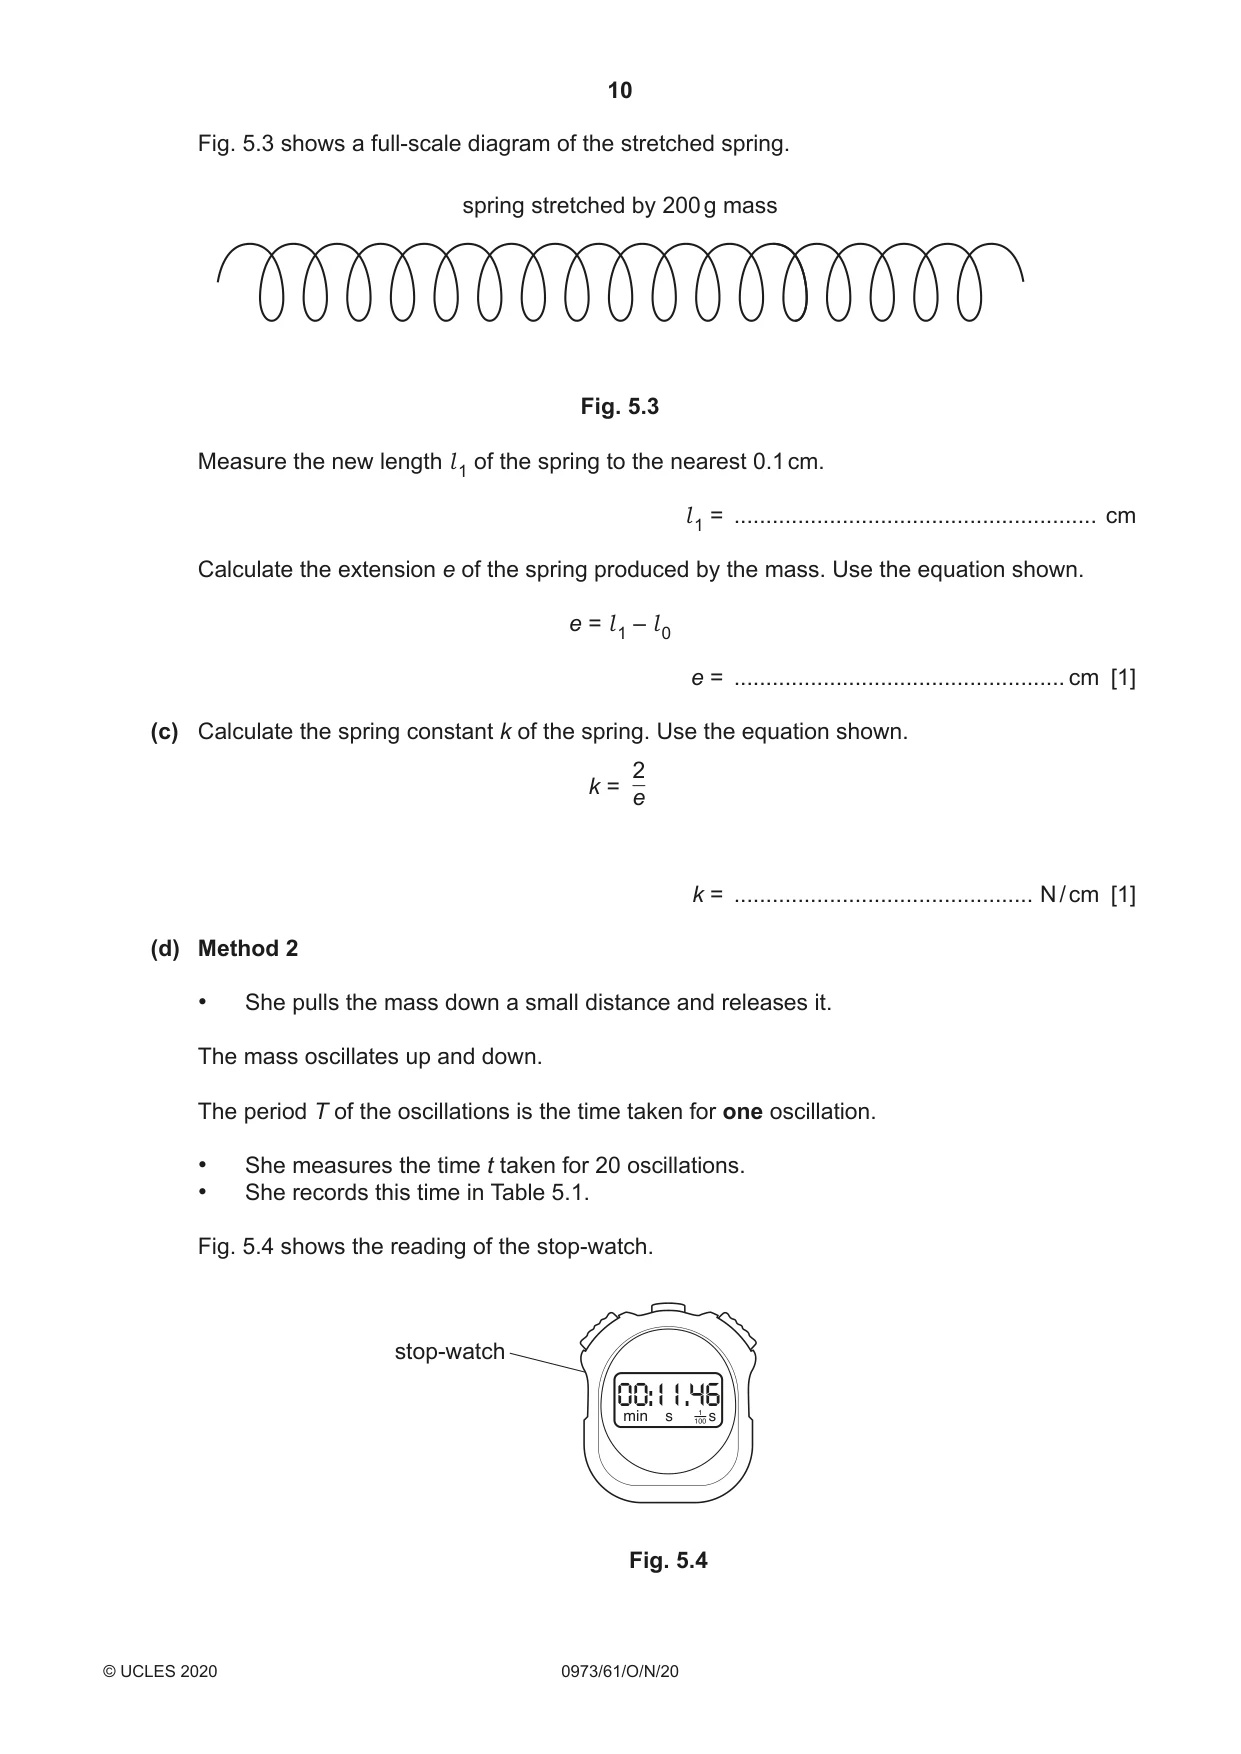
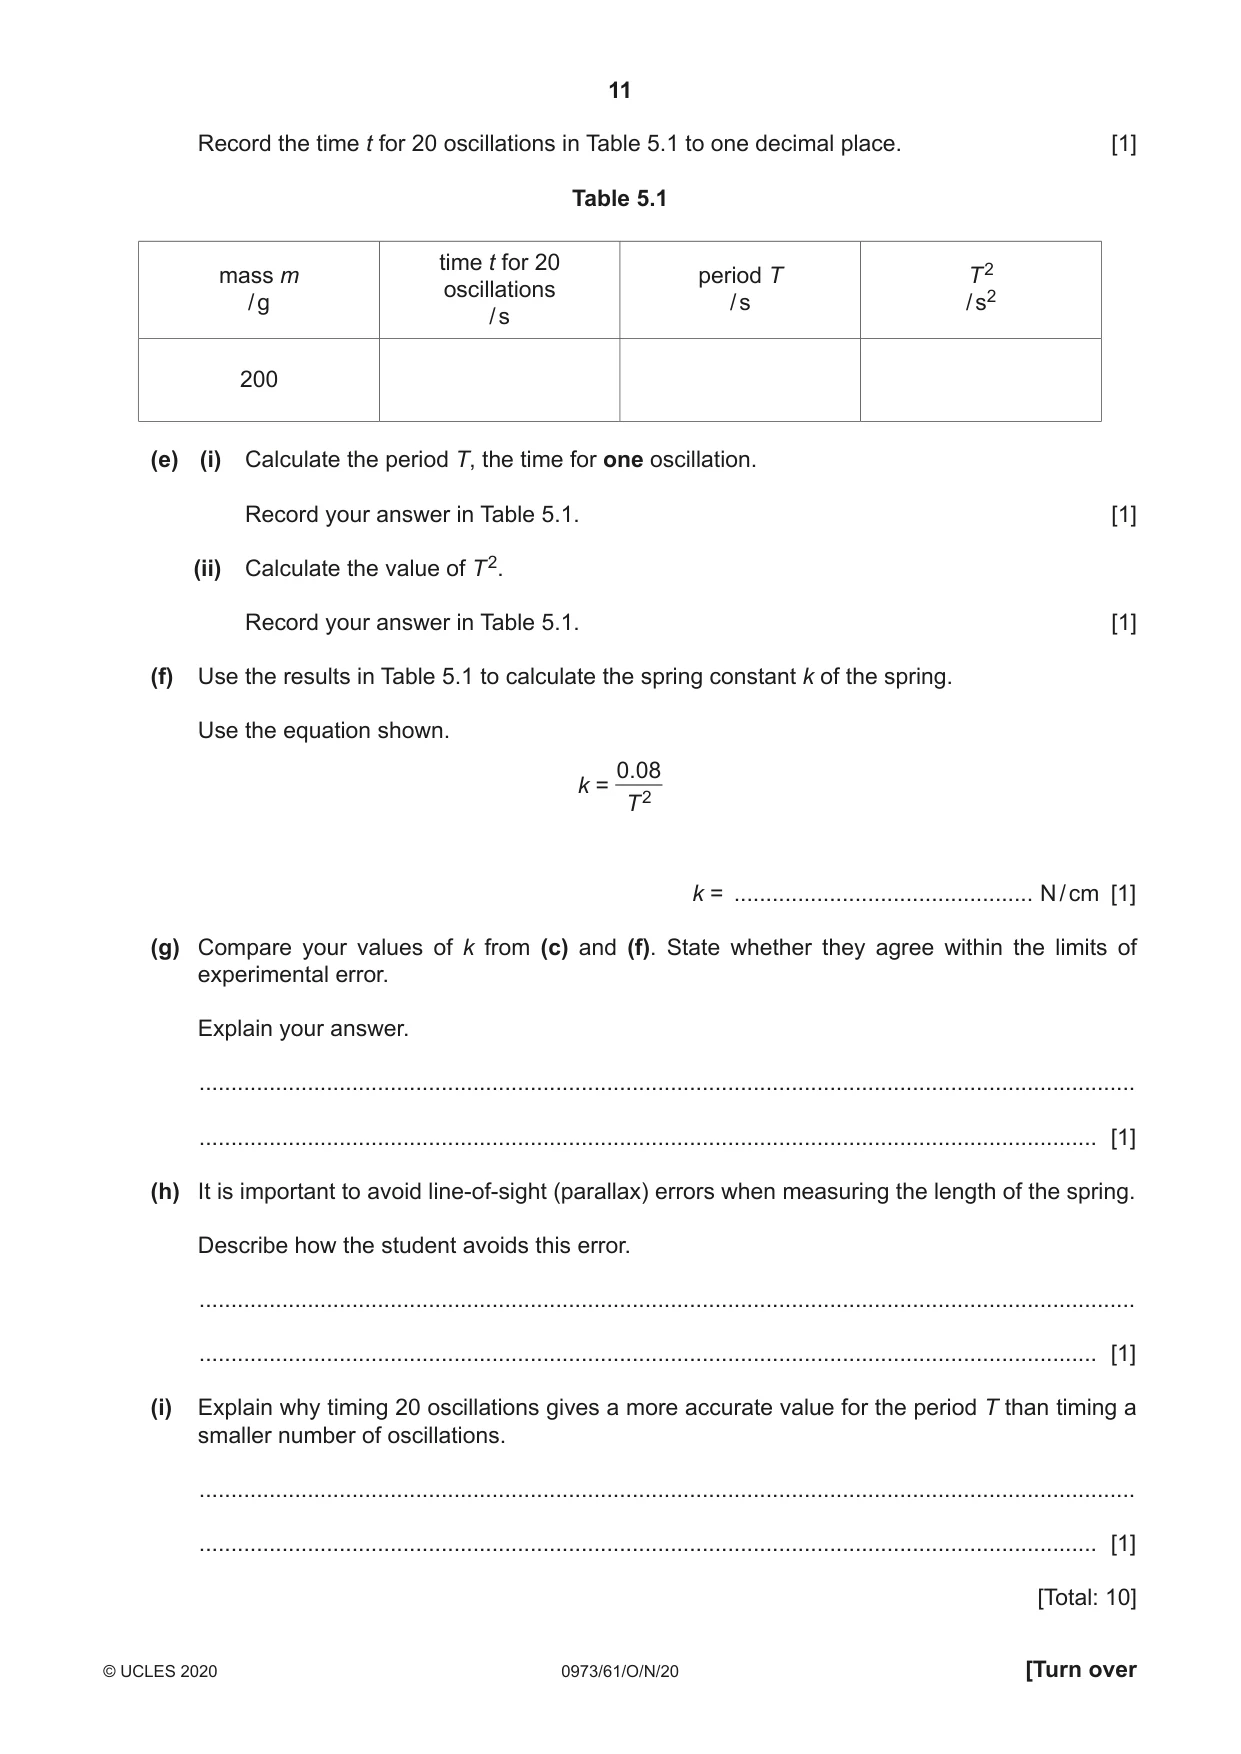
5 A student uses two different methods to measure the spring constant k of a spring. The spring constant k of a spring is a measure of the stiffness of the spring. (a) Method 1 • She measures the unstretched length of the spring. Fig. 5.1 shows a full-scale diagram of the unstretched spring. unstretched spring Fig. 5.1 Measure the unstretched length l 0 of the spring to the nearest 0.1 cm. Do not include the loops at the end of the spring in your measurement. l 0 = ................................................... cm [1] (b) • She attaches the spring to a clamp. • She suspends a 200 g mass on the spring as shown in Fig. 5.2. clamp spring 200 g mass Fig. 5.2 (not to scale) Fig. 5.3 shows a full-scale diagram of the stretched spring. spring stretched by 200 g mass Fig. 5.3 Measure the new length l 1 of the spring to the nearest 0.1 cm. l 1 = ......................................................... cm Calculate the extension e of the spring produced by the mass. Use the equation shown. e = l 1 – l 0 e = .................................................... cm [1] (c) Calculate the spring constant k of the spring. Use the equation shown. 2 k = e k = ............................................... N / cm [1] (d) Method 2 • She pulls the mass down a small distance and releases it. The mass oscillates up and down. The period T of the oscillations is the time taken for one oscillation. • She measures the time t taken for 20 oscillations. • She records this time in Table 5.1. Fig. 5.4 shows the reading of the stop-watch. stop-watch 00:11.461 min s 100 s Fig. 5.4 Record the time t for 20 oscillations in Table 5.1 to one decimal place. [1] Table 5.1 time t for 20 mass m period T T 2 oscillations / g / s / s2 / s 200 (e) (i) Calculate the period T, the time for one oscillation. Record your answer in Table 5.1. [1] (ii) Calculate the value of T 2. Record your answer in Table 5.1. [1] (f) Use the results in Table 5.1 to calculate the spring constant k of the spring. Use the equation shown. 0.08 k = T 2 k = ............................................... N / cm [1] (g) Compare your values of k from (c) and (f). State whether they agree within the limits of experimental error. Explain your answer. ................................................................................................................................................... ............................................................................................................................................. [1] (h) It is important to avoid line-of-sight (parallax) errors when measuring the length of the spring. Describe how the student avoids this error. ................................................................................................................................................... ............................................................................................................................................. [1] (i) Explain why timing 20 oscillations gives a more accurate value for the period T than timing a smaller number of oscillations. ................................................................................................................................................... ............................................................................................................................................. [1] [Total: 10]
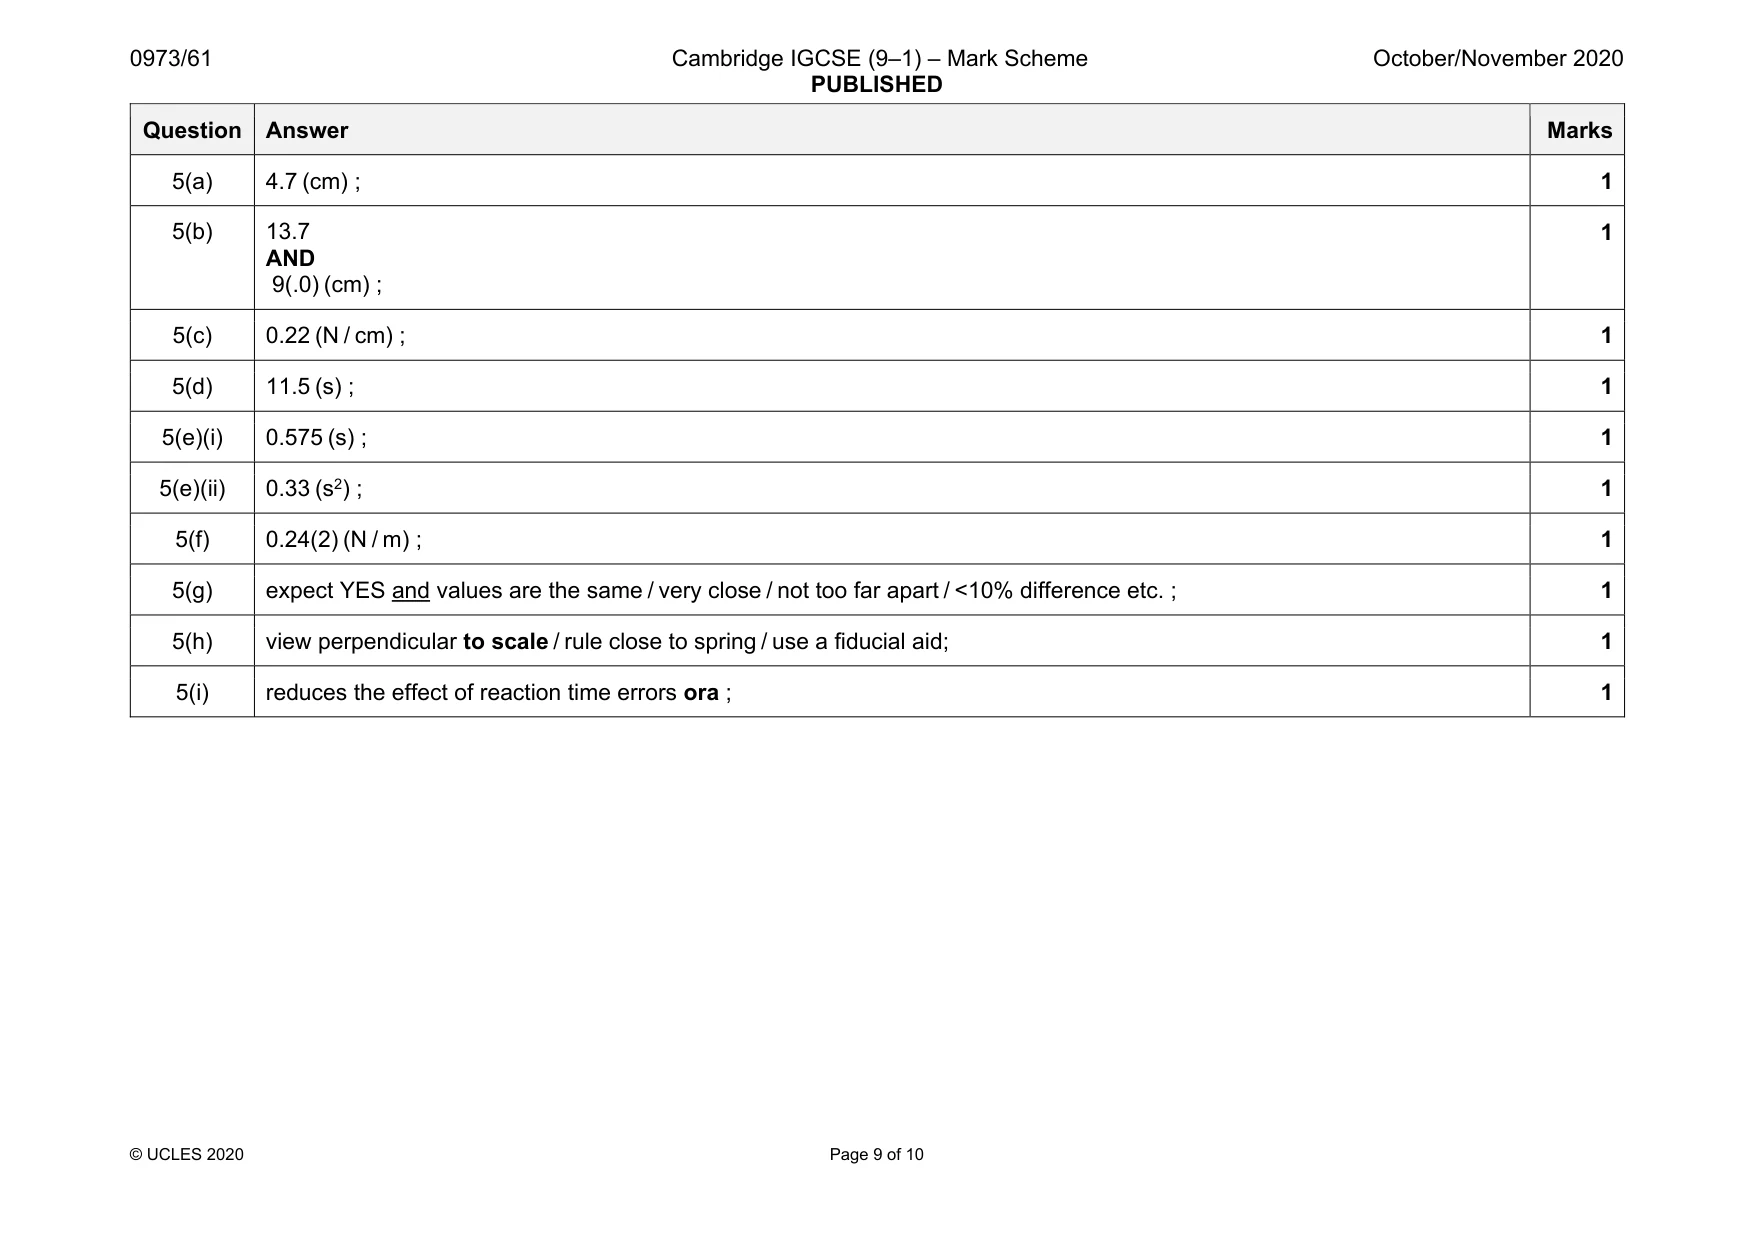
Mark scheme: 5(a) 4.7 (cm) ; 1 5(b) 13.7 AND 9(.0) (cm) ; 1 5(c) 0.22 (N / cm) ; 1 5(d) 11.5 (s) ; 1 5(e)(i) 0.575 (s) ; 1 5(e)(ii) 0.33 (s2) ; 1 5(f) 0.24(2) (N / m) ; 1 5(g) expect YES and values are the same / very close / not too far apart / <10% difference etc. ; 1 5(h) view perpendicular to scale / rule close to spring / use a fiducial aid; 1 5(i) reduces the effect of reaction time errors ora ; 1 Question Answer Marks
Q6 · A student investigates the cooling of hot water in a beaker
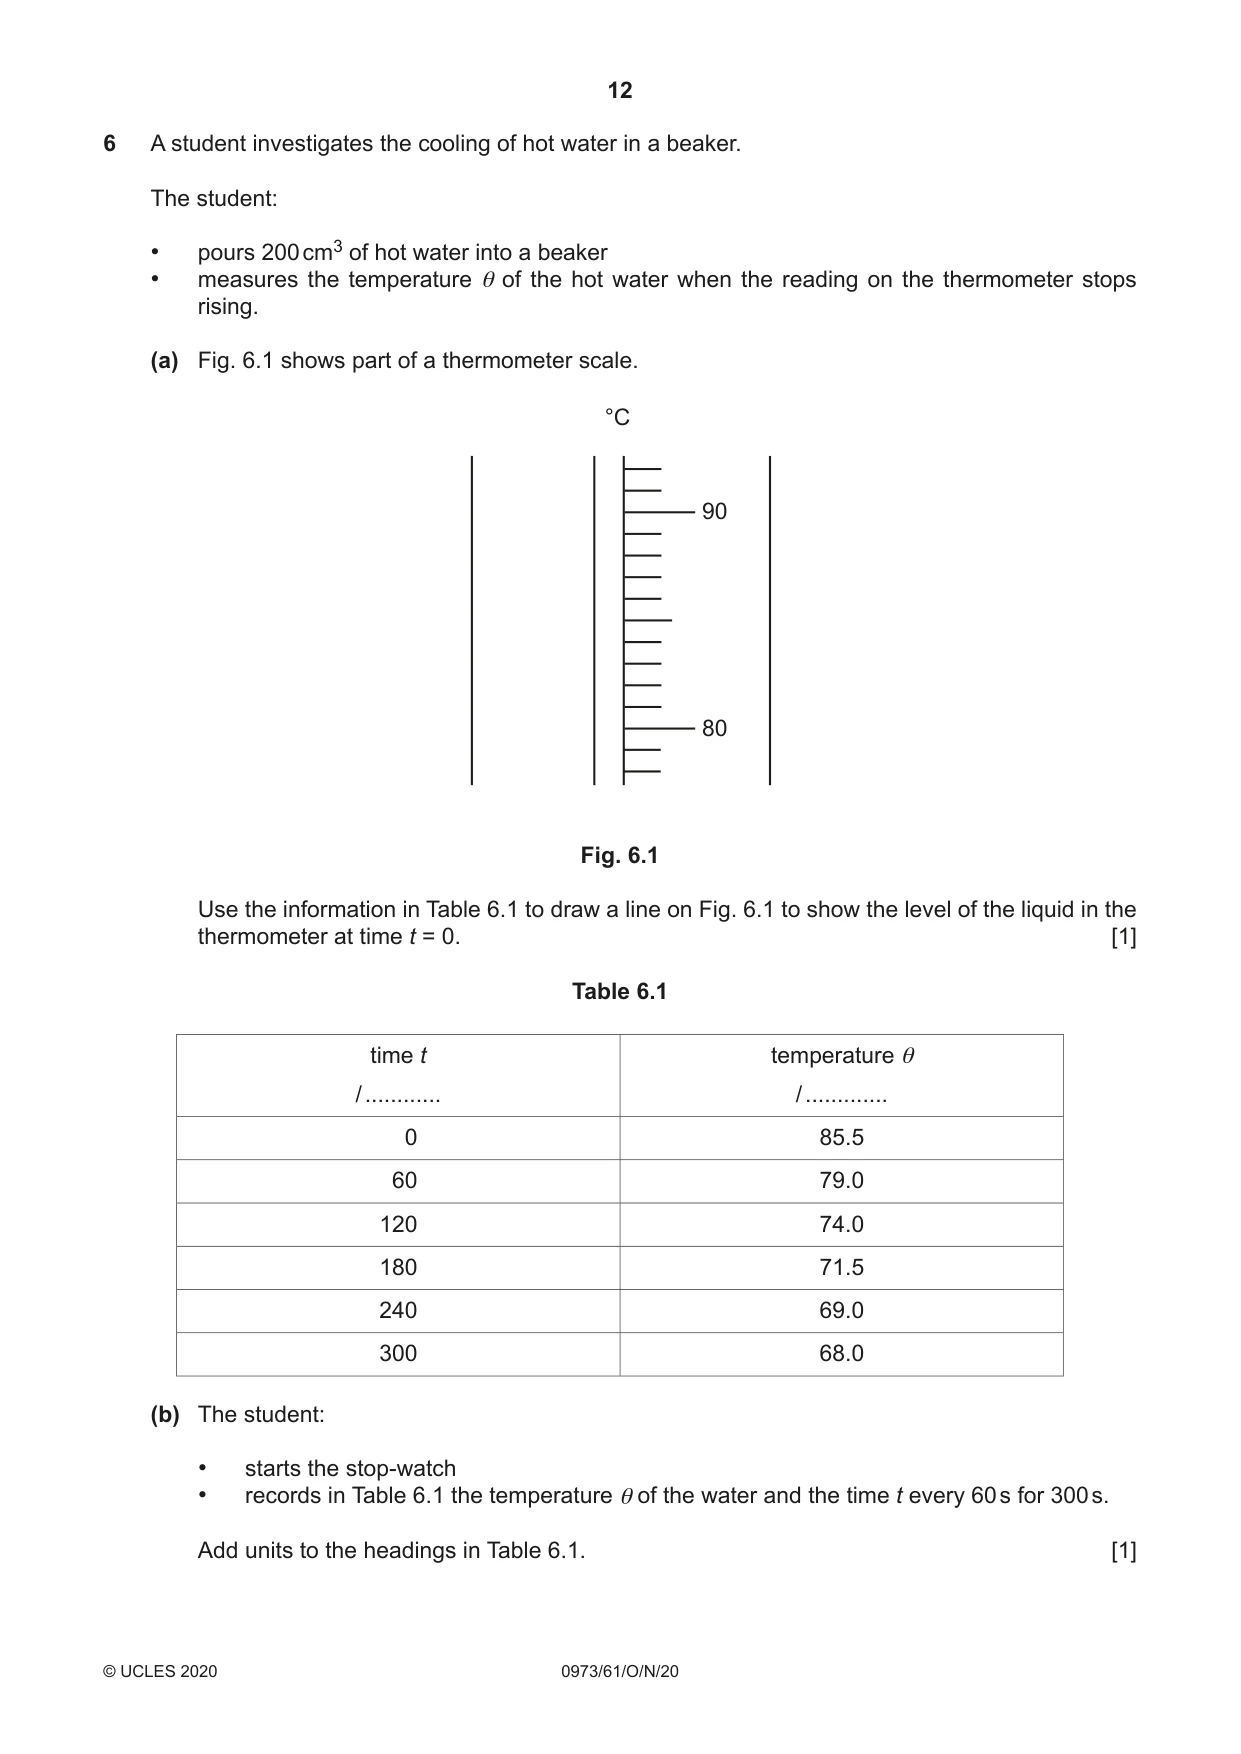
6 A student investigates the cooling of hot water in a beaker. The student: • pours 200 cm3 of hot water into a beaker • measures the temperature θ of the hot water when the reading on the thermometer stops rising. (a) Fig. 6.1 shows part of a thermometer scale. °C 90 80 Fig. 6.1 Use the information in Table 6.1 to draw a line on Fig. 6.1 to show the level of the liquid in the thermometer at time t = 0. [1] Table 6.1 time t temperature θ / ............ / ............. 0 85.5 60 79.0 120 74.0 180 71.5 240 69.0 300 68.0 (b) The student: • starts the stop-watch • records in Table 6.1 the temperature θ of the water and the time t every 60 s for 300 s. Add units to the headings in Table 6.1. [1] (c) (i) On the grid provided, plot a graph of temperature θ (vertical axis) against time t. The vertical axis starts from θ = 60. [3] 60 0 (ii) Draw the best-fit curve. [1] (d) Mark with a letter M on your graph to show where the rate of cooling is greatest. [1] (e) Calculate the average rate of cooling of the hot water during the whole investigation. Use the equation shown. total temperature decrease average rate of cooling = time taken average rate of cooling = ................................................ °C / s [1] (f) (i) State one safety precaution taken during the investigation. Explain your answer. safety precaution ............................................................................................................... explanation ........................................................................................................................ [1] (ii) Suggest one change that the student can make to the investigation to reduce the rate of cooling of the hot water. ........................................................................................................................................... ..................................................................................................................................... [1] [Total: 10]
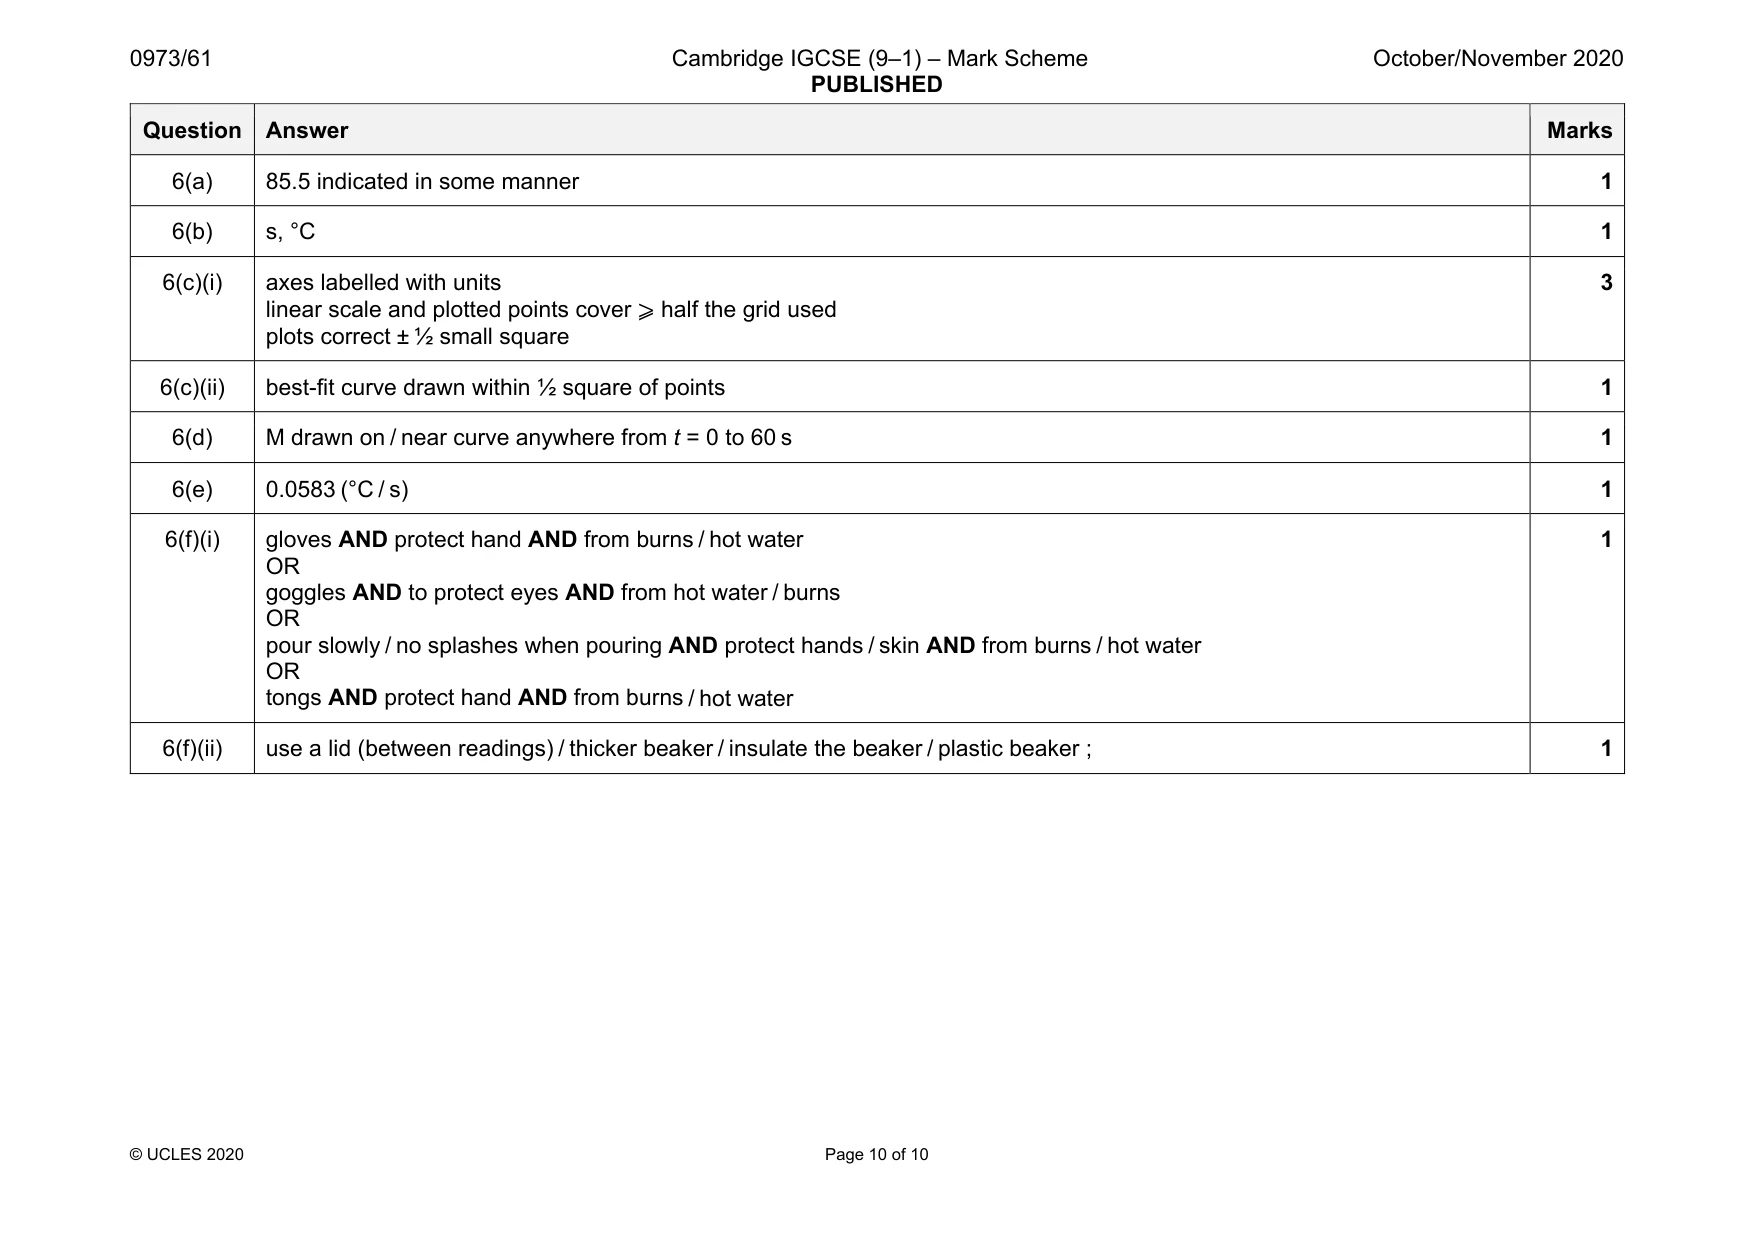
Mark scheme: 6(a) 85.5 indicated in some manner 1 6(b) s, °C 1 6(c)(i) axes labelled with units linear scale and plotted points cover ⩾ half the grid used plots correct ± ½ small square 3 6(c)(ii) best-fit curve drawn within ½ square of points 1 6(d) M drawn on / near curve anywhere from t = 0 to 60 s 1 6(e) 0.0583 (°C / s) 1 6(f)(i) gloves AND protect hand AND from burns / hot water OR goggles AND to protect eyes AND from hot water / burns OR pour slowly / no splashes when pouring AND protect hands / skin AND from burns / hot water OR tongs AND protect hand AND from burns / hot water 1 6(f)(ii) use a lid (between readings) / thicker beaker / insulate the beaker / plastic beaker ; 1
What was in this paper
The subtopics covered by these 6 questions, and how many questions each got. Open one in a new tab to see every Cambridge question on it.
What you needed in this session
Cambridge’s own grade thresholds for 2020 Oct/Nov, Paper 6 · Variant 1. A higher threshold means an easier paper — the bar moves with how the cohort did.