Cambridge IGCSE Sciences - Co-ordinated (9-1) 0973 — 2022 May/June Paper 6 · Variant 1
0973/61/M/J/22 · 6 questions · 60 marks · ≈68 min
The question paper and its mark scheme, free to read here and free to download. This is Cambridge’s own paper, exactly as it was sat.
Question paper20 pages


Mark scheme9 pages
Answers below. Sit the paper first if you are practising.
Questions as text
Question 1
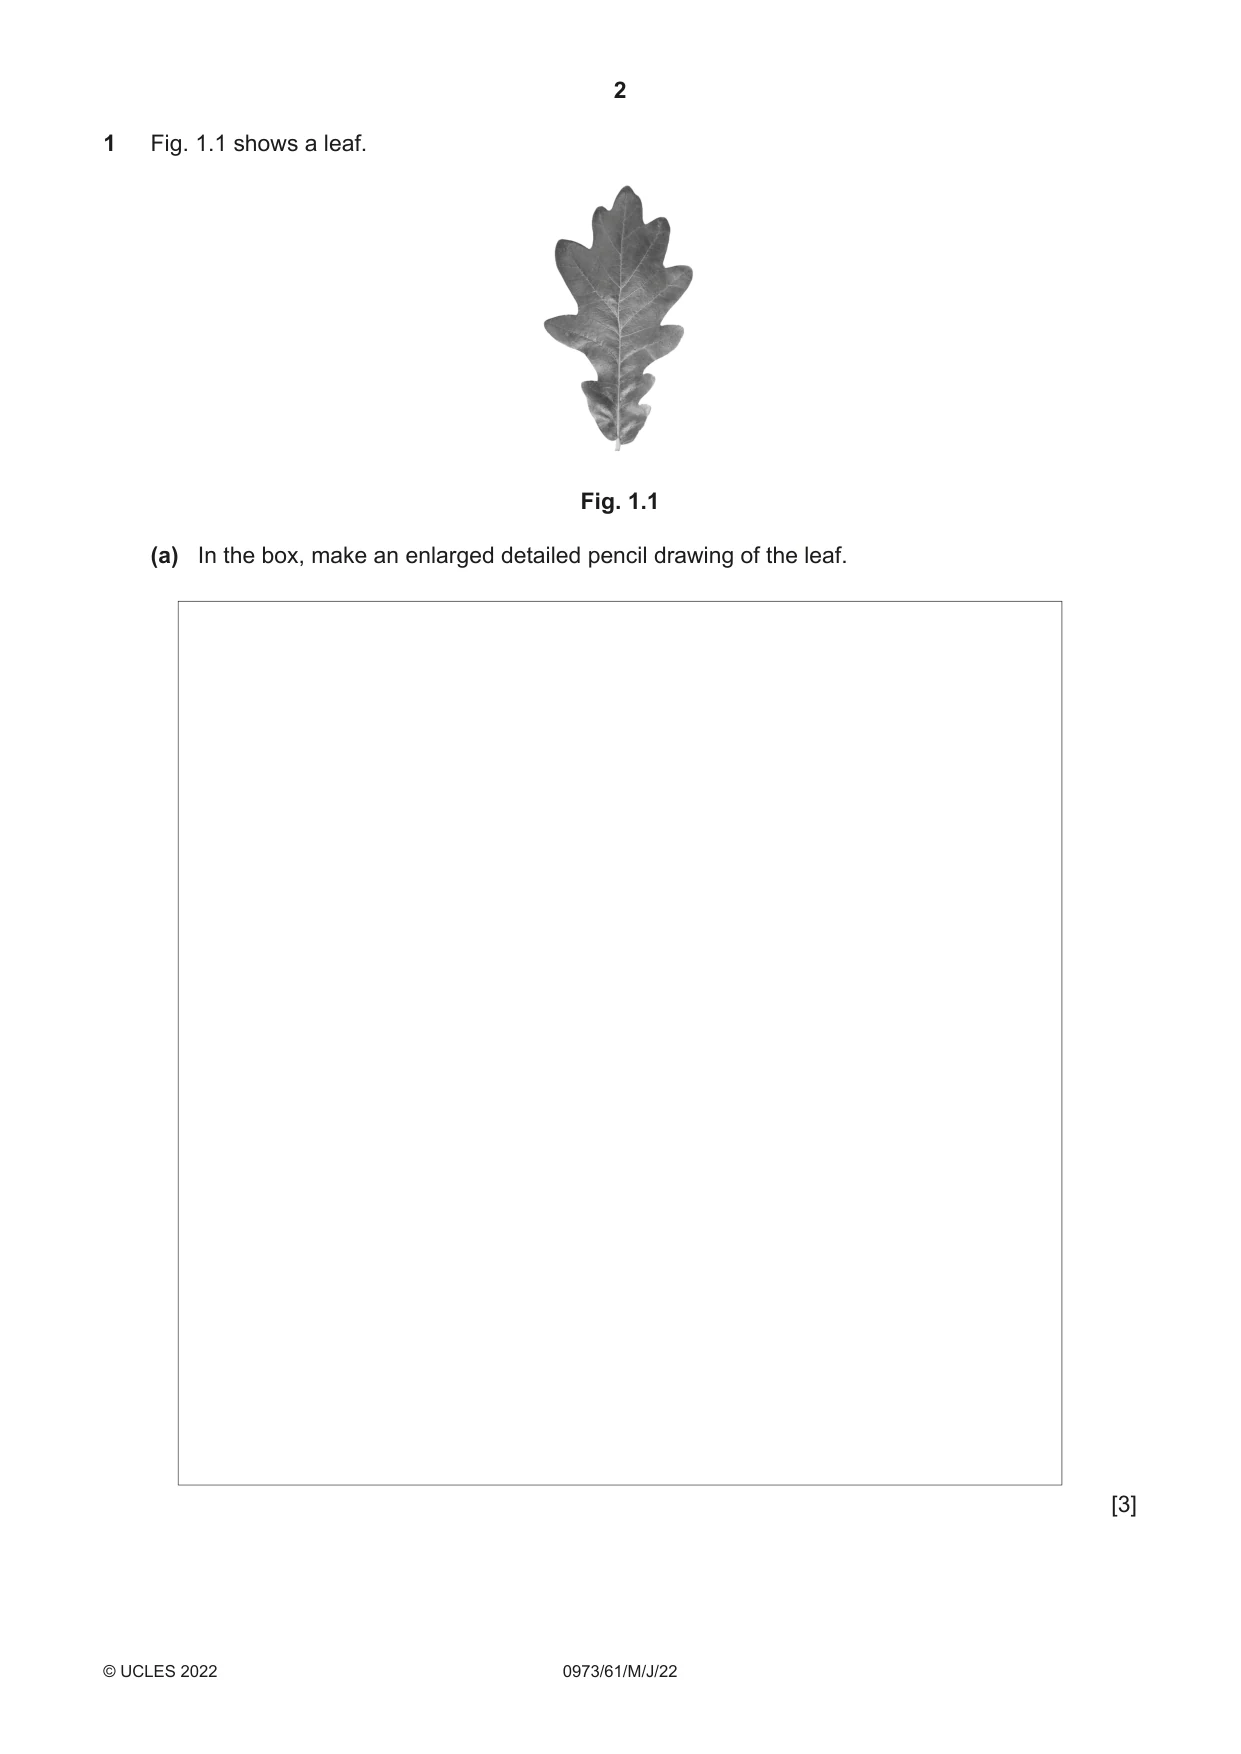
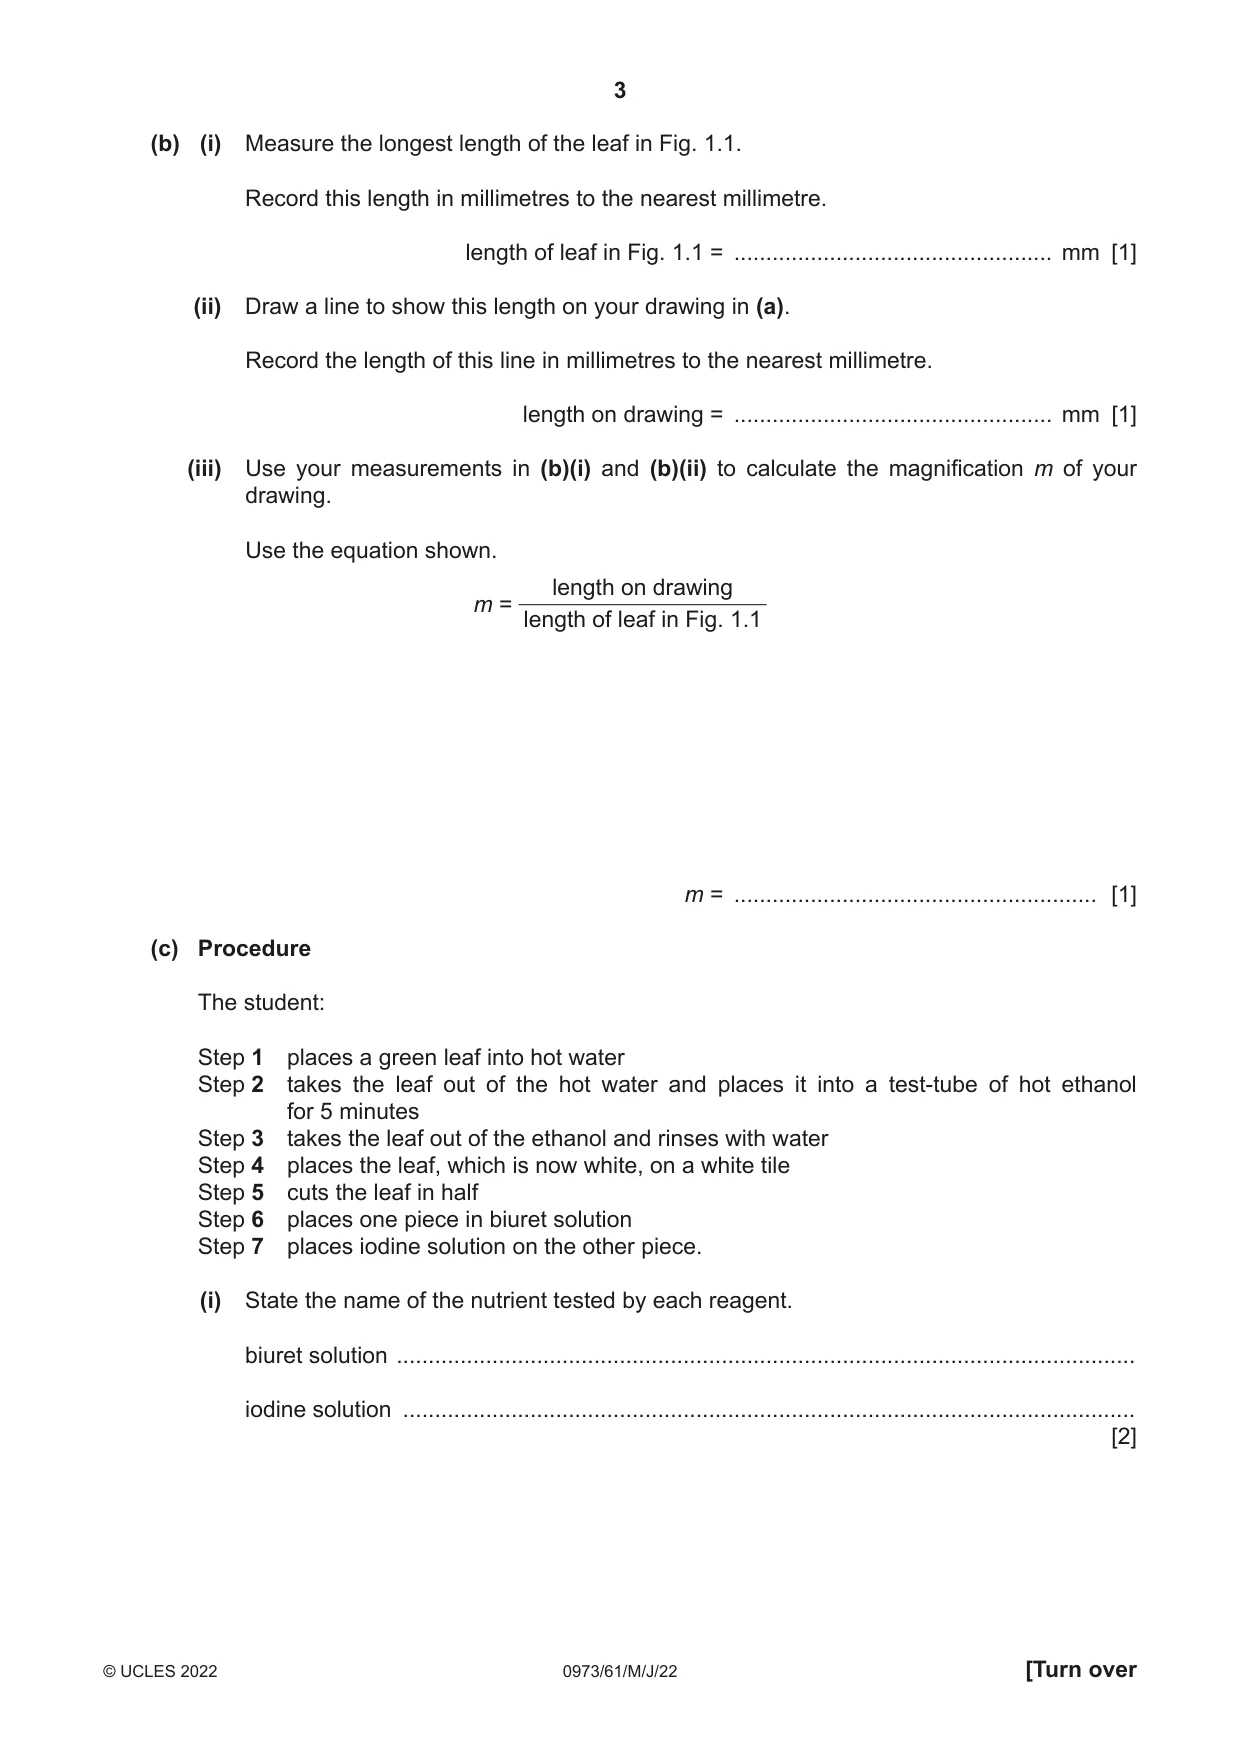
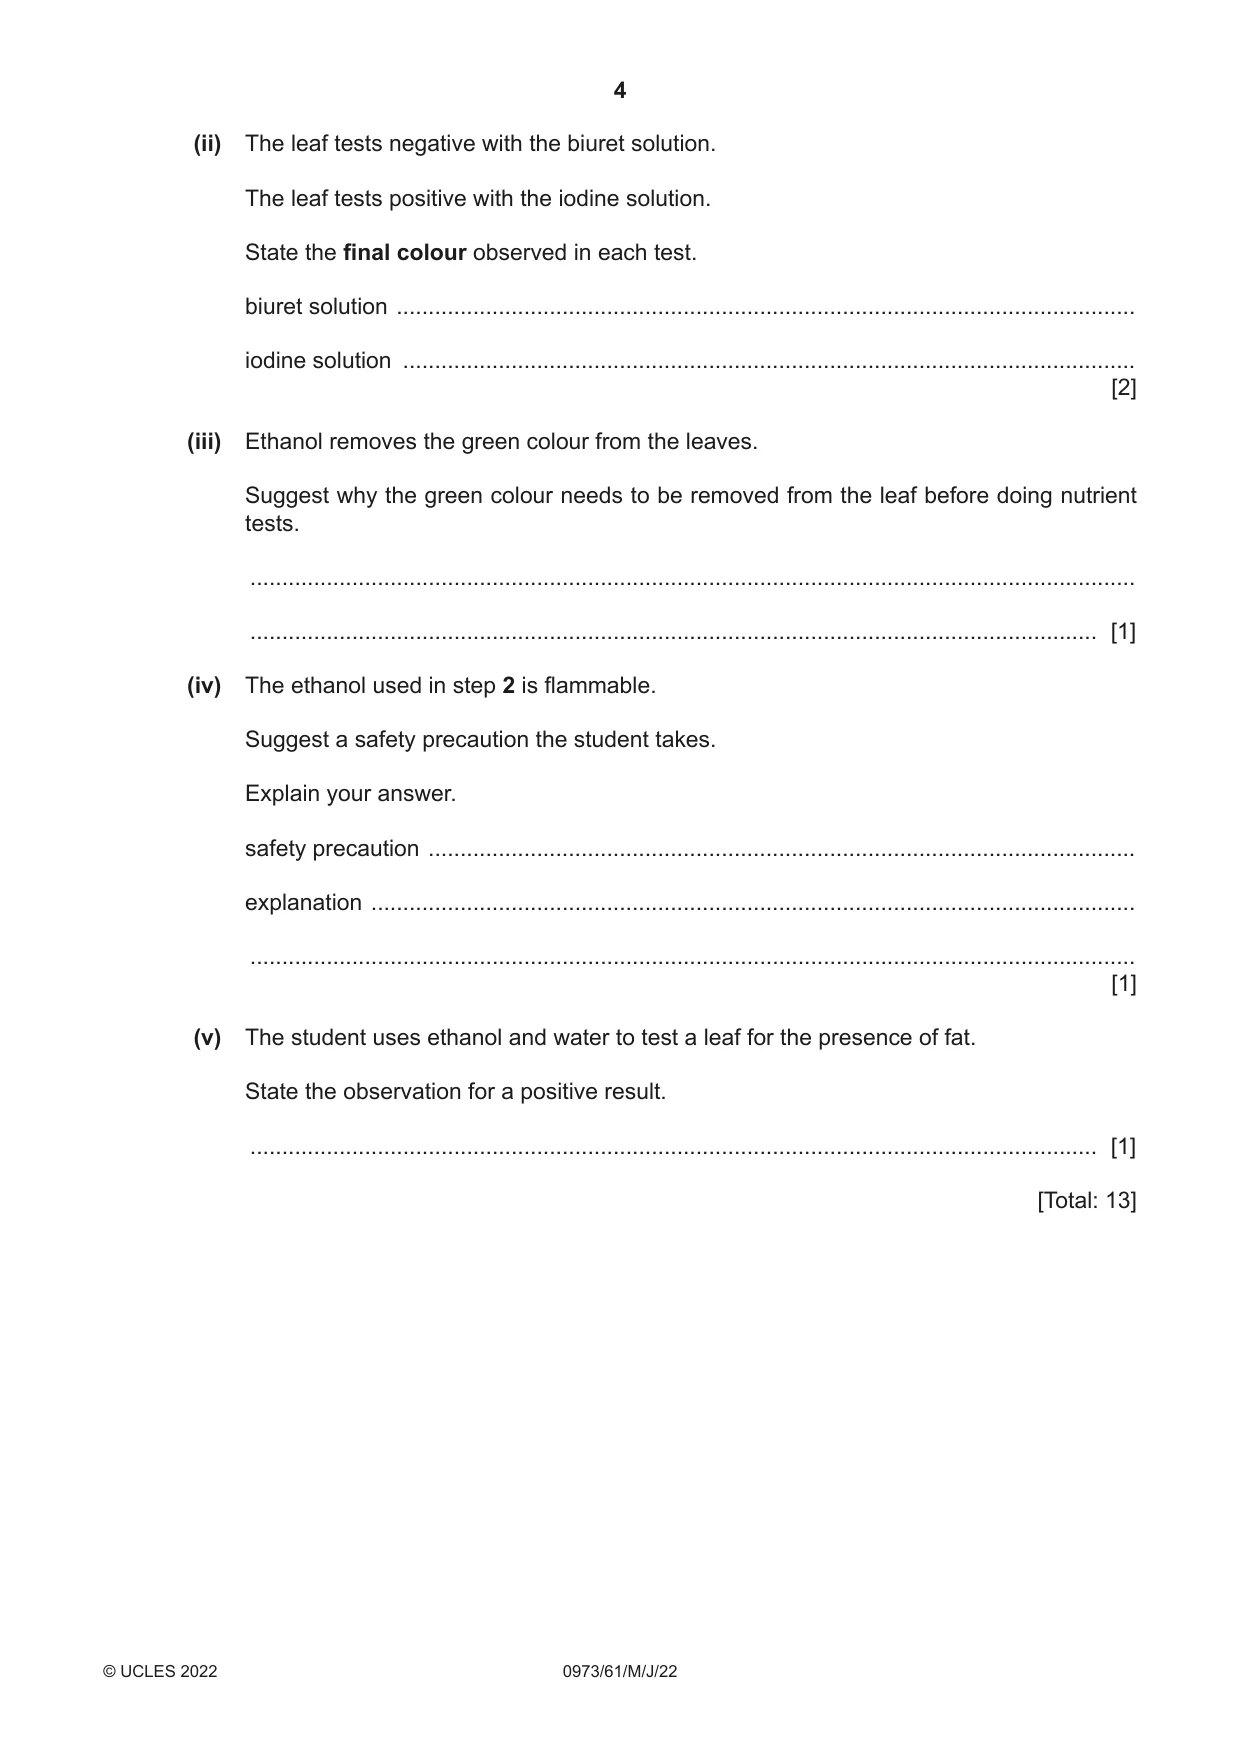
1 Fig. 1.1 shows a leaf. Fig. 1.1 (a) In the box, make an enlarged detailed pencil drawing of the leaf. [3] (b) (i) Measure the longest length of the leaf in Fig. 1.1. Record this length in millimetres to the nearest millimetre. length of leaf in Fig. 1.1 = .................................................. mm [1] (ii) Draw a line to show this length on your drawing in (a). Record the length of this line in millimetres to the nearest millimetre. length on drawing = .................................................. mm [1] (iii) Use your measurements in (b)(i) and (b)(ii) to calculate the magnification m of your drawing. Use the equation shown. length on drawing m = length of leaf in Fig. 1.1 m = ......................................................... [1] (c) Procedure The student: Step 1 places a green leaf into hot water Step 2 takes the leaf out of the hot water and places it into a test-tube of hot ethanol for 5 minutes Step 3 takes the leaf out of the ethanol and rinses with water Step 4 places the leaf, which is now white, on a white tile Step 5 cuts the leaf in half Step 6 places one piece in biuret solution Step 7 places iodine solution on the other piece. (i) State the name of the nutrient tested by each reagent. biuret solution .................................................................................................................... iodine solution ................................................................................................................... [2] (ii) The leaf tests negative with the biuret solution. The leaf tests positive with the iodine solution. State the final colour observed in each test. biuret solution .................................................................................................................... iodine solution ................................................................................................................... [2] (iii) Ethanol removes the green colour from the leaves. Suggest why the green colour needs to be removed from the leaf before doing nutrient tests. ........................................................................................................................................... ..................................................................................................................................... [1] (iv) The ethanol used in step 2 is flammable. Suggest a safety precaution the student takes. Explain your answer. safety precaution ............................................................................................................... explanation ........................................................................................................................ ........................................................................................................................................... [1] (v) The student uses ethanol and water to test a leaf for the presence of fat. State the observation for a positive result. ..................................................................................................................................... [1] [Total: 13]
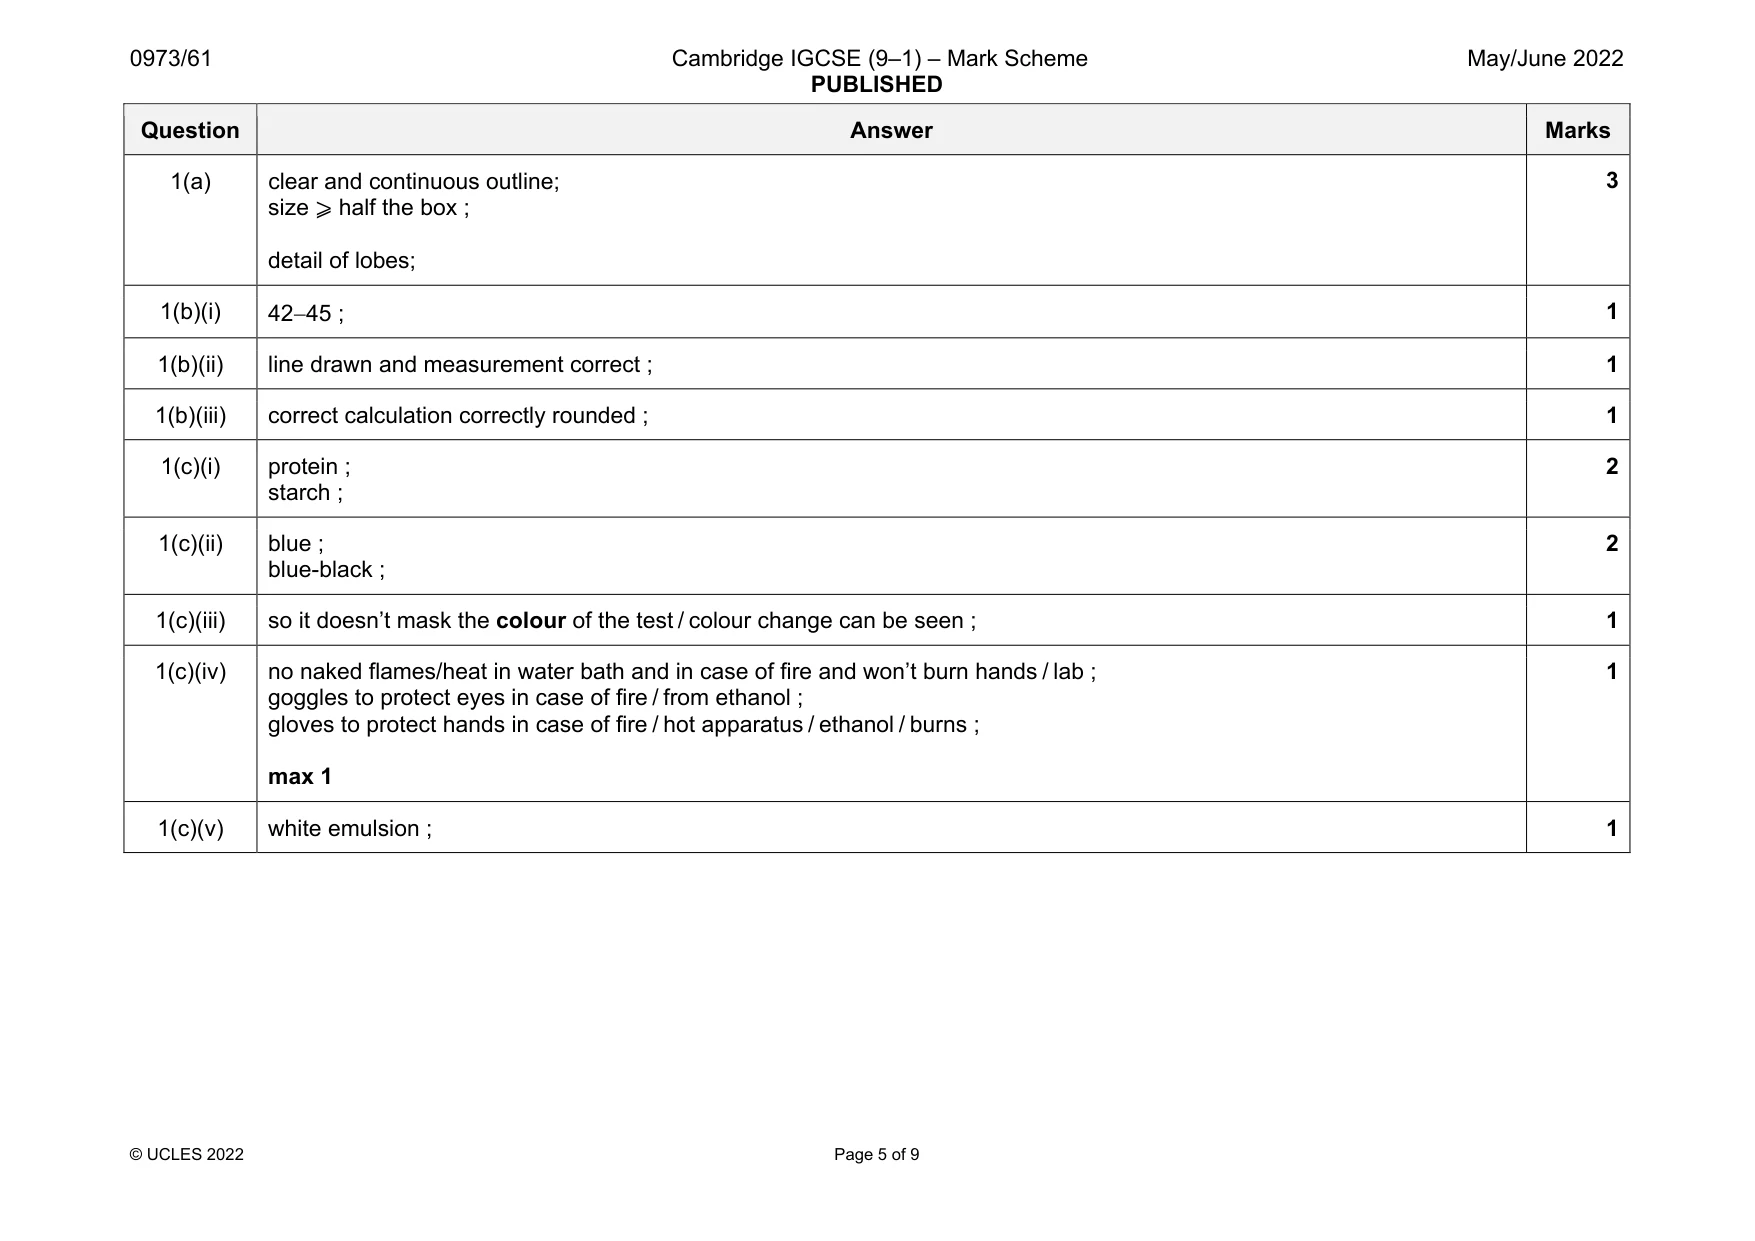
Mark scheme: 1(a) clear and continuous outline; size ⩾ half the box ; detail of lobes; 1(b)(i) 4245 ; 1 1(b)(ii) line drawn and measurement correct ; 1 1(b)(iii) correct calculation correctly rounded ; 1 1(c)(i) protein ; starch ; 2 1(c)(ii) blue ; blue-black ; 2 1(c)(iii) so it doesn’t mask the colour of the test / colour change can be seen ; 1 1(c)(iv) no naked flames/heat in water bath and in case of fire and won’t burn hands / lab ; goggles to protect eyes in case of fire / from ethanol ; gloves to protect hands in case of fire / hot apparatus / ethanol / burns ; max 1 1 1(c)(v) white emulsion ; 1
Q2 · Water from the soil enters a plant through its roots, travels up the plant in xylem…
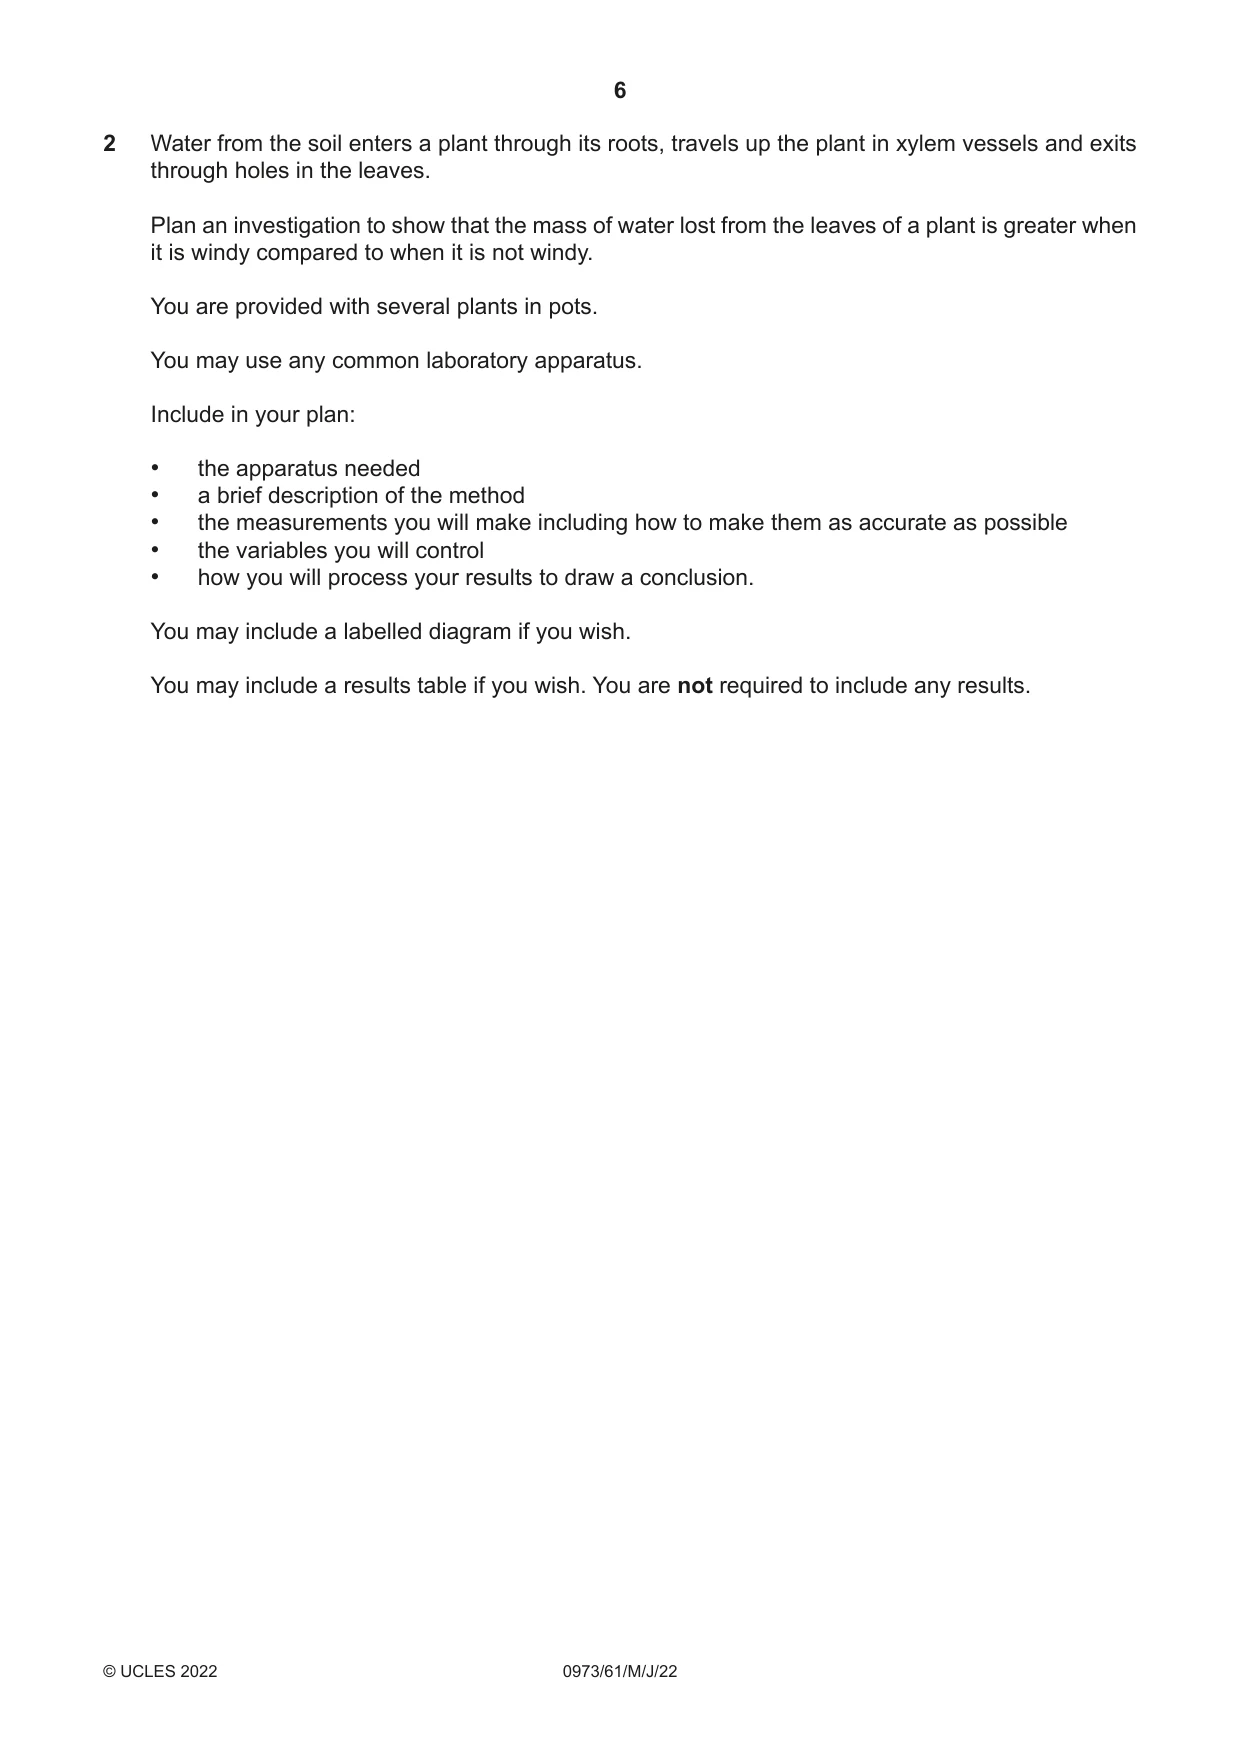
2 Water from the soil enters a plant through its roots, travels up the plant in xylem vessels and exits through holes in the leaves. Plan an investigation to show that the mass of water lost from the leaves of a plant is greater when it is windy compared to when it is not windy. You are provided with several plants in pots. You may use any common laboratory apparatus. Include in your plan: • the apparatus needed • a brief description of the method • the measurements you will make including how to make them as accurate as possible • the variables you will control • how you will process your results to draw a conclusion. You may include a labelled diagram if you wish. You may include a results table if you wish. You are not required to include any results. .......................................................................................................................................................... .......................................................................................................................................................... .......................................................................................................................................................... .......................................................................................................................................................... .......................................................................................................................................................... .......................................................................................................................................................... .......................................................................................................................................................... .......................................................................................................................................................... .......................................................................................................................................................... .......................................................................................................................................................... .......................................................................................................................................................... .......................................................................................................................................................... .......................................................................................................................................................... .......................................................................................................................................................... .......................................................................................................................................................... .......................................................................................................................................................... .......................................................................................................................................................... .......................................................................................................................................................... .......................................................................................................................................................... .......................................................................................................................................................... .................................................................................................................................................... [7]
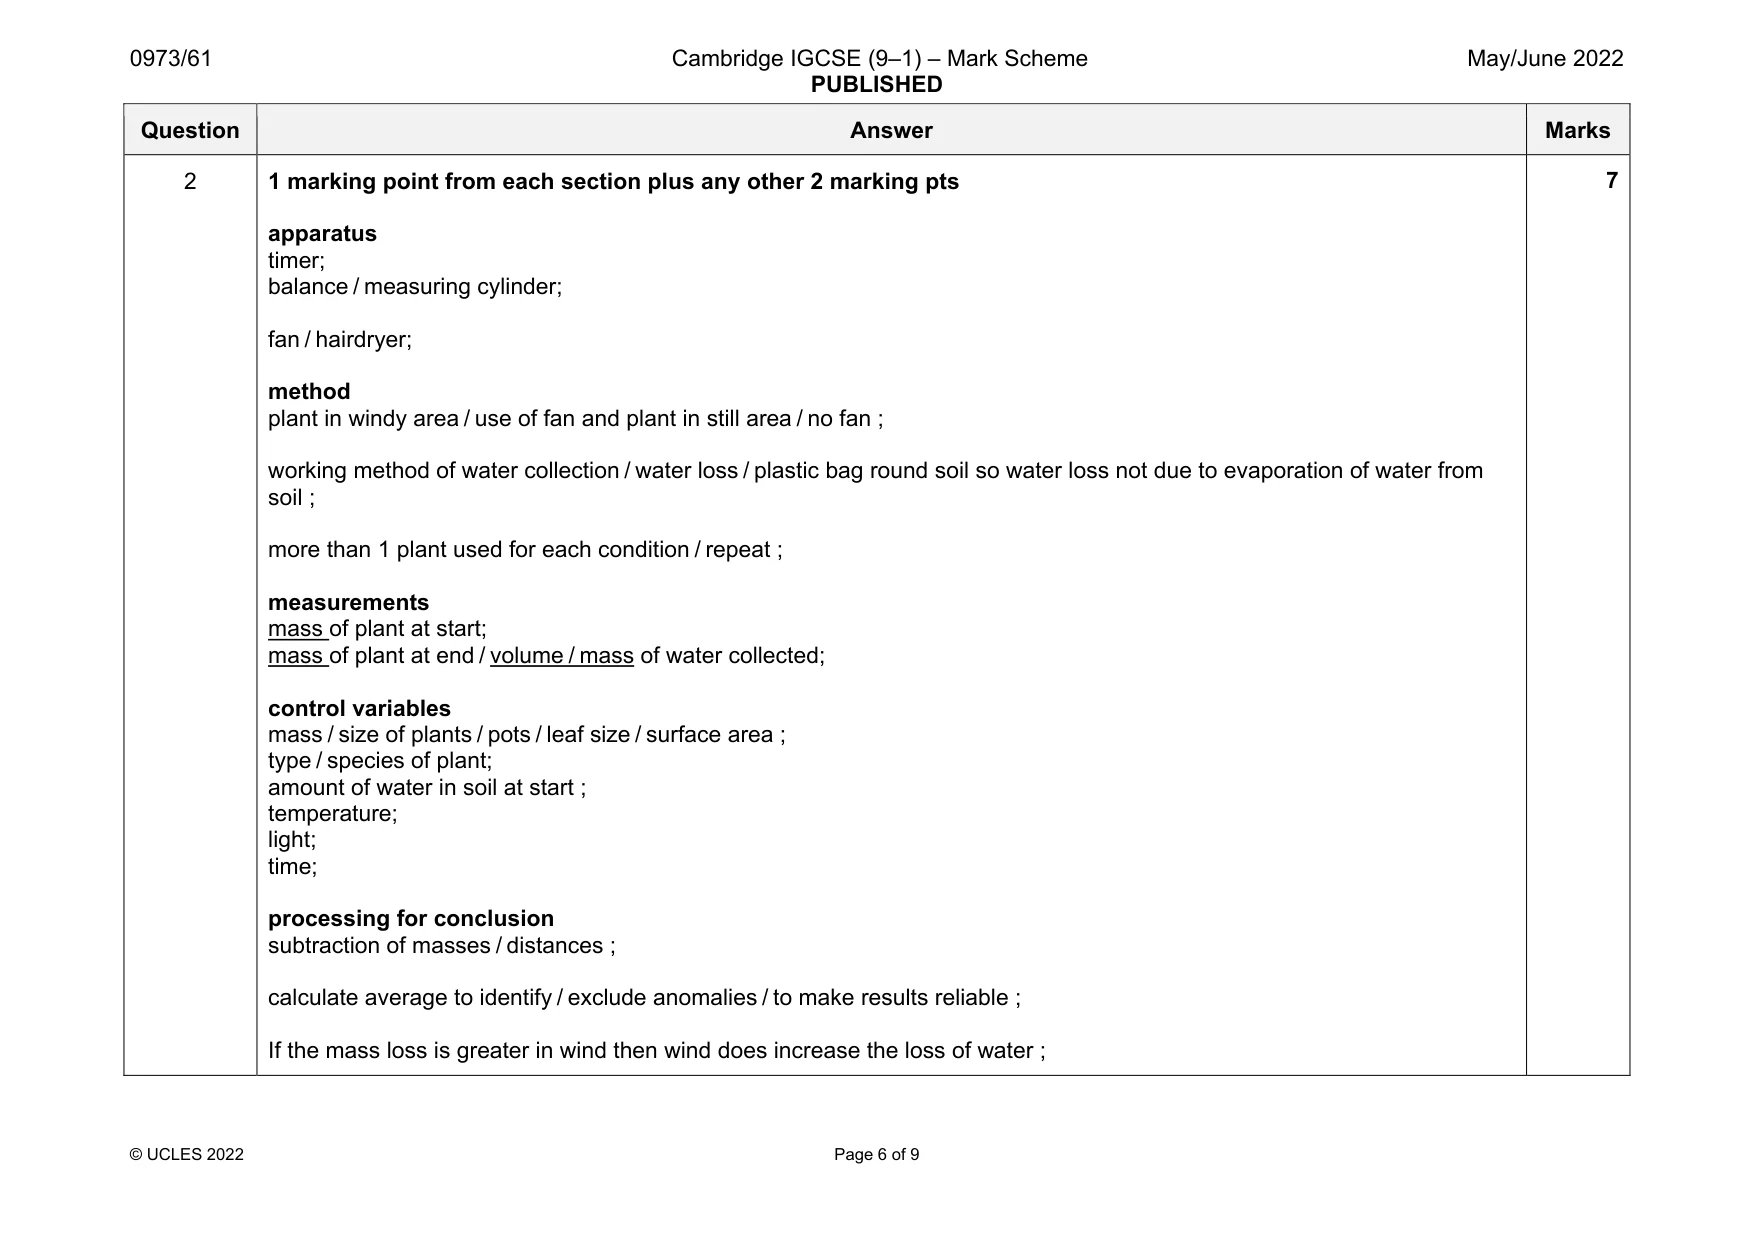
Mark scheme: 2 1 marking point from each section plus any other 2 marking pts apparatus timer; balance / measuring cylinder; fan / hairdryer; method plant in windy area / use of fan and plant in still area / no fan ; working method of water collection / water loss / plastic bag round soil so water loss not due to evaporation of water from soil ; more than 1 plant used for each condition / repeat ; measurements mass of plant at start; mass of plant at end / volume / mass of water collected; control variables mass / size of plants / pots / leaf size / surface area ; type / species of plant; amount of water in soil at start ; temperature; light; time; processing for conclusion subtraction of masses / distances ; calculate average to identify / exclude anomalies / to make results reliable ; If the mass loss is greater in wind then wind does increase the loss of water ;
Q3 · A student does an experiment to find the value of x in the formula of blue copper sulfate…
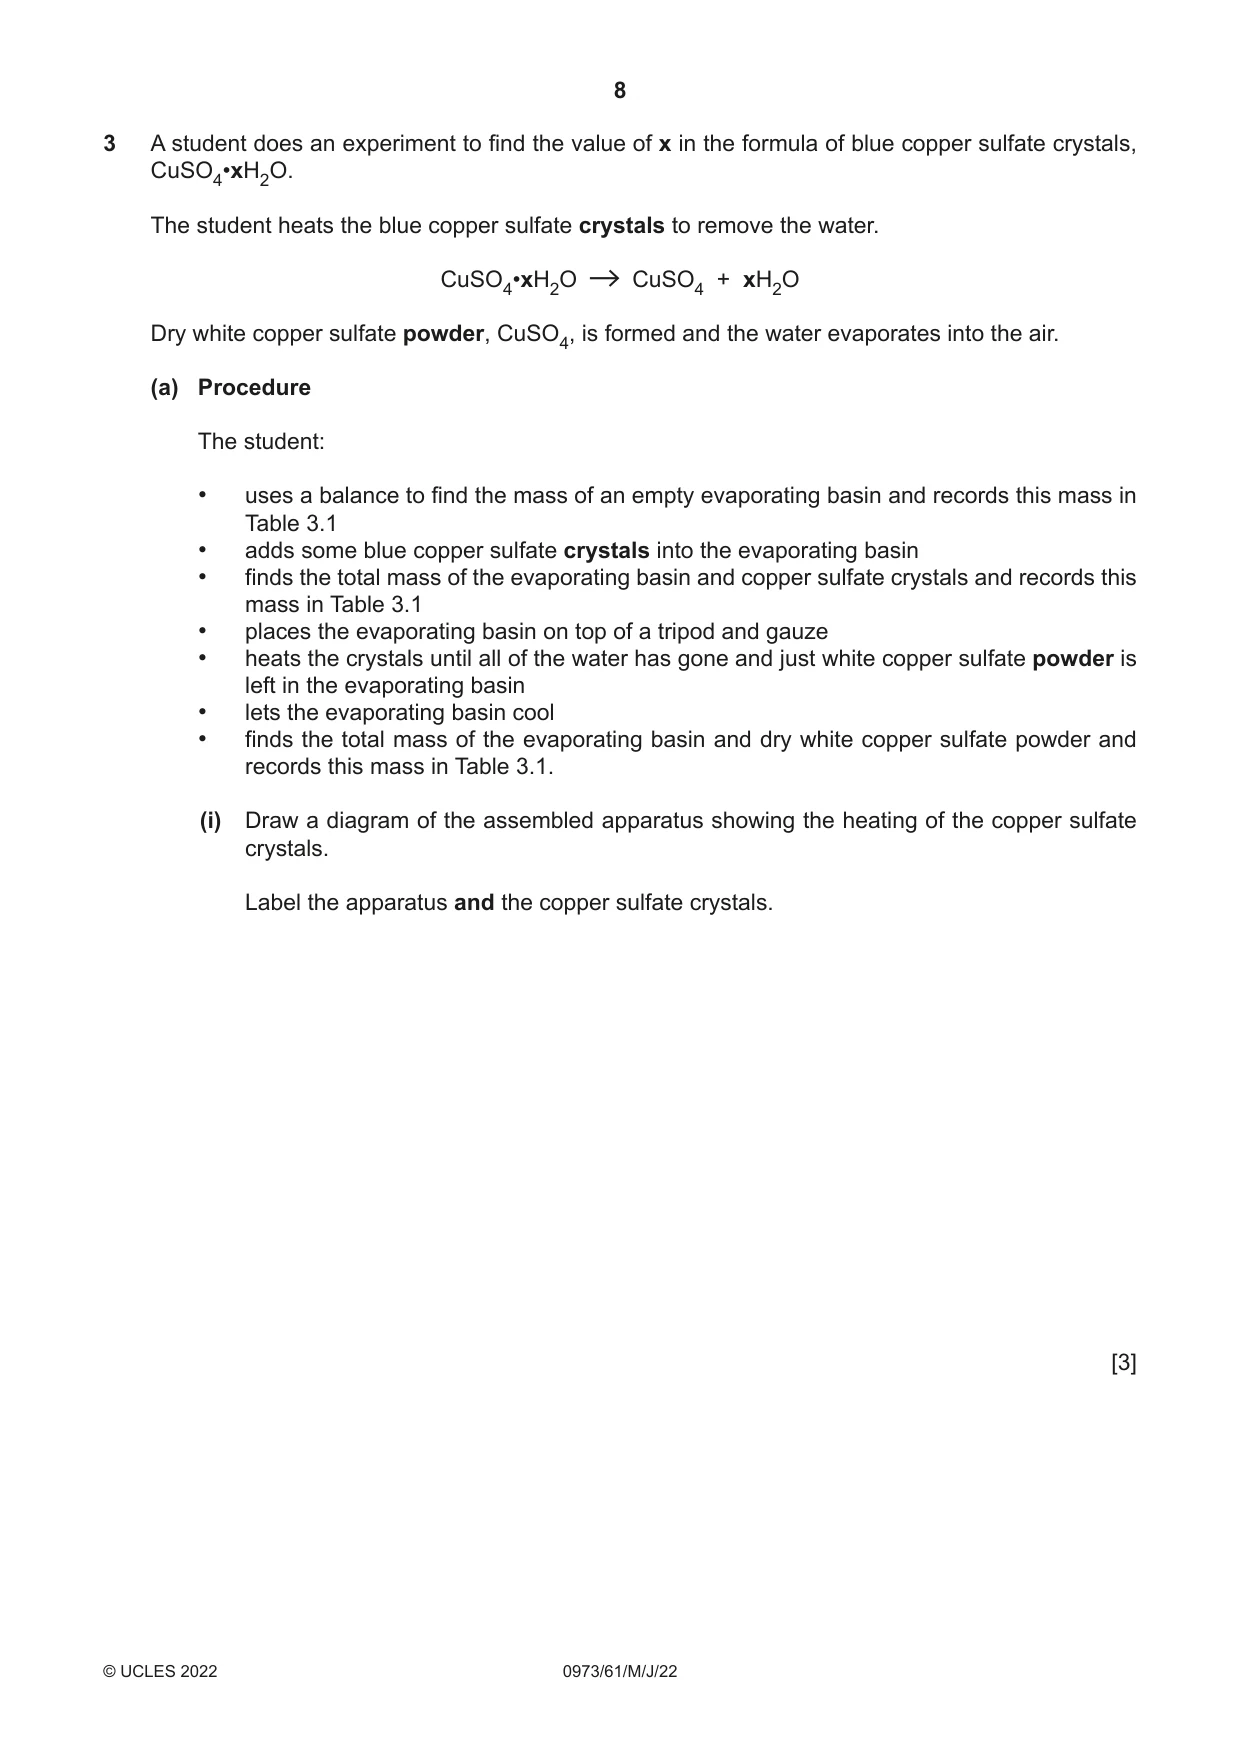
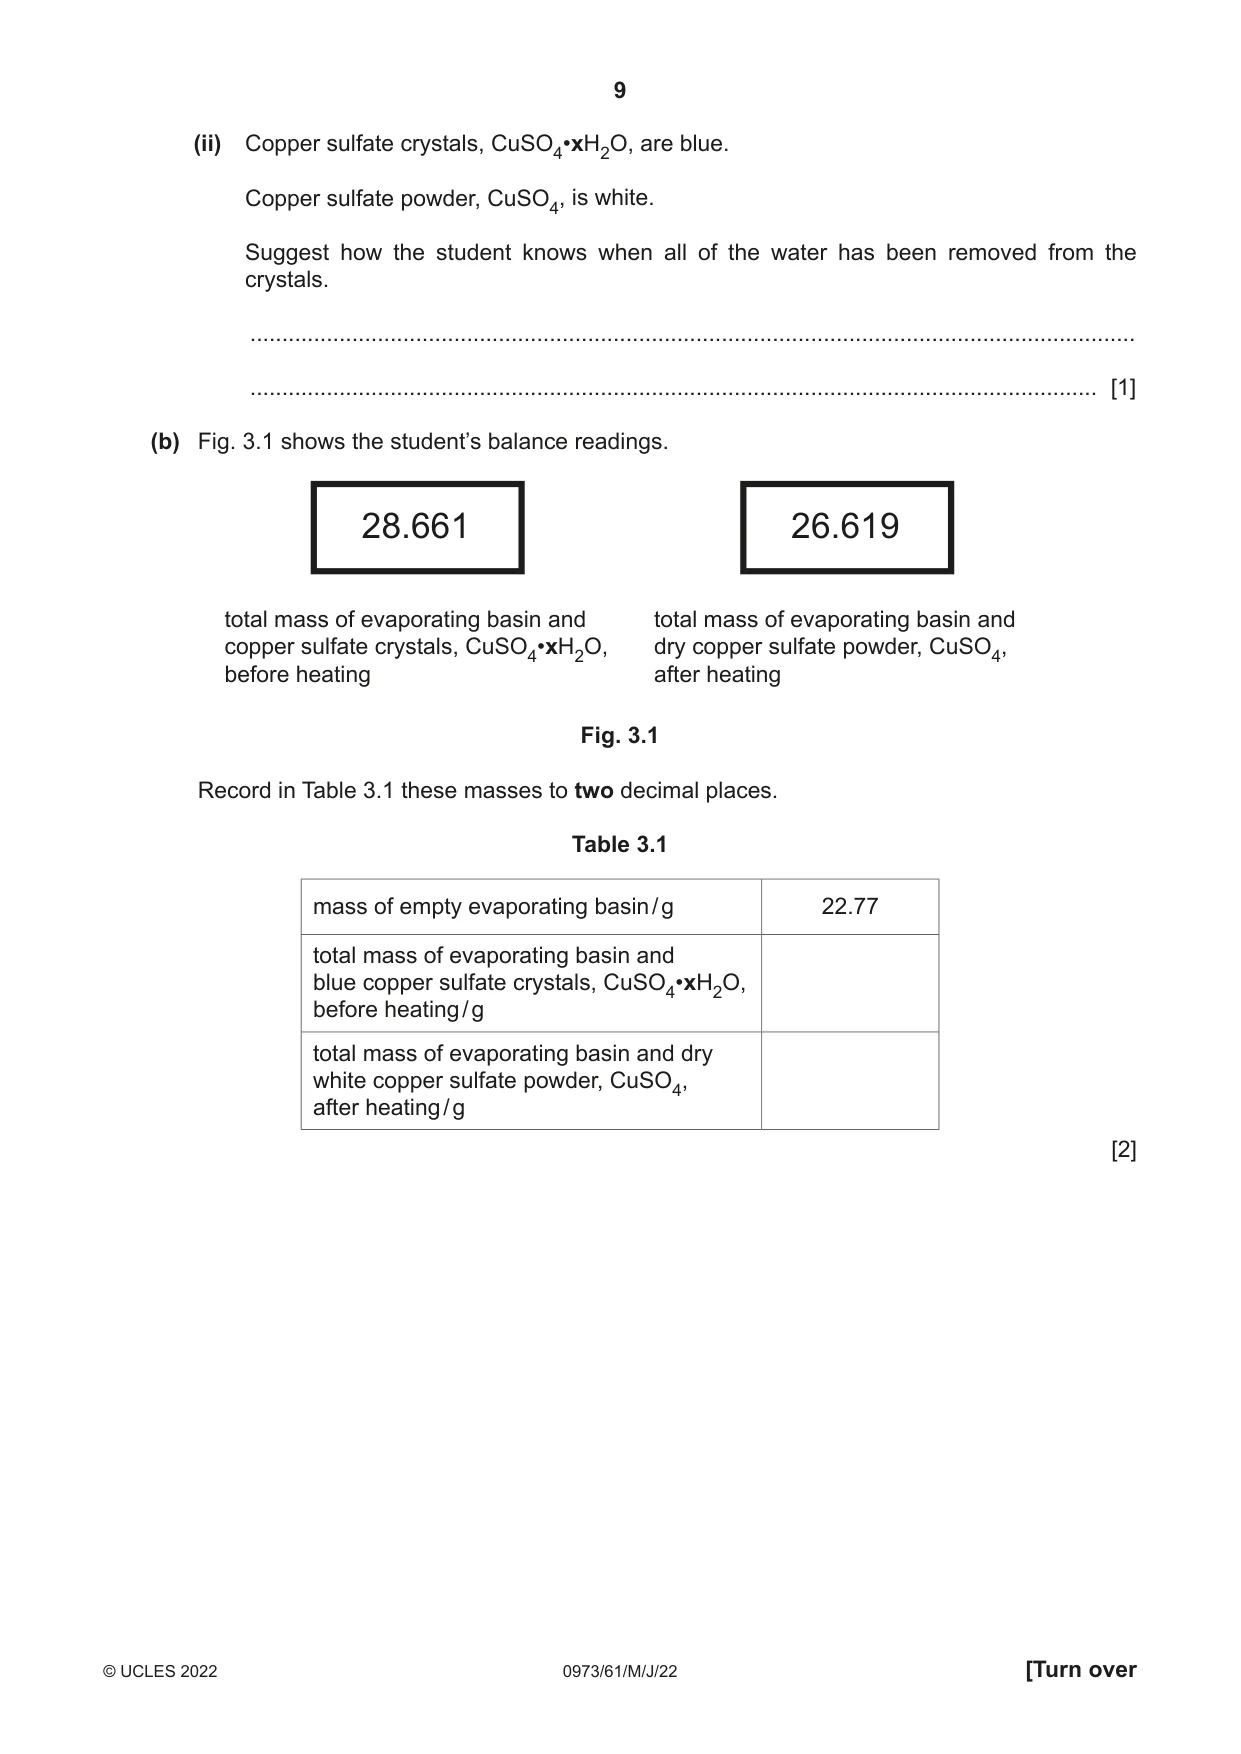
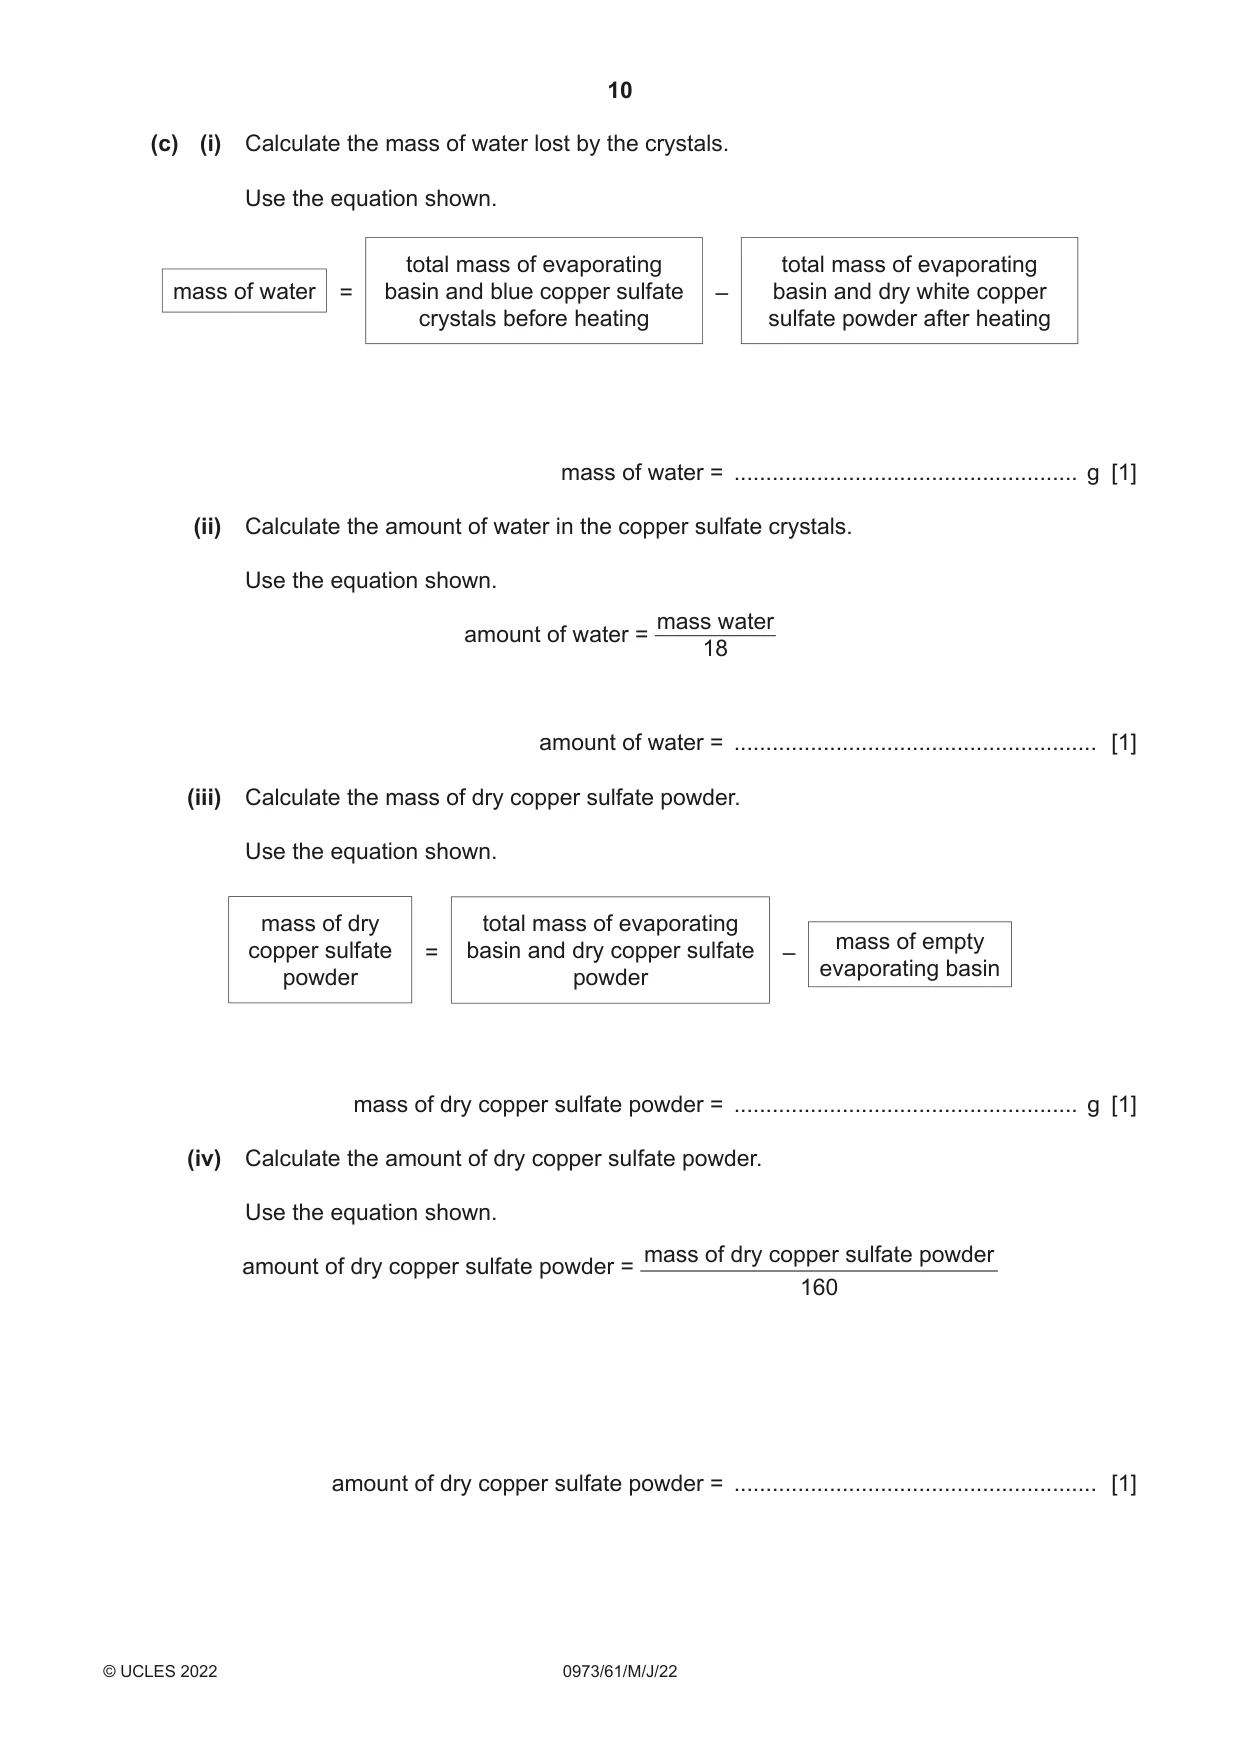
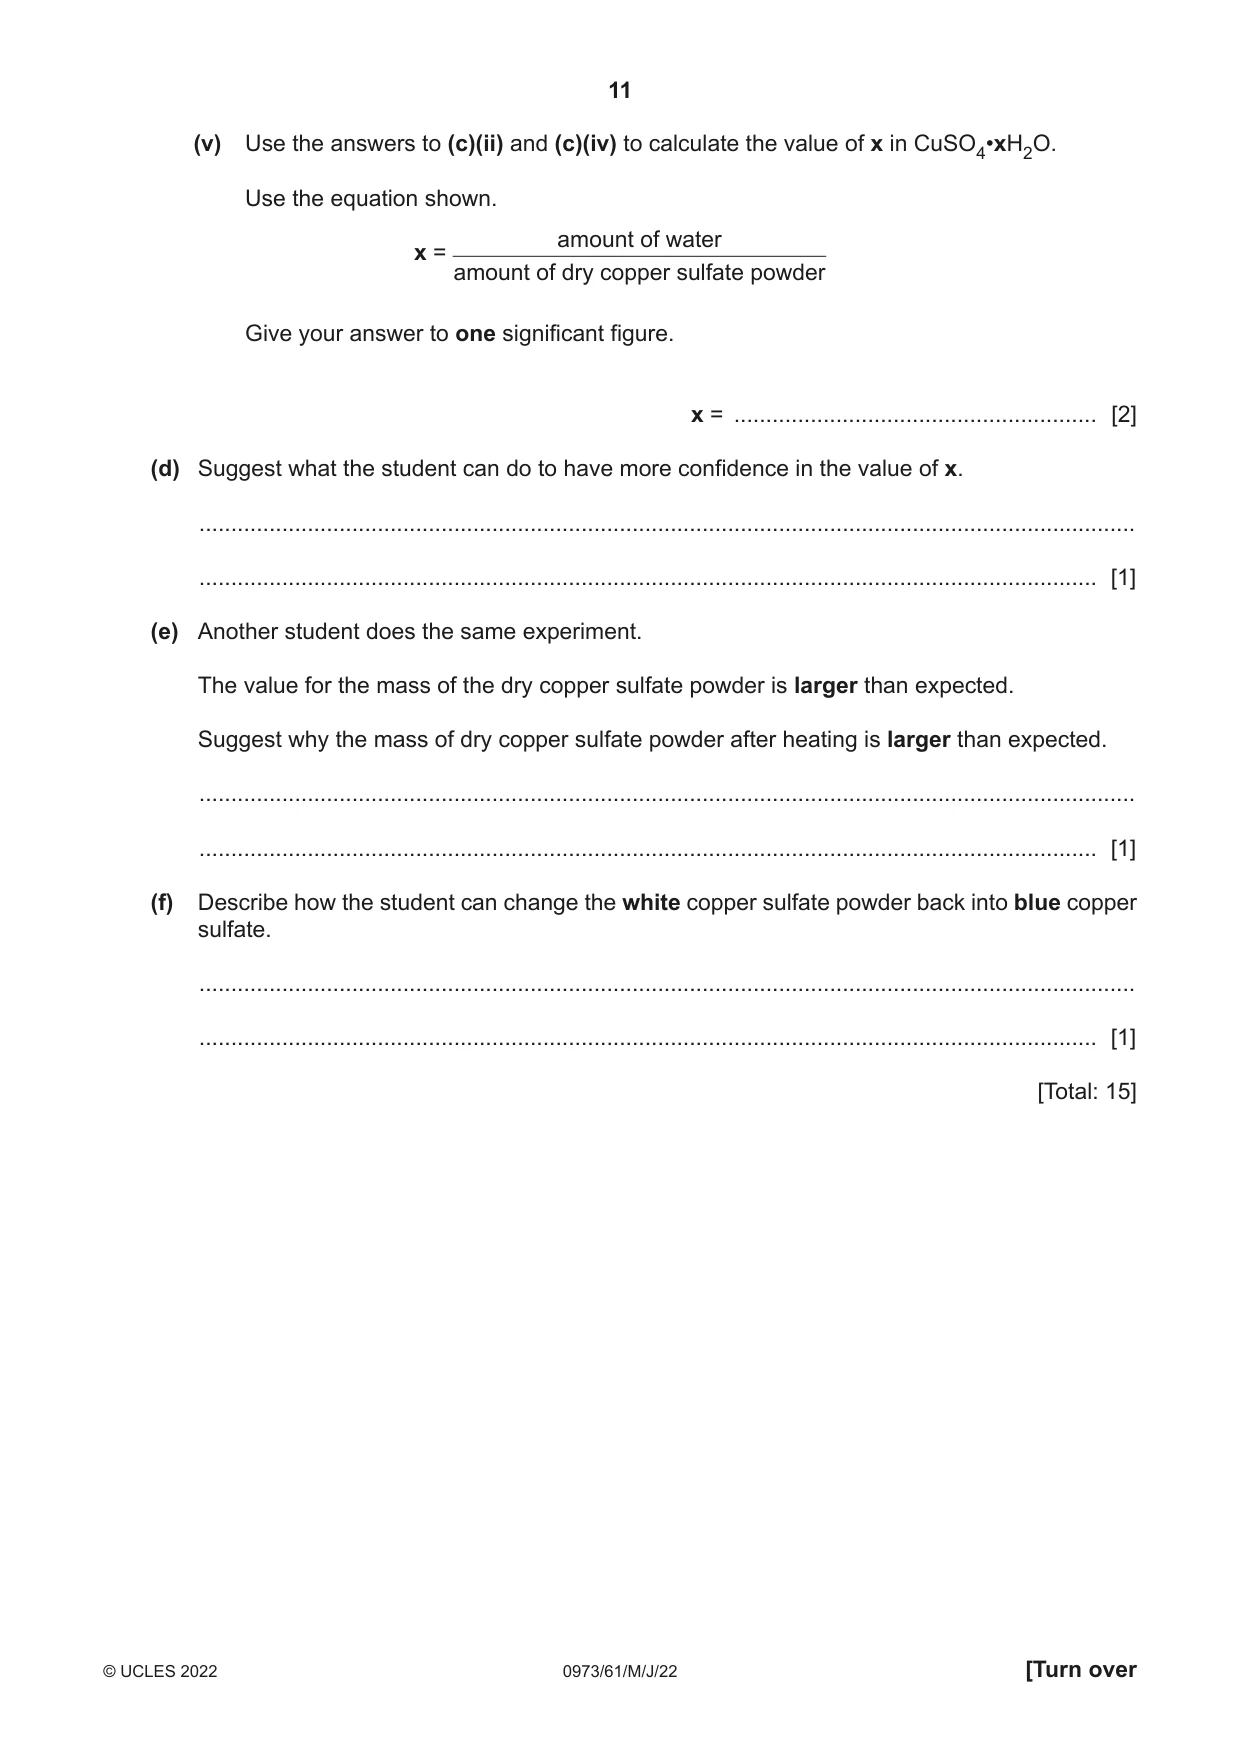
3 A student does an experiment to find the value of x in the formula of blue copper sulfate crystals, CuSO4•xH2O. The student heats the blue copper sulfate crystals to remove the water. CuSO4•xH2O CuSO4 + xH2O Dry white copper sulfate powder, CuSO4, is formed and the water evaporates into the air. (a) Procedure The student: • uses a balance to find the mass of an empty evaporating basin and records this mass in Table 3.1 • adds some blue copper sulfate crystals into the evaporating basin • finds the total mass of the evaporating basin and copper sulfate crystals and records this mass in Table 3.1 • places the evaporating basin on top of a tripod and gauze • heats the crystals until all of the water has gone and just white copper sulfate powder is left in the evaporating basin • lets the evaporating basin cool • finds the total mass of the evaporating basin and dry white copper sulfate powder and records this mass in Table 3.1. (i) Draw a diagram of the assembled apparatus showing the heating of the copper sulfate crystals. Label the apparatus and the copper sulfate crystals. [3] (ii) Copper sulfate crystals, CuSO4•xH2O, are blue. Copper sulfate powder, CuSO4, is white. Suggest how the student knows when all of the water has been removed from the crystals. ........................................................................................................................................... ..................................................................................................................................... [1] (b) Fig. 3.1 shows the student’s balance readings. 28.661 26.619 total mass of evaporating basin and total mass of evaporating basin and copper sulfate crystals, CuSO4•xH2O, dry copper sulfate powder, CuSO4, before heating after heating Fig. 3.1 Record in Table 3.1 these masses to two decimal places. Table 3.1 mass of empty evaporating basin / g 22.77 total mass of evaporating basin and blue copper sulfate crystals, CuSO4•xH2O, before heating / g total mass of evaporating basin and dry white copper sulfate powder, CuSO4, after heating / g [2] (c) (i) Calculate the mass of water lost by the crystals. Use the equation shown. total mass of evaporating total mass of evaporating mass of water = basin and blue copper sulfate – basin and dry white copper crystals before heating sulfate powder after heating mass of water = ...................................................... g [1] (ii) Calculate the amount of water in the copper sulfate crystals. Use the equation shown. mass water amount of water = 18 amount of water = ......................................................... [1] (iii) Calculate the mass of dry copper sulfate powder. Use the equation shown. mass of dry total mass of evaporating mass of empty copper sulfate = basin and dry copper sulfate – evaporating basin powder powder mass of dry copper sulfate powder = ...................................................... g [1] (iv) Calculate the amount of dry copper sulfate powder. Use the equation shown. mass of dry copper sulfate powder amount of dry copper sulfate powder = 160 amount of dry copper sulfate powder = ......................................................... [1] (v) Use the answers to (c)(ii) and (c)(iv) to calculate the value of x in CuSO4•xH2O. Use the equation shown. amount of water x = amount of dry copper sulfate powder Give your answer to one significant figure. x = ......................................................... [2] (d) Suggest what the student can do to have more confidence in the value of x. ................................................................................................................................................... ............................................................................................................................................. [1] (e) Another student does the same experiment. The value for the mass of the dry copper sulfate powder is larger than expected. Suggest why the mass of dry copper sulfate powder after heating is larger than expected. ................................................................................................................................................... ............................................................................................................................................. [1] (f) Describe how the student can change the white copper sulfate powder back into blue copper sulfate. ................................................................................................................................................... ............................................................................................................................................. [1] [Total: 15]
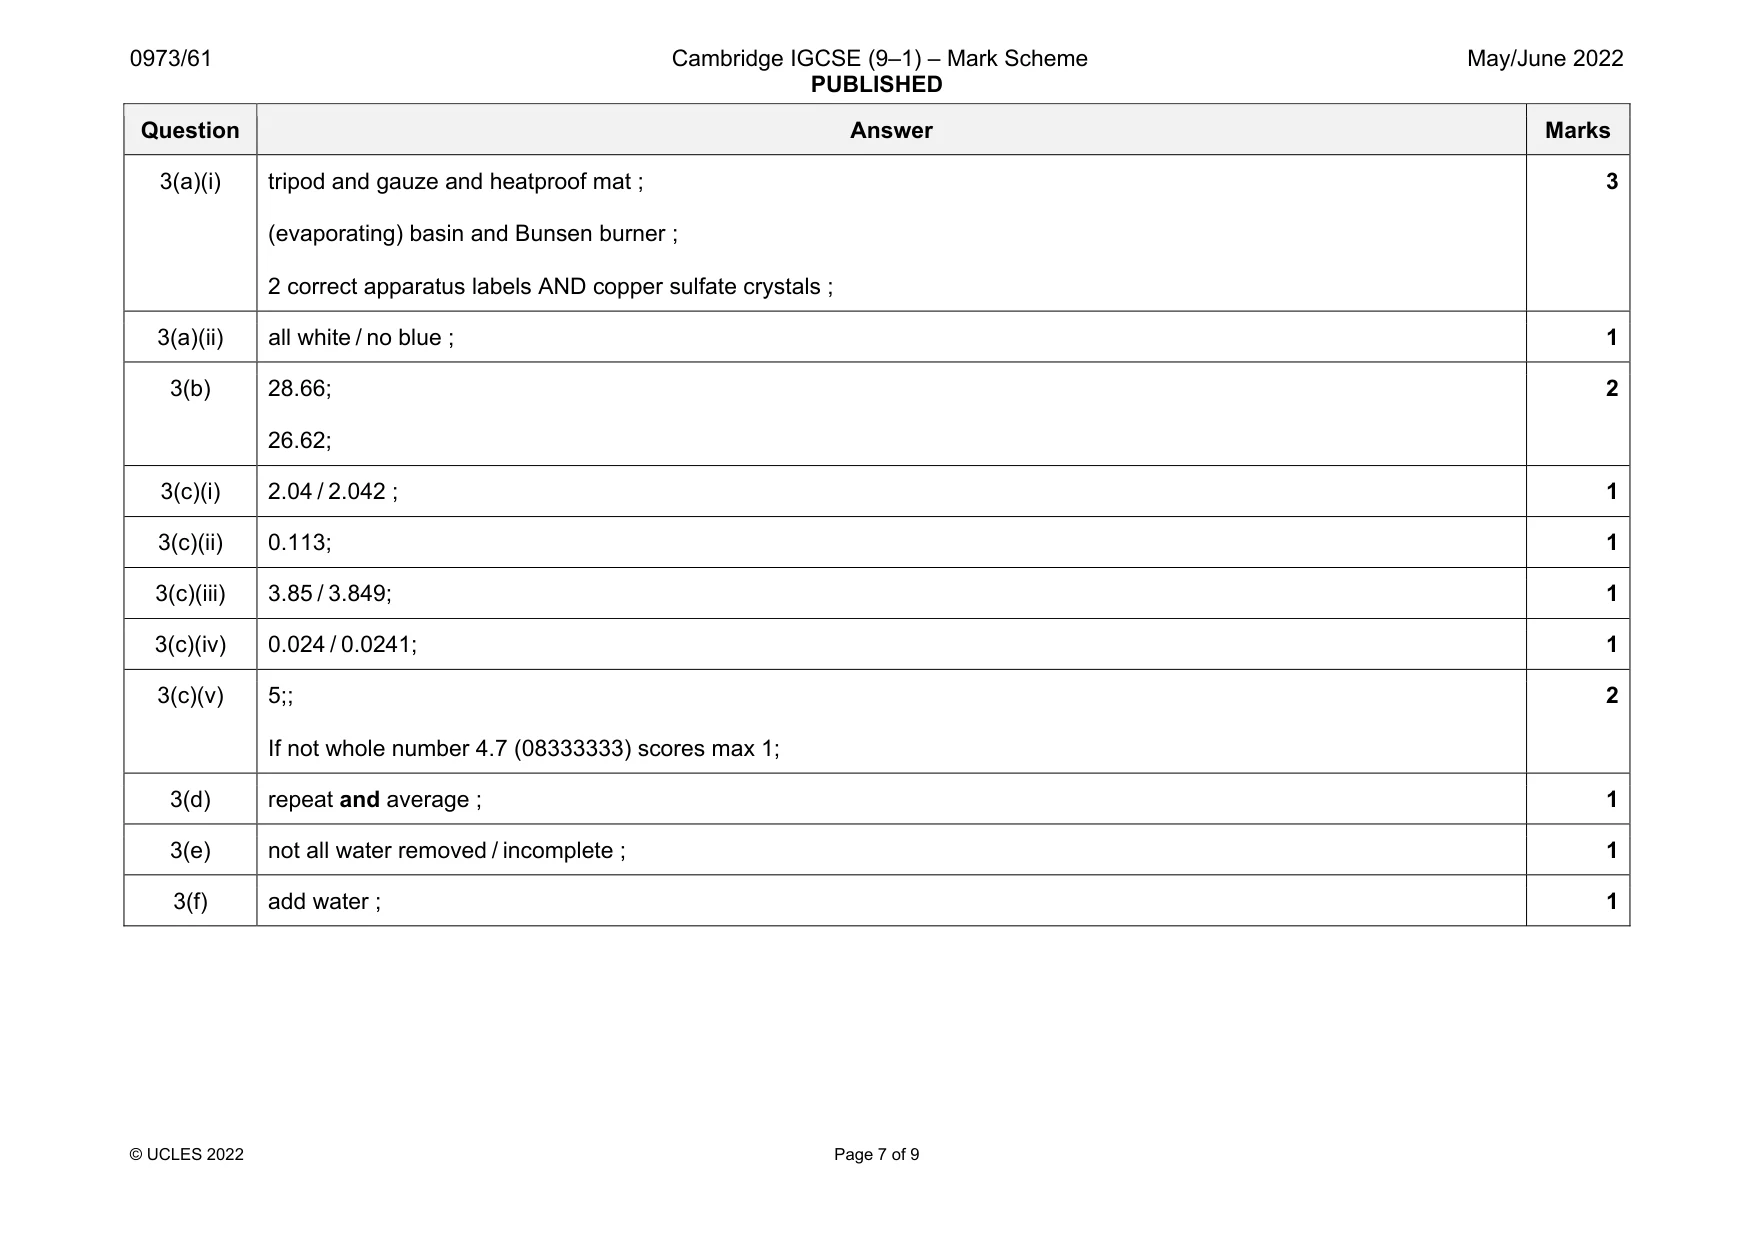
Mark scheme: 3(a)(i) tripod and gauze and heatproof mat ; (evaporating) basin and Bunsen burner ; 2 correct apparatus labels AND copper sulfate crystals ; 3 3(a)(ii) all white / no blue ; 1 3(b) 28.66; 26.62; 2 3(c)(i) 2.04 / 2.042 ; 1 3(c)(ii) 0.113; 1 3(c)(iii) 3.85 / 3.849; 1 3(c)(iv) 0.024 / 0.0241; 1 3(c)(v) 5;; If not whole number 4.7 (08333333) scores max 1; 2 3(d) repeat and average ; 1 3(e) not all water removed / incomplete ; 1 3(f) add water ; 1
Q4 · A student does some tests on solutions R, S and T
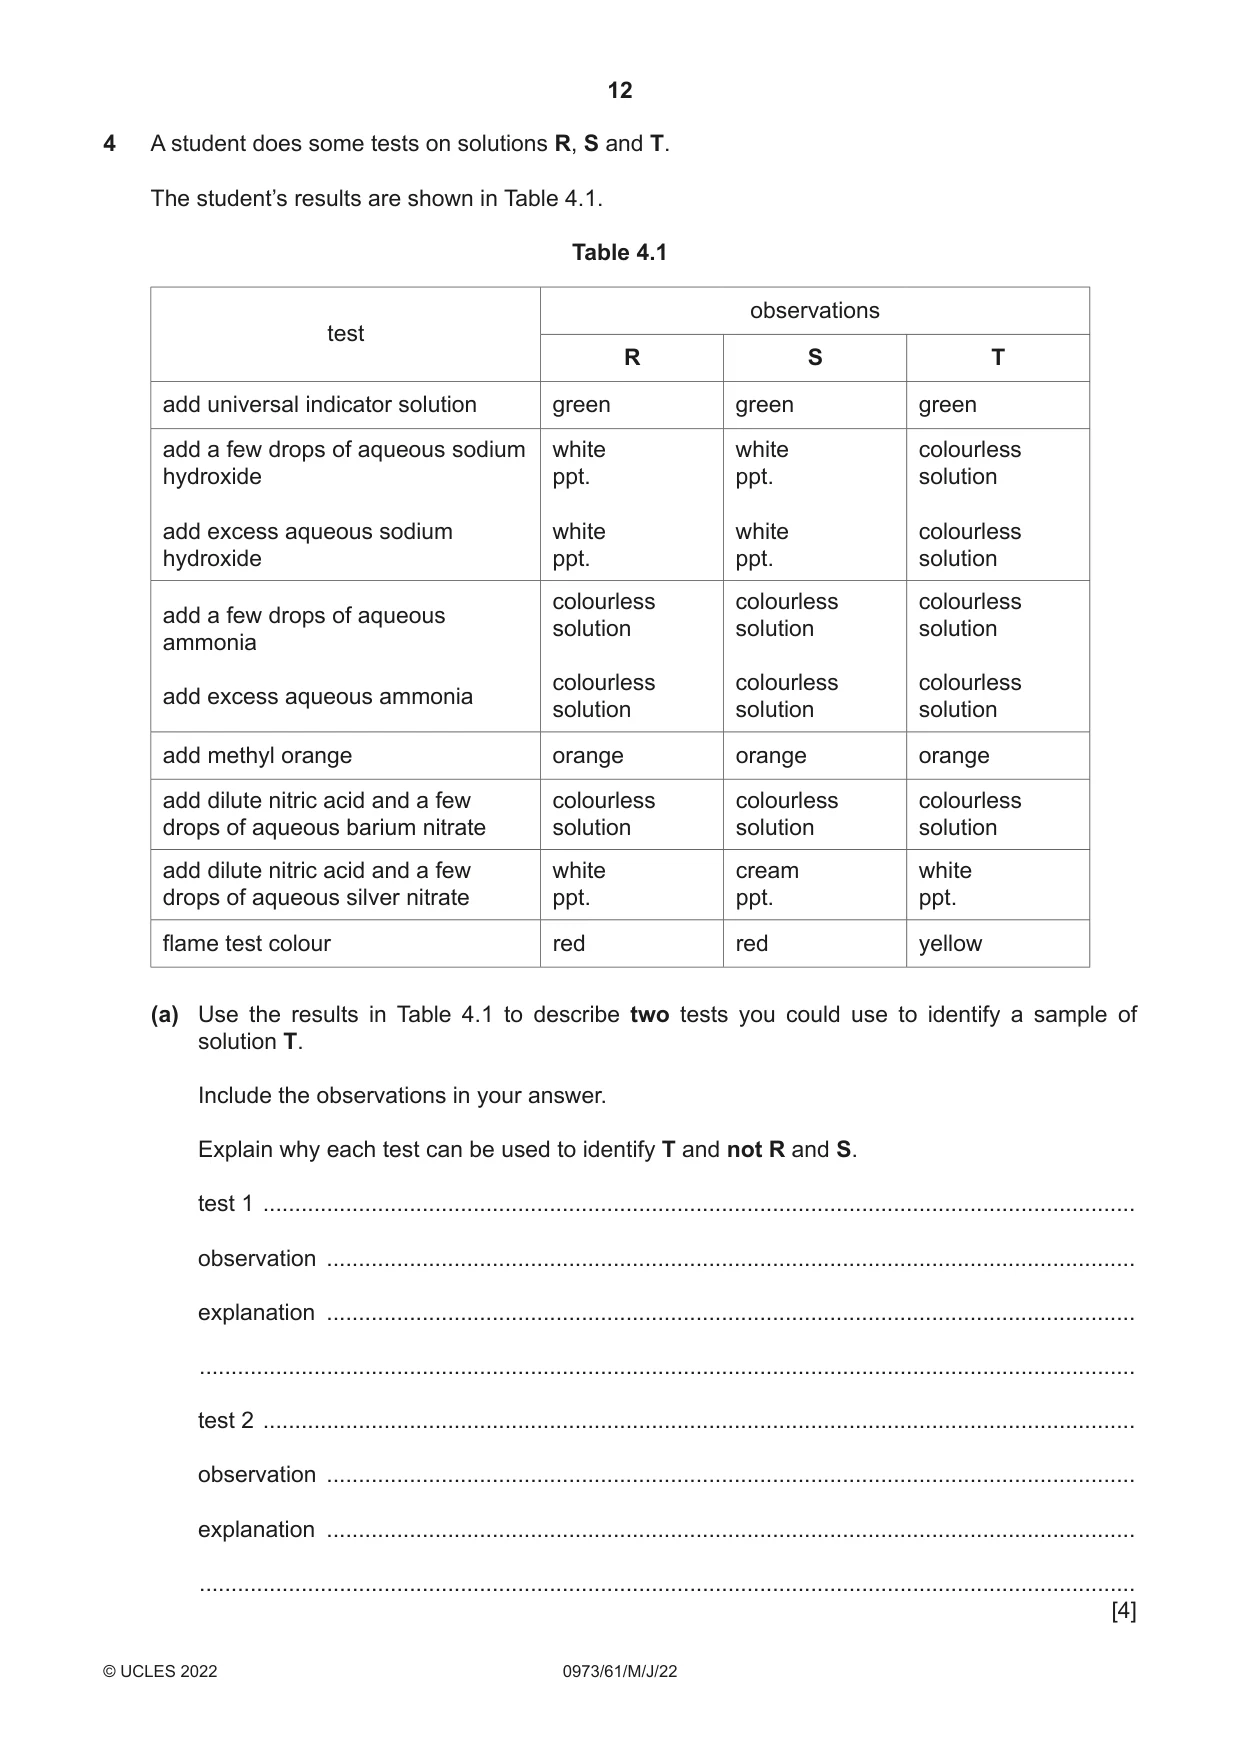
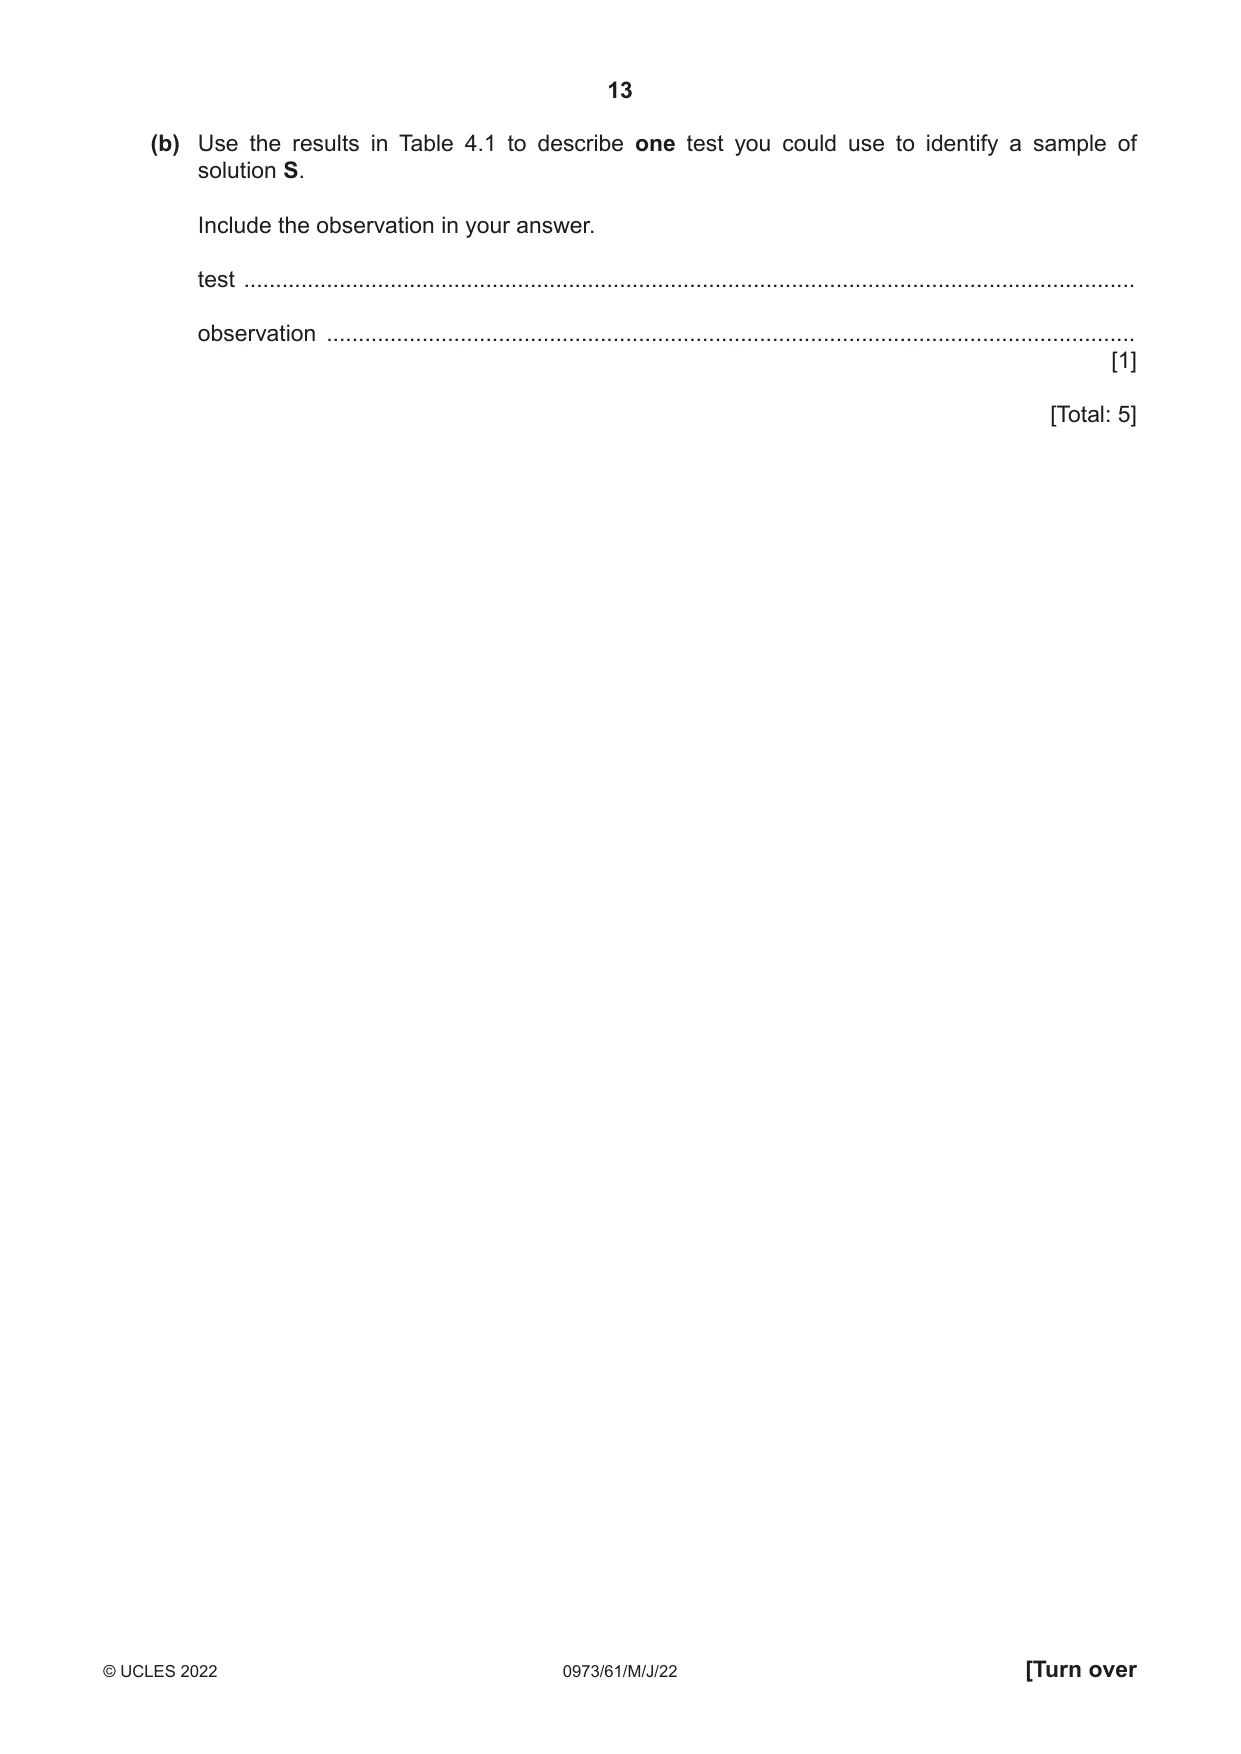
4 A student does some tests on solutions R, S and T. The student’s results are shown in Table 4.1. Table 4.1 observations test R S T add universal indicator solution green green green add a few drops of aqueous sodium white white colourless hydroxide ppt. ppt. solution add excess aqueous sodium white white colourless hydroxide ppt. ppt. solution colourless colourless colourless add a few drops of aqueous solution solution solution ammonia colourless colourless colourless add excess aqueous ammonia solution solution solution add methyl orange orange orange orange add dilute nitric acid and a few colourless colourless colourless drops of aqueous barium nitrate solution solution solution add dilute nitric acid and a few white cream white drops of aqueous silver nitrate ppt. ppt. ppt. flame test colour red red yellow (a) Use the results in Table 4.1 to describe two tests you could use to identify a sample of solution T. Include the observations in your answer. Explain why each test can be used to identify T and not R and S. test 1 ......................................................................................................................................... observation ............................................................................................................................... explanation ............................................................................................................................... ................................................................................................................................................... test 2 ......................................................................................................................................... observation ............................................................................................................................... explanation ............................................................................................................................... ................................................................................................................................................... [4] (b) Use the results in Table 4.1 to describe one test you could use to identify a sample of solution S. Include the observation in your answer. test ............................................................................................................................................ observation ............................................................................................................................... [1] [Total: 5]
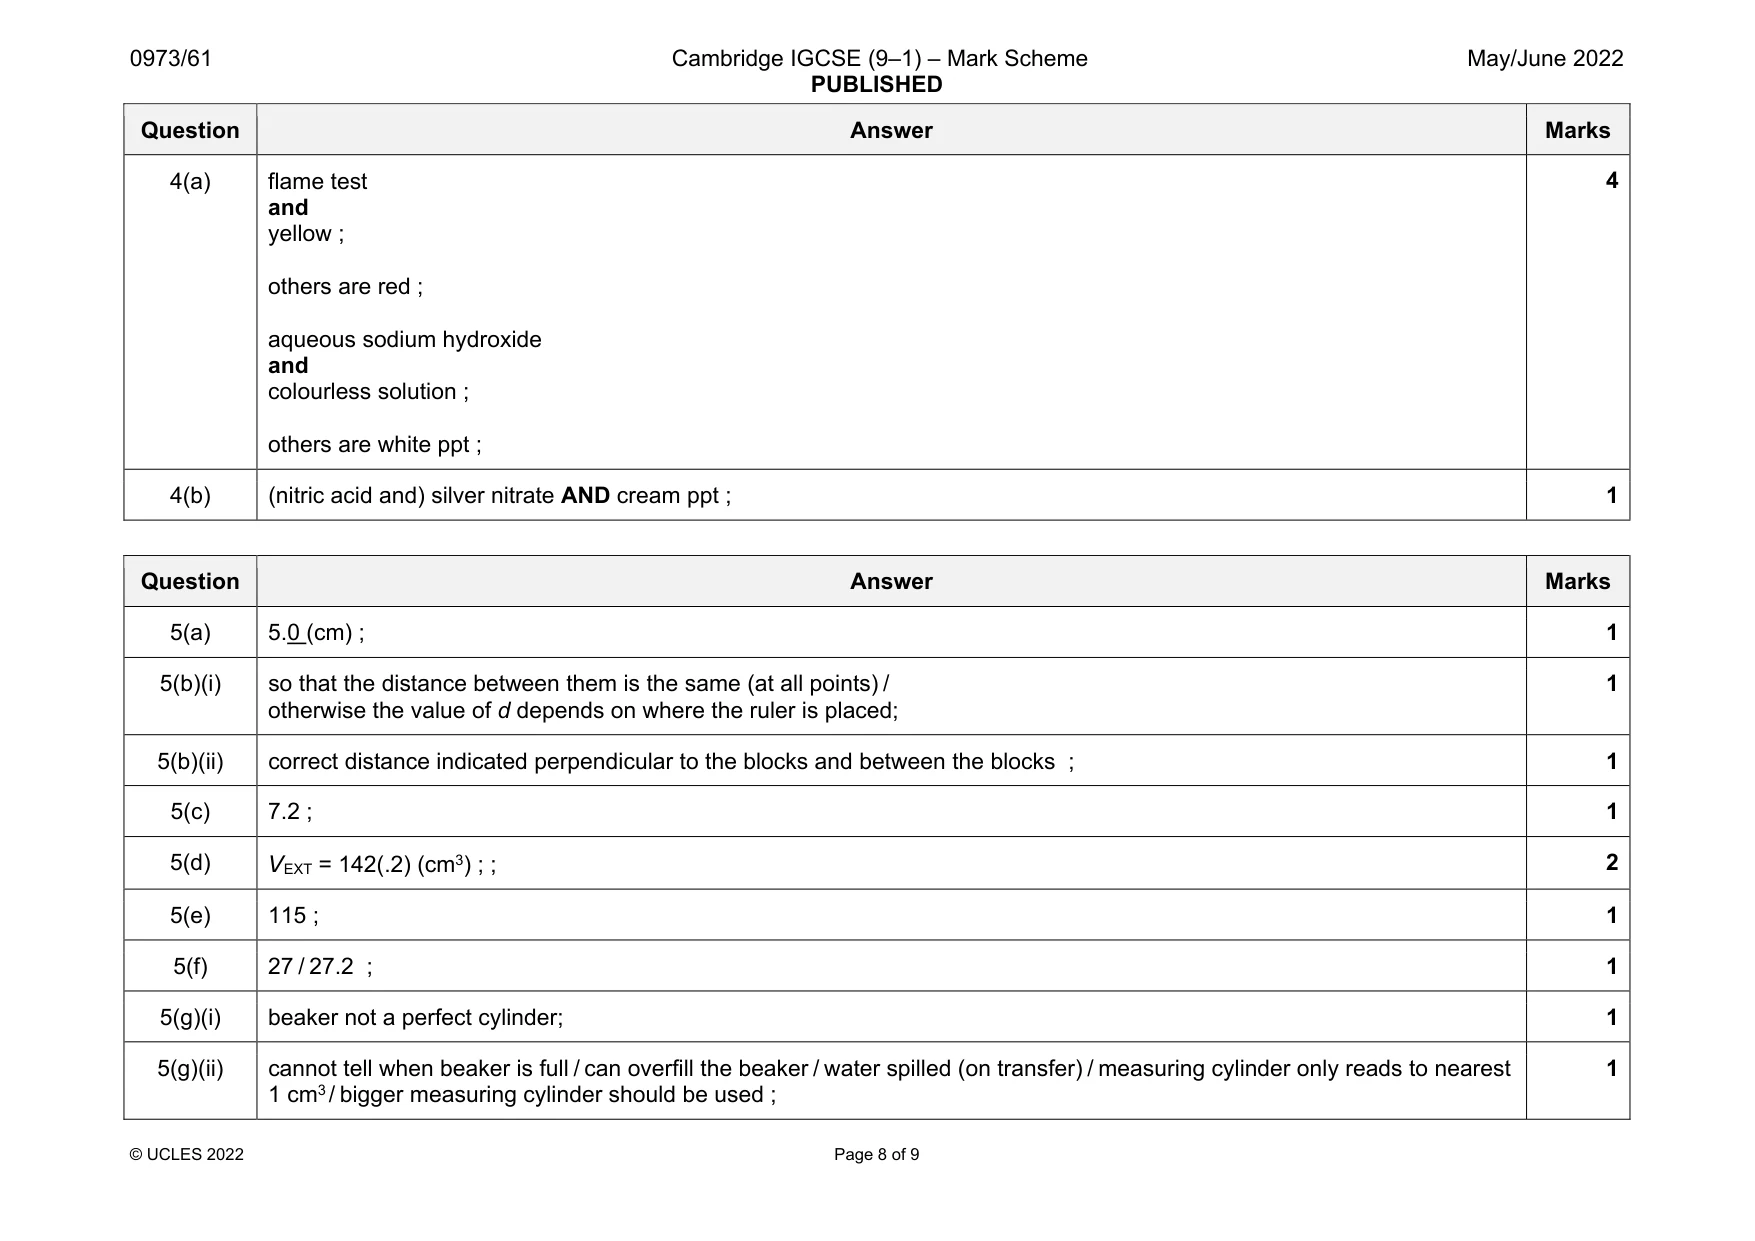
Mark scheme: 4(a) flame test and yellow ; others are red ; aqueous sodium hydroxide and colourless solution ; others are white ppt ; 4(b) (nitric acid and) silver nitrate AND cream ppt ; 1
Q5 · A student determines the volume of glass used to make a beaker
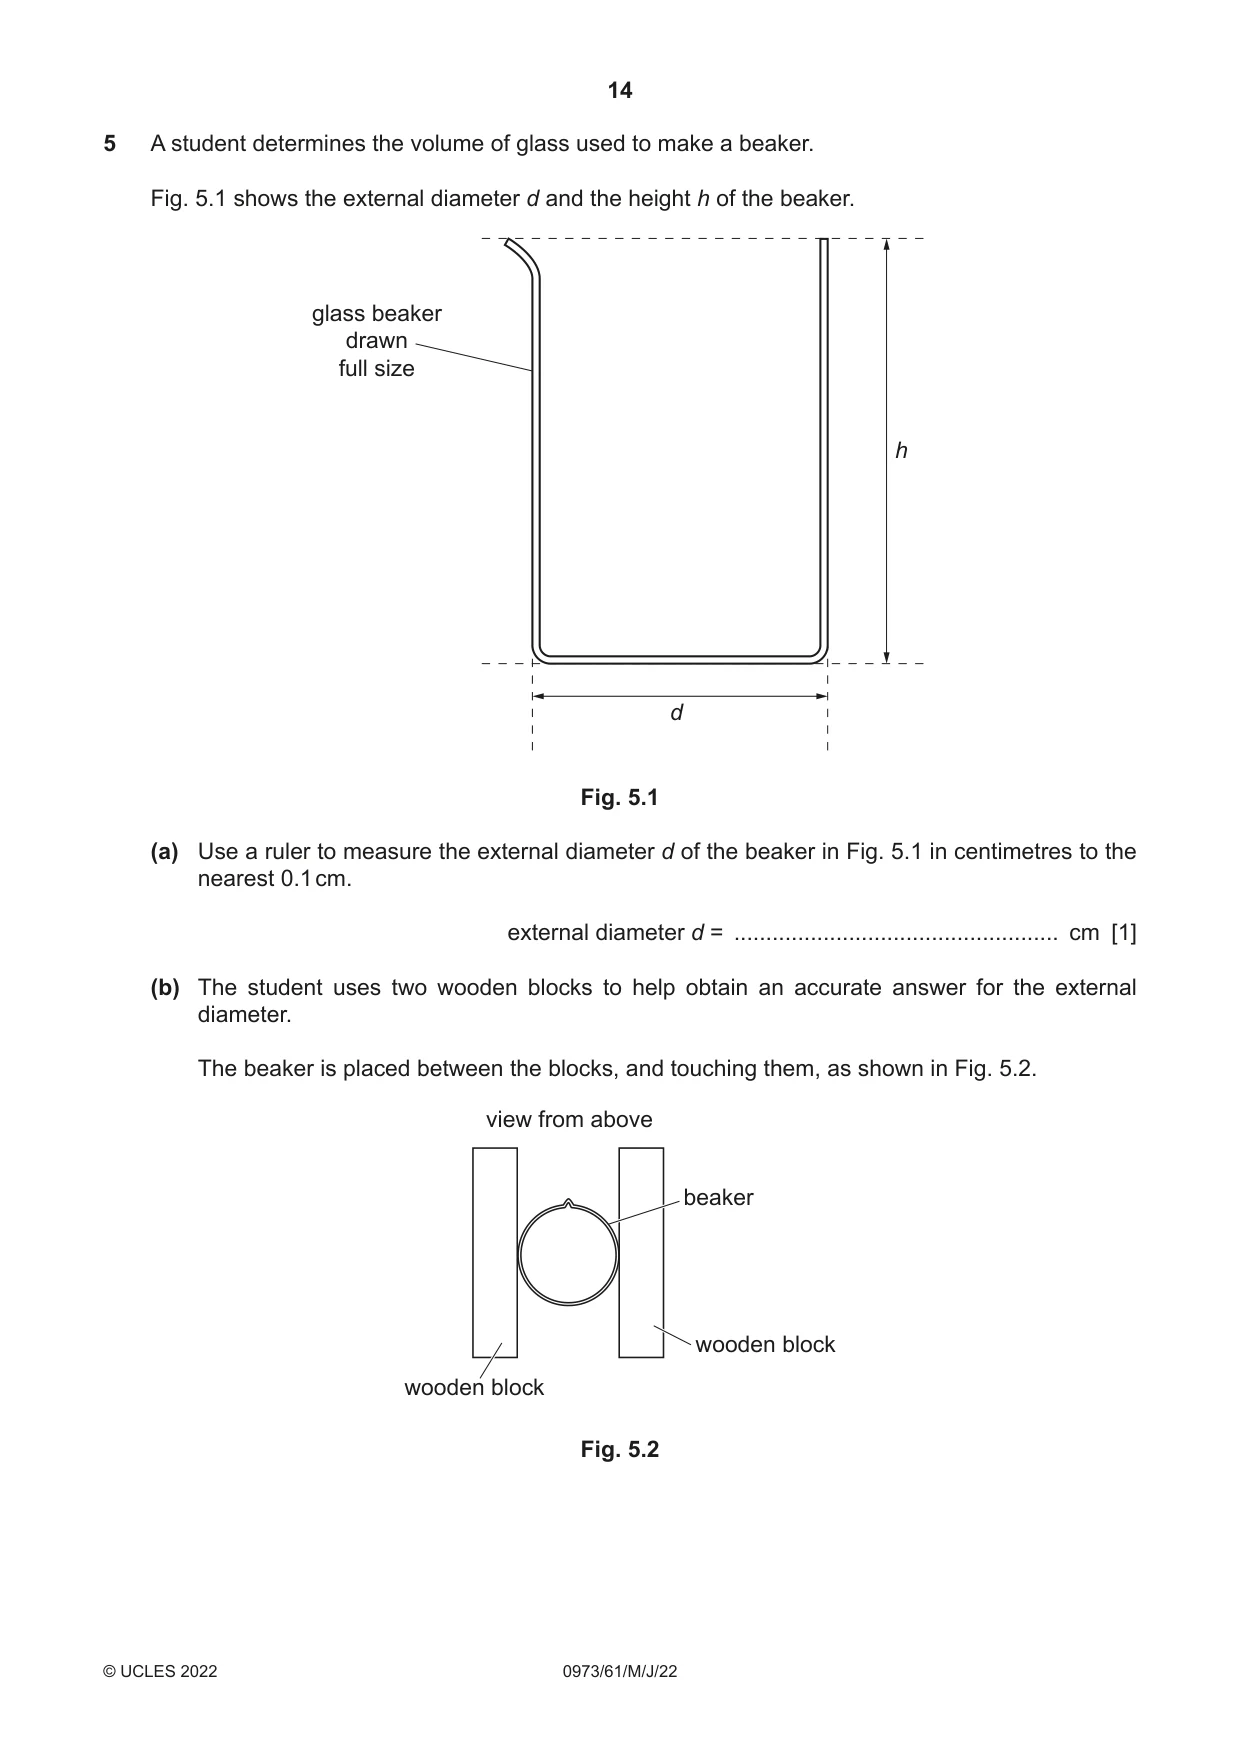
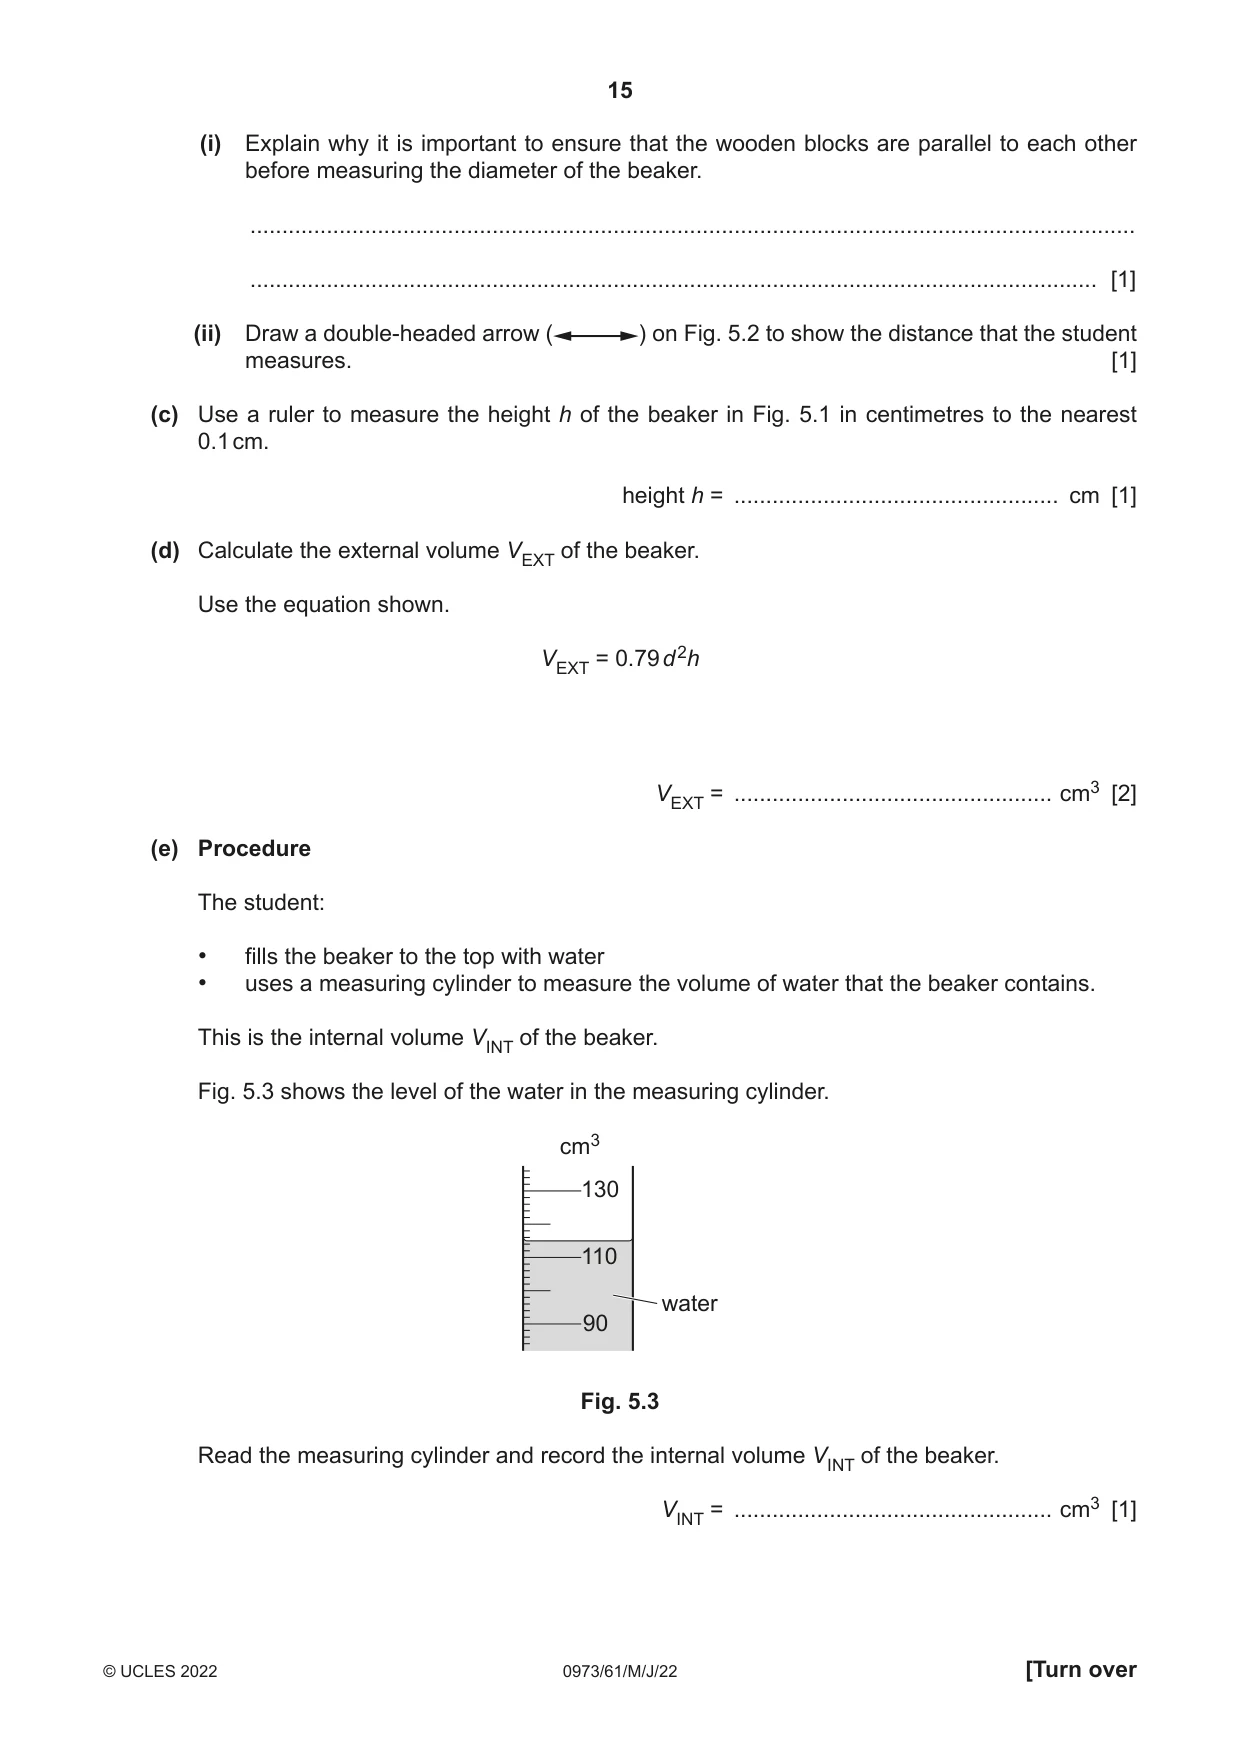
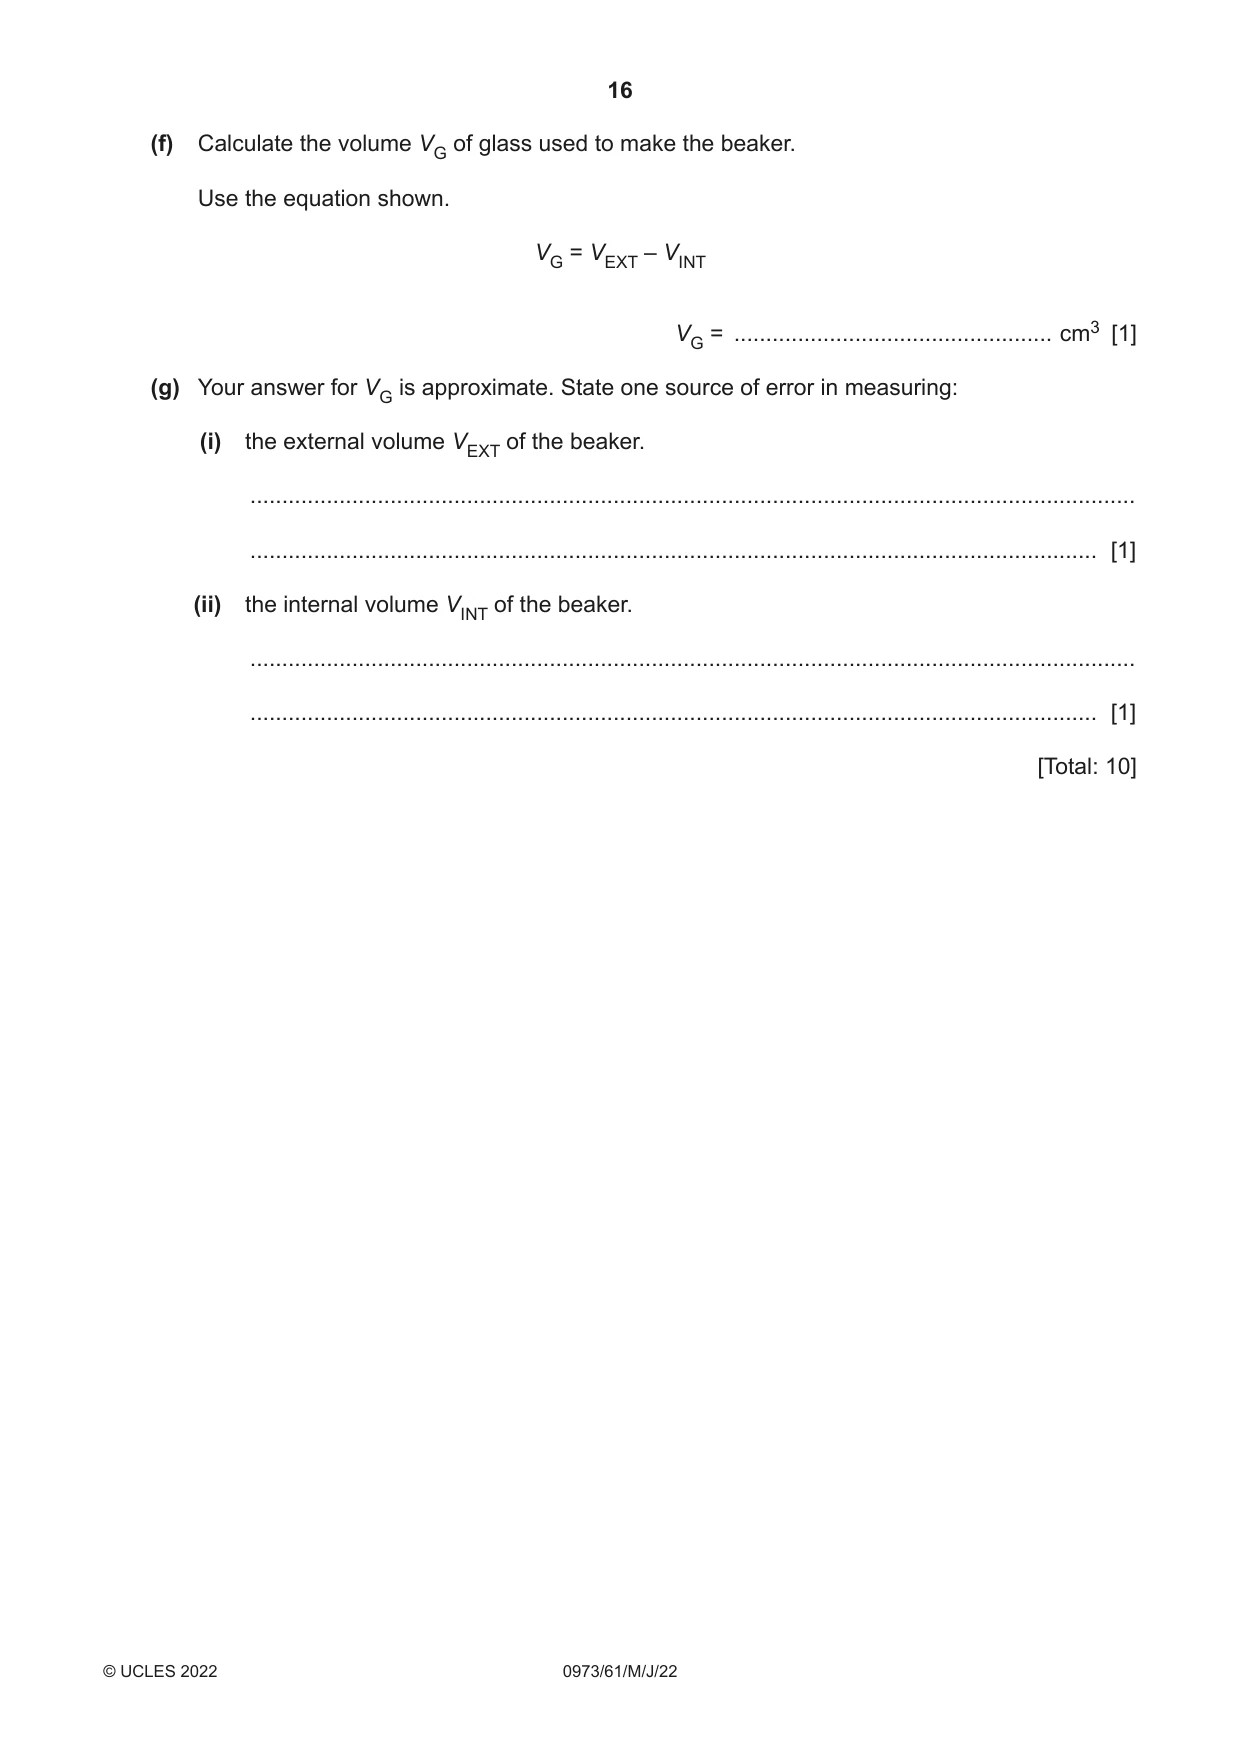
5 A student determines the volume of glass used to make a beaker. Fig. 5.1 shows the external diameter d and the height h of the beaker. glass beaker drawn full size h d Fig. 5.1 (a) Use a ruler to measure the external diameter d of the beaker in Fig. 5.1 in centimetres to the nearest 0.1 cm. external diameter d = ................................................... cm [1] (b) The student uses two wooden blocks to help obtain an accurate answer for the external diameter. The beaker is placed between the blocks, and touching them, as shown in Fig. 5.2. view from above beaker wooden block wooden block Fig. 5.2 (i) Explain why it is important to ensure that the wooden blocks are parallel to each other before measuring the diameter of the beaker. ........................................................................................................................................... ..................................................................................................................................... [1] (ii) Draw a double-headed arrow ( ) on Fig. 5.2 to show the distance that the student measures. [1] (c) Use a ruler to measure the height h of the beaker in Fig. 5.1 in centimetres to the nearest 0.1 cm. height h = ................................................... cm [1] (d) Calculate the external volume VEXT of the beaker. Use the equation shown. VEXT = 0.79 d 2h VEXT = .................................................. cm3 [2] (e) Procedure The student: • fills the beaker to the top with water • uses a measuring cylinder to measure the volume of water that the beaker contains. This is the internal volume VINT of the beaker. Fig. 5.3 shows the level of the water in the measuring cylinder. cm3 130 110 water 90 Fig. 5.3 Read the measuring cylinder and record the internal volume VINT of the beaker. VINT = .................................................. cm3 [1] (f) Calculate the volume VG of glass used to make the beaker. Use the equation shown. VG = VEXT – VINT VG = .................................................. cm3 [1] (g) Your answer for VG is approximate. State one source of error in measuring: (i) the external volume VEXT of the beaker. ........................................................................................................................................... ..................................................................................................................................... [1] (ii) the internal volume VINT of the beaker. ........................................................................................................................................... ..................................................................................................................................... [1] [Total: 10]
Mark scheme: 5(a) 5.0 (cm) ; 1 5(b)(i) so that the distance between them is the same (at all points) / otherwise the value of d depends on where the ruler is placed; 1 5(b)(ii) correct distance indicated perpendicular to the blocks and between the blocks ; 1 5(c) 7.2 ; 1 5(d) VEXT = 142(.2) (cm3) ; ; 2 5(e) 115 ; 1 5(f) 27 / 27.2 ; 1 5(g)(i) beaker not a perfect cylinder; 1 5(g)(ii) cannot tell when beaker is full / can overfill the beaker / water spilled (on transfer) / measuring cylinder only reads to nearest 1 cm3 / bigger measuring cylinder should be used ; 1
More questions on Physical quantities and measurement techniques
Q6 · A student investigates how the resistance R of a lamp changes as the potential difference…
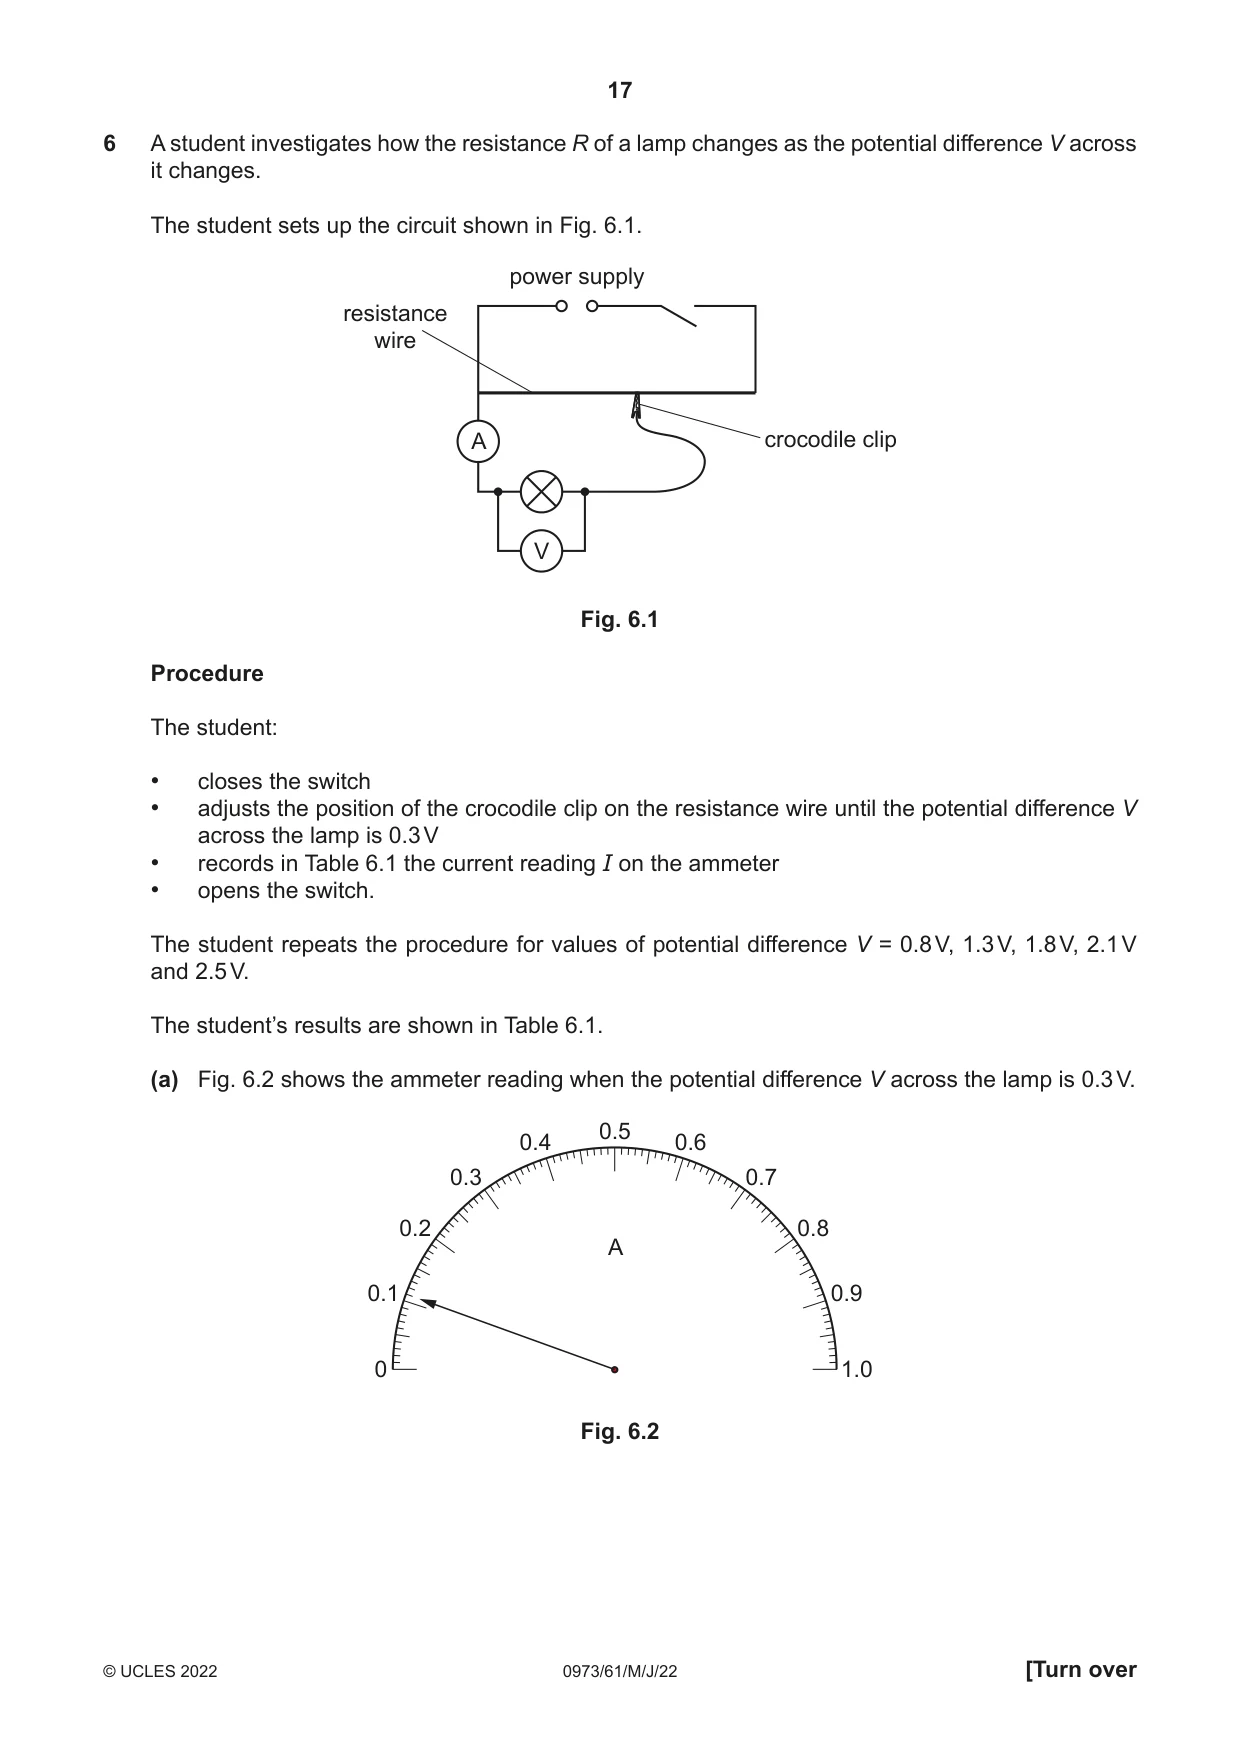
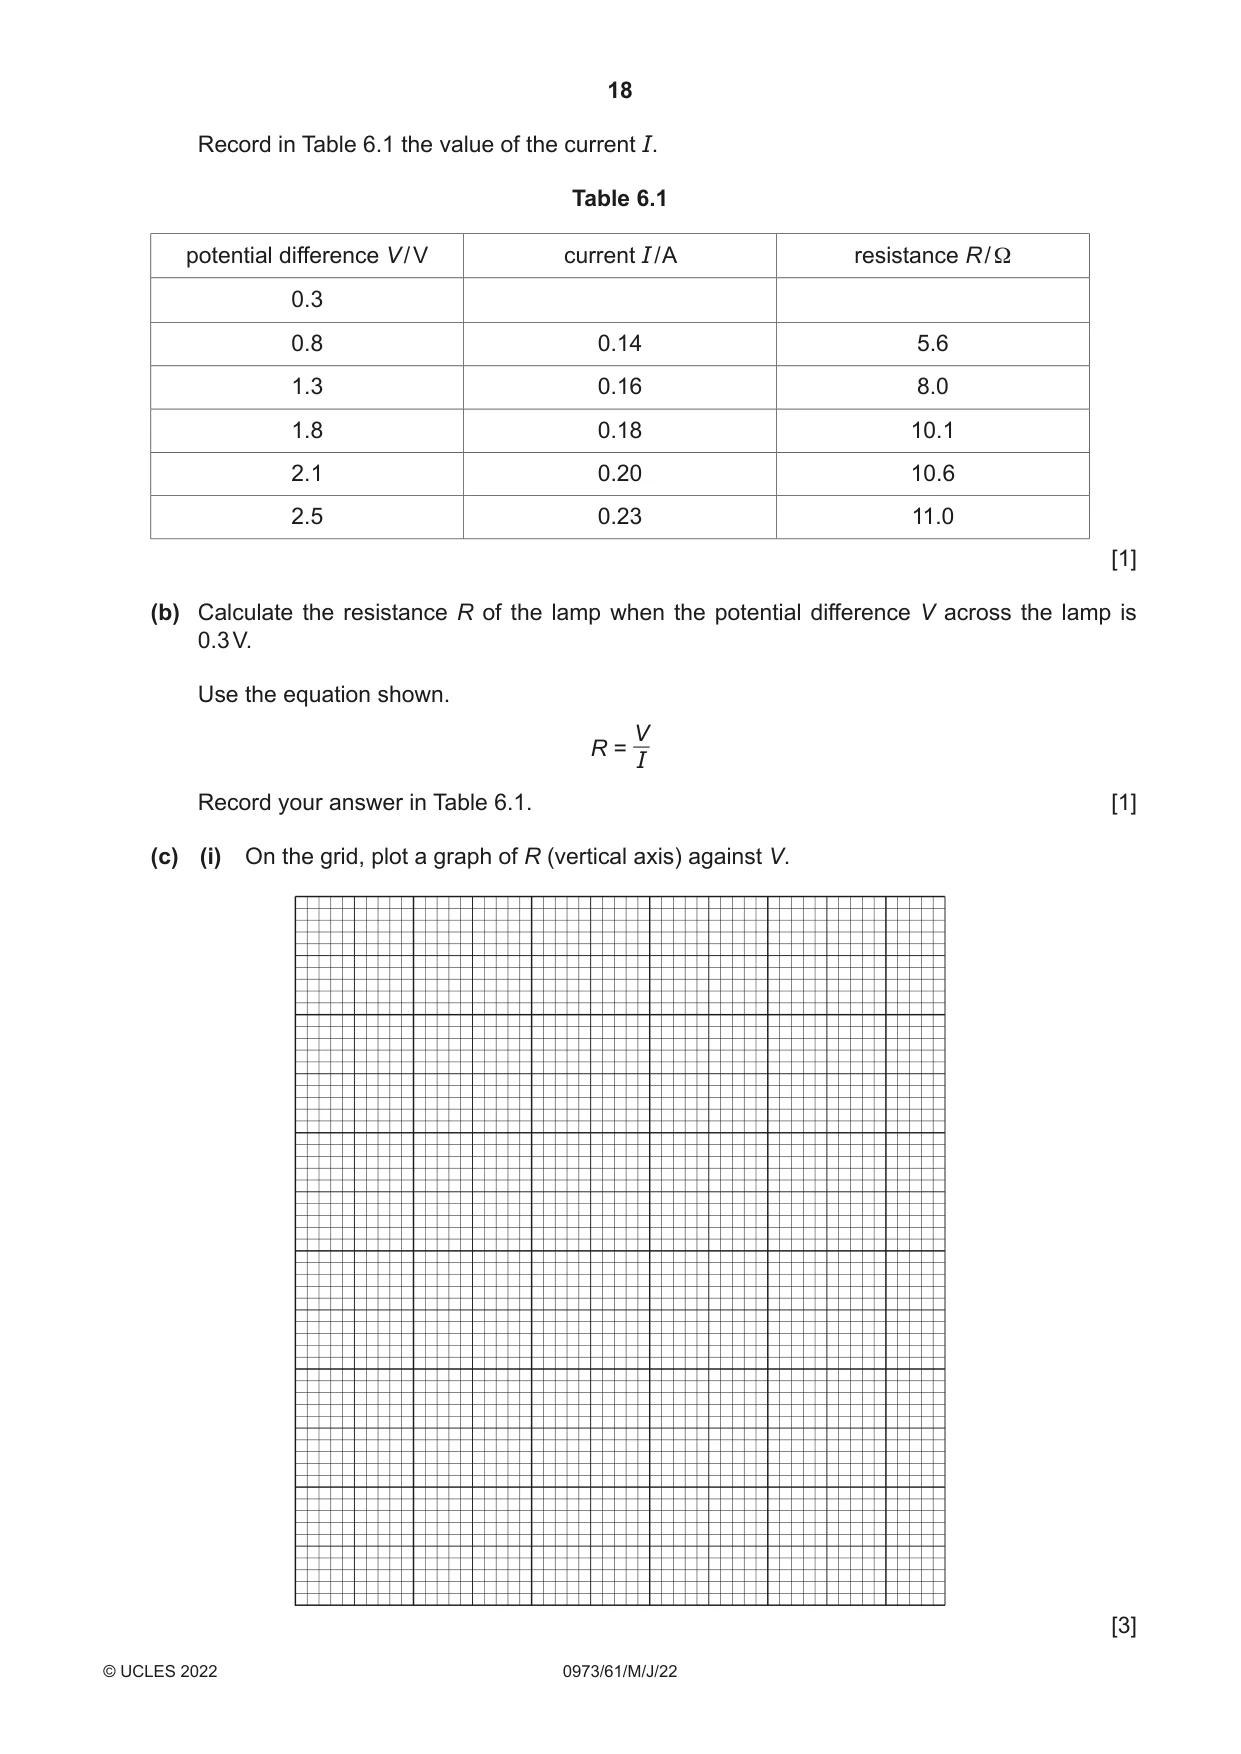
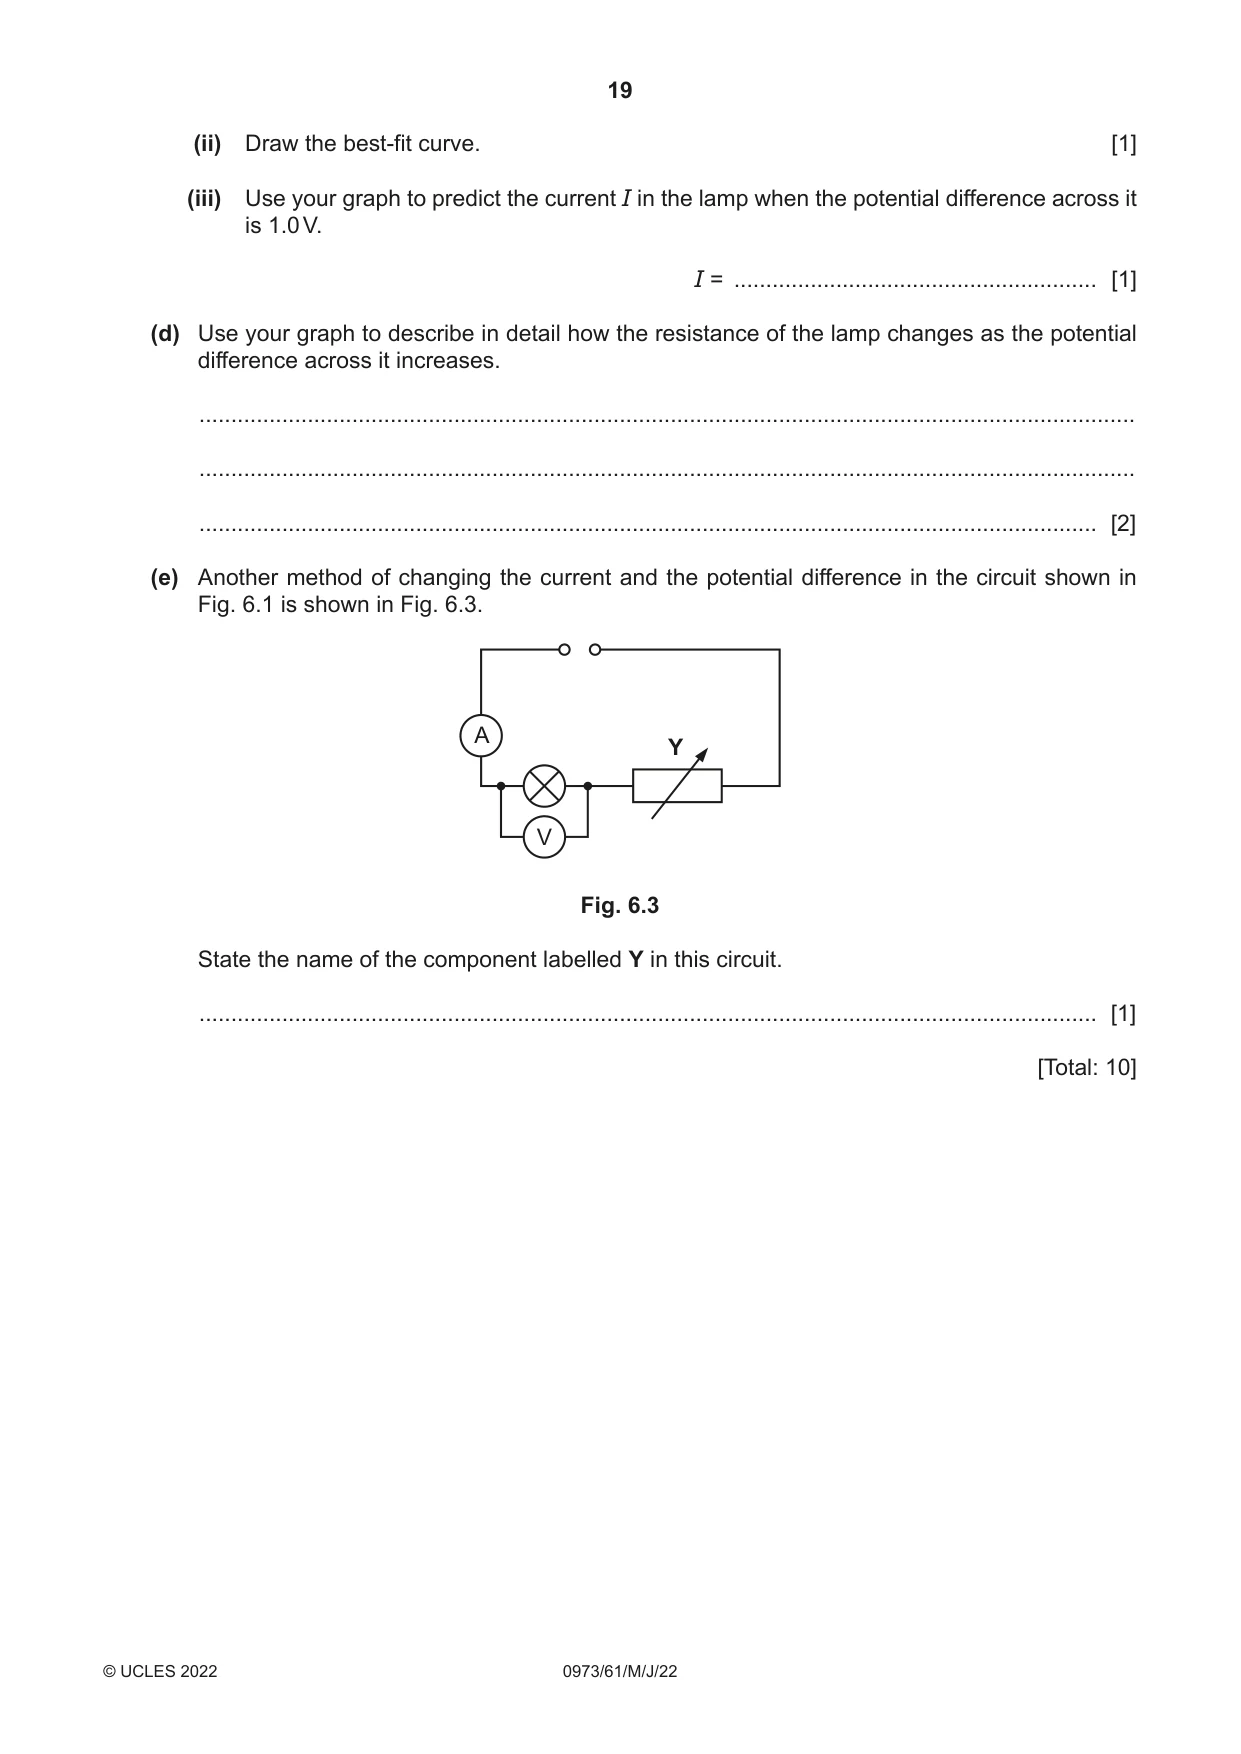
6 A student investigates how the resistance R of a lamp changes as the potential difference V across it changes. The student sets up the circuit shown in Fig. 6.1. power supply resistance wire A crocodile clip V Fig. 6.1 Procedure The student: • closes the switch • adjusts the position of the crocodile clip on the resistance wire until the potential difference V across the lamp is 0.3 V • records in Table 6.1 the current reading I on the ammeter • opens the switch. The student repeats the procedure for values of potential difference V = 0.8 V, 1.3 V, 1.8 V, 2.1 V and 2.5 V. The student’s results are shown in Table 6.1. (a) Fig. 6.2 shows the ammeter reading when the potential difference V across the lamp is 0.3 V. 0.5 0.4 0.6 0.3 0.7 0.2 0.8 A 0.1 0.9 0 1.0 Fig. 6.2 Record in Table 6.1 the value of the current I. Table 6.1 potential difference V / V current I / A resistance R / Ω 0.3 0.8 0.14 5.6 1.3 0.16 8.0 1.8 0.18 10.1 2.1 0.20 10.6 2.5 0.23 11.0 [1] (b) Calculate the resistance R of the lamp when the potential difference V across the lamp is 0.3 V. Use the equation shown. V R = I Record your answer in Table 6.1. [1] (c) (i) On the grid, plot a graph of R (vertical axis) against V. [3] (ii) Draw the best-fit curve. [1] (iii) Use your graph to predict the current I in the lamp when the potential difference across it is 1.0 V. I = ......................................................... [1] (d) Use your graph to describe in detail how the resistance of the lamp changes as the potential difference across it increases. ................................................................................................................................................... ................................................................................................................................................... ............................................................................................................................................. [2] (e) Another method of changing the current and the potential difference in the circuit shown in Fig. 6.1 is shown in Fig. 6.3. A Y V Fig. 6.3 State the name of the component labelled Y in this circuit. ............................................................................................................................................. [1] [Total: 10]
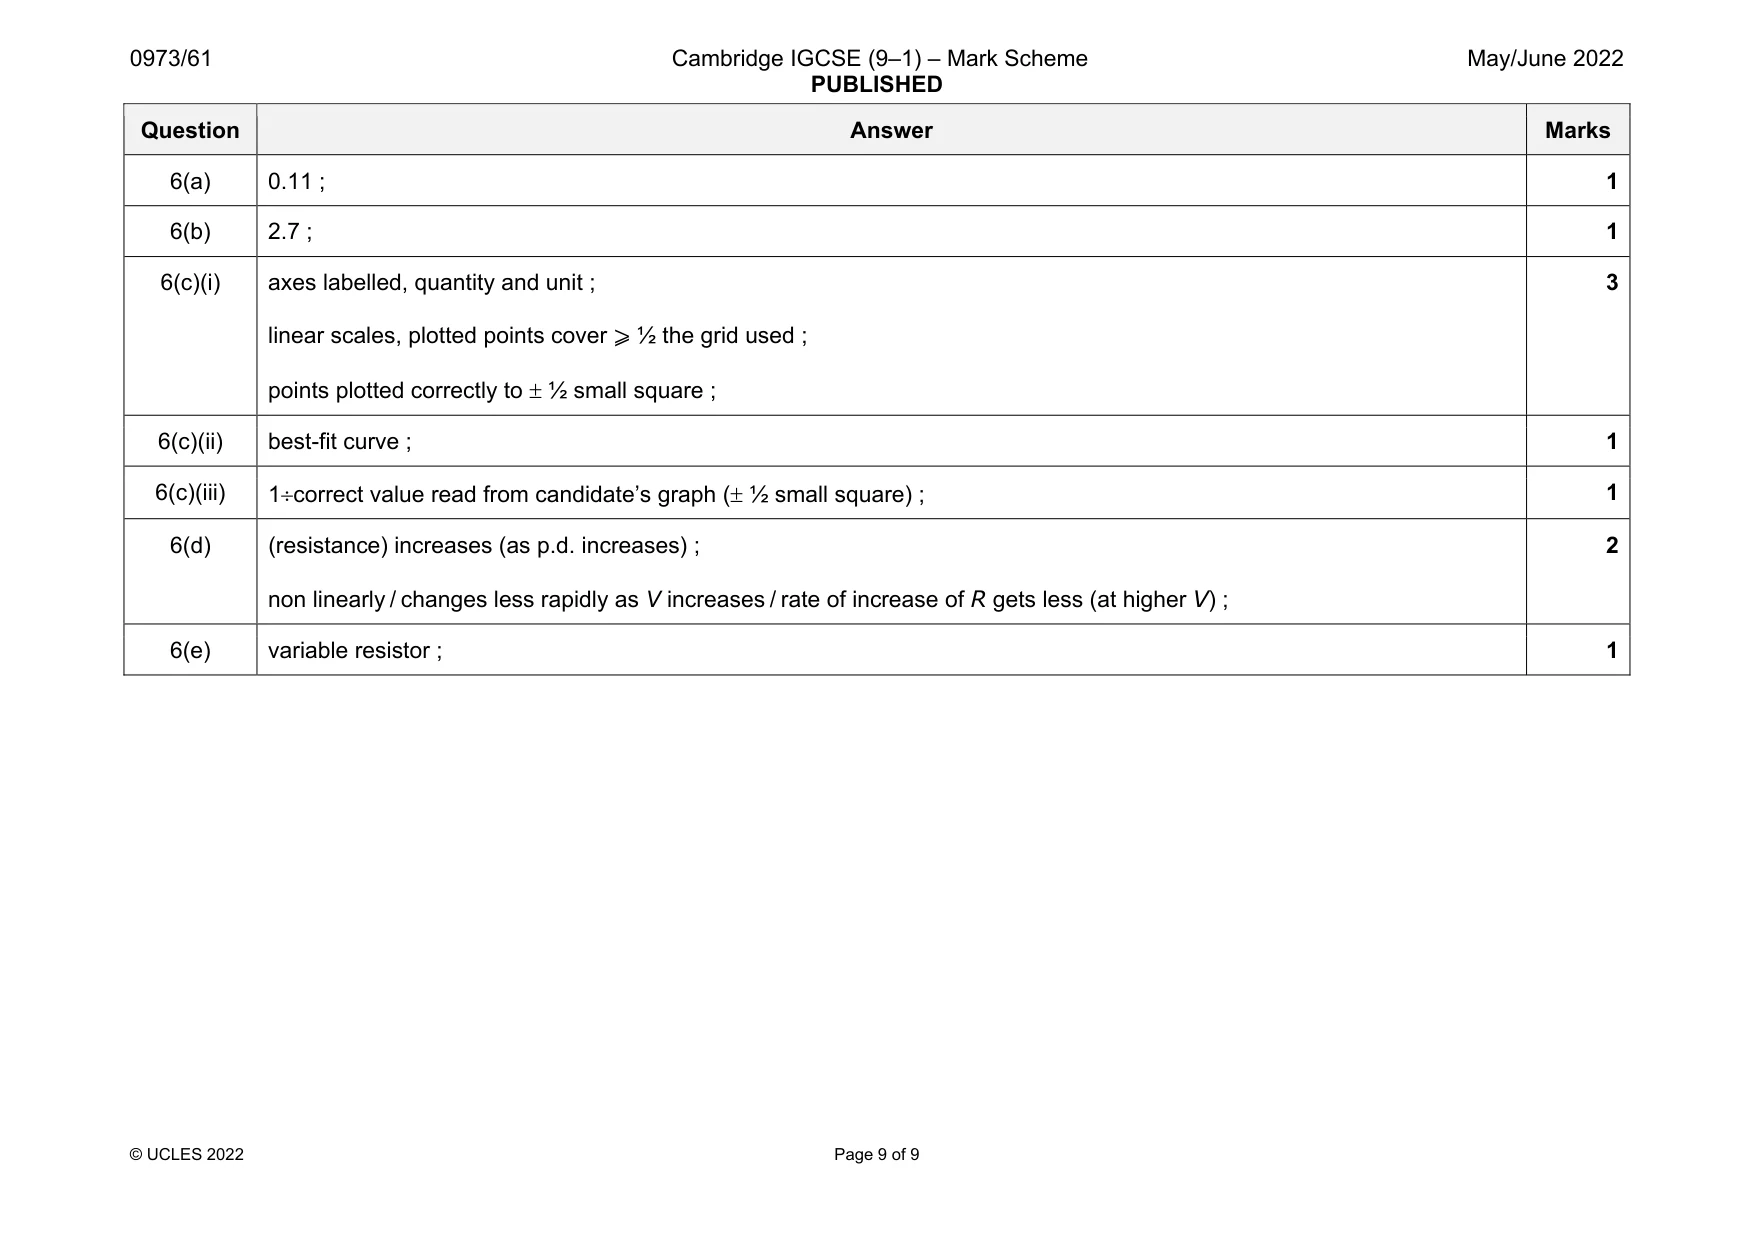
Mark scheme: 6(a) 0.11 ; 1 6(b) 2.7 ; 1 6(c)(i) axes labelled, quantity and unit ; linear scales, plotted points cover ⩾ ½ the grid used ; points plotted correctly to ½ small square ; 3 6(c)(ii) best-fit curve ; 1 6(c)(iii) 1correct value read from candidate’s graph ( ½ small square) ; 1 6(d) (resistance) increases (as p.d. increases) ; non linearly / changes less rapidly as V increases / rate of increase of R gets less (at higher V) ; 2 6(e) variable resistor ; 1
What was in this paper
The subtopics covered by these 6 questions, and how many questions each got. Open one in a new tab to see every Cambridge question on it.
What you needed in this session
Cambridge’s own grade thresholds for 2022 May/June, Paper 6 · Variant 1. A higher threshold means an easier paper — the bar moves with how the cohort did.