Cambridge IGCSE Physics 0625 — 2022 May/June Paper 5 · Variant 1
0625/51/M/J/22 · 4 questions · 40 marks · ≈45 min
The question paper and its mark scheme, free to read here and free to download. This is Cambridge’s own paper, exactly as it was sat.
Question paper16 pages






Mark scheme9 pages
Answers below. Sit the paper first if you are practising.
Questions as text
Q1 · In this experiment, you will investigate the stretching of a spring
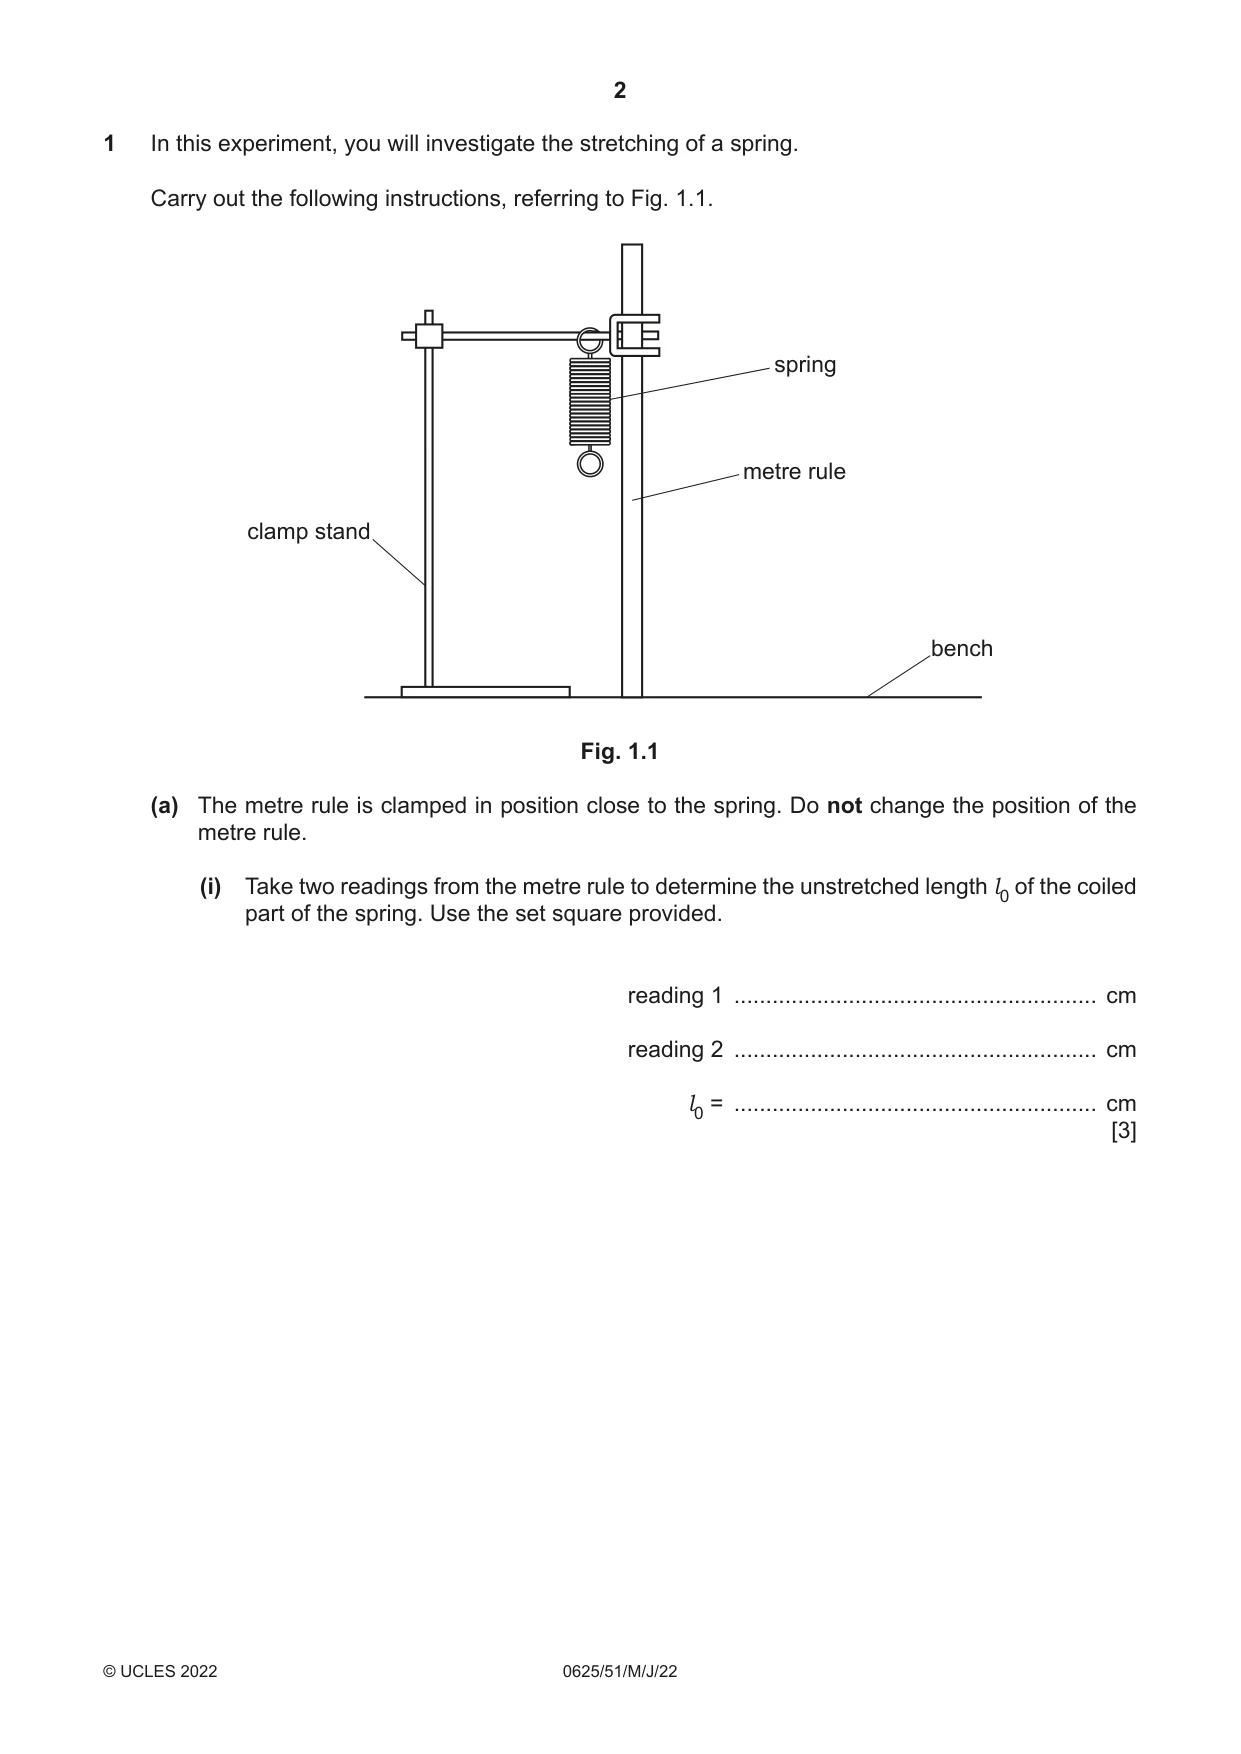
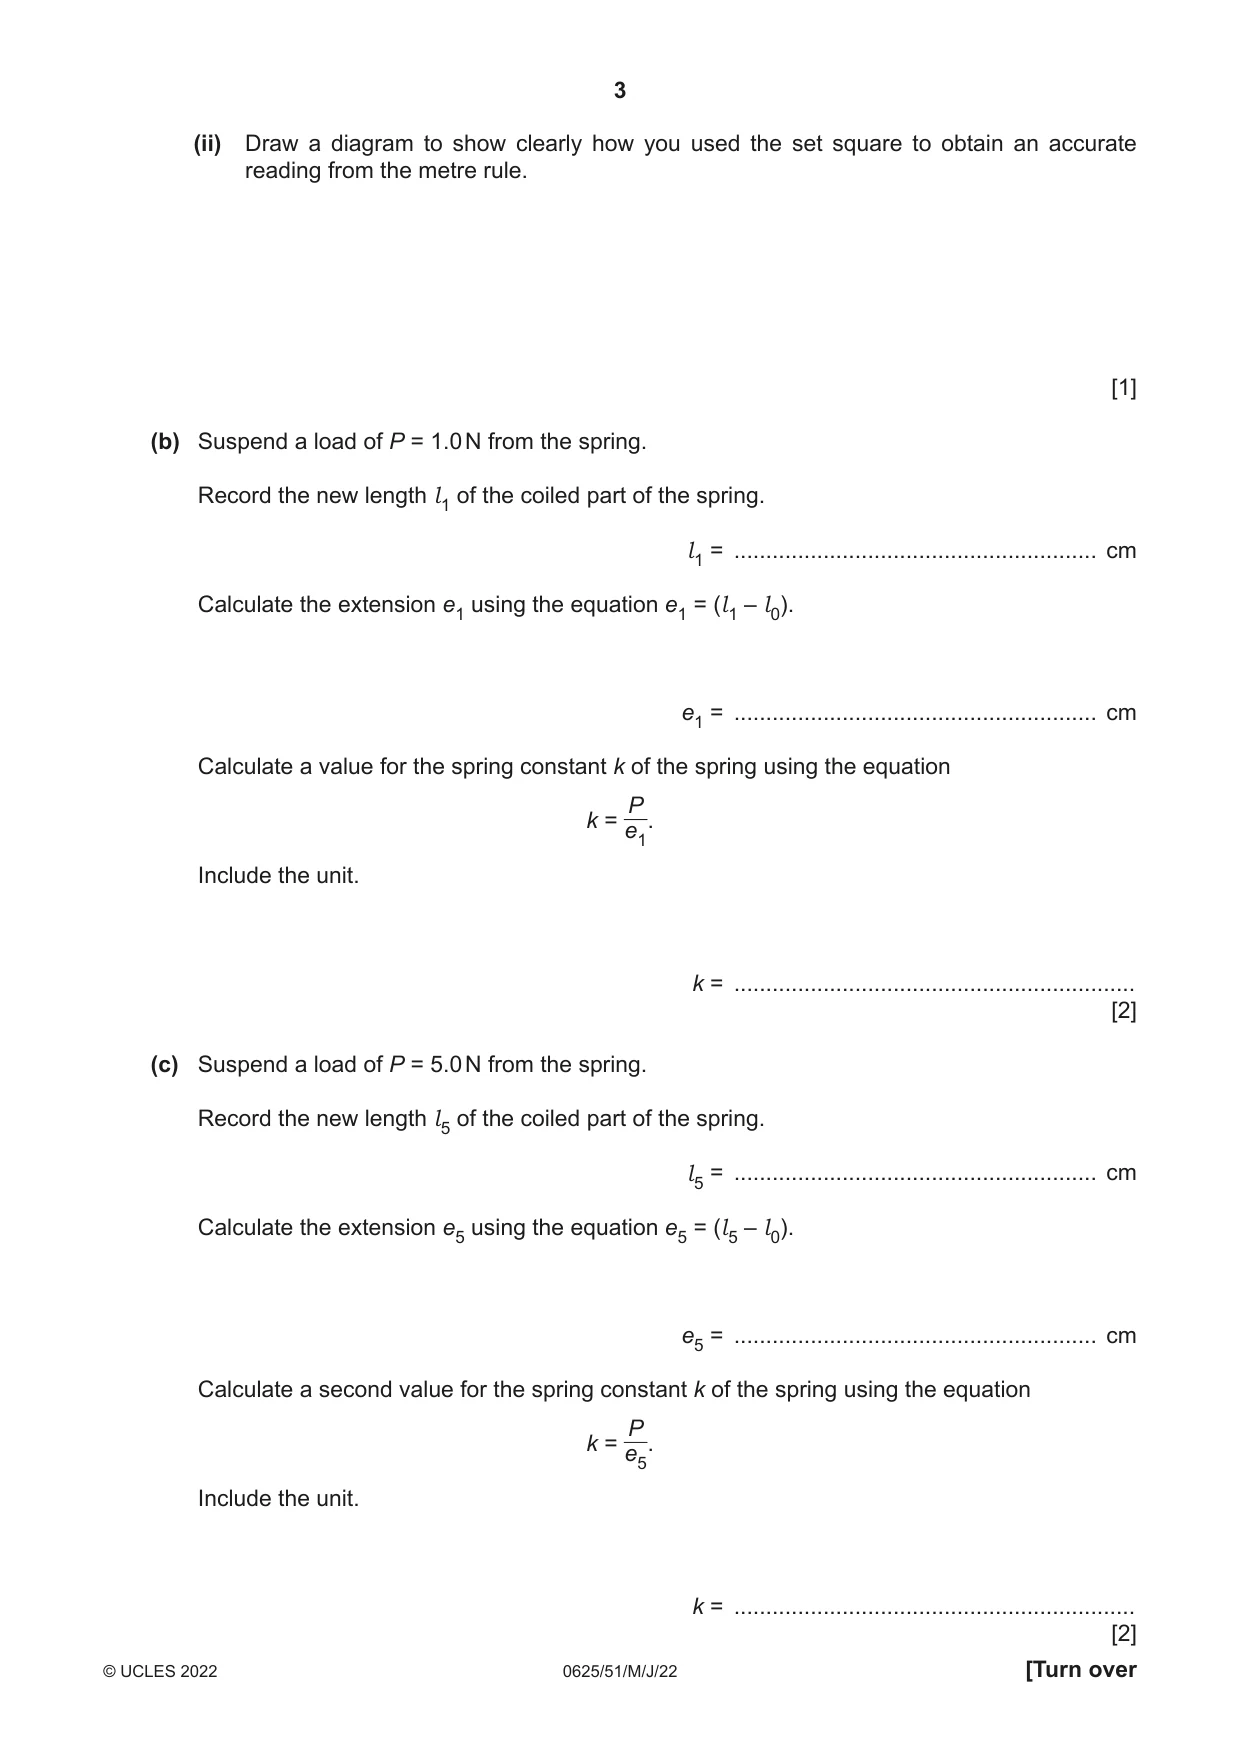
1 In this experiment, you will investigate the stretching of a spring. Carry out the following instructions, referring to Fig. 1.1. spring metre rule clamp stand bench Fig. 1.1 (a) The metre rule is clamped in position close to the spring. Do not change the position of the metre rule. (i) Take two readings from the metre rule to determine the unstretched length l0 of the coiled part of the spring. Use the set square provided. reading 1 ......................................................... cm reading 2 ......................................................... cm l0 = ......................................................... cm [3] (ii) Draw a diagram to show clearly how you used the set square to obtain an accurate reading from the metre rule. [1] (b) Suspend a load of P = 1.0 N from the spring. Record the new length l1 of the coiled part of the spring. l1 = ......................................................... cm Calculate the extension e1 using the equation e1 = (l1 – l0). e1 = ......................................................... cm Calculate a value for the spring constant k of the spring using the equation P k = e1. Include the unit. k = ............................................................... [2] (c) Suspend a load of P = 5.0 N from the spring. Record the new length l5 of the coiled part of the spring. l5 = ......................................................... cm Calculate the extension e5 using the equation e5 = (l5 – l0). e5 = ......................................................... cm Calculate a second value for the spring constant k of the spring using the equation P k = e5. Include the unit. k = ............................................................... [2] (d) State whether your two values of the spring constant k can be considered equal within the limits of experimental accuracy. Explain your answer by referring to your results. statement .................................................................................................................................. explanation ............................................................................................................................... ................................................................................................................................................... ................................................................................................................................................... [1] (e) A student improves the experiment by taking additional sets of readings. (i) Suggest the additional apparatus that the student uses. ........................................................................................................................................... ..................................................................................................................................... [1] (ii) Suggest how the student uses the additional results. ........................................................................................................................................... ..................................................................................................................................... [1] [Total: 11]
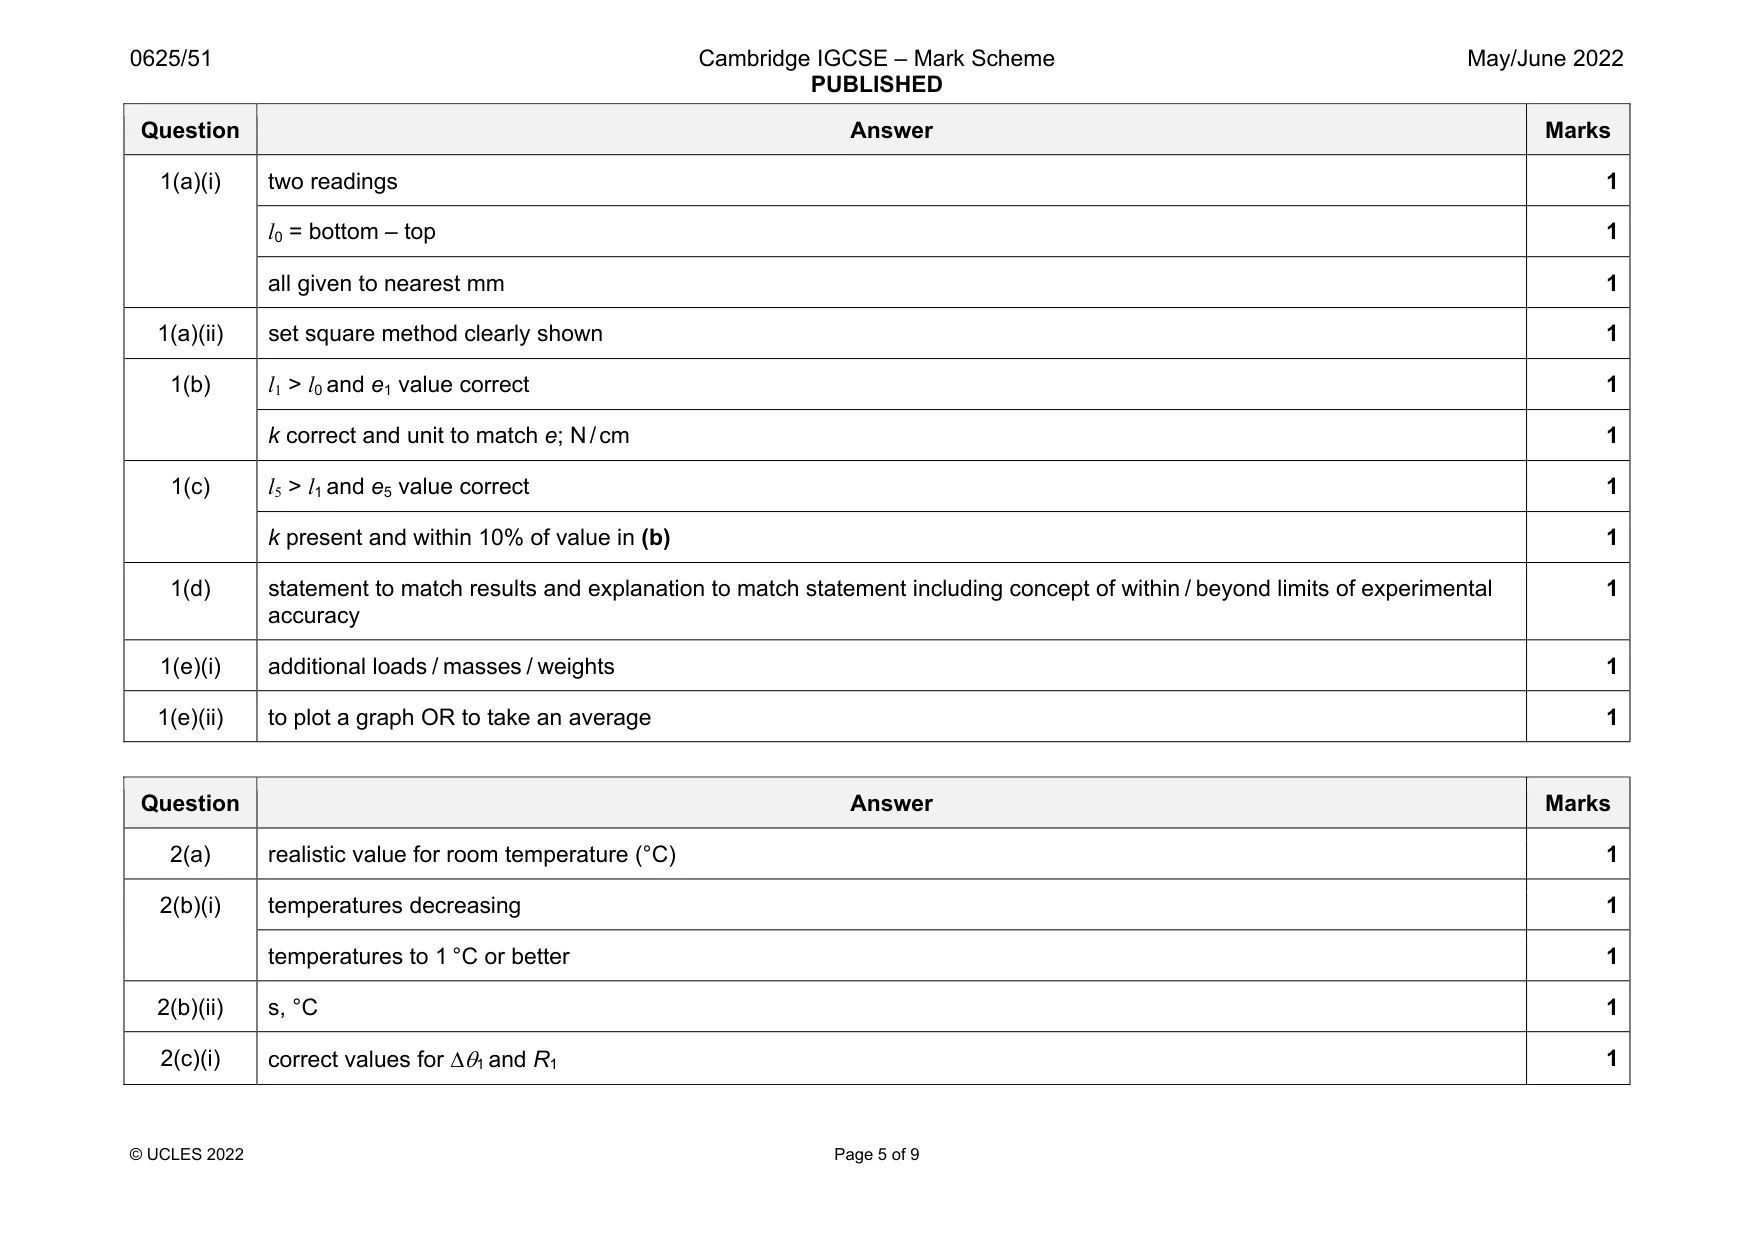
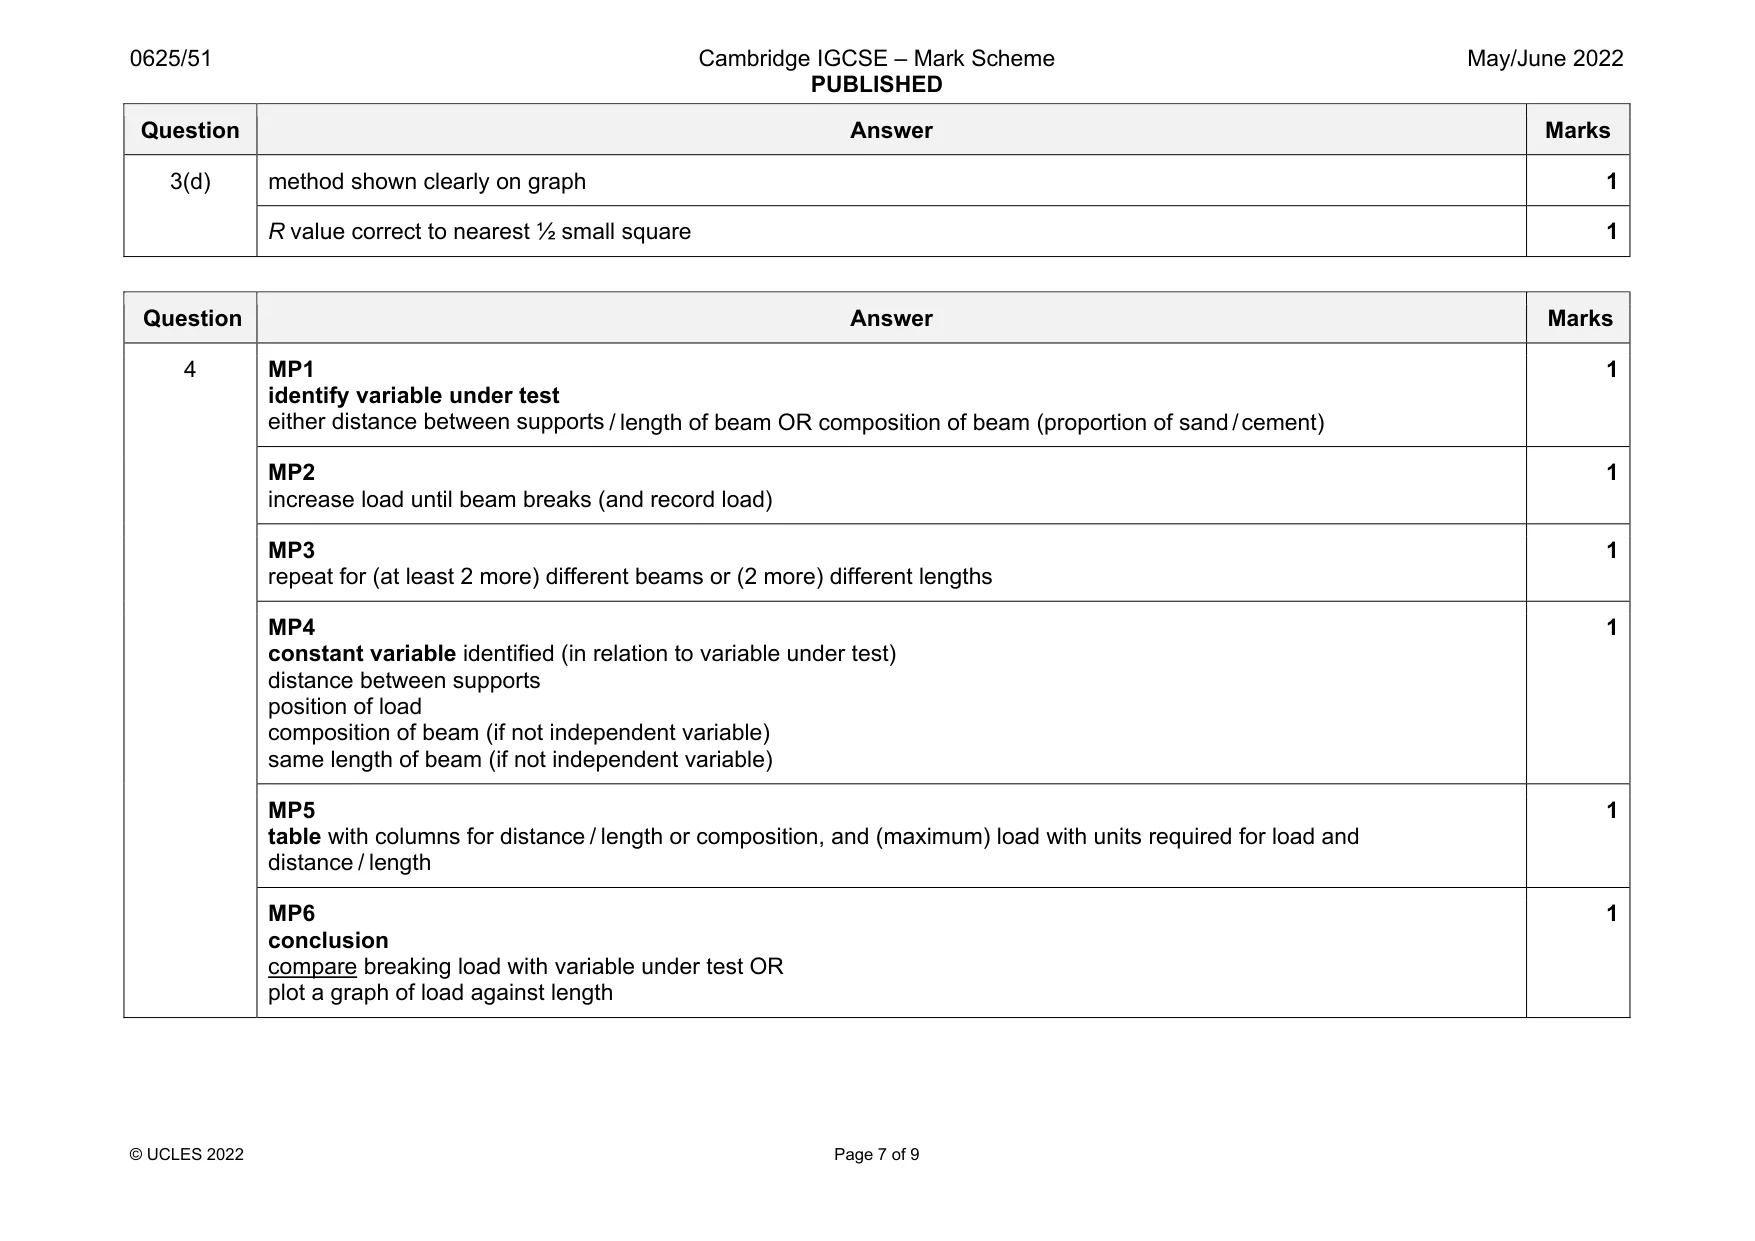
Mark scheme: 1(a)(i) two readings 1 l0 = bottom – top 1 all given to nearest mm 1 1(a)(ii) set square method clearly shown 1 1(b) l1 > l0 and e1 value correct 1 k correct and unit to match e; N / cm 1 1(c) l5 > l1 and e5 value correct 1 k present and within 10% of value in (b) 1 1(d) statement to match results and explanation to match statement including concept of within / beyond limits of experimental accuracy 1 1(e)(i) additional loads / masses / weights 1 1(e)(ii) to plot a graph OR to take an average 1
More questions on Physical quantities and measurement techniques
Q2 · In this experiment, you will investigate the cooling of water
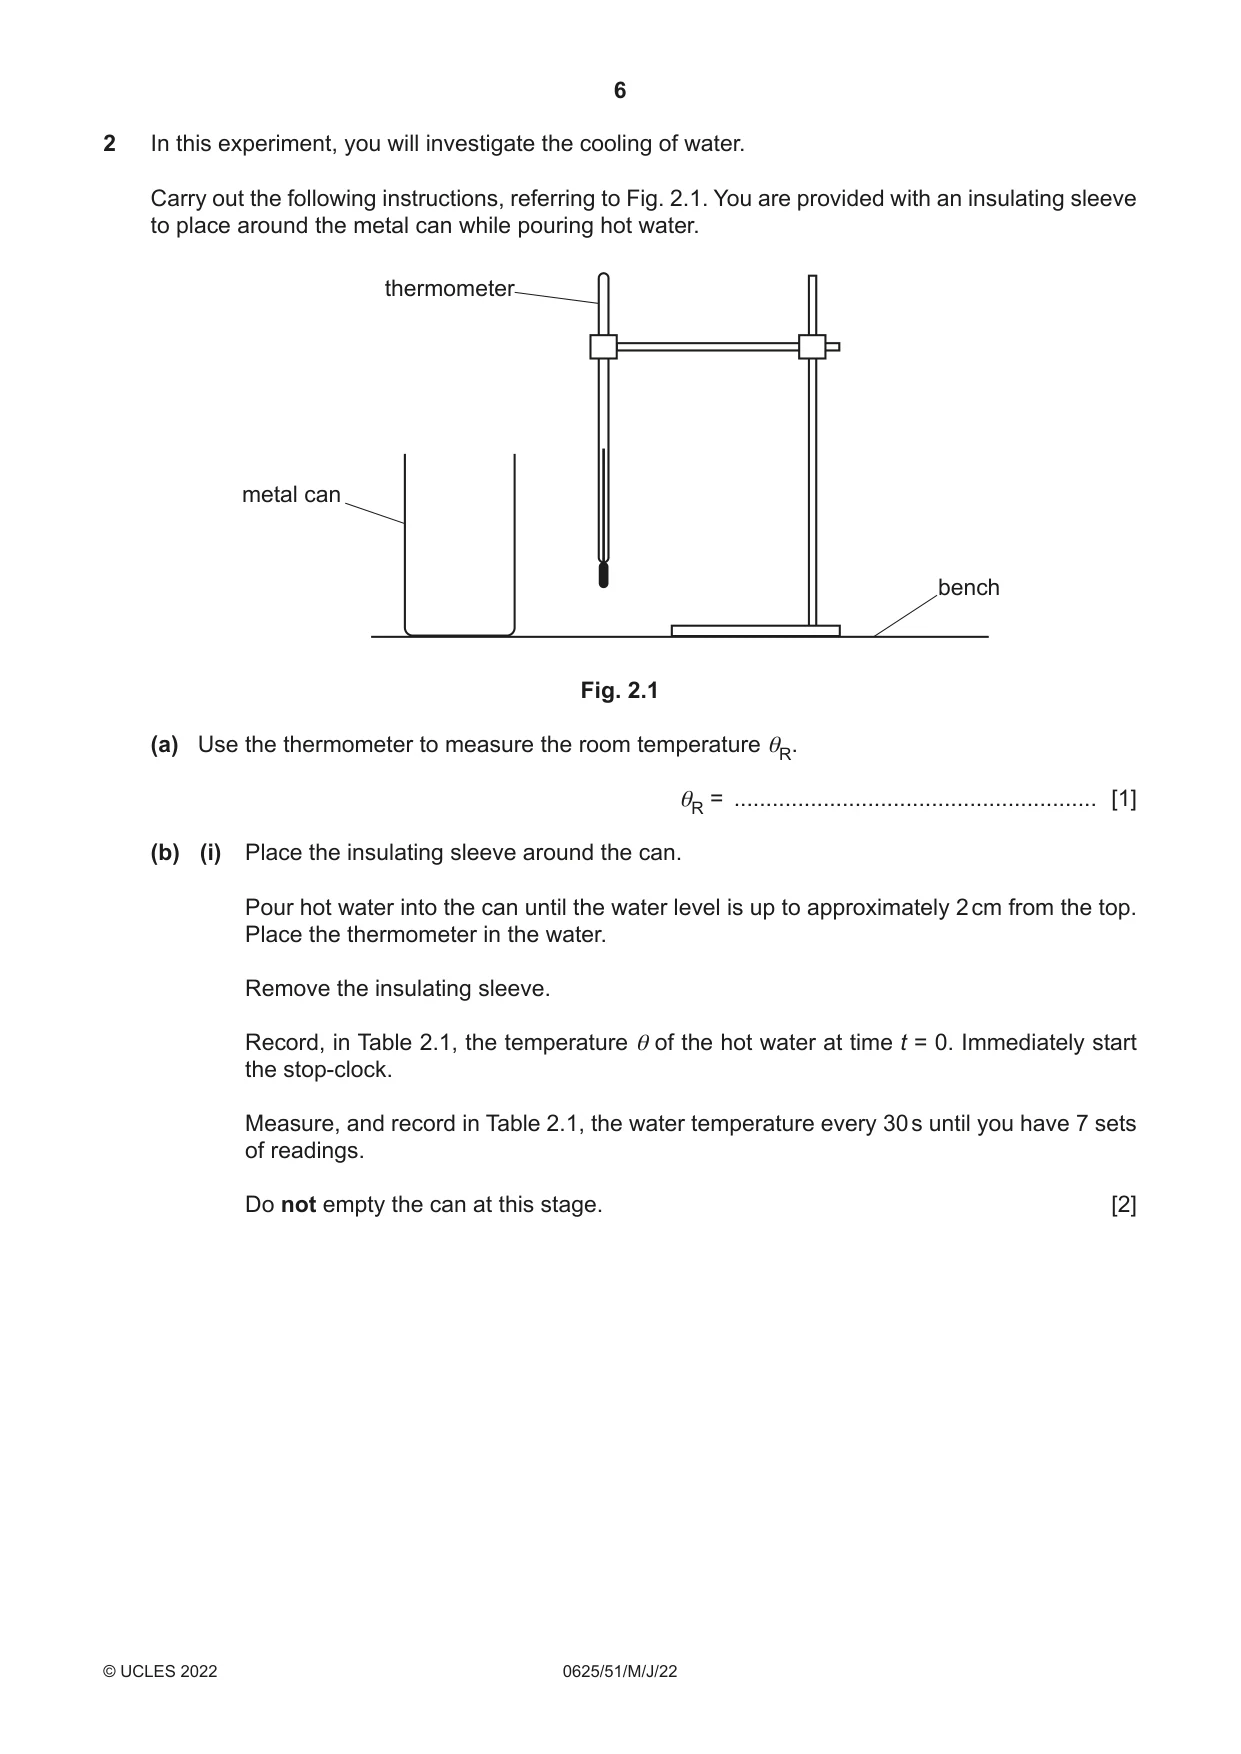
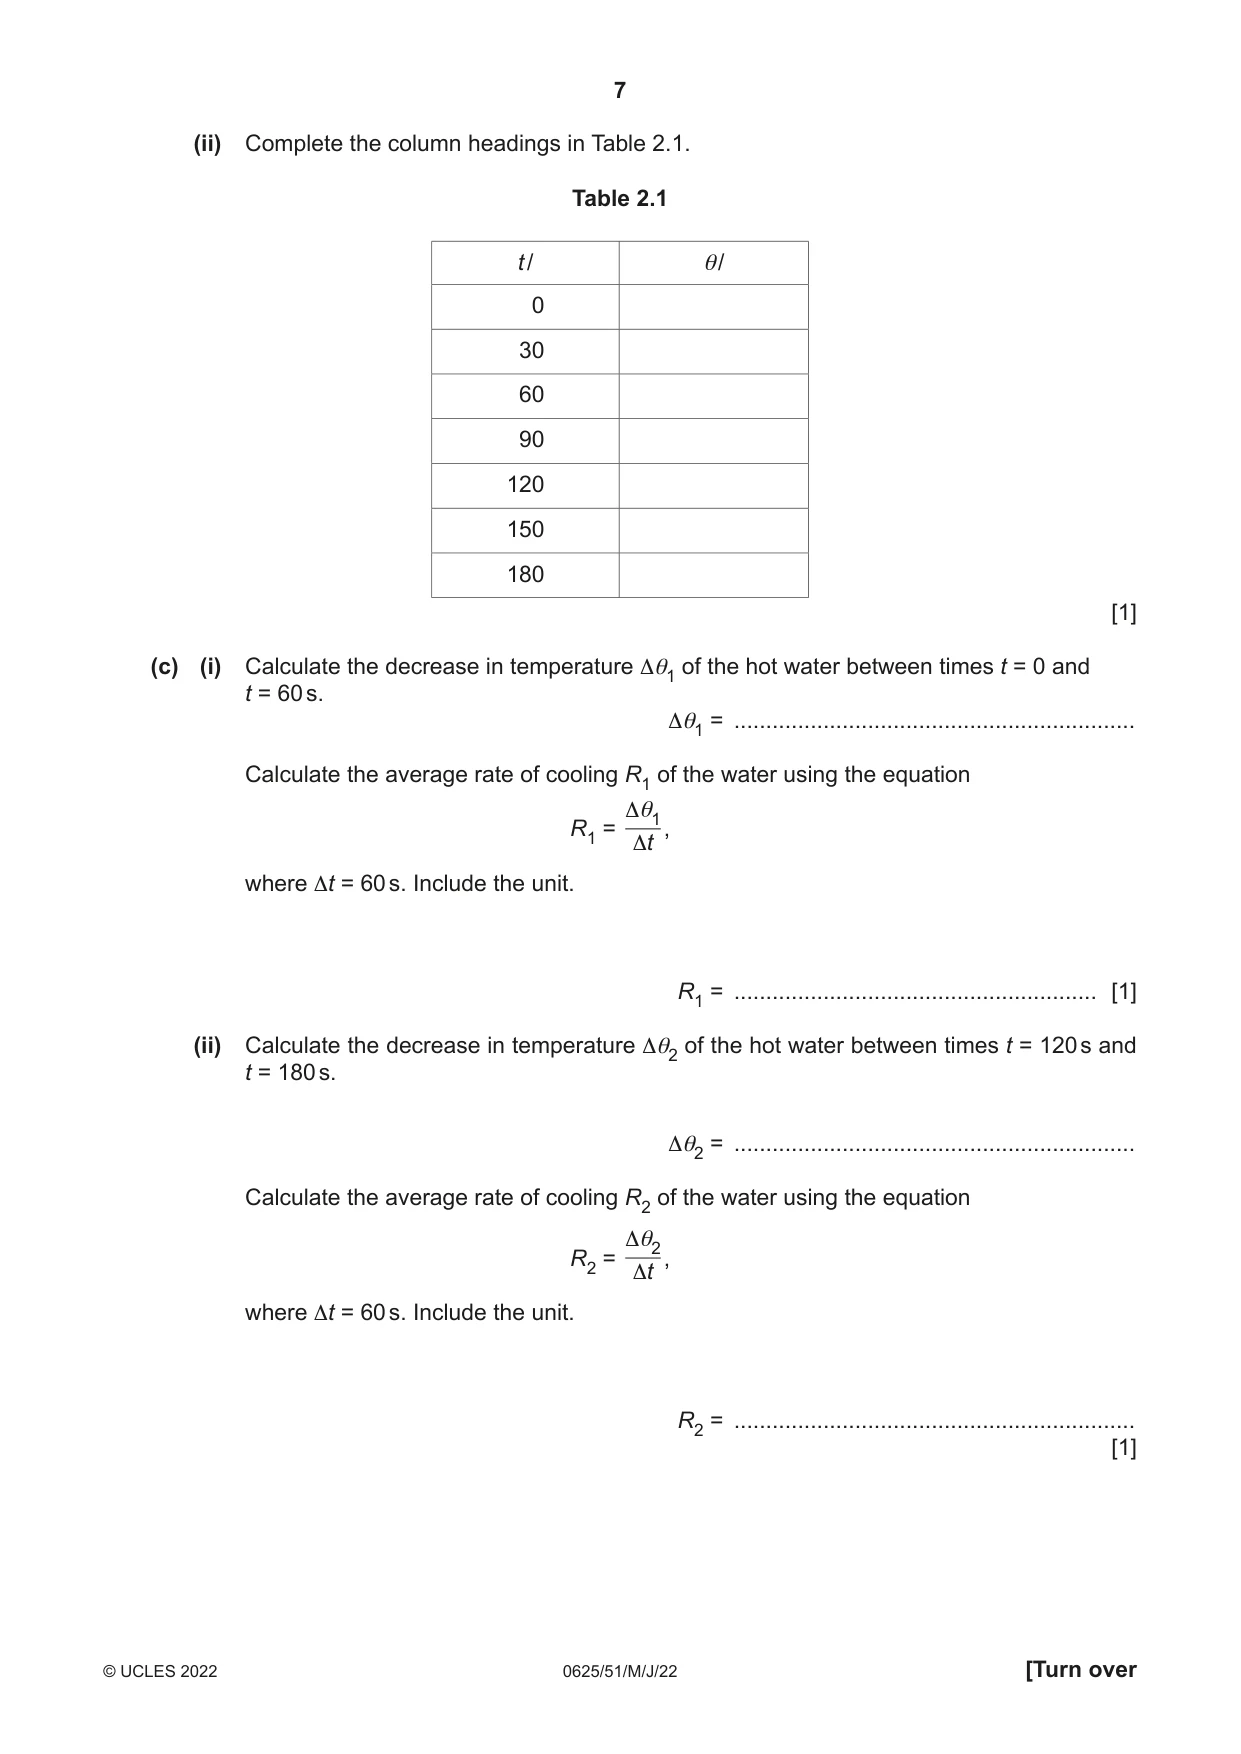
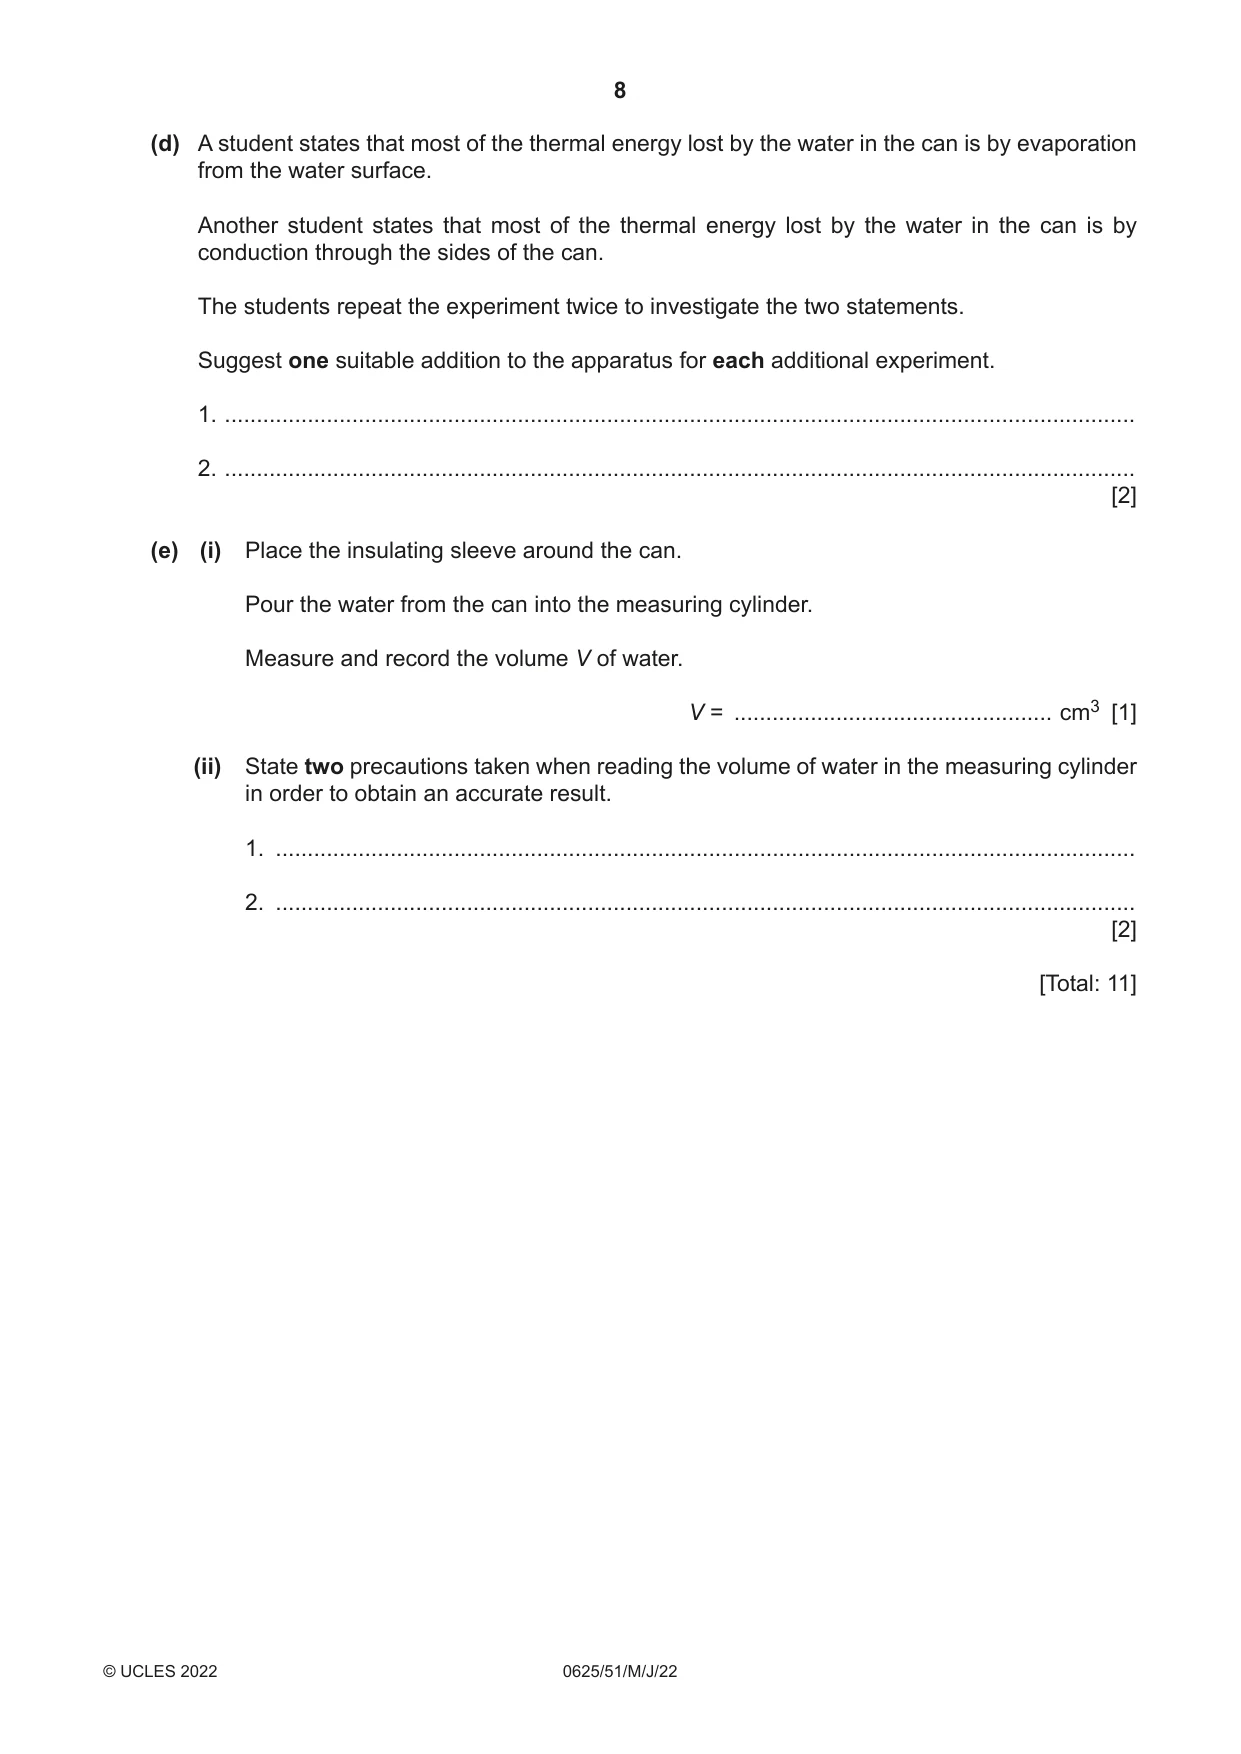
2 In this experiment, you will investigate the cooling of water. Carry out the following instructions, referring to Fig. 2.1. You are provided with an insulating sleeve to place around the metal can while pouring hot water. thermometer metal can bench Fig. 2.1 (a) Use the thermometer to measure the room temperature θR. θR = ......................................................... [1] (b) (i) Place the insulating sleeve around the can. Pour hot water into the can until the water level is up to approximately 2 cm from the top. Place the thermometer in the water. Remove the insulating sleeve. Record, in Table 2.1, the temperature θ of the hot water at time t = 0. Immediately start the stop-clock. Measure, and record in Table 2.1, the water temperature every 30 s until you have 7 sets of readings. Do not empty the can at this stage. [2] (ii) Complete the column headings in Table 2.1. Table 2.1 t / θ/ 0 30 60 90 120 150 180 [1] (c) (i) Calculate the decrease in temperature Δθ1 of the hot water between times t = 0 and t = 60 s. Δθ1 = ............................................................... Calculate the average rate of cooling R1 of the water using the equation Δθ1 R1 = , Δt where Δt = 60 s. Include the unit. R1 = ......................................................... [1] (ii) Calculate the decrease in temperature Δθ2 of the hot water between times t = 120 s and t = 180 s. Δθ2 = ............................................................... Calculate the average rate of cooling R2 of the water using the equation Δθ2 R2 = , Δt where Δt = 60 s. Include the unit. R2 = ............................................................... [1] (d) A student states that most of the thermal energy lost by the water in the can is by evaporation from the water surface. Another student states that most of the thermal energy lost by the water in the can is by conduction through the sides of the can. The students repeat the experiment twice to investigate the two statements. Suggest one suitable addition to the apparatus for each additional experiment. 1. ............................................................................................................................................... 2. ............................................................................................................................................... [2] (e) (i) Place the insulating sleeve around the can. Pour the water from the can into the measuring cylinder. Measure and record the volume V of water. V = .................................................. cm3 [1] (ii) State two precautions taken when reading the volume of water in the measuring cylinder in order to obtain an accurate result. 1. ....................................................................................................................................... 2. ....................................................................................................................................... [2] [Total: 11]
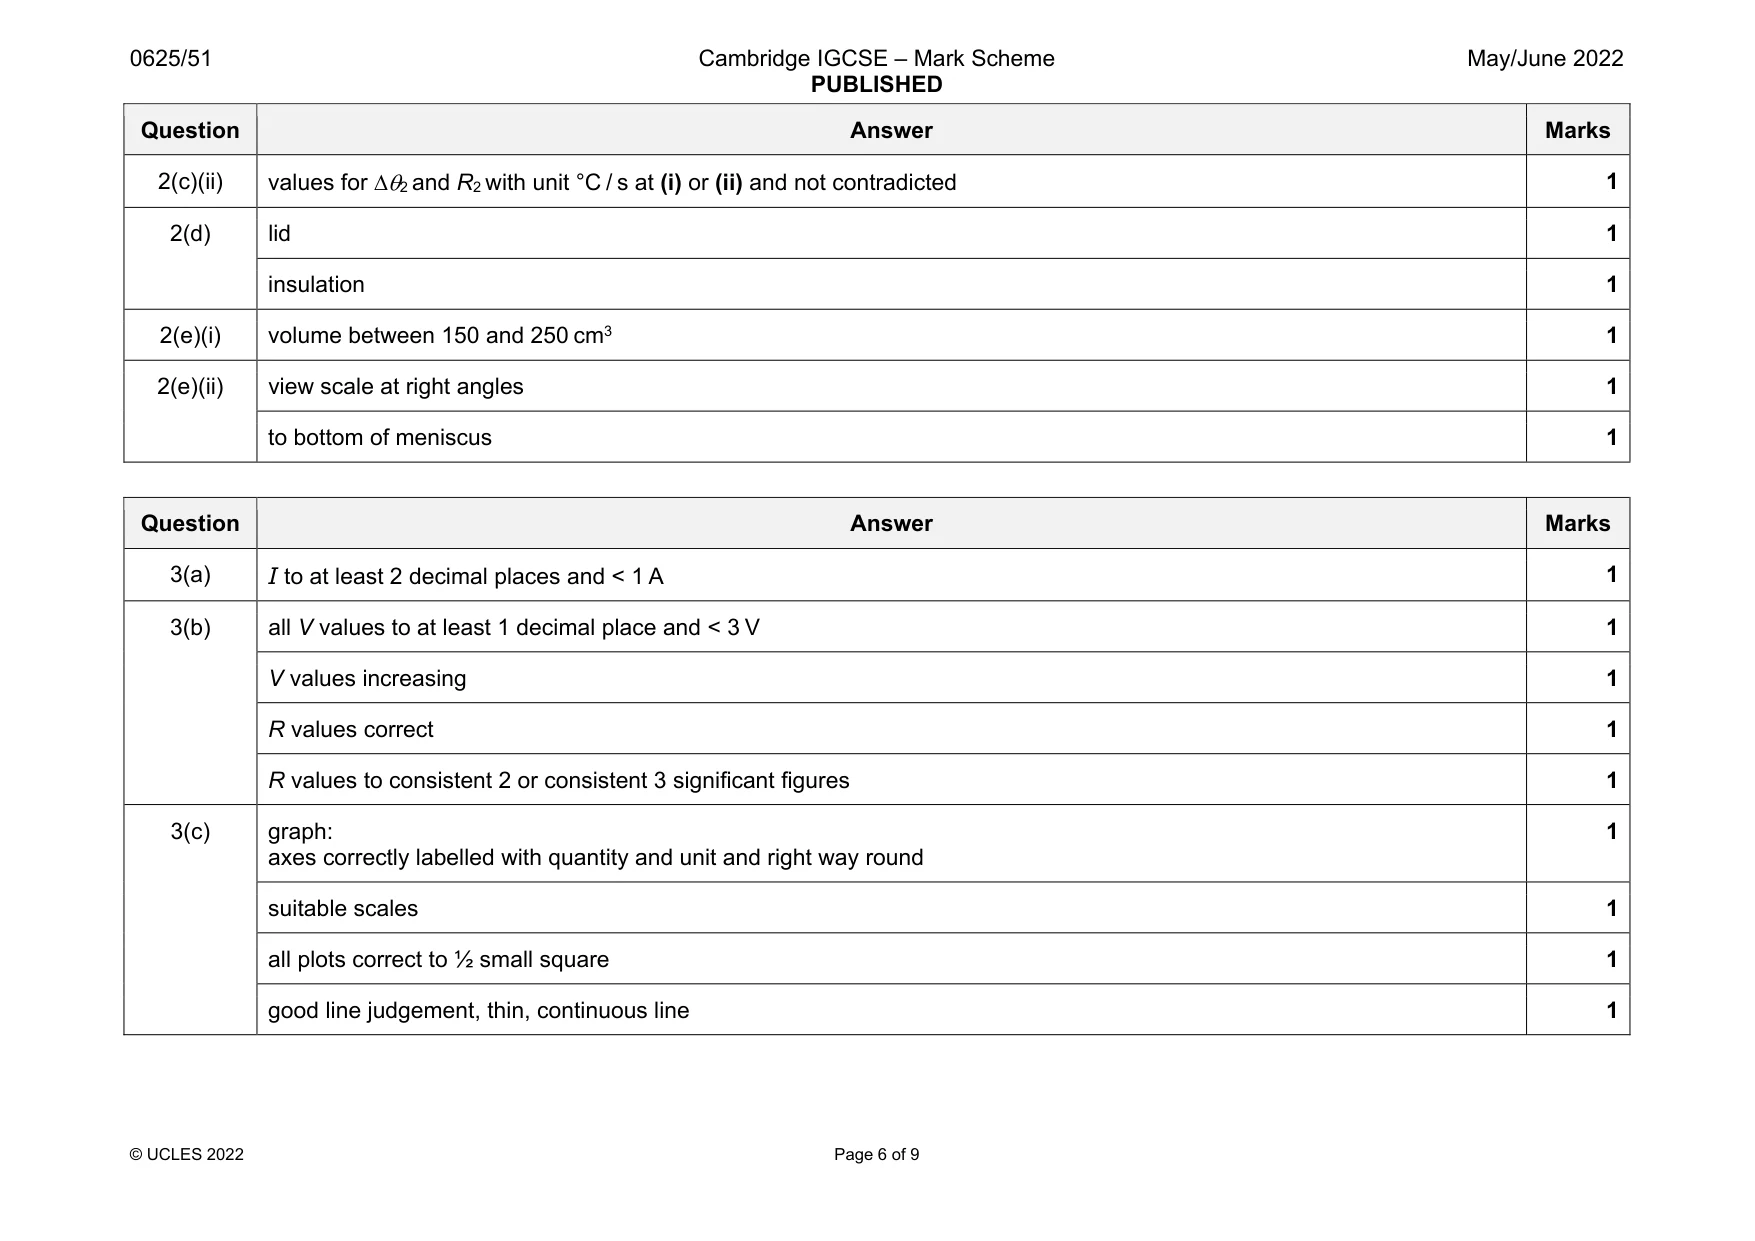
Mark scheme: 2(a) realistic value for room temperature (°C) 1 2(b)(i) temperatures decreasing 1 temperatures to 1 °C or better 1 2(b)(ii) s, °C 1 2(c)(i) correct values for 1 and R1 1 Question Answer Marks 2(c)(ii) values for 2 and R2 with unit °C / s at (i) or (ii) and not contradicted 1 2(d) lid 1 insulation 1 2(e)(i) volume between 150 and 250 cm3 1 2(e)(ii) view scale at right angles 1 to bottom of meniscus 1
Q3 · In this experiment, you will investigate the resistance of a wire
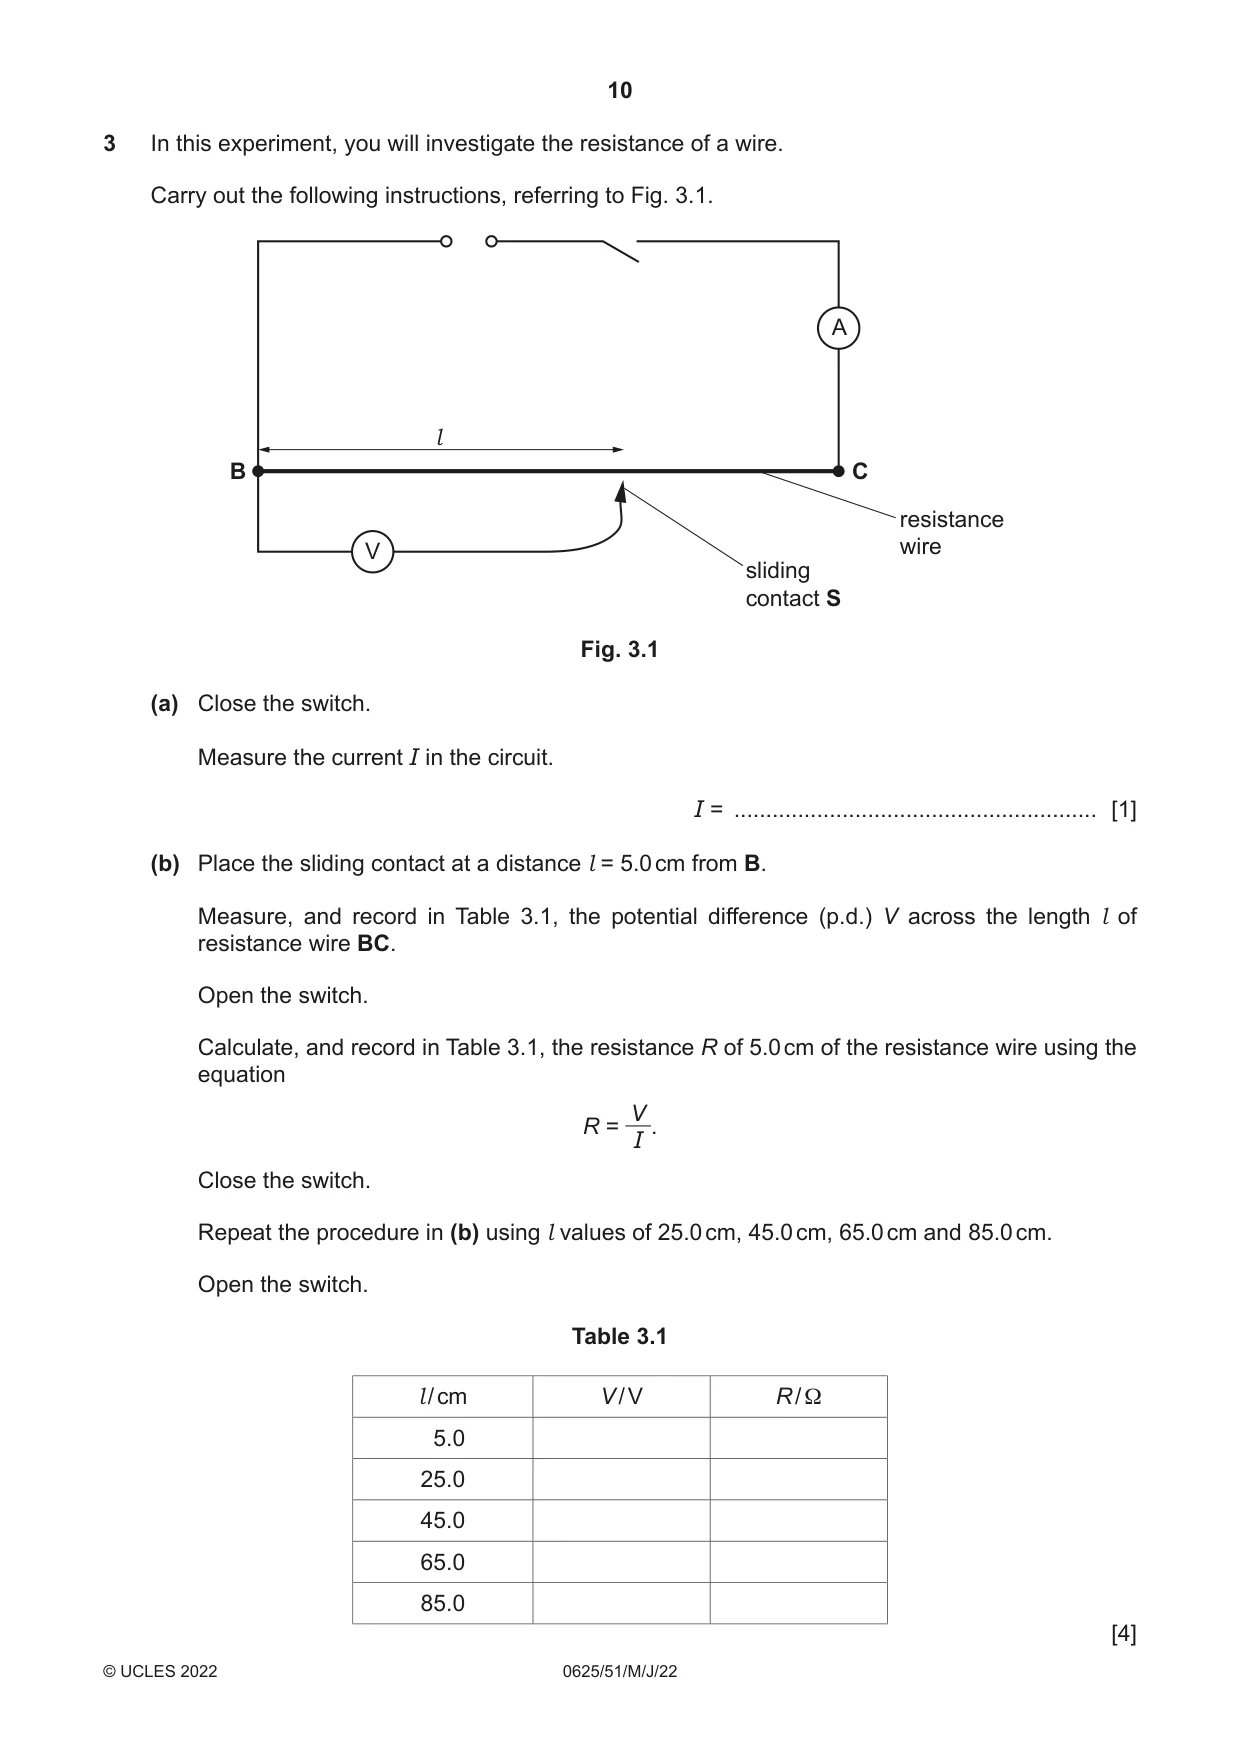
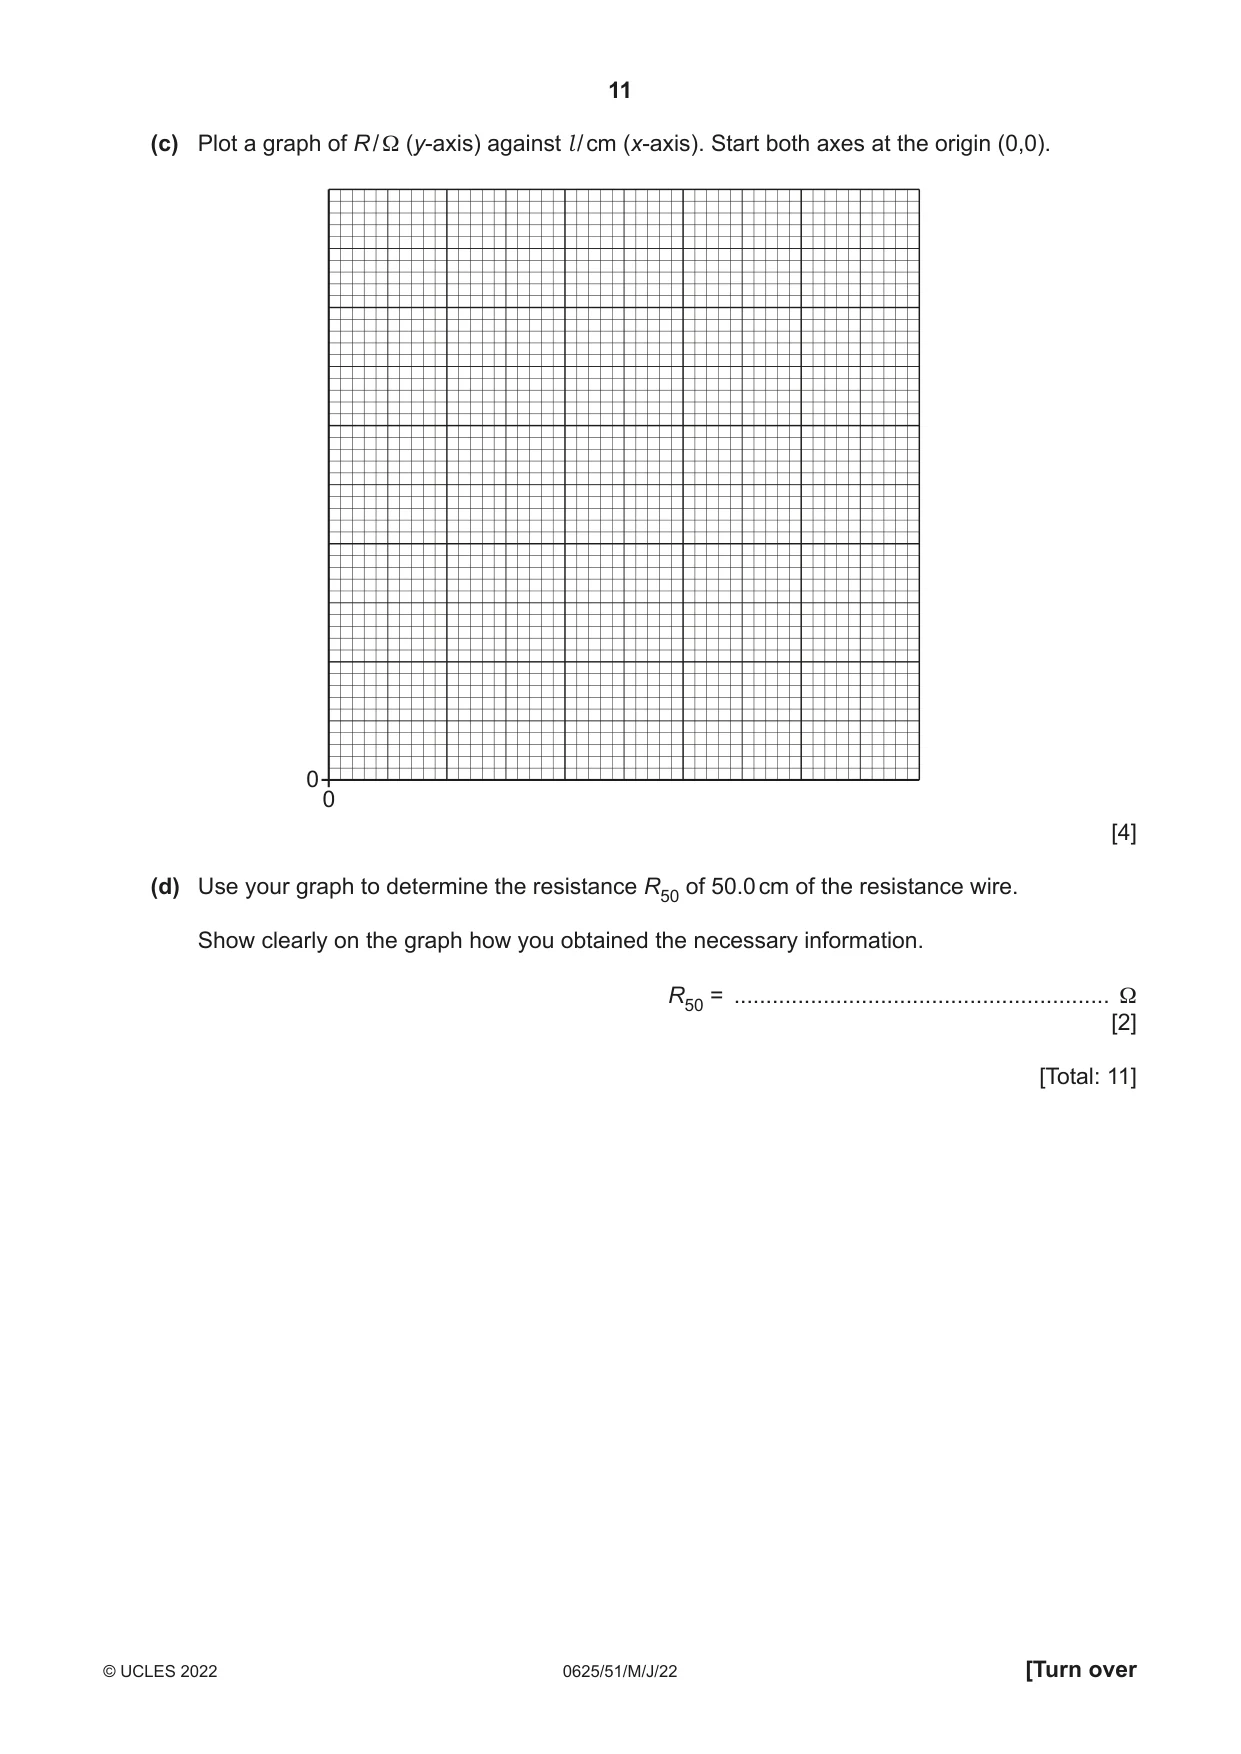
3 In this experiment, you will investigate the resistance of a wire. Carry out the following instructions, referring to Fig. 3.1. A l B C resistance V wire sliding contact S Fig. 3.1 (a) Close the switch. Measure the current I in the circuit. I = ......................................................... [1] (b) Place the sliding contact at a distance l = 5.0 cm from B. Measure, and record in Table 3.1, the potential difference (p.d.) V across the length l of resistance wire BC. Open the switch. Calculate, and record in Table 3.1, the resistance R of 5.0 cm of the resistance wire using the equation V R = . I Close the switch. Repeat the procedure in (b) using l values of 25.0 cm, 45.0 cm, 65.0 cm and 85.0 cm. Open the switch. Table 3.1 l / cm V / V R / Ω 5.0 25.0 45.0 65.0 85.0 [4] (c) Plot a graph of R / Ω (y-axis) against l / cm (x-axis). Start both axes at the origin (0,0). 0 0 [4] (d) Use your graph to determine the resistance R50 of 50.0 cm of the resistance wire. Show clearly on the graph how you obtained the necessary information. R50 = ........................................................... Ω [2] [Total: 11]
Mark scheme: 3(a) 3(b) all V values to at least 1 decimal place and < 3 V 1 V values increasing 1 R values correct 1 R values to consistent 2 or consistent 3 significant figures 1 3(c) graph: axes correctly labelled with quantity and unit and right way round 1 suitable scales 1 all plots correct to ½ small square 1 good line judgement, thin, continuous line 1 Question Answer Marks 3(d) method shown clearly on graph 1 R value correct to nearest ½ small square 1
Q4 · A student investigates the force required to break different beams made from a mixture of…
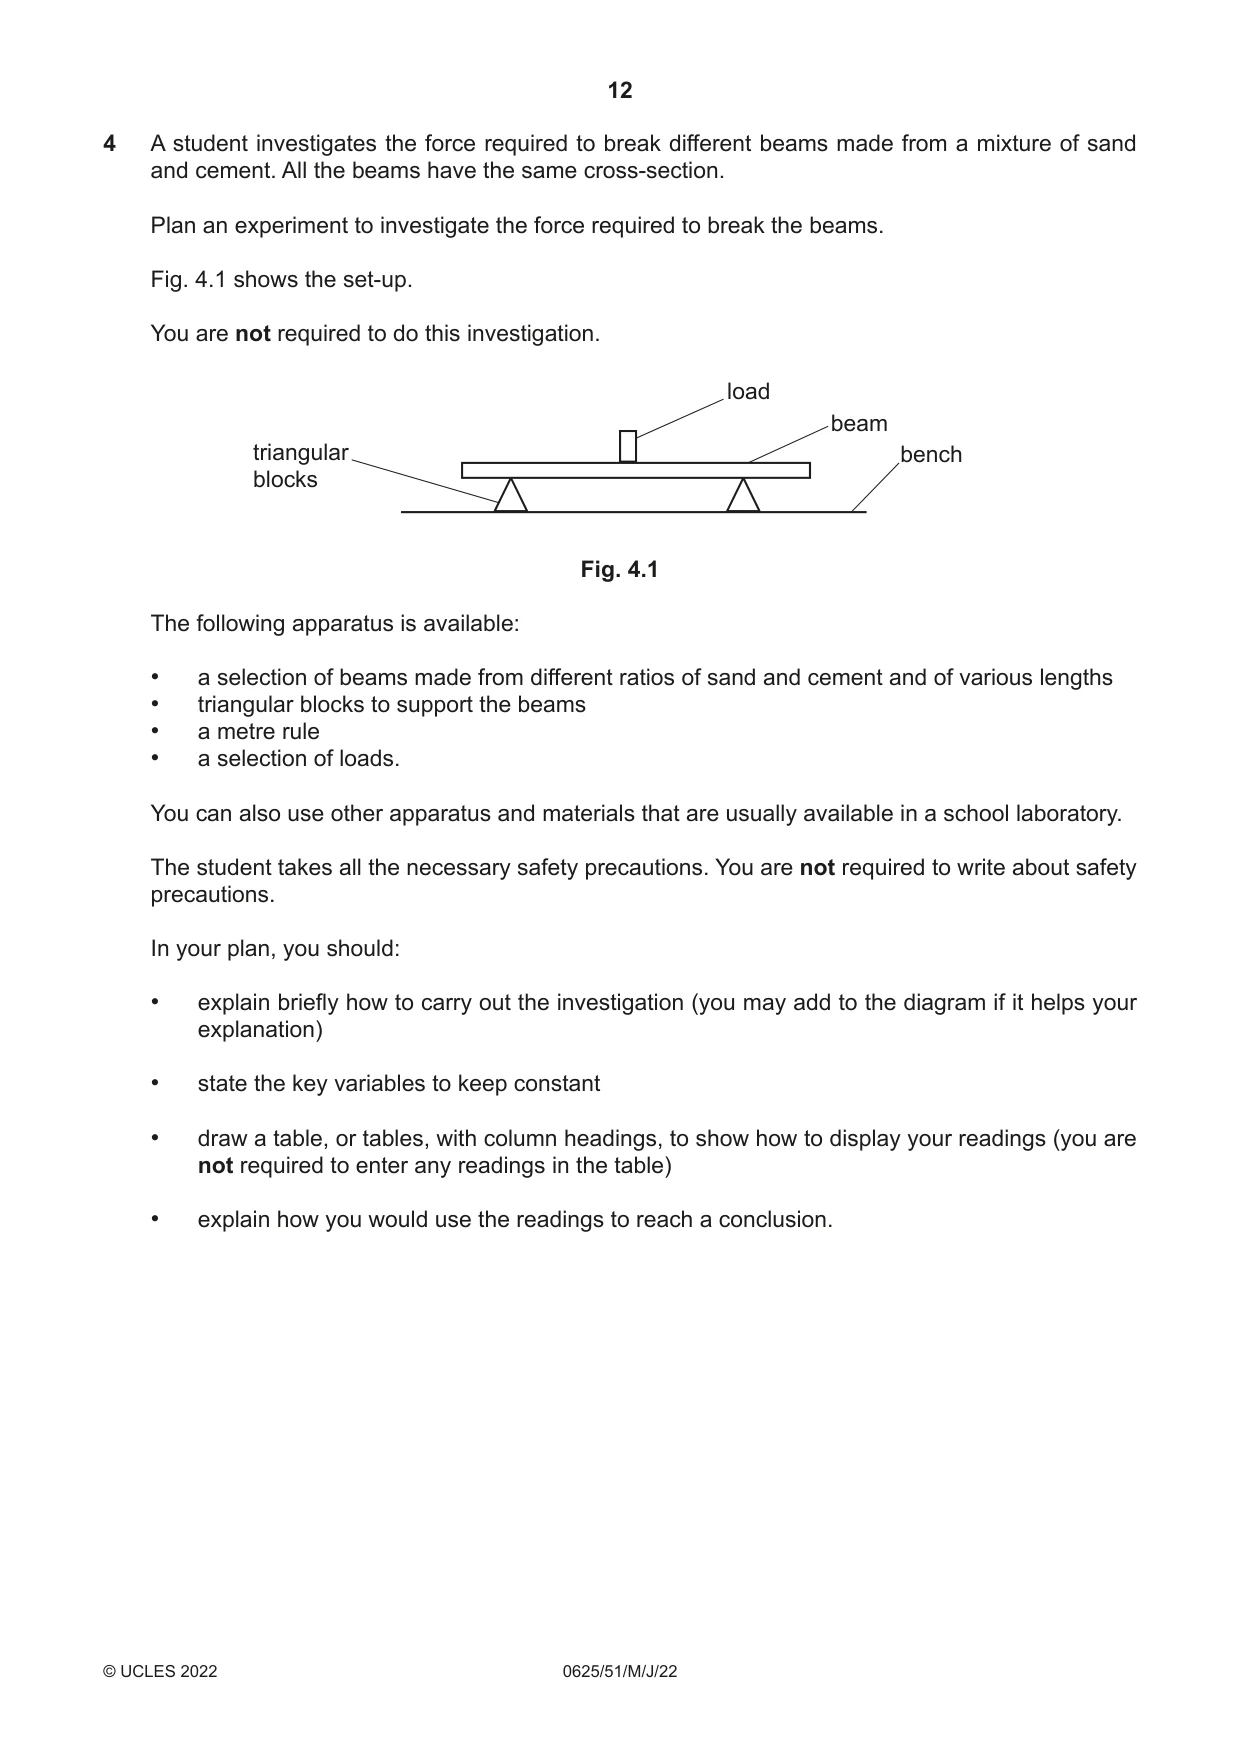
4 A student investigates the force required to break different beams made from a mixture of sand and cement. All the beams have the same cross-section. Plan an experiment to investigate the force required to break the beams. Fig. 4.1 shows the set-up. You are not required to do this investigation. load beam triangular bench blocks Fig. 4.1 The following apparatus is available: • a selection of beams made from different ratios of sand and cement and of various lengths • triangular blocks to support the beams • a metre rule • a selection of loads. You can also use other apparatus and materials that are usually available in a school laboratory. The student takes all the necessary safety precautions. You are not required to write about safety precautions. In your plan, you should: • explain briefly how to carry out the investigation (you may add to the diagram if it helps your explanation) • state the key variables to keep constant • draw a table, or tables, with column headings, to show how to display your readings (you are not required to enter any readings in the table) • explain how you would use the readings to reach a conclusion. .......................................................................................................................................................... .......................................................................................................................................................... .......................................................................................................................................................... .......................................................................................................................................................... .......................................................................................................................................................... .......................................................................................................................................................... .......................................................................................................................................................... .......................................................................................................................................................... .......................................................................................................................................................... .......................................................................................................................................................... .......................................................................................................................................................... .......................................................................................................................................................... .......................................................................................................................................................... .......................................................................................................................................................... .......................................................................................................................................................... .......................................................................................................................................................... .......................................................................................................................................................... .......................................................................................................................................................... .......................................................................................................................................................... .................................................................................................................................................... [7]
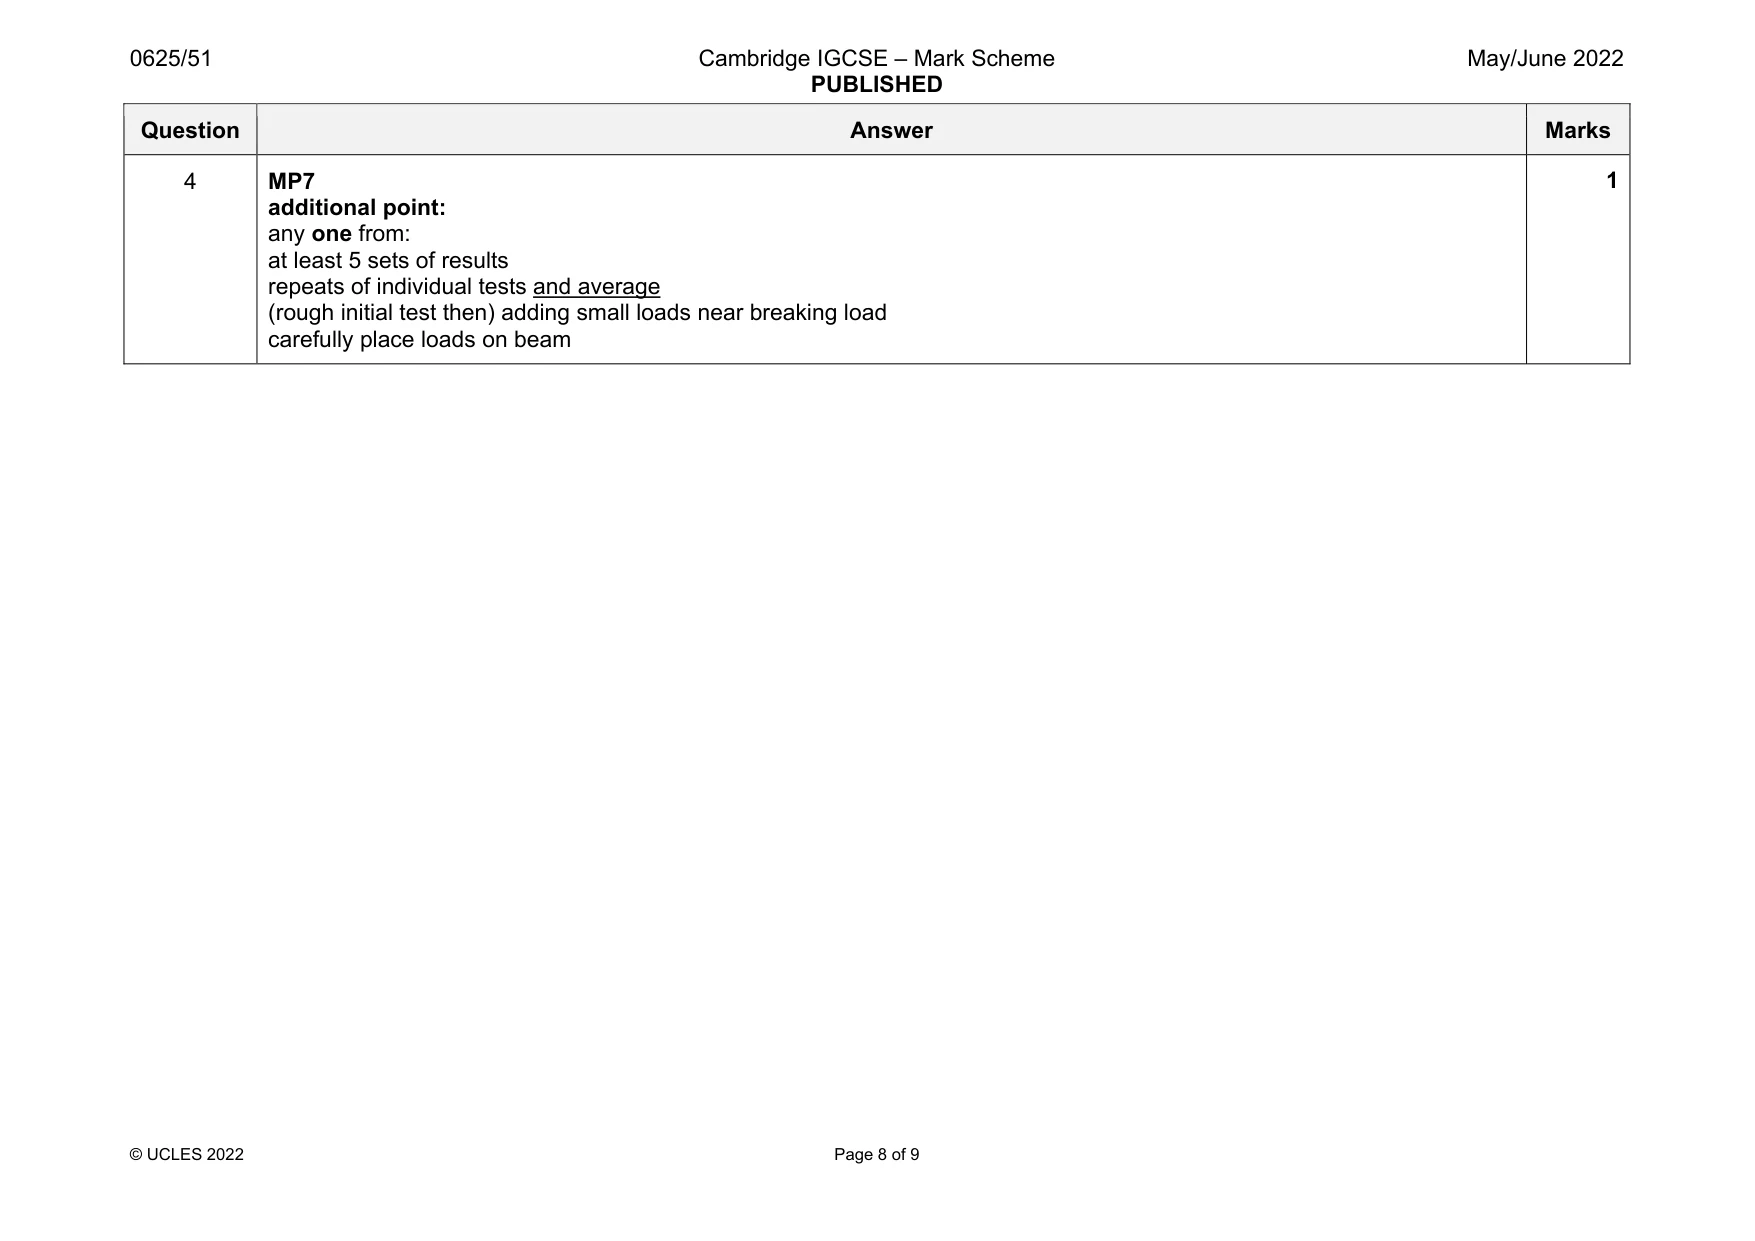
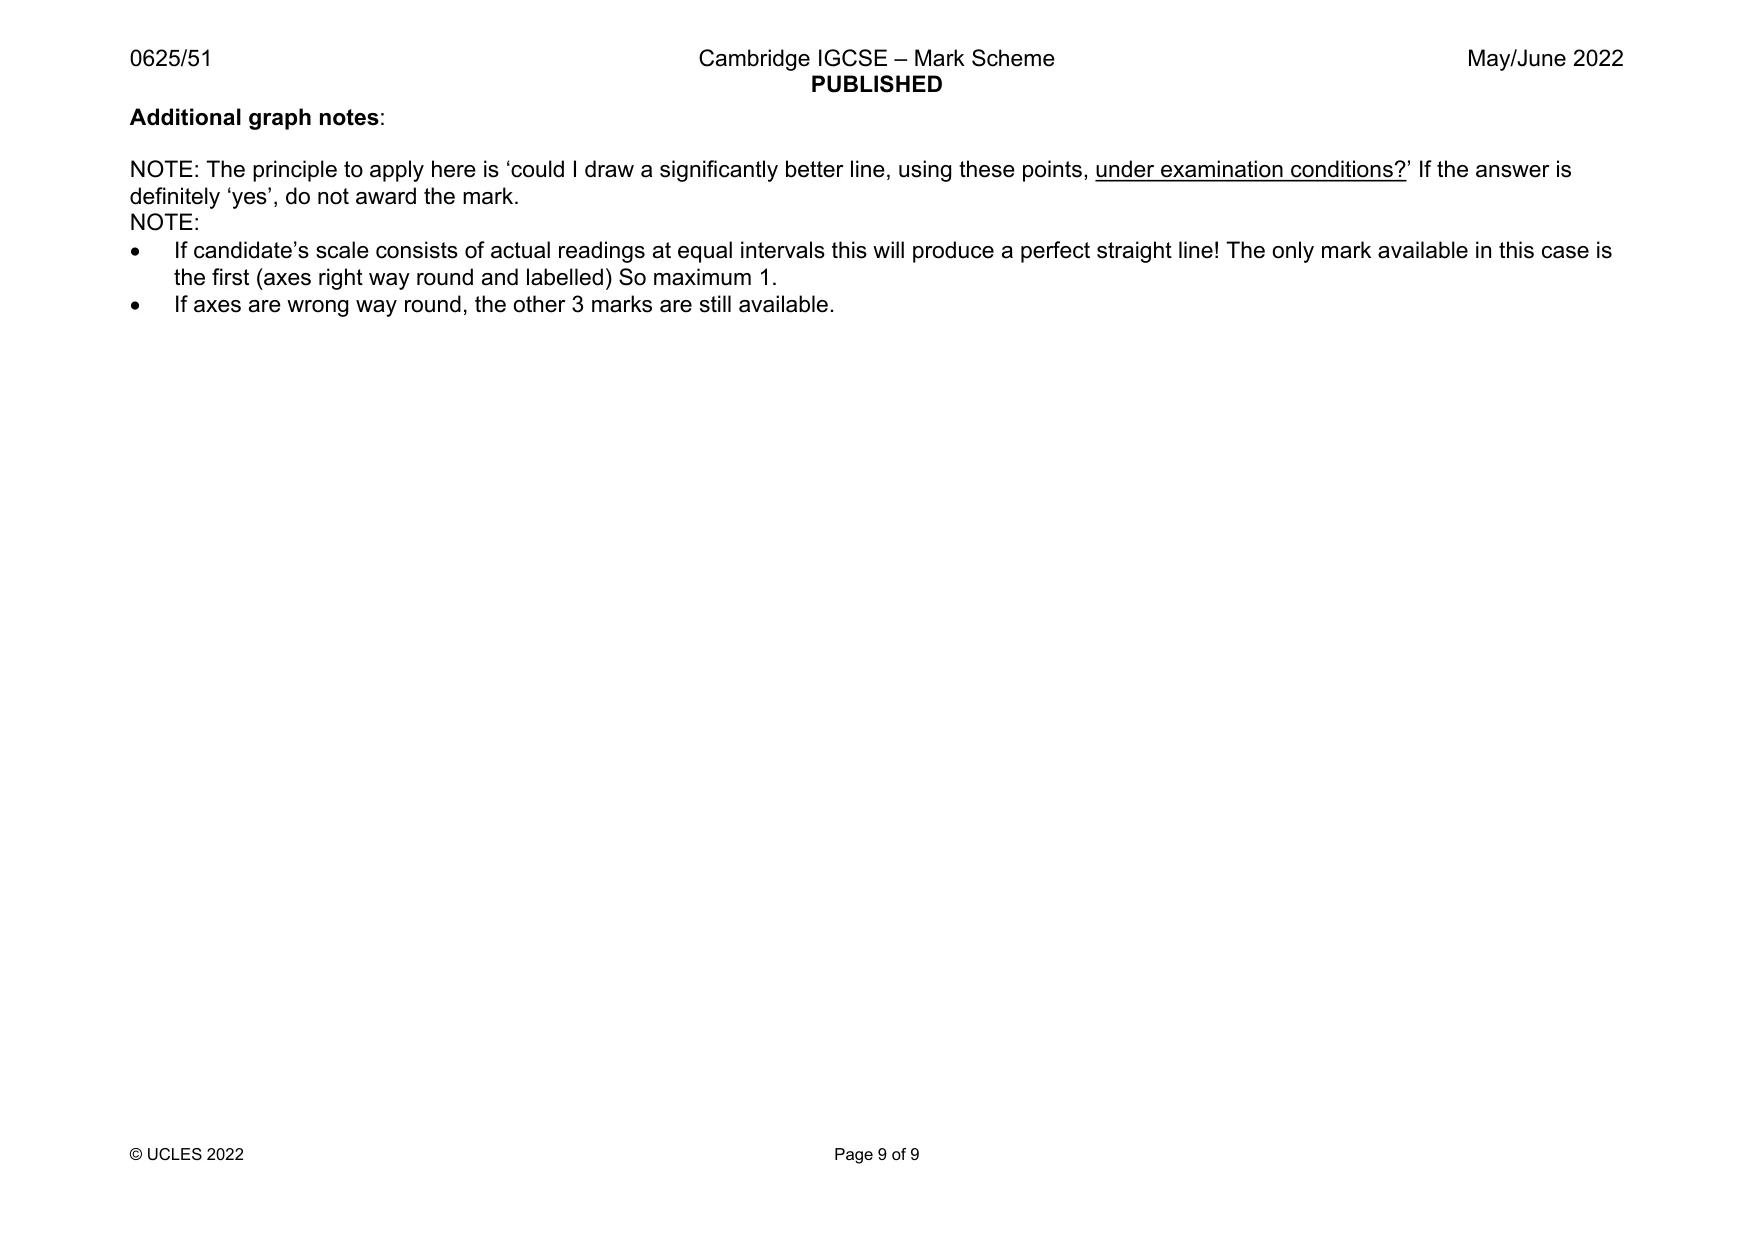
Mark scheme: 4 MP1 identify variable under test either distance between supports / length of beam OR composition of beam (proportion of sand / cement) 1 MP2 increase load until beam breaks (and record load) 1 MP3 repeat for (at least 2 more) different beams or (2 more) different lengths 1 MP4 constant variable identified (in relation to variable under test) distance between supports position of load composition of beam (if not independent variable) same length of beam (if not independent variable) 1 MP5 table with columns for distance / length or composition, and (maximum) load with units required for load and distance / length 1 MP6 conclusion compare breaking load with variable under test OR plot a graph of load against length 1 Question Answer Marks 4 MP7 additional point: any one from: at least 5 sets of results repeats of individual tests and average (rough initial test then) adding small loads near breaking load carefully place loads on beam 1 NOTE: The principle to apply here is ‘could I draw a significantly better line, using these points, under examination conditions?’ If the answer is definitely ‘yes’, do not award the mark. NOTE: If candidate’s scale consists of actual readings at equal intervals this will produce a perfect straight line! The only mark available in this case is the first (axes right way round and labelled) So maximum 1. If axes are wrong way round, the other 3 marks are still available.
What was in this paper
The subtopics covered by these 4 questions, and how many questions each got. Open one in a new tab to see every Cambridge question on it.
What you needed in this session
Cambridge’s own grade thresholds for 2022 May/June, Paper 5 · Variant 1. A higher threshold means an easier paper — the bar moves with how the cohort did.