Cambridge IGCSE Physics 0625 — 2020 Oct/Nov Paper 5 · Variant 1
0625/51/O/N/20 · 4 questions · 40 marks · ≈45 min
The question paper and its mark scheme, free to read here and free to download. This is Cambridge’s own paper, exactly as it was sat.
Question paper12 pages
Mark scheme8 pages
Answers below. Sit the paper first if you are practising.
Questions as text
Q1 · In this experiment, you will determine the density of modelling clay by two methods
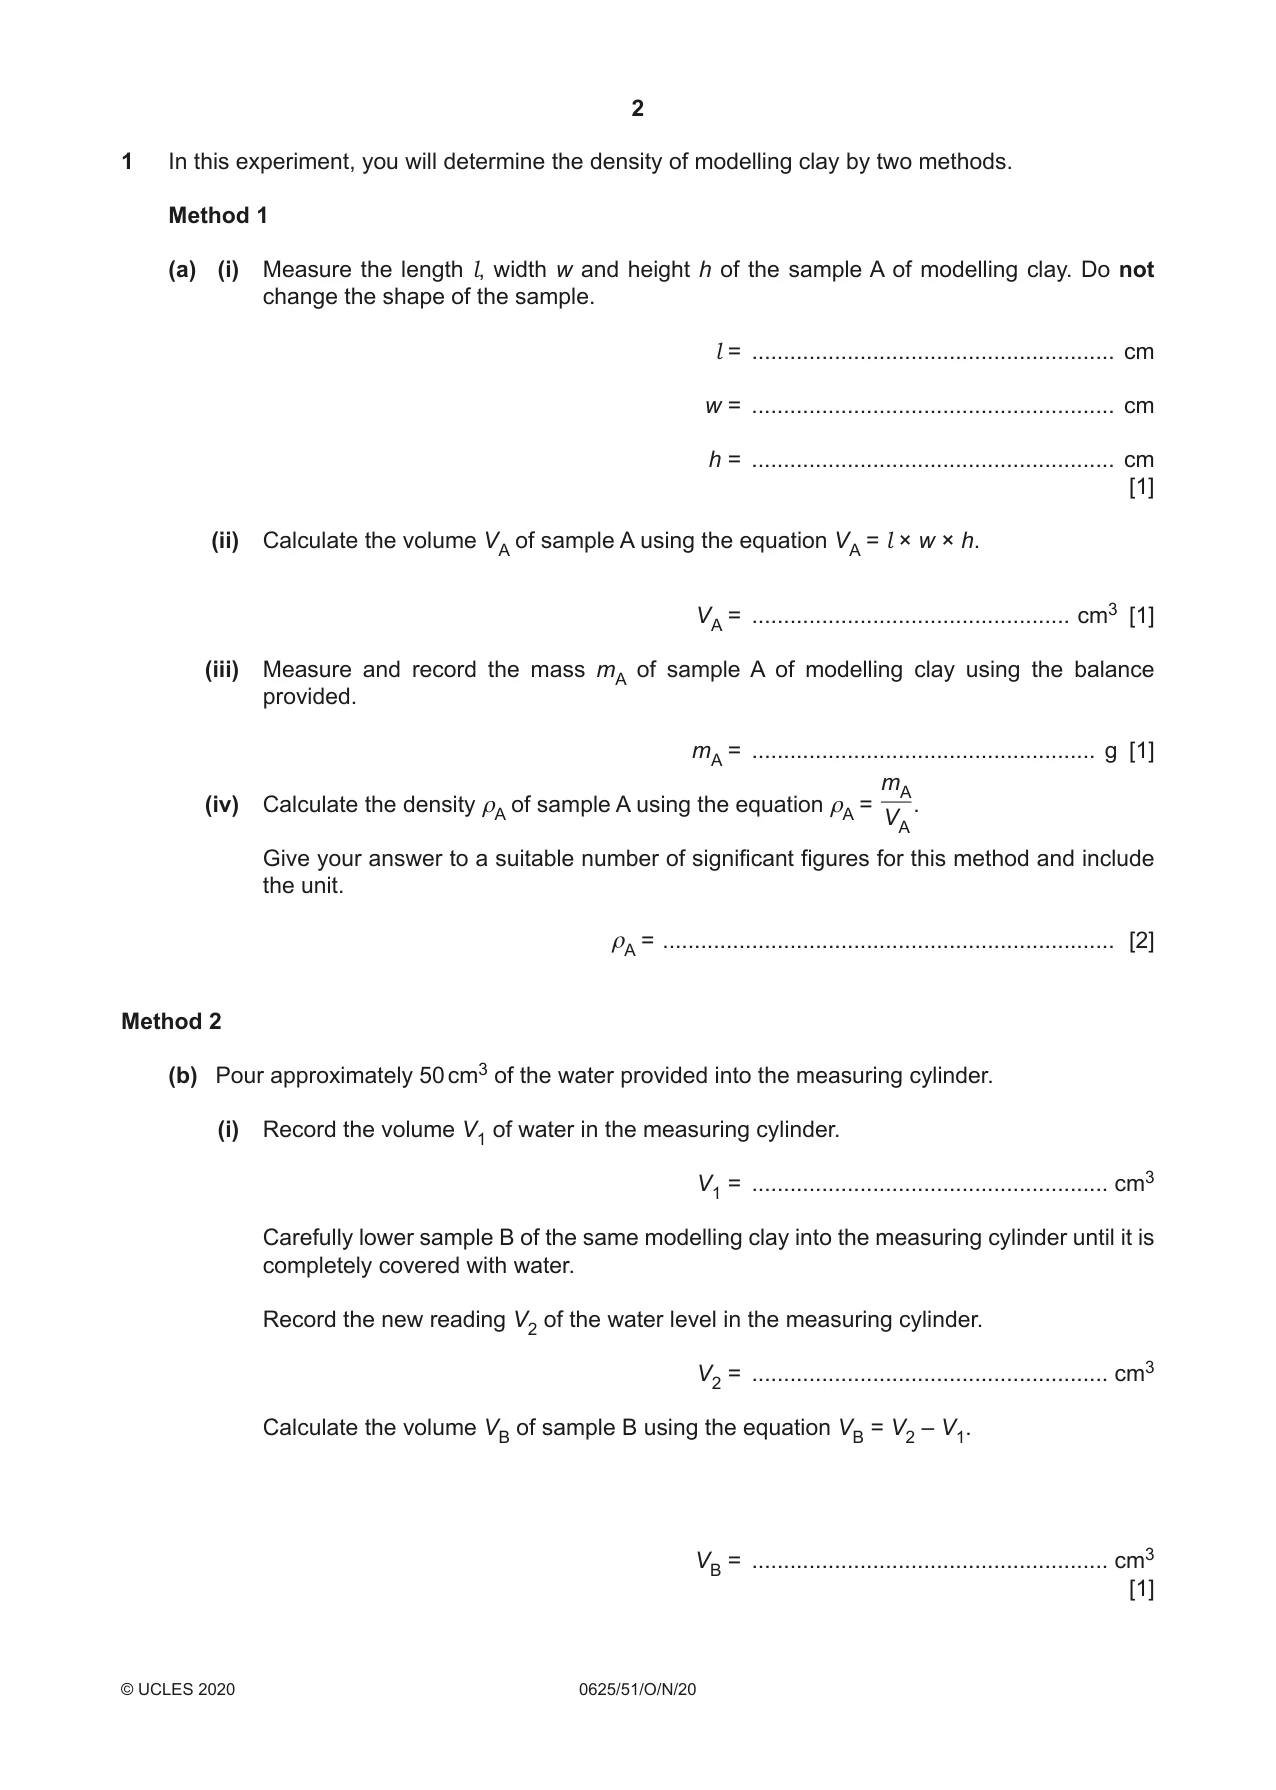
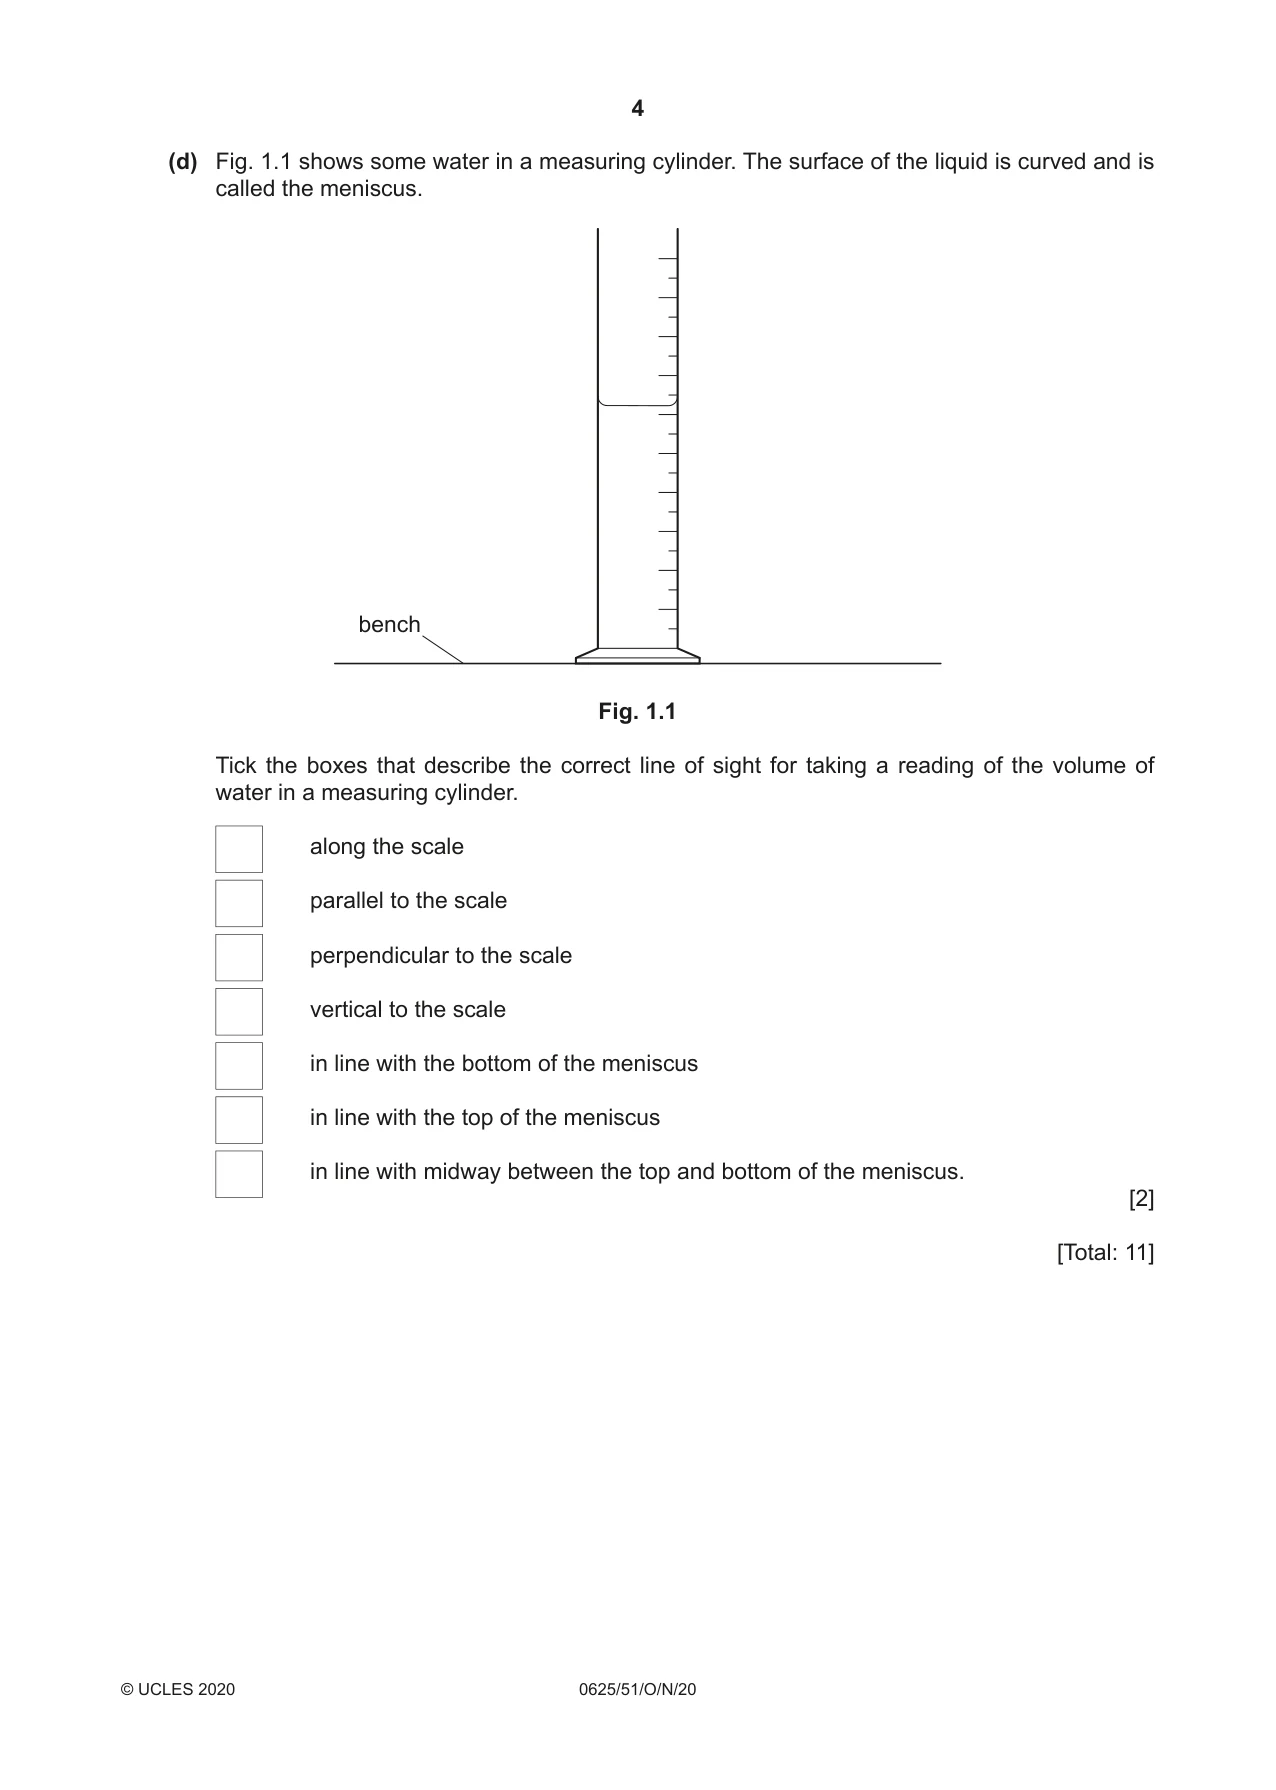
1 In this experiment, you will determine the density of modelling clay by two methods. Method 1 (a) (i) Measure the length l, width w and height h of the sample A of modelling clay. Do not change the shape of the sample. l = ......................................................... cm w = ......................................................... cm h = ......................................................... cm [1] (ii) Calculate the volume VA of sample A using the equation VA = l × w × h. VA = .................................................. cm3 [1] (iii) Measure and record the mass mA of sample A of modelling clay using the balance provided. mA = ...................................................... g [1] mA (iv) Calculate the density ρA of sample A using the equation ρA = . VA Give your answer to a suitable number of significant figures for this method and include the unit. ρA = ....................................................................... [2] Method 2 (b) Pour approximately 50 cm3 of the water provided into the measuring cylinder. (i) Record the volume V1 of water in the measuring cylinder. V1 = ........................................................ cm3 Carefully lower sample B of the same modelling clay into the measuring cylinder until it is completely covered with water. Record the new reading V2 of the water level in the measuring cylinder. V2 = ........................................................ cm3 Calculate the volume VB of sample B using the equation VB = V2 – V1. VB = ........................................................ cm3 [1] (ii) Measure and record the mass mB of sample B of measuring clay using the balance provided. mB = ............................................................ g mB Calculate the density ρB of sample B using the equation ρB = . VB Give your answer to a suitable number of significant figures for this experiment and include the unit. ρB = ............................................................... [1] (c) A student suggests that the density of modelling clay is not affected by either the mass or the volume of the sample used. State whether your results agree with the suggestion. Justify your answer by reference to your results. statement .................................................................................................................................. justification ................................................................................................................................ ................................................................................................................................................... [2] (d) Fig. 1.1 shows some water in a measuring cylinder. The surface of the liquid is curved and is called the meniscus. bench Fig. 1.1 Tick the boxes that describe the correct line of sight for taking a reading of the volume of water in a measuring cylinder. along the scale parallel to the scale perpendicular to the scale vertical to the scale in line with the bottom of the meniscus in line with the top of the meniscus in line with midway between the top and bottom of the meniscus. [2] [Total: 11]
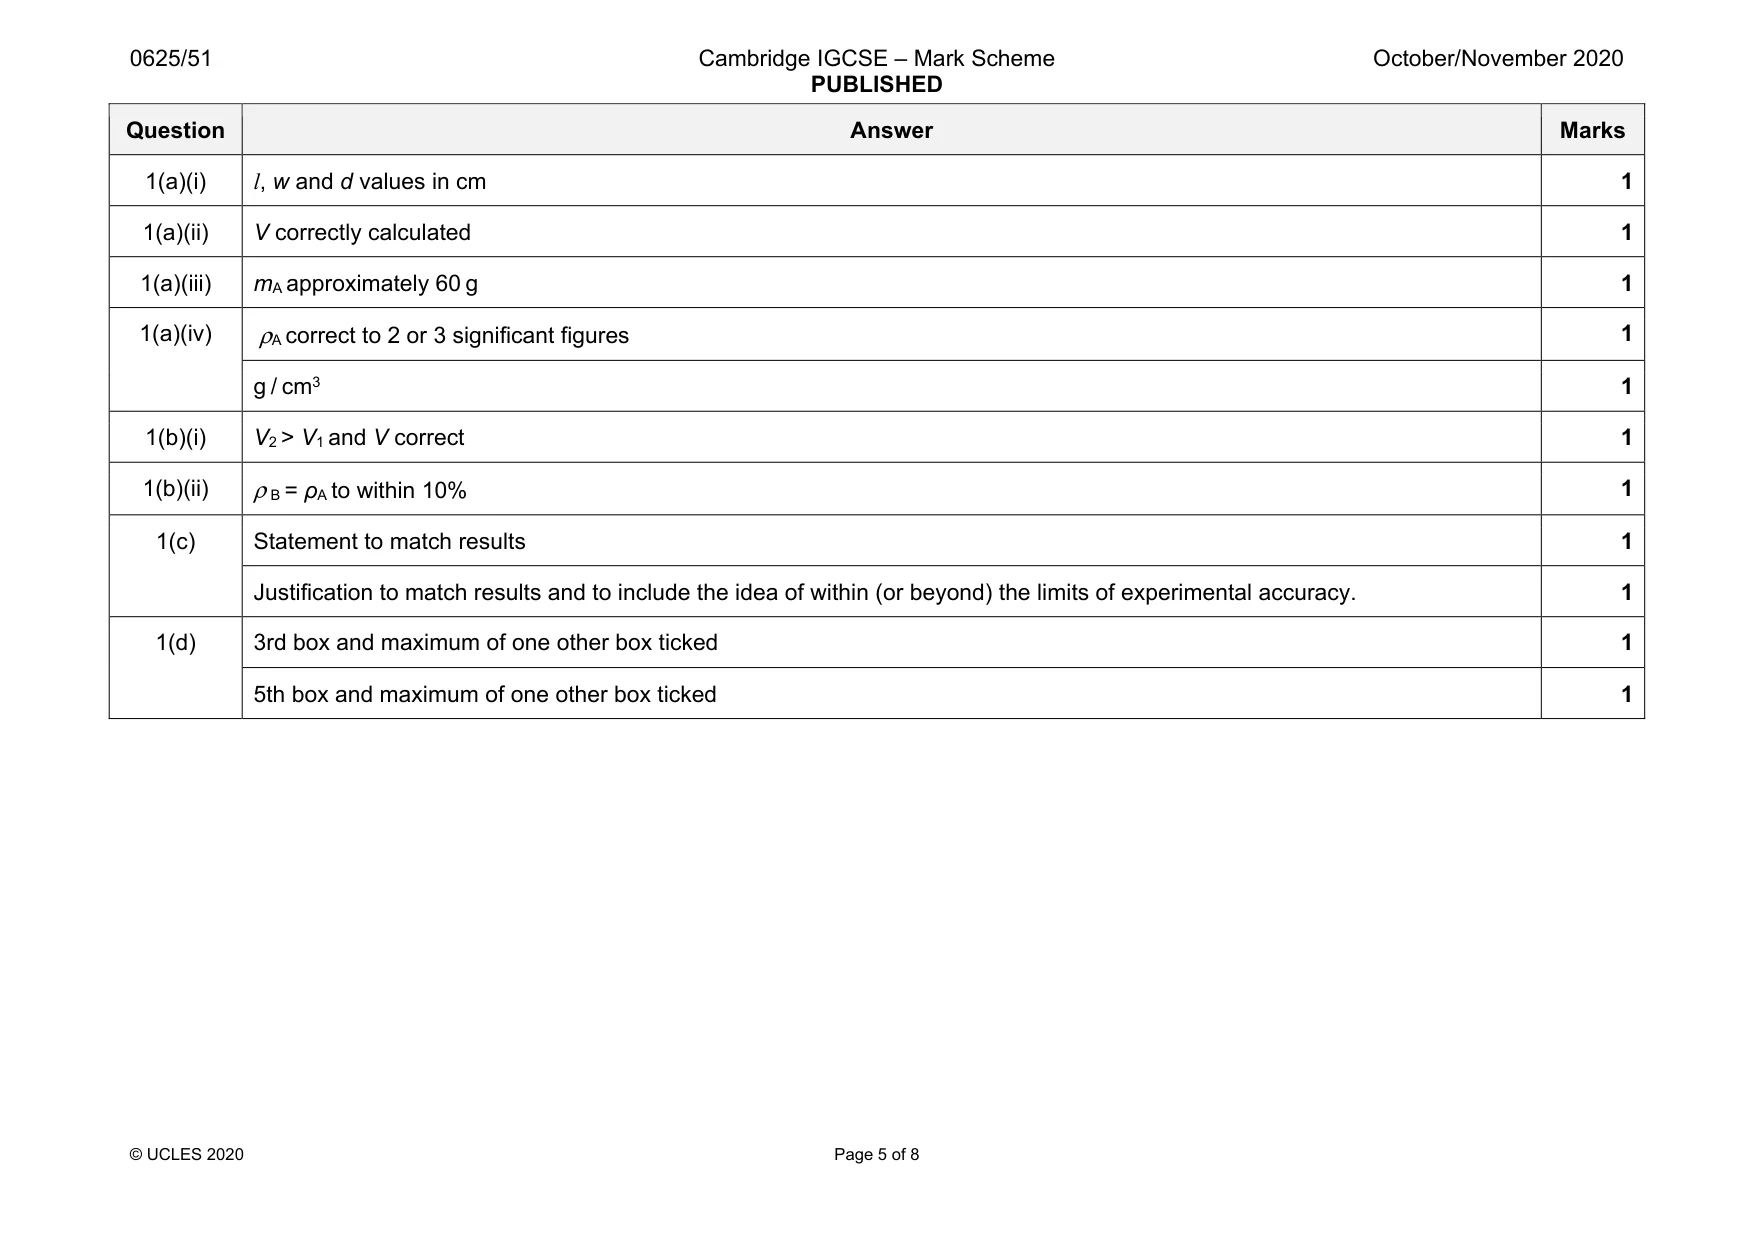
Mark scheme: 1(a)(i) l, w and d values in cm 1 1(a)(ii) V correctly calculated 1 1(a)(iii) mA approximately 60 g 1 1(a)(iv) ρA correct to 2 or 3 significant figures 1 g / cm3 1 1(b)(i) V2 > V1 and V correct 1 1(b)(ii) ρ B = ρA to within 10% 1 1(c) Statement to match results 1 Justification to match results and to include the idea of within (or beyond) the limits of experimental accuracy. 1 1(d) 3rd box and maximum of one other box ticked 1 5th box and maximum of one other box ticked 1
Q2 · In this experiment, you will investigate the cooling of water under different conditions
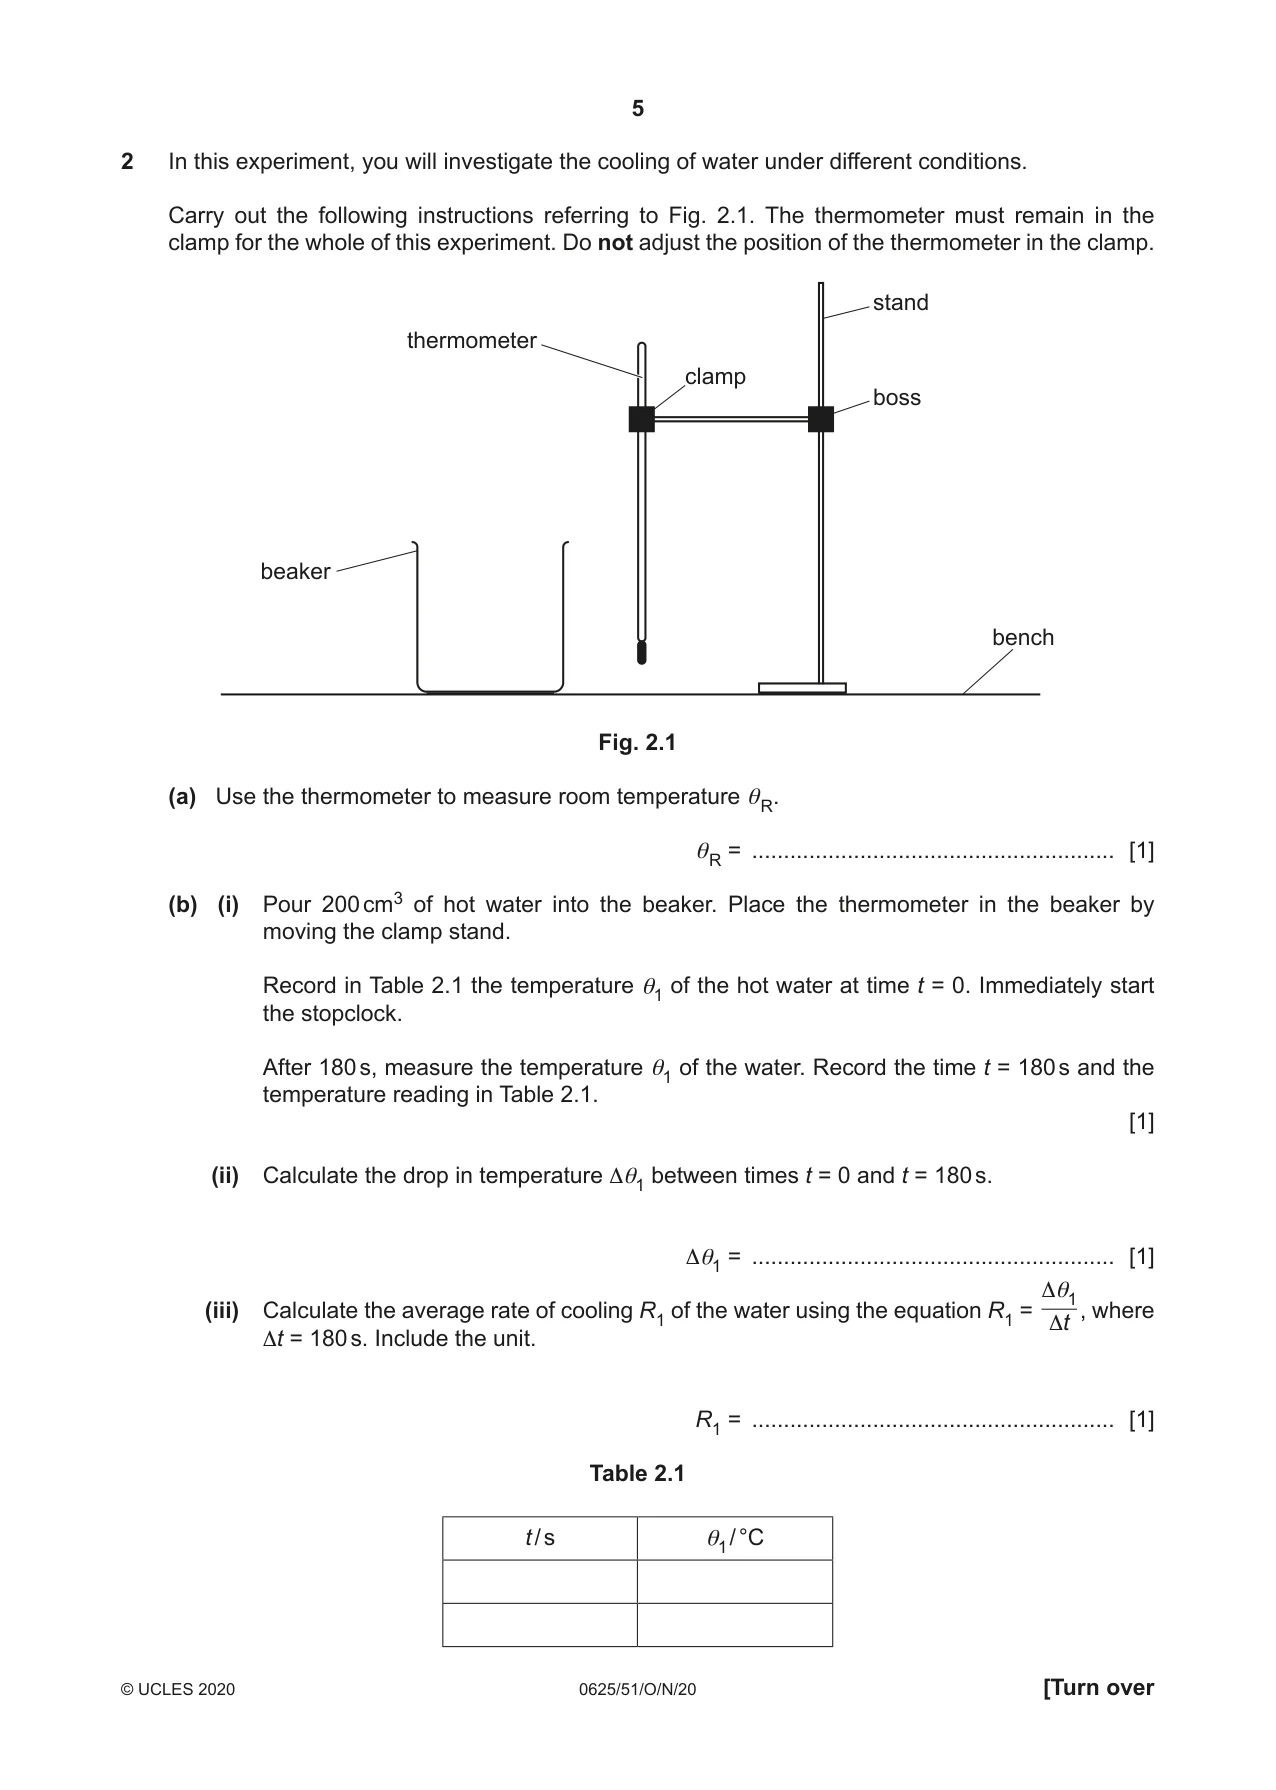
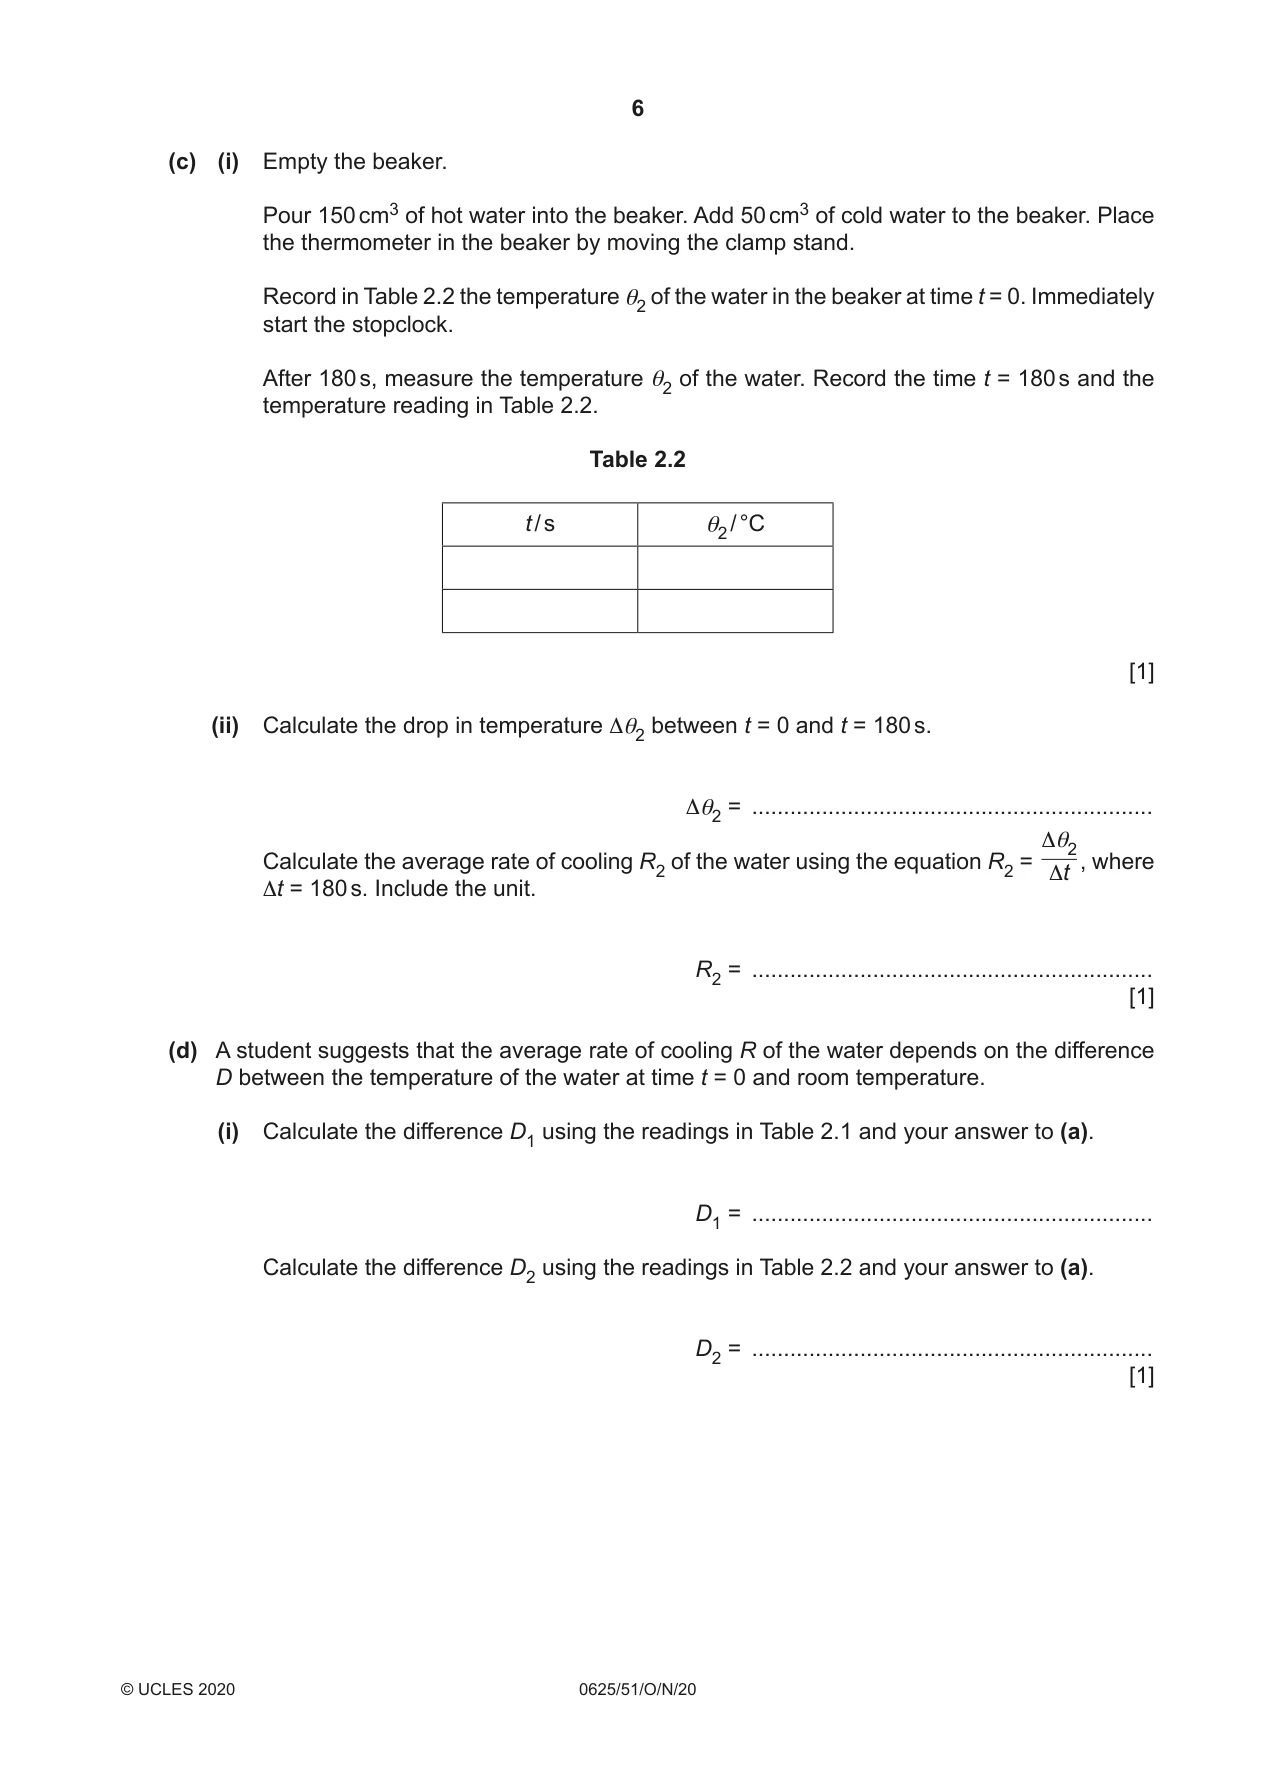
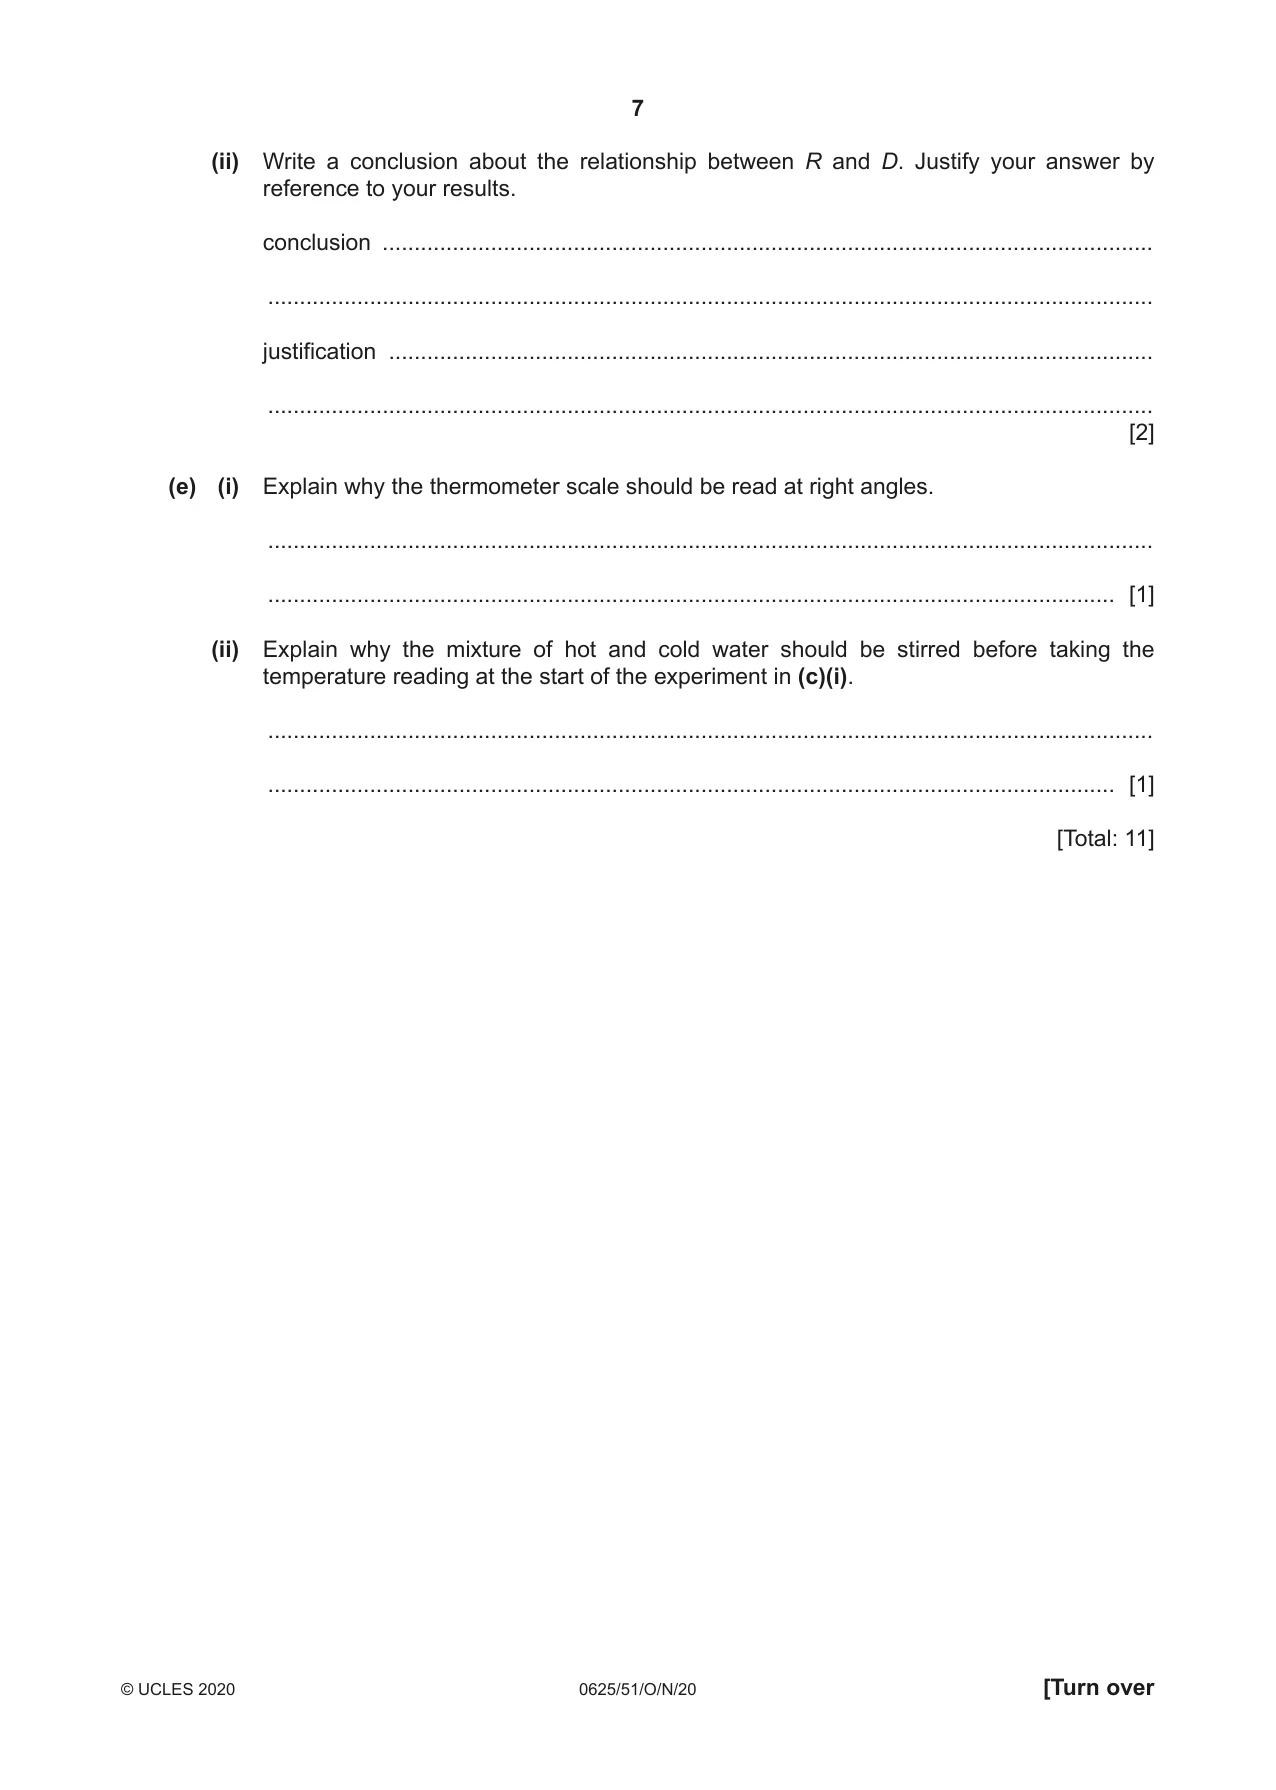
2 In this experiment, you will investigate the cooling of water under different conditions. Carry out the following instructions referring to Fig. 2.1. The thermometer must remain in the clamp for the whole of this experiment. Do not adjust the position of the thermometer in the clamp. stand thermometer clamp boss beaker bench Fig. 2.1 (a) Use the thermometer to measure room temperature θ R. θ R = ......................................................... [1] (b) (i) Pour 200 cm3 of hot water into the beaker. Place the thermometer in the beaker by moving the clamp stand. Record in Table 2.1 the temperature θ1 of the hot water at time t = 0. Immediately start the stopclock. After 180 s, measure the temperature θ1 of the water. Record the time t = 180 s and the temperature reading in Table 2.1. [1] (ii) Calculate the drop in temperature Δθ1 between times t = 0 and t = 180 s. Δθ1 = ......................................................... [1] Δθ1 (iii) Calculate the average rate of cooling R1 of the water using the equation R1 = Δt , where Δt = 180 s. Include the unit. R1 = ......................................................... [1] Table 2.1 t / s θ1 / °C (c) (i) Empty the beaker. Pour 150 cm3 of hot water into the beaker. Add 50 cm3 of cold water to the beaker. Place the thermometer in the beaker by moving the clamp stand. Record in Table 2.2 the temperature θ2 of the water in the beaker at time t = 0. Immediately start the stopclock. After 180 s, measure the temperature θ2 of the water. Record the time t = 180 s and the temperature reading in Table 2.2. Table 2.2 t / s θ2 / °C [1] (ii) Calculate the drop in temperature Δθ2 between t = 0 and t = 180 s. Δθ2 = ............................................................... Δθ2 Calculate the average rate of cooling R2 of the water using the equation R2 = Δt , where Δt = 180 s. Include the unit. R2 = ............................................................... [1] (d) A student suggests that the average rate of cooling R of the water depends on the difference D between the temperature of the water at time t = 0 and room temperature. (i) Calculate the difference D1 using the readings in Table 2.1 and your answer to (a). D1 = ............................................................... Calculate the difference D2 using the readings in Table 2.2 and your answer to (a). D2 = ............................................................... [1] (ii) Write a conclusion about the relationship between R and D. Justify your answer by reference to your results. conclusion ......................................................................................................................... ........................................................................................................................................... justification ........................................................................................................................ ........................................................................................................................................... [2] (e) (i) Explain why the thermometer scale should be read at right angles. ........................................................................................................................................... ..................................................................................................................................... [1] (ii) Explain why the mixture of hot and cold water should be stirred before taking the temperature reading at the start of the experiment in (c)(i). ........................................................................................................................................... ..................................................................................................................................... [1] [Total: 11]
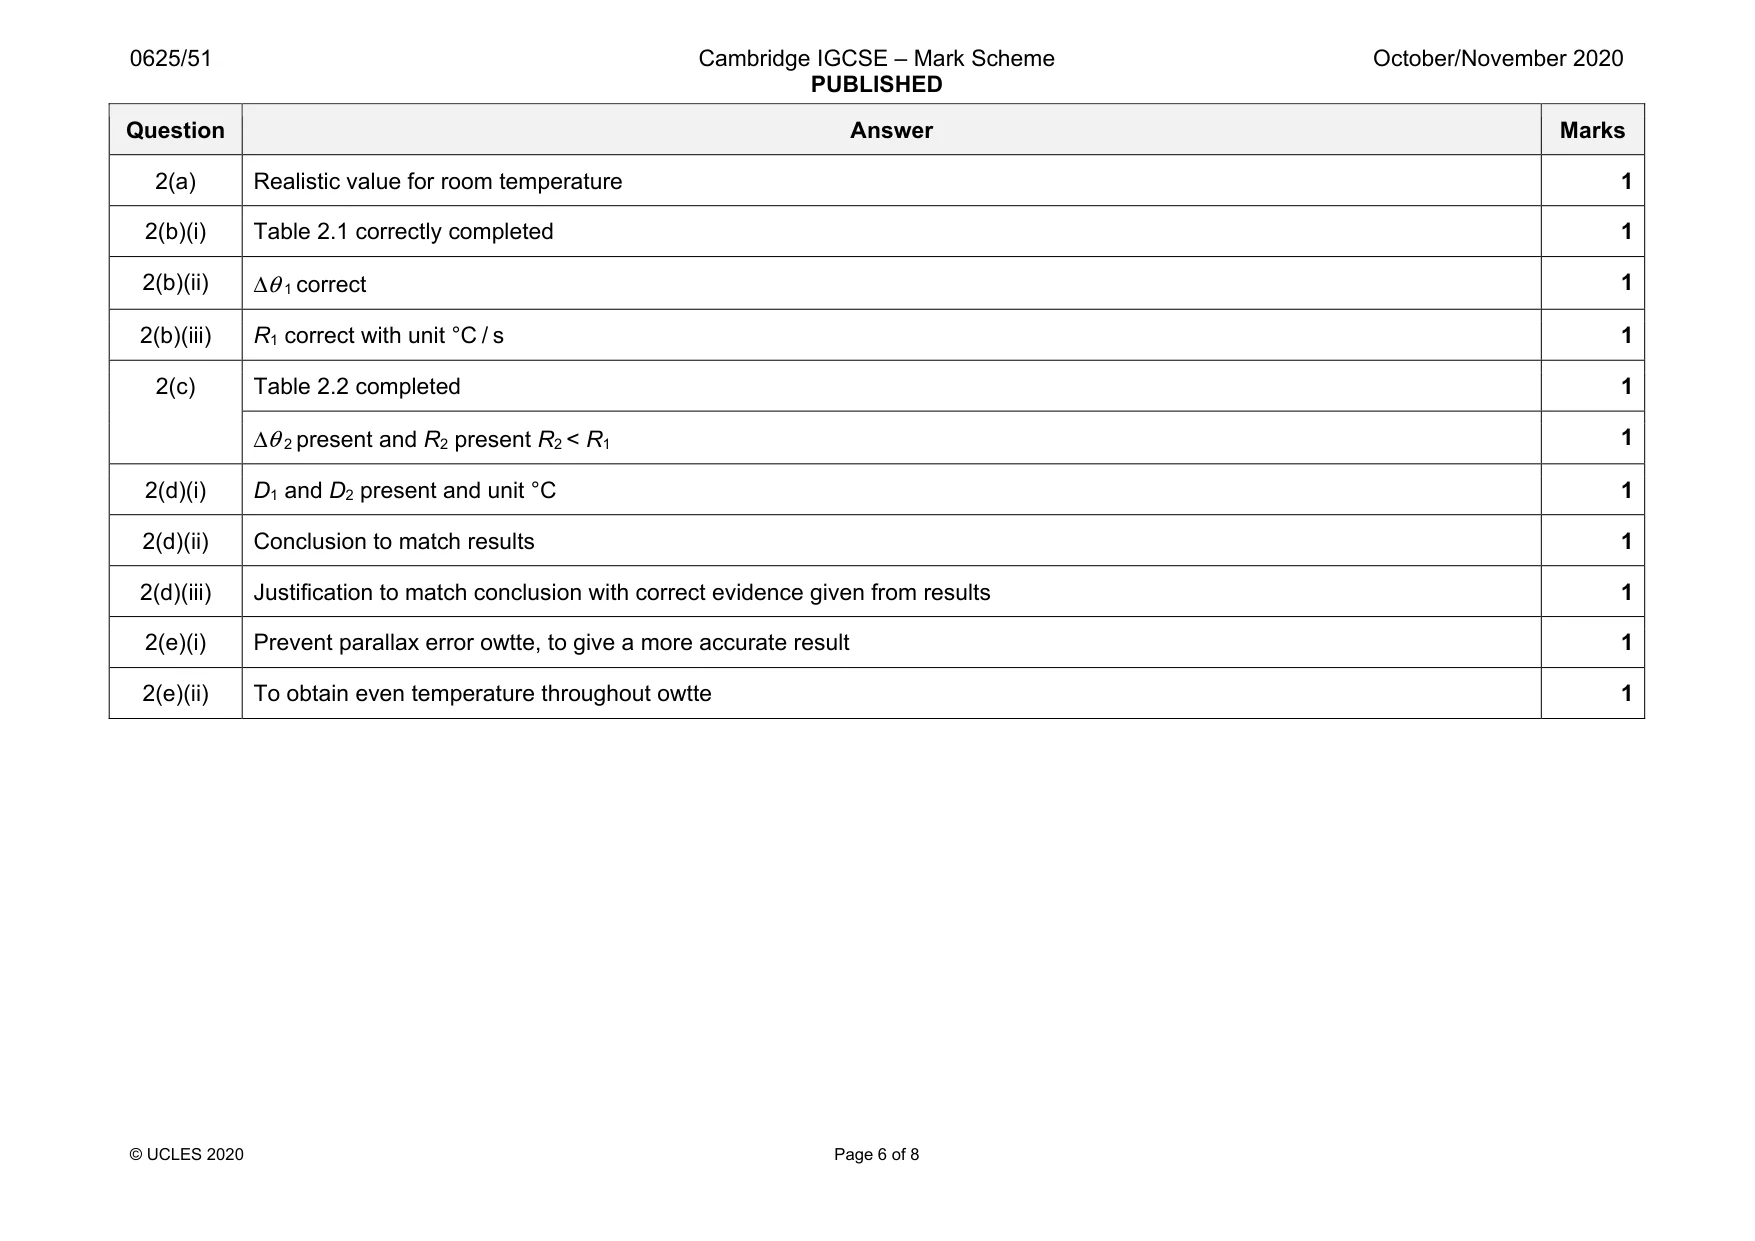
Mark scheme: 2(a) Realistic value for room temperature 1 2(b)(i) Table 2.1 correctly completed 1 2(b)(ii) Δθ 1 correct 1 2(b)(iii) R1 correct with unit °C / s 1 2(c) Table 2.2 completed 1 Δθ 2 present and R2 present R2 < R1 1 2(d)(i) D1 and D2 present and unit °C 1 2(d)(ii) Conclusion to match results 1 2(d)(iii) Justification to match conclusion with correct evidence given from results 1 2(e)(i) Prevent parallax error owtte, to give a more accurate result 1 2(e)(ii) To obtain even temperature throughout owtte 1
Q3 · In this experiment, you will investigate the magnification of the image produced by a lens
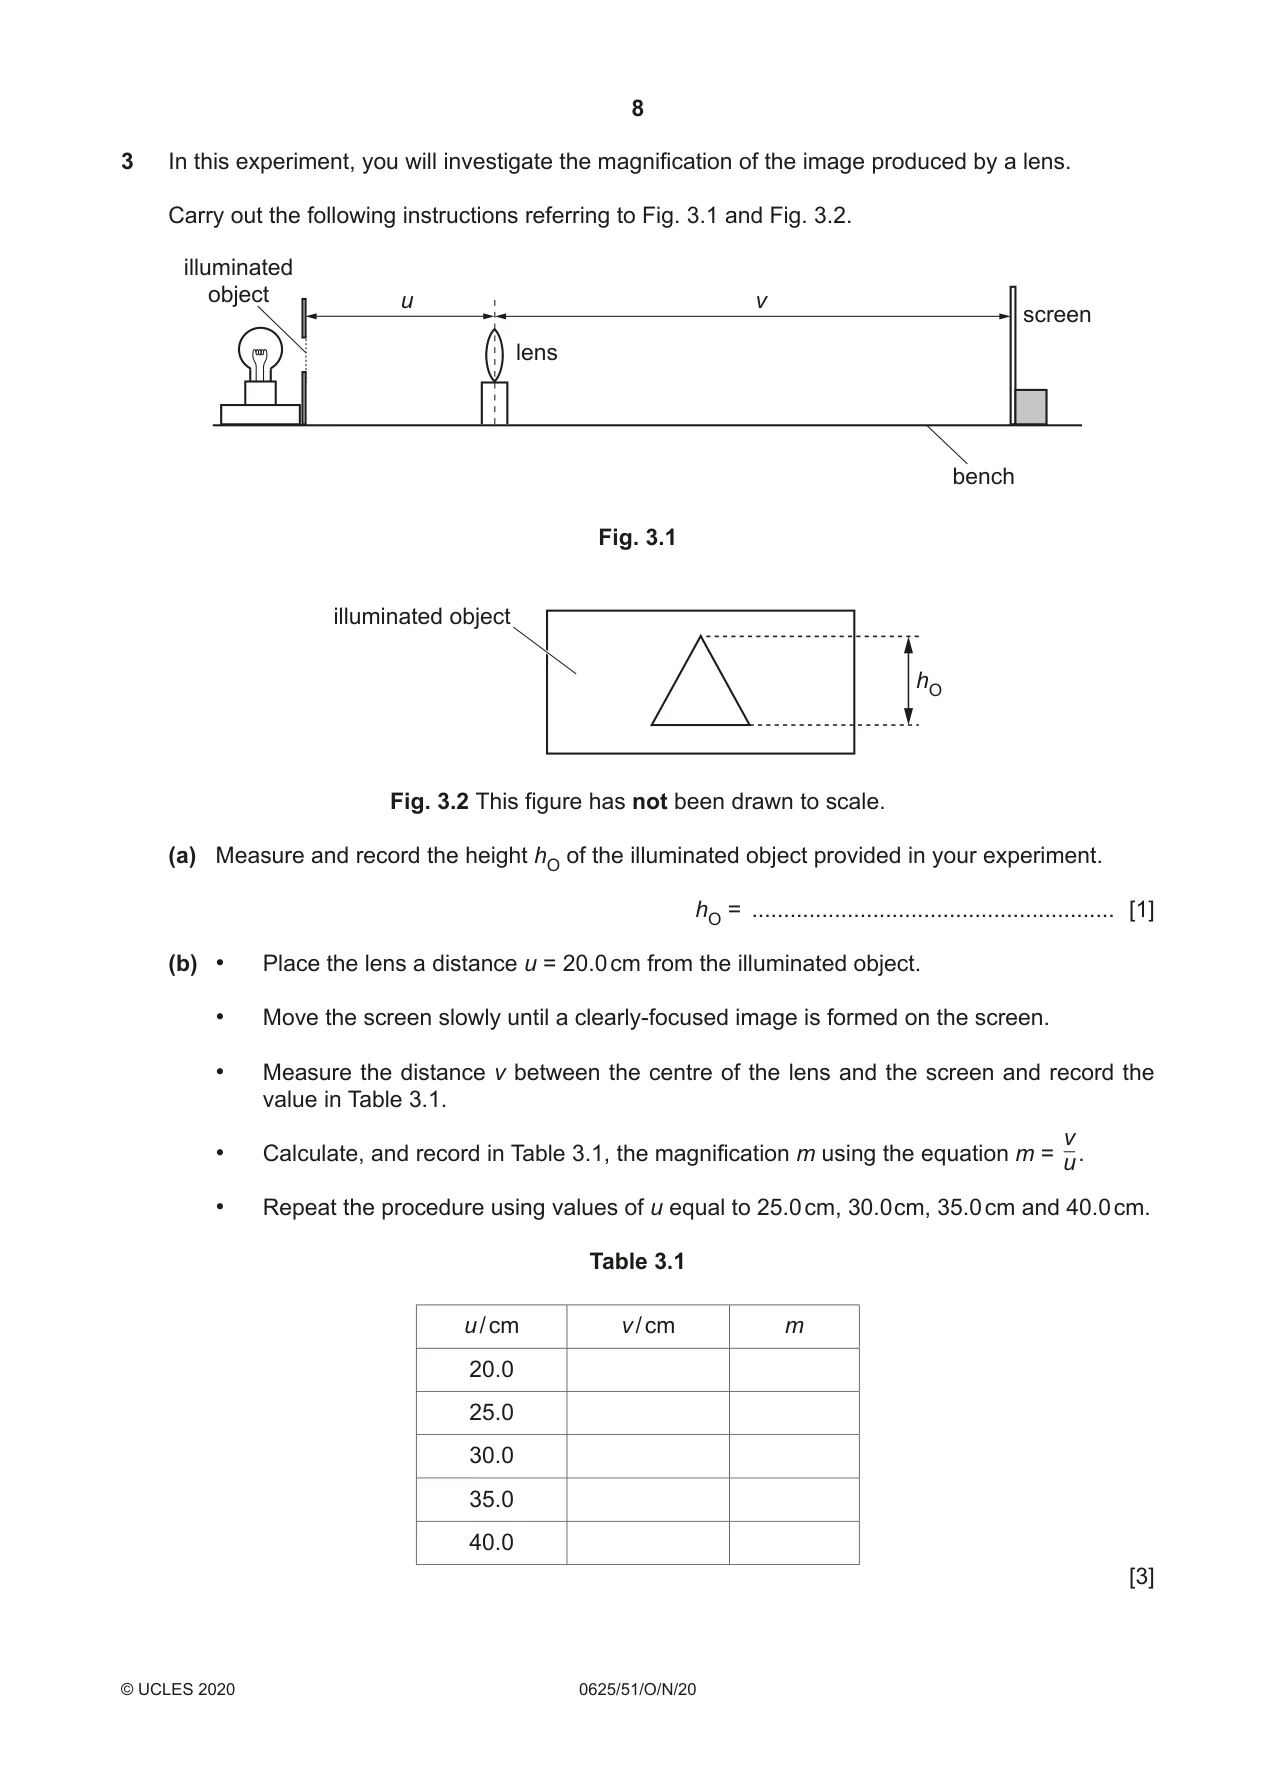
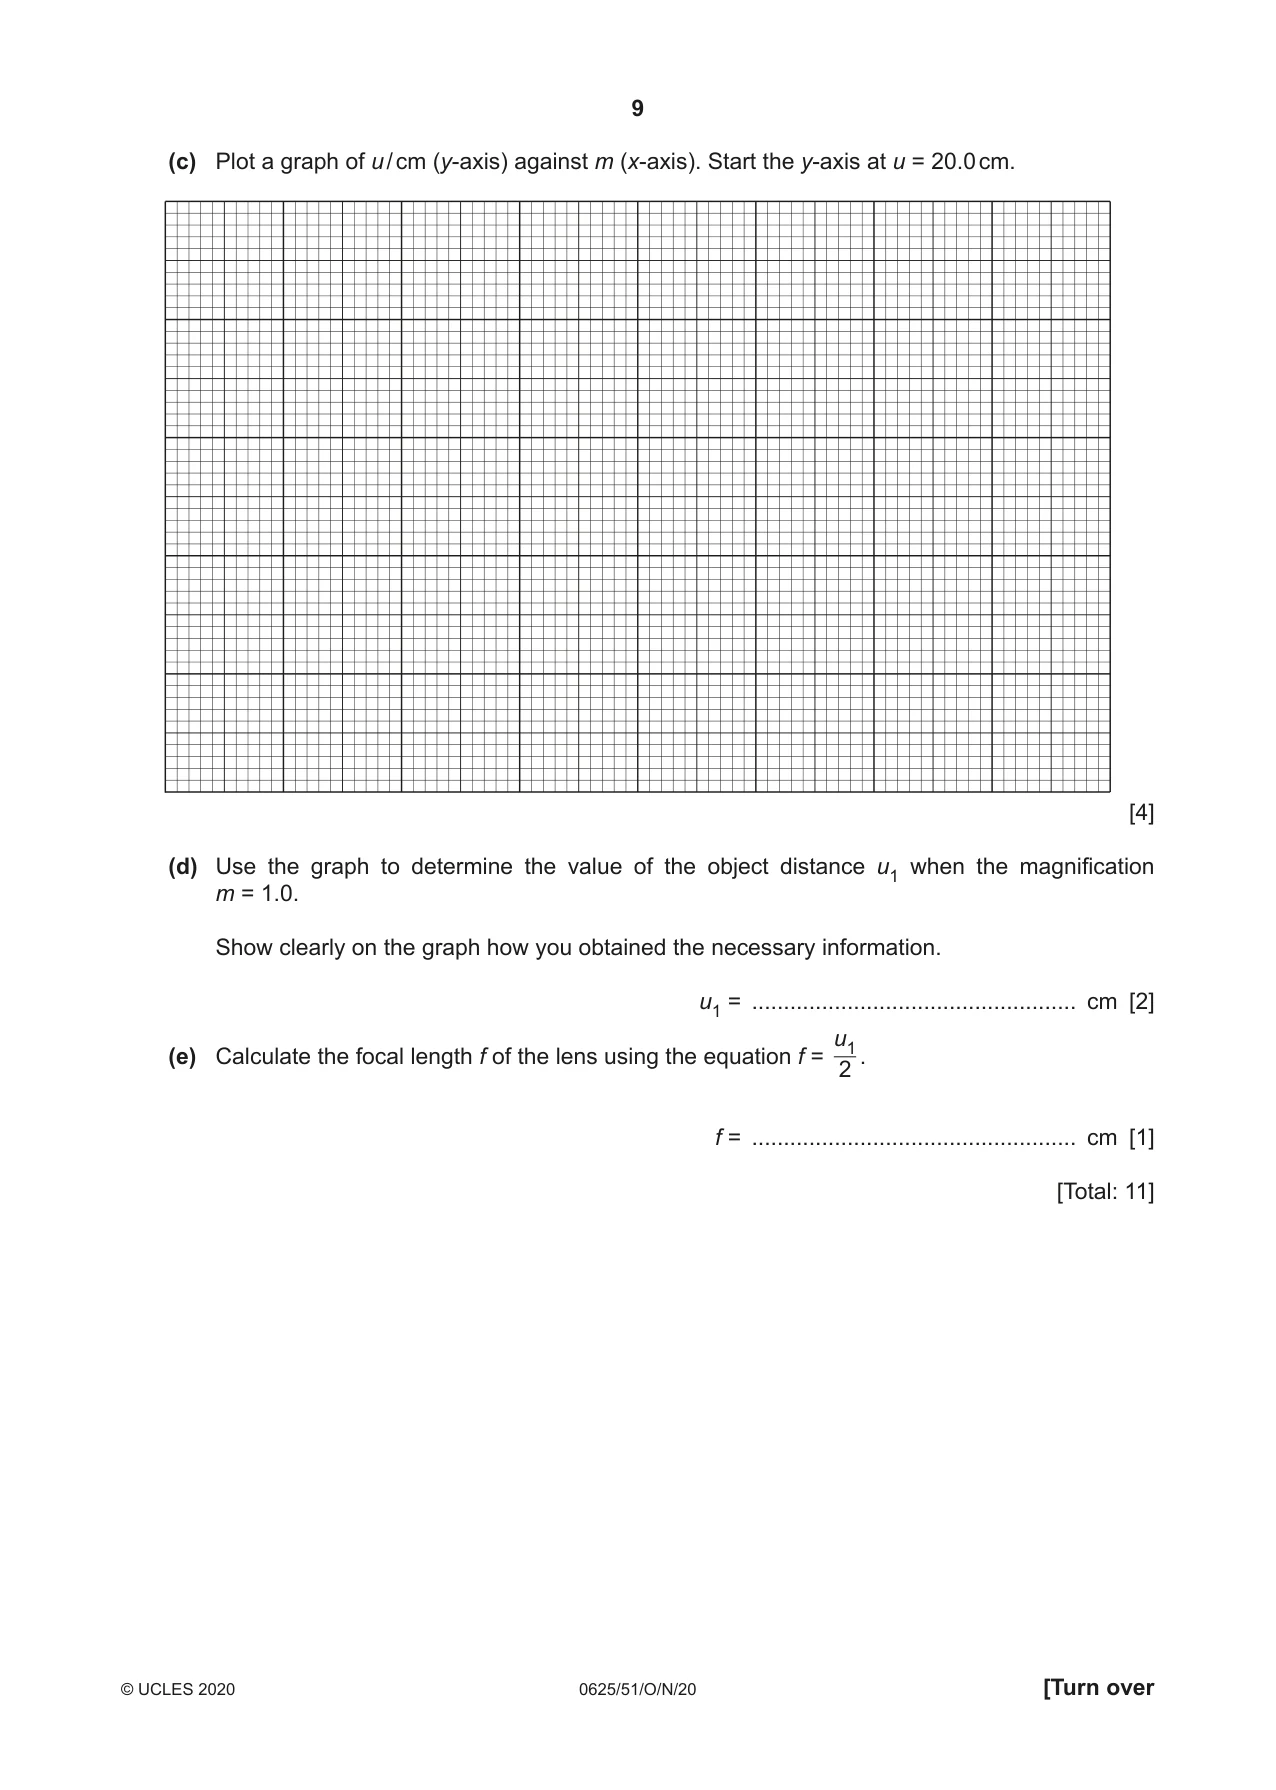
3 In this experiment, you will investigate the magnification of the image produced by a lens. Carry out the following instructions referring to Fig. 3.1 and Fig. 3.2. illuminated object u v screen lens bench Fig. 3.1 illuminated object hO Fig. 3.2 This figure has not been drawn to scale. (a) Measure and record the height hO of the illuminated object provided in your experiment. hO = ......................................................... [1] (b) • Place the lens a distance u = 20.0 cm from the illuminated object. • Move the screen slowly until a clearly-focused image is formed on the screen. • Measure the distance v between the centre of the lens and the screen and record the value in Table 3.1. v • Calculate, and record in Table 3.1, the magnification m using the equation m = u. • Repeat the procedure using values of u equal to 25.0 cm, 30.0 cm, 35.0 cm and 40.0 cm. Table 3.1 u / cm v / cm m 20.0 25.0 30.0 35.0 40.0 [3] (c) Plot a graph of u / cm (y-axis) against m (x-axis). Start the y-axis at u = 20.0 cm. [4] (d) Use the graph to determine the value of the object distance u1 when the magnification m = 1.0. Show clearly on the graph how you obtained the necessary information. u1 = ................................................... cm [2] u1(e) Calculate the focal length f of the lens using the equation f = . 2 f = ................................................... cm [1] [Total: 11]
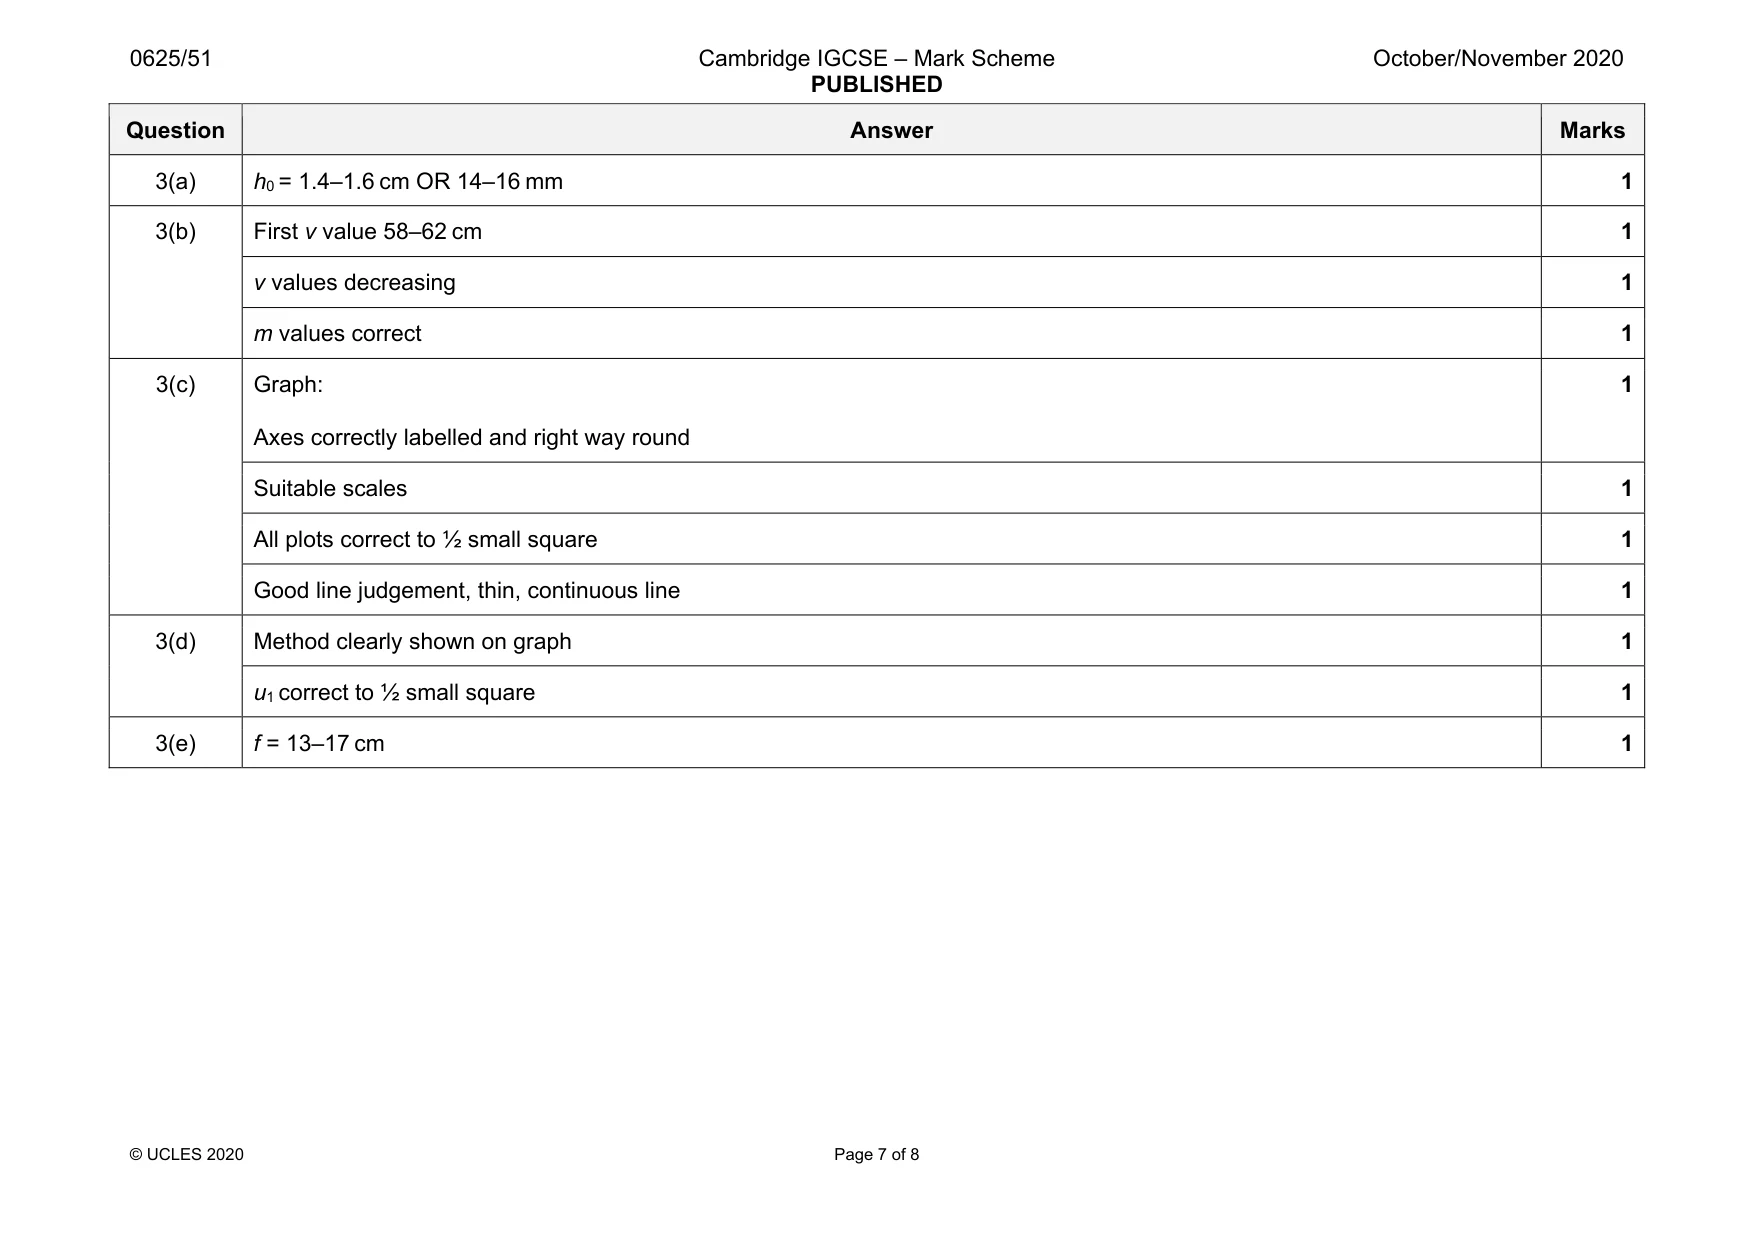
Mark scheme: 3(a) h0 = 1.4–1.6 cm OR 14–16 mm 1 3(b) First v value 58–62 cm 1 v values decreasing 1 m values correct 1 3(c) Graph: Axes correctly labelled and right way round 1 Suitable scales 1 All plots correct to ½ small square 1 Good line judgement, thin, continuous line 1 3(d) Method clearly shown on graph 1 u1 correct to ½ small square 1 3(e) f = 13–17 cm 1
Q4 · A student investigates the resistances of different wires
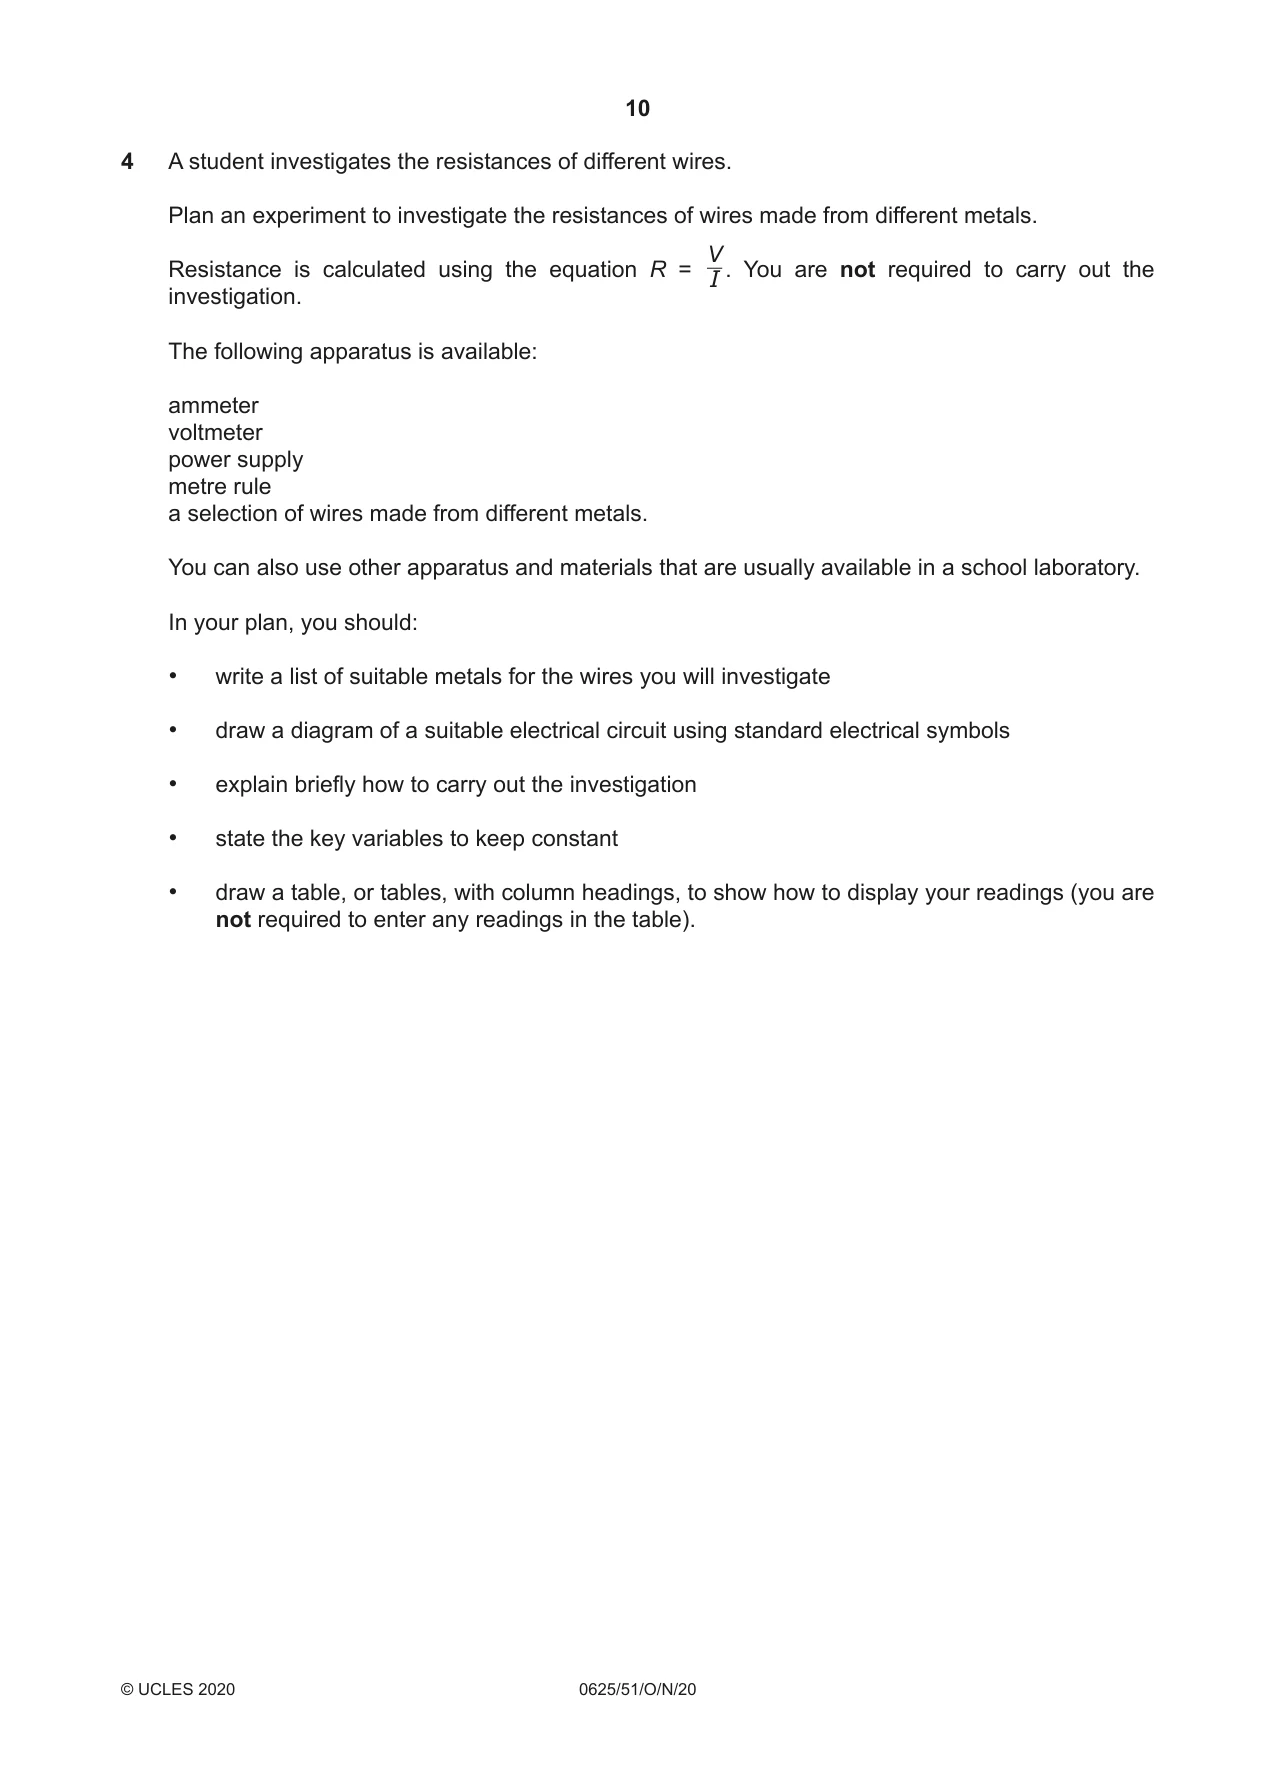
4 A student investigates the resistances of different wires. Plan an experiment to investigate the resistances of wires made from different metals. V Resistance is calculated using the equation R = . You are not required to carry out the I investigation. The following apparatus is available: ammeter voltmeter power supply metre rule a selection of wires made from different metals. You can also use other apparatus and materials that are usually available in a school laboratory. In your plan, you should: • write a list of suitable metals for the wires you will investigate • draw a diagram of a suitable electrical circuit using standard electrical symbols • explain briefly how to carry out the investigation • state the key variables to keep constant • draw a table, or tables, with column headings, to show how to display your readings (you are not required to enter any readings in the table). .......................................................................................................................................................... .......................................................................................................................................................... .......................................................................................................................................................... .......................................................................................................................................................... .......................................................................................................................................................... .......................................................................................................................................................... .......................................................................................................................................................... .......................................................................................................................................................... .......................................................................................................................................................... .......................................................................................................................................................... .......................................................................................................................................................... .......................................................................................................................................................... .......................................................................................................................................................... .......................................................................................................................................................... .......................................................................................................................................................... .......................................................................................................................................................... .......................................................................................................................................................... .......................................................................................................................................................... .......................................................................................................................................................... .................................................................................................................................................... [7] [Total: 7]
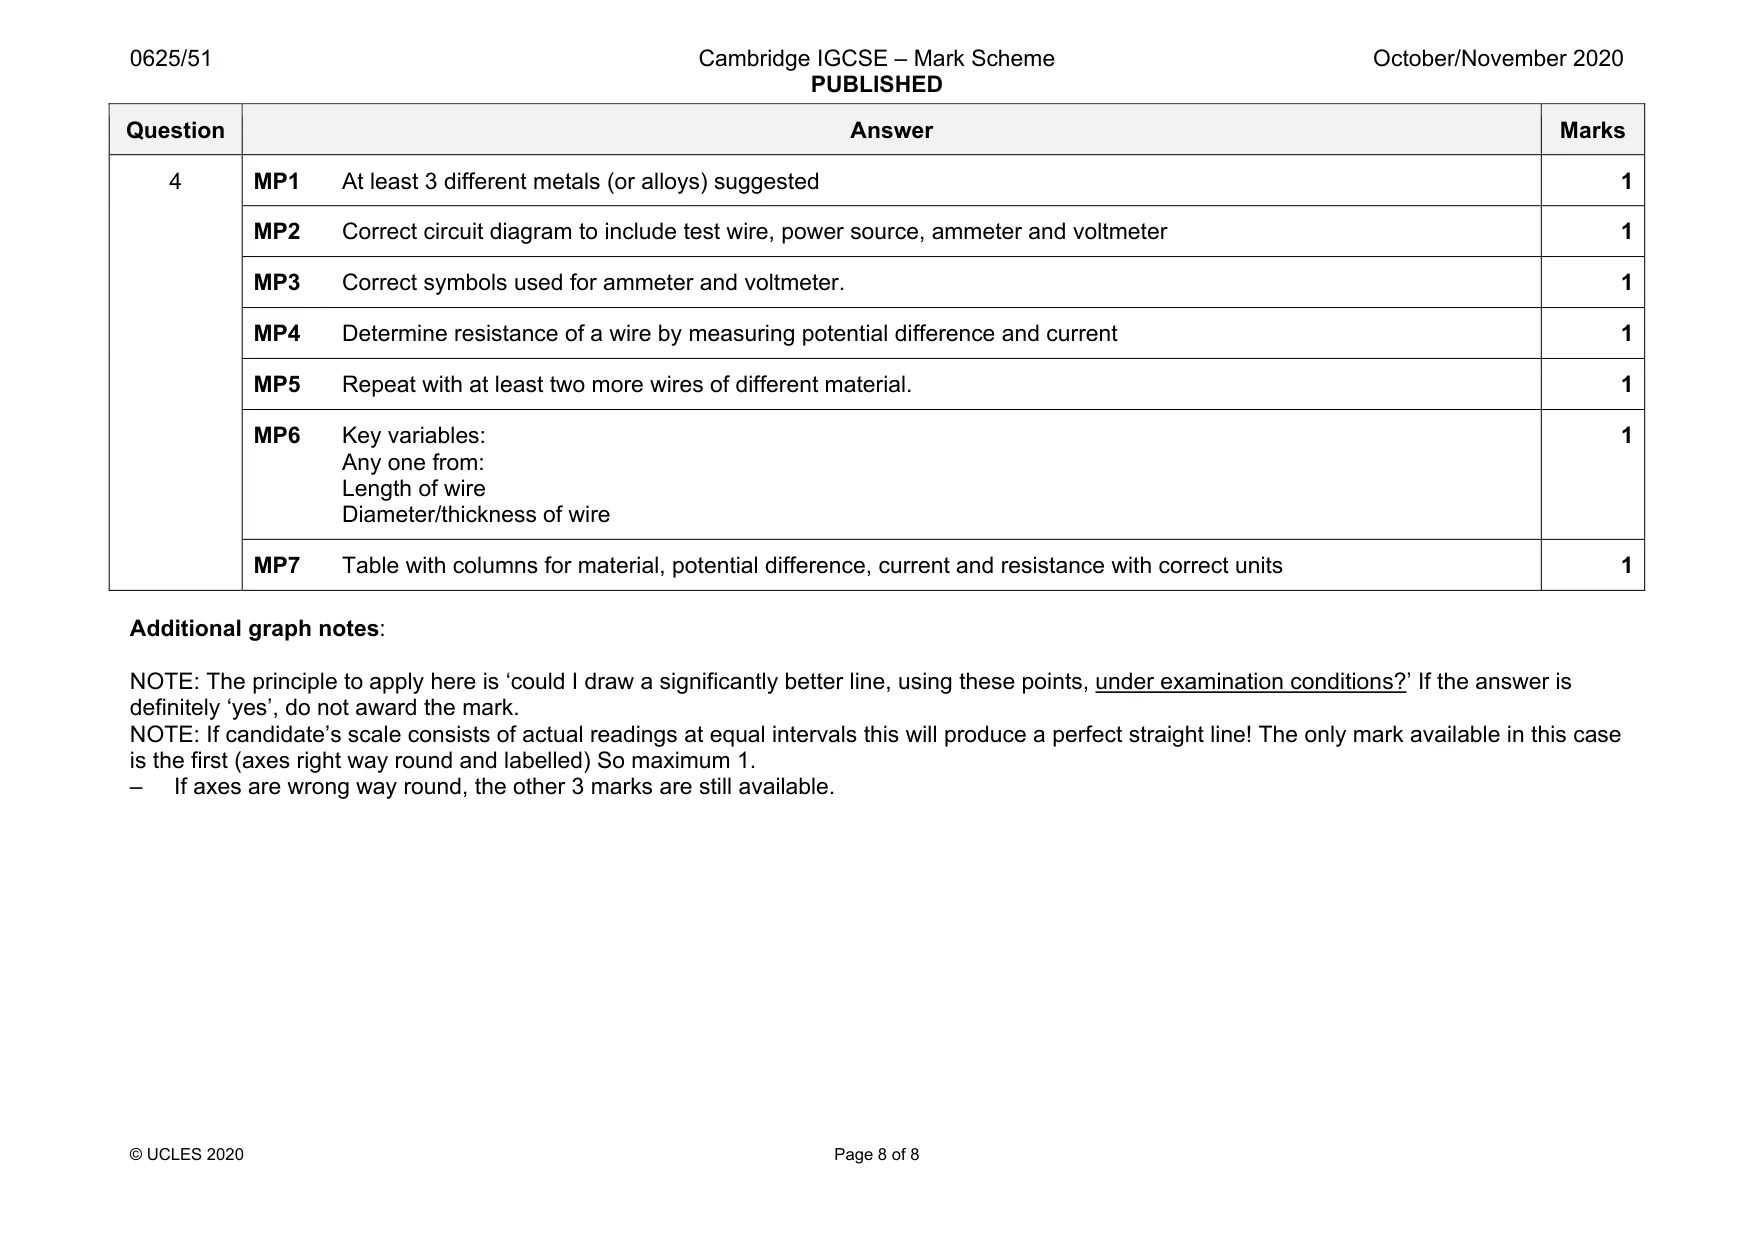
Mark scheme: 4 MP1 At least 3 different metals (or alloys) suggested 1 MP2 Correct circuit diagram to include test wire, power source, ammeter and voltmeter 1 MP3 Correct symbols used for ammeter and voltmeter. 1 MP4 Determine resistance of a wire by measuring potential difference and current 1 MP5 Repeat with at least two more wires of different material. 1 MP6 Key variables: Any one from: Length of wire Diameter/thickness of wire 1 MP7 Table with columns for material, potential difference, current and resistance with correct units 1 Additional graph notes: NOTE: The principle to apply here is ‘could I draw a significantly better line, using these points, under examination conditions?’ If the answer is definitely ‘yes’, do not award the mark. NOTE: If candidate’s scale consists of actual readings at equal intervals this will produce a perfect straight line! The only mark available in this case is the first (axes right way round and labelled) So maximum 1. – If axes are wrong way round, the other 3 marks are still available.
What was in this paper
The subtopics covered by these 4 questions, and how many questions each got. Open one in a new tab to see every Cambridge question on it.
What you needed in this session
Cambridge’s own grade thresholds for 2020 Oct/Nov, Paper 5 · Variant 1. A higher threshold means an easier paper — the bar moves with how the cohort did.