Cambridge IGCSE Physics 0625 — 2017 May/June Paper 6 · Variant 2
0625/62/M/J/17 · 5 questions · 40 marks · ≈45 min
The question paper and its mark scheme, free to read here and free to download. This is Cambridge’s own paper, exactly as it was sat.
Question paper12 pages
Mark scheme6 pages
Answers below. Sit the paper first if you are practising.
Questions as text
Q1 · The class is investigating the resistances of two resistance wires
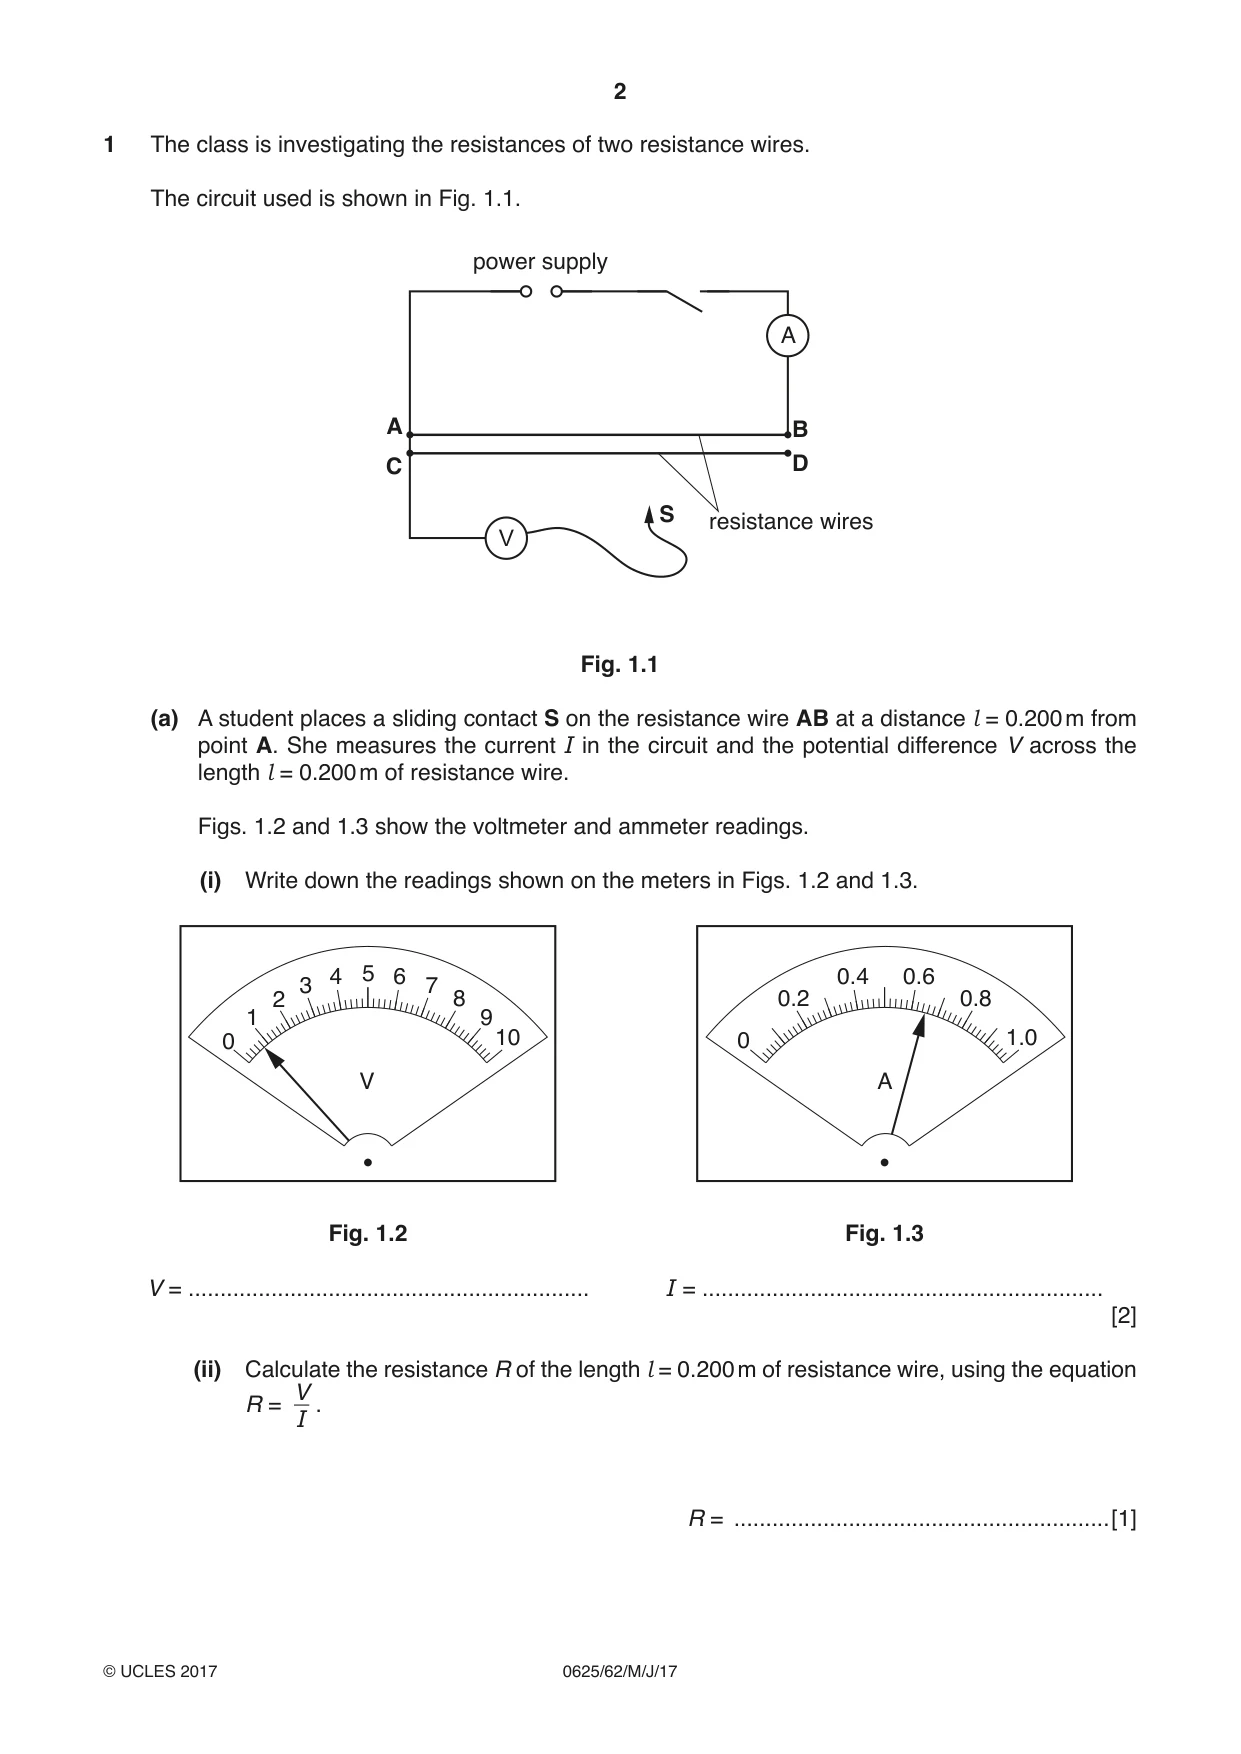
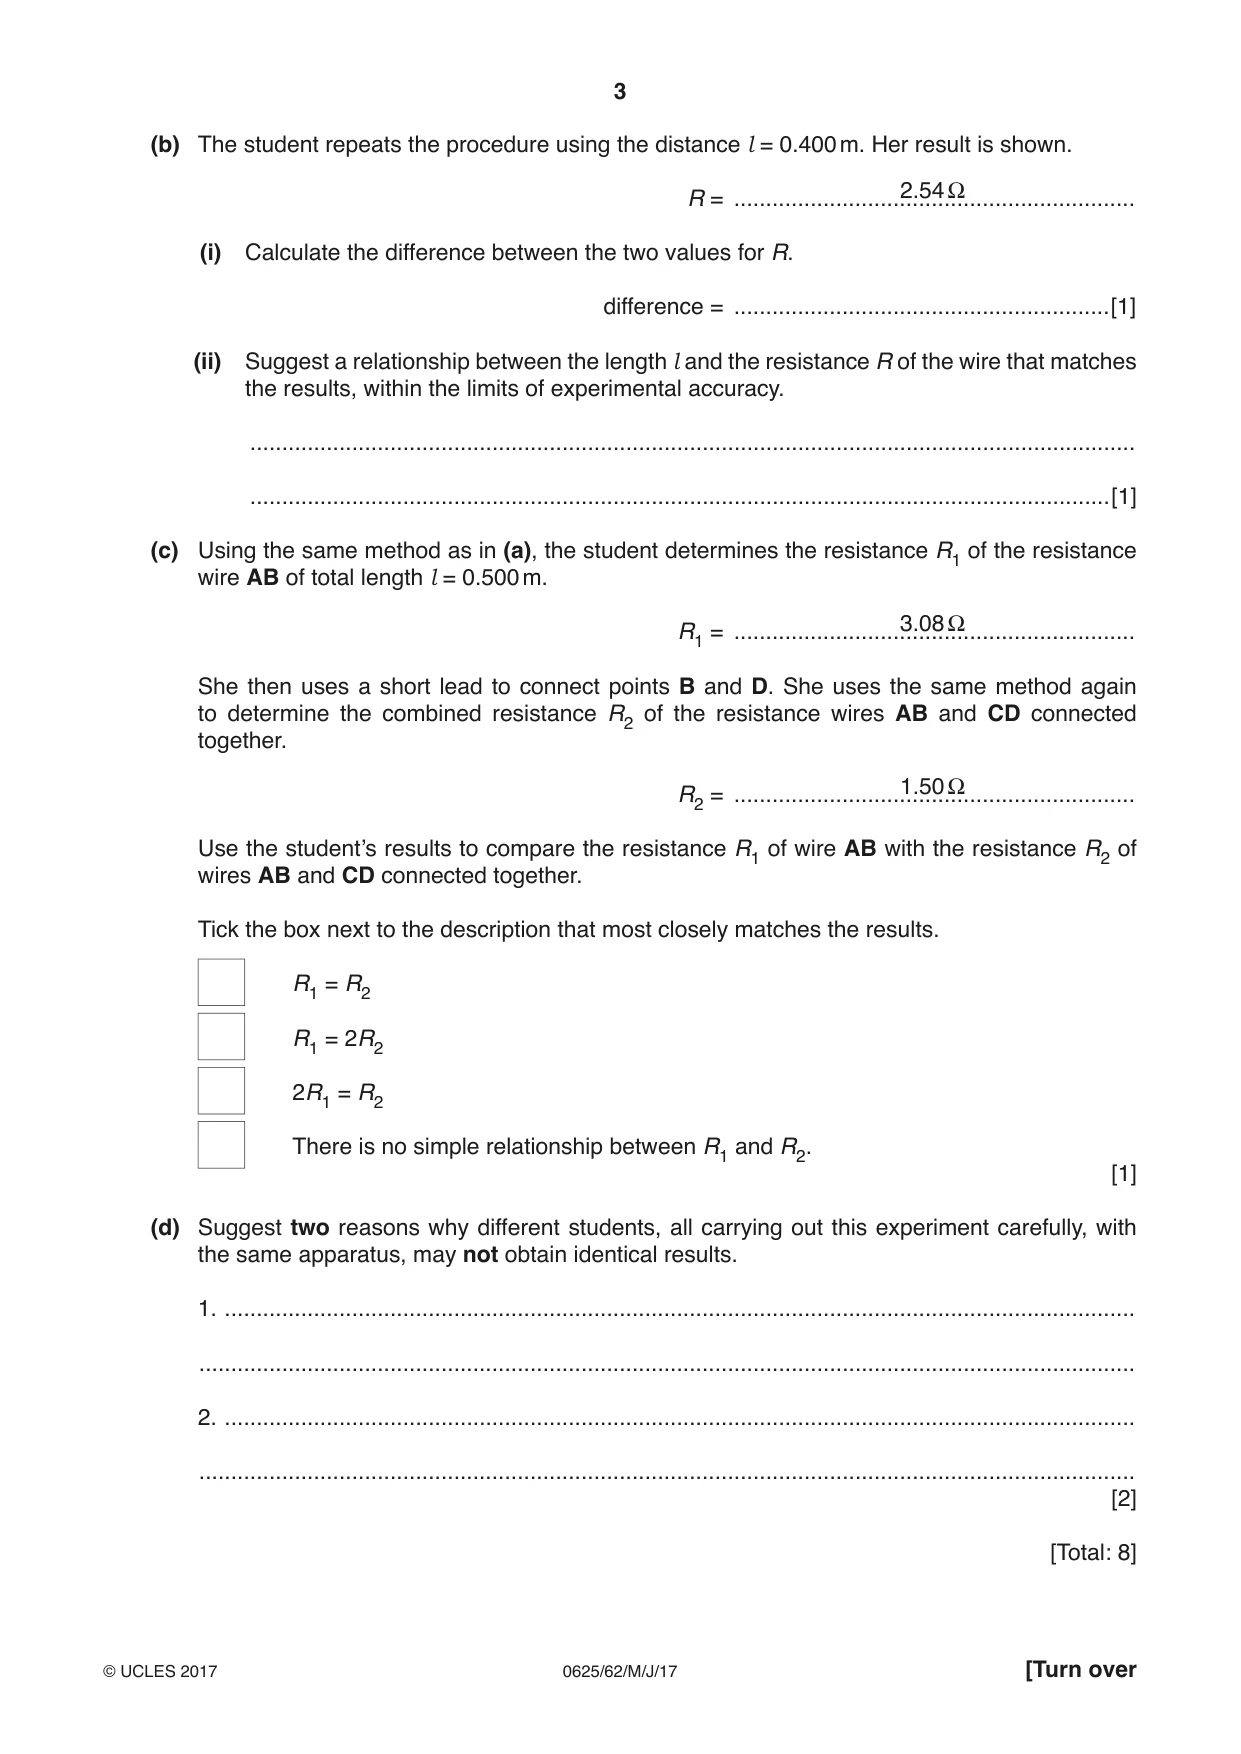
1 The class is investigating the resistances of two resistance wires. The circuit used is shown in Fig. 1.1. power supply A A B C D S resistance wires V Fig. 1.1 (a) A student places a sliding contact S on the resistance wire AB at a distance l = 0.200 m from point A. She measures the current I in the circuit and the potential difference V across the length l = 0.200 m of resistance wire. Figs. 1.2 and 1.3 show the voltmeter and ammeter readings. (i) Write down the readings shown on the meters in Figs. 1.2 and 1.3. 4 5 6 0.4 0.6 3 7 2 8 0.2 0.8 1 9 0 10 0 1.0 V A Fig. 1.2 Fig. 1.3 V = ............................................................... I = ............................................................... [2] (ii) Calculate the resistance R of the length l = 0.200 m of resistance wire, using the equation V R = . I R = ...........................................................[1] (b) The student repeats the procedure using the distance l = 0.400 m. Her result is shown. 2.54 Ω R = ............................................................... (i) Calculate the difference between the two values for R. difference = ...........................................................[1] (ii) Suggest a relationship between the length l and the resistance R of the wire that matches the results, within the limits of experimental accuracy. ........................................................................................................................................... .......................................................................................................................................[1] (c) Using the same method as in (a), the student determines the resistance R1 of the resistance wire AB of total length l = 0.500 m. 3.08 Ω R1 = ............................................................... She then uses a short lead to connect points B and D. She uses the same method again to determine the combined resistance R2 of the resistance wires AB and CD connected together. 1.50 Ω R2 = ............................................................... Use the student’s results to compare the resistance R1 of wire AB with the resistance R2 of wires AB and CD connected together. Tick the box next to the description that most closely matches the results. R1 = R2 R1 = 2R2 2R1 = R2 There is no simple relationship between R1 and R2. [1] (d) Suggest two reasons why different students, all carrying out this experiment carefully, with the same apparatus, may not obtain identical results. 1. ............................................................................................................................................... ................................................................................................................................................... 2. ............................................................................................................................................... ................................................................................................................................................... [2] [Total: 8]
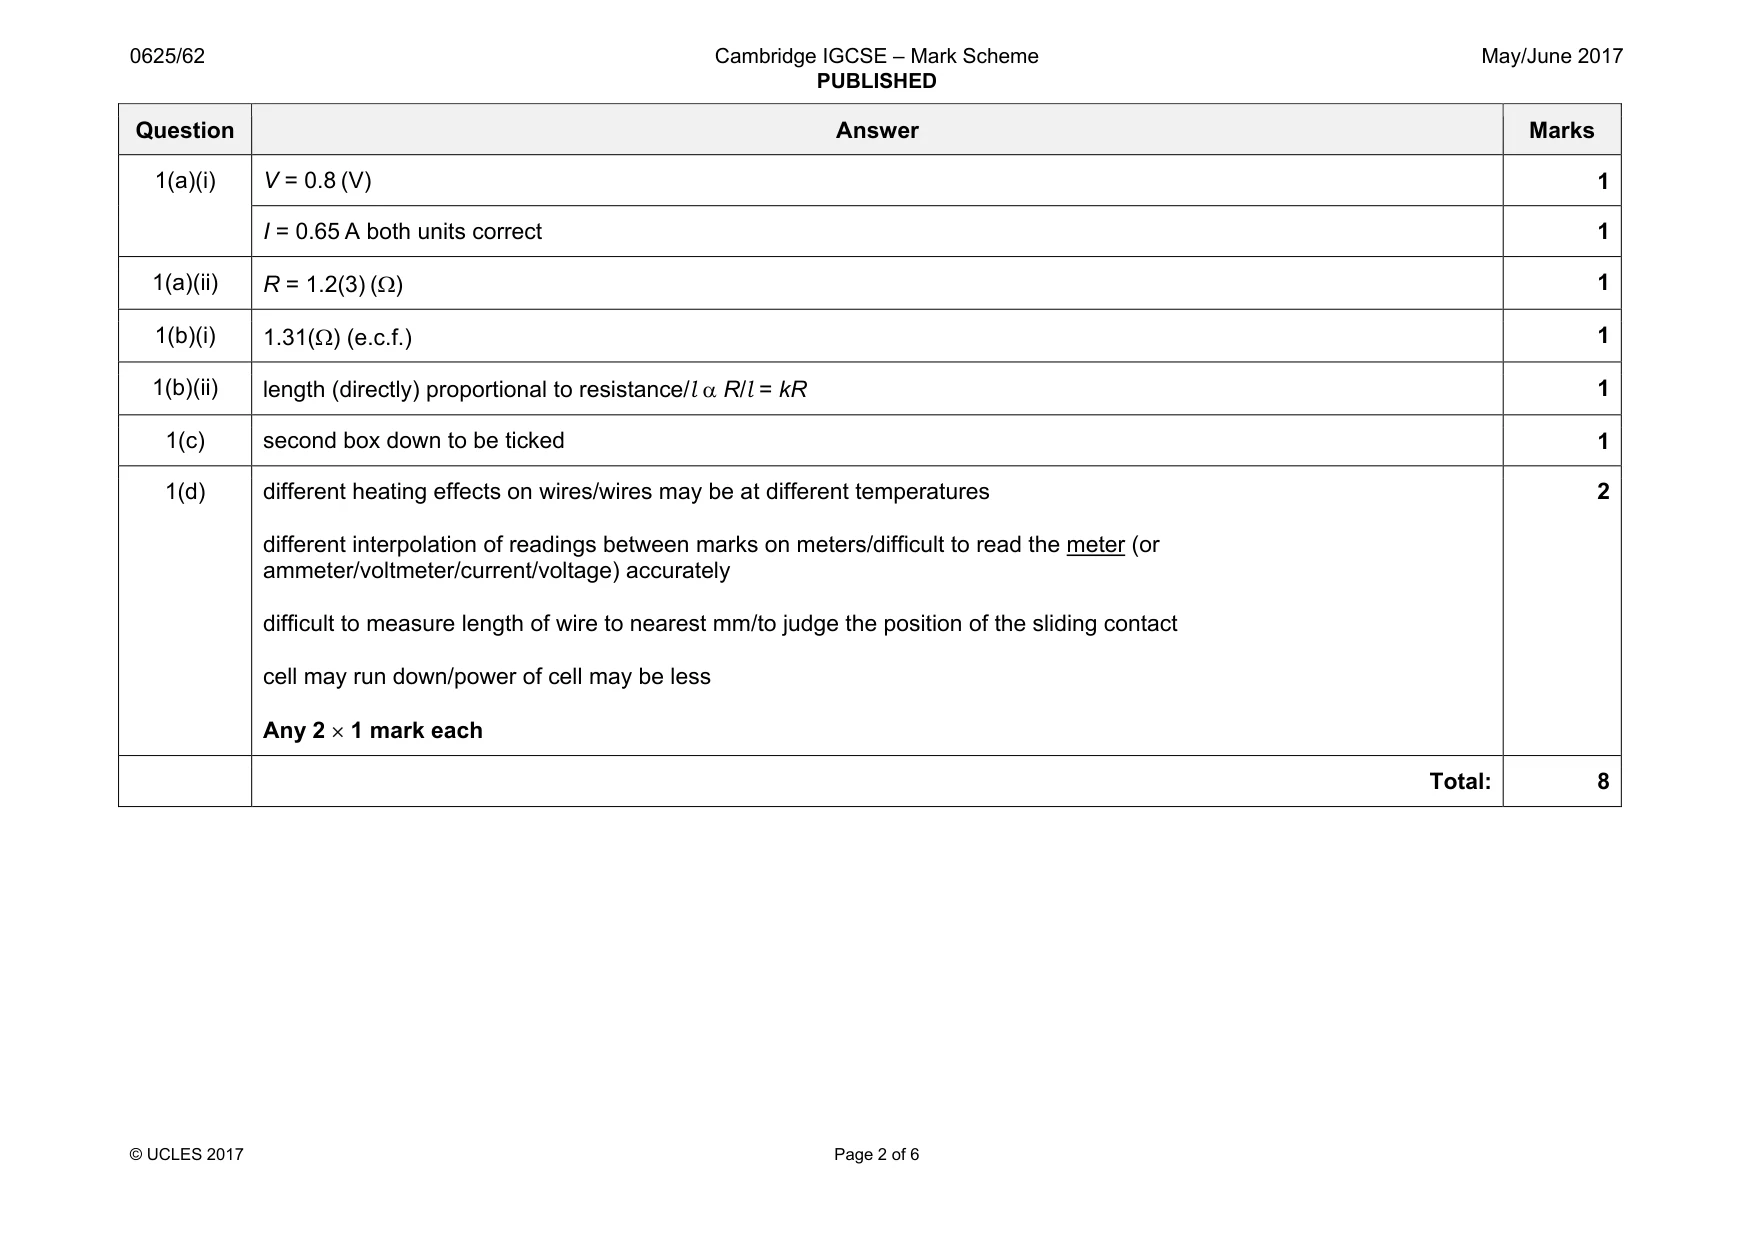
Mark scheme: 1(a)(i) V = 0.8 (V) 1 I = 0.65 A both units correct 1 1(a)(ii) R = 1.2(3) (Ω) 1 1(b)(i) 1.31(Ω) (e.c.f.) 1 1(b)(ii) length (directly) proportional to resistance/l α R/l = kR 1 1(c) second box down to be ticked 1 1(d) different heating effects on wires/wires may be at different temperatures different interpolation of readings between marks on meters/difficult to read the meter (or ammeter/voltmeter/current/voltage) accurately difficult to measure length of wire to nearest mm/to judge the position of the sliding contact cell may run down/power of cell may be less Any 2 × 1 mark each 2 Total: 8
Q2 · The class is investigating the refraction of light passing through a transparent block
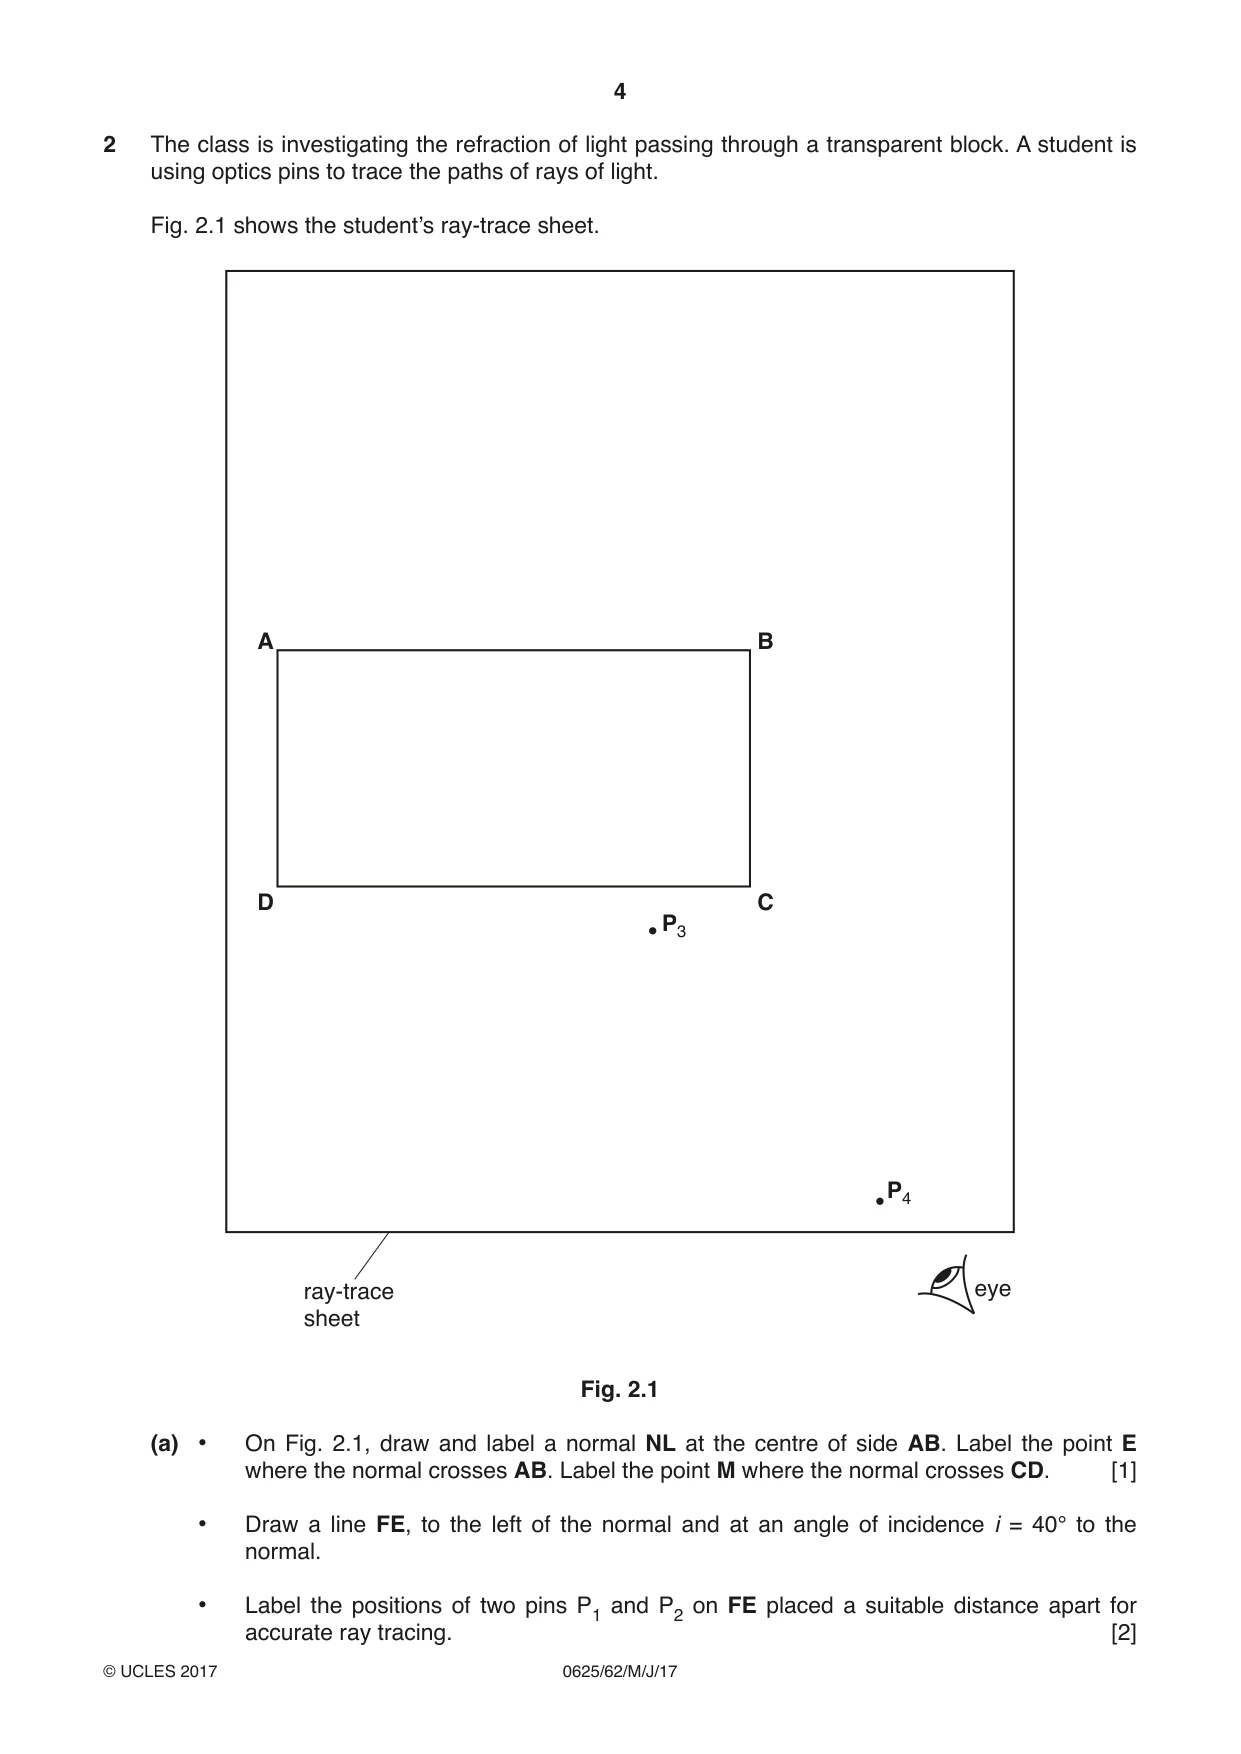
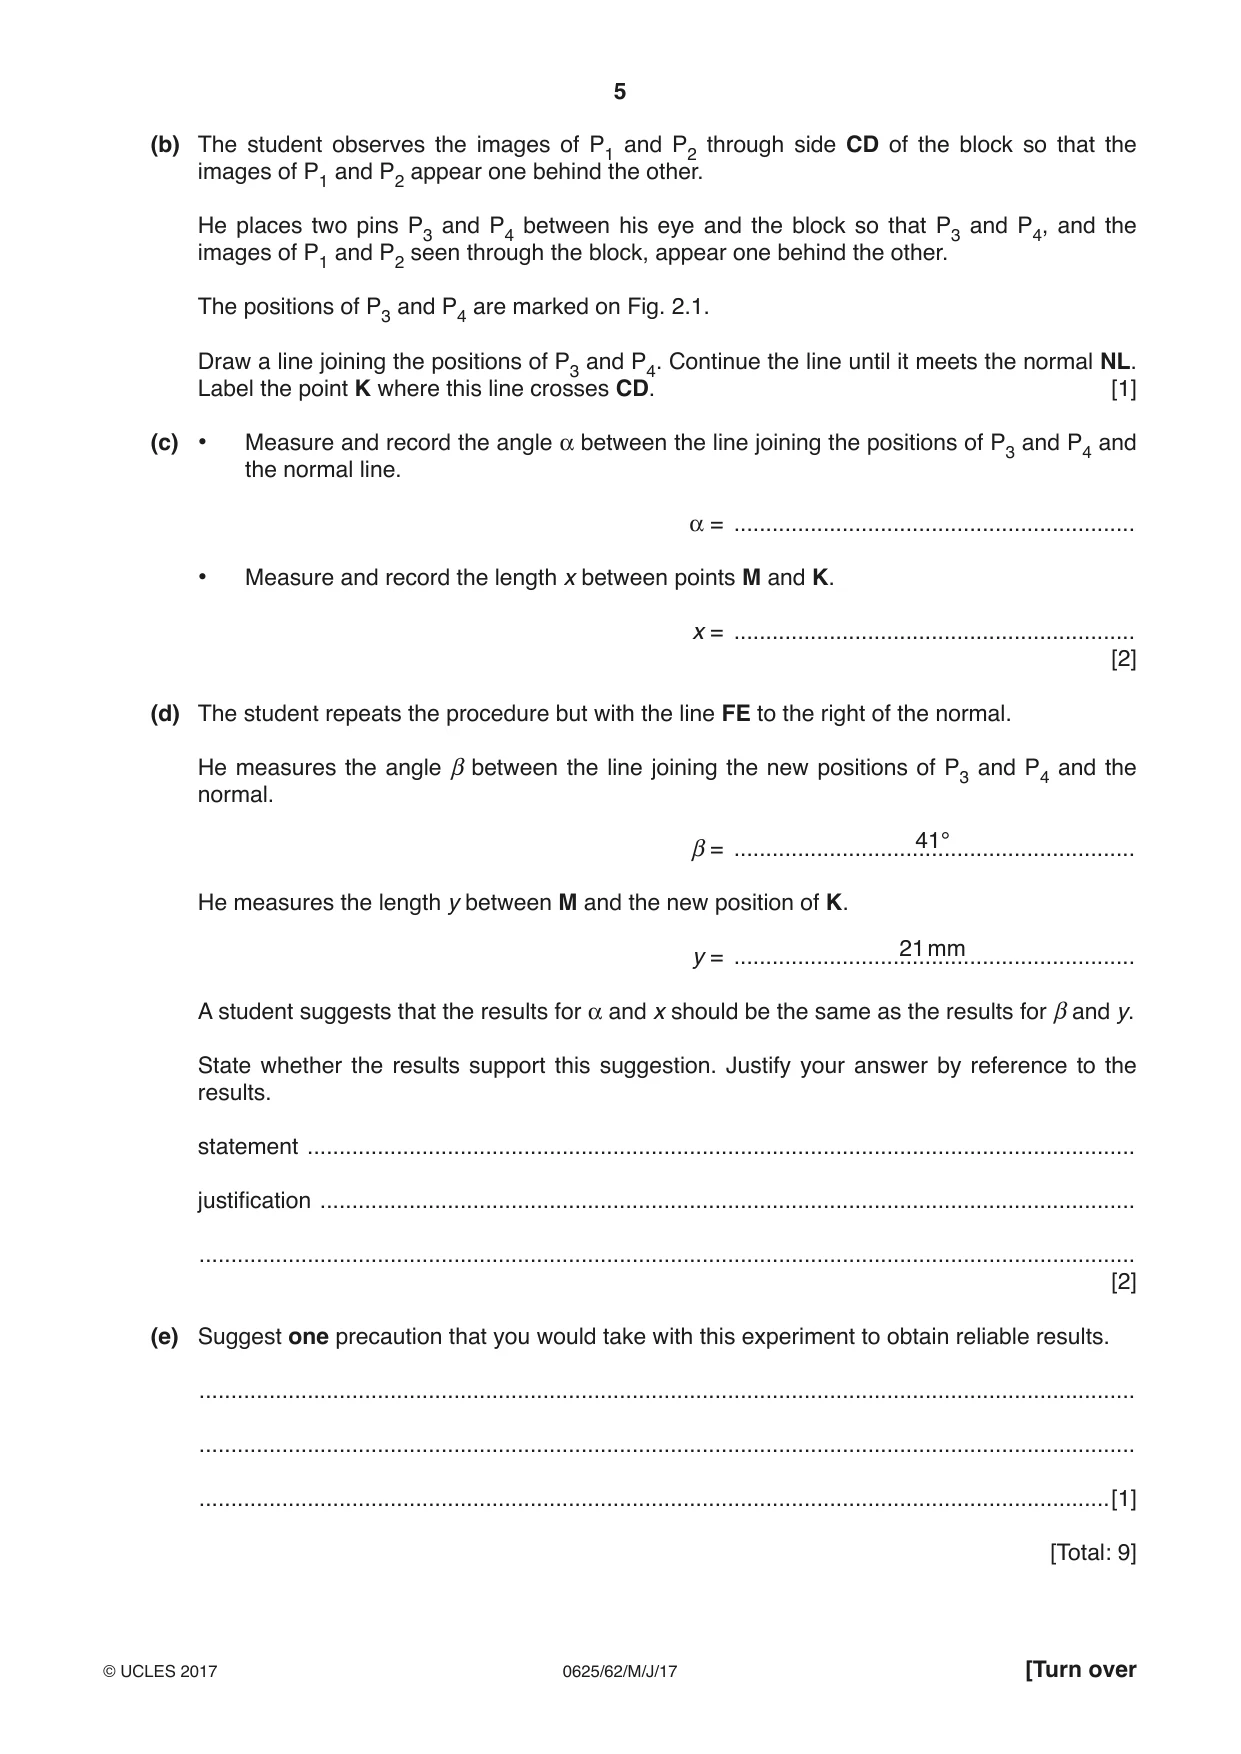
2 The class is investigating the refraction of light passing through a transparent block. A student is using optics pins to trace the paths of rays of light. Fig. 2.1 shows the student’s ray-trace sheet. A B D C P3 P4 ray-trace eye sheet Fig. 2.1 (a) • On Fig. 2.1, draw and label a normal NL at the centre of side AB. Label the point E where the normal crosses AB. Label the point M where the normal crosses CD. [1] • Draw a line FE, to the left of the normal and at an angle of incidence i = 40° to the normal. • Label the positions of two pins P1 and P2 on FE placed a suitable distance apart for accurate ray tracing. [2] (b) The student observes the images of P1 and P2 through side CD of the block so that the images of P1 and P2 appear one behind the other. He places two pins P3 and P4 between his eye and the block so that P3 and P4, and the images of P1 and P2 seen through the block, appear one behind the other. The positions of P3 and P4 are marked on Fig. 2.1. Draw a line joining the positions of P3 and P4. Continue the line until it meets the normal NL. Label the point K where this line crosses CD. [1] (c) • Measure and record the angle α between the line joining the positions of P3 and P4 and the normal line. α = ............................................................... • Measure and record the length x between points M and K. x = ............................................................... [2] (d) The student repeats the procedure but with the line FE to the right of the normal. He measures the angle β between the line joining the new positions of P3 and P4 and the normal. 41° β = ............................................................... He measures the length y between M and the new position of K. 21 mm y = ............................................................... A student suggests that the results for α and x should be the same as the results for β and y. State whether the results support this suggestion. Justify your answer by reference to the results. statement .................................................................................................................................. justification ................................................................................................................................ ................................................................................................................................................... [2] (e) Suggest one precaution that you would take with this experiment to obtain reliable results. ................................................................................................................................................... ................................................................................................................................................... ...............................................................................................................................................[1] [Total: 9]
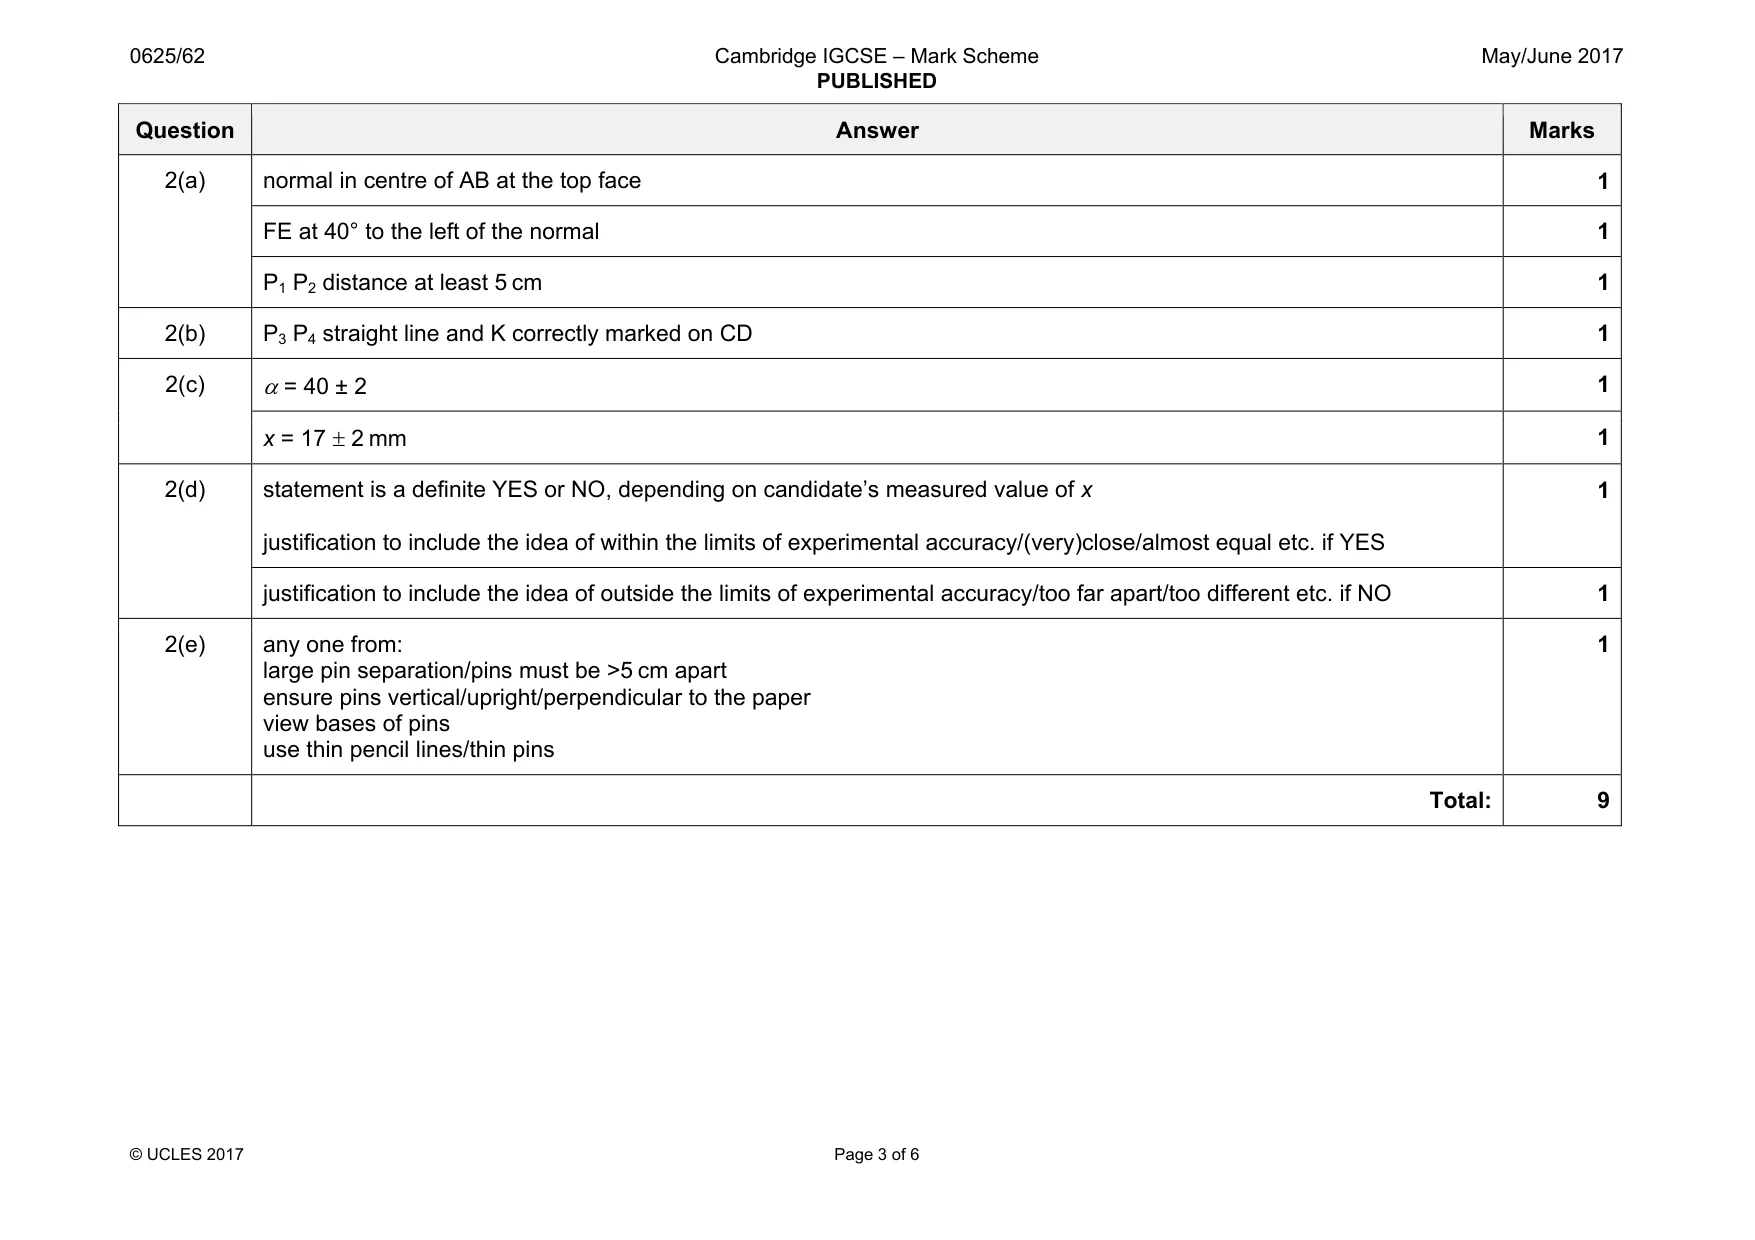
Mark scheme: 2(a) normal in centre of AB at the top face 1 FE at 40° to the left of the normal 1 P1 P2 distance at least 5 cm 1 2(b) P3 P4 straight line and K correctly marked on CD 1 2(c) α = 40 ± 2 1 x = 17 ± 2 mm 1 2(d) statement is a definite YES or NO, depending on candidate’s measured value of x justification to include the idea of within the limits of experimental accuracy/(very)close/almost equal etc. if YES 1 justification to include the idea of outside the limits of experimental accuracy/too far apart/too different etc. if NO 1 2(e) any one from: large pin separation/pins must be >5 cm apart ensure pins vertical/upright/perpendicular to the paper view bases of pins use thin pencil lines/thin pins 1 Total: 9
Q3 · The class is investigating images formed on a screen using a lens
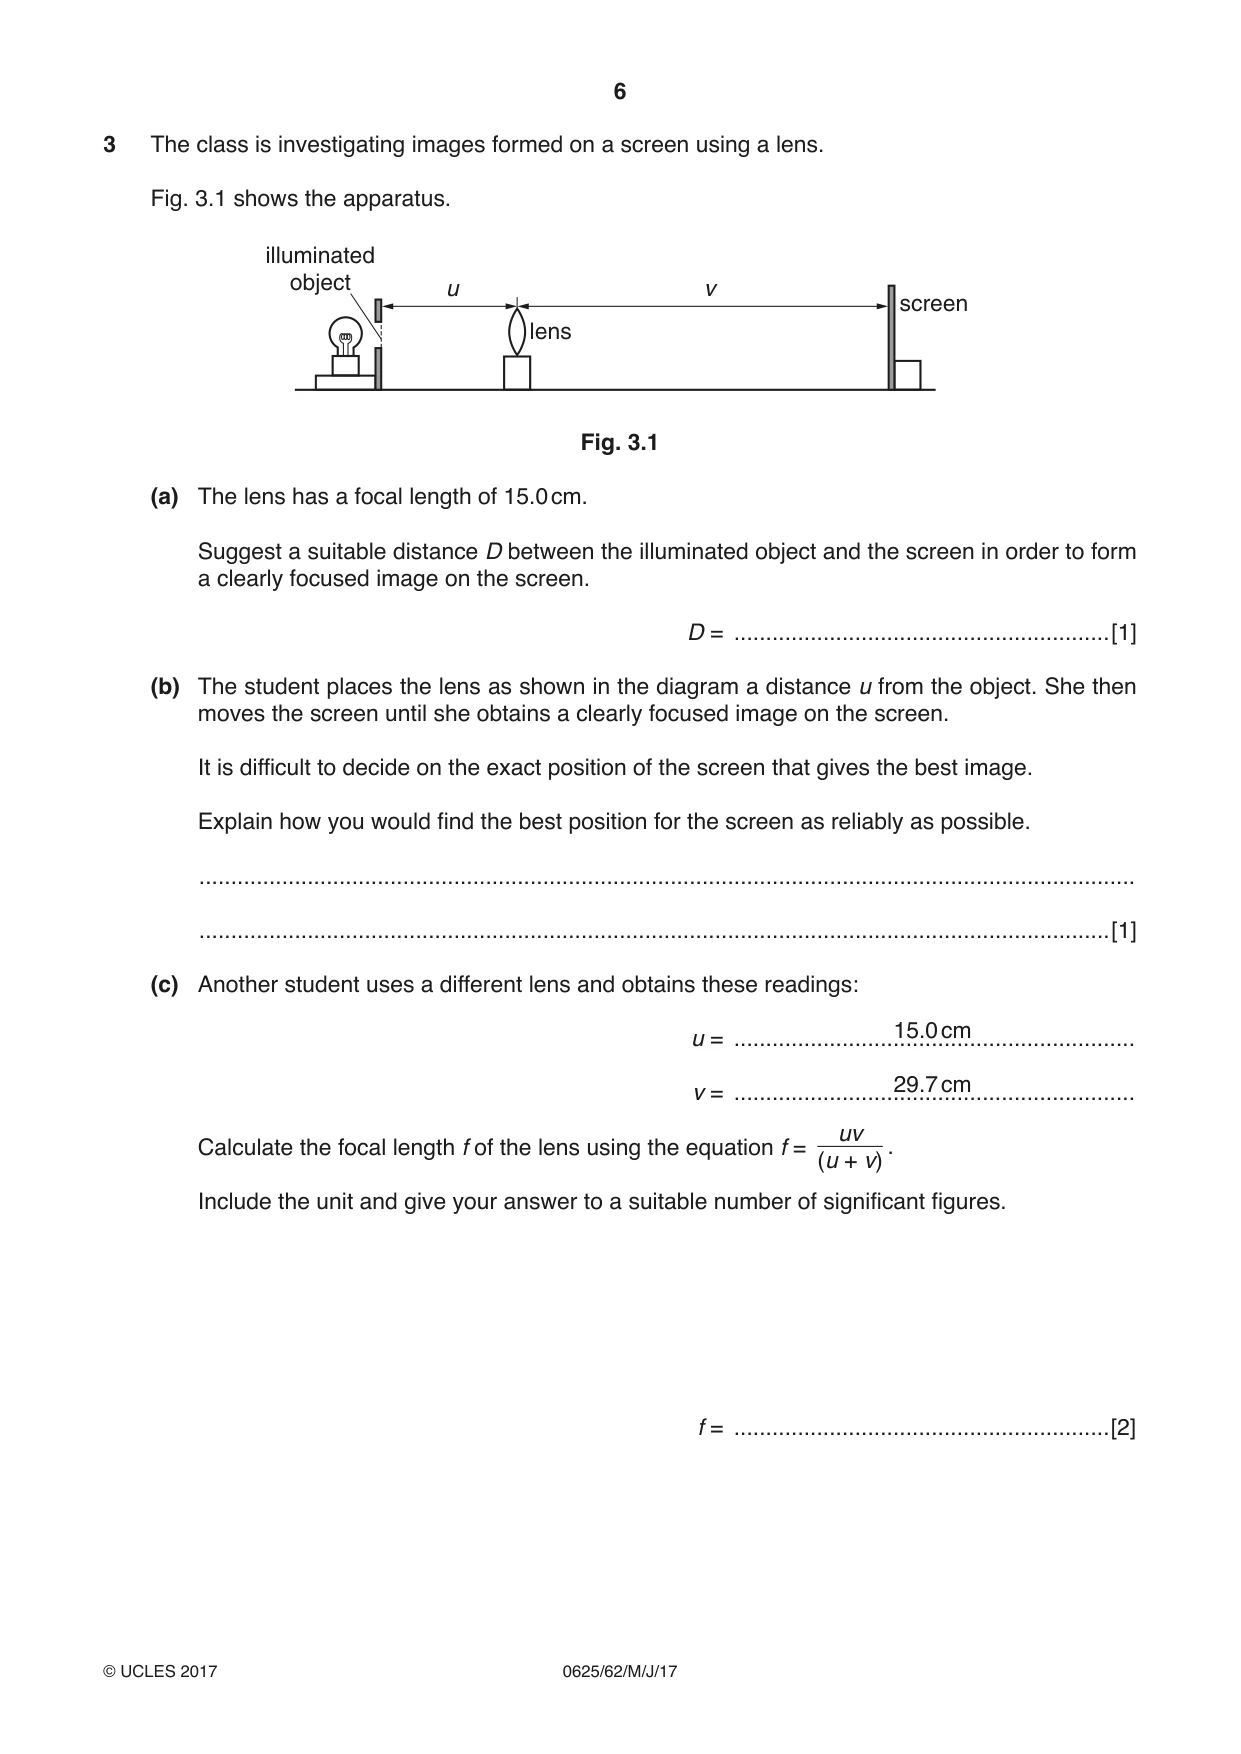
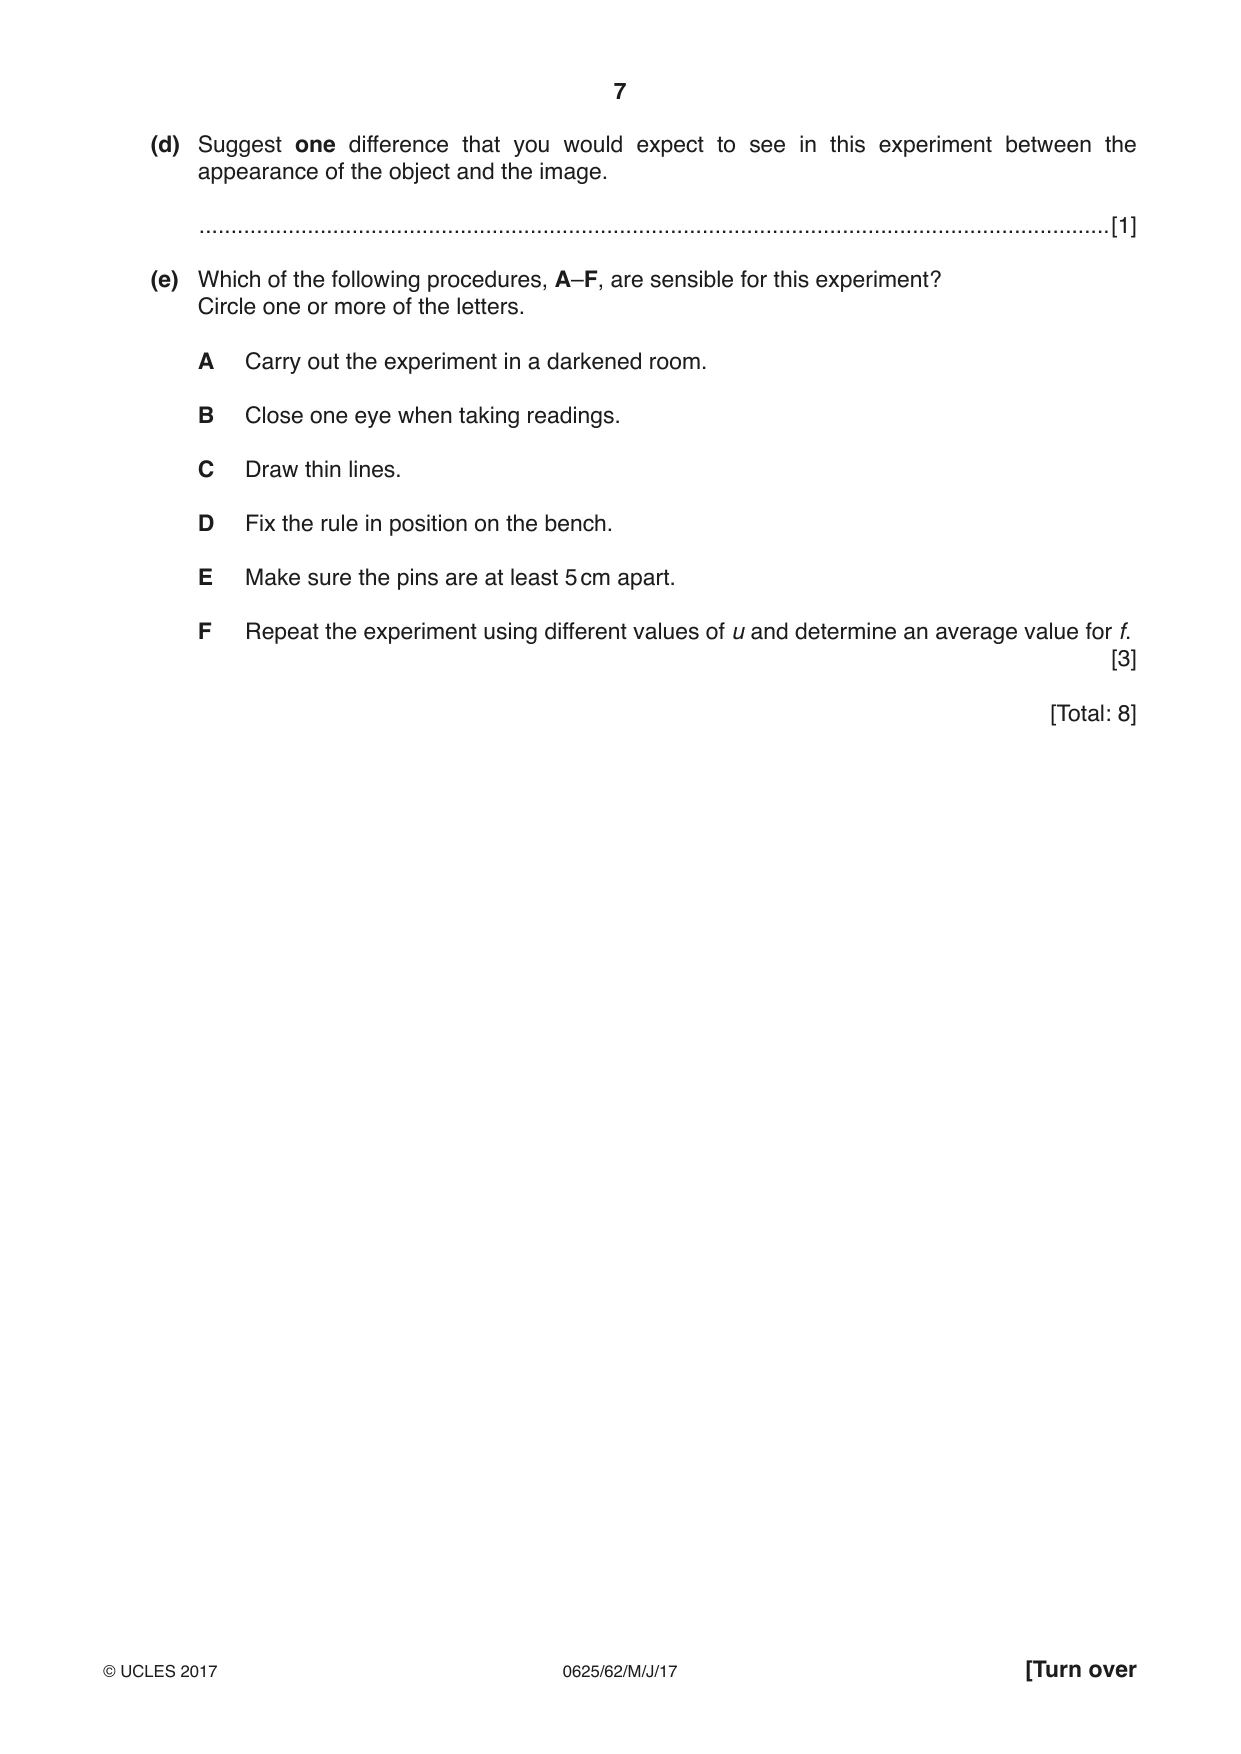
3 The class is investigating images formed on a screen using a lens. Fig. 3.1 shows the apparatus. illuminated object u v screen lens Fig. 3.1 (a) The lens has a focal length of 15.0 cm. Suggest a suitable distance D between the illuminated object and the screen in order to form a clearly focused image on the screen. D = ...........................................................[1] (b) The student places the lens as shown in the diagram a distance u from the object. She then moves the screen until she obtains a clearly focused image on the screen. It is difficult to decide on the exact position of the screen that gives the best image. Explain how you would find the best position for the screen as reliably as possible. ................................................................................................................................................... ...............................................................................................................................................[1] (c) Another student uses a different lens and obtains these readings: 15.0 cm u = ............................................................... 29.7 cm v = ............................................................... uv Calculate the focal length f of the lens using the equation f = . (u + v) Include the unit and give your answer to a suitable number of significant figures. f = ...........................................................[2] (d) Suggest one difference that you would expect to see in this experiment between the appearance of the object and the image. ...............................................................................................................................................[1] (e) Which of the following procedures, A–F, are sensible for this experiment? Circle one or more of the letters. A Carry out the experiment in a darkened room. B Close one eye when taking readings. C Draw thin lines. D Fix the rule in position on the bench. E Make sure the pins are at least 5 cm apart. F Repeat the experiment using different values of u and determine an average value for f. [3] [Total: 8]
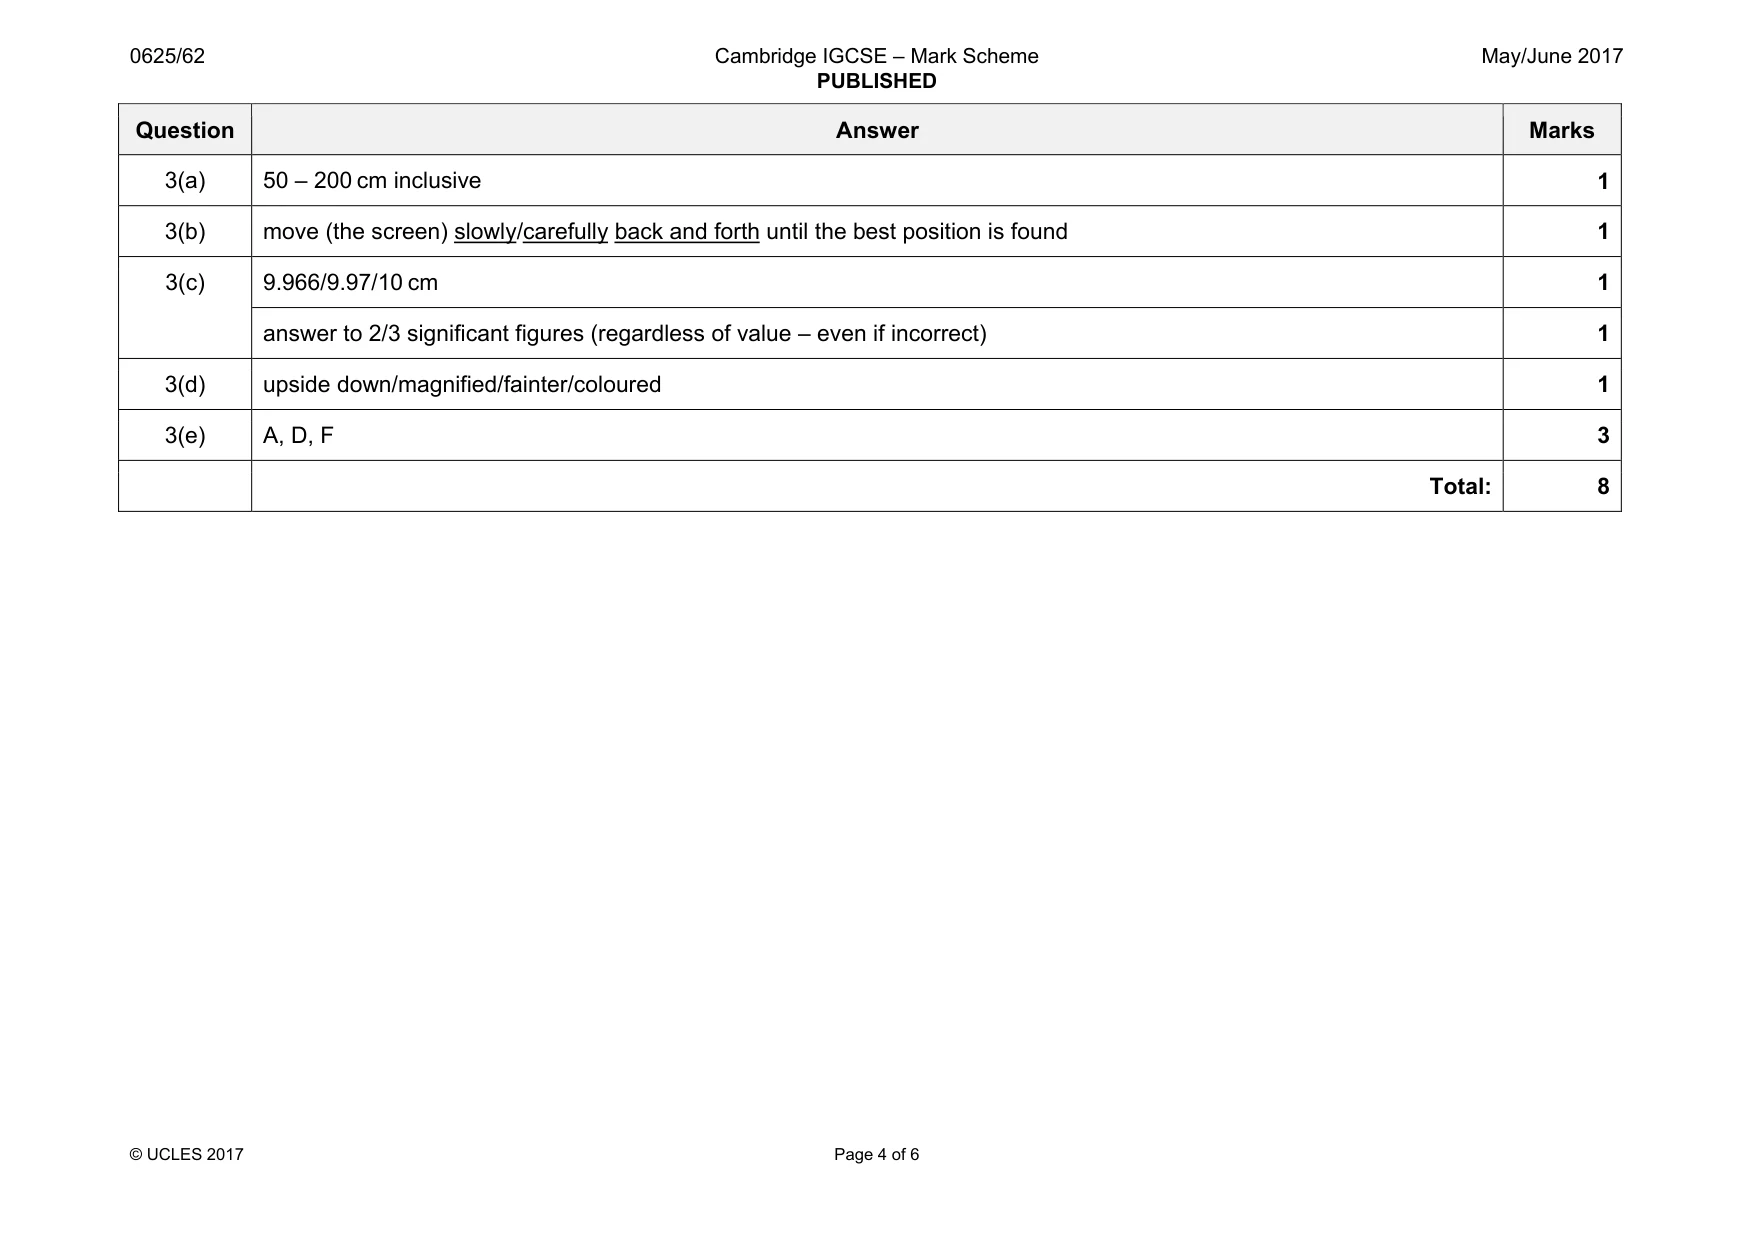
Mark scheme: 3(a) 50 – 200 cm inclusive 1 3(b) move (the screen) slowly/carefully back and forth until the best position is found 1 3(c) 9.966/9.97/10 cm 1 answer to 2/3 significant figures (regardless of value – even if incorrect) 1 3(d) upside down/magnified/fainter/coloured 1 3(e) A, D, F 3 Total: 8
Q4 · The class is investigating the principle of moments
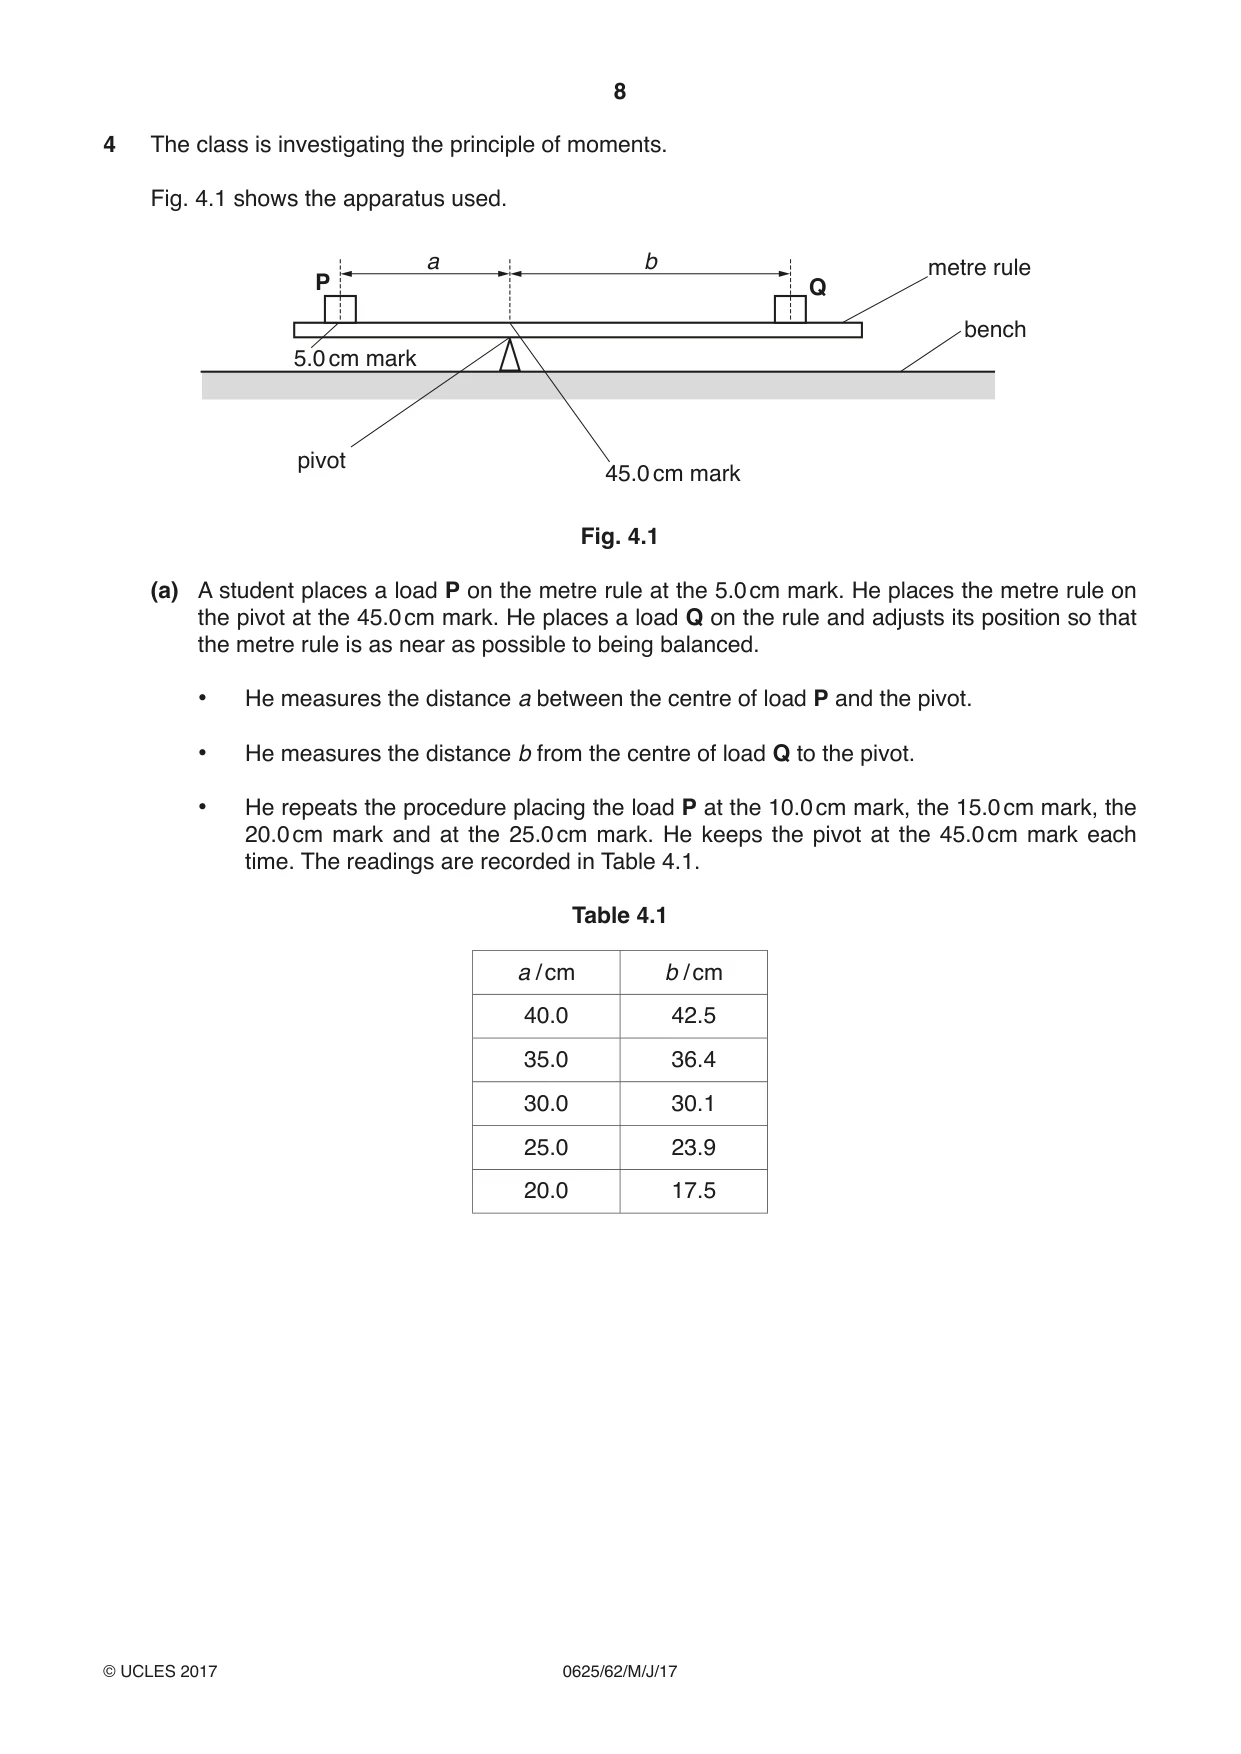
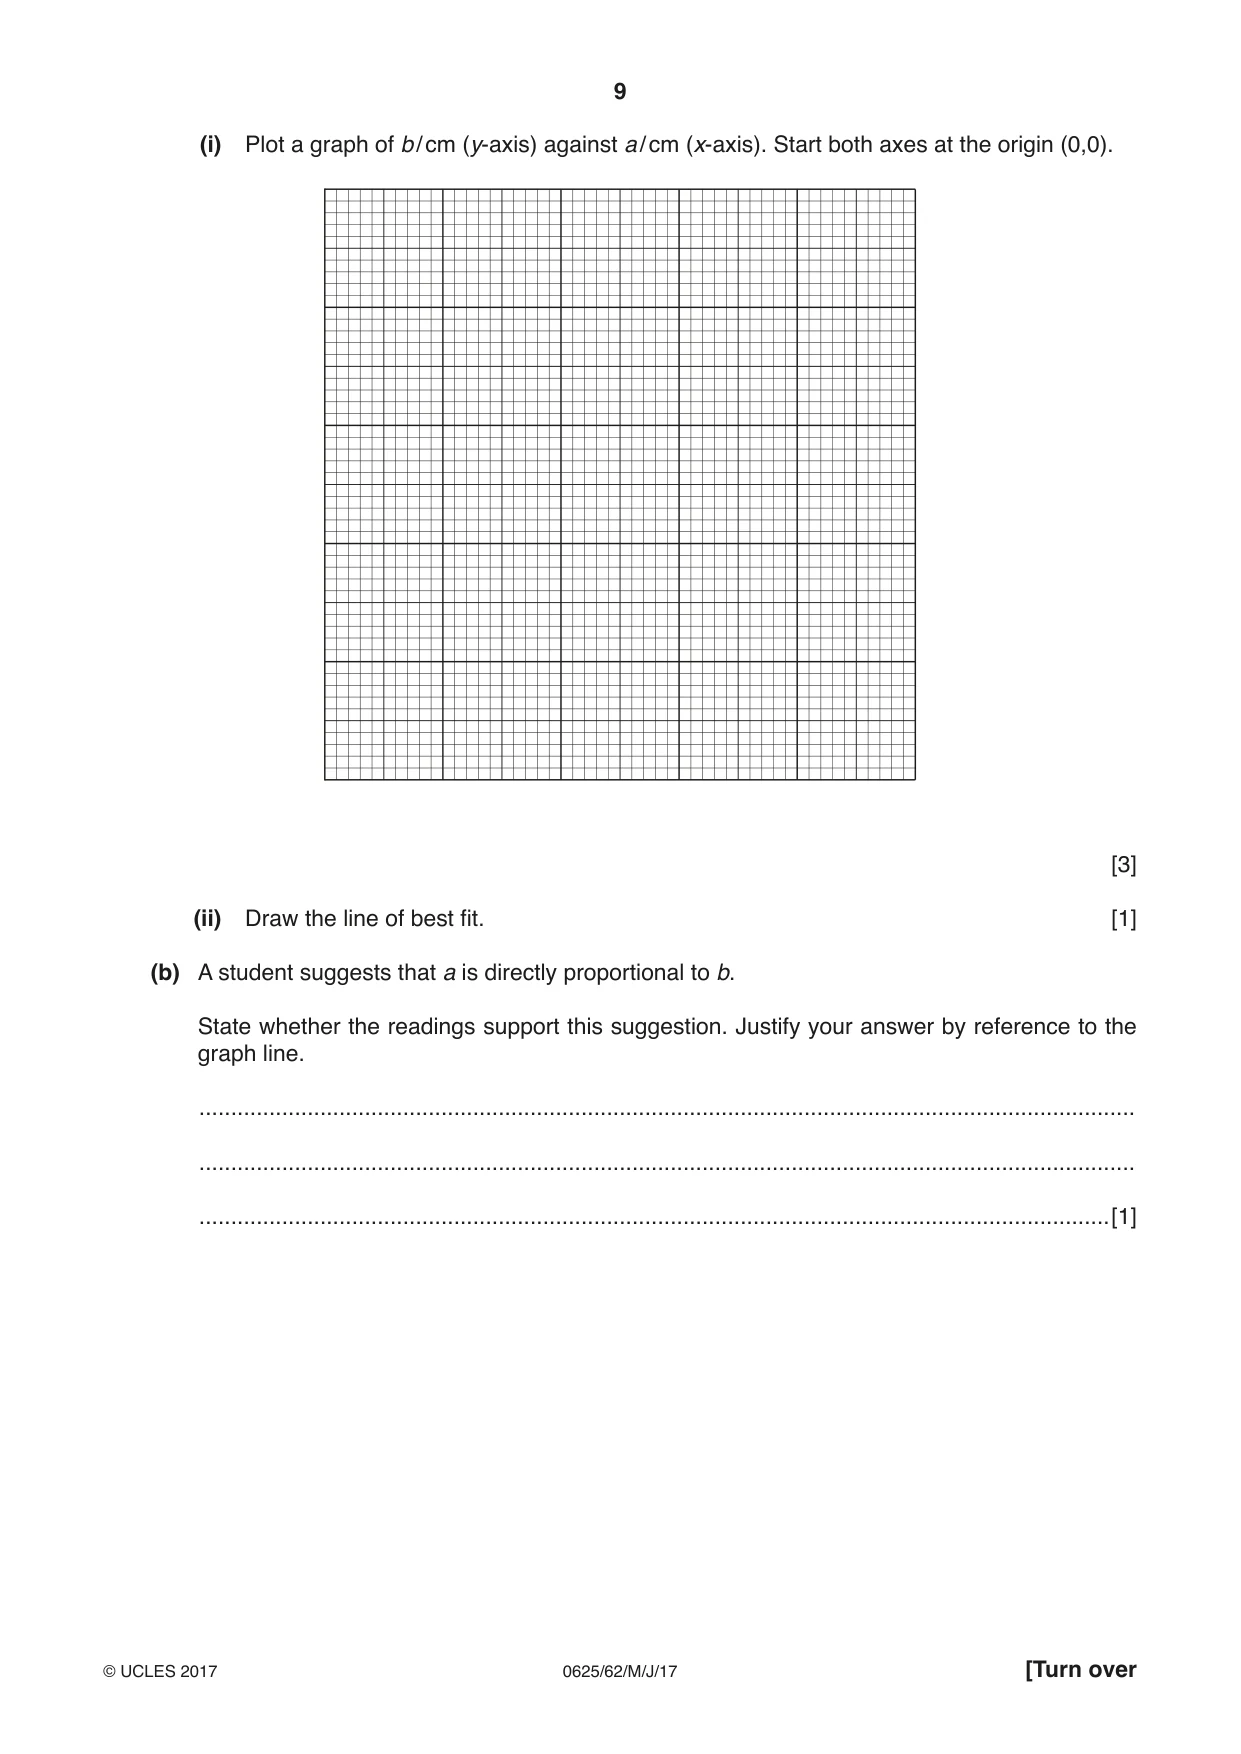
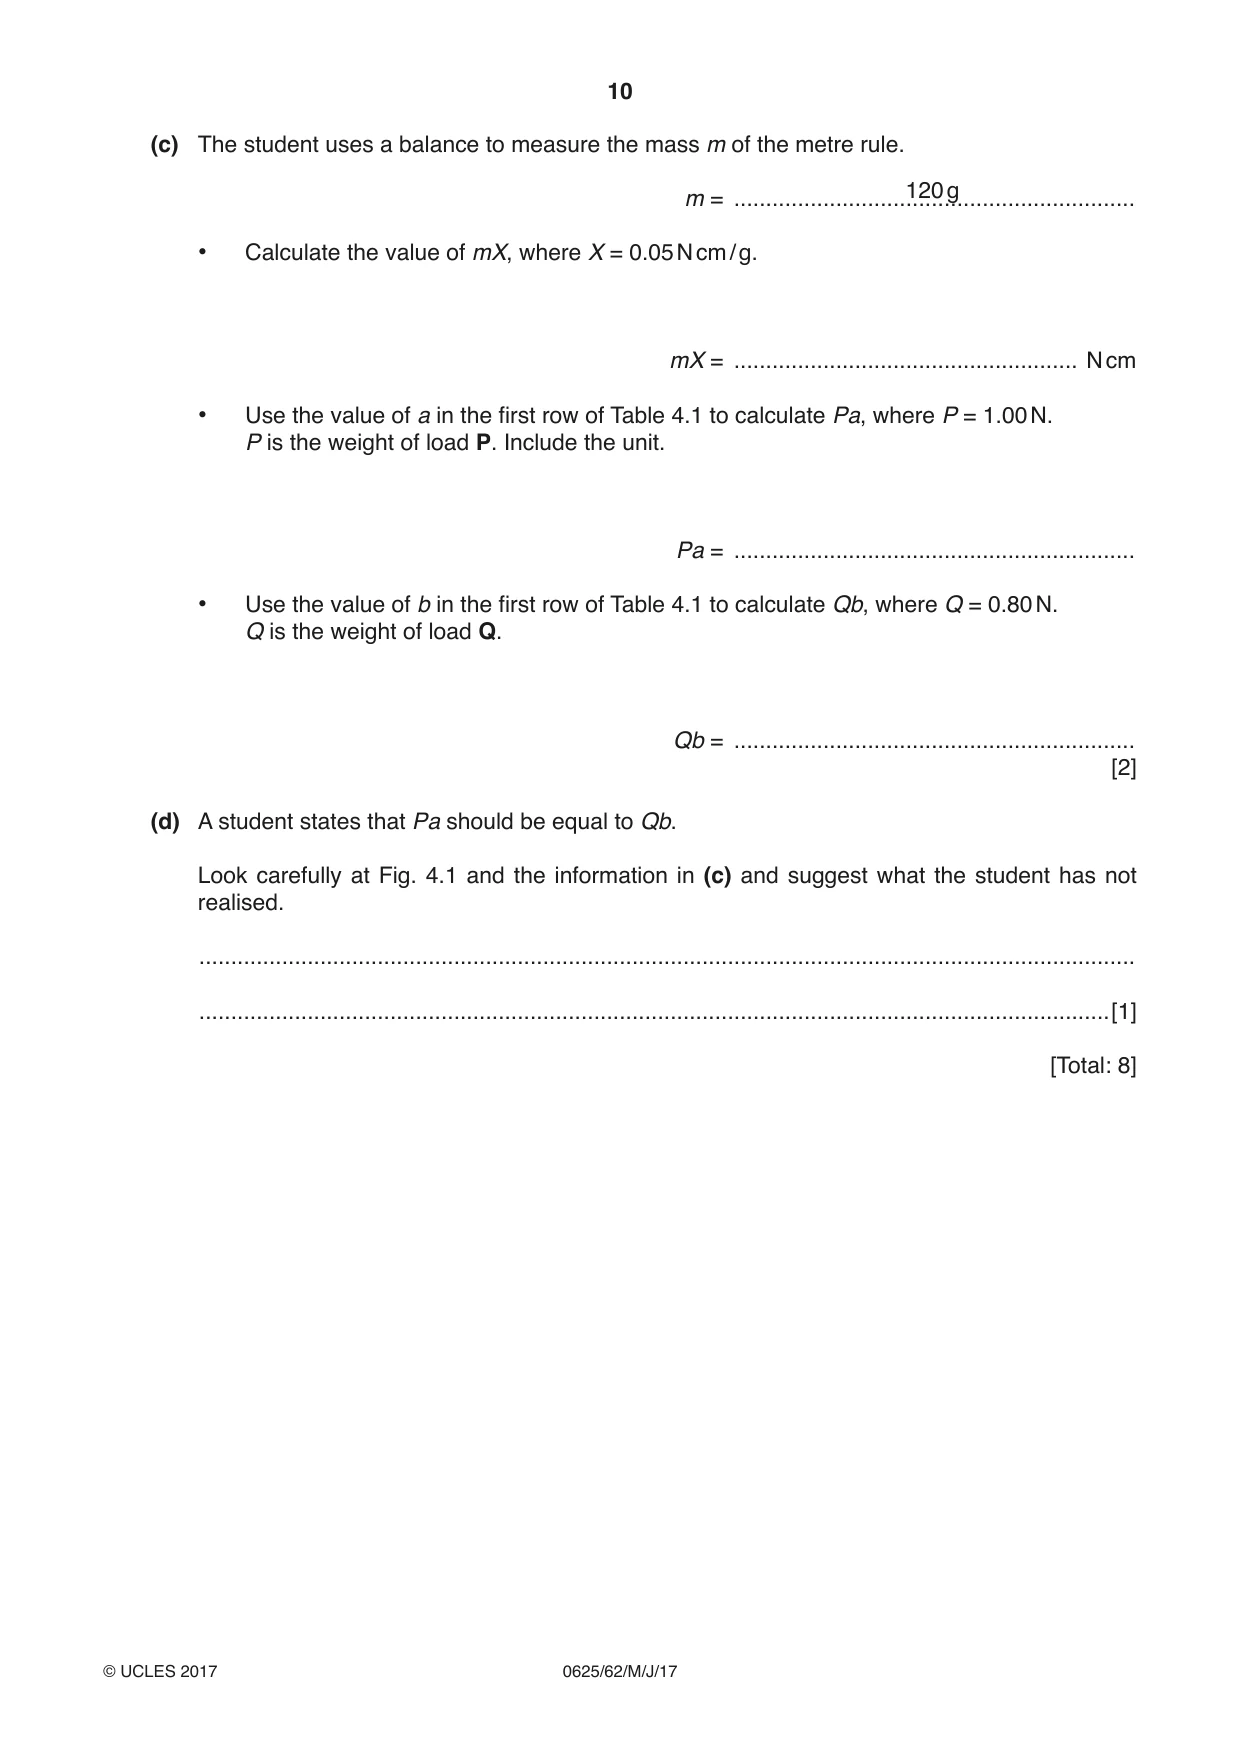
4 The class is investigating the principle of moments. Fig. 4.1 shows the apparatus used. a b metre rule P Q bench 5.0 cm mark pivot 45.0 cm mark Fig. 4.1 (a) A student places a load P on the metre rule at the 5.0 cm mark. He places the metre rule on the pivot at the 45.0 cm mark. He places a load Q on the rule and adjusts its position so that the metre rule is as near as possible to being balanced. • He measures the distance a between the centre of load P and the pivot. • He measures the distance b from the centre of load Q to the pivot. • He repeats the procedure placing the load P at the 10.0 cm mark, the 15.0 cm mark, the 20.0 cm mark and at the 25.0 cm mark. He keeps the pivot at the 45.0 cm mark each time. The readings are recorded in Table 4.1. Table 4.1 a / cm b / cm 40.0 42.5 35.0 36.4 30.0 30.1 25.0 23.9 20.0 17.5 (i) Plot a graph of b / cm (y-axis) against a / cm (x-axis). Start both axes at the origin (0,0). [3] (ii) Draw the line of best fit. [1] (b) A student suggests that a is directly proportional to b. State whether the readings support this suggestion. Justify your answer by reference to the graph line. ................................................................................................................................................... ................................................................................................................................................... ...............................................................................................................................................[1] (c) The student uses a balance to measure the mass m of the metre rule. 120 g m = ............................................................... • Calculate the value of mX, where X = 0.05 N cm / g. mX = ...................................................... N cm • Use the value of a in the first row of Table 4.1 to calculate Pa, where P = 1.00 N. P is the weight of load P. Include the unit. Pa = ............................................................... • Use the value of b in the first row of Table 4.1 to calculate Qb, where Q = 0.80 N. Q is the weight of load Q. Qb = ............................................................... [2] (d) A student states that Pa should be equal to Qb. Look carefully at Fig. 4.1 and the information in (c) and suggest what the student has not realised. ................................................................................................................................................... ...............................................................................................................................................[1] [Total: 8]
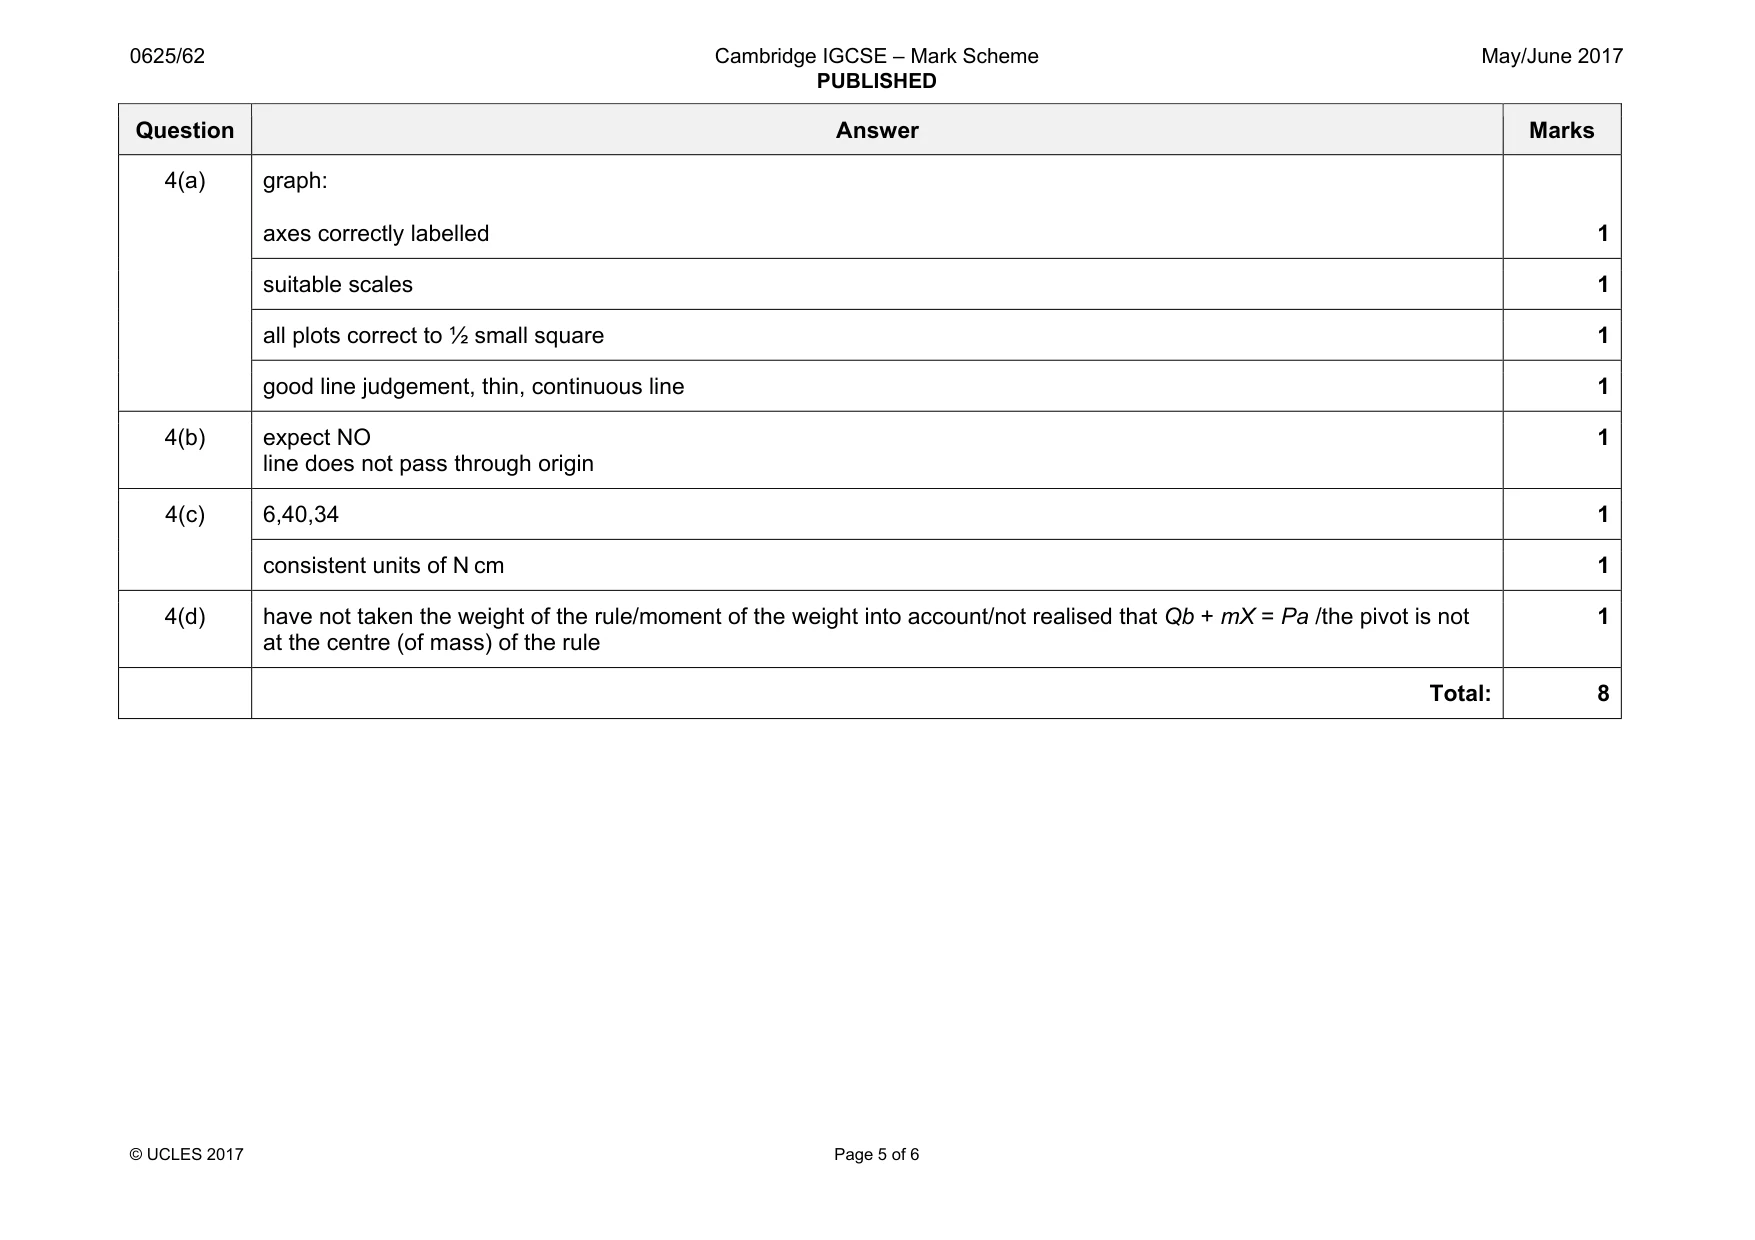
Mark scheme: 4(a) graph: axes correctly labelled 1 suitable scales 1 all plots correct to ½ small square 1 good line judgement, thin, continuous line 1 4(b) expect NO line does not pass through origin 1 4(c) 6,40,34 1 consistent units of N cm 1 4(d) have not taken the weight of the rule/moment of the weight into account/not realised that Qb + mX = Pa /the pivot is not at the centre (of mass) of the rule 1 Total: 8
Q5 · A student is investigating the effect of draughts (moving air) on the rate of cooling of…
5 A student is investigating the effect of draughts (moving air) on the rate of cooling of hot water. The following apparatus is available to the student: an electric fan with four speed settings a supply of hot water thermometer 250 cm3 beaker 250 cm3 measuring cylinder stopwatch clamp, boss and stand. Plan an experiment to investigate the effect of draughts on the rate of cooling of hot water. You should: • explain briefly how you would carry out the investigation • state the key variables that you would control • draw a table, or tables, with column headings, to show how you would display your readings (you are not required to enter any readings in the table) • explain how you would use your readings to reach a conclusion. You may draw a diagram if it helps your explanation. .......................................................................................................................................................... .......................................................................................................................................................... .......................................................................................................................................................... .......................................................................................................................................................... .......................................................................................................................................................... .......................................................................................................................................................... .......................................................................................................................................................... .......................................................................................................................................................... .......................................................................................................................................................... .......................................................................................................................................................... .......................................................................................................................................................... .......................................................................................................................................................... .......................................................................................................................................................... .......................................................................................................................................................... ......................................................................................................................................................[7] [Total: 7]
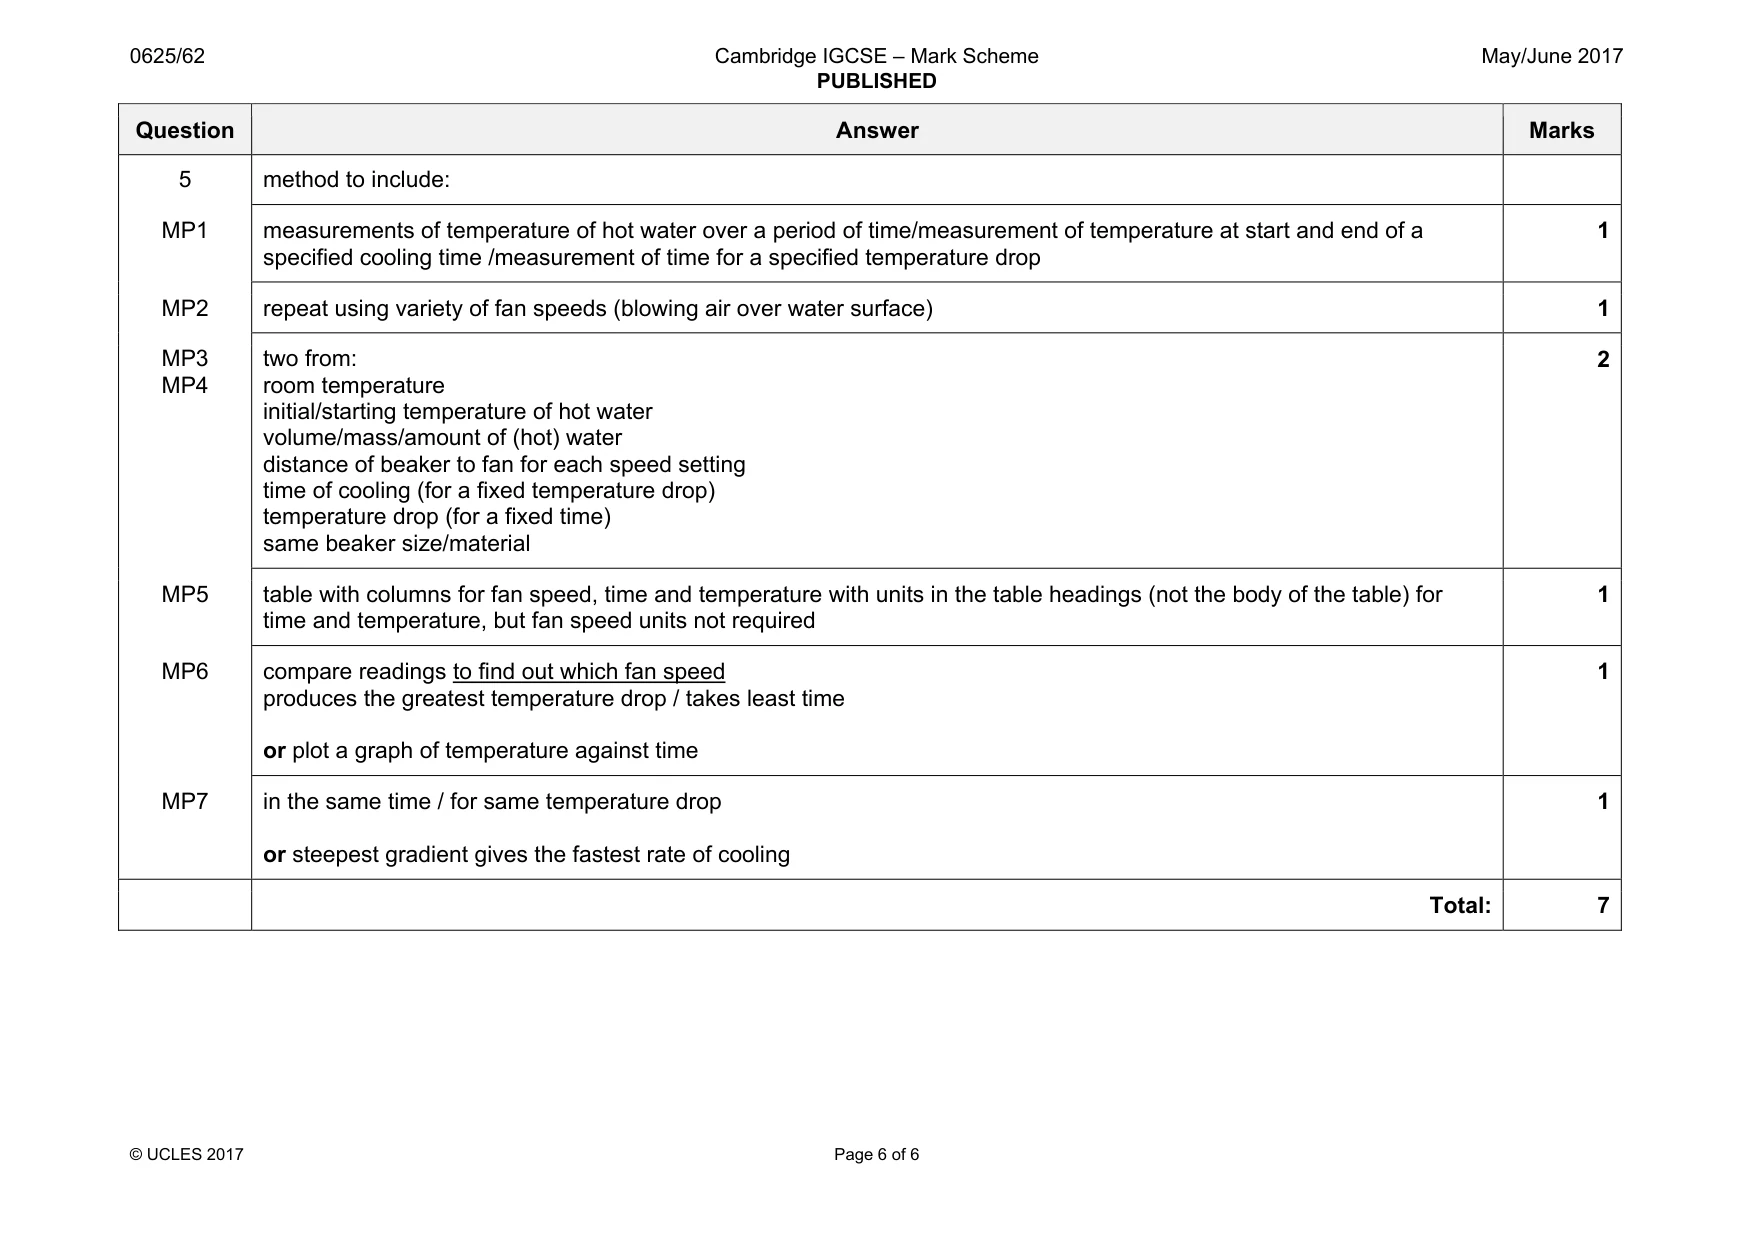
Mark scheme: 5 method to include: MP1 measurements of temperature of hot water over a period of time/measurement of temperature at start and end of a specified cooling time /measurement of time for a specified temperature drop 1 MP2 repeat using variety of fan speeds (blowing air over water surface) 1 MP3 MP4 two from: room temperature initial/starting temperature of hot water volume/mass/amount of (hot) water distance of beaker to fan for each speed setting time of cooling (for a fixed temperature drop) temperature drop (for a fixed time) same beaker size/material 2 MP5 table with columns for fan speed, time and temperature with units in the table headings (not the body of the table) for time and temperature, but fan speed units not required 1 MP6 compare readings to find out which fan speed produces the greatest temperature drop / takes least time or plot a graph of temperature against time 1 MP7 in the same time / for same temperature drop or steepest gradient gives the fastest rate of cooling 1 Total: 7
What was in this paper
The subtopics covered by these 5 questions, and how many questions each got. Open one in a new tab to see every Cambridge question on it.
What you needed in this session
Cambridge’s own grade thresholds for 2017 May/June, Paper 6 · Variant 2. A higher threshold means an easier paper — the bar moves with how the cohort did.