Cambridge IGCSE Physics 0625 — 2014 May/June Paper 5 · Variant 1
0625/51/M/J/14 · 4 questions · 40 marks · ≈45 min
The question paper and its mark scheme, free to read here and free to download. This is Cambridge’s own paper, exactly as it was sat.
Question paper12 pages

Mark scheme4 pages
Answers below. Sit the paper first if you are practising.
Questions as text
Q1 · In this experiment, you will investigate the motion of a mass hanging on a spring
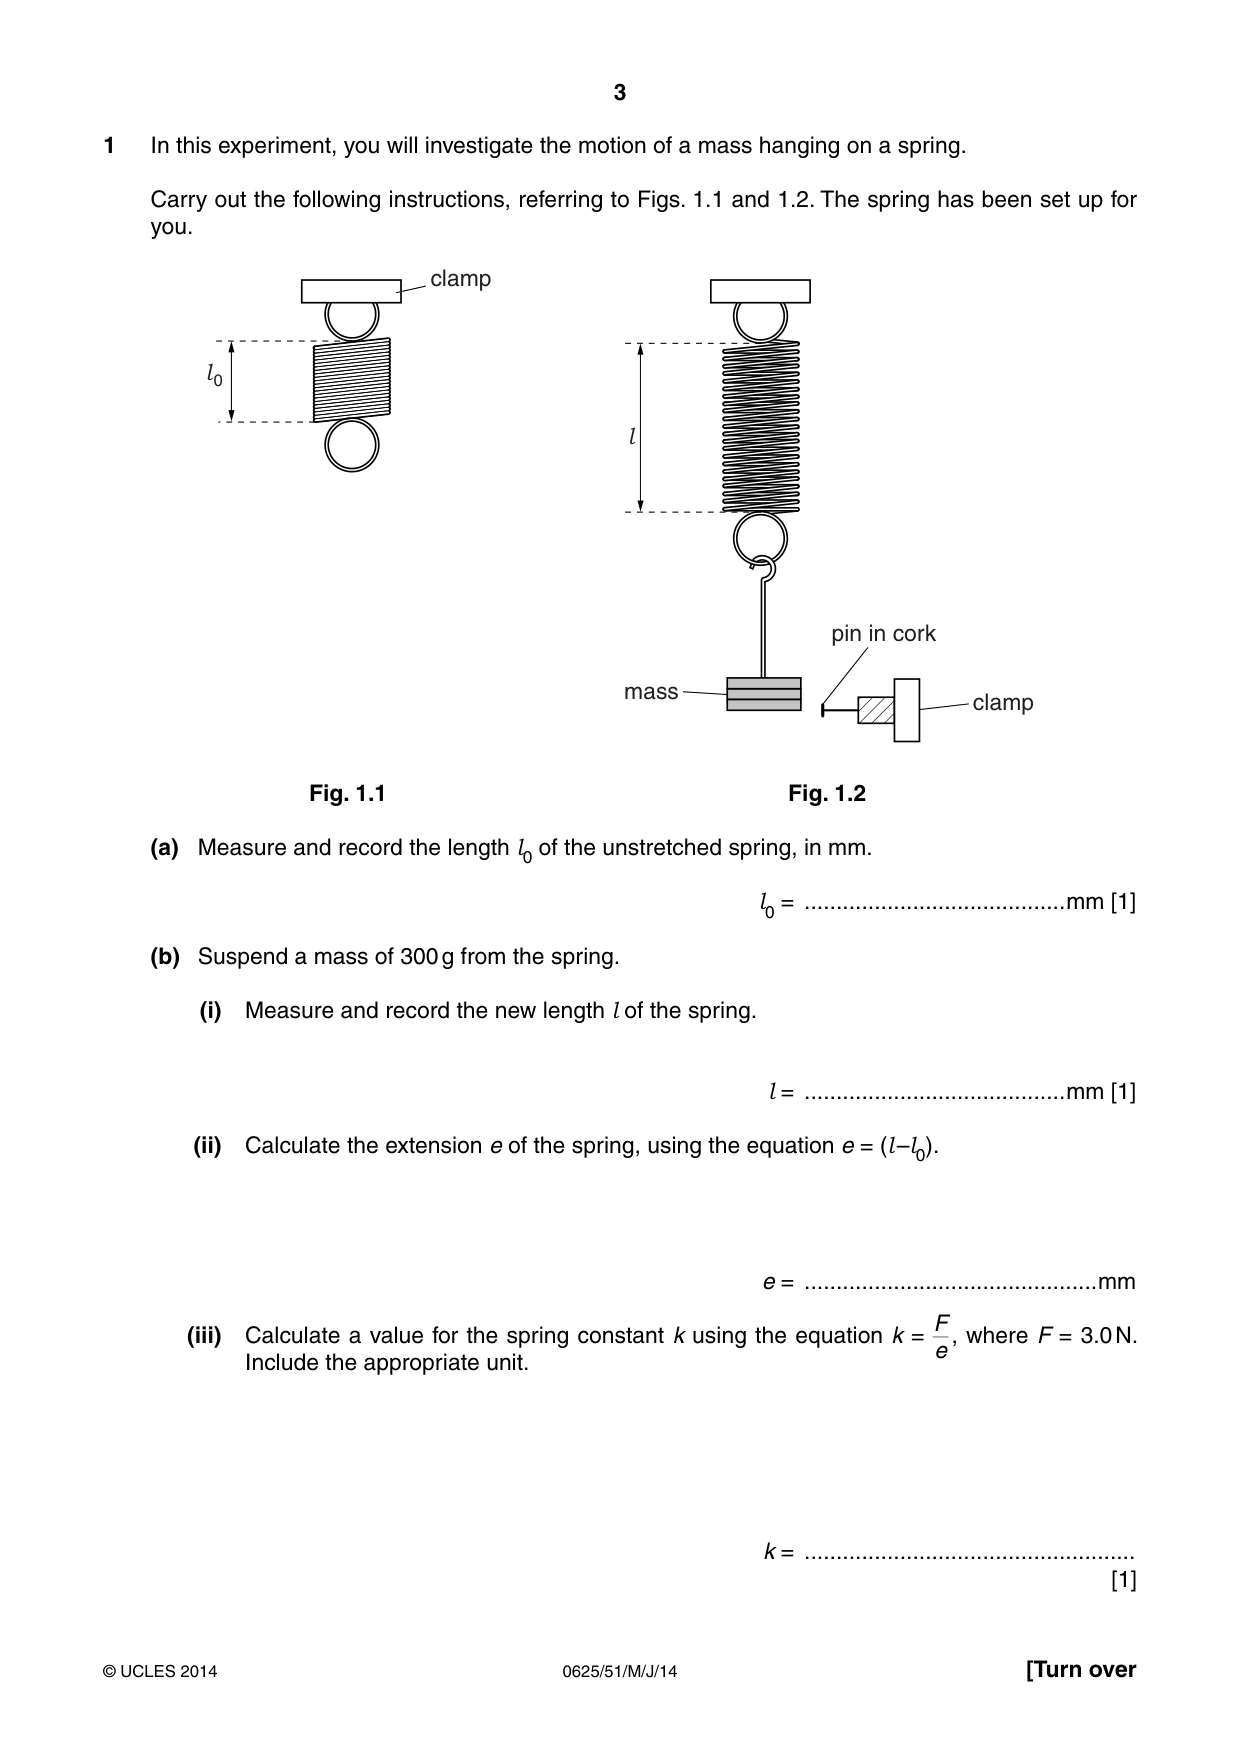
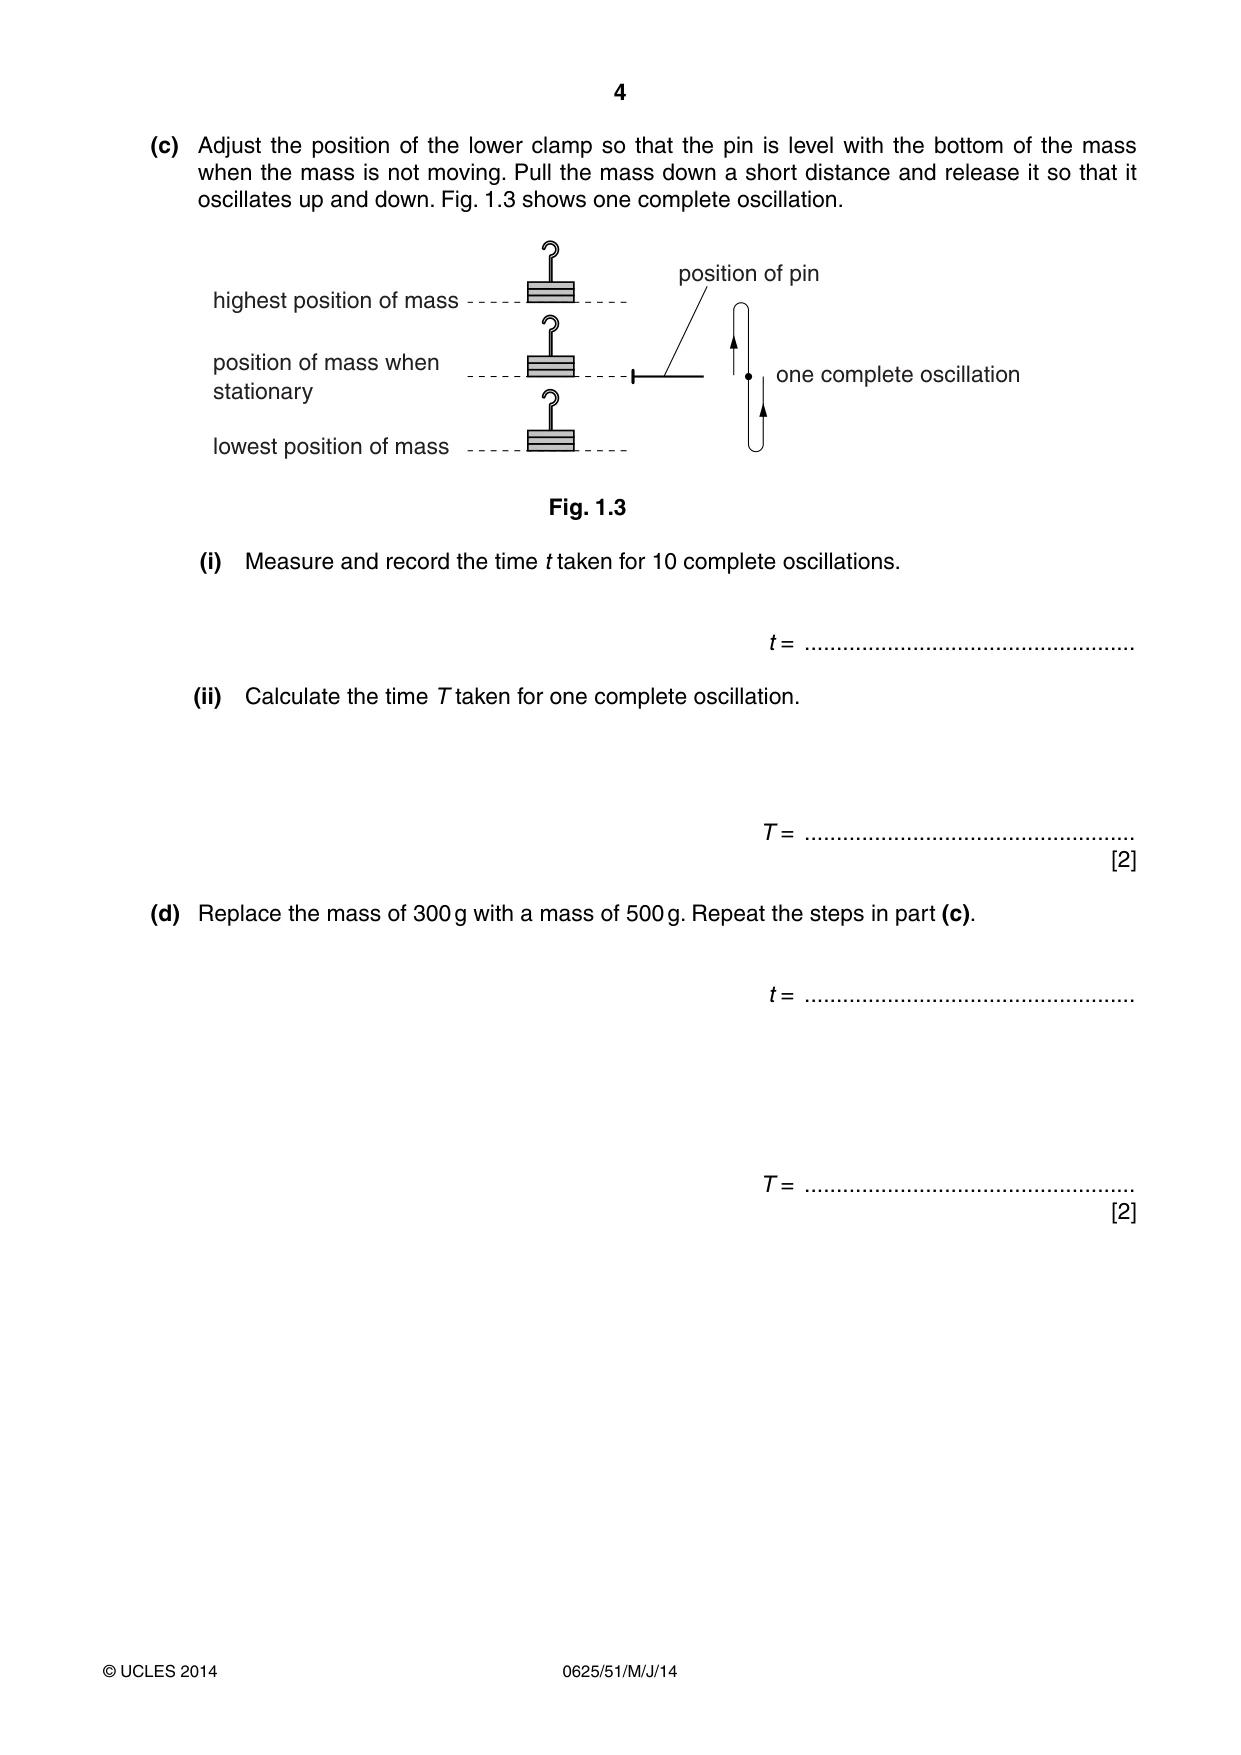
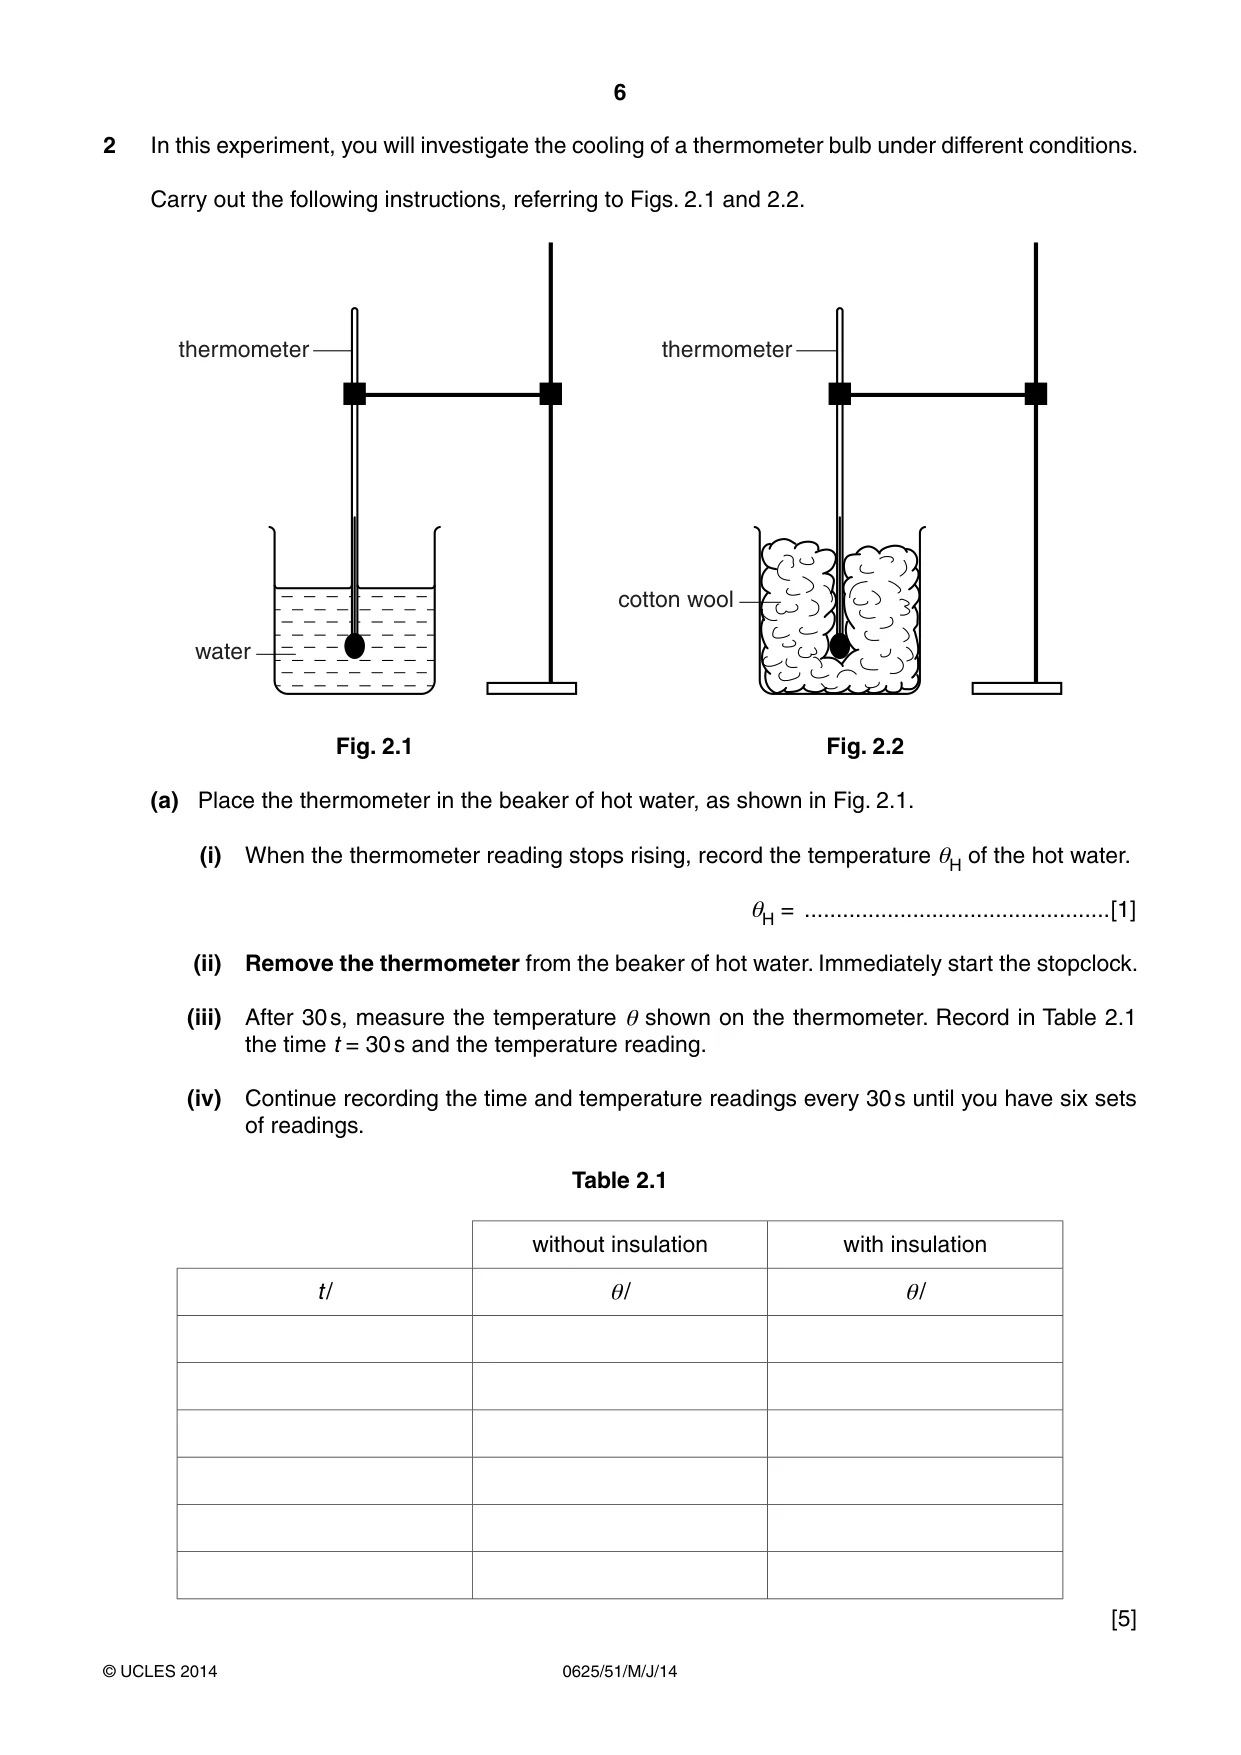
1 In this experiment, you will investigate the motion of a mass hanging on a spring. Carry out the following instructions, referring to Figs. 1.1 and 1.2. The spring has been set up for you. clamp l 0 l pin in cork mass clamp Fig. 1.1 Fig. 1.2 (a) Measure and record the length l0 of the unstretched spring, in mm. l0 = .........................................mm [1] (b) Suspend a mass of 300 g from the spring. (i) Measure and record the new length l of the spring. l = .........................................mm [1] (ii) Calculate the extension e of the spring, using the equation e = (l –l0). e = ..............................................mm F (iii) Calculate a value for the spring constant k using the equation k = , where F = 3.0 N. e Include the appropriate unit. k = .................................................... [1] (c) Adjust the position of the lower clamp so that the pin is level with the bottom of the mass when the mass is not moving. Pull the mass down a short distance and release it so that it oscillates up and down. Fig. 1.3 shows one complete oscillation. position of pin highest position of mass position of mass when one complete oscillation stationary lowest position of mass Fig. 1.3 (i) Measure and record the time t taken for 10 complete oscillations. t = .................................................... (ii) Calculate the time T taken for one complete oscillation. T = .................................................... [2] (d) Replace the mass of 300 g with a mass of 500 g. Repeat the steps in part (c). t = .................................................... T = .................................................... [2] (e) A student suggests that the time T taken for one oscillation should not be affected by the change in mass. State whether your results support this suggestion. Justify your answer by reference to your results. statement .................................................................................................................................. justification ................................................................................................................................ ................................................................................................................................................... ................................................................................................................................................... [2] (f) Explain briefly how you can avoid a line-of-sight (parallax) error when measuring the length of the spring. You may draw a diagram. ................................................................................................................................................... ................................................................................................................................................... ...............................................................................................................................................[1] [Total: 10]
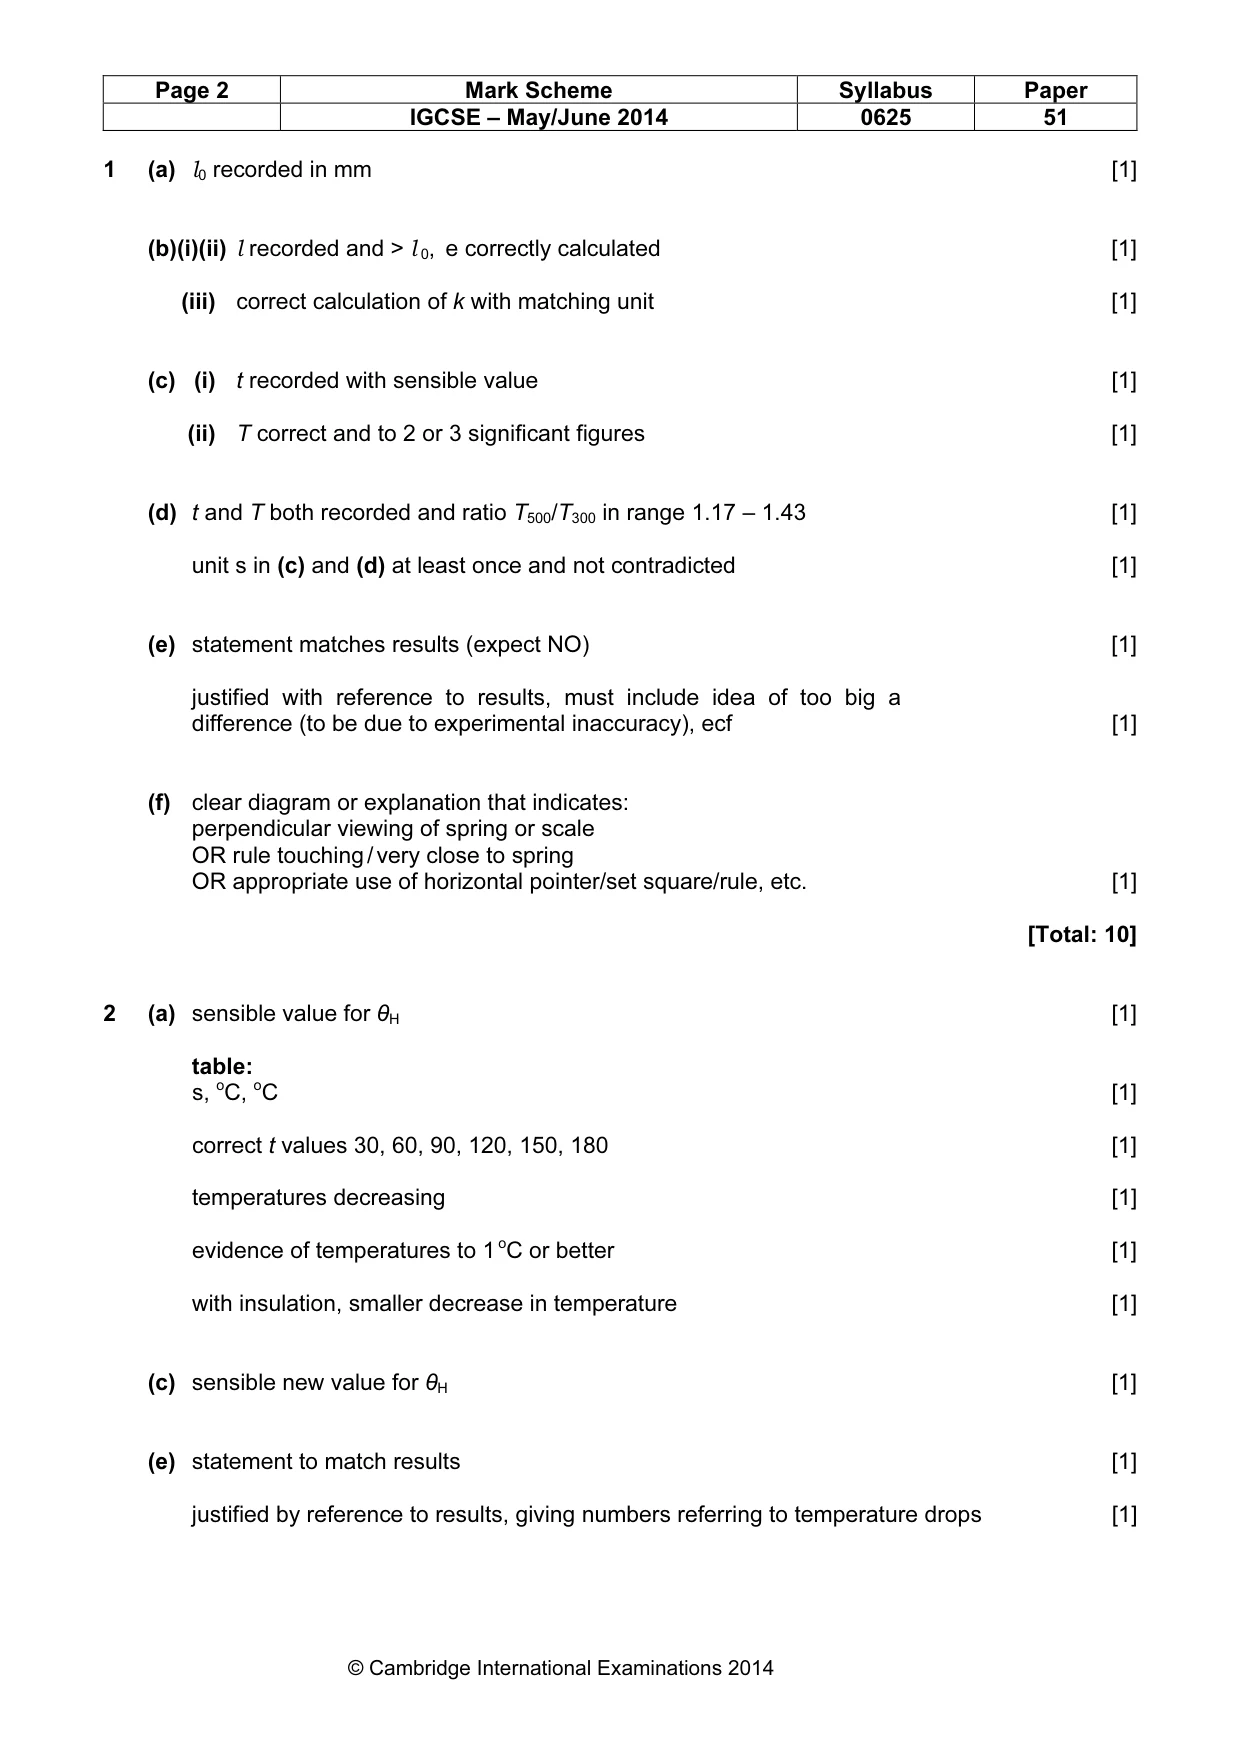
Mark scheme: 1 (a) l0 recorded in mm [1] (b)(i)(ii) l recorded and > l 0, e correctly calculated [1] (iii) correct calculation of k with matching unit [1] (c) (i) t recorded with sensible value [1] (ii) T correct and to 2 or 3 significant figures [1] (d) t and T both recorded and ratio T500/T300 in range 1.17 – 1.43 [1] unit s in (c) and (d) at least once and not contradicted [1] (e) statement matches results (expect NO) [1] justified with reference to results, must include idea of too big a difference (to be due to experimental inaccuracy), ecf [1] (f) clear diagram or explanation that indicates: perpendicular viewing of spring or scale OR rule touching / very close to spring OR appropriate use of horizontal pointer/set square/rule, etc. [1] [Total: 10]
More questions on Physical quantities and measurement techniques
Q2 · In this experiment, you will investigate the cooling of a thermometer bulb under…
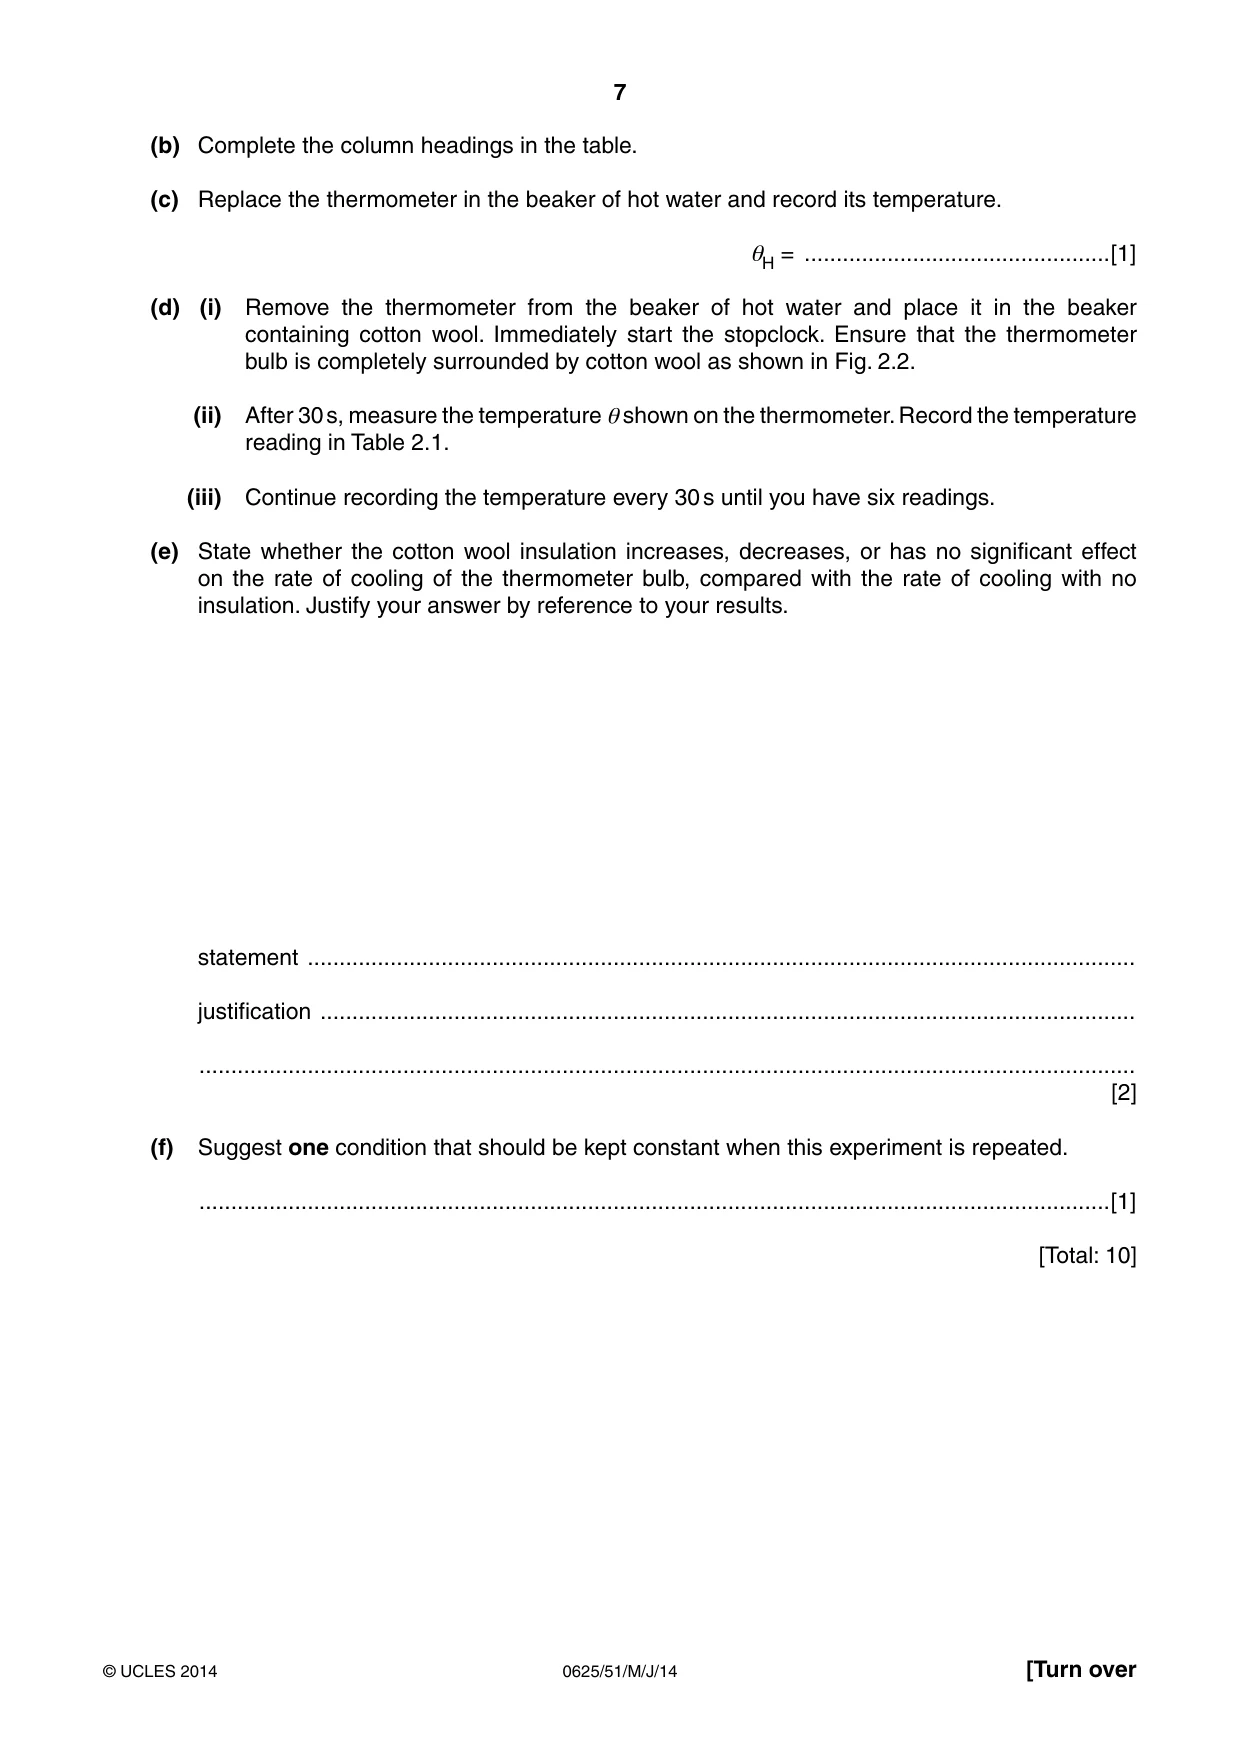
2 In this experiment, you will investigate the cooling of a thermometer bulb under different conditions. Carry out the following instructions, referring to Figs. 2.1 and 2.2. thermometer thermometer cotton wool water Fig. 2.1 Fig. 2.2 (a) Place the thermometer in the beaker of hot water, as shown in Fig. 2.1. (i) When the thermometer reading stops rising, record the temperature θH of the hot water. θH = ................................................[1] (ii) Remove the thermometer from the beaker of hot water. Immediately start the stopclock. (iii) After 30 s, measure the temperature θ shown on the thermometer. Record in Table 2.1 the time t = 30 s and the temperature reading. (iv) Continue recording the time and temperature readings every 30 s until you have six sets of readings. Table 2.1 without insulation with insulation t / θ/ θ/ [5] (b) Complete the column headings in the table. (c) Replace the thermometer in the beaker of hot water and record its temperature. θH = ................................................[1] (d) (i) Remove the thermometer from the beaker of hot water and place it in the beaker containing cotton wool. Immediately start the stopclock. Ensure that the thermometer bulb is completely surrounded by cotton wool as shown in Fig. 2.2. (ii) After 30 s, measure the temperature θ shown on the thermometer. Record the temperature reading in Table 2.1. (iii) Continue recording the temperature every 30 s until you have six readings. (e) State whether the cotton wool insulation increases, decreases, or has no significant effect on the rate of cooling of the thermometer bulb, compared with the rate of cooling with no insulation. Justify your answer by reference to your results. statement .................................................................................................................................. justification ................................................................................................................................ ................................................................................................................................................... [2] (f) Suggest one condition that should be kept constant when this experiment is repeated. ...............................................................................................................................................[1] [Total: 10]
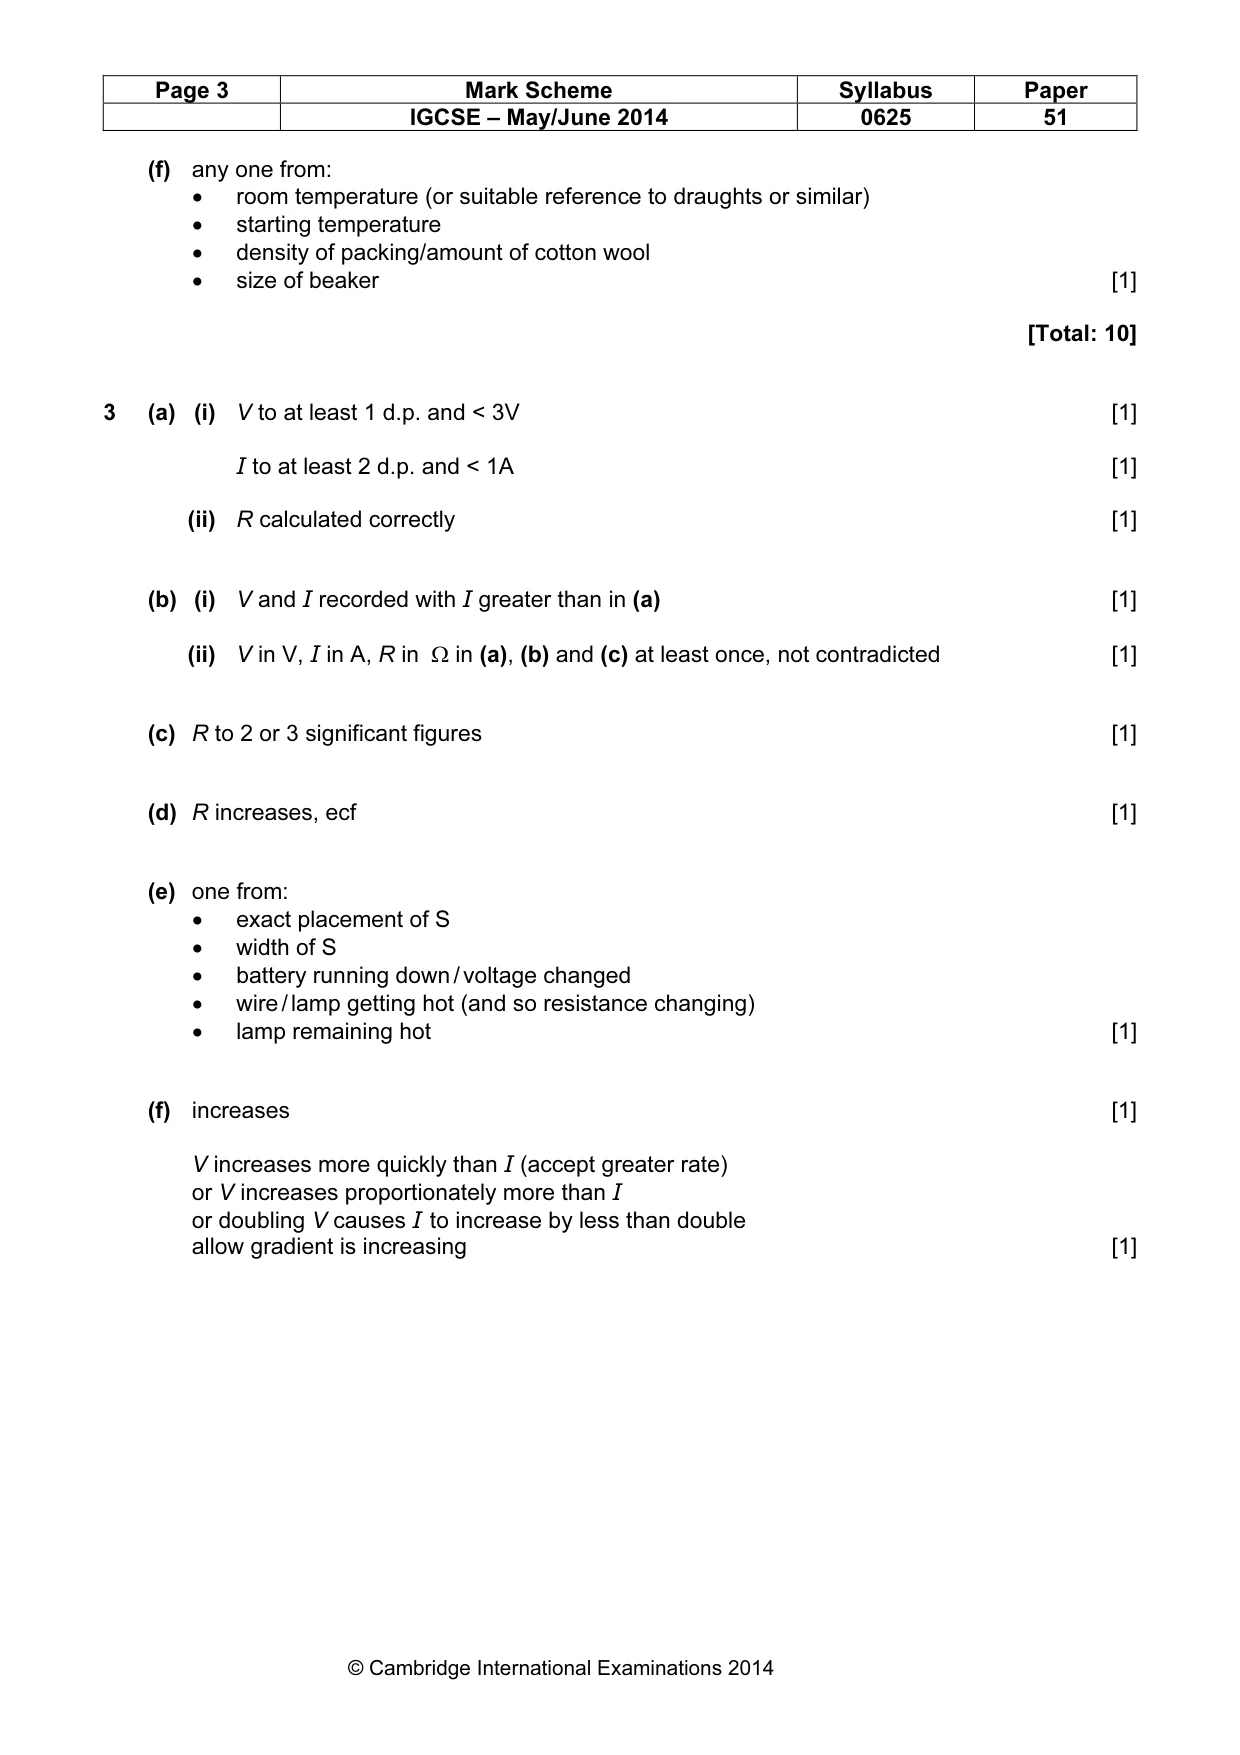
Mark scheme: 2 (a) sensible value for θH [1] table: s, oC, oC [1] correct t values 30, 60, 90, 120, 150, 180 [1] temperatures decreasing [1] evidence of temperatures to 1 oC or better [1] with insulation, smaller decrease in temperature [1] (c) sensible new value for θH [1] (e) statement to match results [1] justified by reference to results, giving numbers referring to temperature drops [1] IGCSE – May/June 2014 0625 51 (f) any one from: • room temperature (or suitable reference to draughts or similar) • starting temperature • density of packing/amount of cotton wool • size of beaker [1] [Total: 10]
Q3 · In this experiment, you will investigate the resistance of a lamp filament
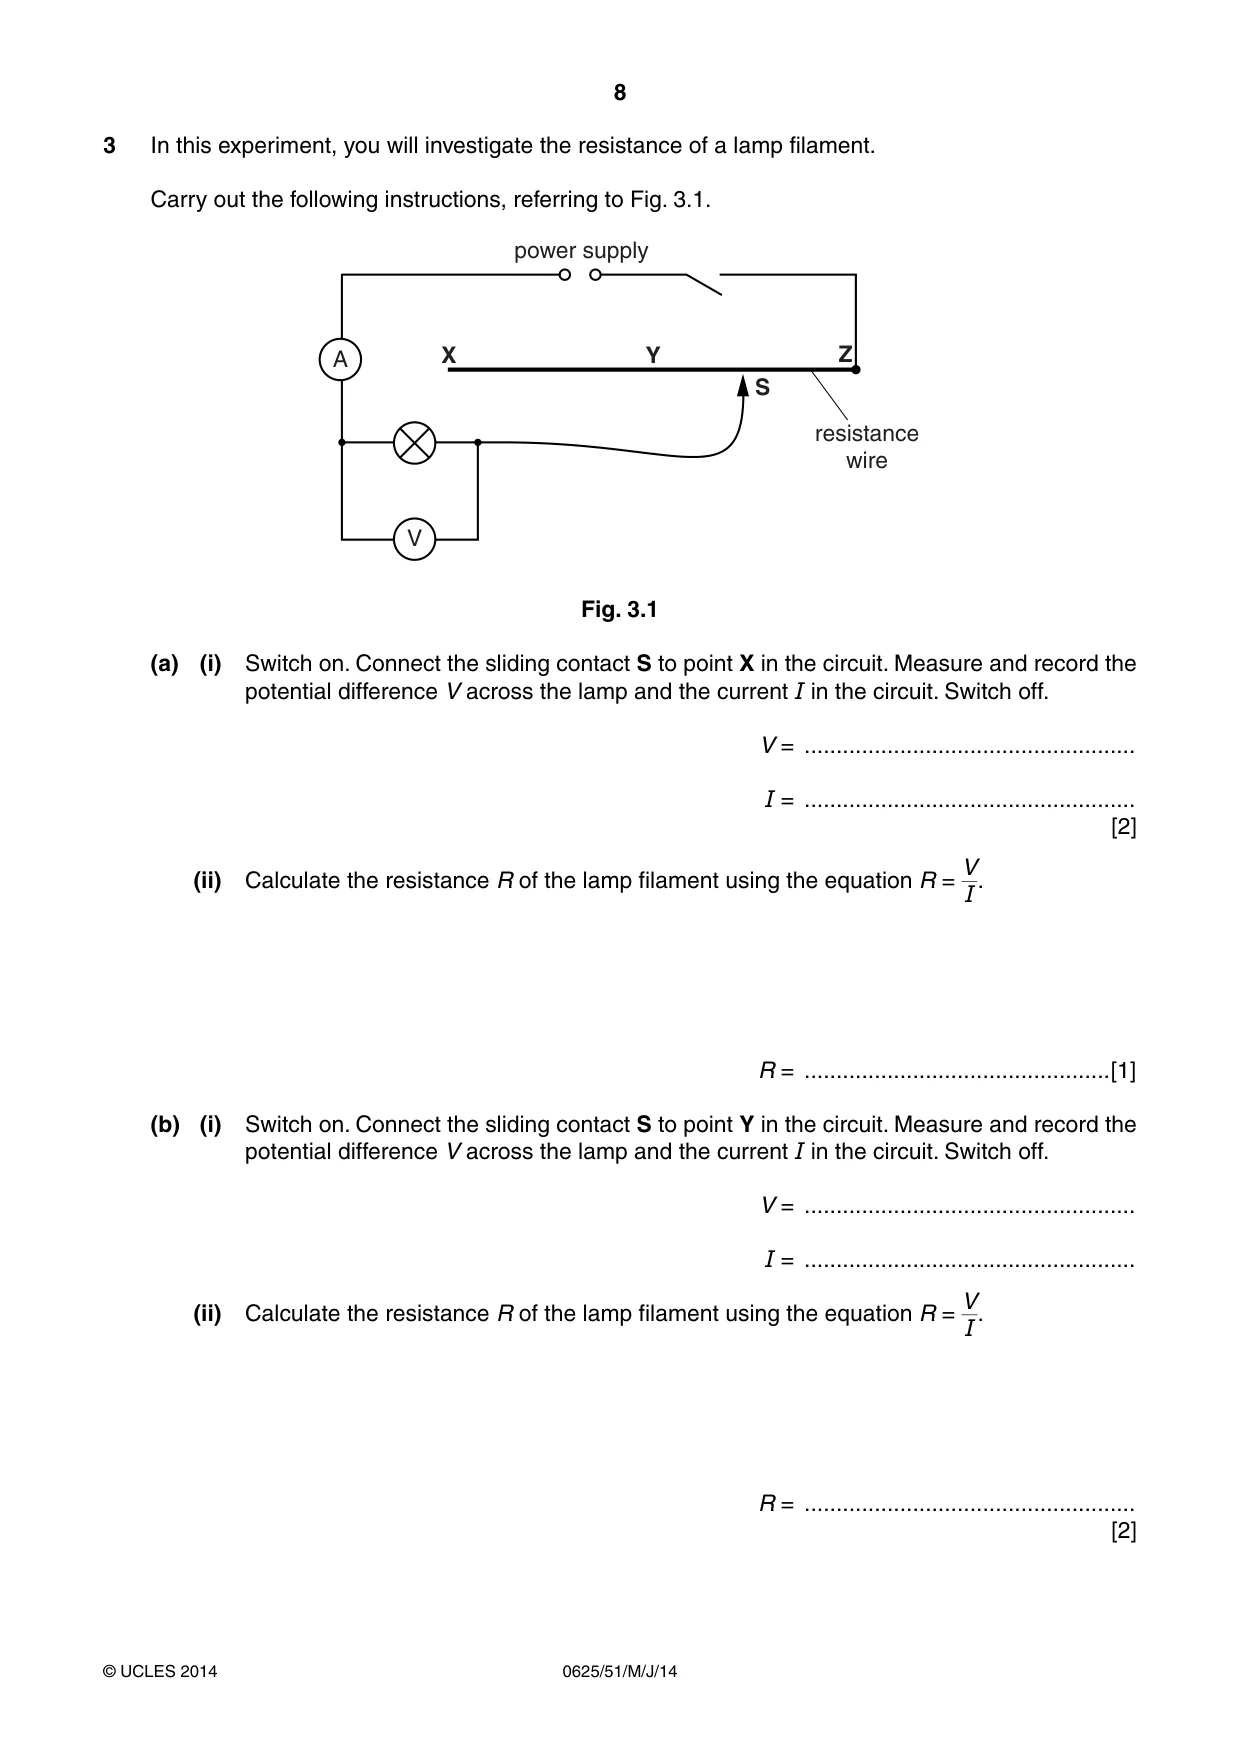
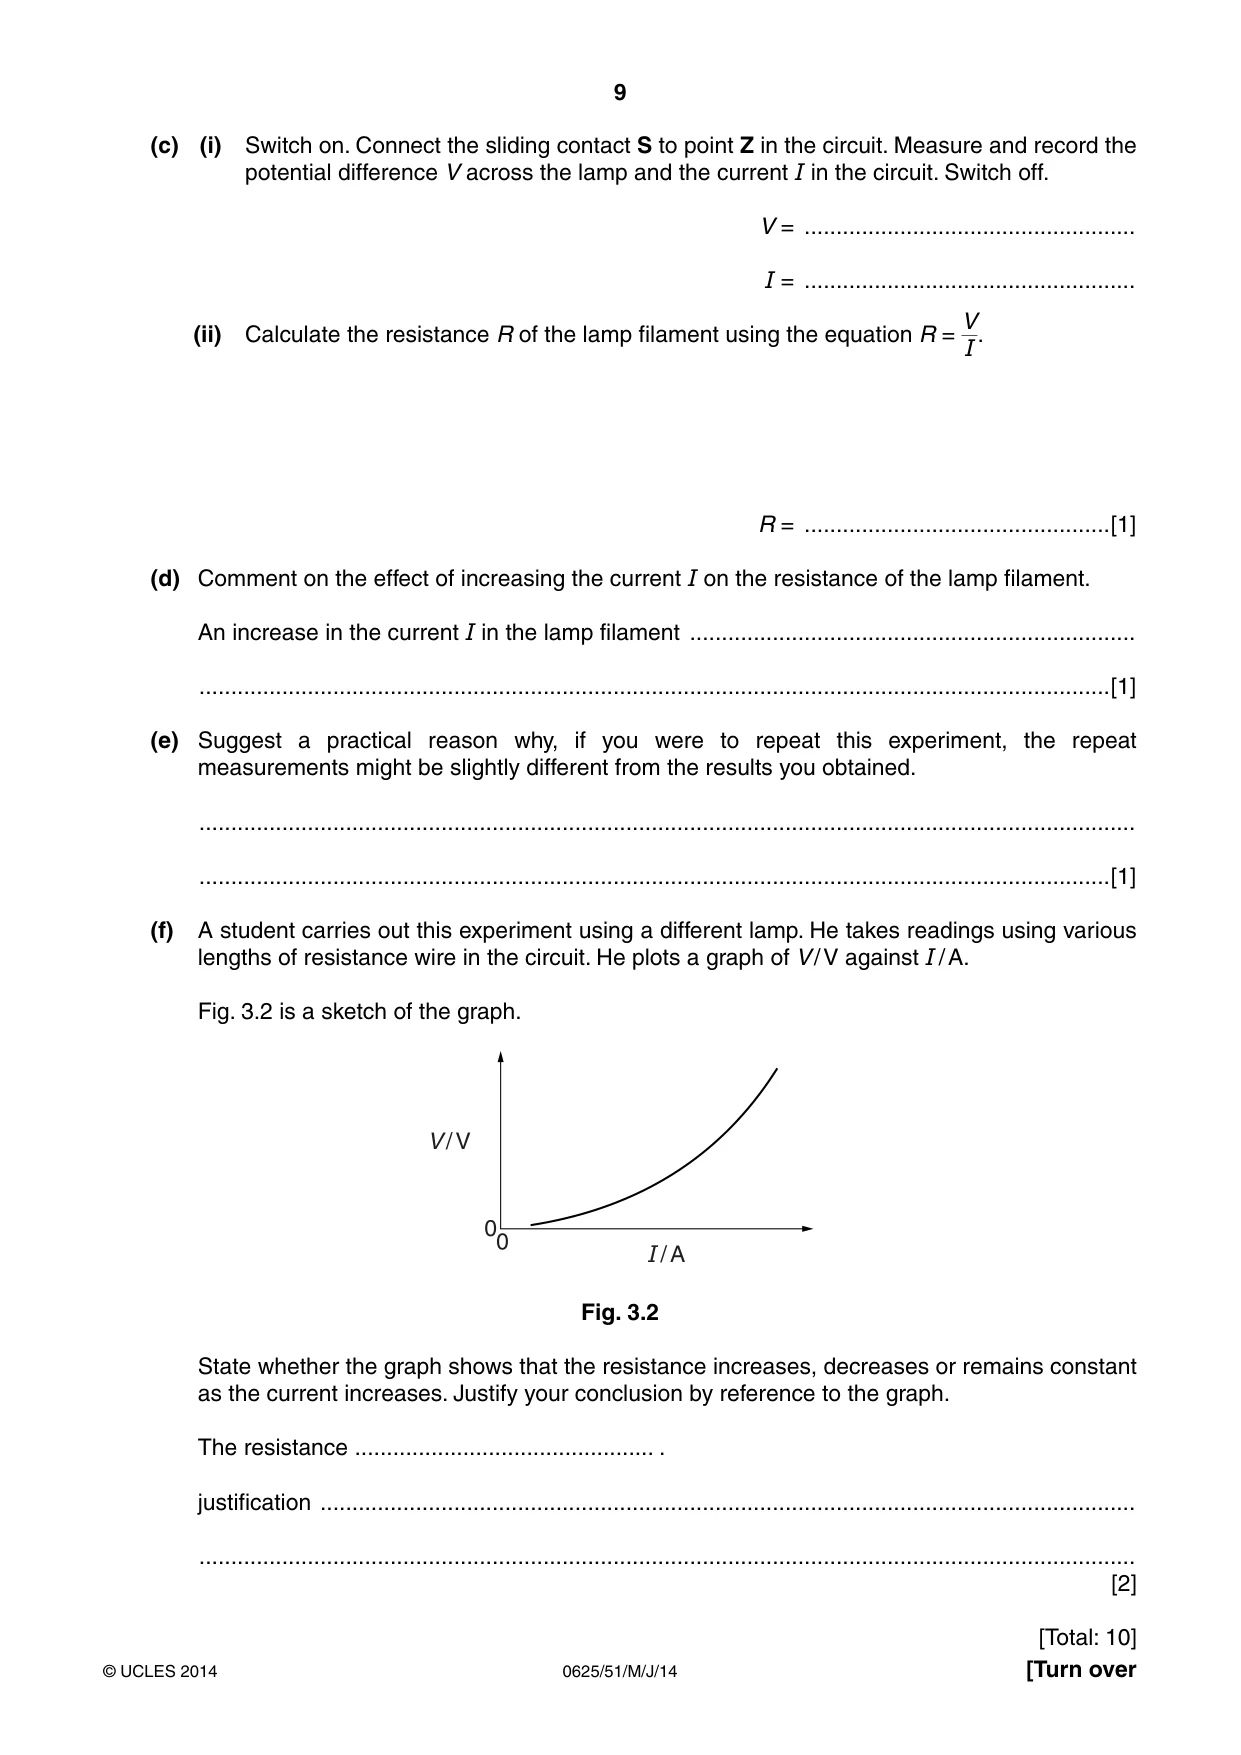
3 In this experiment, you will investigate the resistance of a lamp filament. Carry out the following instructions, referring to Fig. 3.1. power supply A X Y Z S resistance wire V Fig. 3.1 (a) (i) Switch on. Connect the sliding contact S to point X in the circuit. Measure and record the potential difference V across the lamp and the current I in the circuit. Switch off. V = .................................................... I = .................................................... [2] V (ii) Calculate the resistance R of the lamp filament using the equation R = I. R = ................................................[1] (b) (i) Switch on. Connect the sliding contact S to point Y in the circuit. Measure and record the potential difference V across the lamp and the current I in the circuit. Switch off. V = .................................................... I = .................................................... V (ii) Calculate the resistance R of the lamp filament using the equation R = I. R = .................................................... [2] (c) (i) Switch on. Connect the sliding contact S to point Z in the circuit. Measure and record the potential difference V across the lamp and the current I in the circuit. Switch off. V = .................................................... I = .................................................... V (ii) Calculate the resistance R of the lamp filament using the equation R = I. R = ................................................[1] (d) Comment on the effect of increasing the current I on the resistance of the lamp filament. An increase in the current I in the lamp filament ...................................................................... ...............................................................................................................................................[1] (e) Suggest a practical reason why, if you were to repeat this experiment, the repeat measurements might be slightly different from the results you obtained. ................................................................................................................................................... ...............................................................................................................................................[1] (f) A student carries out this experiment using a different lamp. He takes readings using various lengths of resistance wire in the circuit. He plots a graph of V / V against I / A. Fig. 3.2 is a sketch of the graph. V / V 0 0 I / A Fig. 3.2 State whether the graph shows that the resistance increases, decreases or remains constant as the current increases. Justify your conclusion by reference to the graph. The resistance ............................................... . justification ................................................................................................................................ ................................................................................................................................................... [2] [Total: 10]
Mark scheme: 3 (a) (i) V to at least 1 d.p. and < 3V [1] I to at least 2 d.p. and < 1A [1] (ii) R calculated correctly [1] (b) (i) V and I recorded with I greater than in (a) [1] (ii) V in V, I in A, R in Ω in (a), (b) and (c) at least once, not contradicted [1] (c) R to 2 or 3 significant figures [1] (d) R increases, ecf [1] (e) one from: • exact placement of S • width of S • battery running down / voltage changed • wire / lamp getting hot (and so resistance changing) • lamp remaining hot [1] (f) increases [1] V increases more quickly than I (accept greater rate) or V increases proportionately more than I or doubling V causes I to increase by less than double allow gradient is increasing [1] IGCSE – May/June 2014 0625 51
Q4 · In this experiment, you will investigate reflection using a plane mirror
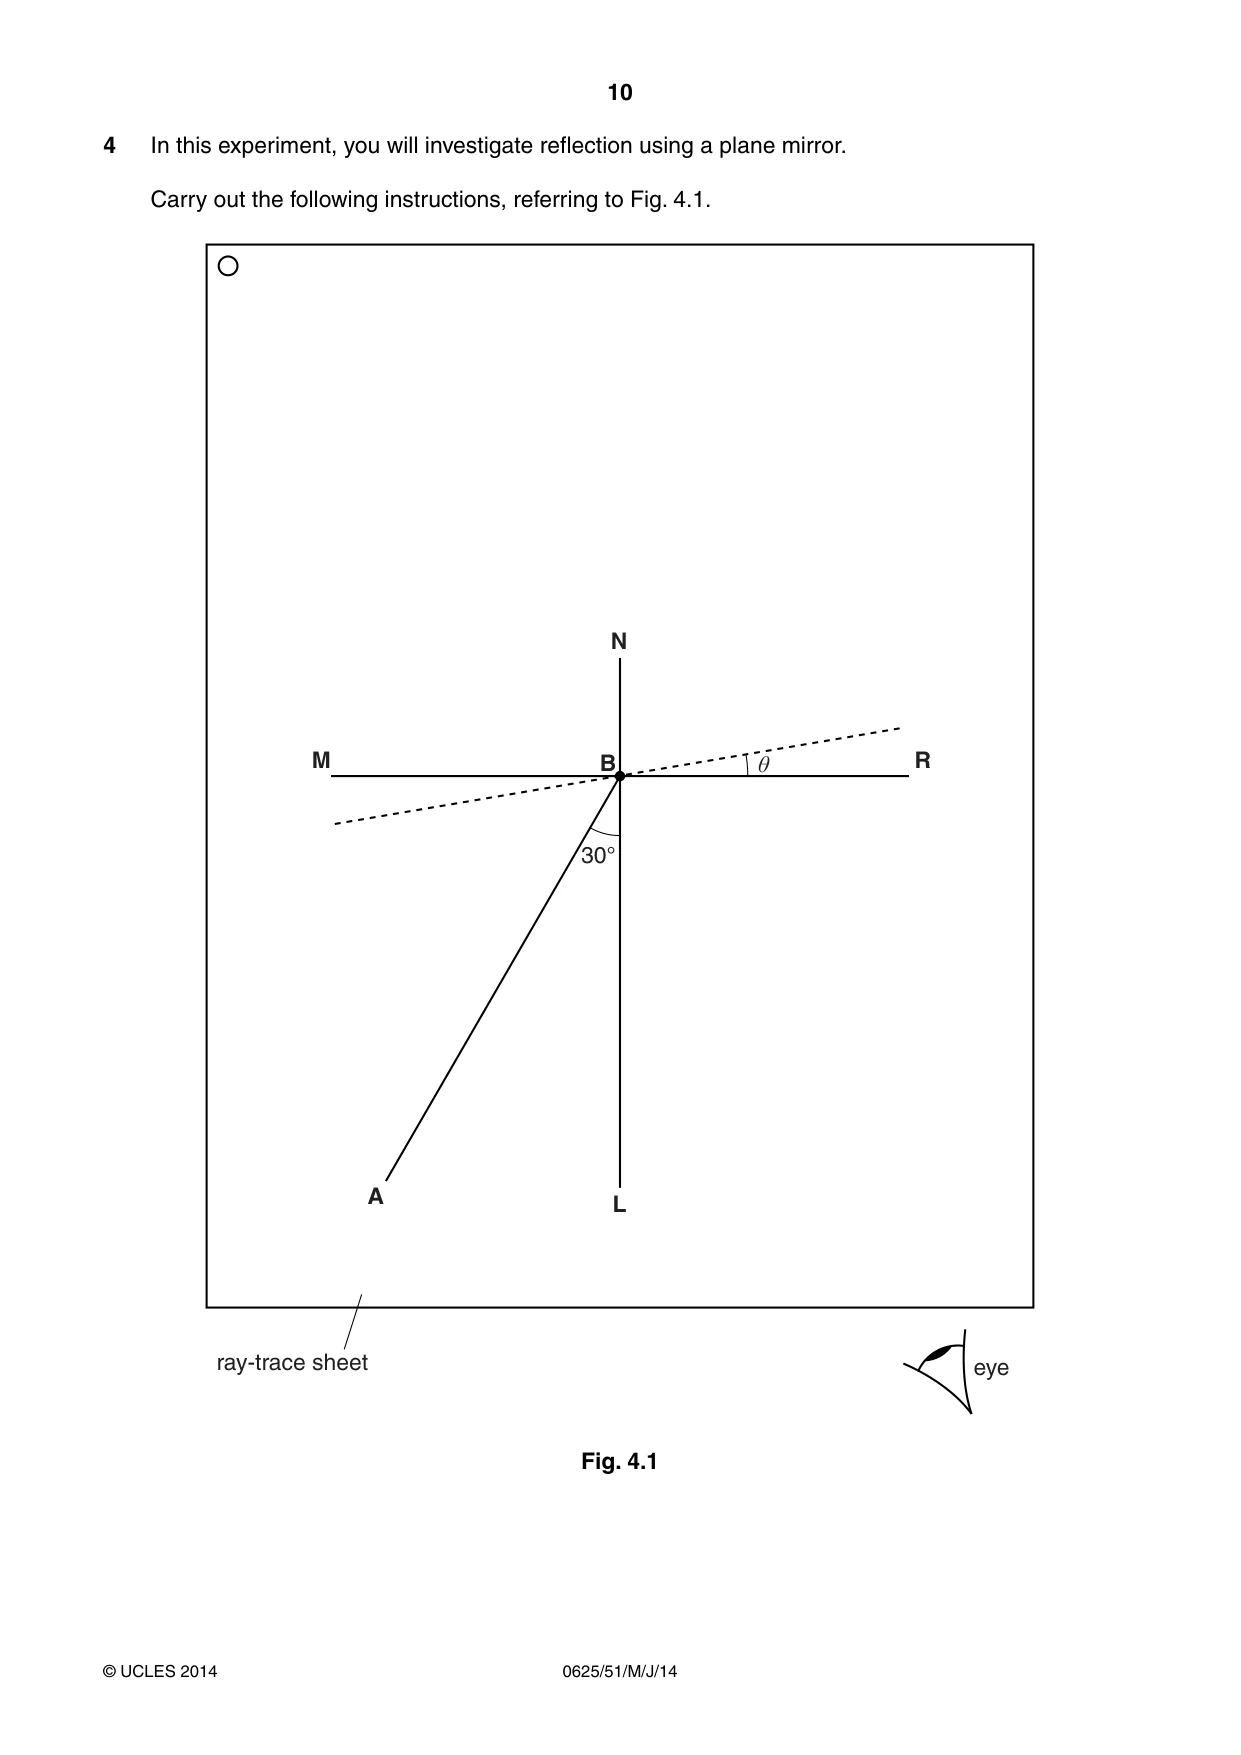
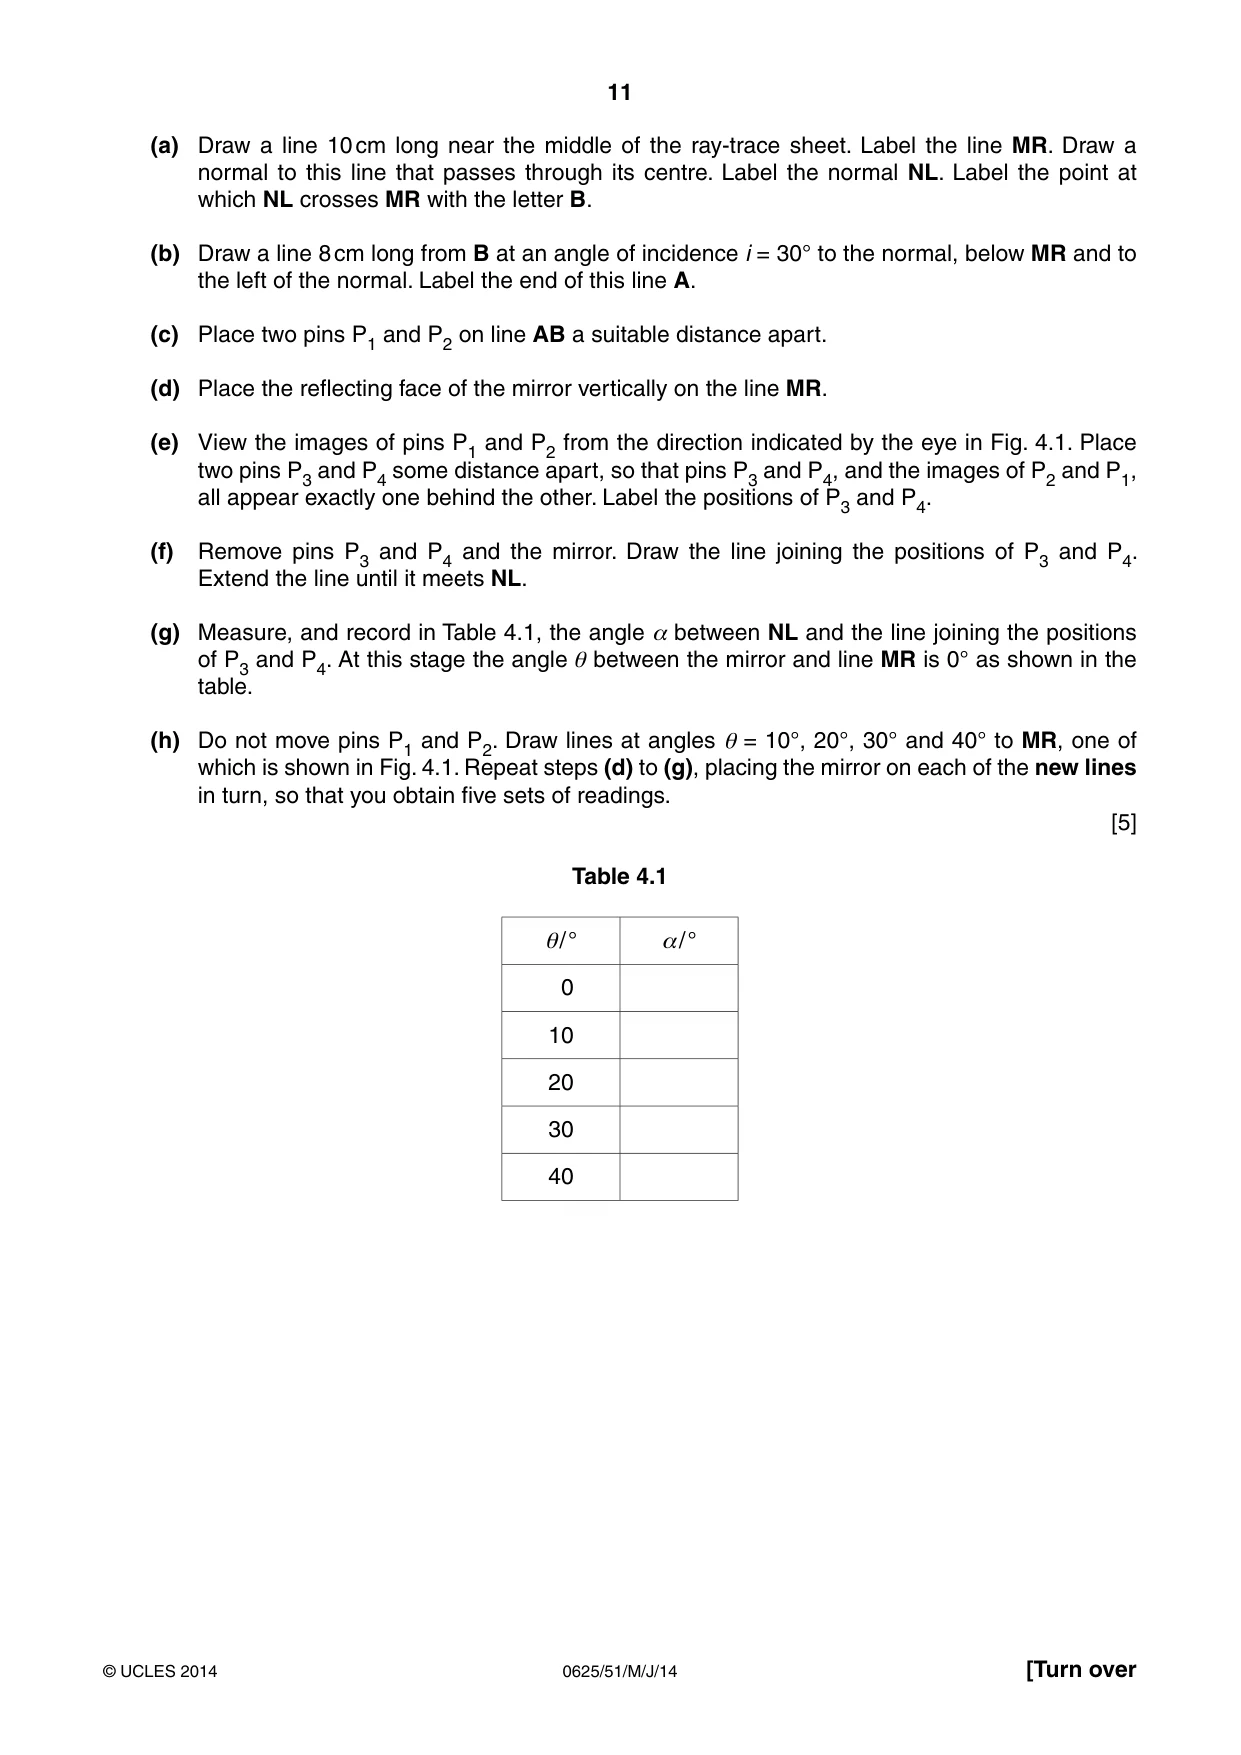
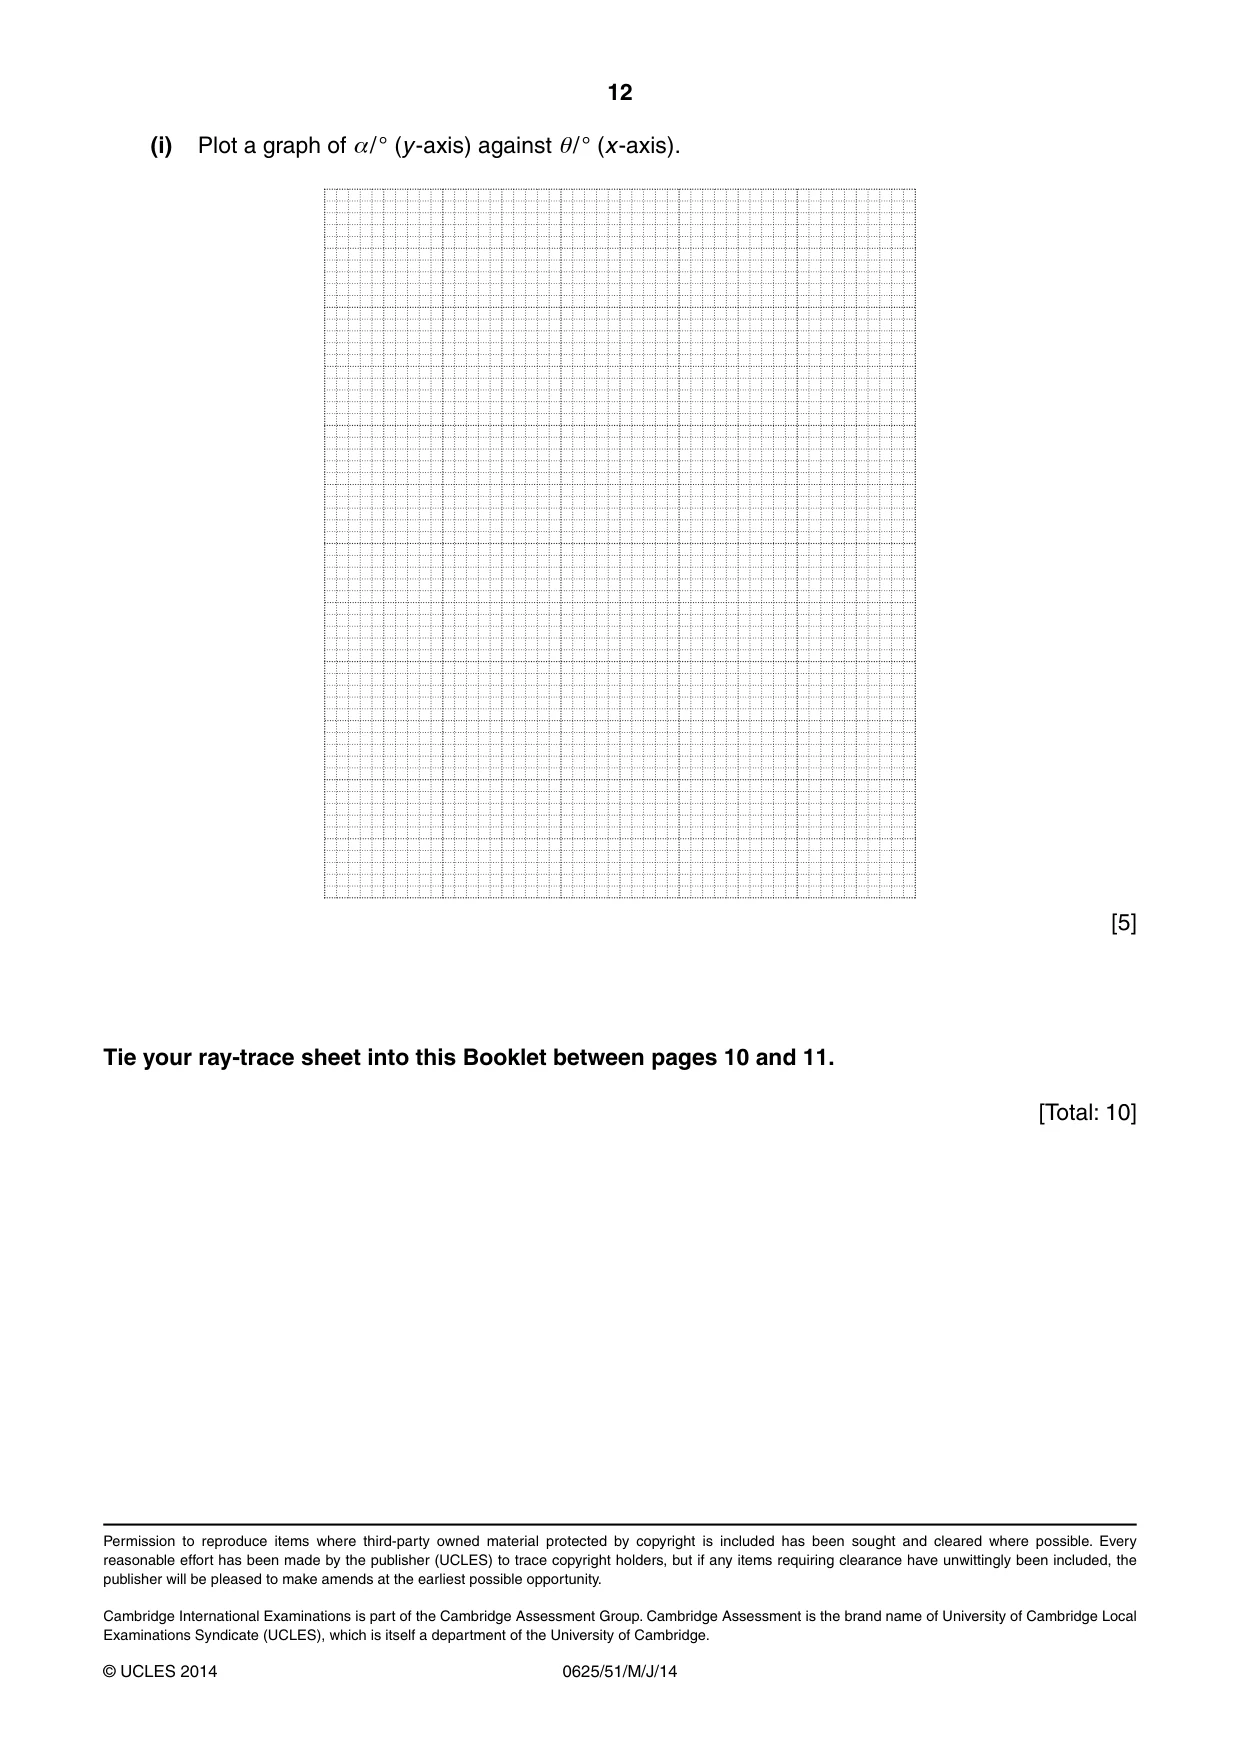
4 In this experiment, you will investigate reflection using a plane mirror. Carry out the following instructions, referring to Fig. 4.1. N M B ș R 30° A L ray-trace sheet eye Fig. 4.1 (a) Draw a line 10 cm long near the middle of the ray-trace sheet. Label the line MR. Draw a normal to this line that passes through its centre. Label the normal NL. Label the point at which NL crosses MR with the letter B. (b) Draw a line 8 cm long from B at an angle of incidence i = 30° to the normal, below MR and to the left of the normal. Label the end of this line A. (c) Place two pins P1 and P2 on line AB a suitable distance apart. (d) Place the reflecting face of the mirror vertically on the line MR. (e) View the images of pins P1 and P2 from the direction indicated by the eye in Fig. 4.1. Place two pins P3 and P4 some distance apart, so that pins P3 and P4, and the images of P2 and P1, all appear exactly one behind the other. Label the positions of P3 and P4. (f) Remove pins P3 and P4 and the mirror. Draw the line joining the positions of P3 and P4. Extend the line until it meets NL. (g) Measure, and record in Table 4.1, the angle α between NL and the line joining the positions of P3 and P4. At this stage the angle θ between the mirror and line MR is 0° as shown in the table. (h) Do not move pins P1 and P2. Draw lines at angles θ = 10°, 20°, 30° and 40° to MR, one of which is shown in Fig. 4.1. Repeat steps (d) to (g), placing the mirror on each of the new lines in turn, so that you obtain five sets of readings. [5] Table 4.1 θ/ ° α/ ° 0 10 20 30 40 (i) Plot a graph of α/ ° (y-axis) against θ/ ° (x-axis). [5] Tie your ray-trace sheet into this Booklet between pages 10 and 11. [Total: 10]
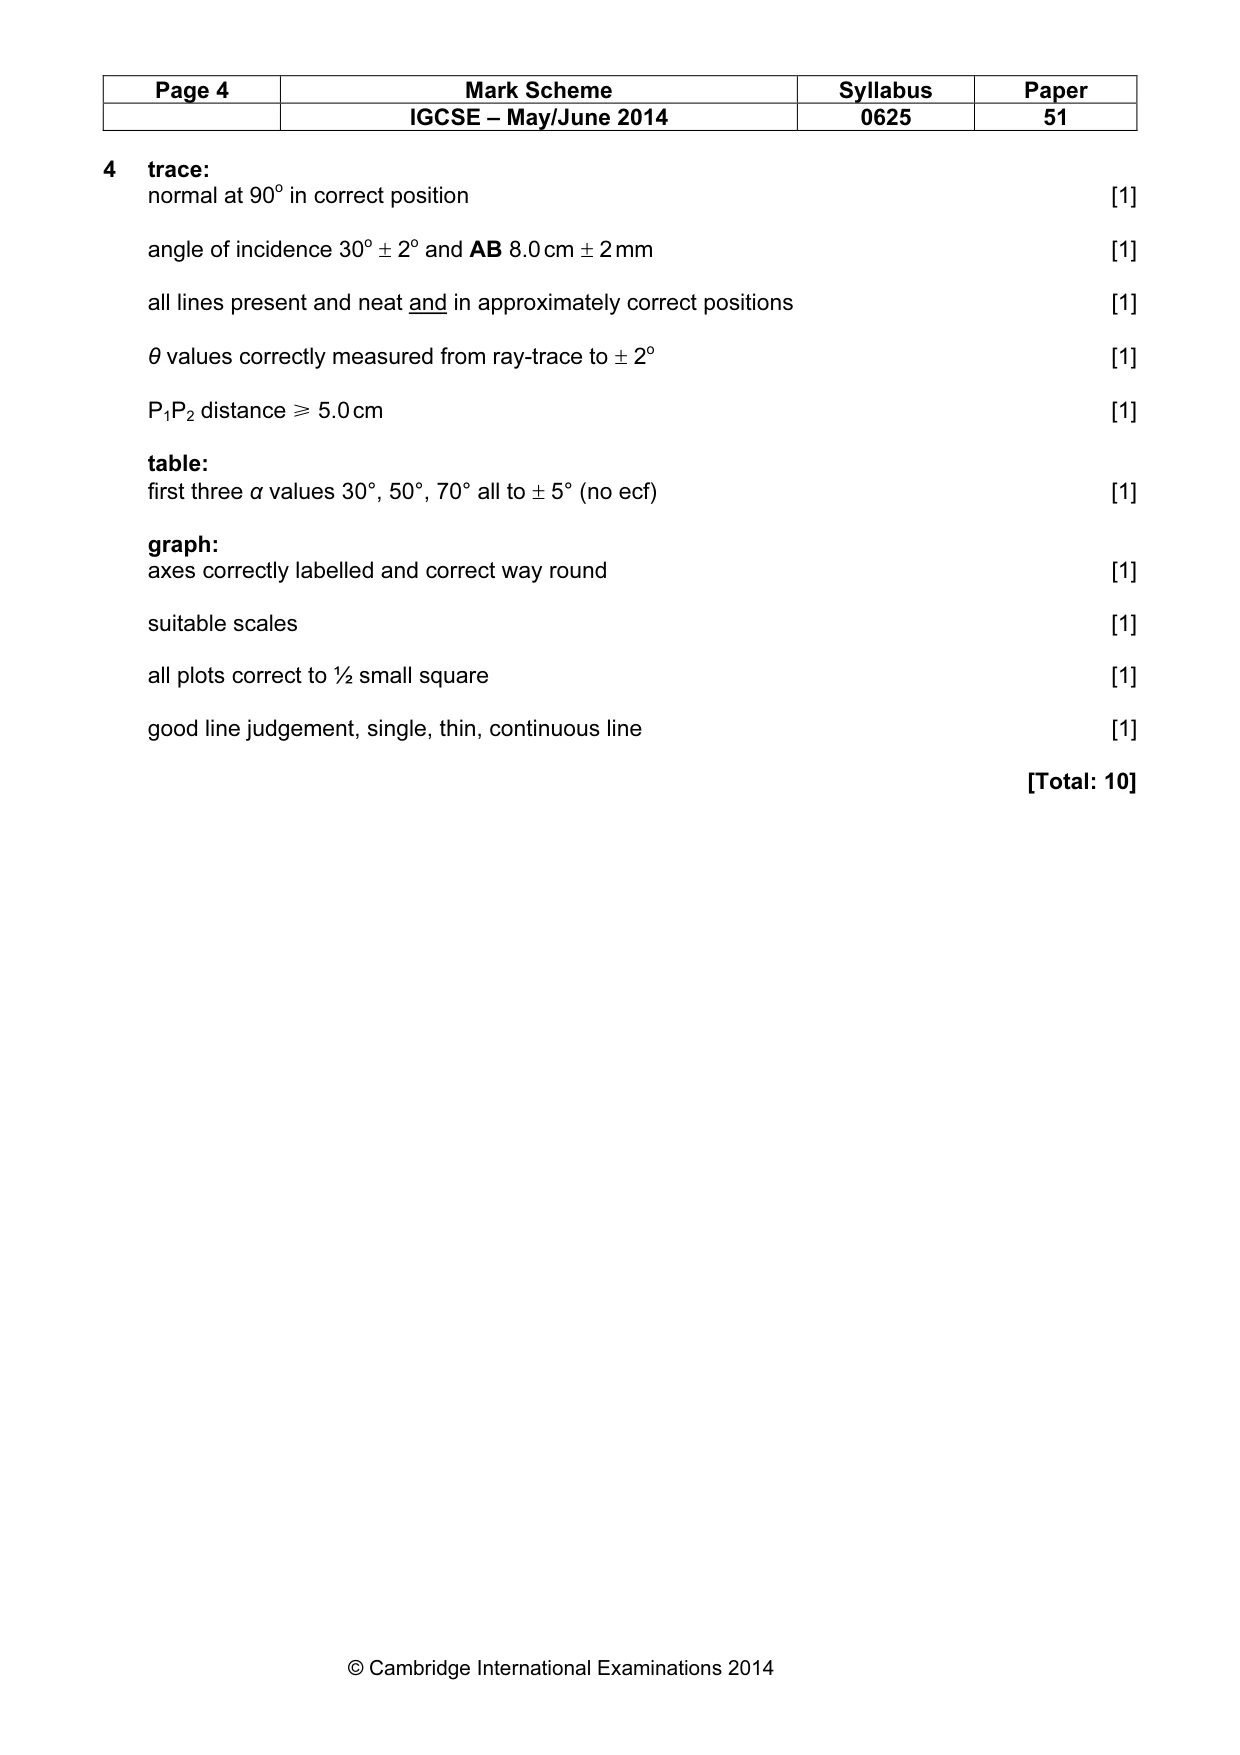
Mark scheme: 4 trace: normal at 90o in correct position [1] angle of incidence 30o ± 2o and AB 8.0 cm ± 2 mm [1] all lines present and neat and in approximately correct positions [1] θ values correctly measured from ray-trace to ± 2o [1] P1P2 distance [ 5.0 cm [1] table: first three α values 30°, 50°, 70° all to ± 5° (no ecf) [1] graph: axes correctly labelled and correct way round [1] suitable scales [1] all plots correct to ½ small square [1] good line judgement, single, thin, continuous line [1] [Total: 10]
What was in this paper
The subtopics covered by these 4 questions, and how many questions each got. Open one in a new tab to see every Cambridge question on it.
What you needed in this session
Cambridge’s own grade thresholds for 2014 May/June, Paper 5 · Variant 1. A higher threshold means an easier paper — the bar moves with how the cohort did.