Cambridge IGCSE Physics 0625 — 2011 May/June Paper 5 · Variant 1
0625/51/M/J/11 · 4 questions · 40 marks · ≈45 min
The question paper and its mark scheme, free to read here and free to download. This is Cambridge’s own paper, exactly as it was sat.
Question paper12 pages

Mark scheme3 pages
Answers below. Sit the paper first if you are practising.
Questions as text
Q1 · In this experiment you are to determine the position of the centre of mass of a…
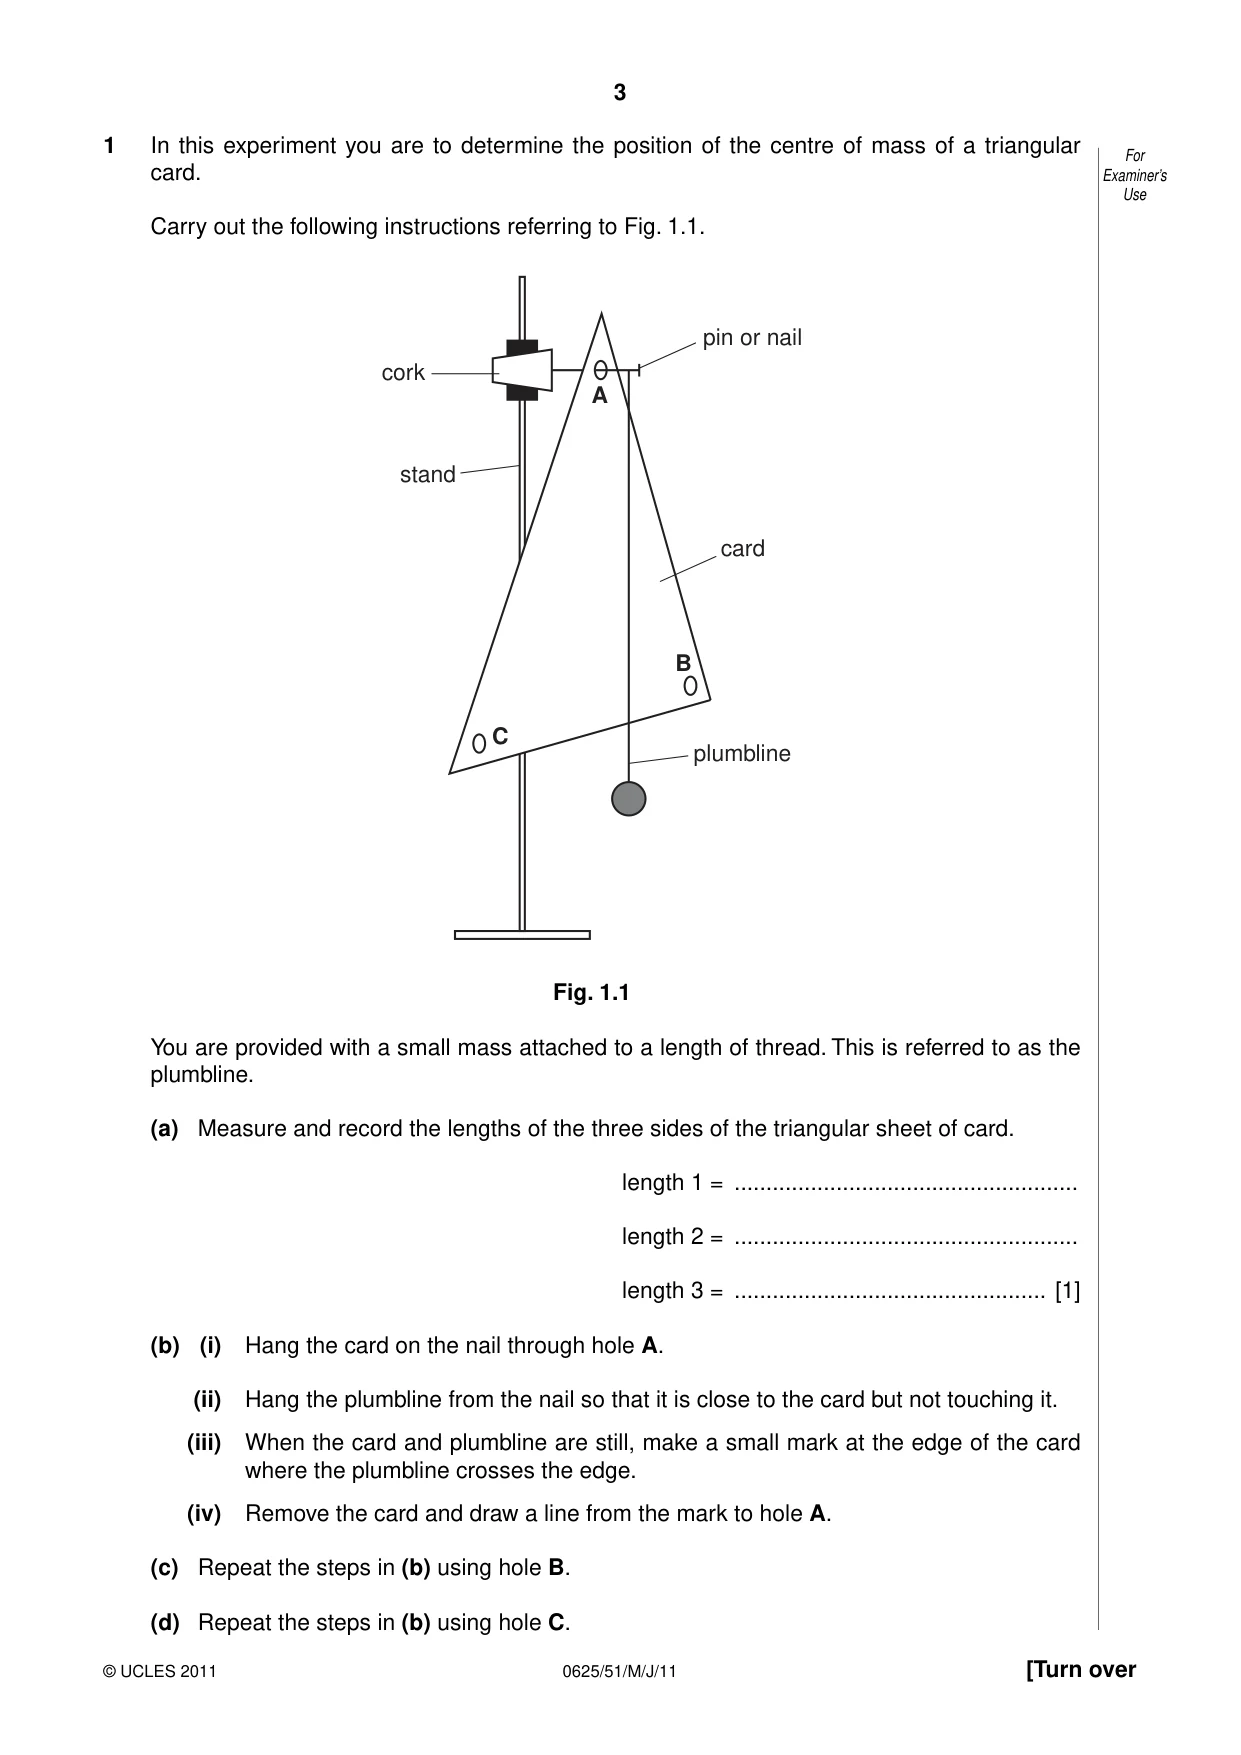
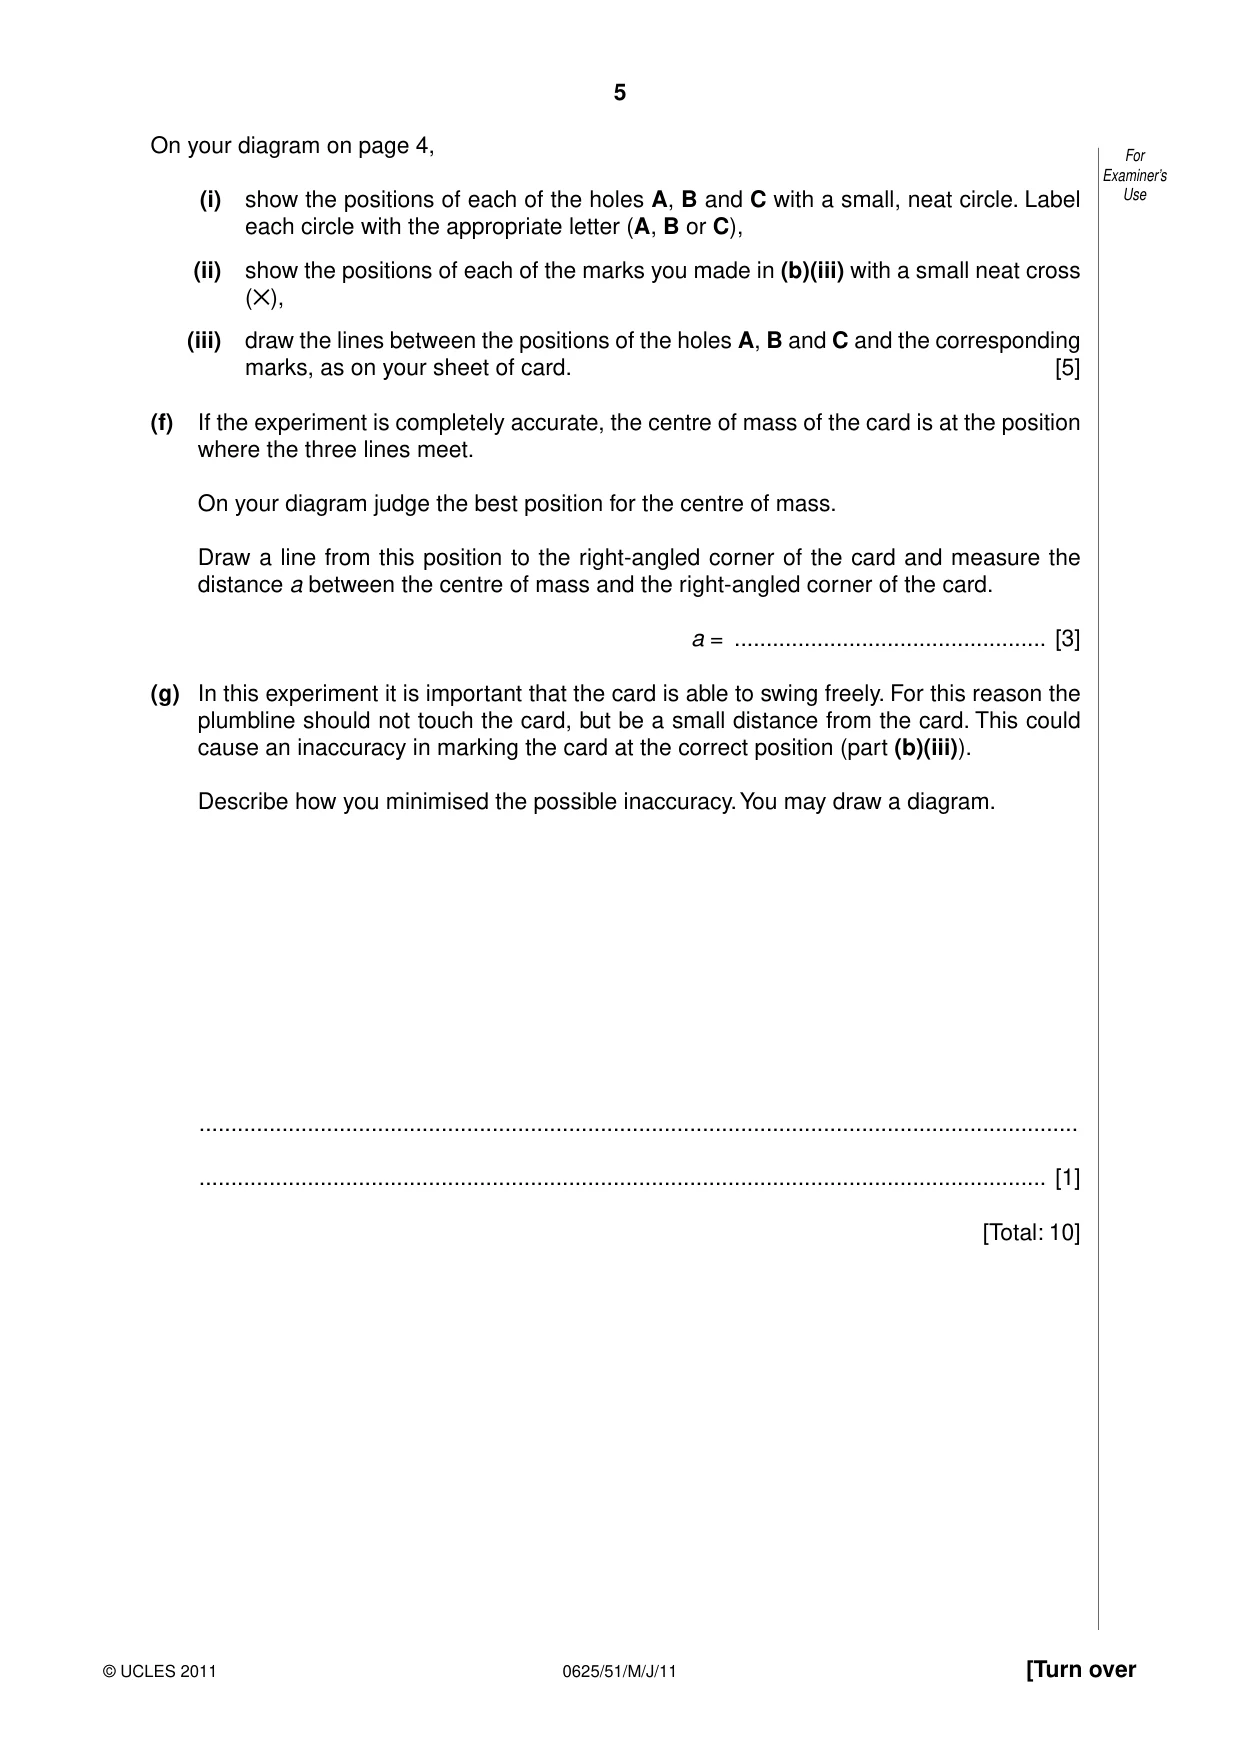
1 In this experiment you are to determine the position of the centre of mass of a triangular For card. Examiner’s Use Carry out the following instructions referring to Fig. 1.1. pin or nail cork A stand card B C plumbline Fig. 1.1 You are provided with a small mass attached to a length of thread. This is referred to as the plumbline. (a) Measure and record the lengths of the three sides of the triangular sheet of card. length 1 = ...................................................... length 2 = ...................................................... length 3 = ................................................. [1] (b) (i) Hang the card on the nail through hole A. (ii) Hang the plumbline from the nail so that it is close to the card but not touching it. (iii) When the card and plumbline are still, make a small mark at the edge of the card where the plumbline crosses the edge. (iv) Remove the card and draw a line from the mark to hole A. (c) Repeat the steps in (b) using hole B. (d) Repeat the steps in (b) using hole C. For (e) Place your card in the space below and draw around its outline. Examiner’s Use On your diagram on page 4, For Examiner’s (i) show the positions of each of the holes A, B and C with a small, neat circle. Label Use each circle with the appropriate letter (A, B or C), (ii) show the positions of each of the marks you made in (b)(iii) with a small neat cross (✕), (iii) draw the lines between the positions of the holes A, B and C and the corresponding marks, as on your sheet of card. [5] (f) If the experiment is completely accurate, the centre of mass of the card is at the position where the three lines meet. On your diagram judge the best position for the centre of mass. Draw a line from this position to the right-angled corner of the card and measure the distance a between the centre of mass and the right-angled corner of the card. a = ................................................. [3] (g) In this experiment it is important that the card is able to swing freely. For this reason the plumbline should not touch the card, but be a small distance from the card. This could cause an inaccuracy in marking the card at the correct position (part (b)(iii)). Describe how you minimised the possible inaccuracy. You may draw a diagram. .......................................................................................................................................... ..................................................................................................................................... [1] [Total: 10]
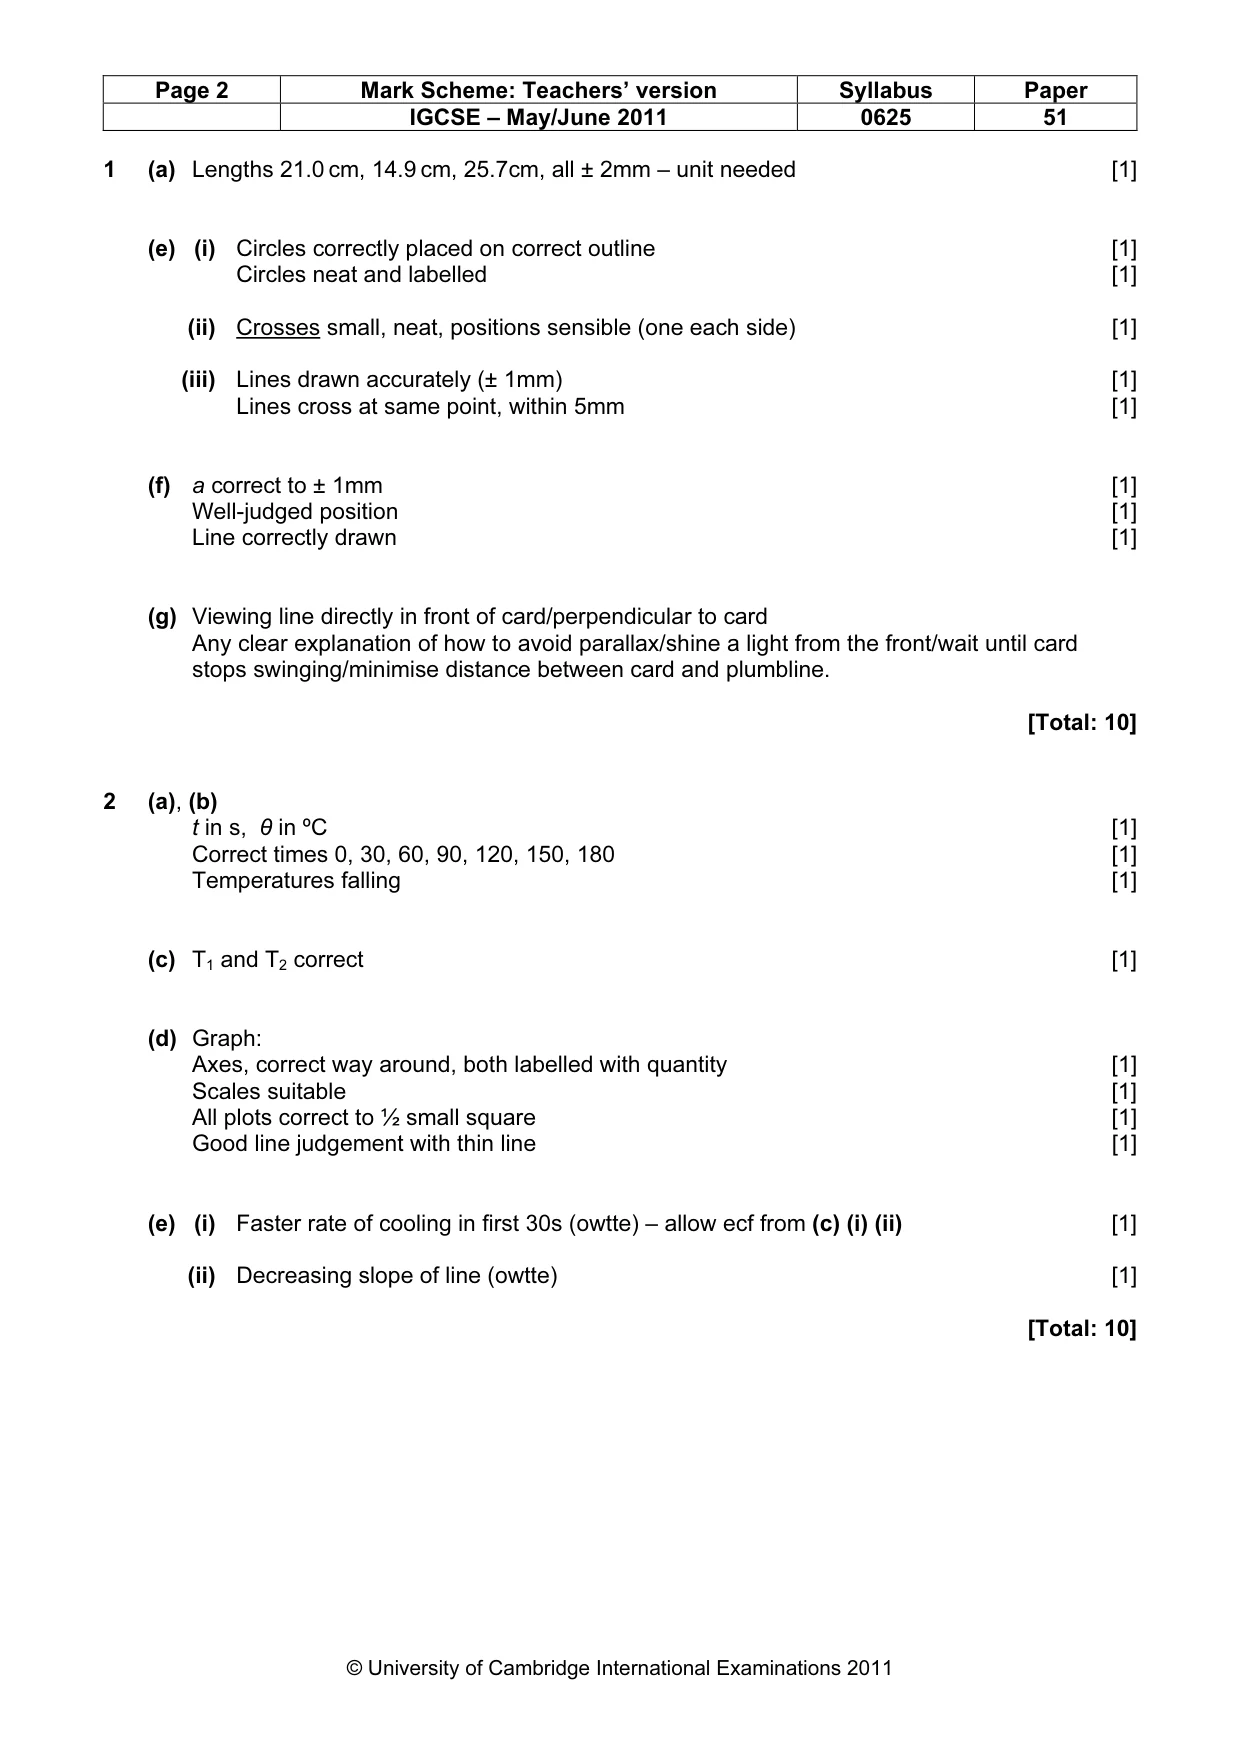
Mark scheme: 1 (a) Lengths 21.0 cm, 14.9 cm, 25.7cm, all ± 2mm – unit needed [1] (e) (i) Circles correctly placed on correct outline [1] Circles neat and labelled [1] (ii) Crosses small, neat, positions sensible (one each side) [1] (iii) Lines drawn accurately (± 1mm) [1] Lines cross at same point, within 5mm [1] (f) a correct to ± 1mm [1] Well-judged position [1] Line correctly drawn [1] (g) Viewing line directly in front of card/perpendicular to card Any clear explanation of how to avoid parallax/shine a light from the front/wait until card stops swinging/minimise distance between card and plumbline. [Total: 10]
More questions on Physical quantities and measurement techniques
Q2 · In this experiment you will investigate the rate of cooling of water
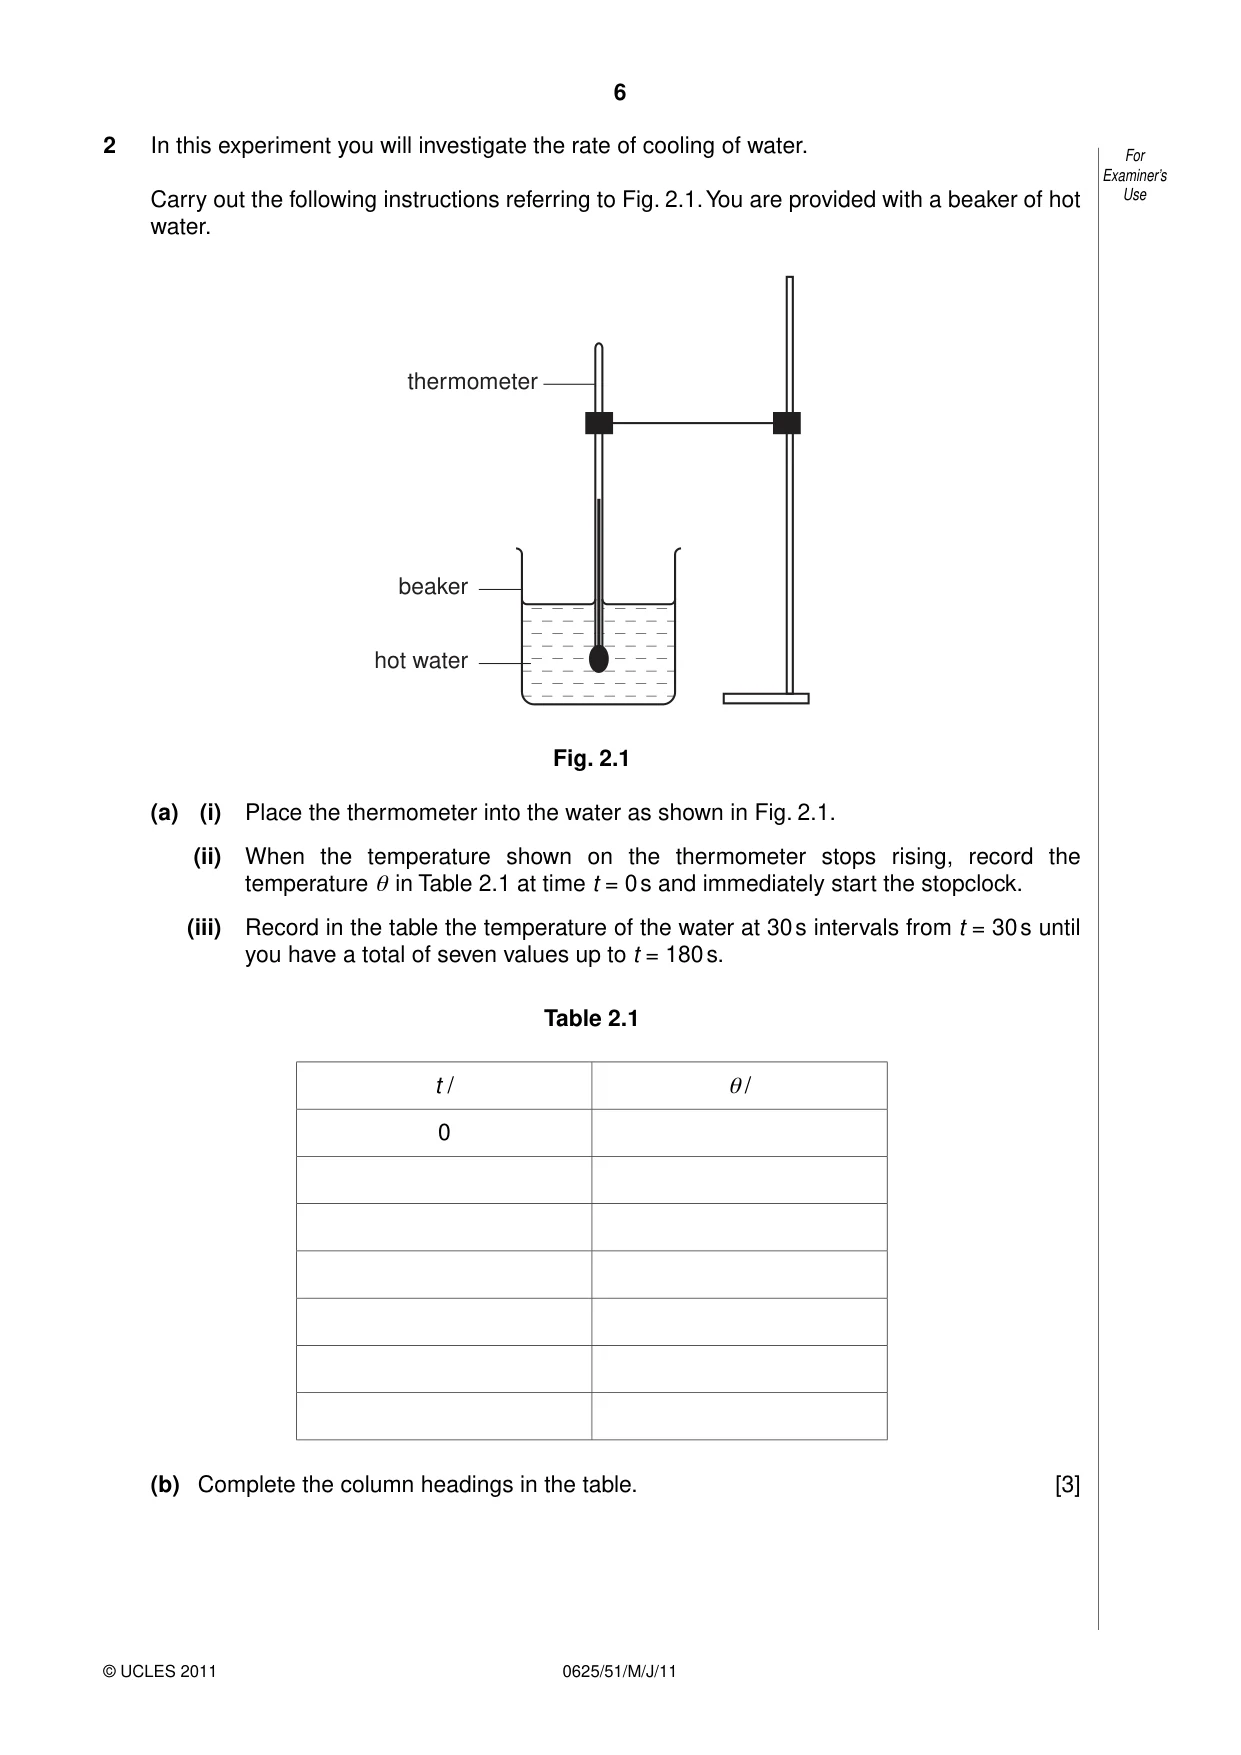
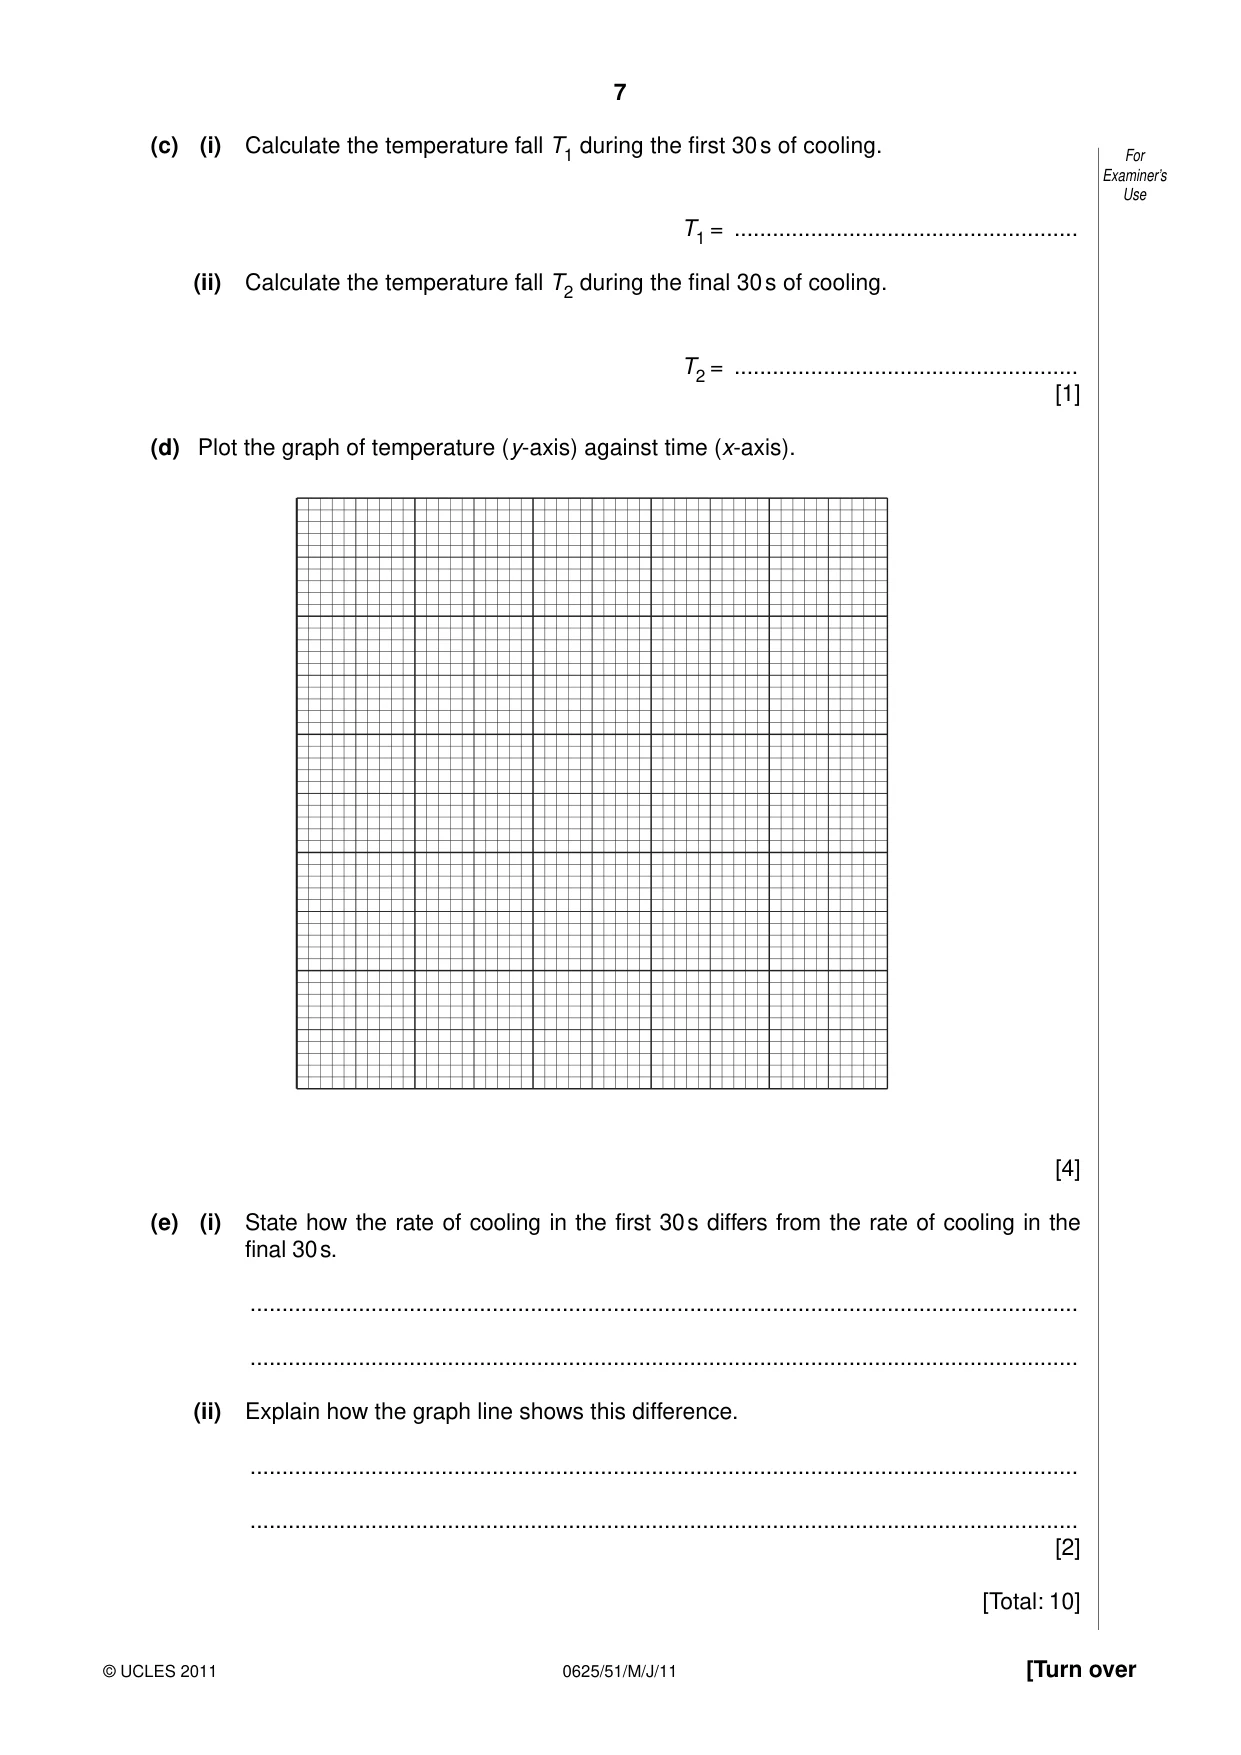
2 In this experiment you will investigate the rate of cooling of water. For Examiner’s Carry out the following instructions referring to Fig. 2.1. You are provided with a beaker of hot Use water. thermometer beaker hot water Fig. 2.1 (a) (i) Place the thermometer into the water as shown in Fig. 2.1. (ii) When the temperature shown on the thermometer stops rising, record the temperature θ in Table 2.1 at time t = 0 s and immediately start the stopclock. (iii) Record in the table the temperature of the water at 30 s intervals from t = 30 s until you have a total of seven values up to t = 180 s. Table 2.1 t / θ / 0 (b) Complete the column headings in the table. [3] (c) (i) Calculate the temperature fall T1 during the first 30 s of cooling. For Examiner’s Use T1 = ...................................................... (ii) Calculate the temperature fall T2 during the final 30 s of cooling. T2 = ...................................................... [1] (d) Plot the graph of temperature (y-axis) against time (x-axis). [4] (e) (i) State how the rate of cooling in the first 30 s differs from the rate of cooling in the final 30 s. .................................................................................................................................. .................................................................................................................................. (ii) Explain how the graph line shows this difference. .................................................................................................................................. .................................................................................................................................. [2] [Total: 10]
Mark scheme: 2 (a), (b) t in s, θ in ºC [1] Correct times 0, 30, 60, 90, 120, 150, 180 [1] Temperatures falling [1] (c) T1 and T2 correct [1] (d) Graph: Axes, correct way around, both labelled with quantity [1] Scales suitable [1] All plots correct to ½ small square [1] Good line judgement with thin line [1] (e) (i) Faster rate of cooling in first 30s (owtte) – allow ecf from (c) (i) (ii) [1] (ii) Decreasing slope of line (owtte) [1] [Total: 10] IGCSE – May/June 2011 0625 51
Q3 · In this experiment you will measure the currents in lamps in a circuit
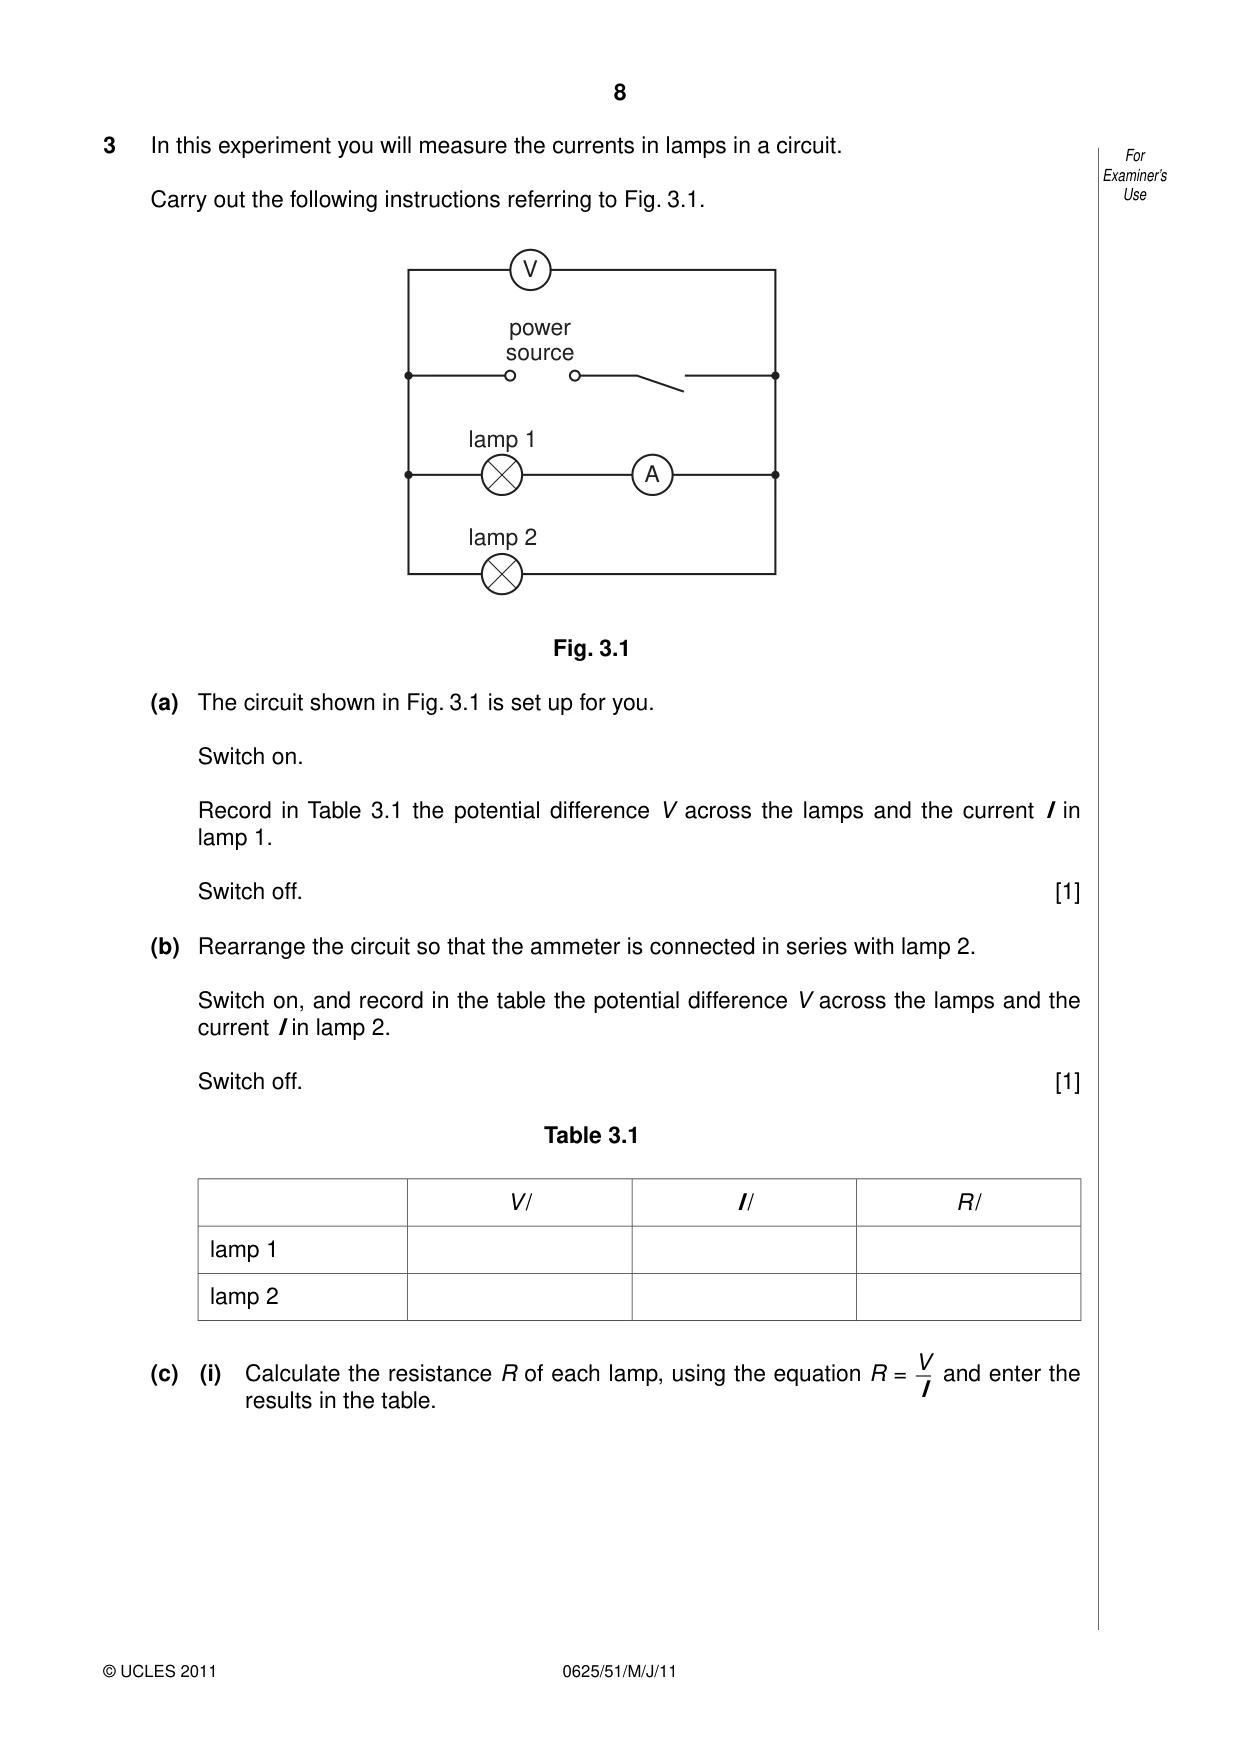
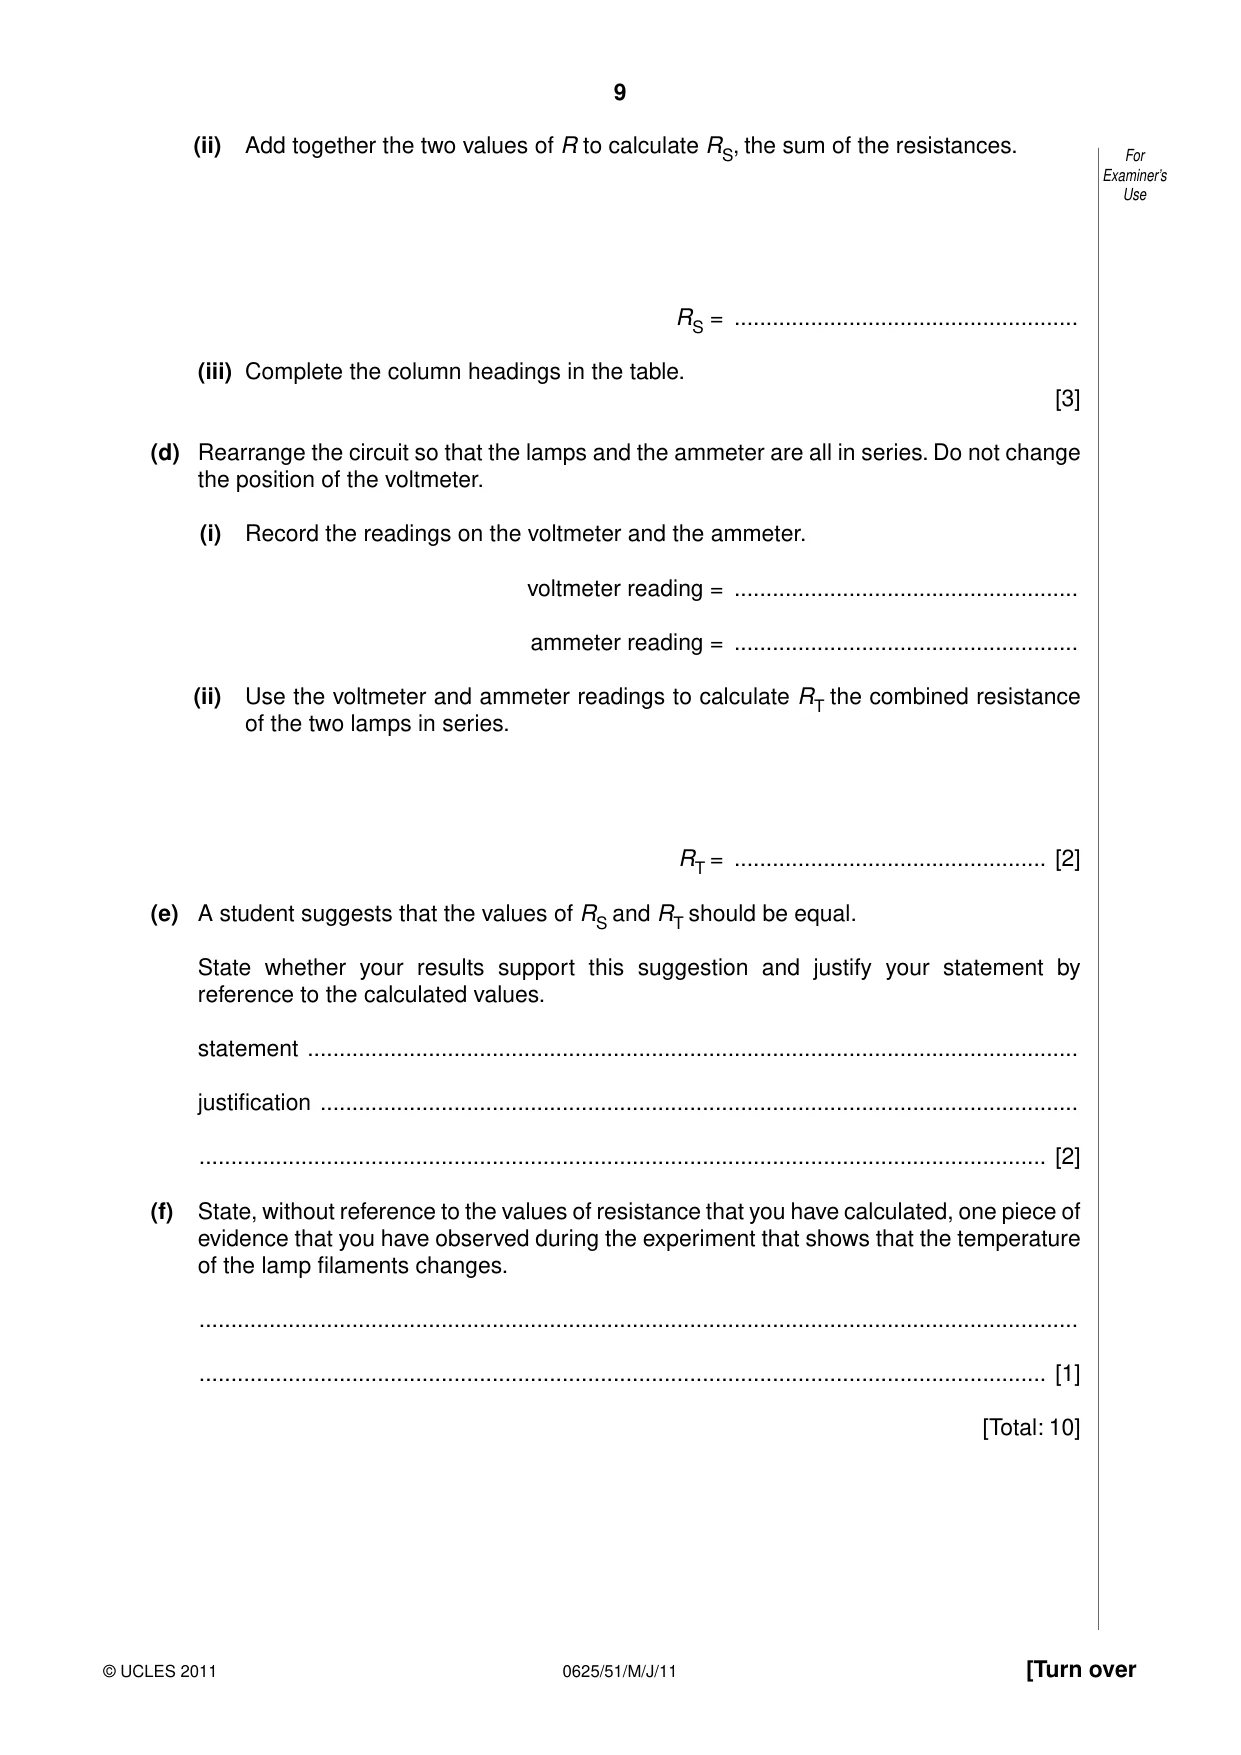
3 In this experiment you will measure the currents in lamps in a circuit. For Examiner’s Carry out the following instructions referring to Fig. 3.1. Use V power source lamp 1 A lamp 2 Fig. 3.1 (a) The circuit shown in Fig. 3.1 is set up for you. Switch on. Record in Table 3.1 the potential difference V across the lamps and the current I in lamp 1. Switch off. [1] (b) Rearrange the circuit so that the ammeter is connected in series with lamp 2. Switch on, and record in the table the potential difference V across the lamps and the current I in lamp 2. Switch off. [1] Table 3.1 V / I / R / lamp 1 lamp 2 V (c) (i) Calculate the resistance R of each lamp, using the equation R = and enter the I results in the table. (ii) Add together the two values of R to calculate RS, the sum of the resistances. For Examiner’s Use RS = ...................................................... (iii) Complete the column headings in the table. [3] (d) Rearrange the circuit so that the lamps and the ammeter are all in series. Do not change the position of the voltmeter. (i) Record the readings on the voltmeter and the ammeter. voltmeter reading = ...................................................... ammeter reading = ...................................................... (ii) Use the voltmeter and ammeter readings to calculate RT the combined resistance of the two lamps in series. RT = ................................................. [2] (e) A student suggests that the values of RS and RT should be equal. State whether your results support this suggestion and justify your statement by reference to the calculated values. statement ......................................................................................................................... justification ....................................................................................................................... ..................................................................................................................................... [2] (f) State, without reference to the values of resistance that you have calculated, one piece of evidence that you have observed during the experiment that shows that the temperature of the lamp filaments changes. .......................................................................................................................................... ..................................................................................................................................... [1] [Total: 10]
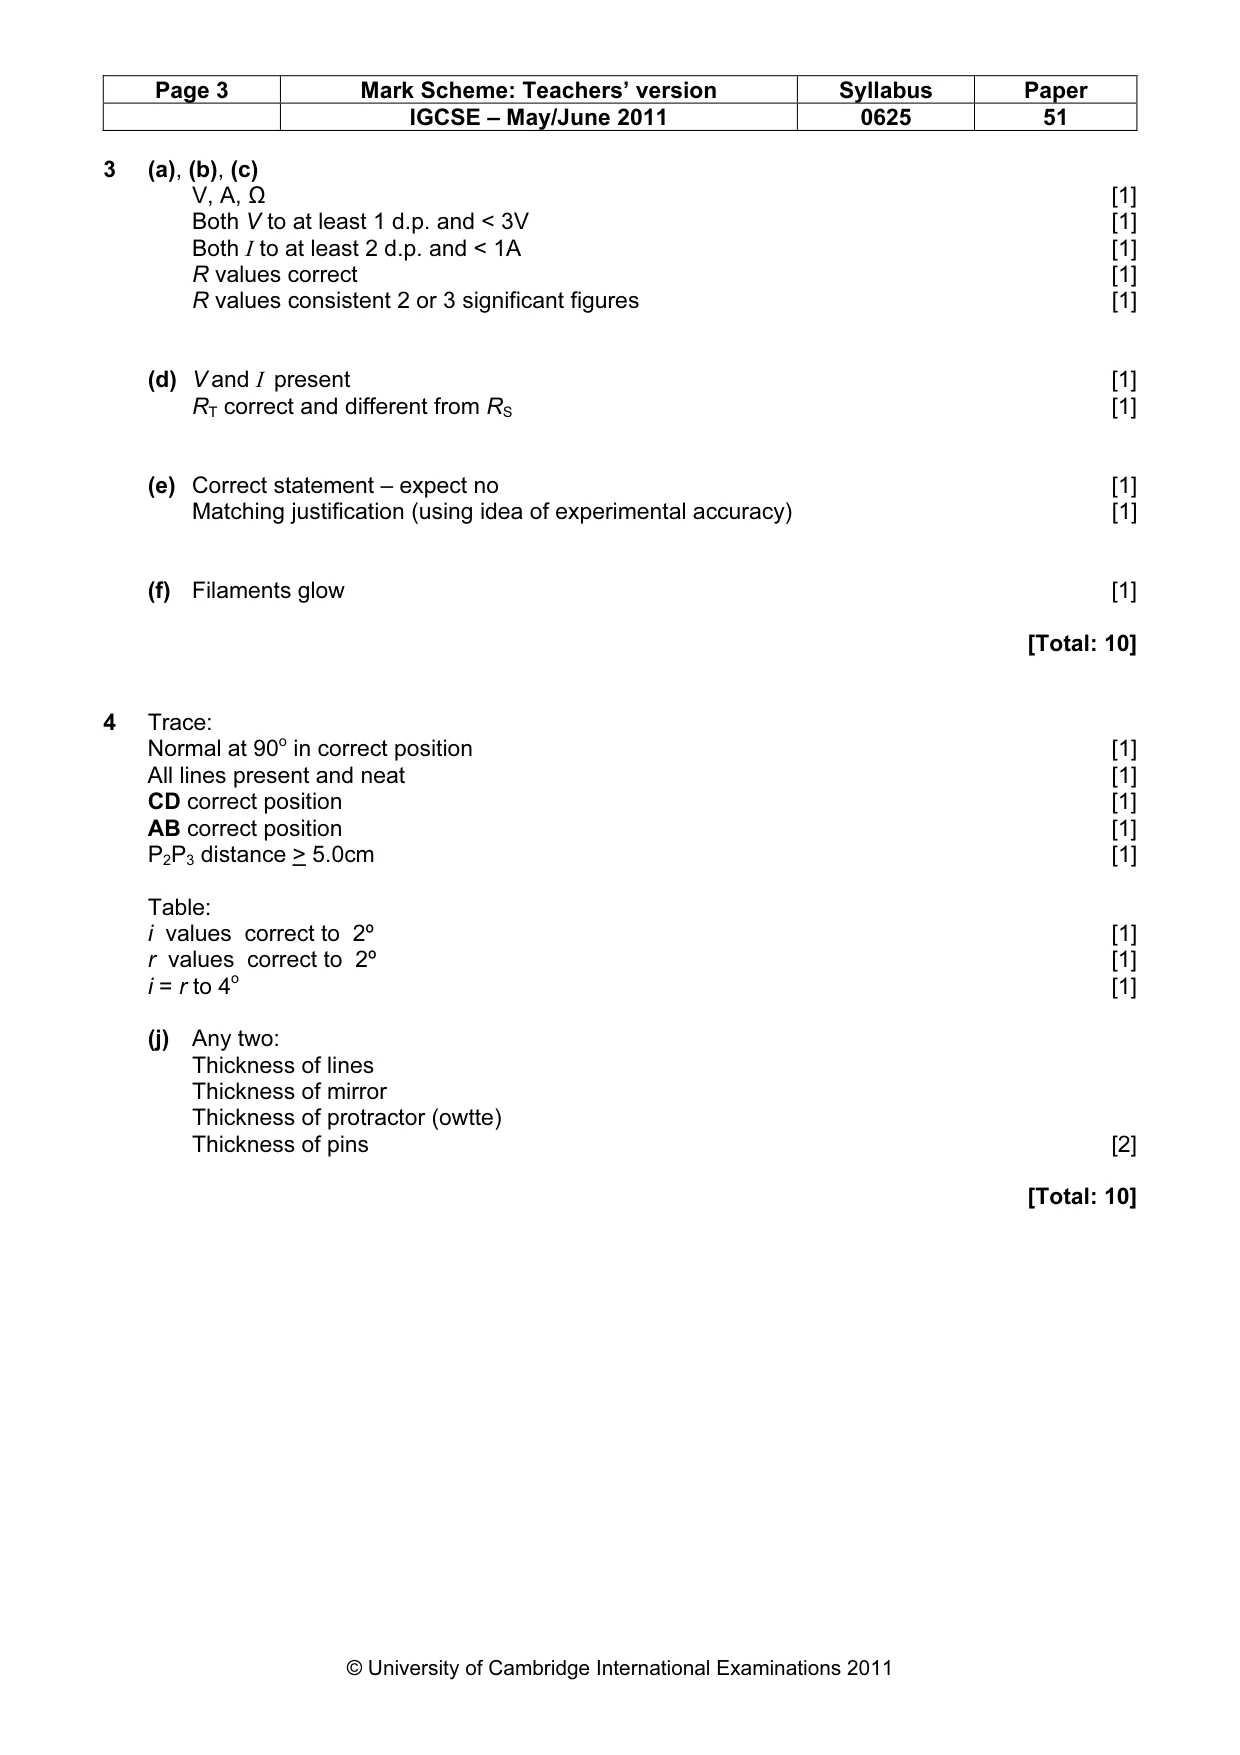
Mark scheme: 3 (a), (b), (c) V, A, Ω [1] Both V to at least 1 d.p. and < 3V [1] Both I to at least 2 d.p. and < 1A [1] R values correct [1] R values consistent 2 or 3 significant figures [1] (d) V and I present [1] RT correct and different from RS [1] (e) Correct statement – expect no [1] Matching justification (using idea of experimental accuracy) [1] (f) Filaments glow [1] [Total: 10]
Q4 · In this experiment you will investigate the reflection of light by a plane mirror
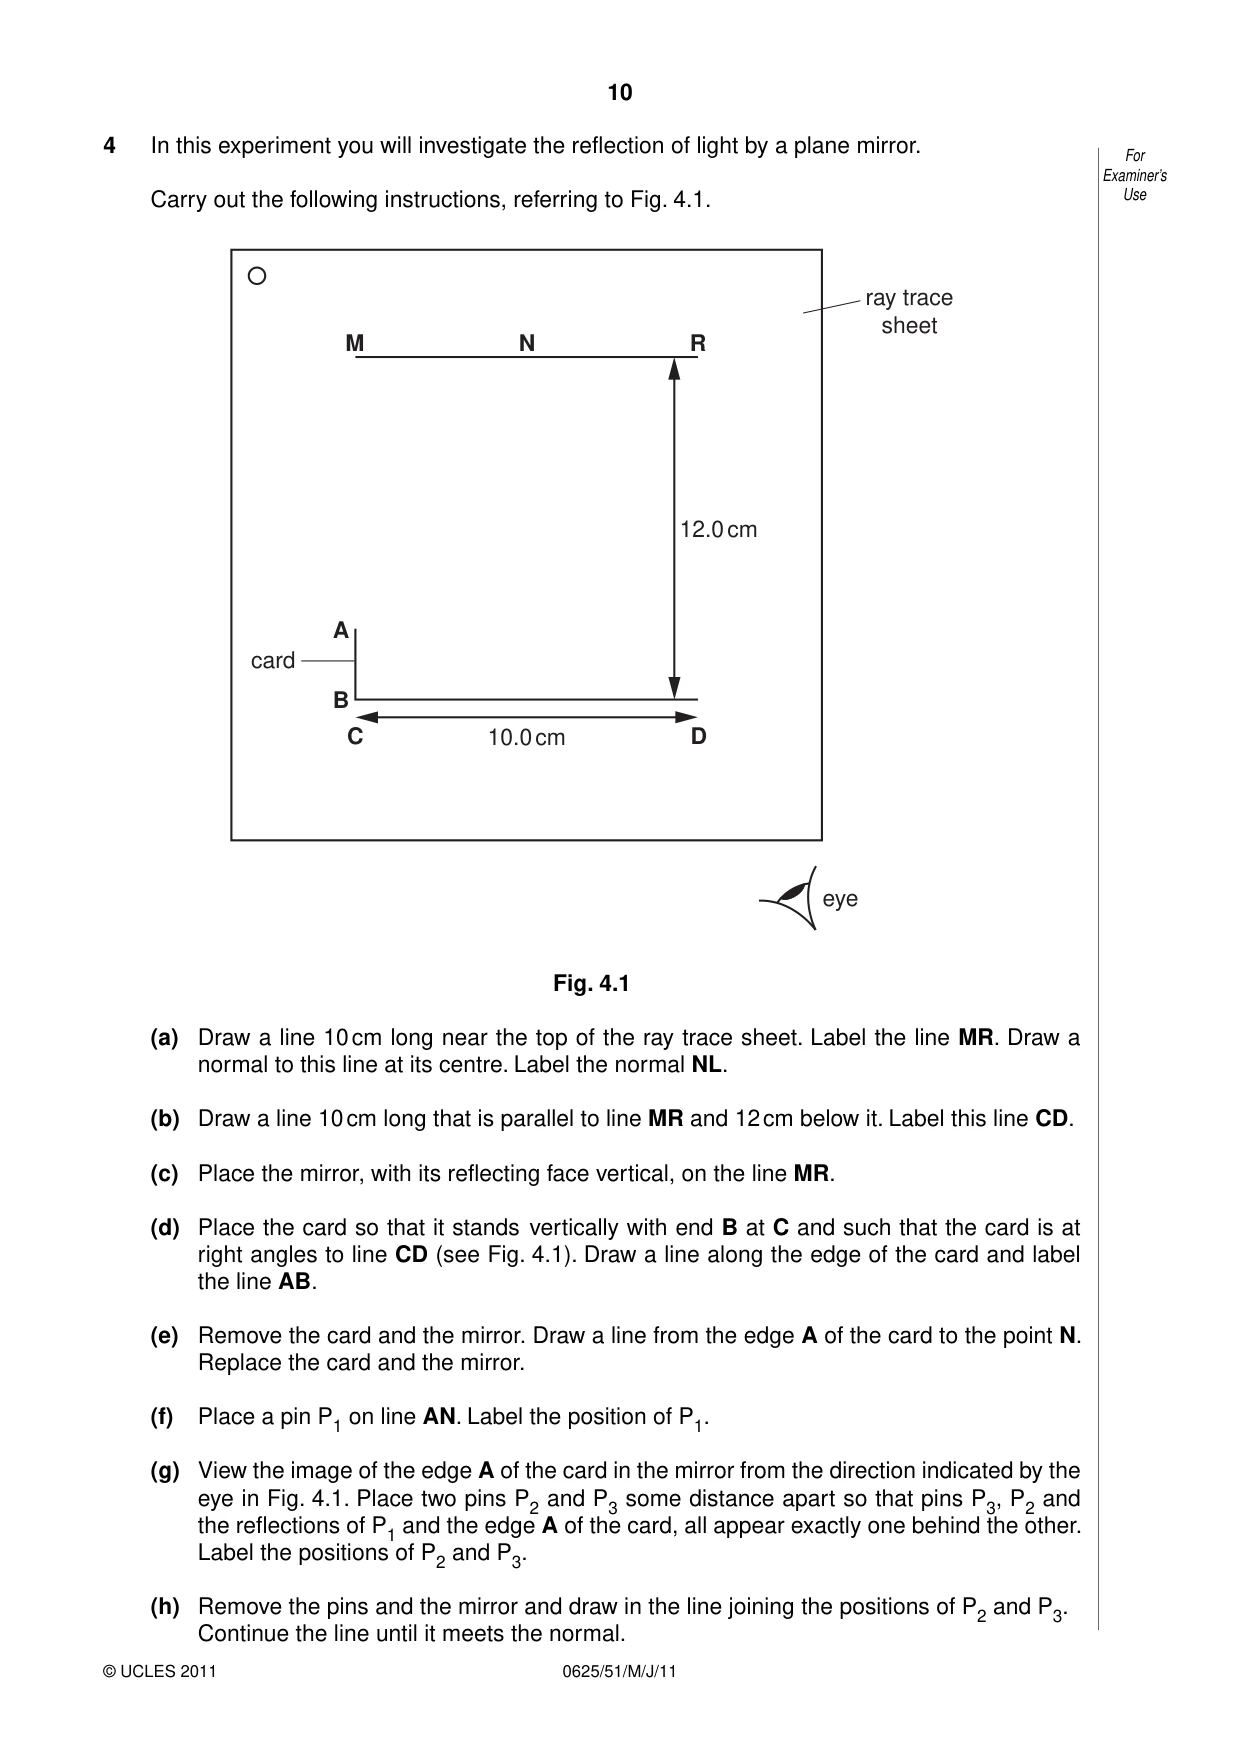
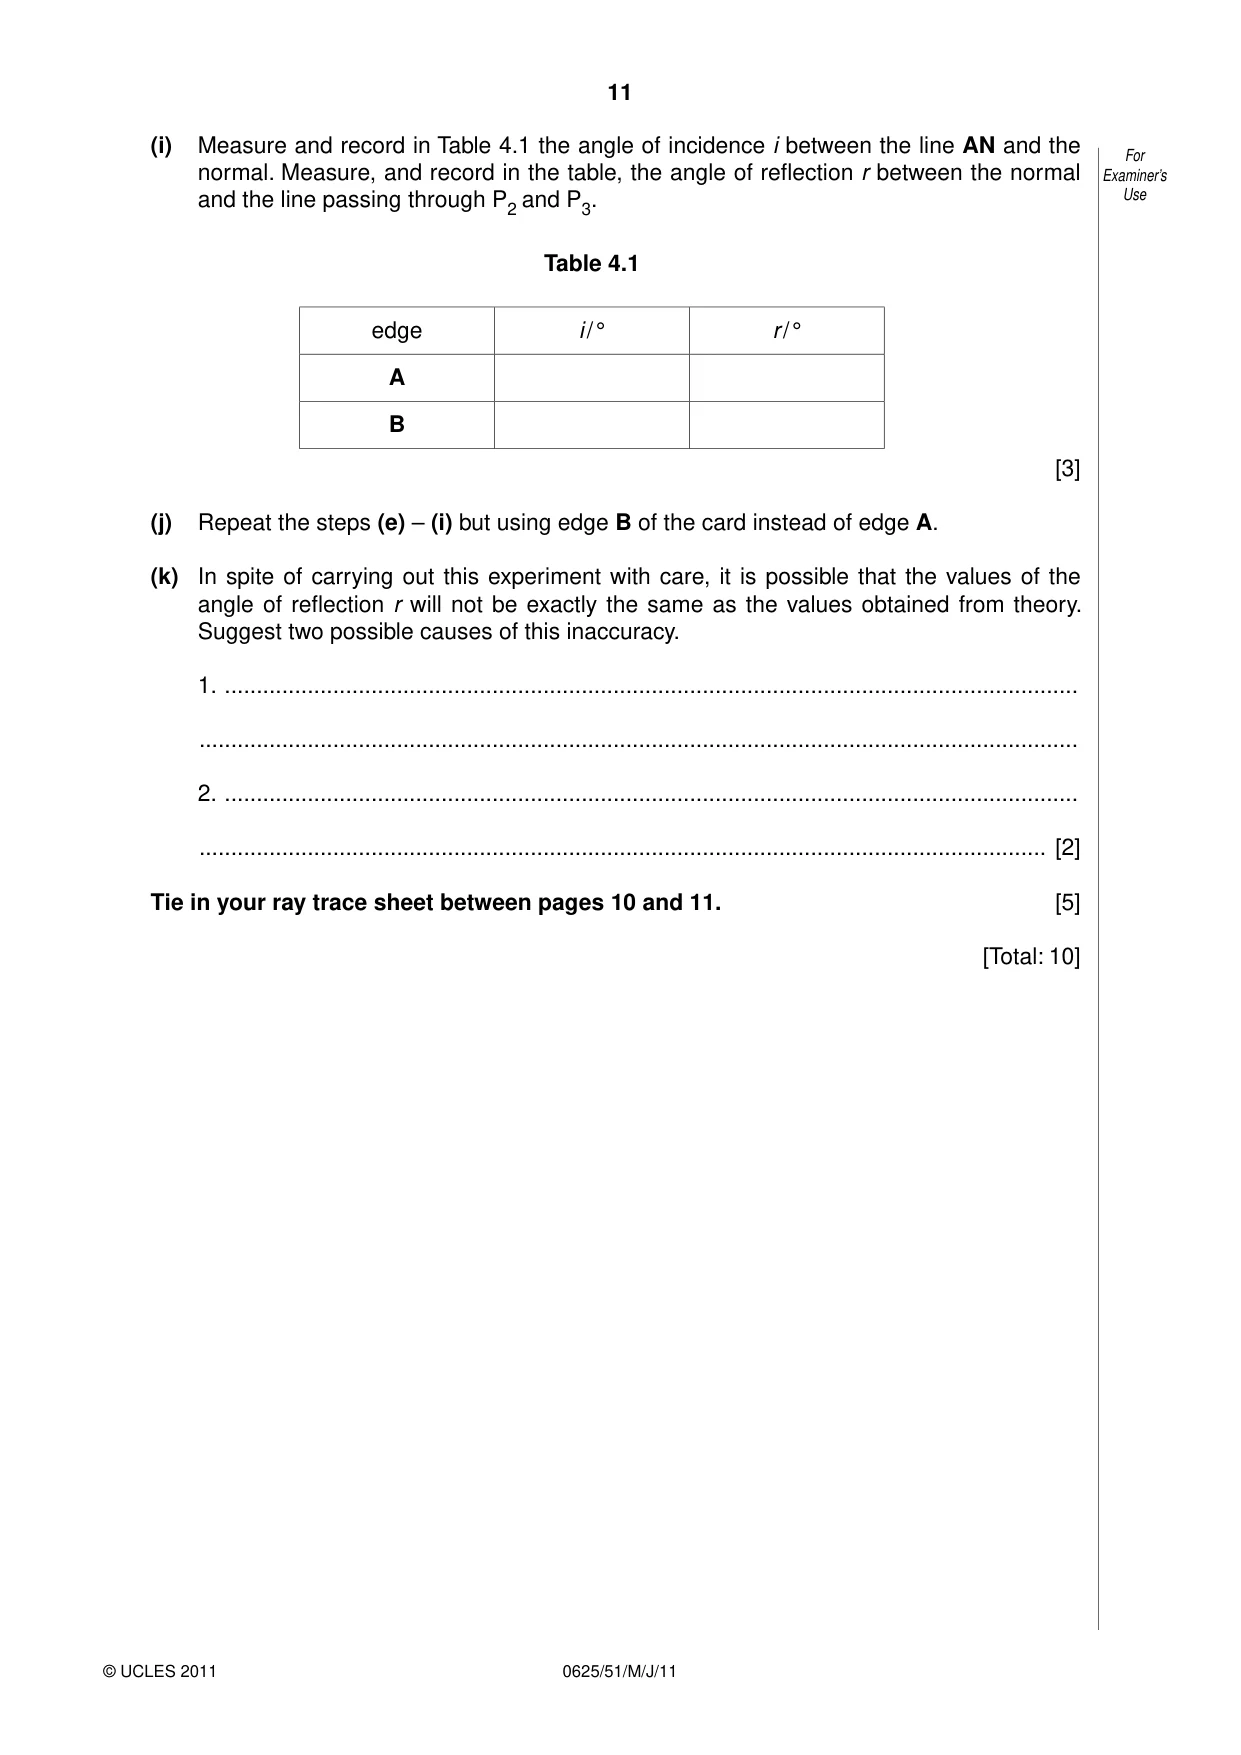
4 In this experiment you will investigate the reflection of light by a plane mirror. For Examiner’s Carry out the following instructions, referring to Fig. 4.1. Use ray trace sheet M N R 12.0 cm A card B C 10.0 cm D eye Fig. 4.1 (a) Draw a line 10 cm long near the top of the ray trace sheet. Label the line MR. Draw a normal to this line at its centre. Label the normal NL. (b) Draw a line 10 cm long that is parallel to line MR and 12 cm below it. Label this line CD. (c) Place the mirror, with its reflecting face vertical, on the line MR. (d) Place the card so that it stands vertically with end B at C and such that the card is at right angles to line CD (see Fig. 4.1). Draw a line along the edge of the card and label the line AB. (e) Remove the card and the mirror. Draw a line from the edge A of the card to the point N. Replace the card and the mirror. (f) Place a pin P1 on line AN. Label the position of P1. (g) View the image of the edge A of the card in the mirror from the direction indicated by the eye in Fig. 4.1. Place two pins P2 and P3 some distance apart so that pins P3, P2 and the reflections of P1 and the edge A of the card, all appear exactly one behind the other. Label the positions of P2 and P3. (h) Remove the pins and the mirror and draw in the line joining the positions of P2 and P3. Continue the line until it meets the normal. (i) Measure and record in Table 4.1 the angle of incidence i between the line AN and the For normal. Measure, and record in the table, the angle of reflection r between the normal Examiner’s and the line passing through P2 and P3. Use Table 4.1 edge i / ° r / ° A B [3] (j) Repeat the steps (e) – (i) but using edge B of the card instead of edge A. (k) In spite of carrying out this experiment with care, it is possible that the values of the angle of reflection r will not be exactly the same as the values obtained from theory. Suggest two possible causes of this inaccuracy. 1. ...................................................................................................................................... .......................................................................................................................................... 2. ...................................................................................................................................... ..................................................................................................................................... [2] Tie in your ray trace sheet between pages 10 and 11. [5] [Total: 10]
Mark scheme: 4 Trace: Normal at 90o in correct position [1] All lines present and neat [1] CD correct position [1] AB correct position [1] P2P3 distance > 5.0cm [1] Table: i values correct to 2º [1] r values correct to 2º [1] i = r to 4o [1] (j) Any two: Thickness of lines Thickness of mirror Thickness of protractor (owtte) Thickness of pins [2] [Total: 10]
What was in this paper
The subtopics covered by these 4 questions, and how many questions each got. Open one in a new tab to see every Cambridge question on it.
What you needed in this session
Cambridge’s own grade thresholds for 2011 May/June, Paper 5 · Variant 1. A higher threshold means an easier paper — the bar moves with how the cohort did.