Cambridge IGCSE Physics 0625 — 2010 Oct/Nov Paper 5 · Variant 1
0625/51/O/N/10 · 4 questions · 40 marks · ≈45 min
The question paper and its mark scheme, free to read here and free to download. This is Cambridge’s own paper, exactly as it was sat.
Question paper12 pages
Mark scheme3 pages
Answers below. Sit the paper first if you are practising.
Questions as text
Q1 · In this experiment, you are to determine the position of the centre of mass of an object…
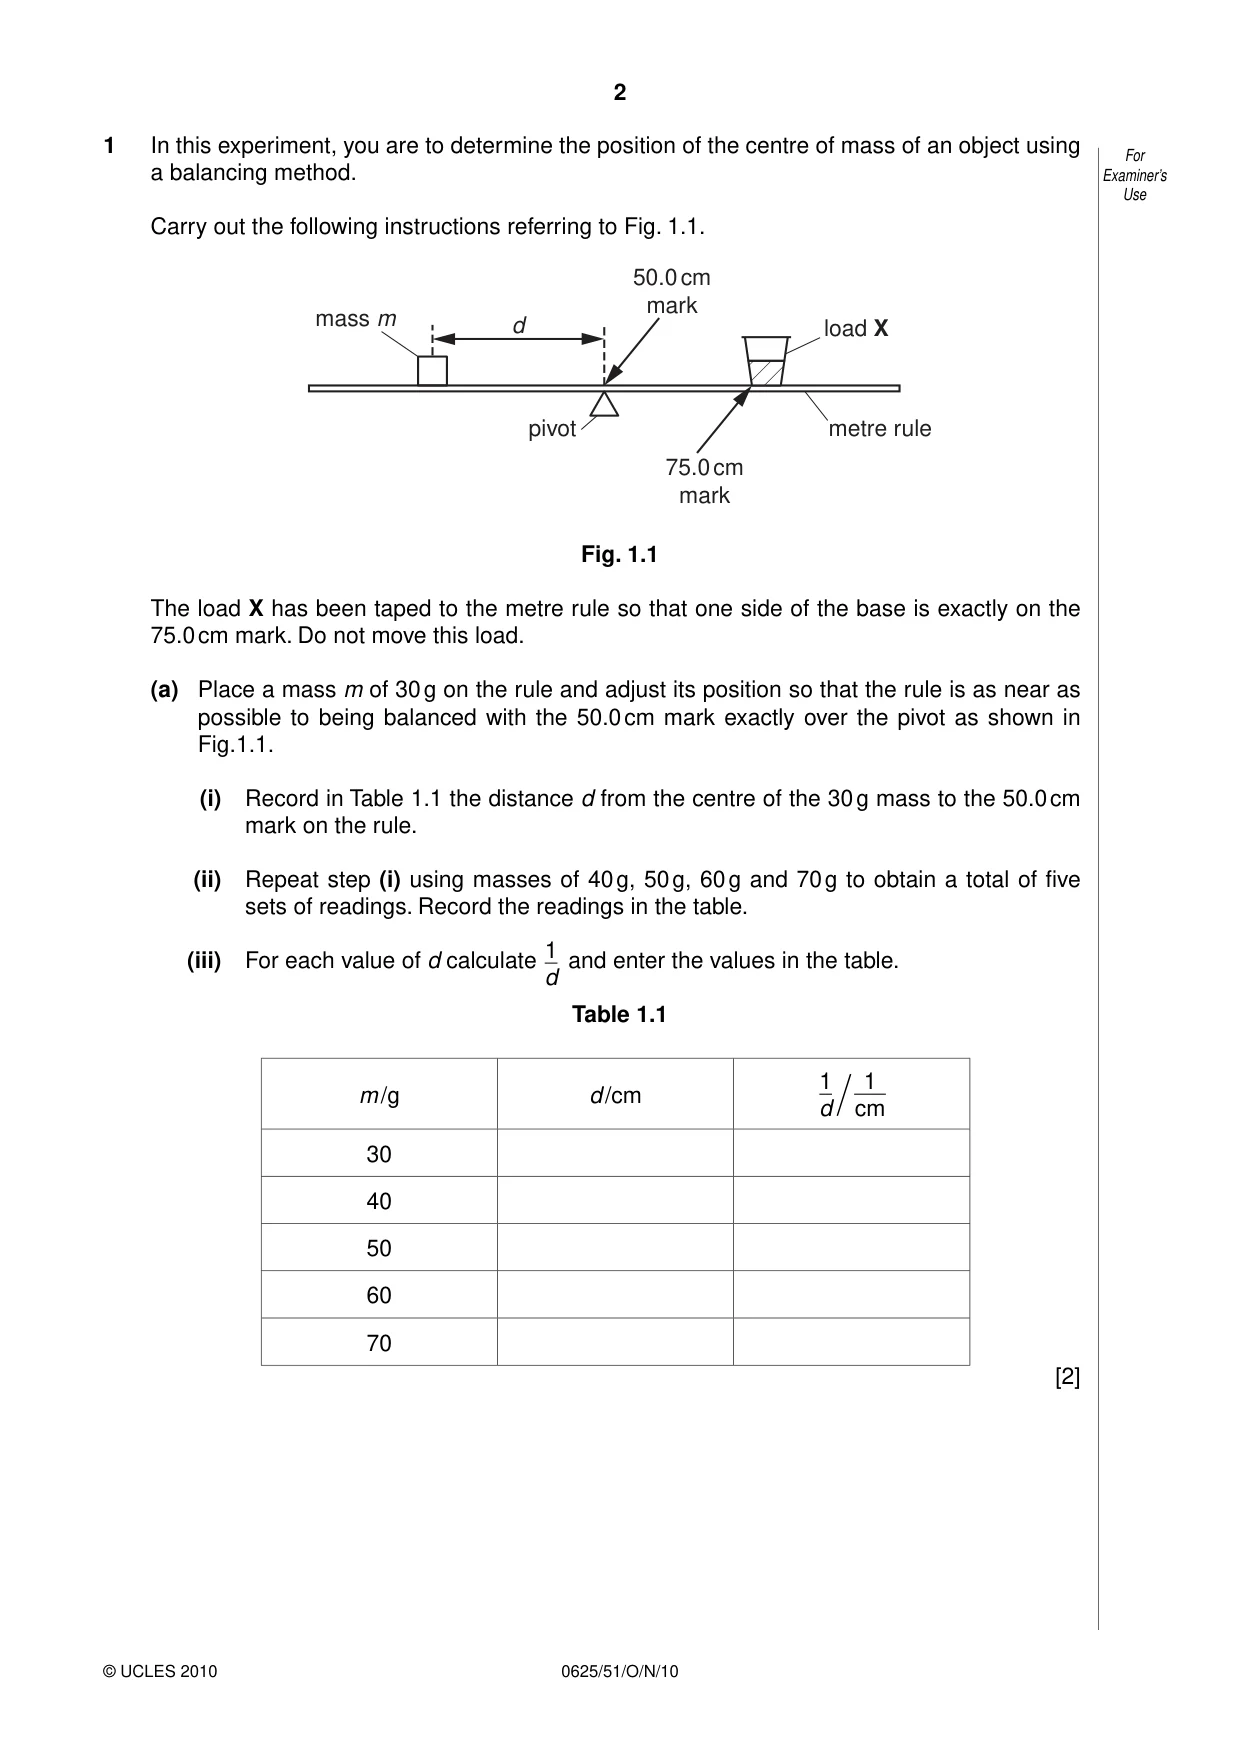
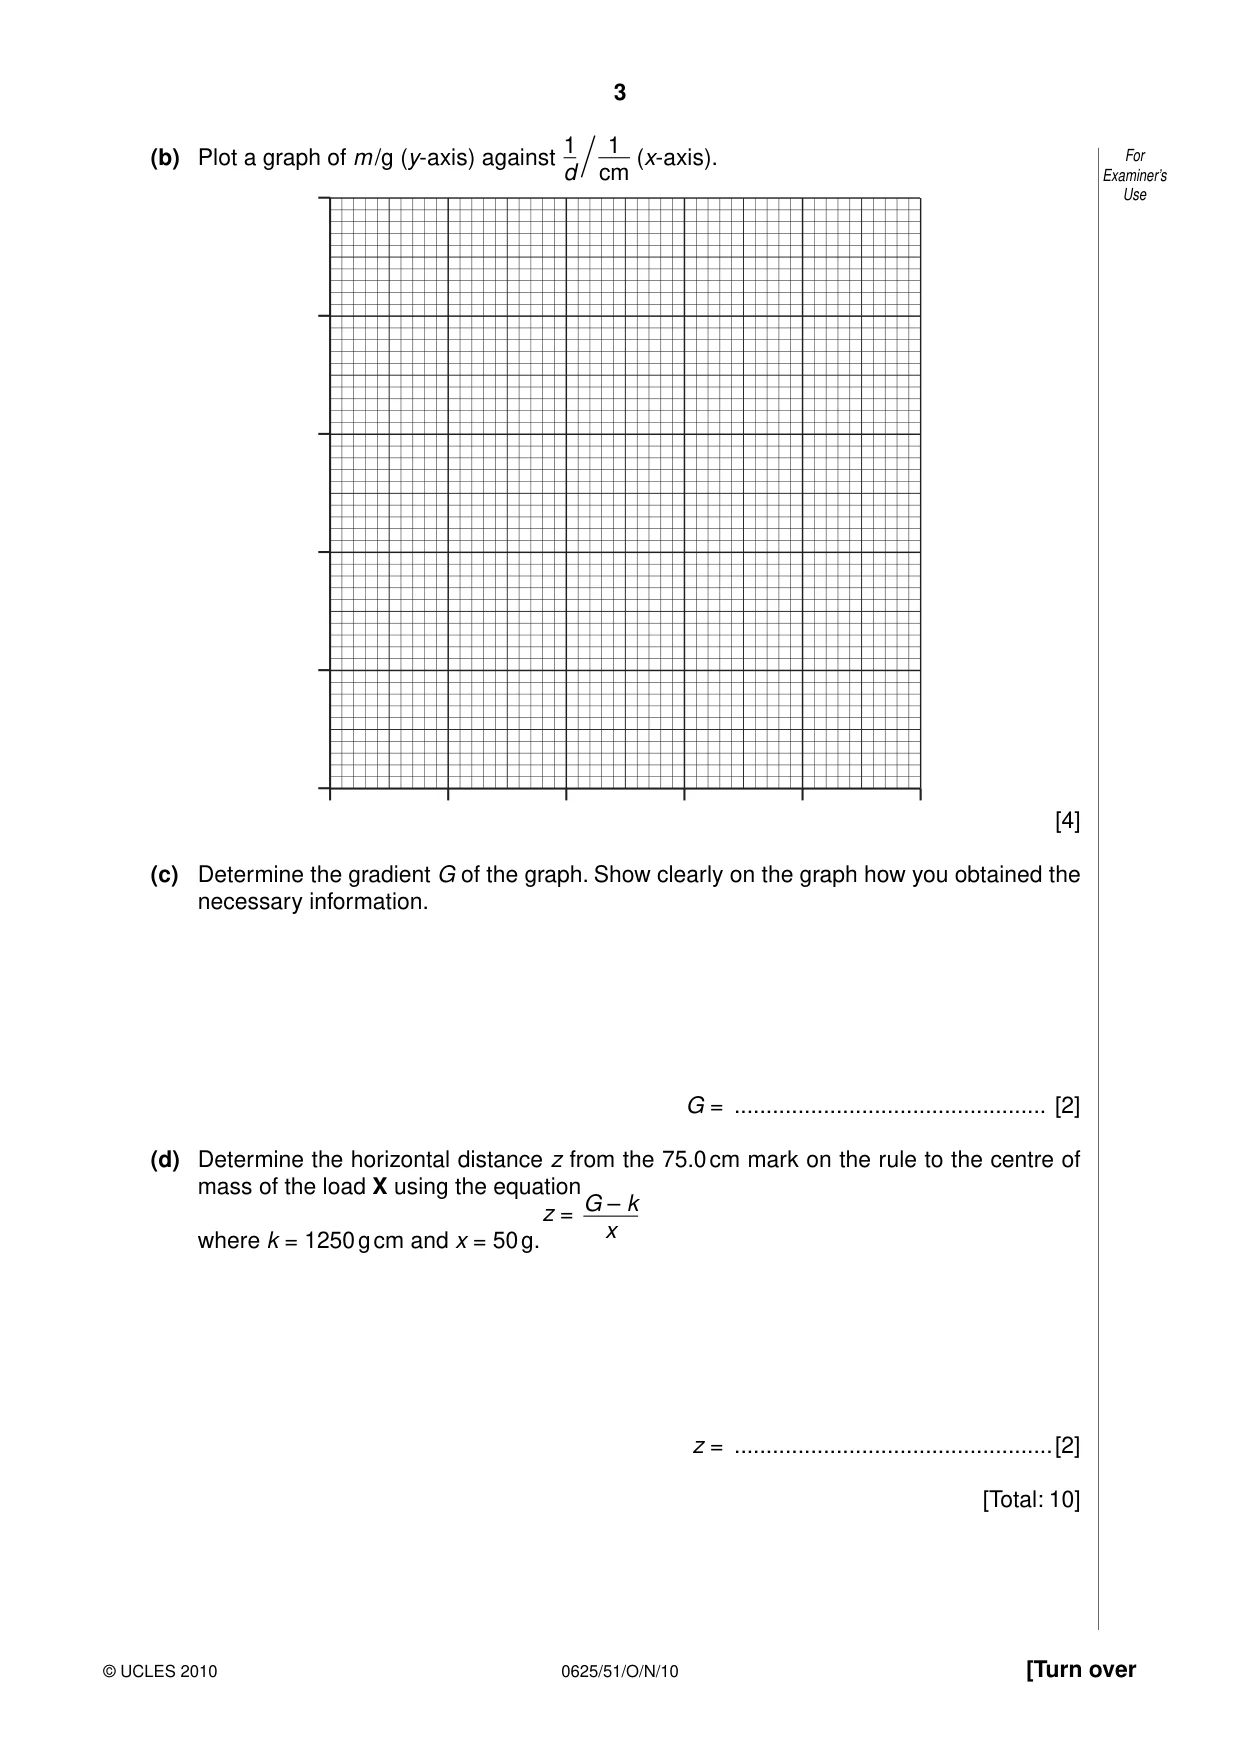
1 In this experiment, you are to determine the position of the centre of mass of an object using For a balancing method. Examiner’s Use Carry out the following instructions referring to Fig. 1.1. 50.0 cm mark mass m d load X pivot metre rule 75.0 cm mark Fig. 1.1 The load X has been taped to the metre rule so that one side of the base is exactly on the 75.0 cm mark. Do not move this load. (a) Place a mass m of 30 g on the rule and adjust its position so that the rule is as near as possible to being balanced with the 50.0 cm mark exactly over the pivot as shown in Fig.1.1. (i) Record in Table 1.1 the distance d from the centre of the 30 g mass to the 50.0 cm mark on the rule. (ii) Repeat step (i) using masses of 40 g, 50 g, 60 g and 70 g to obtain a total of five sets of readings. Record the readings in the table. 1 (iii) For each value of d calculate and enter the values in the table. d Table 1.1 1 1 m /g d /cm d cm 30 40 50 60 70 [2] 1 1 (b) Plot a graph of m /g (y-axis) against (x-axis). For d cm Examiner’s Use [4] (c) Determine the gradient G of the graph. Show clearly on the graph how you obtained the necessary information. G = ................................................. [2] (d) Determine the horizontal distance z from the 75.0 cm mark on the rule to the centre of mass of the load X using the equation G – k z = x where k = 1250 g cm and x = 50 g. z = ..................................................[2] [Total: 10]
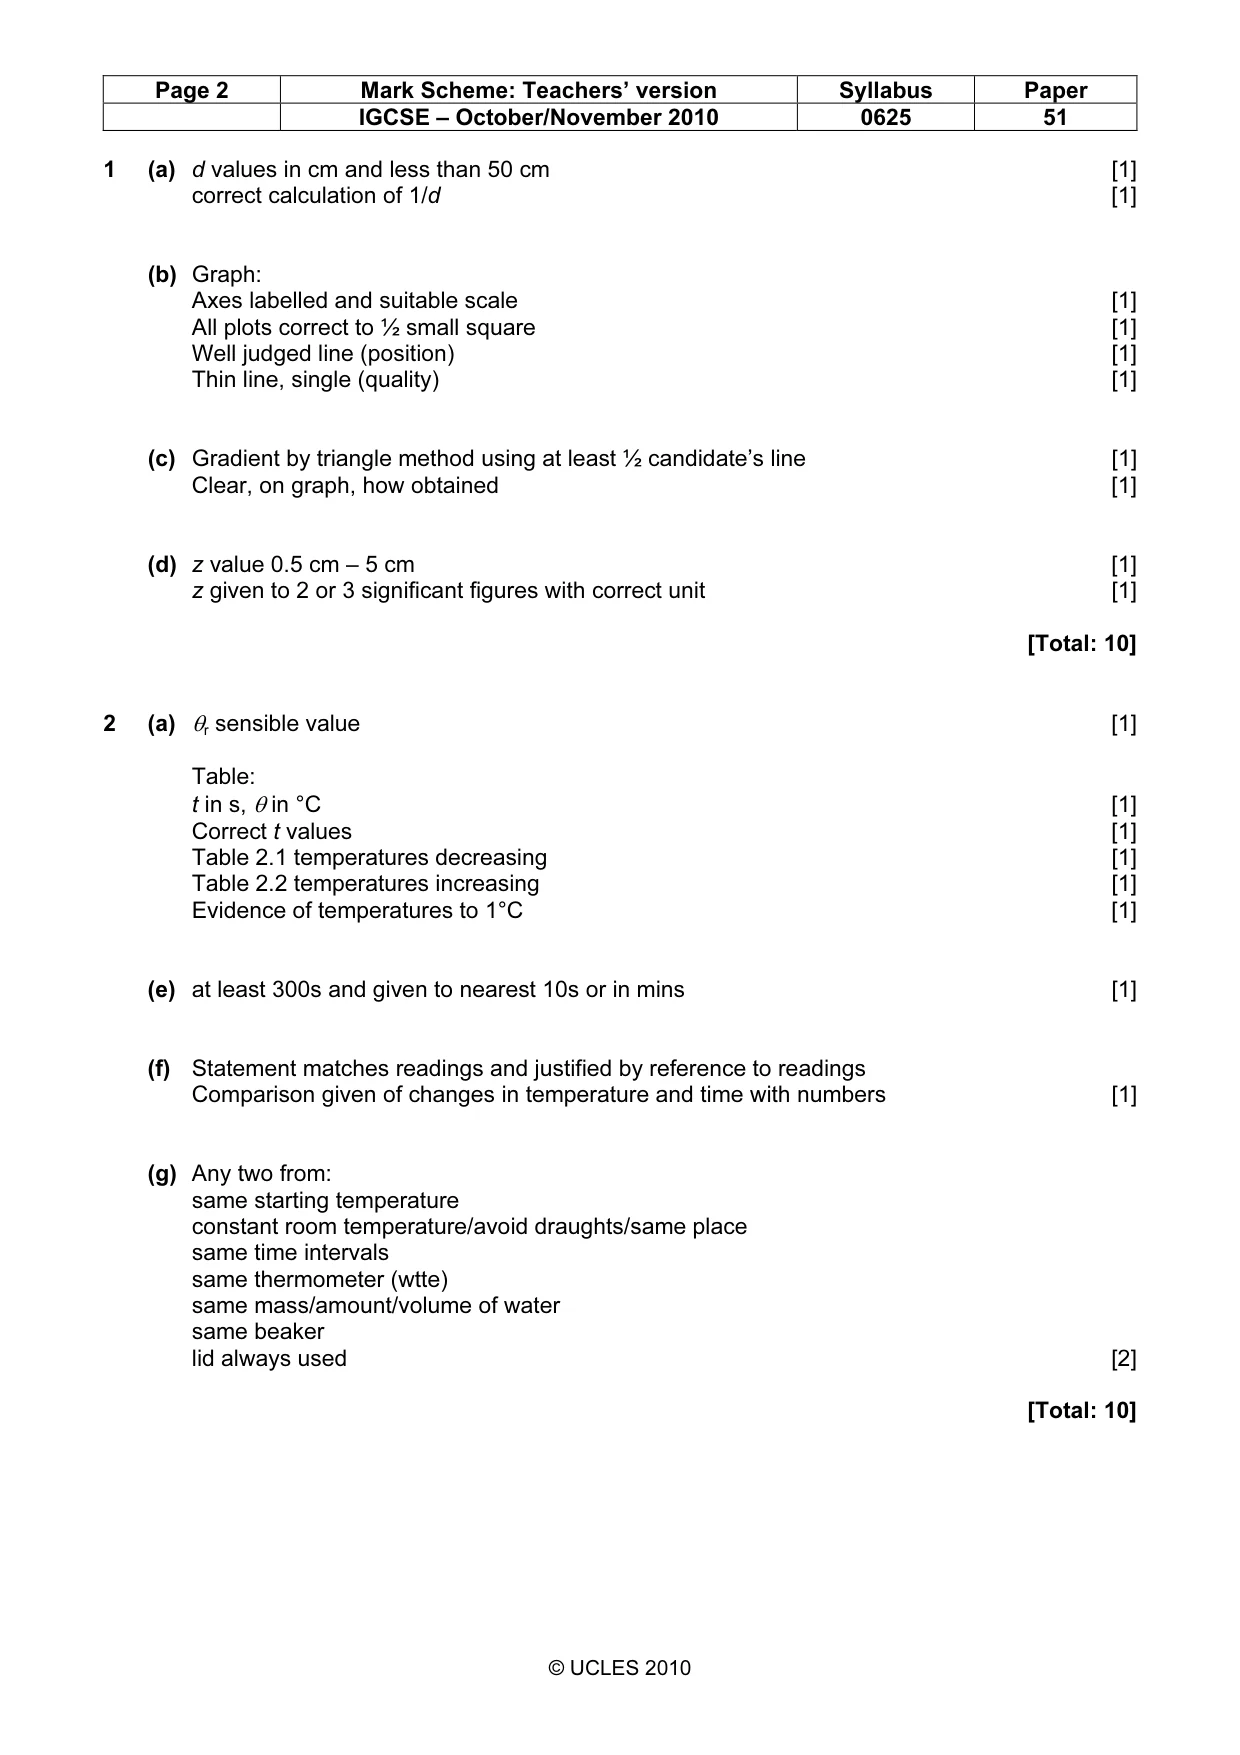
Mark scheme: 1 (a) d values in cm and less than 50 cm [1] correct calculation of 1/d [1] (b) Graph: Axes labelled and suitable scale [1] All plots correct to ½ small square [1] Well judged line (position) [1] Thin line, single (quality) [1] (c) Gradient by triangle method using at least ½ candidate’s line [1] Clear, on graph, how obtained [1] (d) z value 0.5 cm – 5 cm [1] z given to 2 or 3 significant figures with correct unit [1] [Total: 10]
Q2 · In this experiment you will investigate the rate of heating and cooling of a thermometer…
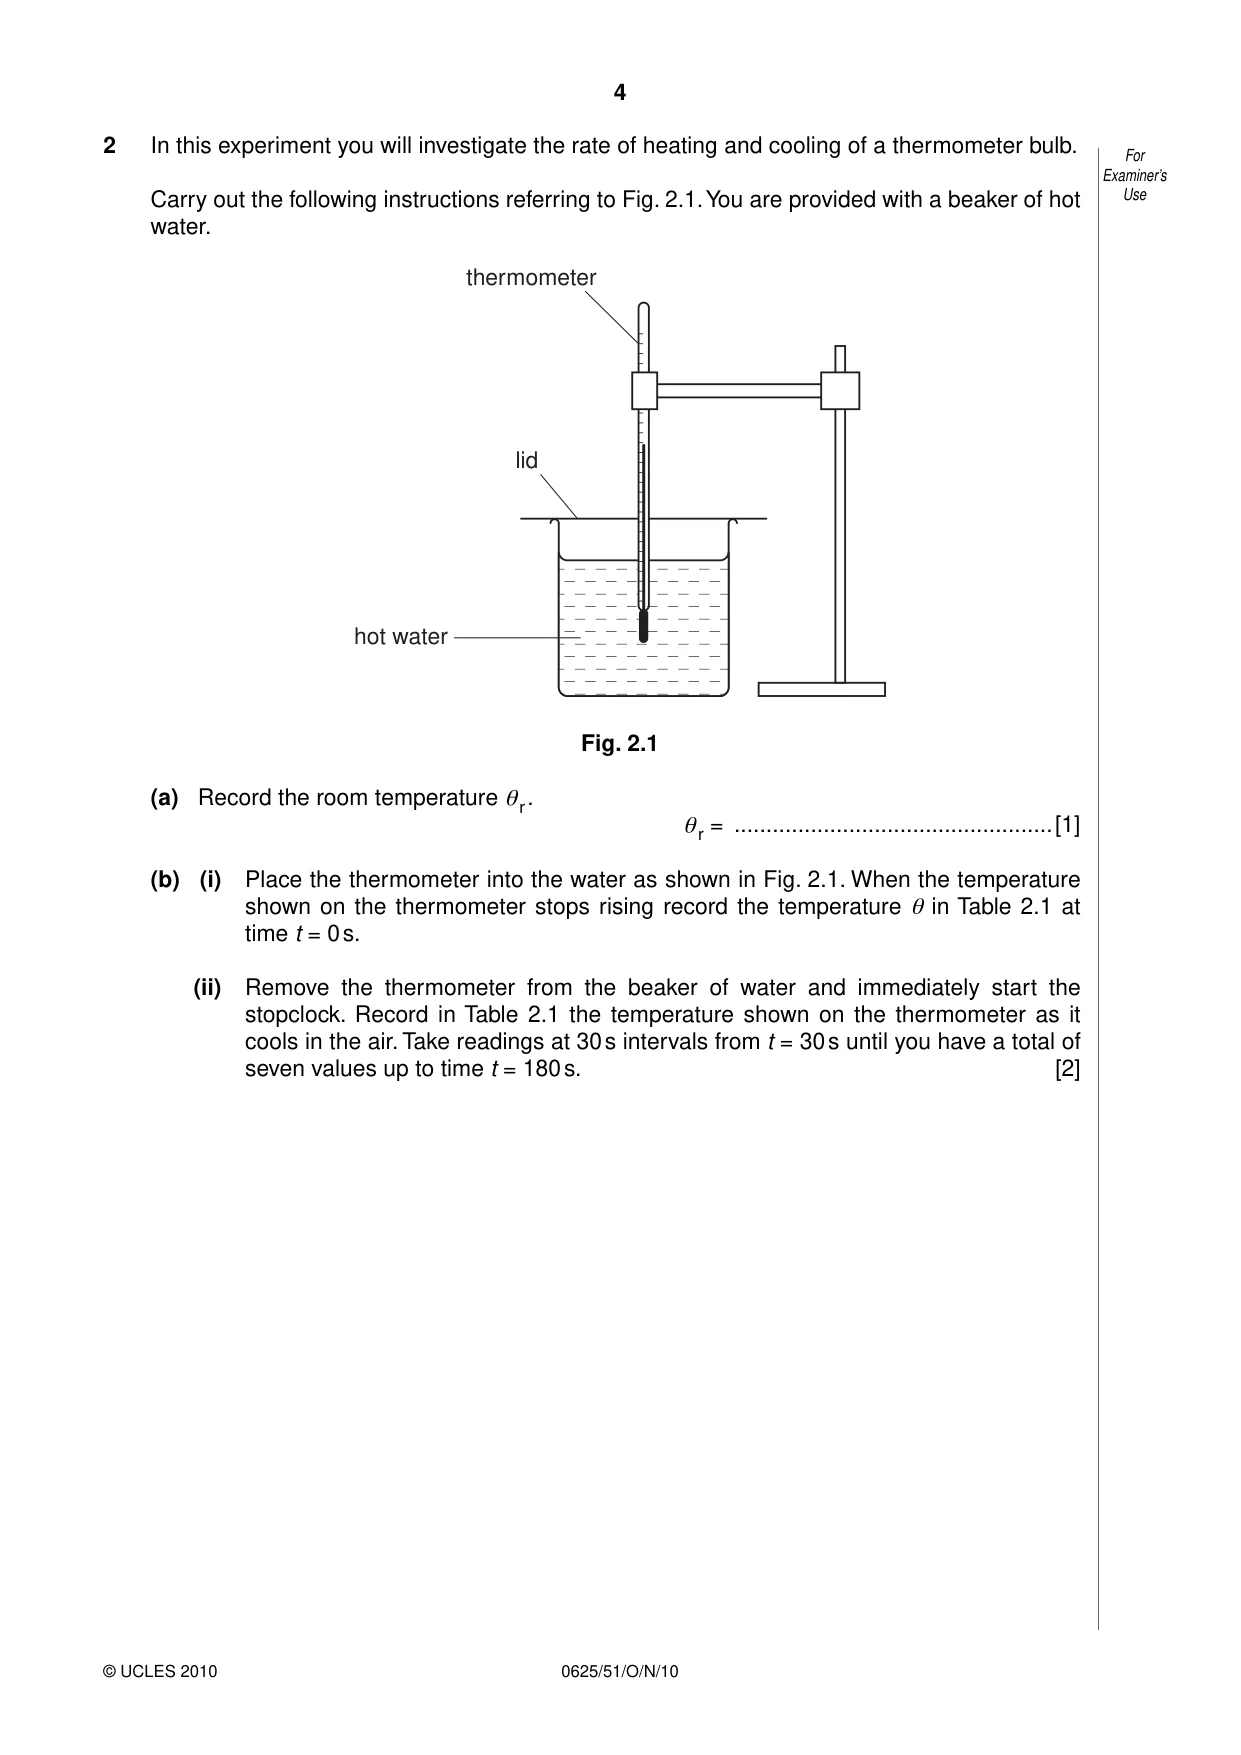
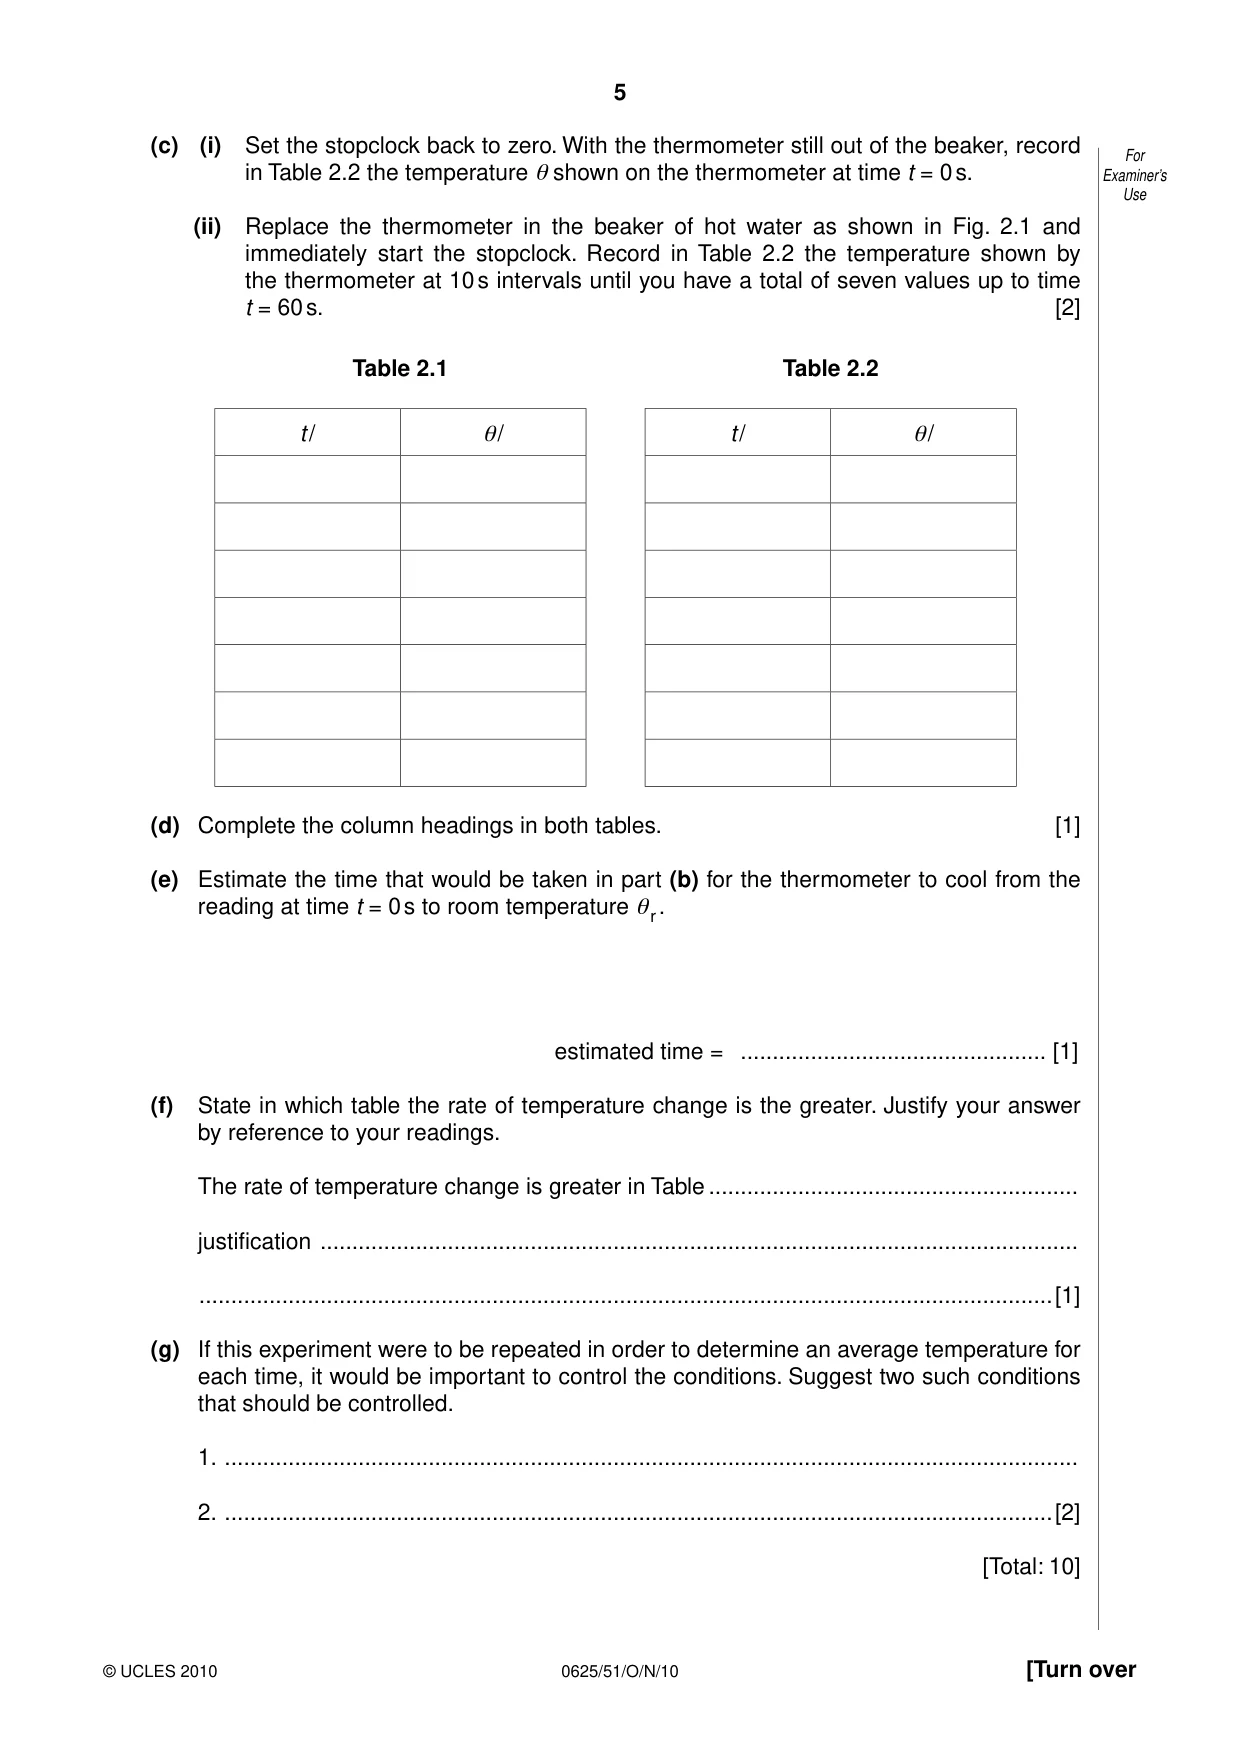
2 In this experiment you will investigate the rate of heating and cooling of a thermometer bulb. For Examiner’s Carry out the following instructions referring to Fig. 2.1. You are provided with a beaker of hot Use water. thermometer lid hot water Fig. 2.1 (a) Record the room temperature θr . θr = ..................................................[1] (b) (i) Place the thermometer into the water as shown in Fig. 2.1. When the temperature shown on the thermometer stops rising record the temperature θ in Table 2.1 at time t = 0 s. (ii) Remove the thermometer from the beaker of water and immediately start the stopclock. Record in Table 2.1 the temperature shown on the thermometer as it cools in the air. Take readings at 30 s intervals from t = 30 s until you have a total of seven values up to time t = 180 s. [2] (c) (i) Set the stopclock back to zero. With the thermometer still out of the beaker, record For in Table 2.2 the temperature θ shown on the thermometer at time t = 0 s. Examiner’s Use (ii) Replace the thermometer in the beaker of hot water as shown in Fig. 2.1 and immediately start the stopclock. Record in Table 2.2 the temperature shown by the thermometer at 10 s intervals until you have a total of seven values up to time t = 60 s. [2] Table 2.1 Table 2.2 t / θ/ t / θ/ (d) Complete the column headings in both tables. [1] (e) Estimate the time that would be taken in part (b) for the thermometer to cool from the reading at time t = 0 s to room temperature θr . estimated time = ................................................ [1] (f) State in which table the rate of temperature change is the greater. Justify your answer by reference to your readings. The rate of temperature change is greater in Table .......................................................... justification ....................................................................................................................... ......................................................................................................................................[1] (g) If this experiment were to be repeated in order to determine an average temperature for each time, it would be important to control the conditions. Suggest two such conditions that should be controlled. 1. ...................................................................................................................................... 2. ..................................................................................................................................[2] [Total: 10]
Mark scheme: 2 (a) θr sensible value [1] Table: t in s, θ in °C [1] Correct t values [1] Table 2.1 temperatures decreasing [1] Table 2.2 temperatures increasing [1] Evidence of temperatures to 1°C [1] (e) at least 300s and given to nearest 10s or in mins [1] (f) Statement matches readings and justified by reference to readings Comparison given of changes in temperature and time with numbers [1] (g) Any two from: same starting temperature constant room temperature/avoid draughts/same place same time intervals same thermometer (wtte) same mass/amount/volume of water same beaker lid always used [2] [Total: 10] IGCSE – October/November 2010 0625 51
Q3 · In this experiment, you will investigate the current in a circuit when different…
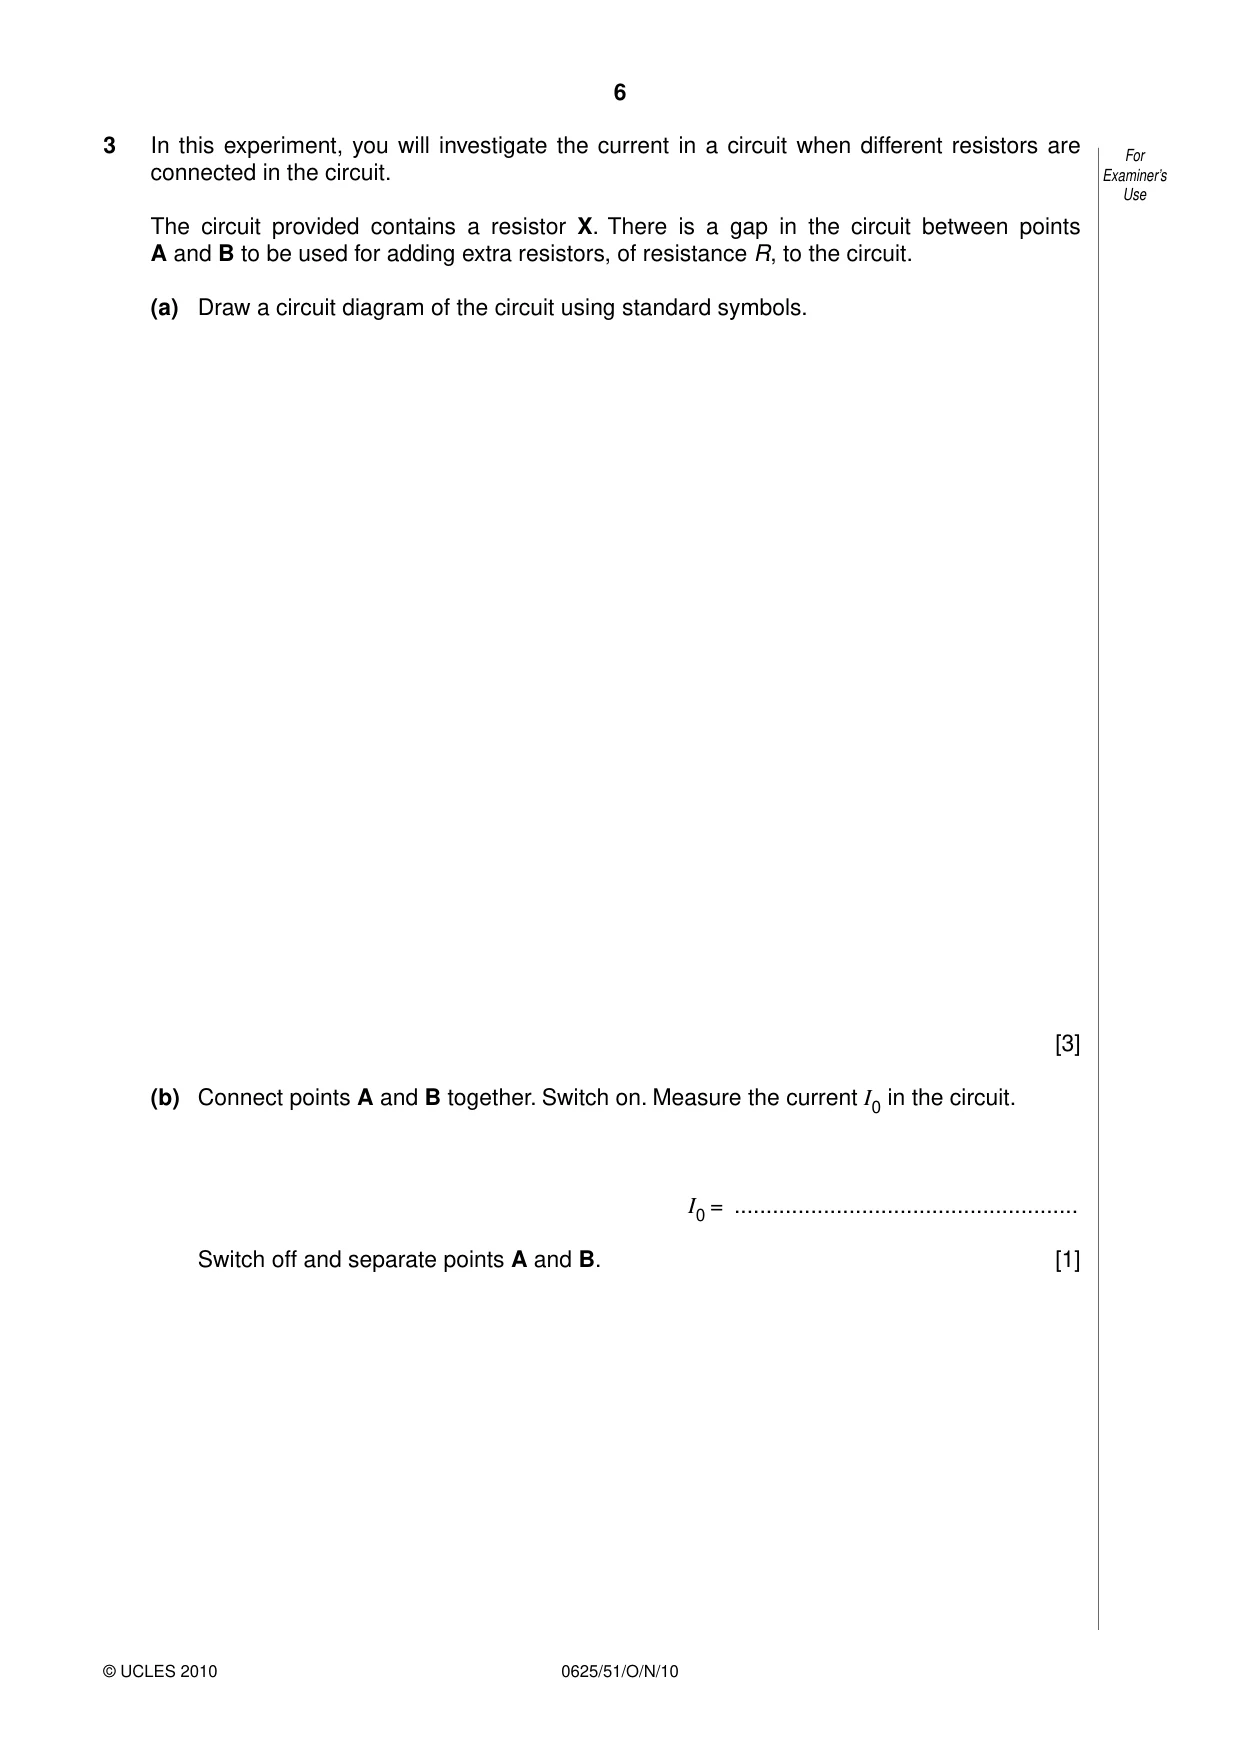
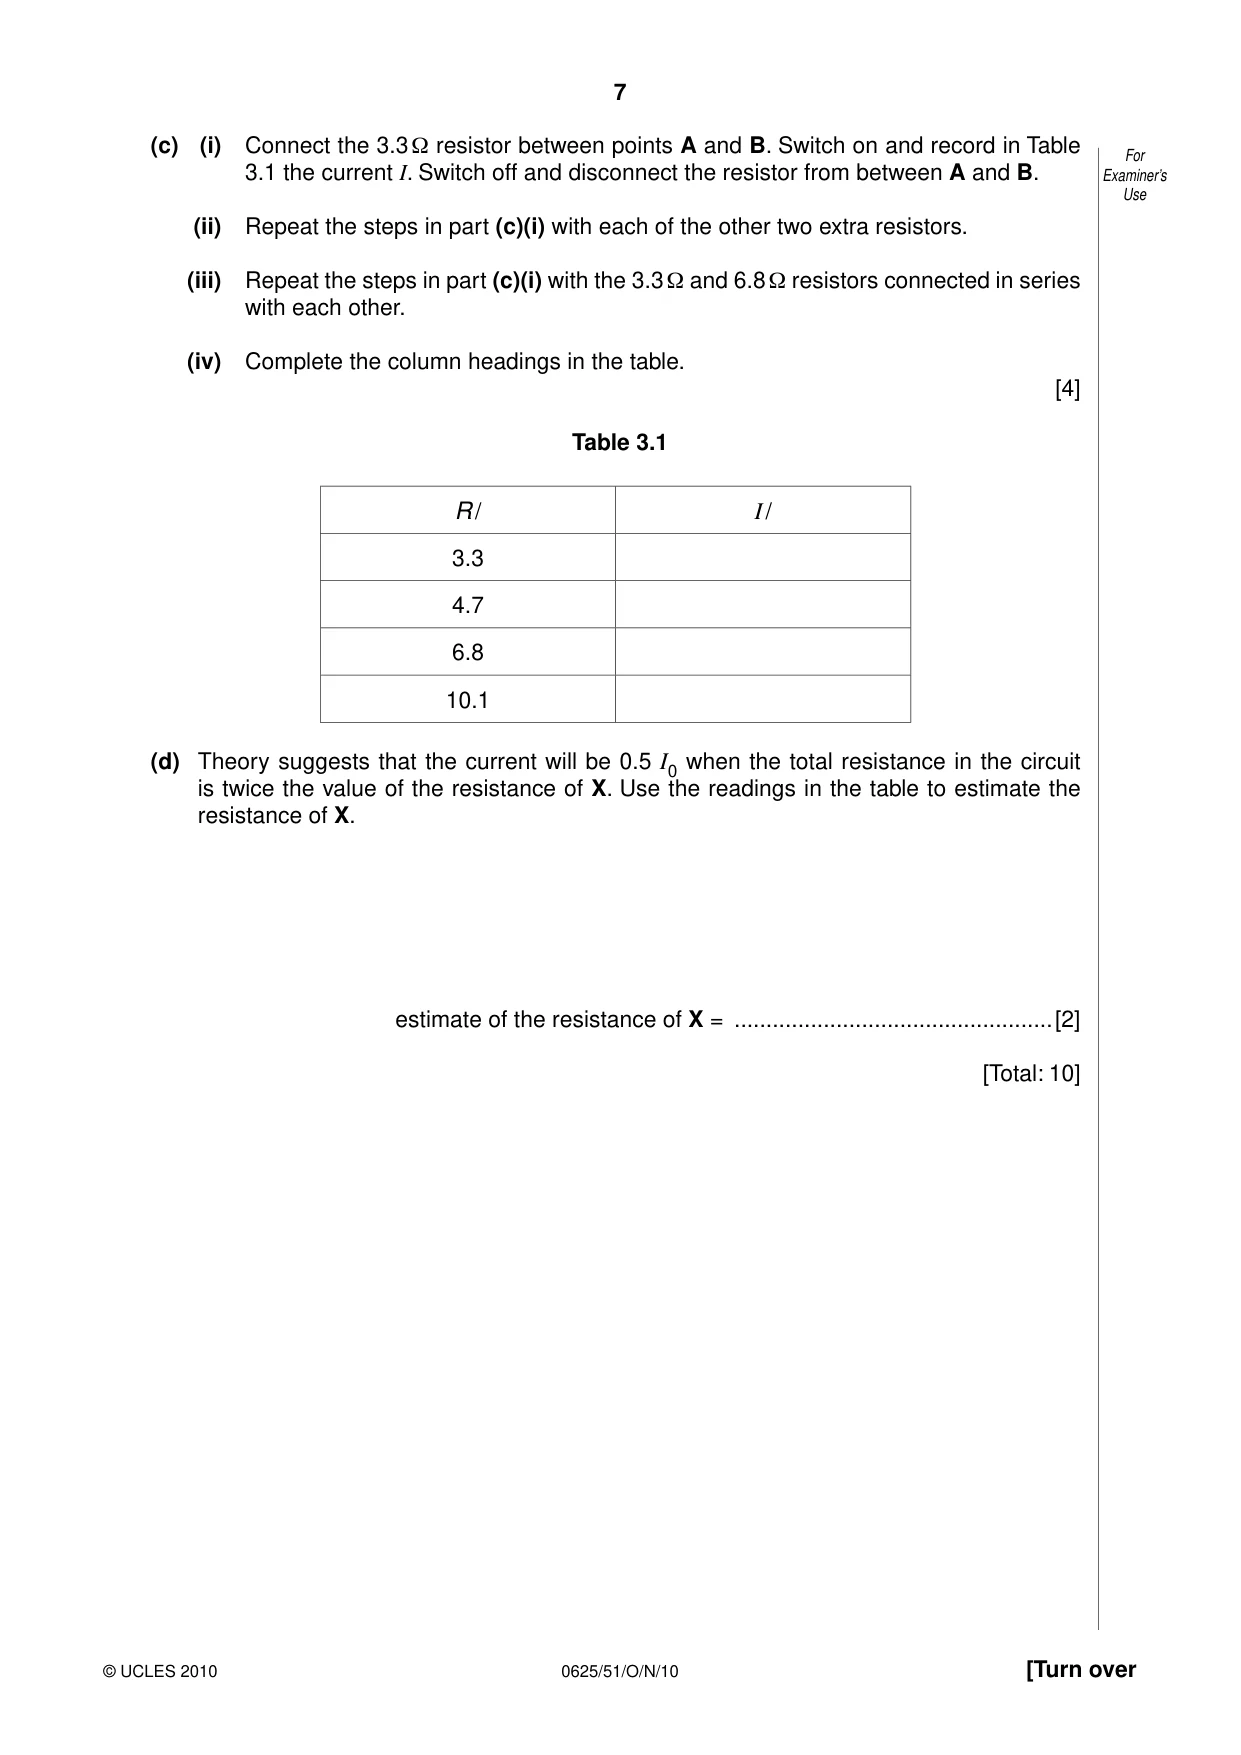
3 In this experiment, you will investigate the current in a circuit when different resistors are For connected in the circuit. Examiner’s Use The circuit provided contains a resistor X. There is a gap in the circuit between points A and B to be used for adding extra resistors, of resistance R, to the circuit. (a) Draw a circuit diagram of the circuit using standard symbols. [3] (b) Connect points A and B together. Switch on. Measure the current I0 in the circuit. I0 = ...................................................... Switch off and separate points A and B. [1] (c) (i) Connect the 3.3 Ω resistor between points A and B. Switch on and record in Table For 3.1 the current I. Switch off and disconnect the resistor from between A and B. Examiner’s Use (ii) Repeat the steps in part (c)(i) with each of the other two extra resistors. (iii) Repeat the steps in part (c)(i) with the 3.3 Ω and 6.8 Ω resistors connected in series with each other. (iv) Complete the column headings in the table. [4] Table 3.1 R / I / 3.3 4.7 6.8 10.1 (d) Theory suggests that the current will be 0.5 I0 when the total resistance in the circuit is twice the value of the resistance of X. Use the readings in the table to estimate the resistance of X. estimate of the resistance of X = ..................................................[2] [Total: 10]
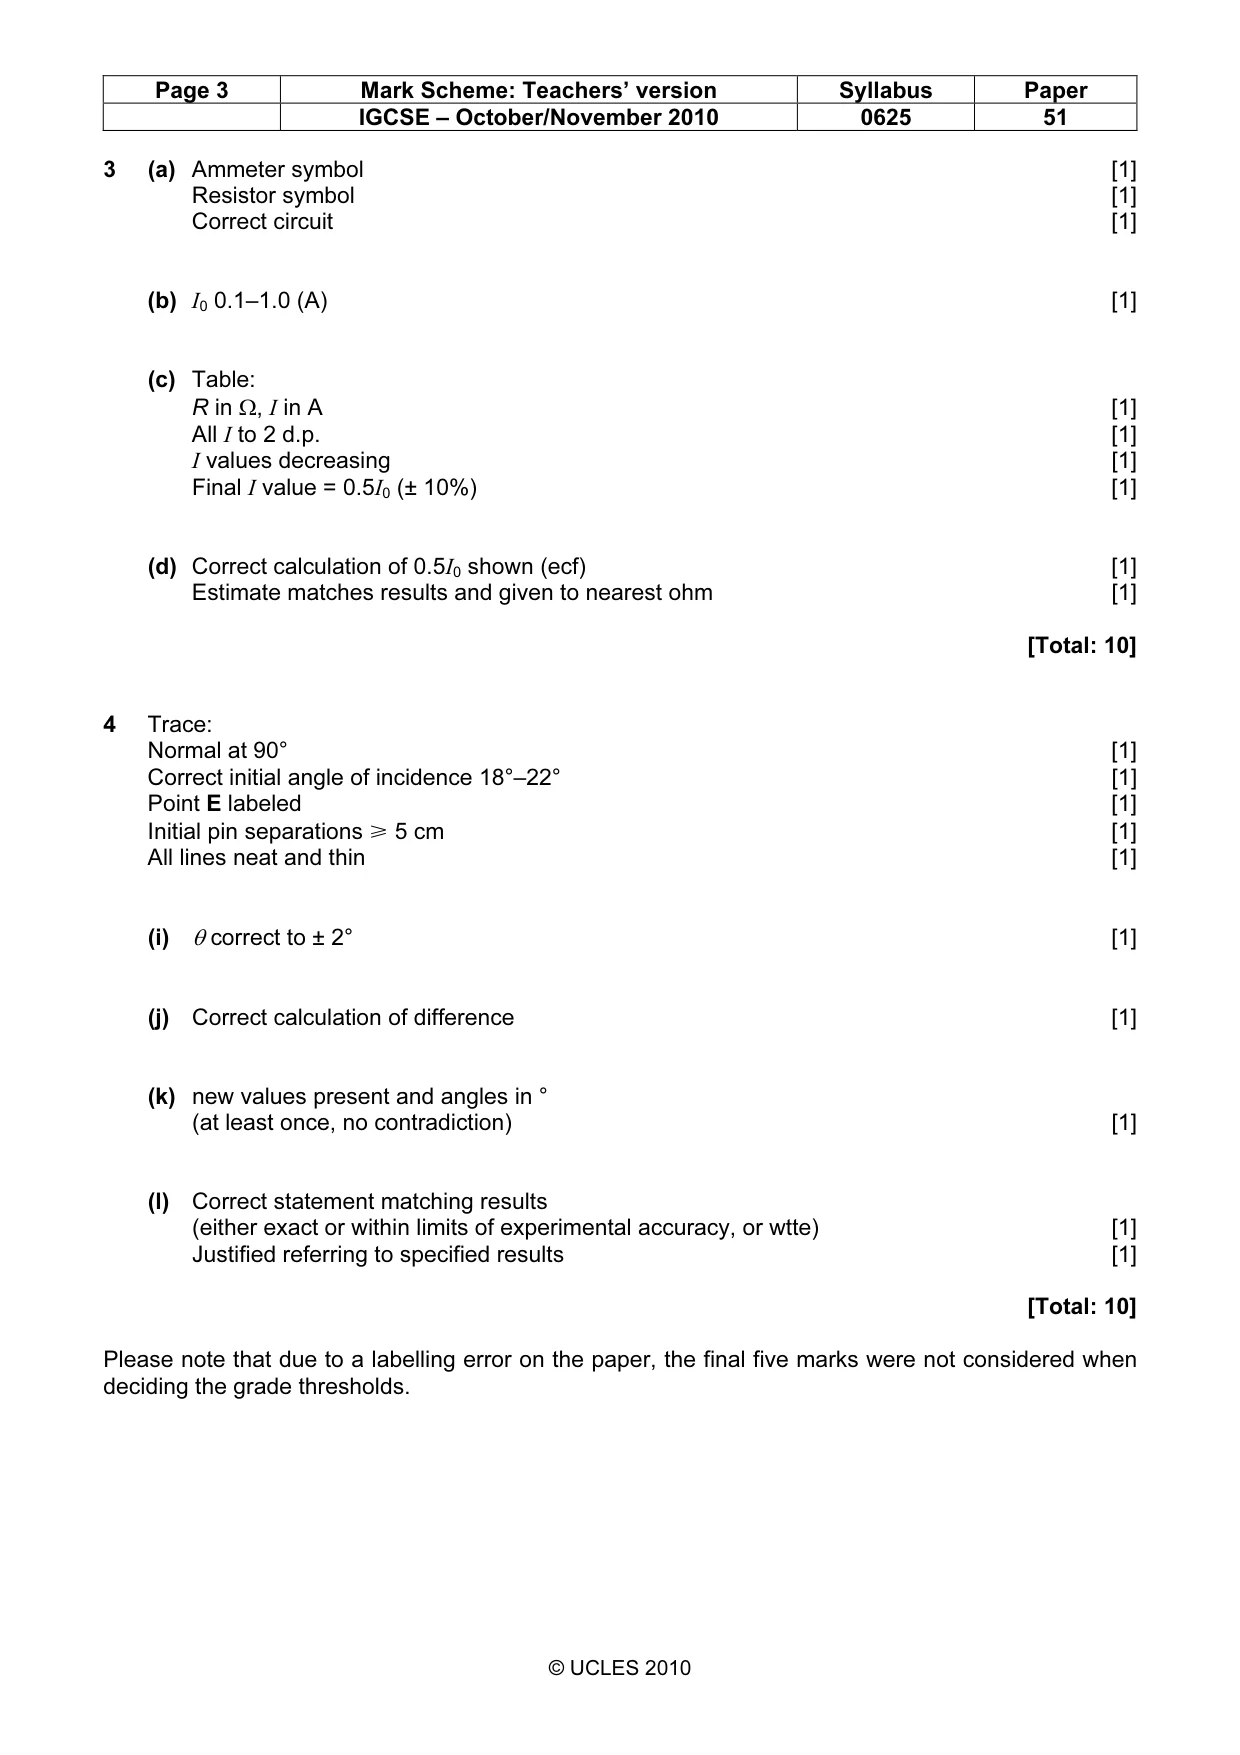
Mark scheme: 3 (a) Ammeter symbol [1] Resistor symbol [1] Correct circuit [1] (b) I0 0.1–1.0 (A) [1] (c) Table: R in Ω, I in A [1] All I to 2 d.p. [1] I values decreasing [1] Final I value = 0.5I0 (± 10%) [1] (d) Correct calculation of 0.5I0 shown (ecf) [1] Estimate matches results and given to nearest ohm [1] [Total: 10]
Q4 · In this experiment you will investigate reflection of light through a transparent block
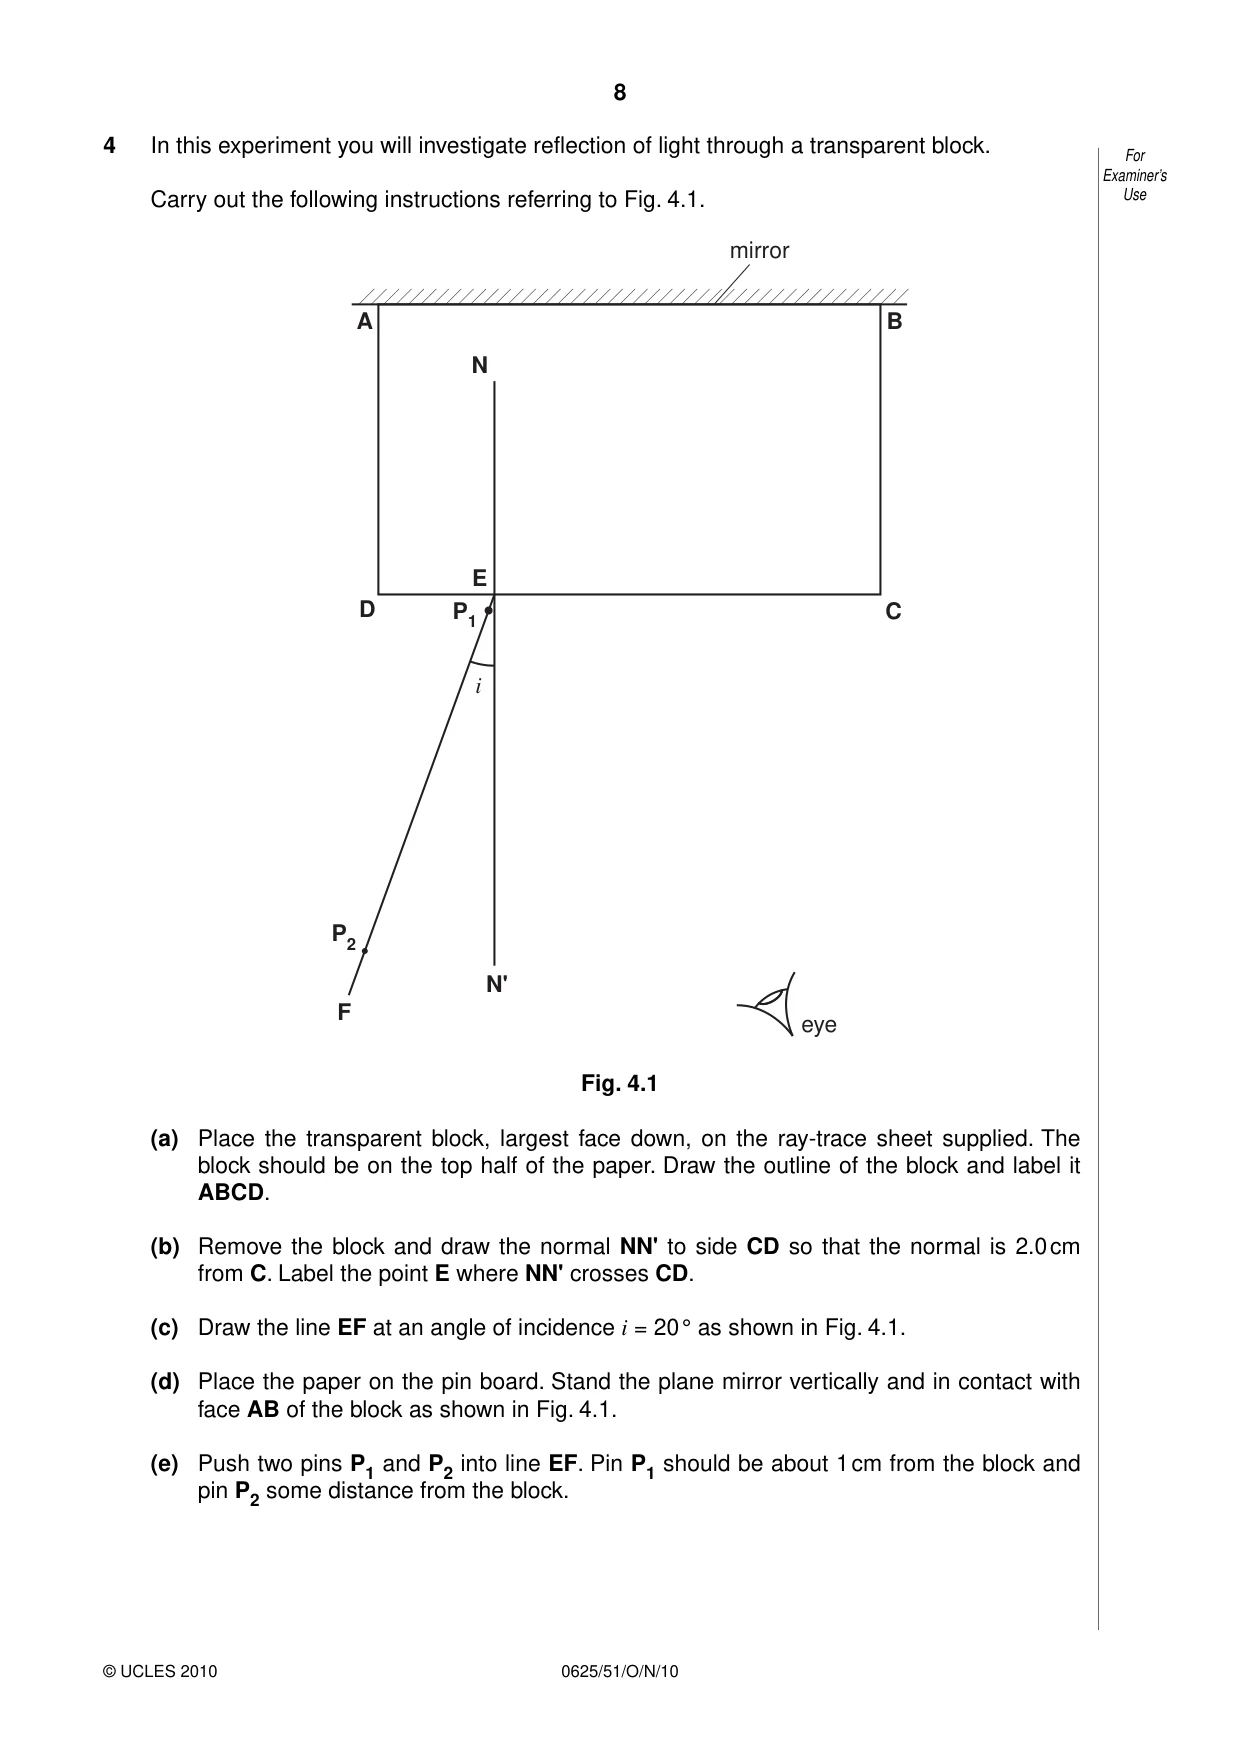
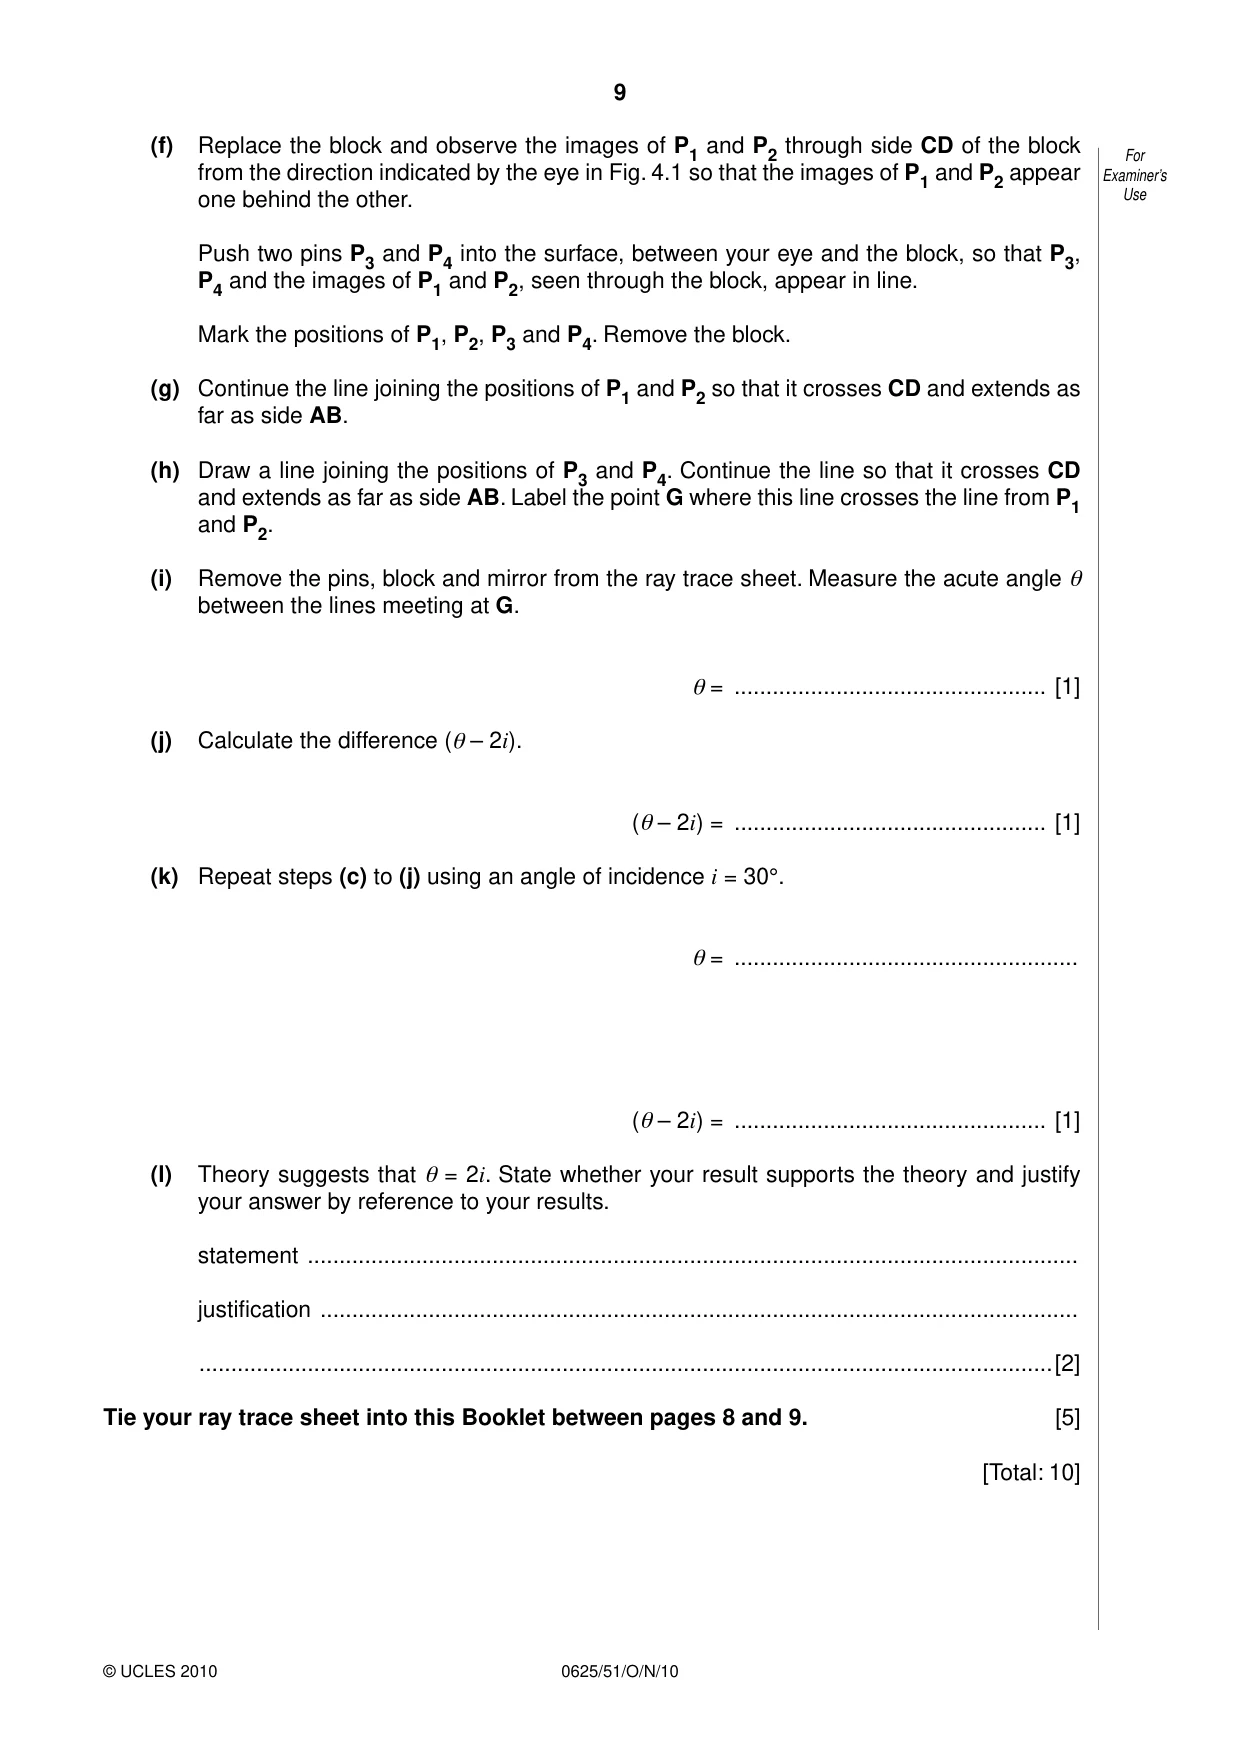
4 In this experiment you will investigate reflection of light through a transparent block. For Examiner’s Carry out the following instructions referring to Fig. 4.1. Use mirror A B N E D P1 C i P2 N' F eye Fig. 4.1 (a) Place the transparent block, largest face down, on the ray-trace sheet supplied. The block should be on the top half of the paper. Draw the outline of the block and label it ABCD. (b) Remove the block and draw the normal NN' to side CD so that the normal is 2.0 cm from C. Label the point E where NN' crosses CD. (c) Draw the line EF at an angle of incidence i = 20 ° as shown in Fig. 4.1. (d) Place the paper on the pin board. Stand the plane mirror vertically and in contact with face AB of the block as shown in Fig. 4.1. (e) Push two pins P1 and P2 into line EF. Pin P1 should be about 1 cm from the block and pin P2 some distance from the block. (f) Replace the block and observe the images of P1 and P2 through side CD of the block For Examiner’s from the direction indicated by the eye in Fig. 4.1 so that the images of P1 and P2 appear one behind the other. Use Push two pins P3 and P4 into the surface, between your eye and the block, so that P3, P4 and the images of P1 and P2, seen through the block, appear in line. Mark the positions of P1, P2, P3 and P4. Remove the block. (g) Continue the line joining the positions of P1 and P2 so that it crosses CD and extends as far as side AB. (h) Draw a line joining the positions of P3 and P4. Continue the line so that it crosses CD and extends as far as side AB. Label the point G where this line crosses the line from P1 and P2. (i) Remove the pins, block and mirror from the ray trace sheet. Measure the acute angle θ between the lines meeting at G. θ = ................................................. [1] (j) Calculate the difference (θ – 2i). (θ – 2i) = ................................................. [1] (k) Repeat steps (c) to (j) using an angle of incidence i = 30°. θ = ...................................................... (θ – 2i) = ................................................. [1] (l) Theory suggests that θ = 2i. State whether your result supports the theory and justify your answer by reference to your results. statement ......................................................................................................................... justification ....................................................................................................................... ......................................................................................................................................[2] Tie your ray trace sheet into this Booklet between pages 8 and 9. [5] [Total: 10]
Mark scheme: 4 Trace: Normal at 90° [1] Correct initial angle of incidence 18°–22° [1] Point E labeled [1] Initial pin separations [ 5 cm [1] All lines neat and thin [1] (i) θ correct to ± 2° [1] (j) Correct calculation of difference [1] (k) new values present and angles in ° (at least once, no contradiction) [1] (l) Correct statement matching results (either exact or within limits of experimental accuracy, or wtte) [1] Justified referring to specified results [1] [Total: 10] Please note that due to a labelling error on the paper, the final five marks were not considered when deciding the grade thresholds.
What was in this paper
The subtopics covered by these 4 questions, and how many questions each got. Open one in a new tab to see every Cambridge question on it.
What you needed in this session
Cambridge’s own grade thresholds for 2010 Oct/Nov, Paper 5 · Variant 1. A higher threshold means an easier paper — the bar moves with how the cohort did.