Cambridge IGCSE Physics 0625 — 2009 Oct/Nov Paper 5 · Variant 1
0625/51/O/N/09 · 4 questions · 40 marks · ≈45 min
The question paper and its mark scheme, free to read here and free to download. This is Cambridge’s own paper, exactly as it was sat.
Question paper12 pages
Mark scheme3 pages
Answers below. Sit the paper first if you are practising.
Questions as text
Q1 · In this experiment, you are to investigate the period of oscillation of a simple pendulum
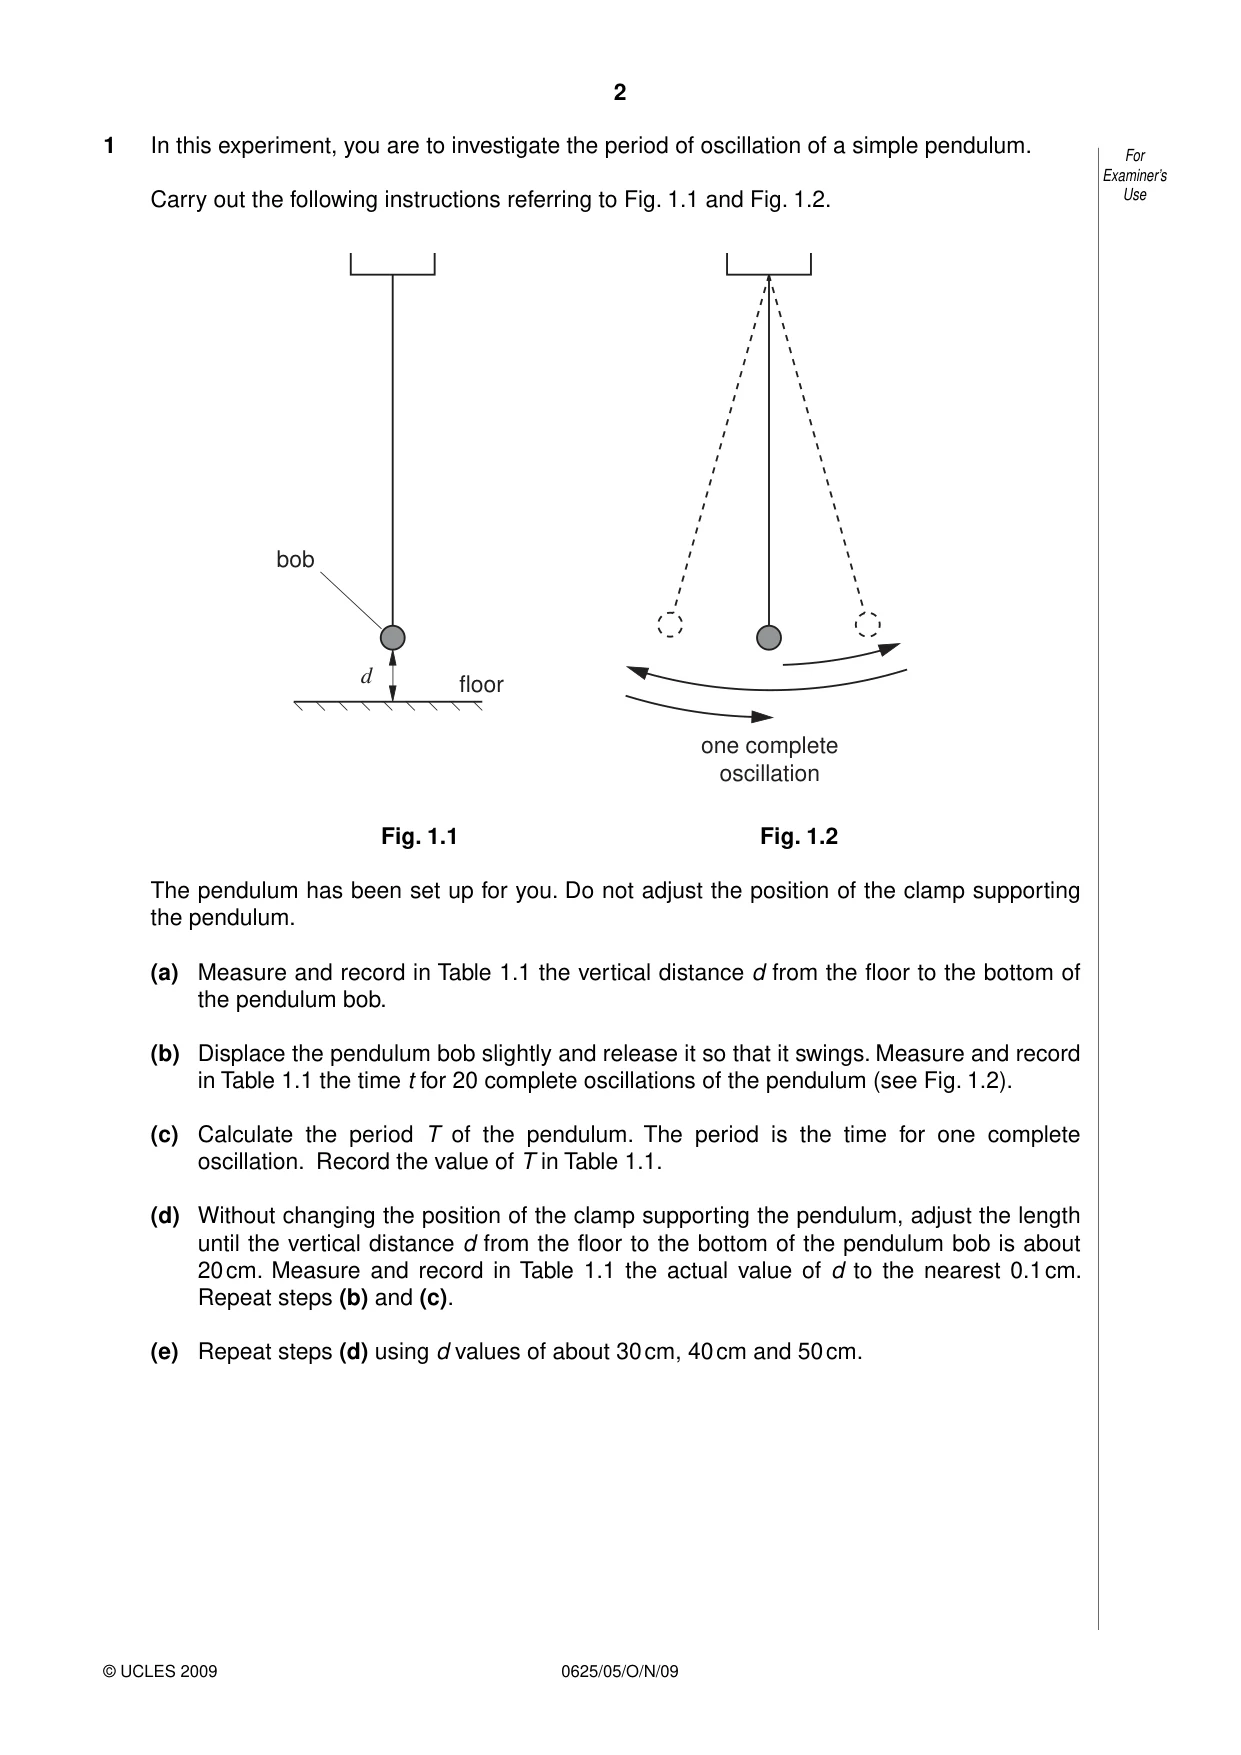
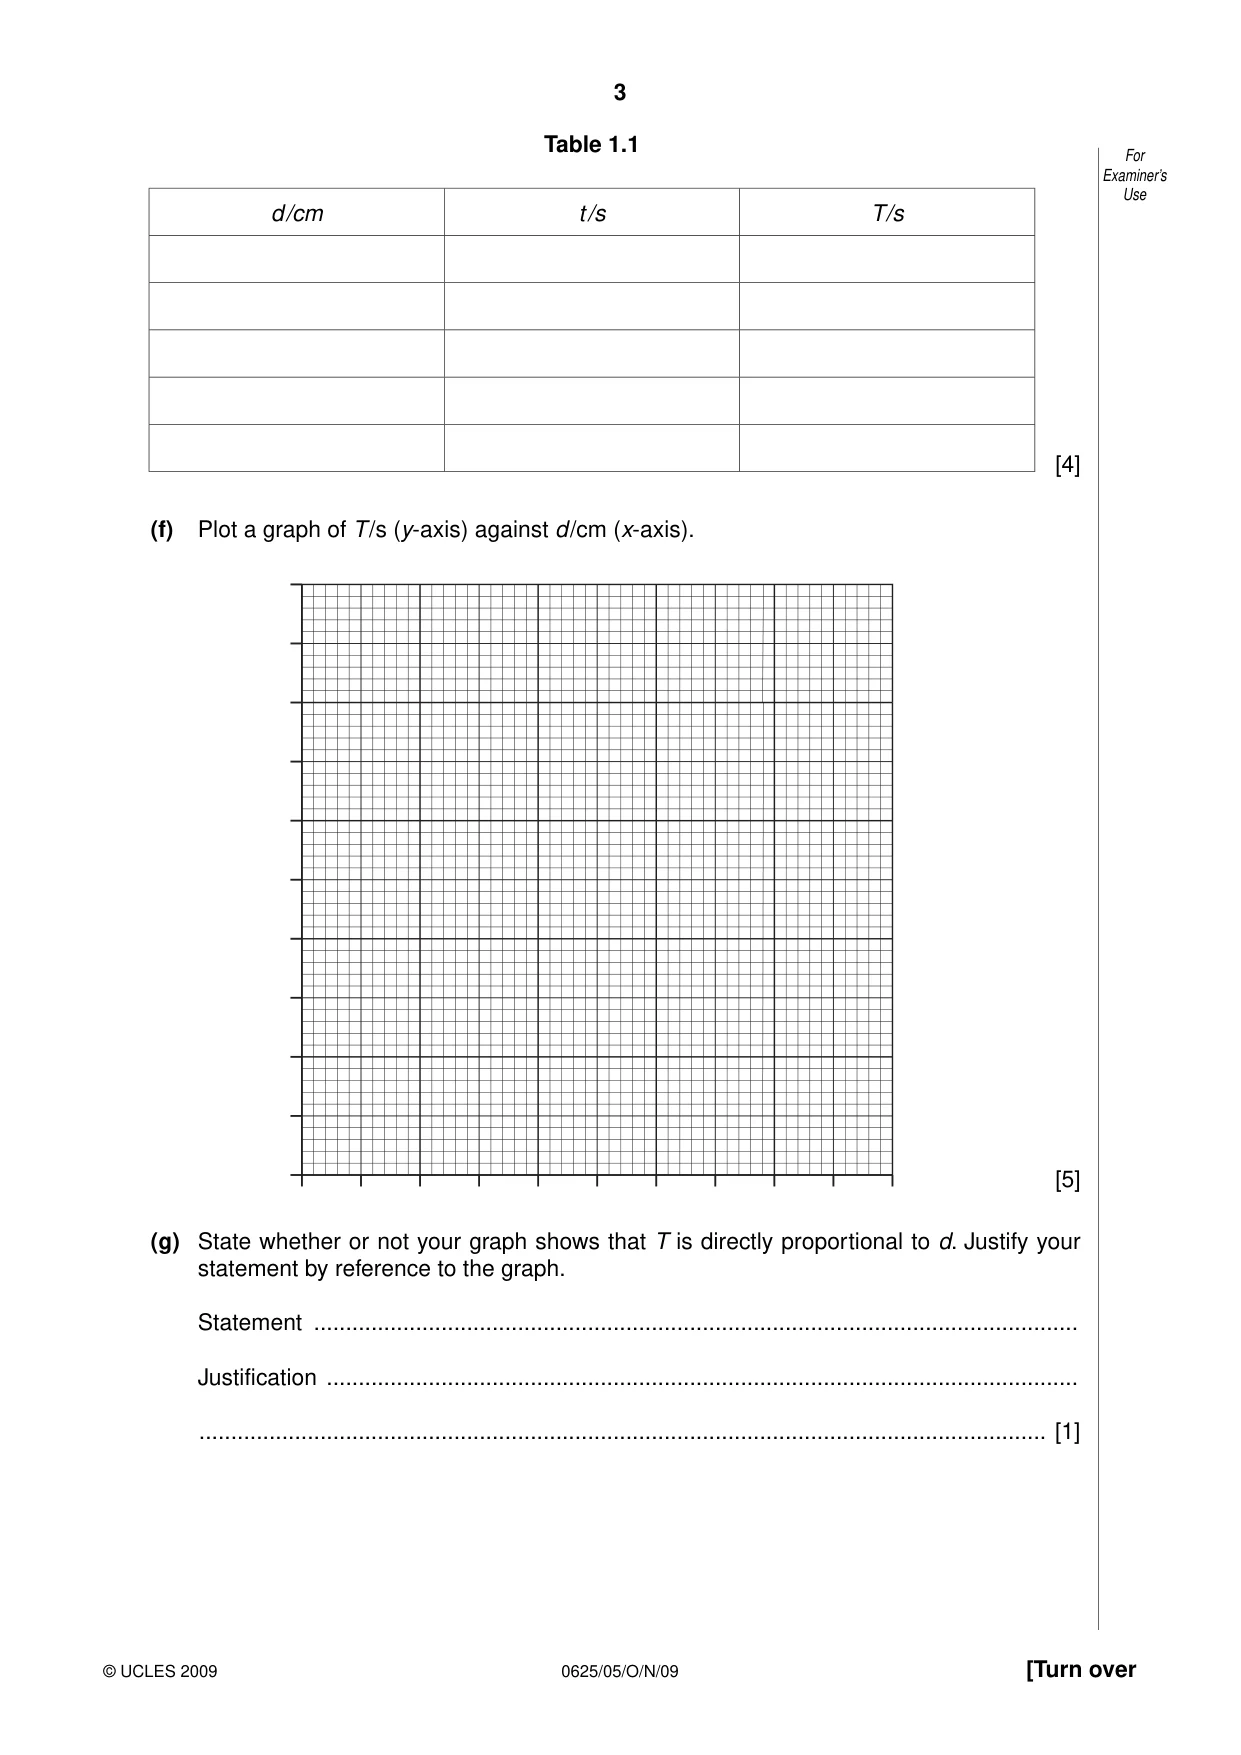
1 In this experiment, you are to investigate the period of oscillation of a simple pendulum. For Examiner’s Carry out the following instructions referring to Fig. 1.1 and Fig. 1.2. Use bob d floor one complete oscillation Fig. 1.1 Fig. 1.2 The pendulum has been set up for you. Do not adjust the position of the clamp supporting the pendulum. (a) Measure and record in Table 1.1 the vertical distance d from the floor to the bottom of the pendulum bob. (b) Displace the pendulum bob slightly and release it so that it swings. Measure and record in Table 1.1 the time t for 20 complete oscillations of the pendulum (see Fig. 1.2). (c) Calculate the period T of the pendulum. The period is the time for one complete oscillation. Record the value of T in Table 1.1. (d) Without changing the position of the clamp supporting the pendulum, adjust the length until the vertical distance d from the floor to the bottom of the pendulum bob is about 20 cm. Measure and record in Table 1.1 the actual value of d to the nearest 0.1 cm. Repeat steps (b) and (c). (e) Repeat steps (d) using d values of about 30 cm, 40 cm and 50 cm. Table 1.1 For Examiner’s Use d/cm t/s T/s [4] (f) Plot a graph of T/s (y-axis) against d/cm (x-axis). [5] (g) State whether or not your graph shows that T is directly proportional to d. Justify your statement by reference to the graph. Statement ........................................................................................................................ Justification ...................................................................................................................... ..................................................................................................................................... [1]
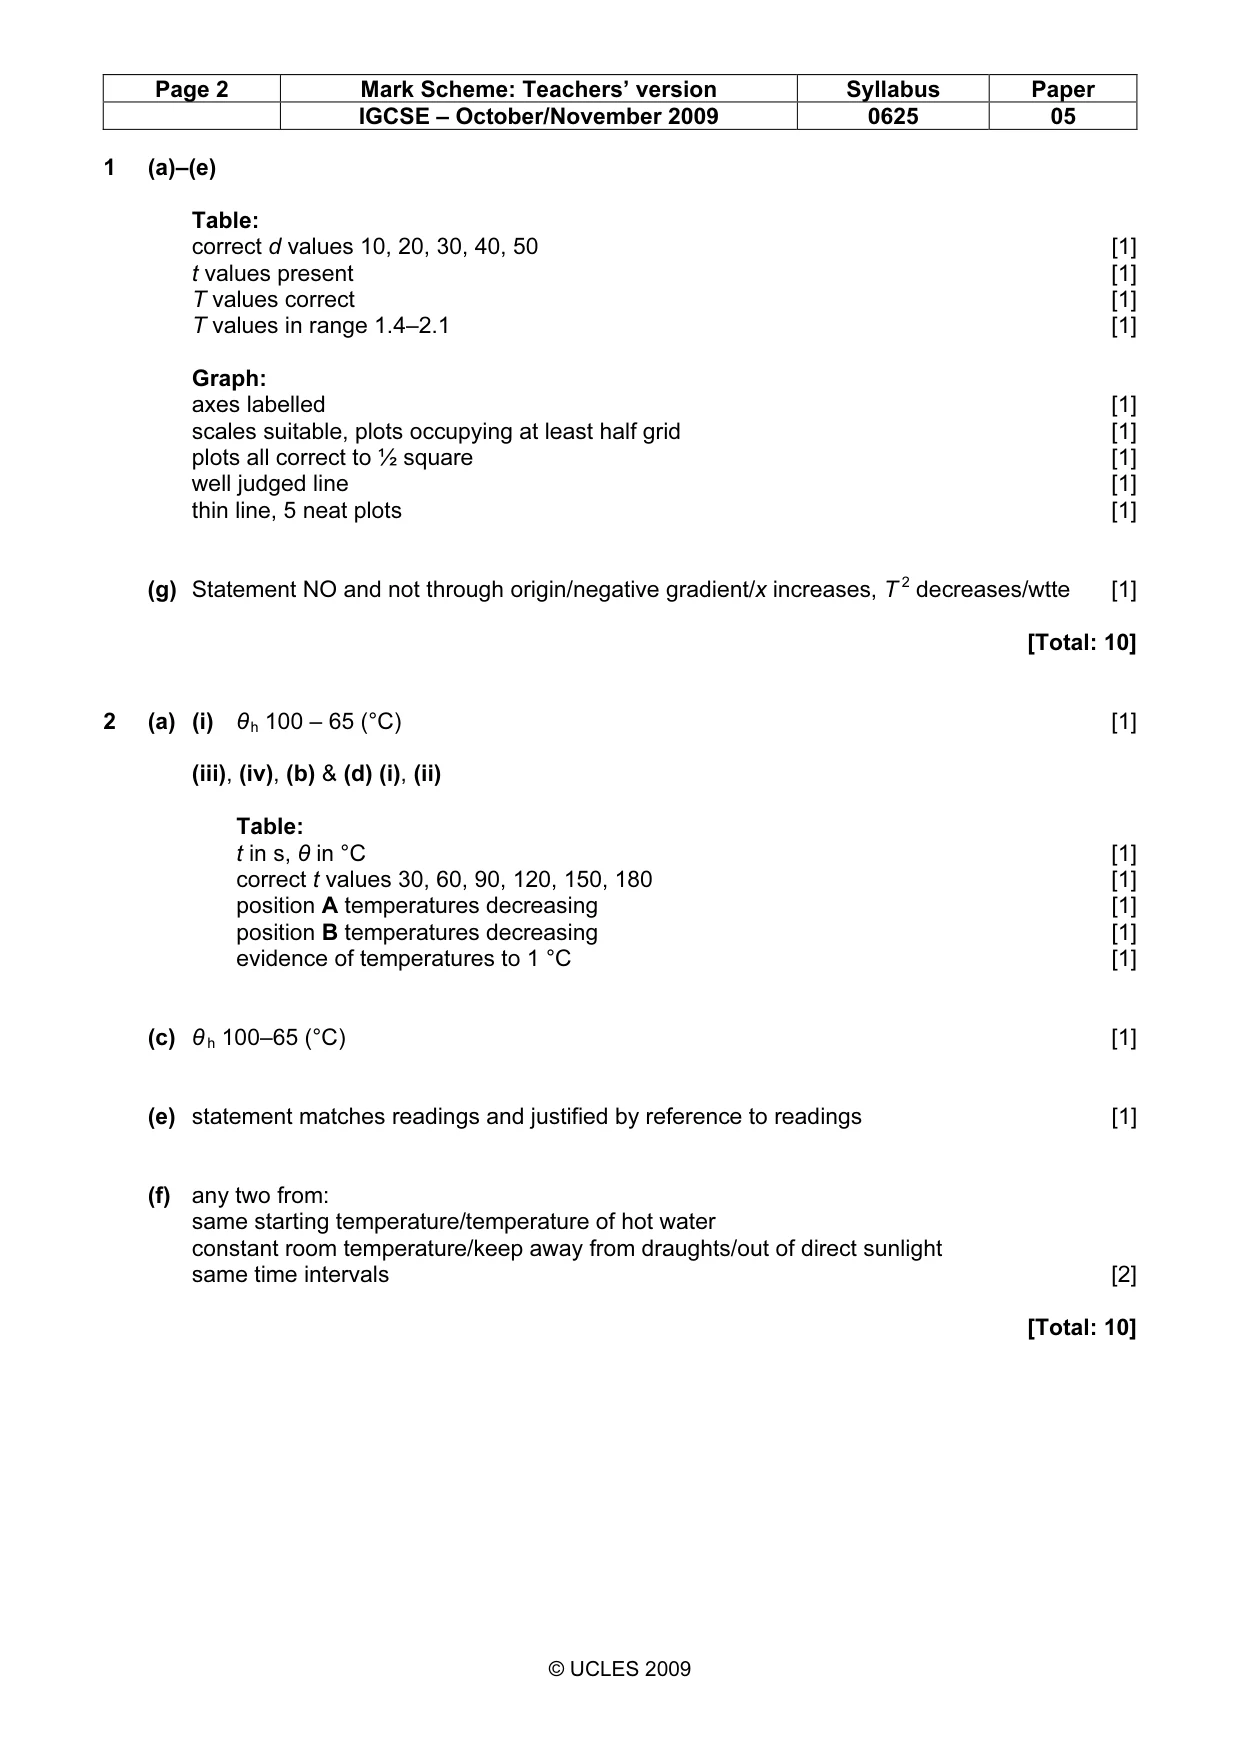
Mark scheme: 1 (a)–(e) Table: correct d values 10, 20, 30, 40, 50 [1] t values present [1] T values correct [1] T values in range 1.4–2.1 [1] Graph: axes labelled [1] scales suitable, plots occupying at least half grid [1] plots all correct to ½ square [1] well judged line [1] thin line, 5 neat plots [1] (g) Statement NO and not through origin/negative gradient/x increases, T 2 decreases/wtte [1] [Total: 10]
More questions on Physical quantities and measurement techniques
Q2 · In this experiment you will investigate the cooling of thermometer bulbs under different…
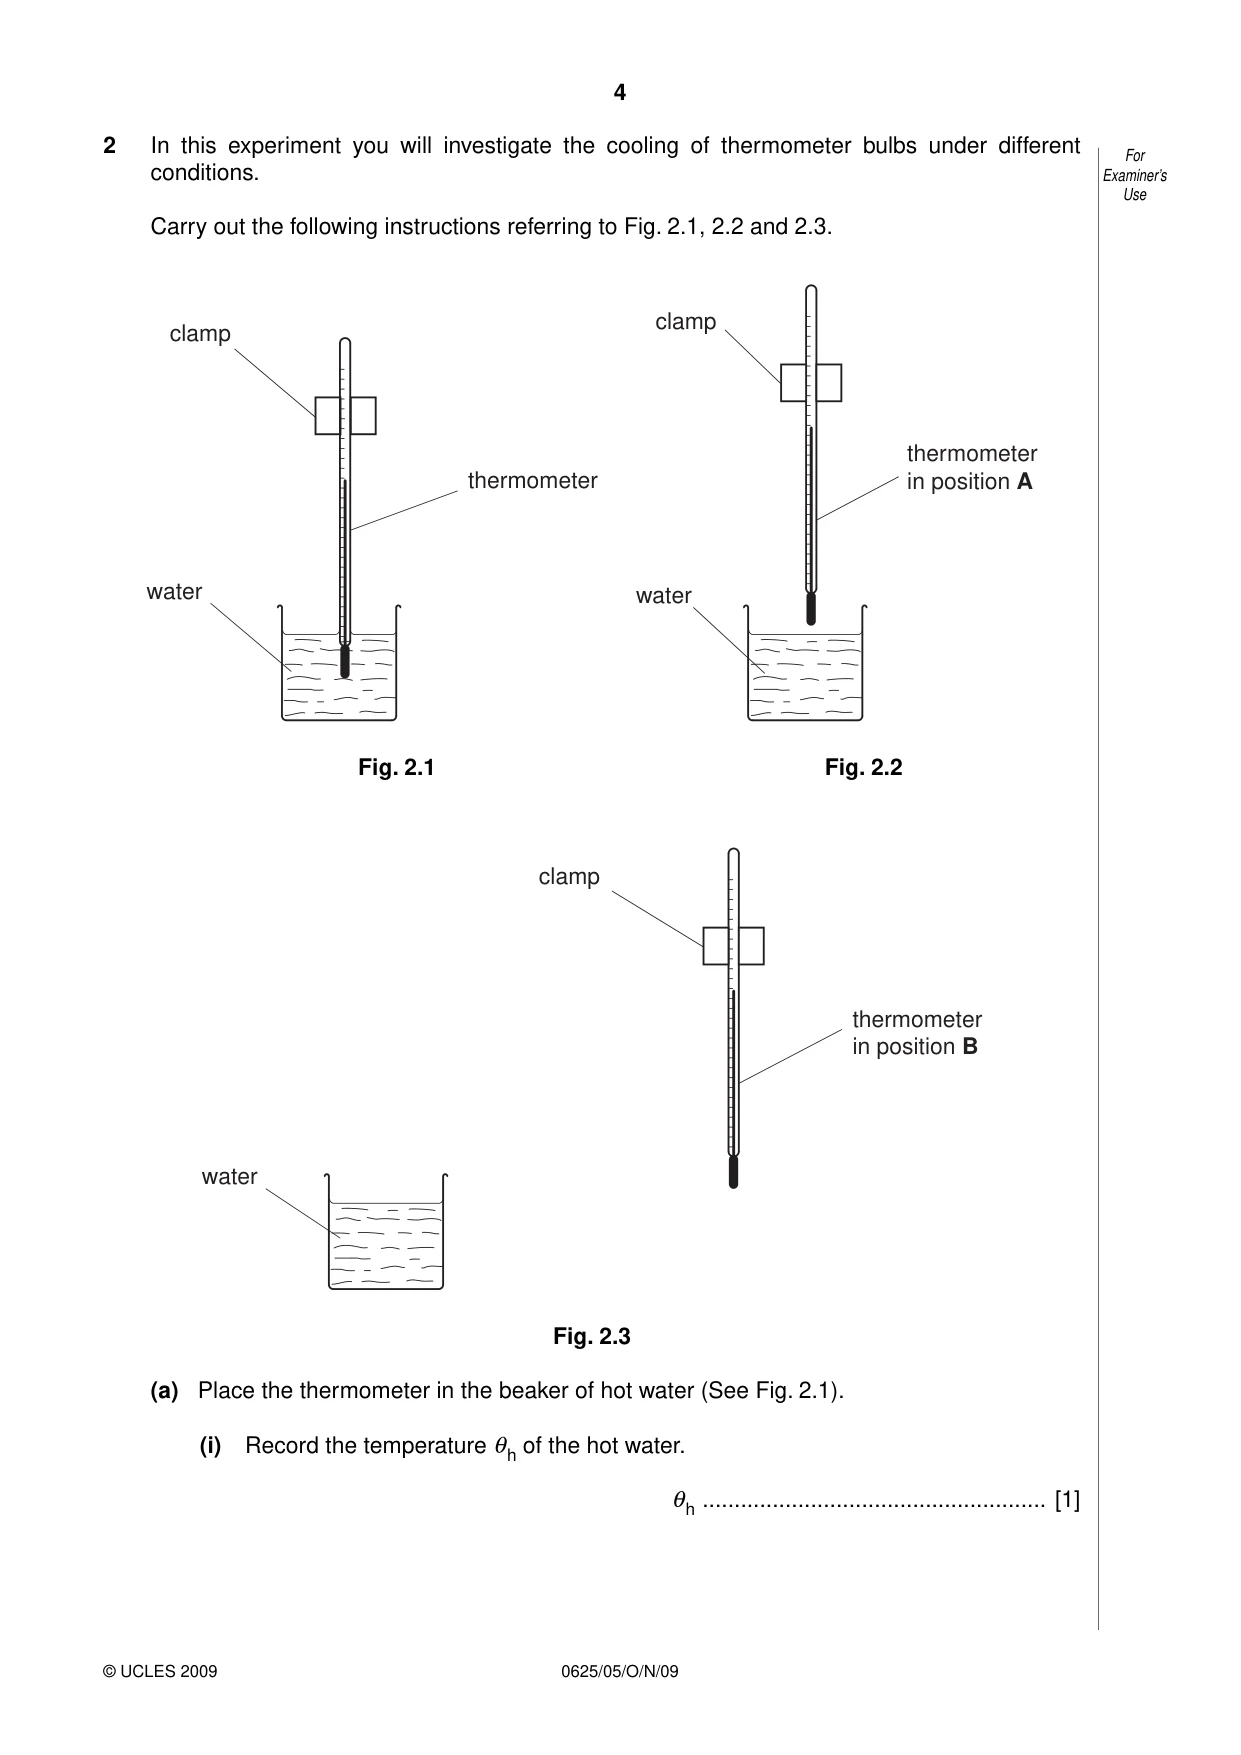
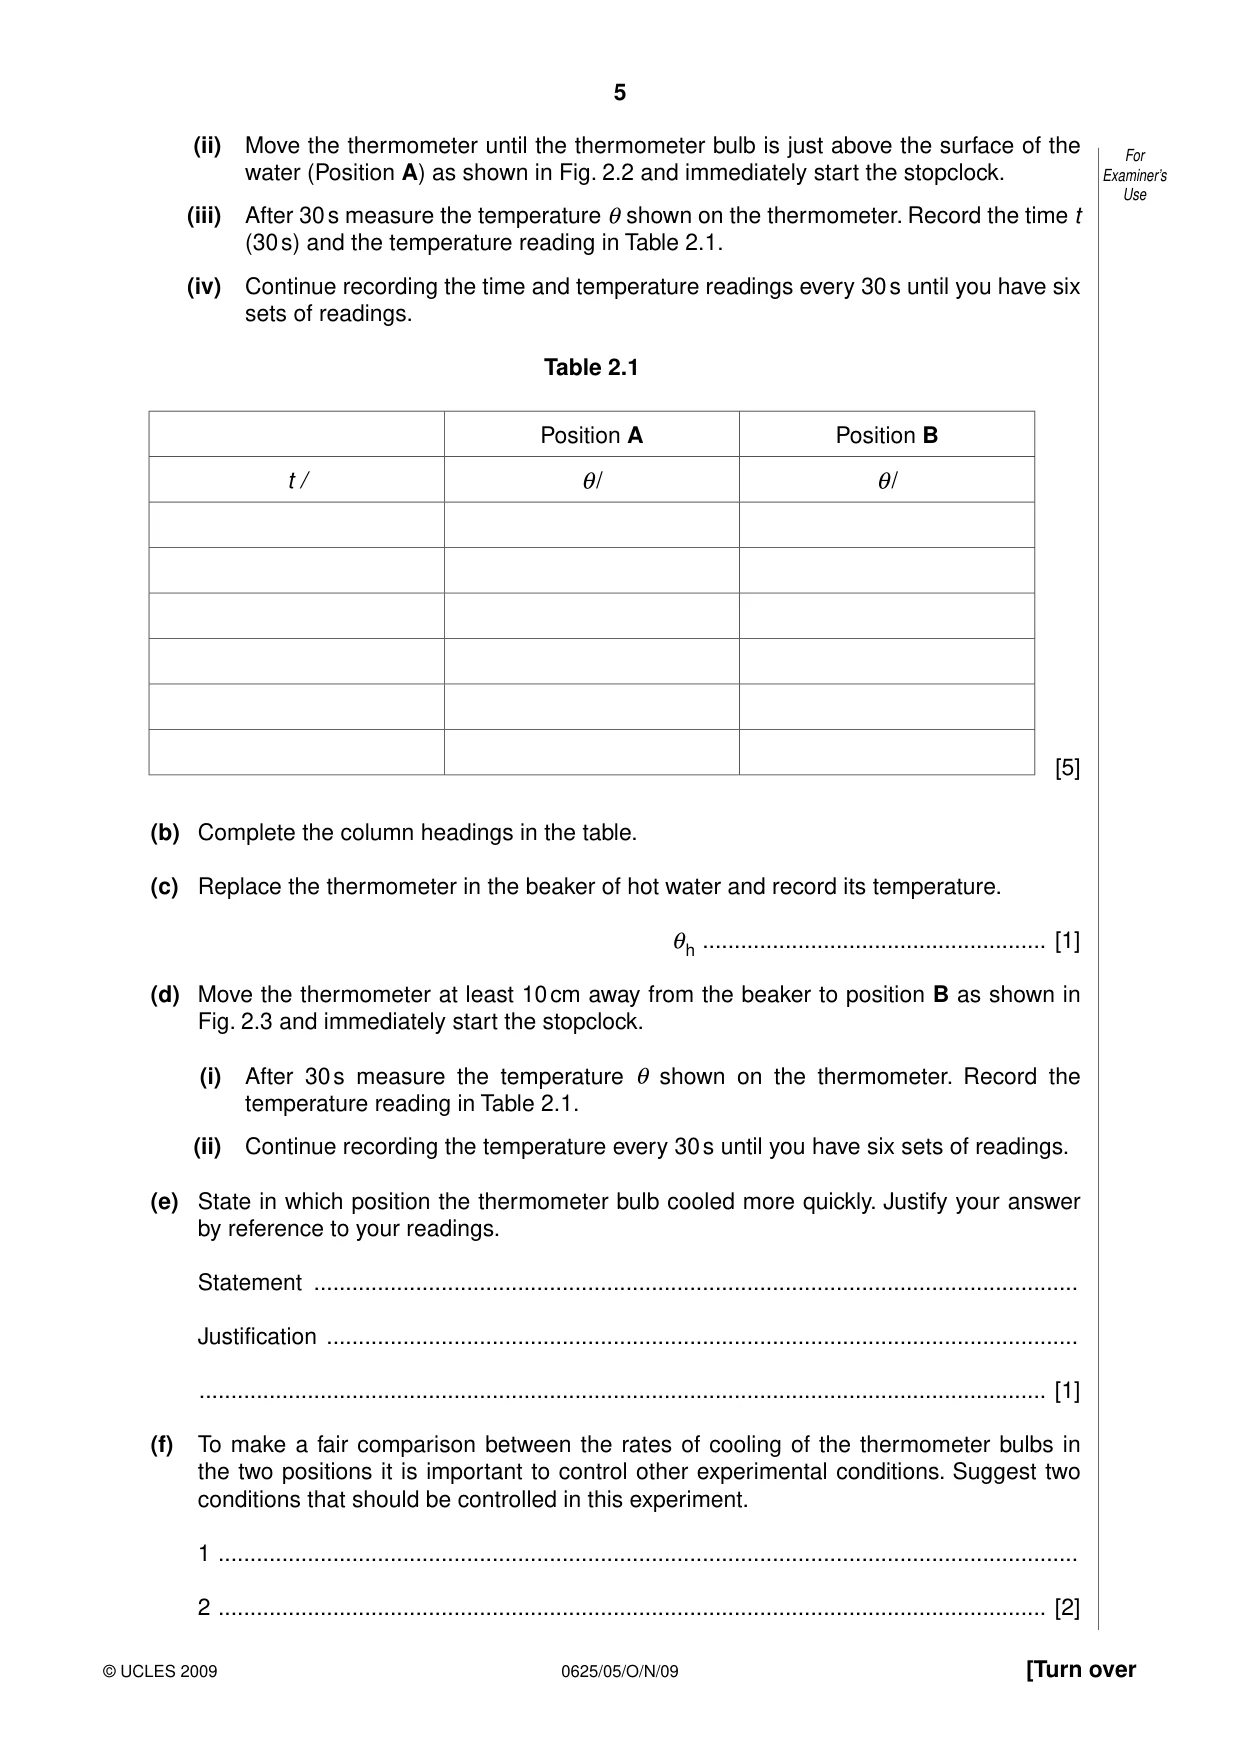
2 In this experiment you will investigate the cooling of thermometer bulbs under different For conditions. Examiner’s Use Carry out the following instructions referring to Fig. 2.1, 2.2 and 2.3. clamp clamp thermometer thermometer in position A water water Fig. 2.1 Fig. 2.2 clamp thermometer in position B water Fig. 2.3 (a) Place the thermometer in the beaker of hot water (See Fig. 2.1). (i) Record the temperature θh of the hot water. θh ...................................................... [1] (ii) Move the thermometer until the thermometer bulb is just above the surface of the For water (Position A) as shown in Fig. 2.2 and immediately start the stopclock. Examiner’s Use (iii) After 30 s measure the temperature θ shown on the thermometer. Record the time t (30 s) and the temperature reading in Table 2.1. (iv) Continue recording the time and temperature readings every 30 s until you have six sets of readings. Table 2.1 Position A Position B t / θ/ θ/ [5] (b) Complete the column headings in the table. (c) Replace the thermometer in the beaker of hot water and record its temperature. θh ...................................................... [1] (d) Move the thermometer at least 10 cm away from the beaker to position B as shown in Fig. 2.3 and immediately start the stopclock. (i) After 30 s measure the temperature θ shown on the thermometer. Record the temperature reading in Table 2.1. (ii) Continue recording the temperature every 30 s until you have six sets of readings. (e) State in which position the thermometer bulb cooled more quickly. Justify your answer by reference to your readings. Statement ........................................................................................................................ Justification ...................................................................................................................... ..................................................................................................................................... [1] (f) To make a fair comparison between the rates of cooling of the thermometer bulbs in the two positions it is important to control other experimental conditions. Suggest two conditions that should be controlled in this experiment. 1 ....................................................................................................................................... 2 .................................................................................................................................. [2]
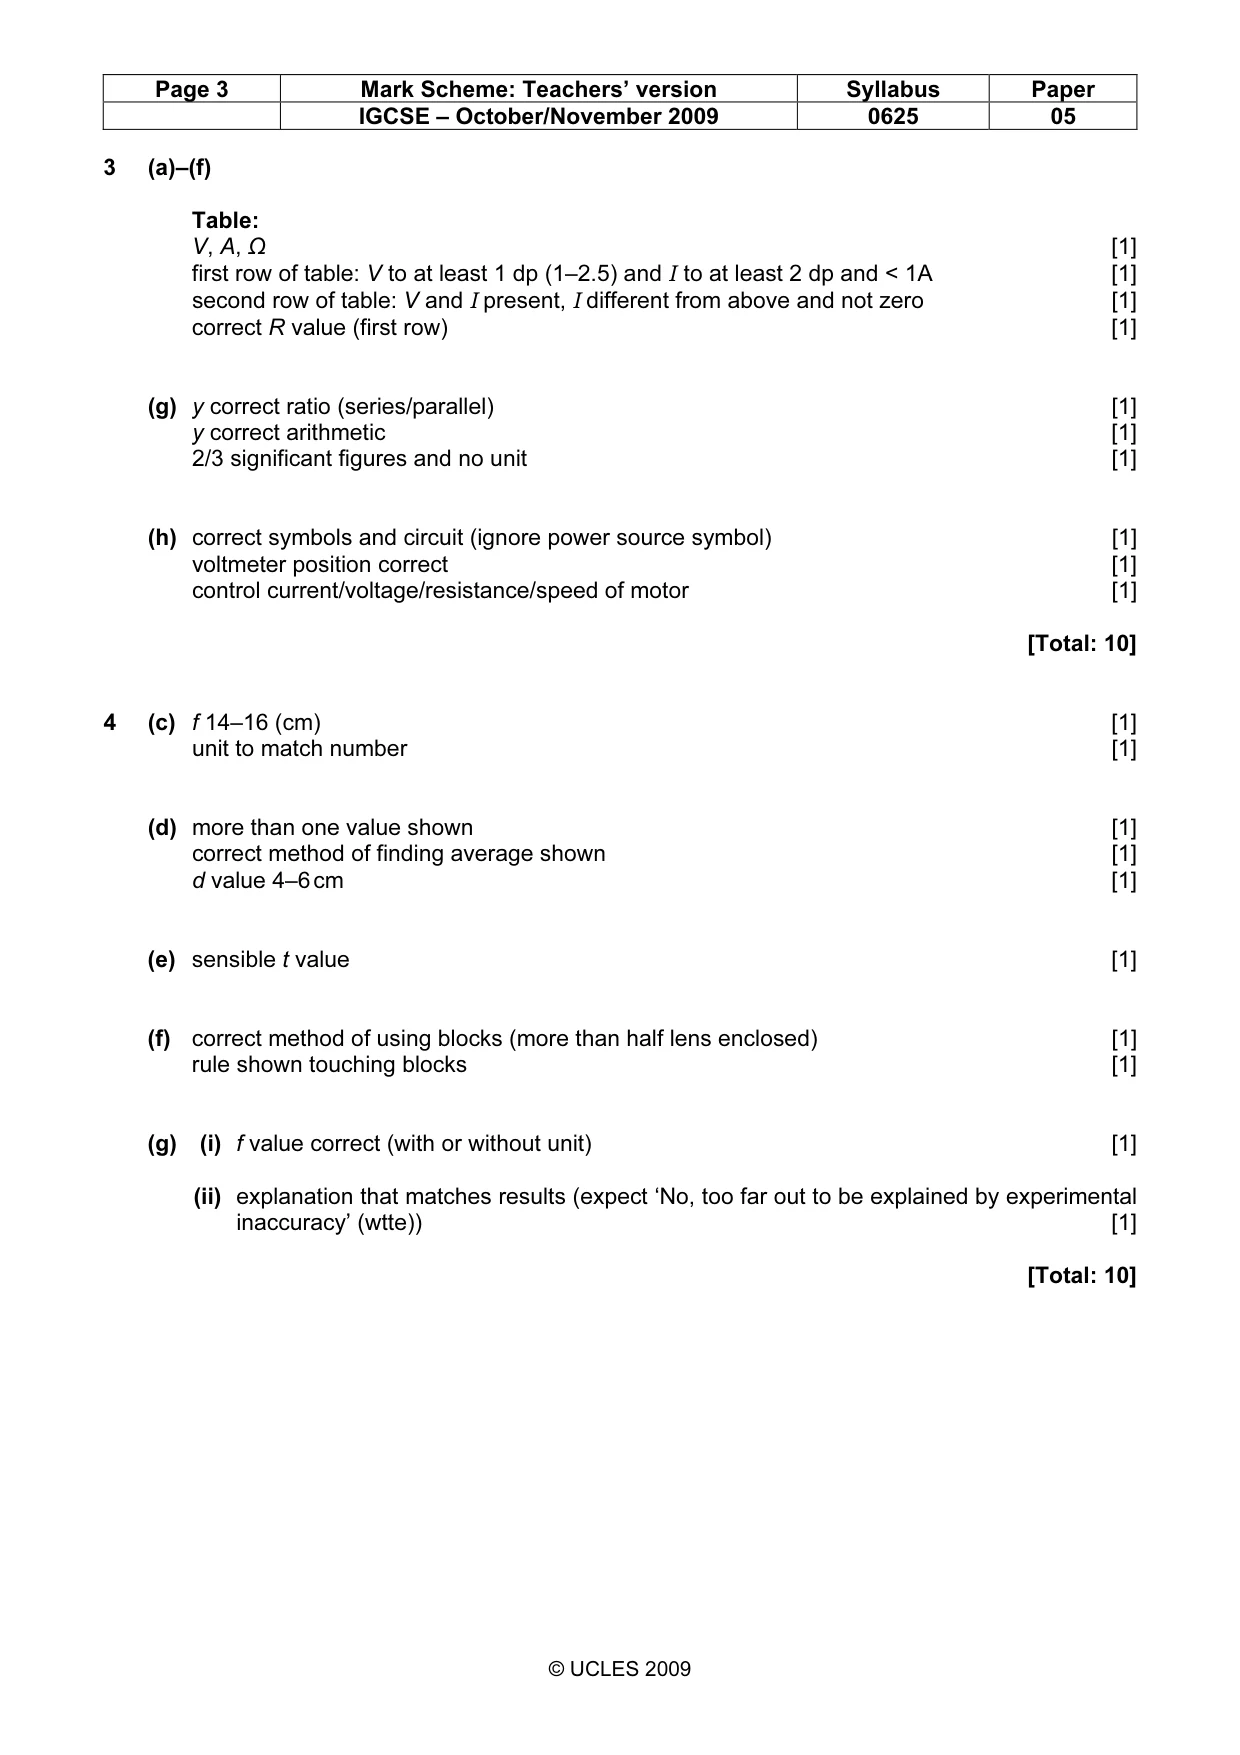
Mark scheme: 2 (a) (i) θ h 100 – 65 (°C) [1] (iii), (iv), (b) & (d) (i), (ii) Table: t in s, θ in °C [1] correct t values 30, 60, 90, 120, 150, 180 [1] position A temperatures decreasing [1] position B temperatures decreasing [1] evidence of temperatures to 1 °C [1] (c) θ h 100–65 (°C) [1] (e) statement matches readings and justified by reference to readings [1] (f) any two from: same starting temperature/temperature of hot water constant room temperature/keep away from draughts/out of direct sunlight same time intervals [2] [Total: 10] IGCSE – October/November 2009 0625 05
Q3 · In this experiment, you are to compare the combined resistance of lamps arranged in…
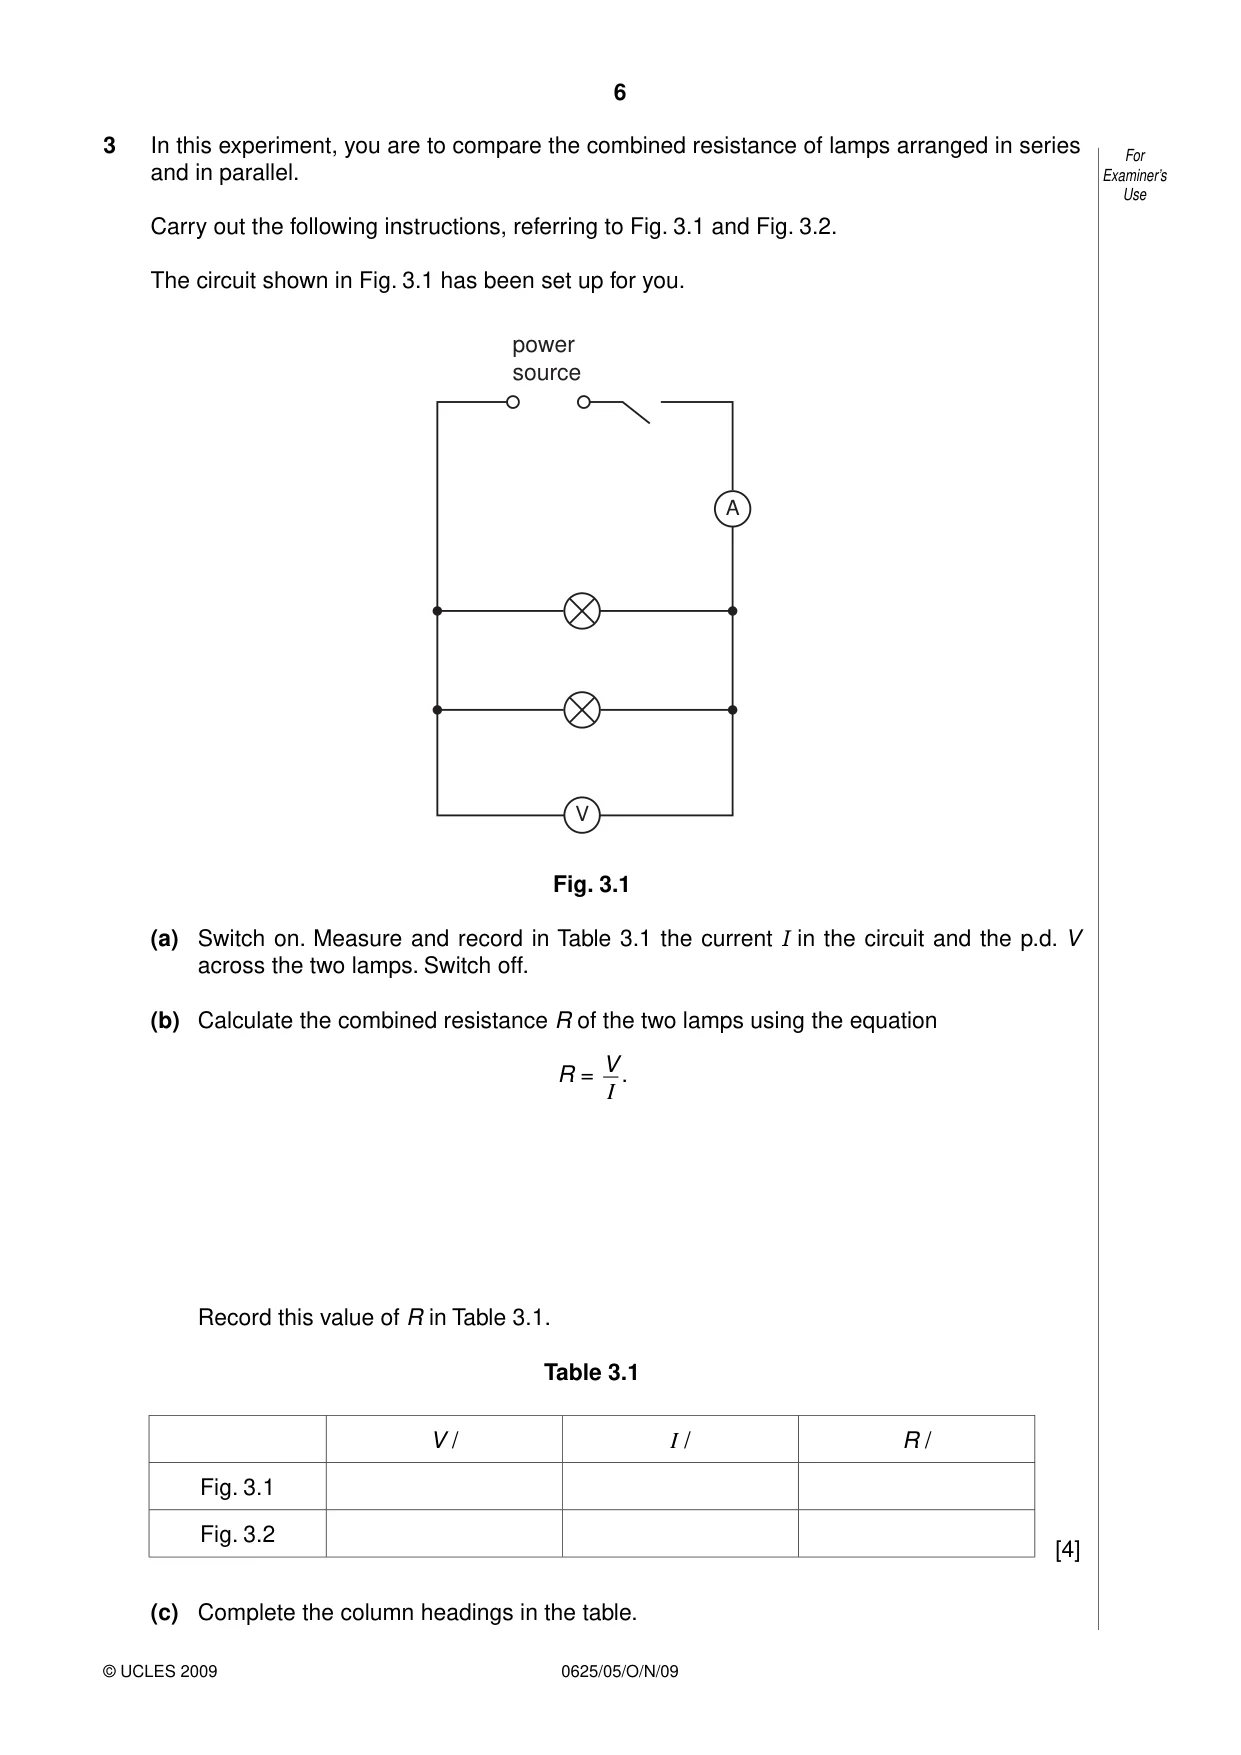
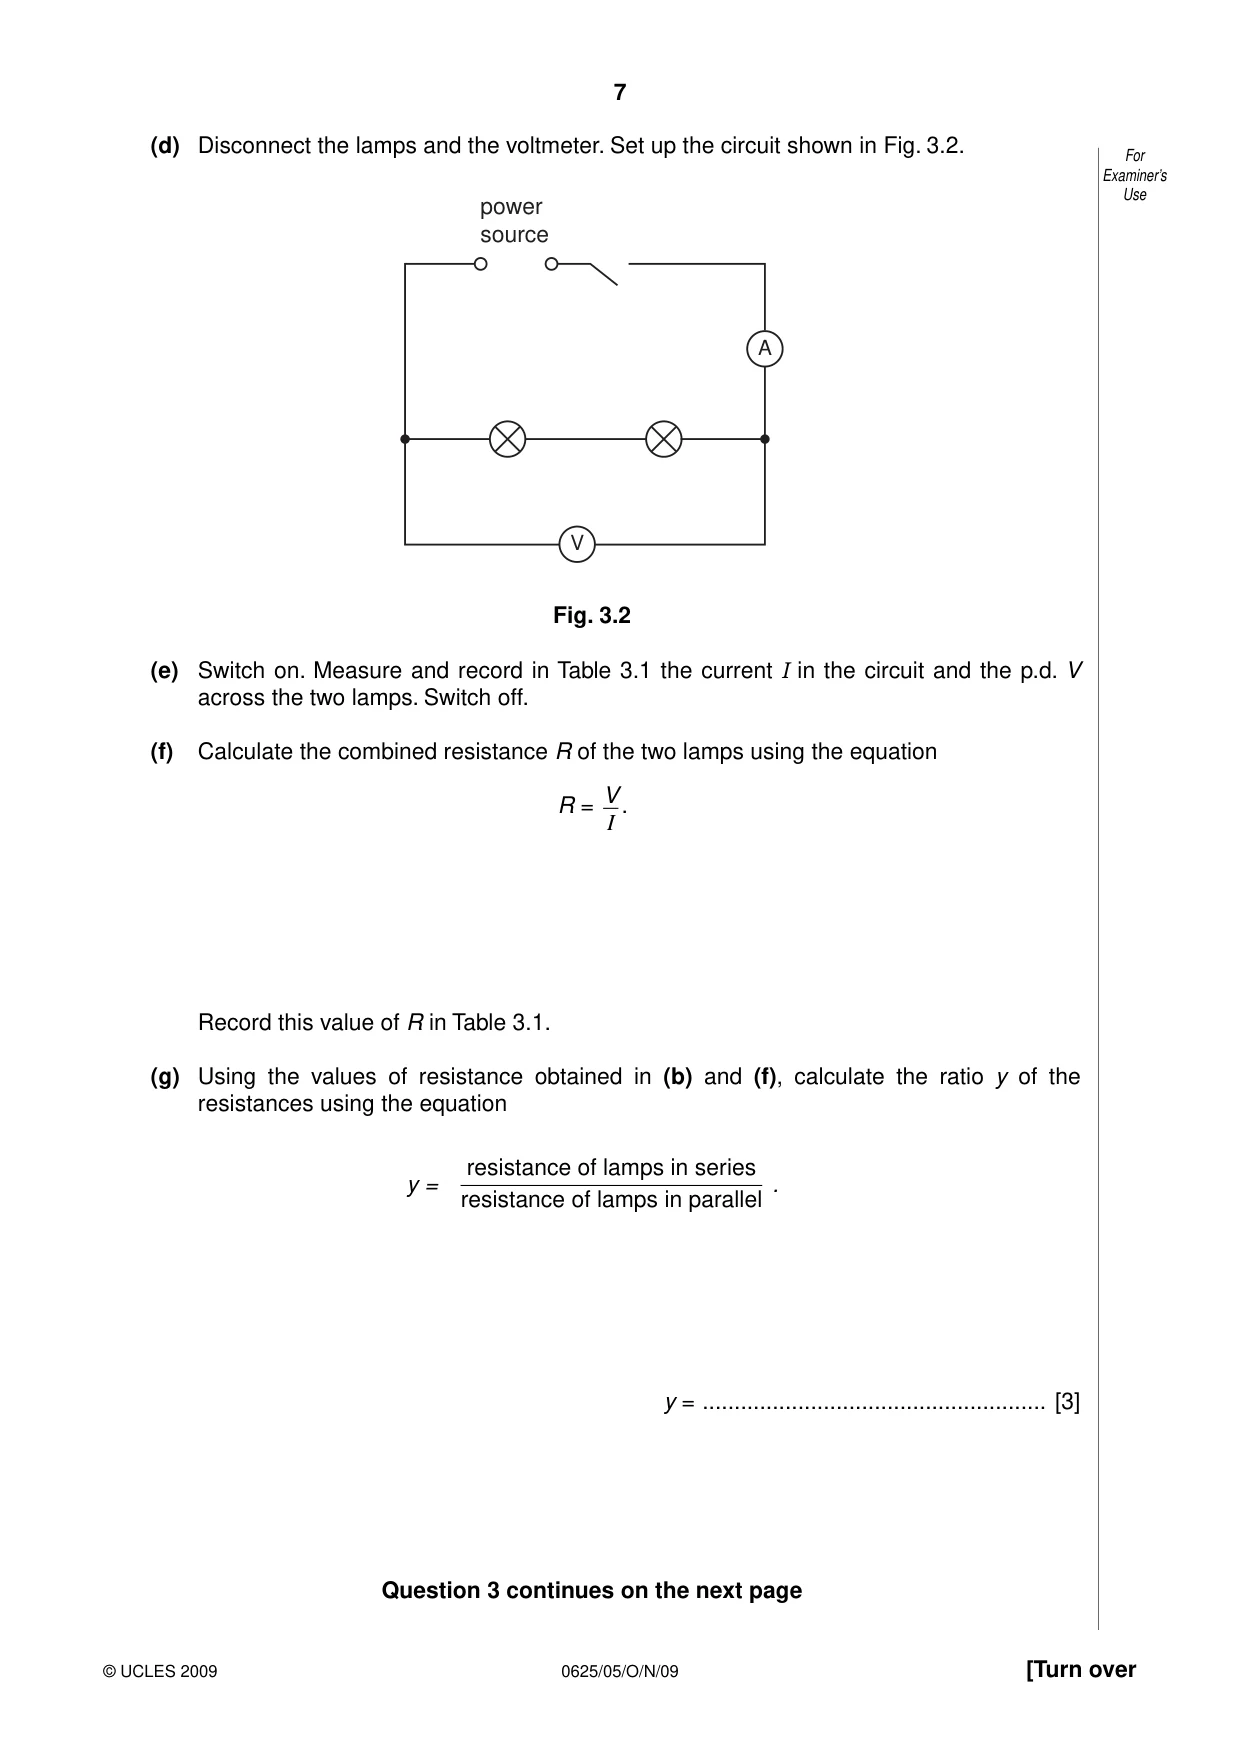
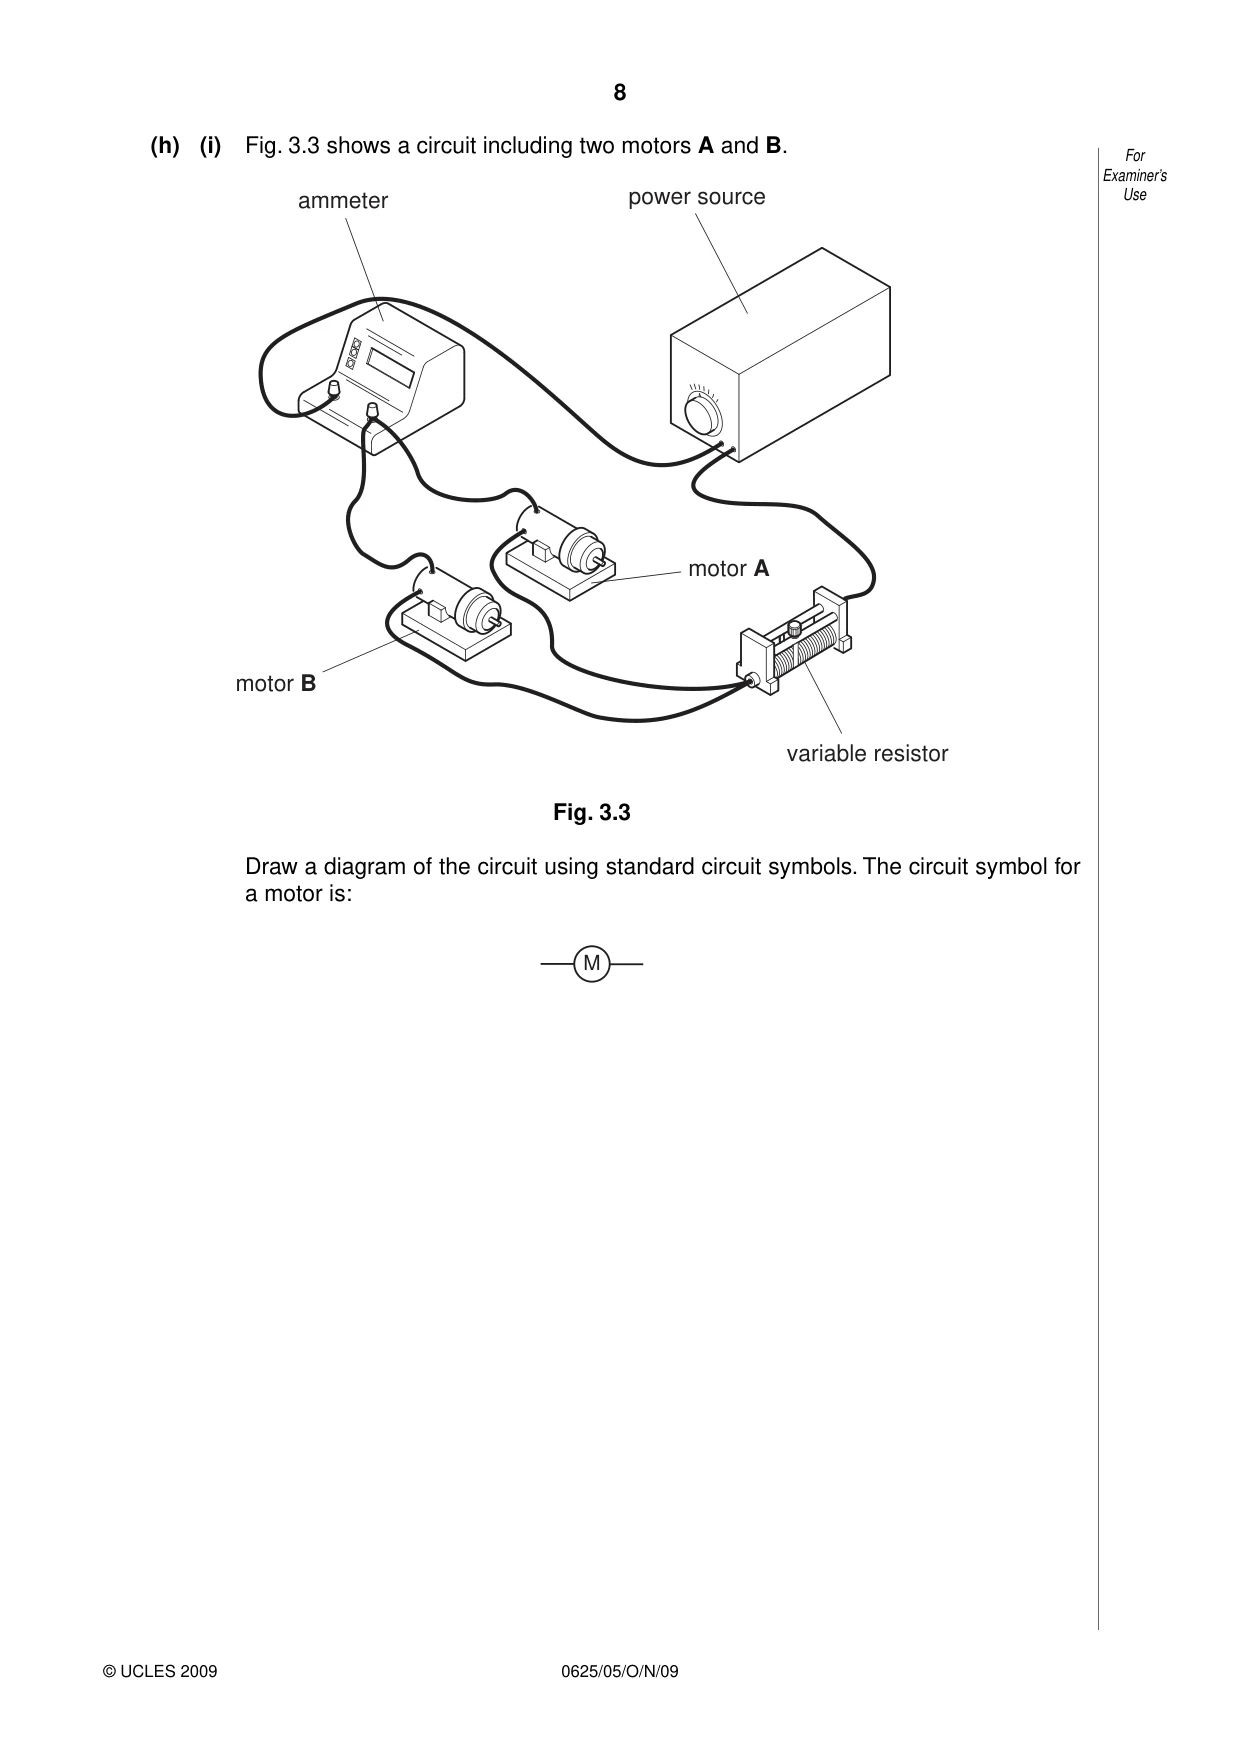
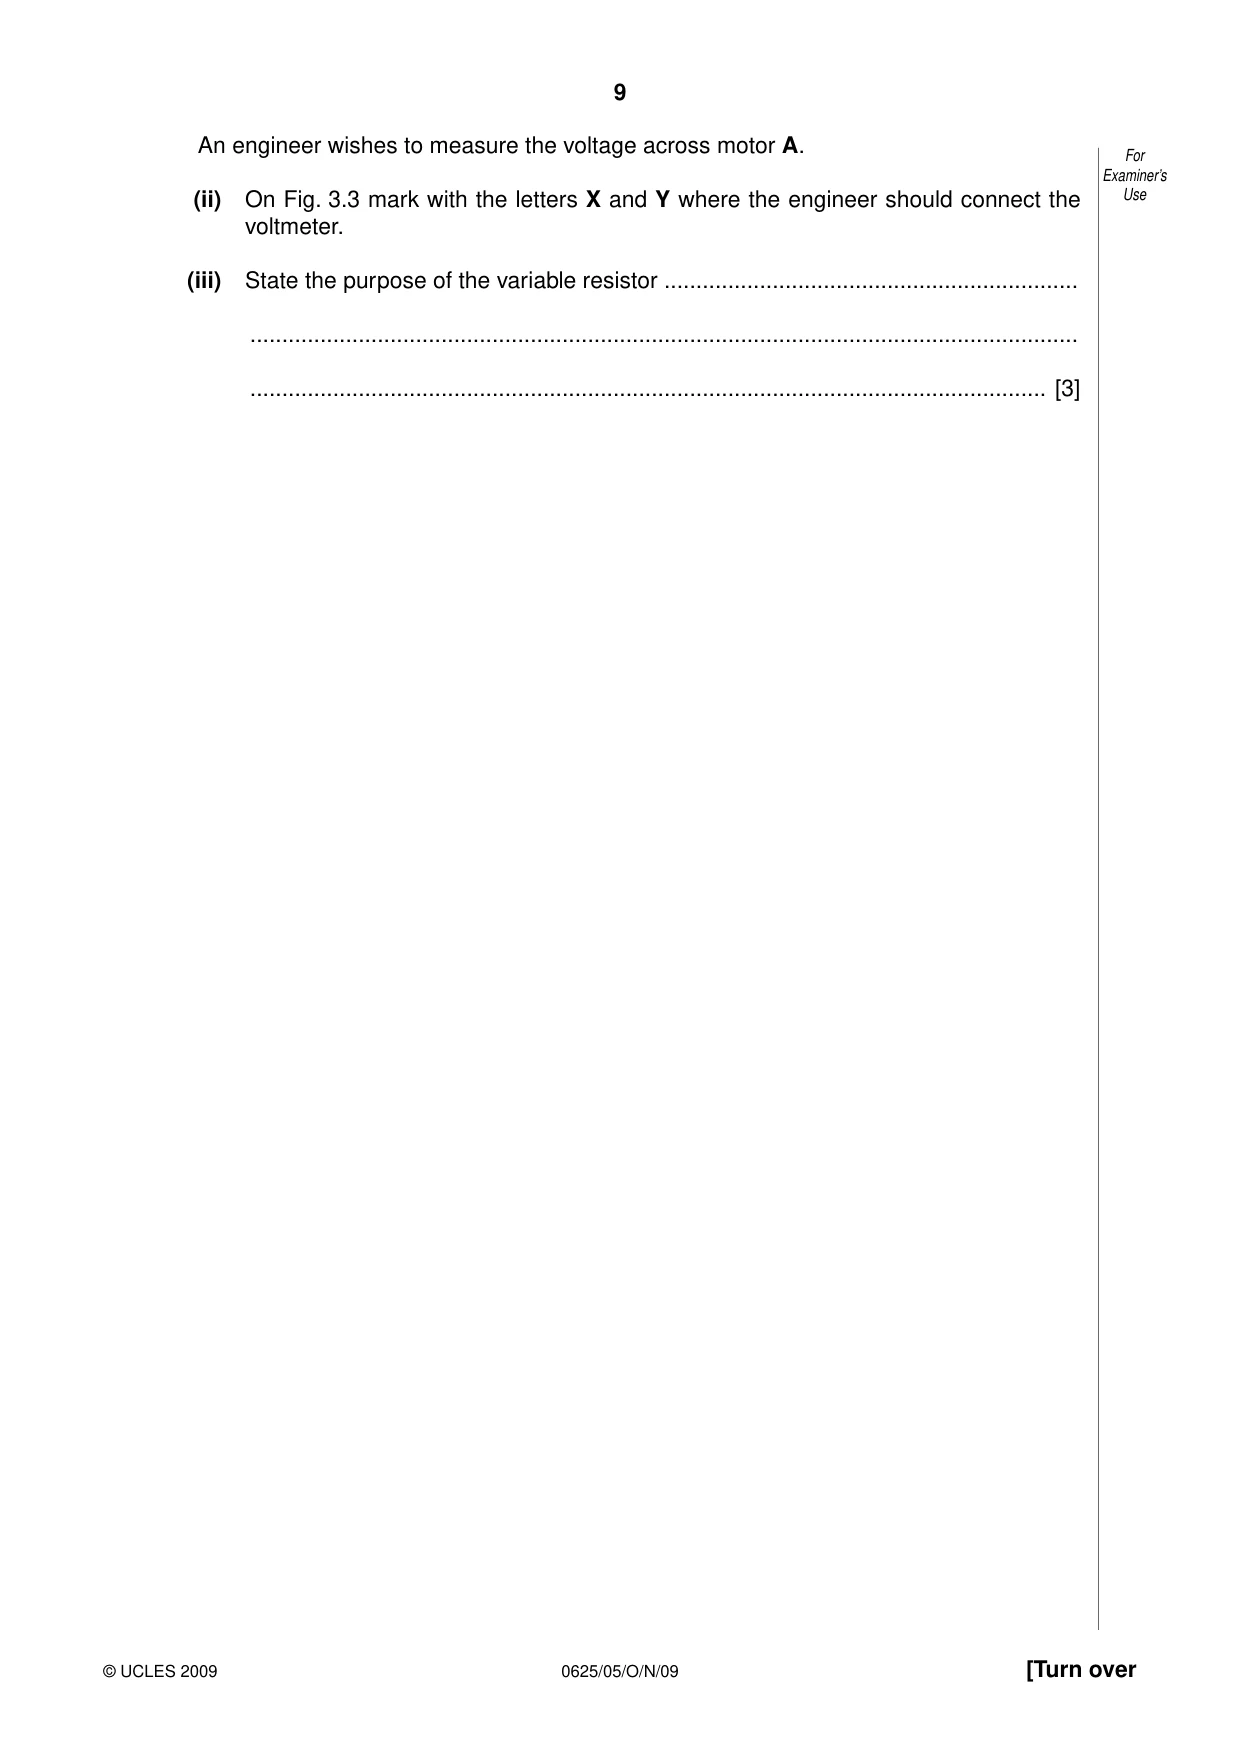
3 In this experiment, you are to compare the combined resistance of lamps arranged in series For and in parallel. Examiner’s Use Carry out the following instructions, referring to Fig. 3.1 and Fig. 3.2. The circuit shown in Fig. 3.1 has been set up for you. power source A V Fig. 3.1 (a) Switch on. Measure and record in Table 3.1 the current I in the circuit and the p.d. V across the two lamps. Switch off. (b) Calculate the combined resistance R of the two lamps using the equation V R = . I Record this value of R in Table 3.1. Table 3.1 V / I / R / Fig. 3.1 Fig. 3.2 [4] (c) Complete the column headings in the table. (d) Disconnect the lamps and the voltmeter. Set up the circuit shown in Fig. 3.2. For Examiner’s Use power source A V Fig. 3.2 (e) Switch on. Measure and record in Table 3.1 the current I in the circuit and the p.d. V across the two lamps. Switch off. (f) Calculate the combined resistance R of the two lamps using the equation V R = . I Record this value of R in Table 3.1. (g) Using the values of resistance obtained in (b) and (f), calculate the ratio y of the resistances using the equation resistance of lamps in series y = . resistance of lamps in parallel y = ...................................................... [3] Question 3 continues on the next page (h) (i) Fig. 3.3 shows a circuit including two motors A and B. For Examiner’s ammeter power source Use motor A motor B variable resistor Fig. 3.3 Draw a diagram of the circuit using standard circuit symbols. The circuit symbol for a motor is: M An engineer wishes to measure the voltage across motor A. For Examiner’s (ii) On Fig. 3.3 mark with the letters X and Y where the engineer should connect the Use voltmeter. (iii) State the purpose of the variable resistor ................................................................. .................................................................................................................................. ............................................................................................................................. [3]
Mark scheme: 3 (a)–(f) Table: V, A, Ω [1] first row of table: V to at least 1 dp (1–2.5) and I to at least 2 dp and < 1A [1] second row of table: V and I present, I different from above and not zero [1] correct R value (first row) [1] (g) y correct ratio (series/parallel) [1] y correct arithmetic [1] 2/3 significant figures and no unit [1] (h) correct symbols and circuit (ignore power source symbol) [1] voltmeter position correct [1] control current/voltage/resistance/speed of motor [1] [Total: 10]
Q4 · In this experiment you will determine the focal length of a converging lens by two…
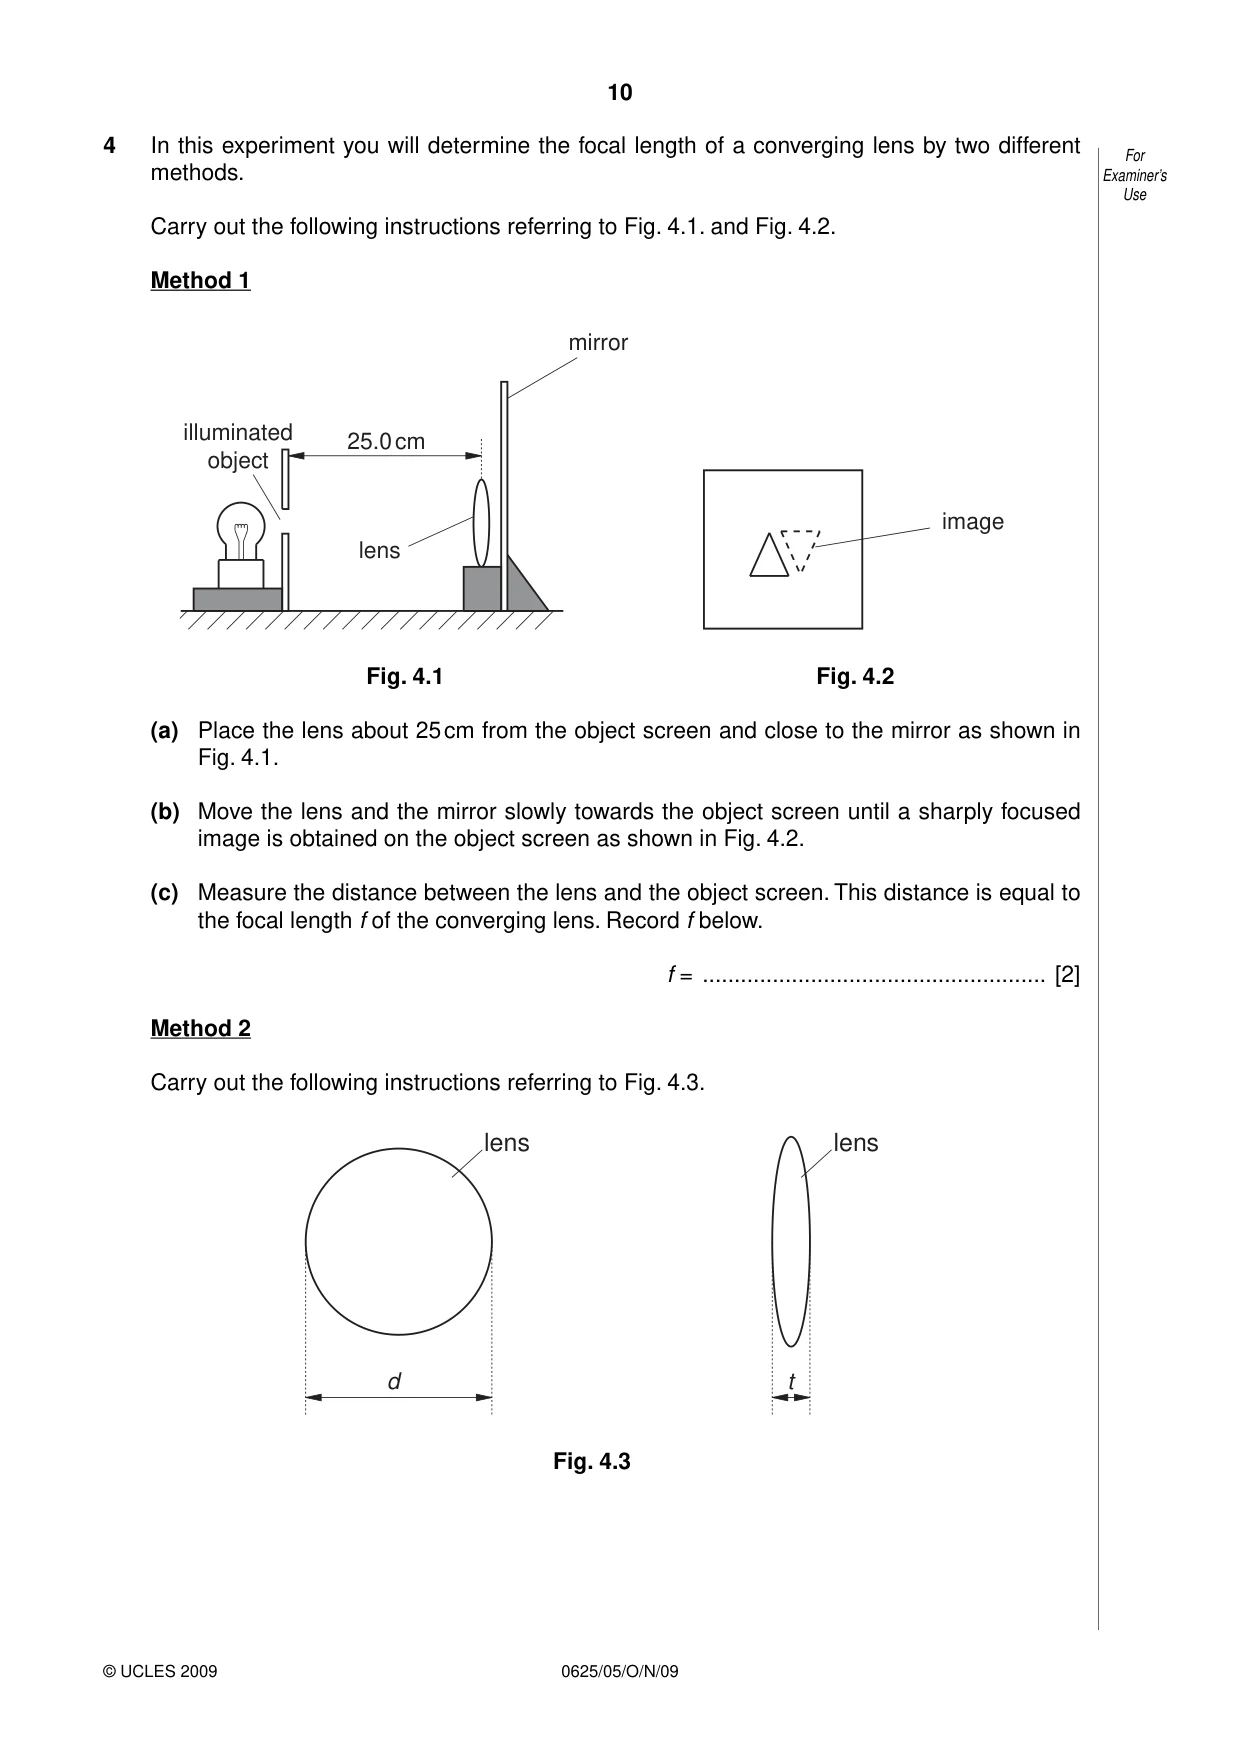
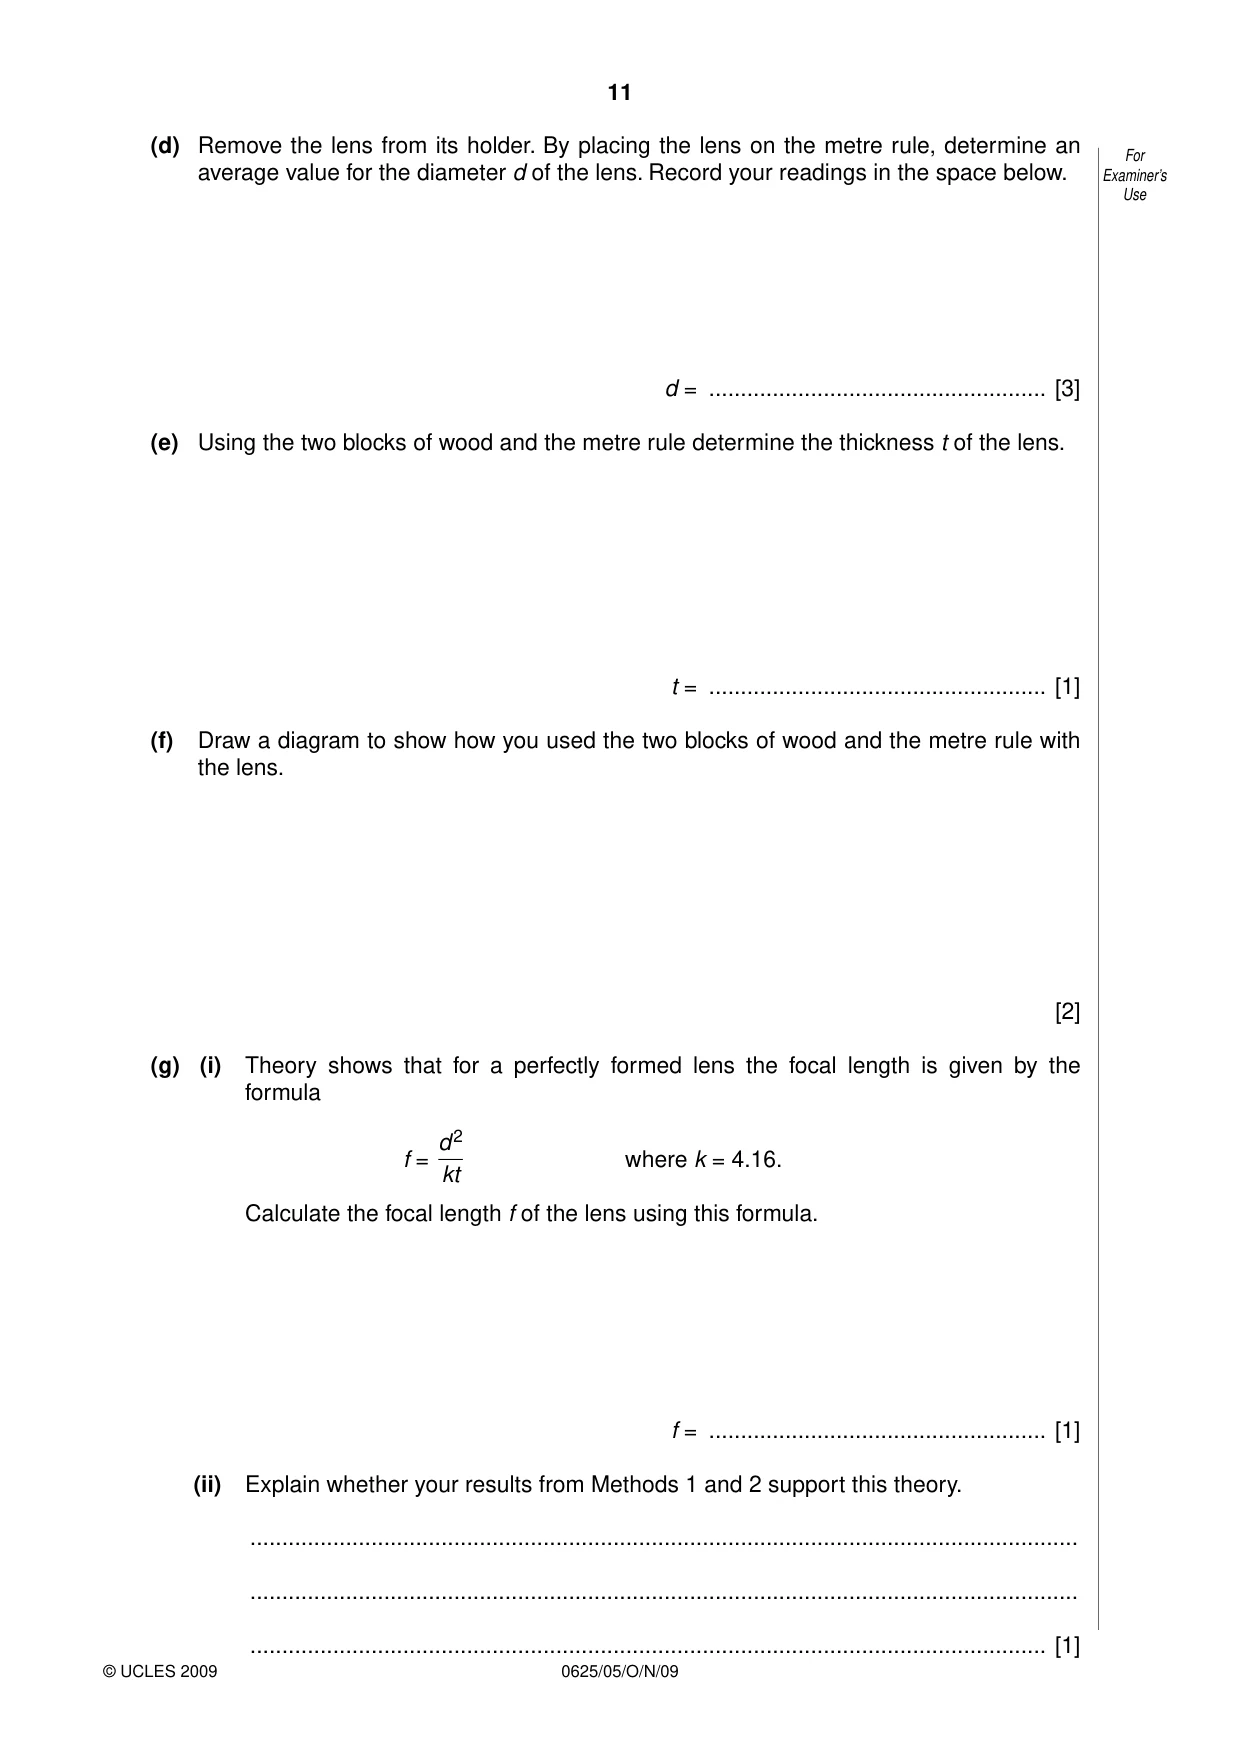
4 In this experiment you will determine the focal length of a converging lens by two different For methods. Examiner’s Use Carry out the following instructions referring to Fig. 4.1. and Fig. 4.2. Method 1 mirror illuminated 25.0 cm object image lens Fig. 4.1 Fig. 4.2 (a) Place the lens about 25 cm from the object screen and close to the mirror as shown in Fig. 4.1. (b) Move the lens and the mirror slowly towards the object screen until a sharply focused image is obtained on the object screen as shown in Fig. 4.2. (c) Measure the distance between the lens and the object screen. This distance is equal to the focal length f of the converging lens. Record f below. f = ...................................................... [2] Method 2 Carry out the following instructions referring to Fig. 4.3. lens lens d t Fig. 4.3 (d) Remove the lens from its holder. By placing the lens on the metre rule, determine an For average value for the diameter d of the lens. Record your readings in the space below. Examiner’s Use d = ..................................................... [3] (e) Using the two blocks of wood and the metre rule determine the thickness t of the lens. t = ..................................................... [1] (f) Draw a diagram to show how you used the two blocks of wood and the metre rule with the lens. [2] (g) (i) Theory shows that for a perfectly formed lens the focal length is given by the formula d2 f = where k = 4.16. kt Calculate the focal length f of the lens using this formula. f = ..................................................... [1] (ii) Explain whether your results from Methods 1 and 2 support this theory. .................................................................................................................................. ..................................................................................................................................
Mark scheme: 4 (c) f 14–16 (cm) [1] unit to match number [1] (d) more than one value shown [1] correct method of finding average shown [1] d value 4–6 cm [1] (e) sensible t value [1] (f) correct method of using blocks (more than half lens enclosed) [1] rule shown touching blocks [1] (g) (i) f value correct (with or without unit) [1] (ii) explanation that matches results (expect ‘No, too far out to be explained by experimental inaccuracy’ (wtte)) [1] [Total: 10]
More questions on Physical quantities and measurement techniques
What was in this paper
The subtopics covered by these 4 questions, and how many questions each got. Open one in a new tab to see every Cambridge question on it.
What you needed in this session
Cambridge’s own grade thresholds for 2009 Oct/Nov, Paper 5 · Variant 1. A higher threshold means an easier paper — the bar moves with how the cohort did.